Abstract
The dynamic characteristics of atmospheric rivers (ARs) have been researched over the western North Pacific and East Asia due to their close linkage to disastrous precipitation extremes, while very little attention has been paid to the AR features from the western Pacific to Southeast Asia. This study aims to quantify the climatology, long-term trends and variability of different AR properties from the western Pacific to Southeast Asia using an objective identification algorithm, the ERA5 reanalysis dataset and the APHRODITE precipitation dataset for the period 1951-2015. The results indicate a belt of frequent AR activities from the western Pacific to the Andaman Sea during the boreal autumn-winter season. The long-term trend analyses show a significantly increasing trend in AR frequency and an eastward shift of AR plumes. These dynamic changes contribute to the increasing trend of extreme precipitation amounts in the coastal areas surrounding the South China Sea. The intraseasonal variability of the AR associated with the Madden-Julian oscillation (MJO) shows a pronounced enhancement of AR activity in the MJO phase-2 to phase-3 due to the steeper gradient of low-level geopotential height between the Northwestern Pacific and the tropical Indian Ocean. The modulation is partly explained by the enhanced MJO convection and the adiabatic heating in the vicinity of the trough of the 200-500 hPa geopotential thickness of the region. This study shows that ARs are important mechanisms behind the climatology, trends and variability of the regional precipitation in Southeast Asia. This study implies that more attention is required toward the dynamics of these tropical weather systems, particularly for their interactions with other synoptic processes and their response to future climate warming.
1 Introduction
Southeast Asia, including the populated areas within Myanmar, Thailand, the Indonesian islands and the Maritime Continent, is highly vulnerable to extreme precipitation (World Bank, 2013). Predictions of extreme precipitation in Southeast Asia are crucial for mitigating their impacts on the local communities. However, accurately predicting the spatial and temporal variations of extreme precipitation is highly difficult in this region due to the complex interactions between topography and different scales of atmospheric motion (Chang et al., 2005a; Wang and Chang, 2012; Raghavan et al., 2018; Liang et al., 2021). Therefore, a better understanding of the dynamic processes leading to precipitation and its modulation by different climate regimes is helpful to enhance the predictability of precipitation in this region. This includes quantitively assessing the historical changes in the precipitating weather systems and delivering its key message to the local policymakers associated with climate risk management and mitigation strategies.
The precipitation over the Southeast Asia region is strongly dependent on the monsoon flows of different seasons (Sengupta and Nigam, 2019; Wang et al., 2020) and their interaction with the complicated orography (Chang et al., 2005b; Lim et al., 2017). It is noted that, in contrast to South Asia and East Asia where the southwest monsoon flow can lead to the summer rainy season, the boreal summer is the relatively dry season of the year for Southeast Asia. The mechanism behind the summer dry season is associated with the northward shift of the intense southwest monsoon flow, which extends from the Indian Continent to Indochina Peninsula. This leads to a stationary and stable anti-cyclonic shear in summer, which acts to inhibit precipitating weather systems over most of Southeast Asia. On the other hand, the boreal winter is the relatively wet season of the region due to the domination of the relatively wet northeast monsoon flow from the western Pacific. Previous studies have investigated the long-term trend in precipitation extremes for this region (Manton et al., 2001; Yao et al., 2008; Yao et al., 2010; Cheong et al., 2018). Endo et al. (2009) revealed spatially incoherent trends in extreme rainfall over the region, even within individual Southeast Asian countries. Specifically a significant negative trend for the frequency of the 99th percentile extreme wet days has been observed in Peninsular Malaysia (Zin and Jemain, 2010). In contrast, Suhaila et al. (2010) reported a significant increase in the rainfall intensity trend during the Northeast Monsoon season for the same region. In addition, no pronounced trends in extreme precipitation events have been found over Southeast Asia (Kim et al., 2019). Overall, the above-mentioned studies suggested considerable complexity in the temporal and spatial variations of extreme precipitation across Southeast Asia, which requires more adequate investigations. One of the approaches to such studies is to diagnose the dynamic causes of the historical precipitation changes, particularly from the perspectives of the synoptic processes leading to extreme precipitations.
Atmospheric river (AR), as defined by Zhu and Newell (1994), features long and narrow mesoscale synoptic corridors of moisture transport in the lower troposphere. The dynamical characteristics of ARs and their associated extreme precipitation exhibit strong seasonality in the Asian monsoon region (Kamae et al., 2017a; Kamae et al., 2017b; Kamae et al., 2019; Liang and Yong, 2021). For regions such as western North America and South India, ARs exhibit strong orographical effects on the local precipitation (Smith et al., 2010; Dettinger, 2011; Yang et al., 2018) and linkages to disastrous weather extremes, including floodings, extreme winds, extreme snow (Guan et al., 2010; Gorodetskaya et al., 2014) and freezing precipitation (Liang and Sushama, 2019). Intense AR-related moisture transports are usually observed along the windward side of coastal mountains and weaken when they penetrate inland (Rutz et al., 2015). Such an environment can effectively convert the total-column water vapor to stratiform precipitation due to the topography-forced ascend (Dettinger, 2011; Neiman et al., 2013; Liang and Yong, 2022).
It is worth mentioning that when Zhu and Newell (1998) perform the first statistical analysis that quantifies AR activity globally, they found that the winter moisture transport by ARs (referred to as “river flux”) from the western Pacific to Southeast Asia exhibit similar magnitudes to those affecting western North America and North Atlantic (Figure 1). These systems are considered to be related to large-scale convergence, such as the intertropical convergence zone, instead of the baroclinic disturbances in the midlatitude storm tracks. The recent study by Liang and Yong (2021) revealed that these tropical ARs have a pronounced seasonality with relatively high frequency from October to January. So far, the impact of ARs has been extensively discussed across North America and North Atlantic, but very few studies have focused on the AR features from the western Pacific to Southeast Asia. The relatively high moisture flux within the tropical ARs affecting Southeast Asia implies a potential linkage between these systems and the local extreme precipitation events. This can be reflected by the AR cases detected in 1953 (Figure 2), which led to heavy rain events in the Philippines (Figure 2A) and Peninsular Malaysia (Figure 2B). The neglection of these tropical features by previous AR studies is possible due to two reasons: (1) ARs have been considered only related to poleward moisture transport; hence, a number (more than four-fifths, despite Sellars et al., 2015; Reid et al., 2020) of algorithms for detecting ARs automatically remove any equatorward transports and those without apparent poleward direction (also referred to as tropical moisture filaments Pan and Lu, 2019; Pan and Lu, 2020) according to the current ARTMIP (Atmospheric River Tracking Method Intercomparison Project) protocol (Liang et al., 2022), Guan and Waliser (2015) indicate that tropical AR IVTs typically have a stronger eastward component than poleward component. (2) as pointed out by Liang and Yong (2021), the moisture transport over the main Asian monsoon region is usually considered to be stationary, while typical ARs (like those affecting western North America) are considered to be transient transport of moisture. This hinders the motivation of understanding the climatology of ARs within the subtropical Asian monsoon region as ARs in the Asian monsoon region cannot be simply treated as transient or stationary moisture transport (Park et al., 2020). Such a research gap poses limitations in advancing the understanding and predictability of ARs and the associated precipitation extremes in Southeast Asia.
Figure 1
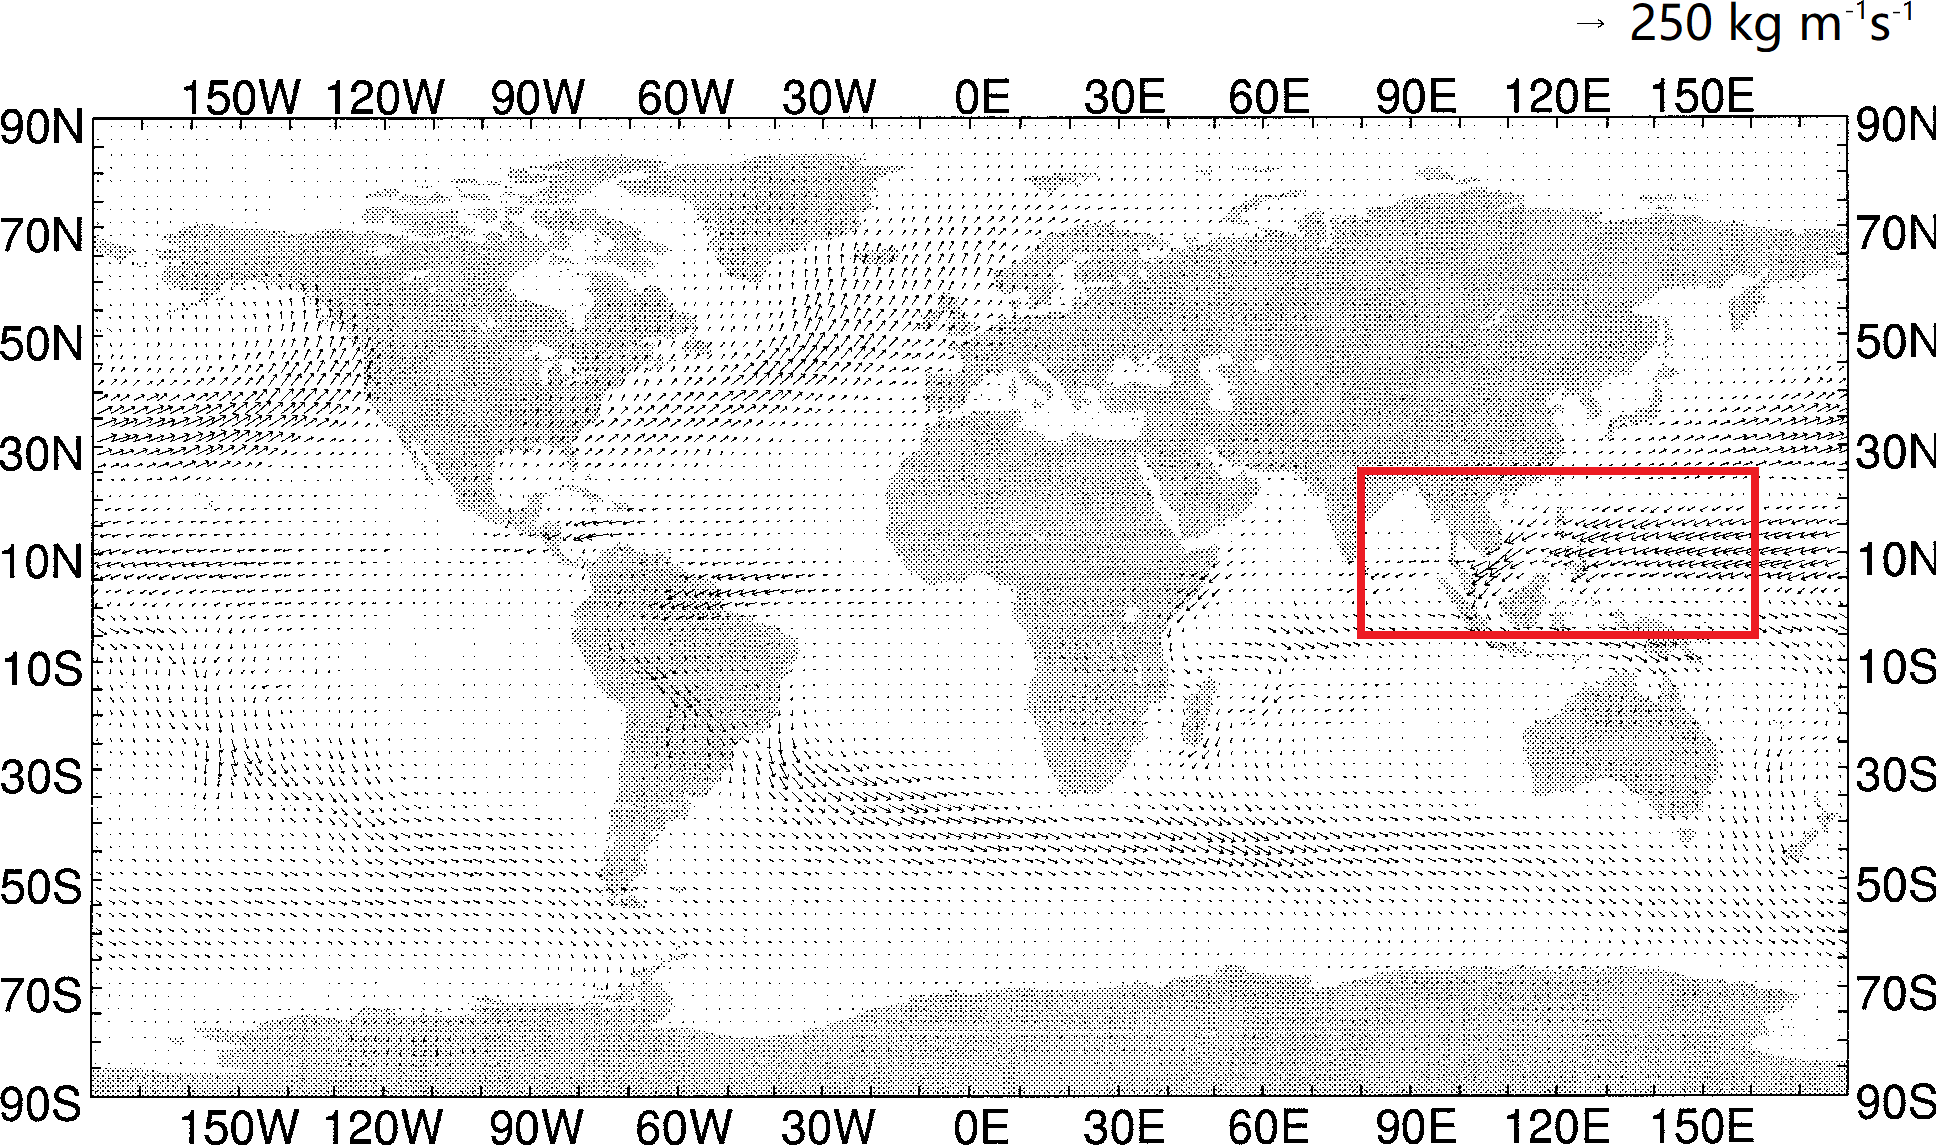
The moisture fluxes within ARs (kg m−1 s−1) averaged during January 1992, 1995, and 1996 using data from the European Centre for Medium-Range Weather Forecasts (taken from Zhu and Newell (1998)© American Meteorological Society. Used with permission). The red box shows the study region of this research.
Figure 2
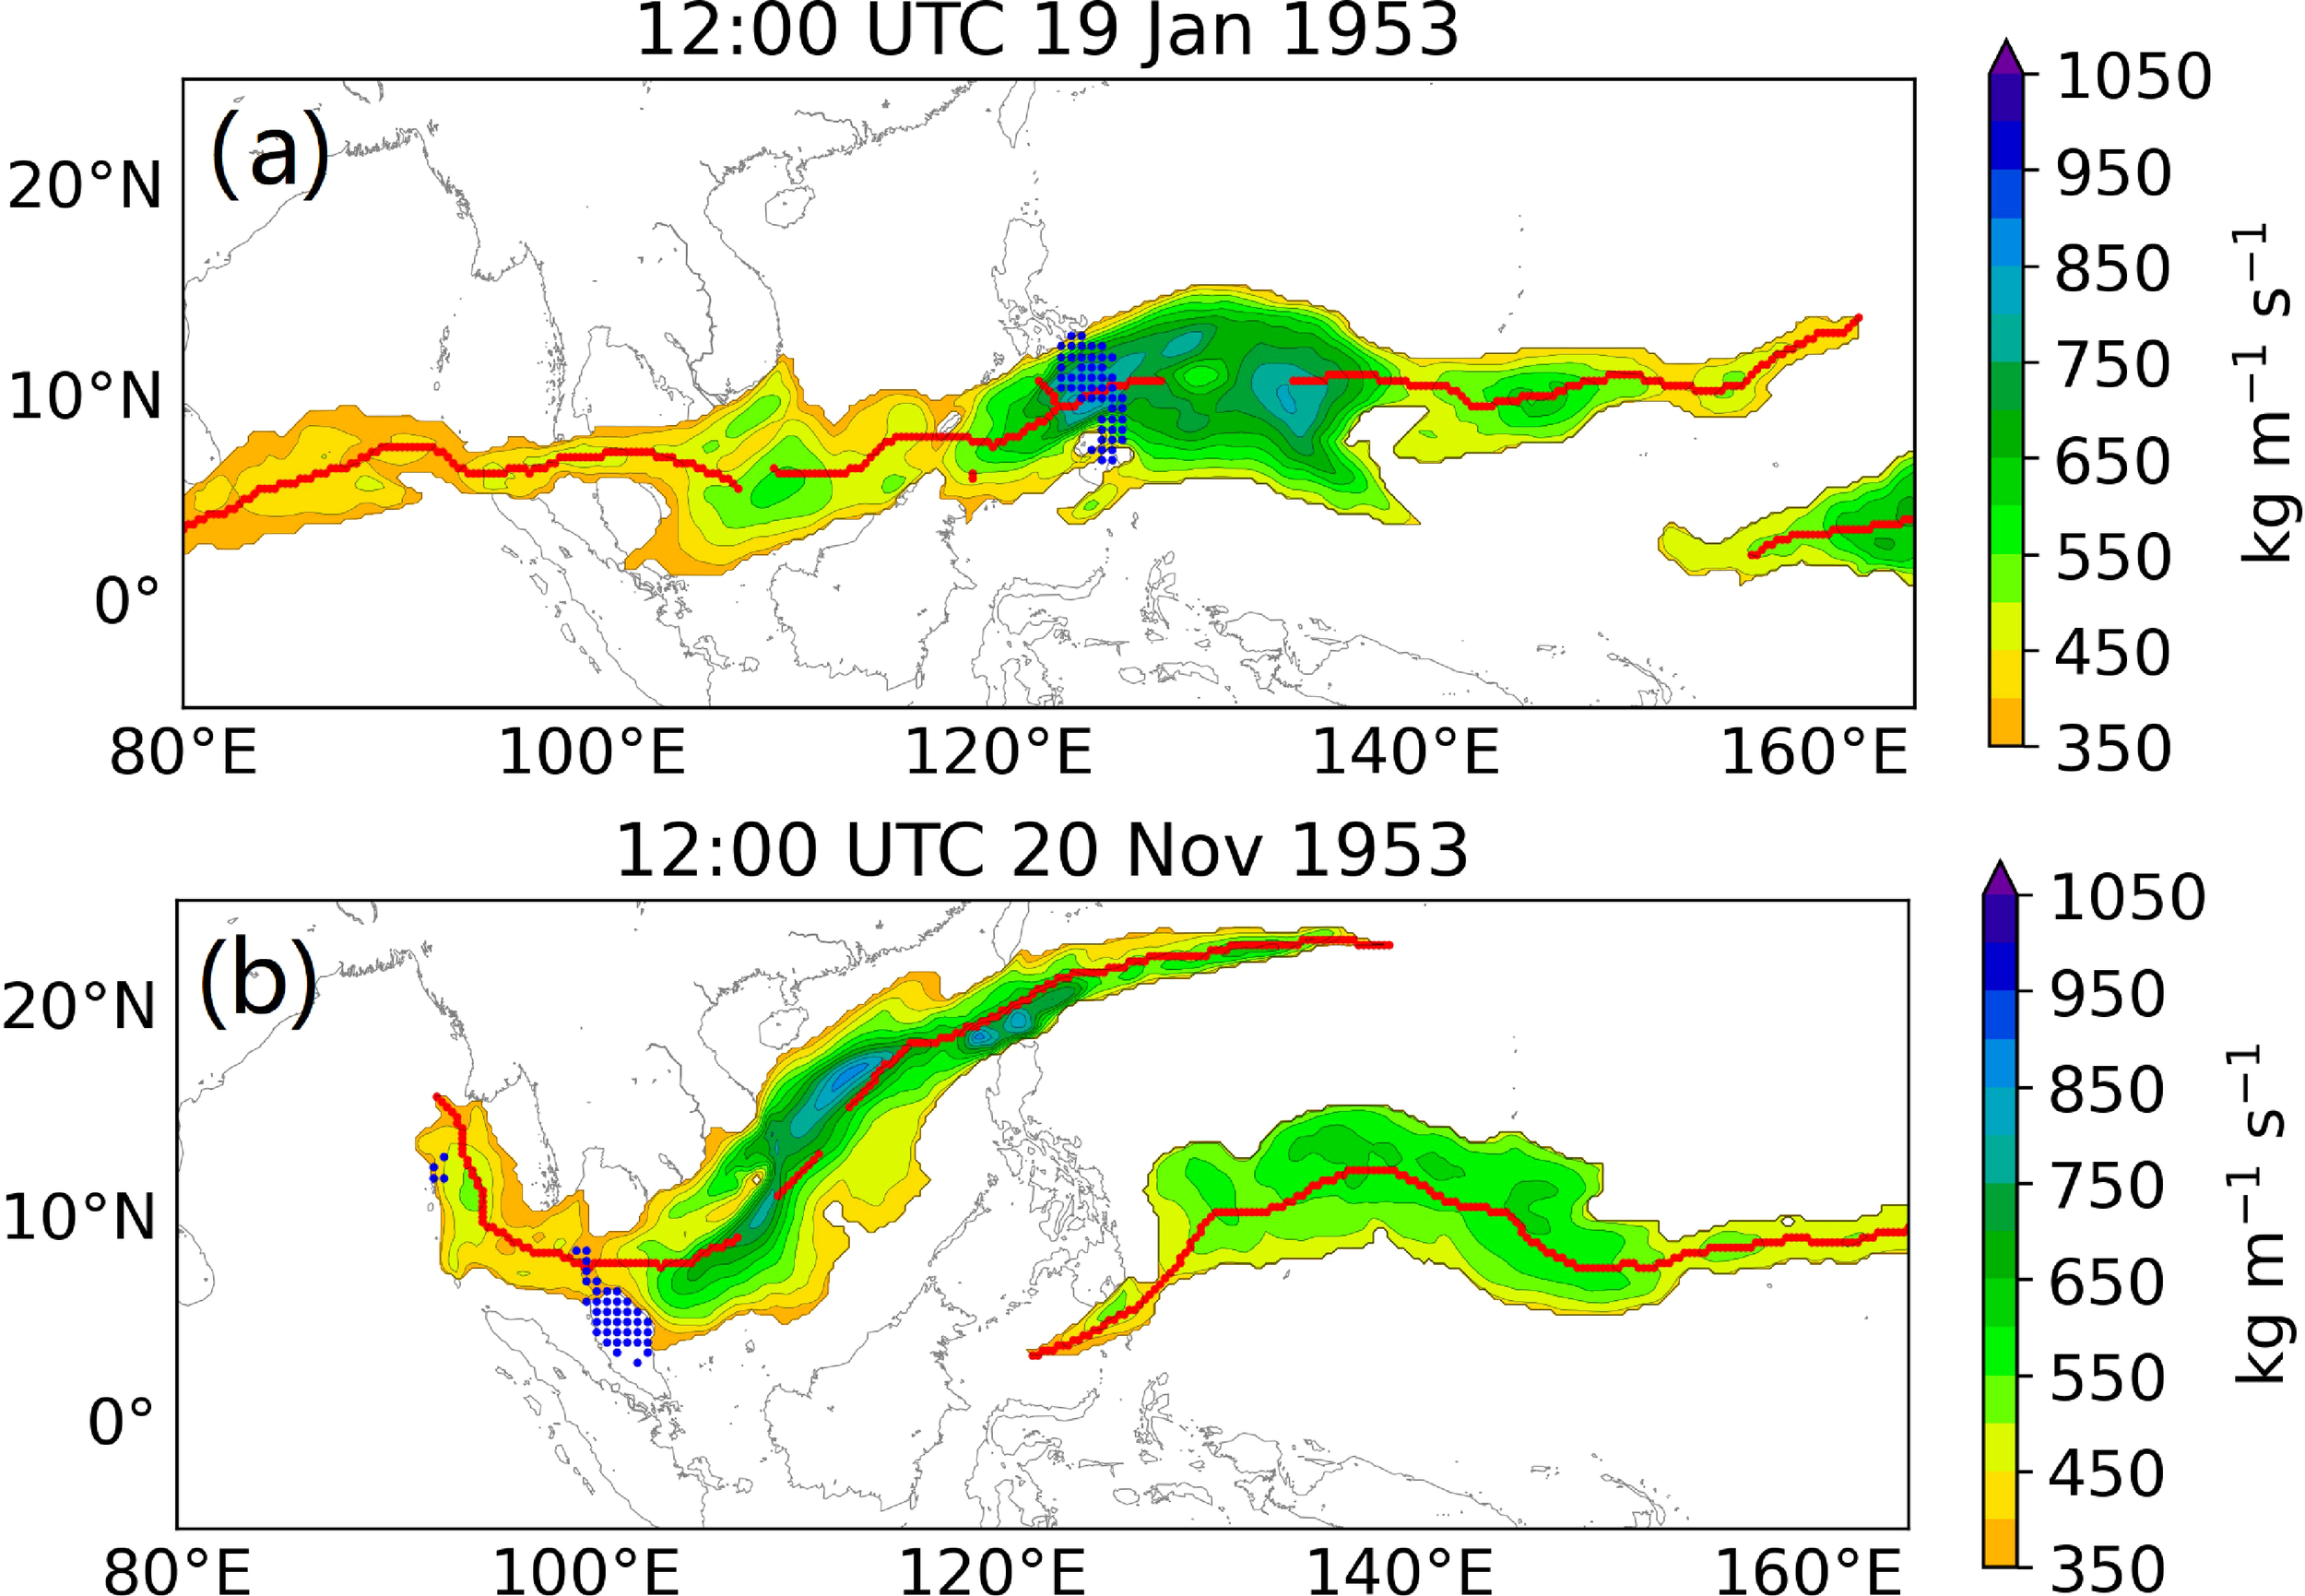
Typical AR cases detected in the Northeast Monsoon season of 1953: (A) 12:00 UTC 19 Jan 1953; (B) 12:00 UTC 20 Nov 1953. Red lines illustrate AR axes. Blue stippling indicates locations of heavy rain events (Daily precipitation > 35 mm). Methods for AR feature detection are described in Section 2.2.
As quantitively assessing the historical changes in ARs and their associated precipitation extremes will be beneficial for enhancing the predictability of hydrological disasters, this study aims to quantify the climatology and long-term trends of different AR properties from the western Pacific to Southeast Asia using high-resolution climate reanalysis and observational datasets. The paper is structured as follows: Section 2 describes the data and methods used for the analyses of AR characteristics and the associated large-scale environmental factors. In Section 3, analyses of the climatological characteristics and long-term trends of ARs are performed and interpreted in the context of the associated large-scale environmental mechanisms. The findings of the research are summarized and discussed in Section 4.
2 Methodology
2.1 Physical quantity for indicating AR activity
The analyses of the characteristics of ARs are based on two datasets of historical climate reanalysis and observations. First, as the detection of ARs is based on 6-hourly fields of integrated water vapor transport (IVT), the pressure-level data of winds (meridional and zonal components) and specific humidity during the main AR season (from October to March, ONDJFM) of Southeast Asia for the period 1951-2015 is used. We first compute the historical IVT (100-1000 hPa) fields. The formula for the calculation of IVT is as Liang and Yong (2021). The data is from the ECMWF Reanalysis v5 of the European Centre for Medium-Range Weather Forecasts (ERA5, Hersbach et al., 2020), a climate reanalysis data produced by a 4D-Var data assimilation technique and a spectral model at a horizontal resolution of ~28 km and a vertical resolution of 137 atmospheric vertical levels. This dataset has been used in numerous studies on the climatology of ARs (Demirdjian et al., 2020; Lorente-Plazas et al., 2020; Pan and Lu, 2020; Rhoades et al., 2020). To thoroughly generalize the long-term climatology and trends of ARs, the present-day climate version (1979 to 2015) and the extended version (1951-1978) of ERA5 are combined (65 years in total) and used as the inputs of an AR detection algorithm and other AR-related diagnostic procedures. ERA5 is also used for analysing the environmental fields associated with ARs, such as the 850-hPa wind speeds and geopotential height (for indicating the lower-tropospheric circulation steering ARs) as well as the 200-hPa wind field and the 200-500 hPa geopotential thickness (for analyses of the high-level circulation).
For analyzing the AR-associated precipitation, we apply the gridded daily precipitation dataset from the Asia Precipitation—Highly Resolved Observational Data Integration Towards Evaluation of Water Resources (APHRODITE, Yatagai et al., 2014) v1101 & v1101 EX_R1 at a horizontal resolution of 0.25°×0.25°. This dataset is produced by the Research Institute for Humanity and Nature and the Meteorological Research Institute of the Japan Meteorological Agency. This dataset is developed through a spatial interpolation method based on the angular-distance-weighting technique that considers the topographical differences between the interpolation point and the weather station. The data is also based on quality control procedures that handle inhomogeneity and errors in the rain gauge records (Hamada et al., 2011).
2.2 Objective detection of ARs
A modified version of an objective identification algorithm for ARs within the Asian monsoon region is used to explicitly extract the information on AR characteristics over Southeast Asia from ERA5. Detailed configuration description of the algorithm and its comparison with other ARTMIP algorithms can be found in Liang et al. (2022). This algorithm has presented reliability in detecting AR features over East Asia using climate reanalysis and climate model data (Liang and Yong, 2022). However, for the regions of Southeast Asia, several modifications have been made to this algorithm for identifying ARs. First, the modules for filtering tropical moisture filaments are turned off as these can remove the important equatorward features. Second, for isolating AR plumes, relative magnitude thresholds, i. e. the local 85th percentile of IVT for the main AR season of Southeast Asia (Figure 3A), are used to consider the climatology of IVT varying with seasons and locations. Following Pan and Lu (2019), Pan and Lu (2020), the distribution of the relative thresholds is spatially filtered using a 2-D Gaussian filter with a geodesic bandwidth of six degrees (Figure 3B). This is to isolate the plume area more coherently by reducing the biases associated with the fine-scale spatial variation of the thresholds. Another potential benefit of using the relative thresholds is that they can facilitate the detection of the upstream AR features with relatively weak IVTs so that more information on the AR moisture source can be obtained. Similar relative thresholding methods have been commonly used by the current ARTMIP algorithms (Rutz et al., 2019; Collow et al., 2022), though some issues of such a thresholding method were noted and discussed by Shields et al. (2018) and Liang et al. (2022).
Figure 3
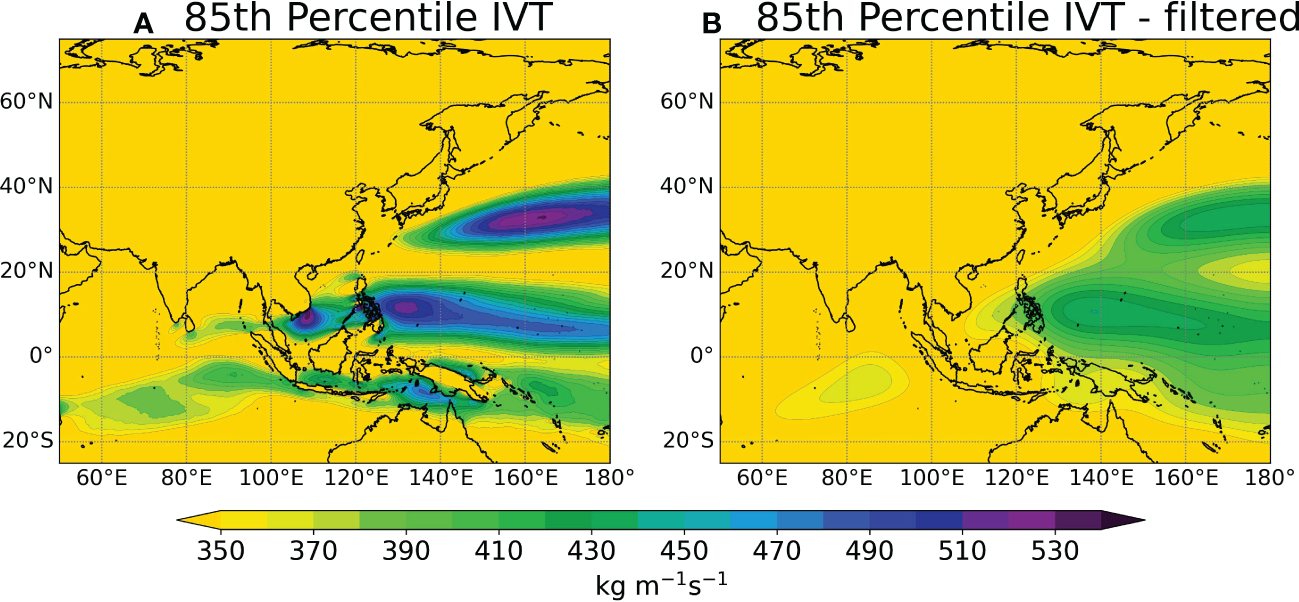
Spatial distribution of the 85th percentile of IVT from October to March (ONDJFM) for the period 1951–2015: (A) Original distribution; (B) Filtered distribution used for the isolation of AR plumes.
Based on the detected AR plumes and the corresponding axes, several diagnostic fields are computed for indicating the characteristics of ARs. First, the detected AR plumes are used to diagnose the frequency of ARs (i.e. the fraction of timestep when AR plumes occur) for each grid point of ERA5. Second, as Mahoney et al. (2016) and Liang et al. (2022), AR-associated precipitation is defined as precipitation within ~250 km from the identified AR axis (i.e. 10 grid spaces for ERA5). Extreme precipitation events associated with ARs are defined as AR-associated precipitation greater than the 99th percentile of precipitation on wet days (daily precipitation > 0.1 mm).
2.3 Composite analyses of Madden–Julian oscillation
For the study region shown in Figure 1, the eastward propagation of the MJO convective envelope can lead to considerable sub-seasonal variability of deep convection and precipitation (e.g. Wu and Hsu, 2009; Oh et al., 2012; Peatman et al., 2014). Synoptic processes over this region such as the northeasterly cold surges and Borneo Vortices are also found to be enhanced by the convection-active phases of MJO (Lim et al., 2017; Saragih et al., 2018). AR frequencies in the Pacific were also found to be significantly modulated by MJO (approximately 25–50% during certain phases, Mundhenk et al., 2016; Bui and Maloney, 2018). To understand the potential modulation of ARs by MJO, we first determine the days corresponding to the eight different phases of the MJO during ONDJFM using the daily real-time multivariate MJO (RMM) index, which is a function of the daily outgoing longwave radiation (OLR) and zonal winds in the upper and lower troposphere (Wheeler and Hendon, 2004). The used RMM index data is based on the observation and reanalysis datasets from the National Centers for Environmental Prediction (NCEP) and the computation is performed by the Bureau of Meteorology of Australia. The modulation of AR characteristics related to the different phases of MJO will be analyzed by computing the mean composites of AR characteristics (including AR frequency, OLR, the 850-hPa wind fields and 200-500 hPa geopotential thickness) over the days corresponding to each MJO phase.
3 Results
3.1 Frequency of ARs
The precipitation peak over Southeast Asia usually occurs during the boreal autumn-winter season due to the domination of abundant moisture transported by the northeasterly monsoon flow and intermittent cold surges from the western Pacific to the South China Sea (Wu et al., 2007; Pullen et al., 2015; Basconcillo et al., 2016; Tangang et al., 2017). This coincides with the peak of the frequency of AR plumes affecting Southeast Asia according to the landfalling AR detection performed by Liang and Yong (2021). Here, our analyses of the AR features affecting Southeast Asia and those extended from the western Pacific upstream focus on the autumn-winter season from October to March of the next year (ONDJFM). The climatological distribution of ARs in terms of the fraction of time steps when AR plumes occur (i.e. AR frequency, Figure 4A) shows a belt of relatively frequent AR activity from the Andaman Sea to the western Pacific (across regions along 10°N and between 90°E and 135°E). The local maximum AR frequency (up to 15%) is spotted over the South China Sea and to the south of Vietnam. Some coastal regions of the South China Sea (e.g. southern Thailand and the Philippines) are also affected by frequent AR activities (up to 10%). The downstream of ARs is observed to affect Peninsular Malaysia and Indonesia with a frequency of up to 6%. The spatial pattern of AR frequency averaged in the autumn-winter season is similar to the AR analyses over Southeast Asia by Liang and Yong (2021), though their study was based on a reanalysis dataset at a lower horizontal resolution and focused on landfalling systems only.
Figure 4
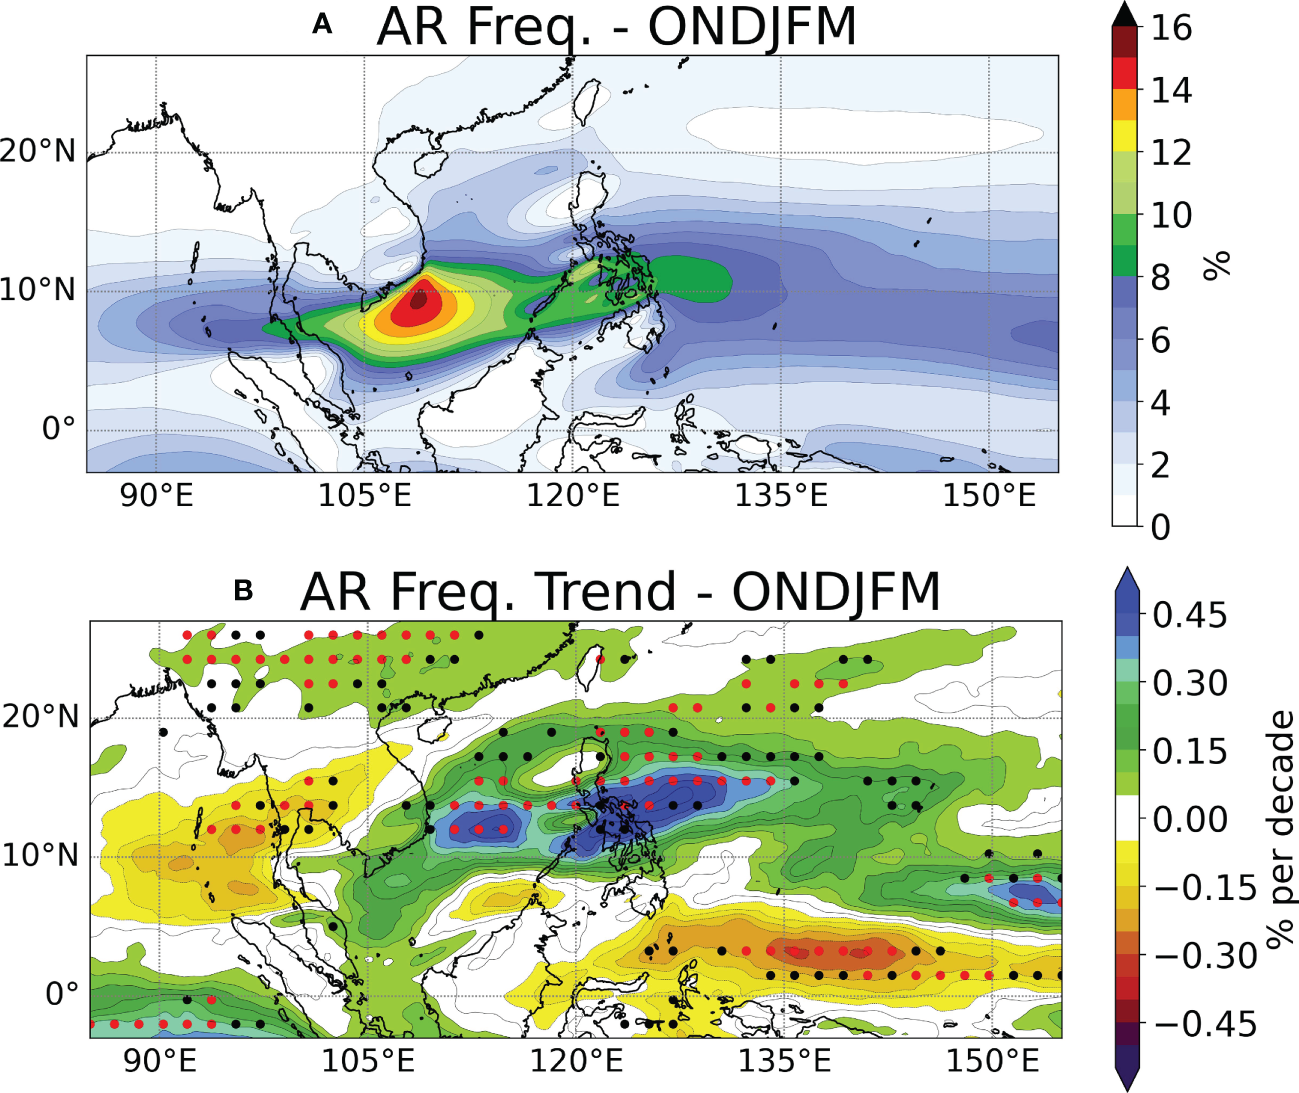
Distributions of AR frequency [(A), unit: %] and their trends [(B), unit: % per decade] for ONDJFM during the period 1951–2015. Red (black) stippling indicates statistically significant trends with confidence levels above 95% (90%).
For the long-term trend in ARs, Figure 4B shows a belt of pronounced increasing trends in AR frequency from the South China Sea to the western Pacific (10-20°N, 105-145°E). The trends are up to 0.5% per decade over the central Philippines (near 13.75°N, 123.5°E) and exhibit confidence levels of above 95% (p-value < 0.05), although the mean frequencies of ARs affecting this area is relatively low. The trends in the frequency of ARs affecting the central South China Sea are up to 0.4% per decade (p-value < 0.05). To the west of 105°E, significant decreasing trends are found over the Andaman Sea (near 11.75°N, 95°E) and Thailand (12°N, 100°E) by up to -0.3% per decade. Overall, the trends in AR frequency indicate a significant decreasing (increasing) trend to the west (east) of 105°E, implying an eastward shift of ARs within the study region.
3.2 AR-related precipitation
Figure 5A presents the climatology of AR-associated precipitation during ONDJFM for the period 1951–2015. Two local maximum accumulated precipitation amounts from ARs (up to above 360 mm per season) are spotted in the northeastern part of Peninsular Malaysia (near 5.5°N, 102.75°E) and the southeastern part of the Philippines (9.25°N, 125.75°E). The coastal region of Vietnam (near 16.25°N, 108°E) is also affected by the relatively great amount of AR precipitation (up to above 280 mm per season). These regions are located on the foreside of the area with relatively frequent ARs and their relatively great AR precipitation amounts are likely due to the local steep topography that interacts with the intense IVT within AR plumes and generates precipitation via orographic effects. Such an AR-topography interaction has been extensively discussed across western North America (e.g. Smith et al., 2010). ARs penetrating downstream also bring precipitation of up to 160 mm per season in South Borneo (near 5.25°N, 117°E) and the southern part of Sumatra Island (5°S, 105°E). It is worth noting that patterns in Peninsular Malaysia demonstrate a pronounced dipole of AR precipitation and this relates to the blocking effect of the Titiwangsa mountain range on the southwestward water vapor transport (Suhaila and Jemain, 2012).
Figure 5
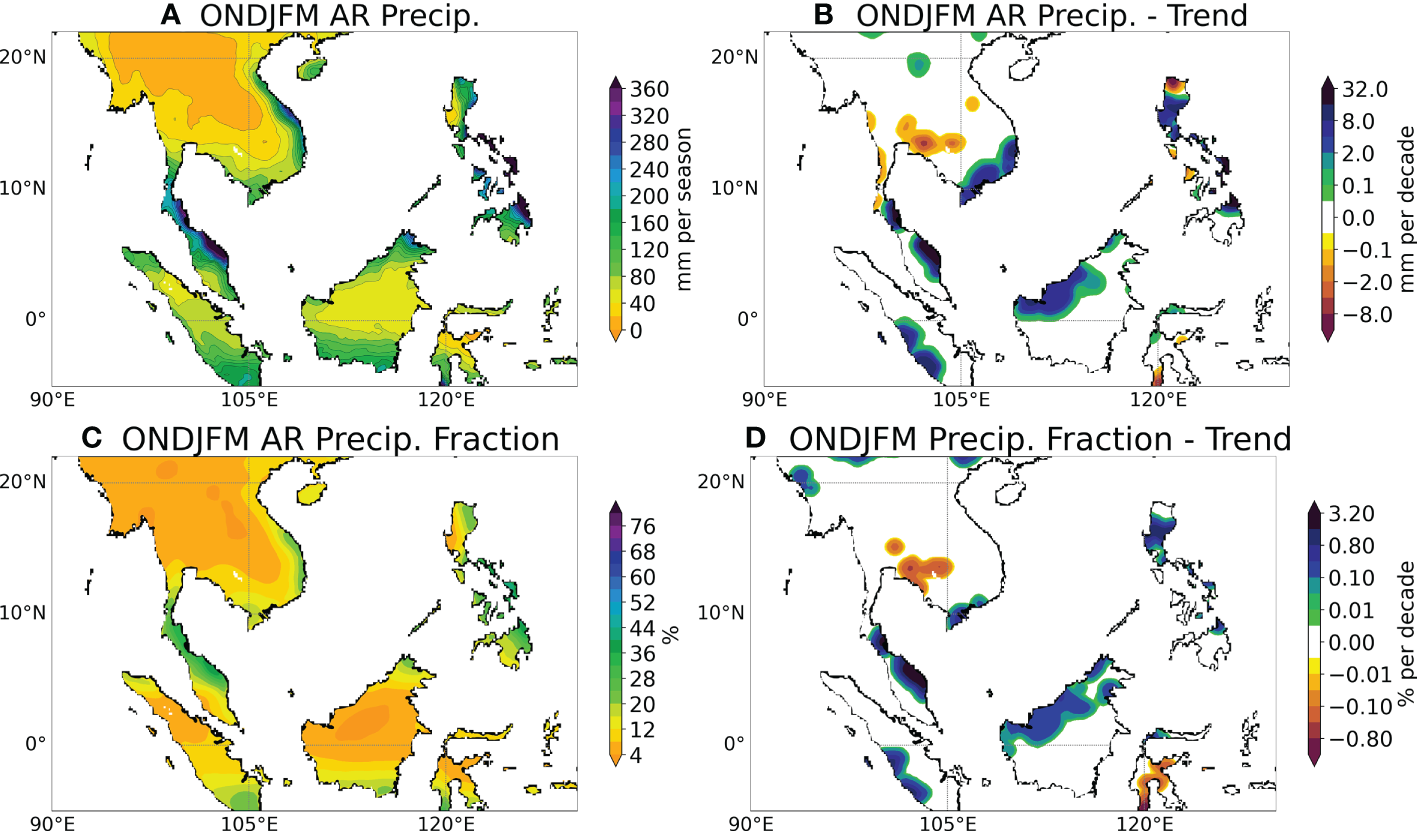
Analyses of the precipitation amount for autumn-winter seasons (ONDJFM) during the period 1951–2015: (A) AR-associated precipitation amount (unit: mm per year); (B) trends in AR-associated precipitation amount (mm per decade); (C) fraction (%) of the total precipitation amount contributed by ARs; (D) trends in the fraction (% per decade) of precipitation contributed by ARs.
The distributions of trends in AR precipitation (Figure 5B) present significant increasing tendencies by up to 8mm per decade (p-value < 0.05) over most of the coastal areas surrounding the southern South China Sea, including southern Indochina Peninsula (near 12°N, 107°E), eastern Peninsular Malaysia (5°N, 105°E), the west coast of Sumatra (3°S, 100°E), North Borneo (1°N, 110°E) and the Philippines (15°N, 120.5°E). These trends correspond well with the pattern of trends in AR frequency over the regions (Figure 5B). Given the long-term increasing trends in autumn-winter precipitation over Southeast Asia (Yao et al., 2010). The observed increasing trends in AR precipitation imply the important role of ARs in the local precipitation trends over the study region. In addition, regions with decreasing trends in AR precipitation (up to ~4 mm per decade) are spotted over the northern part of the Philippines (near 17°N, 121°E) and southern Thailand (12°N, 100°E), which can be explained by the local decreasing trends in AR frequency.
To understand the role of ARs in the local climate and water cycle, the fractional contribution of ARs to the total precipitation amounts is computed following Kim et al. (2020). The spatial distribution of AR precipitation fraction (Figure 5C) exhibits similarities to that for the total AR precipitation (Figure 5A), i.e. the windward coastal areas tend to receive a greater amount of AR precipitation. Specifically, ARs are responsible for up to 32% of the total precipitation in the northeastern part of Peninsular Malaysia (near 5°N, 105°E) and the eastern Philippines (12°N, 125.25°E); hence, ARs act as an important synoptic agent of precipitation. For other regions such as the coastal area of Vietnam (near 16.25°N, 108°E), North Borneo (6.75°N, 117.25°E) and South Sumatra (4.75°S, 105°E), ARs contribute up to 20% of the local total precipitation.
Trends in the fractional contribution of ARs to precipitation (Figure 5D) show some similarities of distribution to that of total AR precipitation (Figure 5B). The general increasing trend of up to 0.8% per decade in the fraction of precipitation that is AR-associated is found in most of the coastal areas surrounding the southern South China Sea. In southern Thailand (near 12°N, 100°E), trends in ARs’ fraction contribution are observed to decrease by up to 0.45% per decade. It is worth noting that, in Thailand, severe drought does not only affect crops and water resources but also provides a favorable condition for forest fires (Zhao et al., 2022). Given the drought busting effect of ARs (Dettinger, 2013), the local decreasing trends in AR precipitation and its contribution to the total precipitation amount may exacerbate water scarcity and related extreme events. In contrast, under the increasing trends in AR frequency over most of the study region (Figures 3B), the increasing trends in both total AR precipitation and the fraction of total precipitation that is AR-associated may lead to more precipitation over most of Southeast Asia during autumn-winter, particular over the windward coastal regions where the local topography strongly interacts with the warm moist air within AR plumes.
Extreme precipitation is one of the main extreme climate and weather events that severely threaten the local communities in Southeast Asia (Adhikari et al., 2010). As ARs are usually observed to closely relate to extreme precipitation causing devastating flooding (Lavers and Villarini, 2015; Ramos et al., 2016), it is of importance to investigate the role of ARs in the occurrence of hydrological extremes in Southeast Asia. Figure 6A shows that relatively large amounts of autumn-winter (ONDJFM) extreme precipitation coming from ARs (up to 65 mm) are located along the windward coastal mountain regions of Peninsular Malaysia, the Philippines and Indochina Peninsula. Similar to the total precipitation contributed by ARs, the orographical effects associated with ARs can also be manifested by the AR-related extreme precipitation amount across the above-mentioned regions. Figure 6B shows the spatial pattern of trends in the AR-related extreme precipitation over Southeast Asia. Significant increasing trends (p-value < 0.05) by up to 5 mm per decade are noted over the eastern part of Peninsular Malaysia (near 5°N, 103°E), the coastal areas of Borneo (2.5°N, 110.5°E and 3°N, 117.5°E) and the southern Philippines (7°N, 123°E). There are also significant decreasing trends by up to 2 mm per decade over southern Thailand, the west coast of Peninsular Malaysia (near 5°N, 100°E) and Southeast Sumatra (3°S, 105°E). Over northern Borneo (1°N, 110°E) and the northern Philippines (15°N, 122°E), consistencies between trends in extreme and total precipitation were noted. Besides, trends in AR-related extreme precipitation contradicting those in AR-related total precipitation (i.e. areas with no significant trend in AR-related total precipitation but with a significant increasing trend in extreme precipitation from ARs) are spotted in South Borneo.
Figure 6
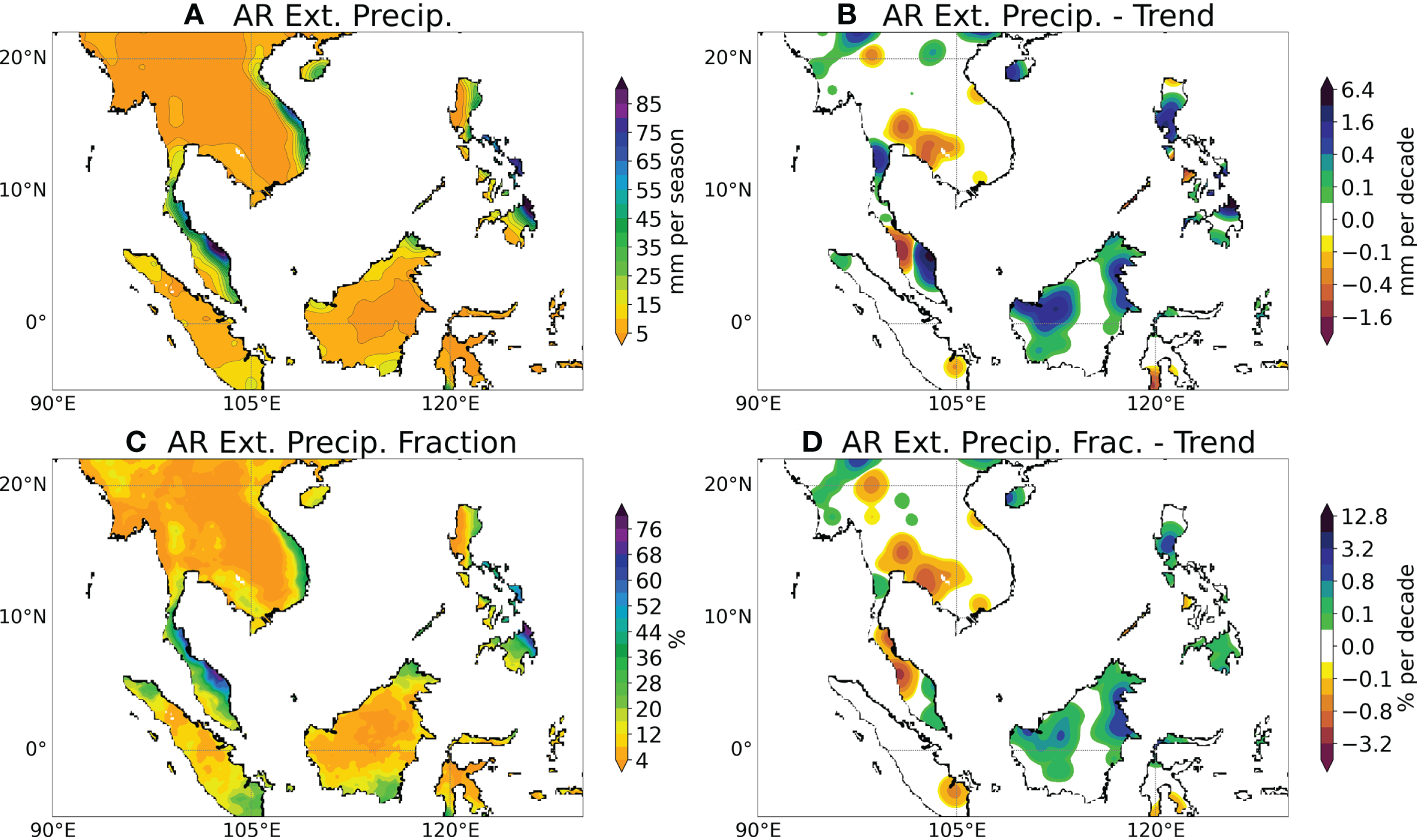
As for Figure 5, but for the contribution of ARs to the extreme precipitation amount.
Figure 6C shows the spatial pattern of the fractional contribution of ARs to the seasonal total extreme precipitation amount. It is seen that ARs are associated with the majority of extreme precipitation in northeastern Peninsular Malaysia (by up to 68%), eastern Vietnam and the southeastern Philippines (up to above 60%). The distribution of trends in the fractional contribution (Figure 6D) shows that ARs tend to contribute less to the accumulation of extreme precipitation in the southeastern part of Peninsular Malaysia, West Borneo and most of the Philippines. Decreasing trends are also observed on the southern coast of Thailand. These findings are generally consistent with the distribution of trends in AR-related precipitation shown in Figure 5. Consistent with the eastward shift in AR frequency observed from the eastern Indian Ocean to the western Pacific (Figure 4B), the trends in the extreme precipitation coming from ARs display increasing (decreasing) trends to the east (west) of 105°E, implying a general eastward shift of AR-related hydrological extremes affecting Southeast Asia.
3.3 Environmental controls of ARs
To understand the environmental mechanisms behind the long-term trends and variability of AR characteristics, this section analyzes the environmental fields averaged over AR Days for autumn-winter seasons and their trends and anomalies corresponding with each MJO phase using ERA5 during the period 1951–2015.
We first analyze the fields indicating the low-level circulation patterns that are closely associated with the main AR features in the lower troposphere. The seasonal-mean fields of winds (Figure 7A) and geopotential height (Figure 7B) at 850-hPa during AR Days show a northeasterly monsoon flow extending from the tropical western Pacific to the South China Sea. Such a large-scale steering flow is one of the decisive drivers of the southwestward moisture transport within AR plumes. This is mainly driven by the steep gradient in geopotential height between the continental high-pressure over East Asia and the low-pressure belt across the tropical Pacific. The trends in the wind speed at 850-hPa (Figure 7A) show generally increasing trends in the northeasterly wind speed over the South China Sea of 10-25°N and 105-135°E. We note that the northeasterly flow is strengthening but such a trend is restricted to the east of 105°E, the eastern part of the main AR region. This pattern of trends can lead to an eastward displacement of moisture transport from the western Pacific to the South China Sea, which corresponds well with the eastward shifts in AR features (Figures 4B, 5B–D, 6B–D).
Figure 7
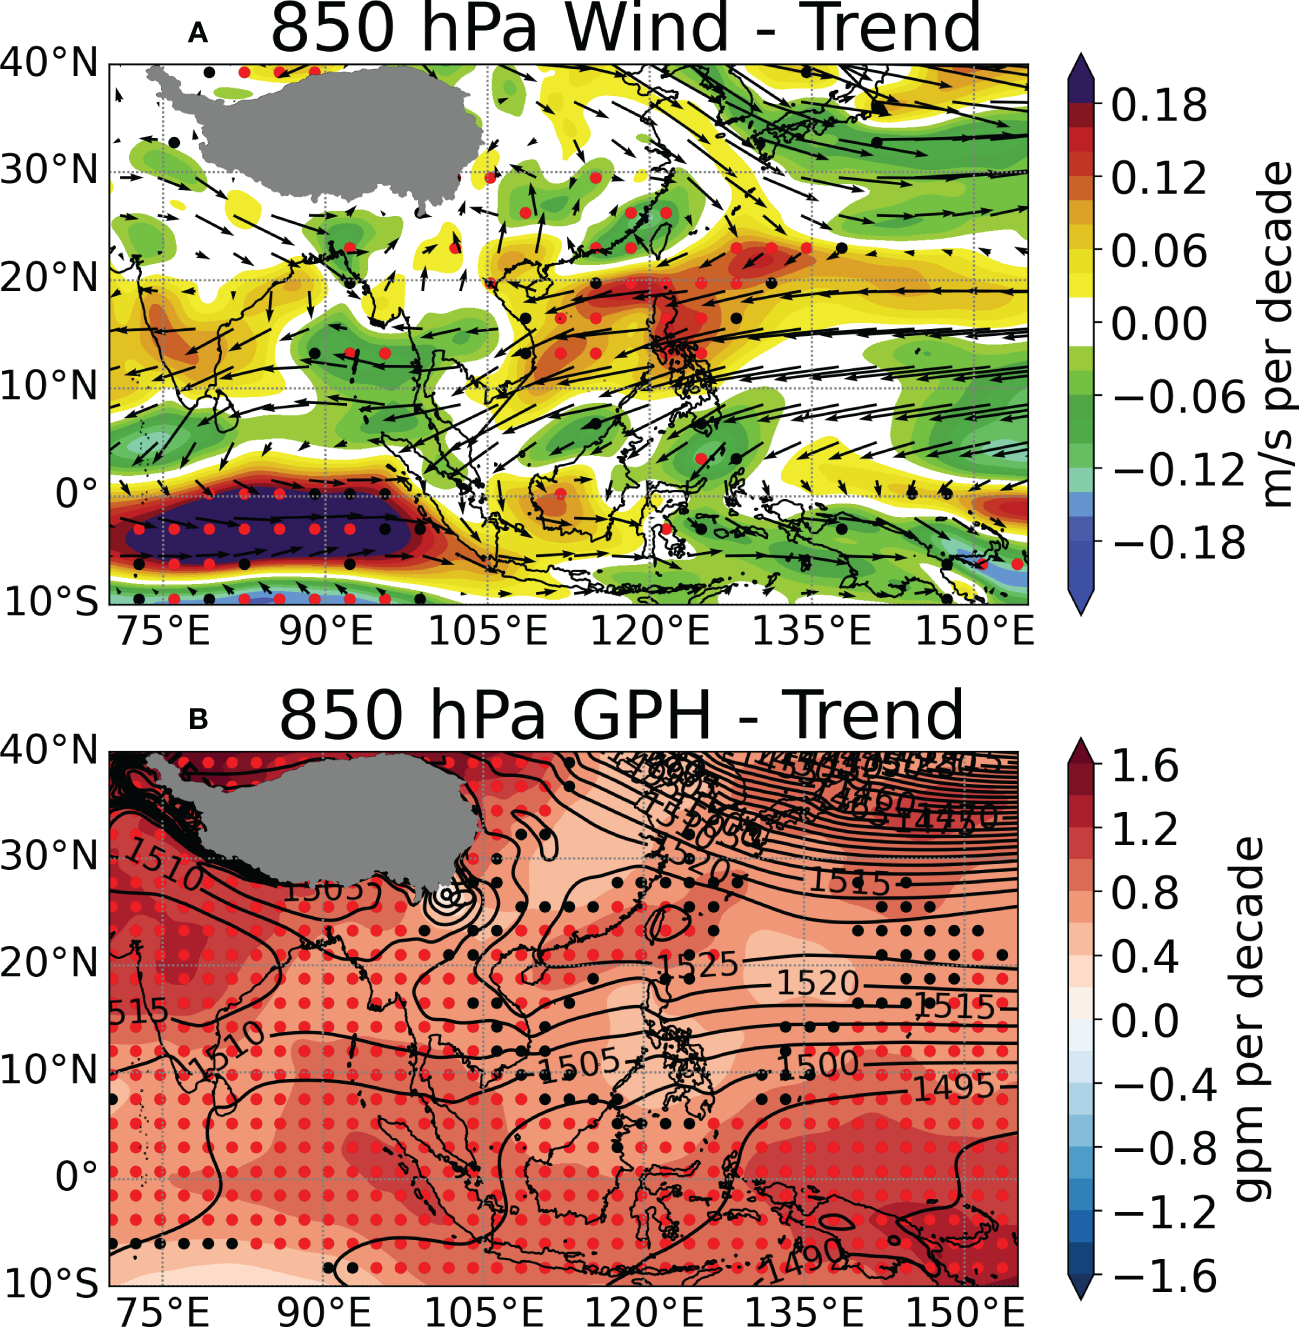
Seasonal mean (vectors and black contours) and climatic trends (shaded) for the AR-associated large-scale environments in AR Days for autumn-winter seasons during the period 1951–2015, including 850-hPa wind field (unit: m s-1) (A), 850-hPa geopotential height (contour, unit: gpm) (B). Red (black) stippling indicates statistically significant trends with confidence levels above 95% (90%). Grey-shaded areas in (A) and (B) mask out contours inside the Tibetan Plateau.
Figure 7B shows that the increasing trends in the northeasterly wind speed to the east of 105°E are driven by the increasing trends in the geopotential height at 850-hPa across the northern South China Sea, which can induce an increase in the horizontal gradient of geopotential height along the southern edge of the midlatitude high pressure. However, an increasing trend in geopotential height (up to 1.2 gpm per decade) is observed near the tropical western Pacific, which induces a decrease in the horizontal gradient of geopotential height over the upstream region of ARs. This partly explains that the areas with significant increases in AR frequency are confined to the downstream region (Figure 4B).
Considering the potential linkage between the modulation of extreme rainfall over Southeast Asia by MJO and that of the regional synoptic-scale processes (Lim et al., 2017), we now assess the physical mechanisms associated with the modulation of AR and their associated large-scale circulation patterns by the MJO. To achieve this, the anomaly distributions of AR frequency and AR-related environmental fields are analyzed during each MJO phase for the period 1951–2015. Figure 8 presents composites of AR frequency anomalies for eight RMM-based MJO phases with respect to the long-term mean AR frequency. An apparent transition of patterns from positive frequency anomalies to negative ones is observed when comparing the different MJO life cycles. Specifically, the geopotential height at 850-hPa for MJO phase 1 (Figure 8A) shows a zonally oriented high-pressure anomaly dominating over the western Pacific. Negative anomalies of AR frequency are observed over most of the study region. For phases 2 and 3 (Figures 8B, C), increases in AR frequency are observed over most of Southeast Asia. The more frequent ARs are possibly related to the enhanced northeasterly driven by the steeper gradient of geopotential height between the Northwestern Pacific and the tropical Indian Ocean. The region with increased AR frequency stretches from the western Pacific to the eastern Indian Ocean and affects most of Southeast Asia, which is corresponding with the anomalous convective activity when the MJO-related convection activation propagates eastward from the Indian Ocean to the Marine Continent.
Figure 8
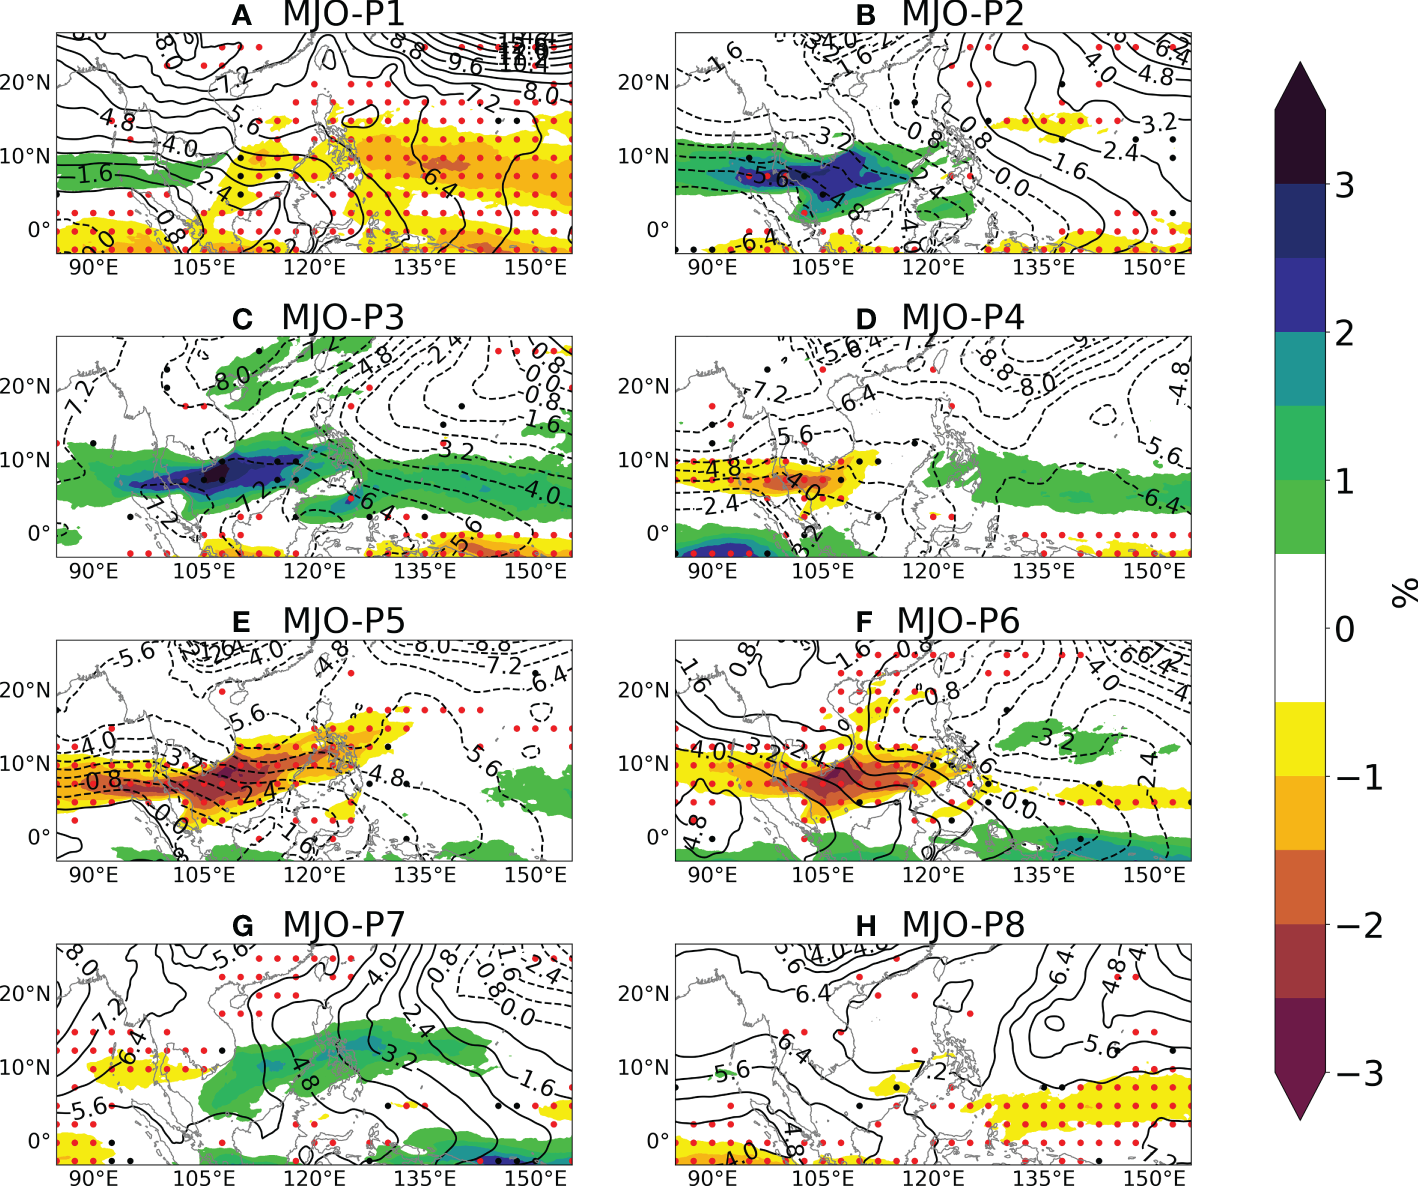
850-hPa geopotential height anomaly (contour, unit: gpm) and anomalous AR frequency (color, unit: %) based on eight phases of MJO. (A–H) corresponding to phases 1 to 8. Red (black) stippling indicates statistically significant trends with confidence levels above 95% (90%).
From phase 5 to phase 6 (Figures 8E, F), decreases in AR frequency are observed over most of Southeast Asia. The inhibited AR activity is possibly due to the departure of the active convection propagating away from the Marine Continent into the western Pacific. Phase 8 (Figure 8H) shows an opposite pattern with smaller magnitudes of changes over the tropical upstream in comparison with phase 4 (Figure 8D). This is partly in agreement with the study of Xavier et al. (2014) suggesting that phases 6-8 of MJO tend to reduce the occurrence probability of extreme precipitation over Southeast Asia. Furthermore, for the study region, increases in the AR frequency are observed during about one-half of the MJO cycle. Overall, the composites for the convection-active phases and the transition from suppressed to active phases over most of the Maritime Continent demonstrate a pronounced relationship between the anomalous easterly winds and the enhancement of AR-related westward and southwestward IVT over Southeast Asia.
To understand the thermal environmental factors associated with the anomalous AR activity discussed above, the patterns of OLR and the geopotential thickness between 200-hPa and 500-hPa across the Indian Ocean and western Pacific are analyzed (Figure 9). Comparing the different MJO phases, an eastward propagation of the positive anomalies of geopotential thickness, i.e. increased thermal expansion, is observed across the Indian Ocean and western Pacific, which is possibly linked to the adiabatic heating by the MJO-activated convection. This can be manifested by the anomalies of OLR of the region as the ridge of geopotential thickness corresponds well with the positive OLR anomalies, and the trough tends to be accompanied by negative OLR anomalies. Specifically, composites for phases 2-3 (Figures 9B, C) show negative geopotential thickness anomalies dominating across 30°N and negative anomalies expanding from the western Indian Ocean to Southeast Asia. Such meridionally contrasting patterns of anomalous geopotential thickness can relate to the meridional differences in OLR. The positive (negative) geopotential thickness across the tropics (subtropics) sharpens the meridional thermal contrast and favor the tropical easterly from the Maritime Continent to the tropical Indian Ocean, which partly explains the increase in AR frequency during phases 2-3 (Figures 8B, C). Similar variations of geopotential height dependent on the MJO-related changes in adiabatic heating have also been presented by Franzke et al. (2019). For phase 6 (Figure 9F), an opposite pattern of geopotential thickness anomaly and OLR to phases 2-3 is shown, which is consistent with the significant decrease in AR frequency for this phase (Figure 8F). In summary, the meridional contrast of thermal expansion related to the adiabatic heating within the MJO-activated convection can modulate the AR-related circulation pattern and, consequently, lead to the sub-seasonal variability of ARs affecting Southeast Asia.
Figure 9
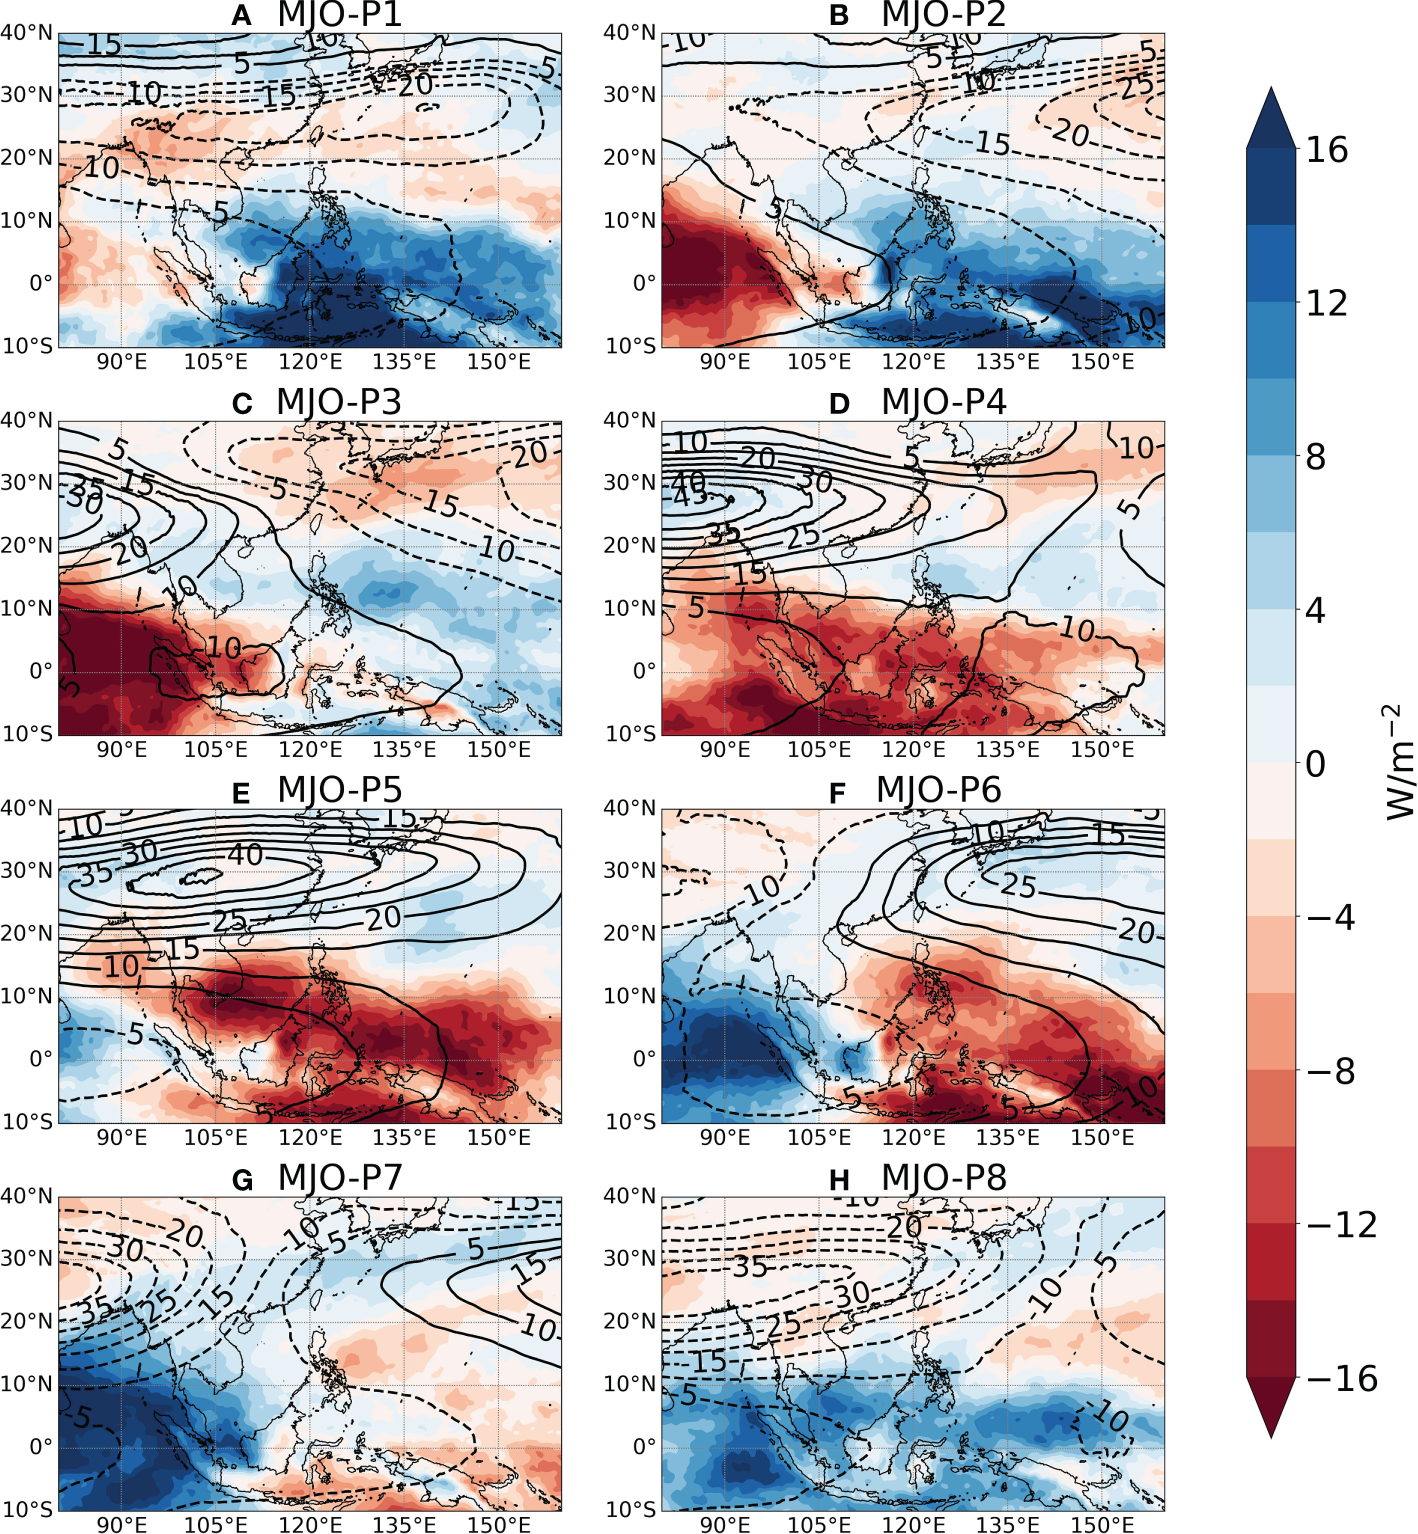
The anomalous geopotential thickness between 200 and 500-hPa (contour, unit: gpm) and anomalous Outgoing Longwave Radiation (color, unit: W/m2) based on eight phases of MJO. (A–H) corresponding to phases 1 to 8.
4 Summary
ARs are high-impact weather systems contributing to regional precipitation and rainfall extremes in the Asian monsoon region. This study has presented the first overview of the climatology and historical changes in ARs over Southeast Asia. The key findings of the research are summarized as follows:
-
(1) Climate reanalysis data during the autumn-winter season (ONDJFM) indicates a belt of frequent AR activities along 10°N from the western Pacific to the Andaman Sea. The most frequent AR activity within Southeast Asia is observed in the offshore region near southern Vietnam. The coastal regions of the South China Sea, particularly southern Thailand, the Philippines and Peninsular Malaysia, are also affected by frequent landfalling ARs. The analyses of the long-term trend in AR frequency during the period 1951–2015 show significant increasing trends over most of the AR active regions in Southeast Asia. The largest magnitude of such an increasing trend is located from the Philippines to the central South China Sea. In addition, the distribution of trends indicates an eastward shift of ARs from the eastern Indian Ocean to the western Pacific.
-
(2) As ARs tend to become more active, significant increasing trends in AR-associated precipitation are commonly found in the coastal areas surrounding the South China Sea, though marginal decreasing trends are seen in the north of the Philippines and south of Thailand due to the local decreasing trends in AR frequency. On average, ARs are associated with the majority of the extreme precipitation amount in northeastern Peninsular Malaysia, southern Vietnam and the southeastern Philippines. Meanwhile, an increasing trend in the contribution of ARs to extreme precipitation amounts is noted on the east coast of Peninsular Malaysia, western Borneo and the Philippines.
-
(3) Composite analyses for AR frequency during the different phases of MJO suggest a pronounced enhancement of AR activity by the MJO phase-2 to phase-3 due to the steeper gradient of low-level geopotential height between the Northwestern Pacific and the tropical Indian Ocean. This modulation can be partly explained by the enhanced convection and the adiabatic heating in the vicinity of the trough of the 200-500 hPa geopotential thickness of the region. Opposite modulations of ARs and the associated dynamical environments are seen for the MJO phase-5 and phase-6. Overall, the modulation of ARs by MJO suggests close spatial and temporal relationships between ARs and the tropical convection pattern in Southeast Asia.
This study has demonstrated that ARs are important mechanisms behind the climatology, trends and variability of the regional precipitation in Southeast Asia. However, one of the main limitations of the study is the lack of investigation of how the uncertainty in the choice of climate observation and reanalysis datasets affect the analyses of AR climatology and its long-term trend over the study region. Also, as ARs are usually correlated with mid-latitude synoptic systems (e.g. Zhu and Newell, 1994; Dacre et al., 2015), the interaction of ARs with other synoptic processes, such as the northeasterly cold surges and Borneo Vortices (Lim et al., 2017; Saragih et al., 2018) of the study region, remain unknown and should be focused in future studies. This paper is expected to be a call for more attention to the impact of ARs and their changes in Southeast Asia. Given the non-negligible effect of Southeast Asian ARs presented in this study, future research on such high-impact weather systems should be incorporated with climate model simulations to project their possible future changes under climate warming conditions and explore the in-depth hydrological impacts of the projected changes based on hydrological modelling techniques.
Statements
Data availability statement
The original contributions presented in the study are included in the article/Supplementary Material. Further inquiries can be directed to the corresponding author.
Author contributions
YY: Formal analysis, Writing - Original Draft. JL: Conceptualization, Methodology, Visualization, Writing - Review & Editing. KY: Data Curation, Validation. All authors contributed to the article and approved the submitted version.
Funding
This research was supported by the Natural Science Foundation of Guangxi Province (2022GXNSFAA035441) and the National Natural Science Foundation of China (42265007).
Conflict of interest
The authors declare that the research was conducted in the absence of any commercial or financial relationships that could be construed as a potential conflict of interest.
Publisher’s note
All claims expressed in this article are solely those of the authors and do not necessarily represent those of their affiliated organizations, or those of the publisher, the editors and the reviewers. Any product that may be evaluated in this article, or claim that may be made by its manufacturer, is not guaranteed or endorsed by the publisher.
References
1
Adhikari P. Hong Y. Douglas K. R. Kirschbaum D. B. Gourley J. Adler R. et al . (2010). A digitized global flood inventory, (1998–2008): compilation and preliminary results. Nat. Hazards.55, 405–422. doi: 10.1007/s11069-010-9537-2
2
Basconcillo J. Lucero A. Solis A. Sandoval J. R. Bautista E. Koizumi T. et al . (2016). Statistically downscaled projected changes in seasonal mean temperature and rainfall in cagayan valley, Philippines. J. Meteorol. Soc Jpn. Ser. II.94A, 151–164. doi: 10.2151/jmsj.2015-058
3
Bui H. X. Maloney E. D. (2018). Changes in madden-Julian oscillation precipitation and wind variance under global warming. Geophys. Res. Lett.45, 7148–7155. doi: 10.1029/2018GL078504
4
Chang C.-P. Harr P. A. Chen H.-J. (2005a). Synoptic disturbances over the equatorial south China Sea and Western maritime continent during Boreal winter. Mon. Weather Rev.133, 489–503. doi: 10.1175/mwr-2868.1
5
Chang C.-P. Wang Z. McBride J. Liu C.-H. (2005b). Annual cycle of southeast Asia–maritime continent rainfall and the asymmetric monsoon transition. J. Clim.18, 287–301. doi: 10.1175/jcli-3257.1
6
Cheong W. K. Timbal B. Golding N. Sirabaha S. Kwan K. F. Cinco T. A. et al . (2018). Observed and modelled temperature and precipitation extremes over southeast Asia from 1972 to 2010. Int. J. Climatol.38, 3013–3027. doi: 10.1002/joc.5479
7
Collow A. B. M. Shields C. A. Guan B. Kim S. Lora J. M. McClenny E. E. et al . (2022). An overview of ARTMIP's tier 2 reanalysis intercomparison: Uncertainty in the detection of atmospheric rivers and their associated precipitation. J. Geophys. Res.-Atmos.127, e2021JD036155. doi: 10.1029/2021JD036155
8
Dacre H. F. Clark P. A. Martinez-Alvarado O. Stringer M. A. Lavers D. A. (2015). How do atmospheric rivers form? Bull. Amer. Meteorol. Soc96, 1243–1255. doi: 10.1175/bams-d-14-00031.1
9
Demirdjian R. Norris J. R. Martin A. Ralph F. M. (2020). Dropsonde observations of the ageostrophy within the pre-Cold-Frontal low-level jet associated with atmospheric rivers. Mon. Weather Rev.148, 1389–1406. doi: 10.1175/mwr-d-19-0248.1
10
Dettinger M. D. (2011). Climate change, atmospheric rivers, and floods in California – a multimodel analysis of storm frequency and magnitude Changes1. JAWRA J. Am. Water Resour. Assoc.47, 514–523. doi: 10.1111/j.1752-1688.2011.00546.x
11
Dettinger M. D. (2013). Atmospheric rivers as drought busters on the U.S. West coast. J. Hydrometeorol.14, 1721–1732. doi: 10.1175/JHM-D-13-02.1
12
Endo N. Matsumoto J. Lwin T. (2009). Trends in precipitation extremes over southeast Asia. SOLA.5, 168–171. doi: 10.2151/sola.2009-043
13
Franzke C. L. E. Jelic D. Lee S. Feldstein S. B. (2019). Systematic decomposition of the MJO and its northern hemispheric extratropical response into rossby and inertio-gravity components. Q. J. R. Meteorol. Soc145, 1147–1164. doi: 10.1002/qj.3484
14
Gorodetskaya I. V. Tsukernik M. Claes K. Ralph M. F. Neff W. D. Van Lipzig N. P. M. (2014). The role of atmospheric rivers in anomalous snow accumulation in East Antarctica. Geophys. Res. Lett.41, 6199–6206. doi: 10.1002/2014GL060881
15
Guan B. Molotch N. P. Waliser D. E. Fetzer E. J. Neiman P. J. (2010). Extreme snowfall events linked to atmospheric rivers and surface air temperature via satellite measurements. Geophys. Res. Lett.37, L20401. doi: 10.1029/2010GL044696
16
Hamada A. Arakawa O. Yatagai A. (2011). An automated quality control method for daily rain-gauge data. Glob. Environ. Res.15, 183–192.
17
Hersbach H. Bell B. Berrisford P. Hirahara S. Horányi A. Muñoz-Sabater J. et al . (2020). The ERA5 global reanalysis. Q. J. R. Meteorol. Soc146, 1999–2049. doi: 10.1002/qj.3803
18
Kamae Y. Mei W. Xie S.-P. (2017a). Climatological relationship between warm season atmospheric rivers and heavy rainfall over East Asia. J. Meteorol. Soc Jpn. Ser. II. advpub.95, 411–431. doi: 10.2151/jmsj.2017-027
19
Kamae Y. Mei W. Xie S.-P. (2019). Ocean warming pattern effects on future changes in East Asian atmospheric rivers. Environ. Res. Lett.14, 054019. doi: 10.1088/1748-9326/ab128a
20
Kamae Y. Mei W. Xie S.-P. Naoi M. Ueda H. (2017b). Atmospheric rivers over the northwestern pacific: Climatology and interannual variability. J. Clim.30, 5605–5619. doi: 10.1175/jcli-d-16-0875.1
21
Kim J. Moon H. Guan B. Waliser D. E. Choi J. Gu T.-Y. et al . (2020). Precipitation characteristics related to atmospheric rivers in East Asia. Int. J. Climatol.41, E2244–E2257. doi: 10.1002/joc.6843
22
Kim I.-W. Oh J. Woo S. Kripalani R. H. (2019). Evaluation of precipitation extremes over the Asian domain: observation and modelling studies. Clim. Dyn.52, 1317–1342. doi: 10.1007/s00382-018-4193-4
23
Lavers D. A. Villarini G. (2015). The contribution of atmospheric rivers to precipitation in Europe and the united states. J. Hydrol.522, 382–390. doi: 10.1016/j.jhydrol.2014.12.010
24
Liang J. Sushama L. (2019). Freezing rain events related to atmospheric rivers and associated mechanisms for Western north America. Geophys. Res. Lett.46, 10541–10550. doi: 10.1029/2019GL084647
25
Liang J. Tan M. L. Hawcroft M. Catto J. L. Hodges K. I. Haywood J. M. (2021). Monsoonal precipitation over peninsular Malaysia in the CMIP6 HighResMIP experiments: the role of model resolution. Clim. Dyn.58, 2783–2805. doi: 10.1007/s00382-021-06033-y
26
Liang J. Yong Y. (2021). Climatology of atmospheric rivers in the Asian monsoon region. Int. J. Climatol.41, E801–E818. doi: 10.1002/joc.6729
27
Liang J. Yong Y. (2022). Dynamics of probable maximum precipitation within coastal urban areas in a convection-permitting regional climate model. Front. Mar. Sci.8. doi: 10.3389/fmars.2021.747083
28
Liang J. Yong Y. Hawcroft M. K. (2022). Long-term trends in atmospheric rivers over East Asia. Clim. Dyn.60, 643–666. doi: 10.1007/s00382-022-06339-5
29
Lim S. Y. Marzin C. Xavier P. Chang C.-P. Timbal B. (2017). Impacts of Boreal winter monsoon cold surges and the interaction with MJO on southeast Asia rainfall. J. Clim.30, 4267–4281. doi: 10.1175/jcli-d-16-0546.1
30
Lorente-Plazas R. Montavez J. P. Ramos A. M. Jerez S. Trigo R. M. Jimenez-Guerrero P. (2020). Unusual atmospheric-River-Like structures coming from Africa induce extreme precipitation over the Western Mediterranean Sea. J. Geophys. Res.-Atmos.125, e2019JD031280. doi: 10.1029/2019JD031280
31
Mahoney K. Jackson D. L. Neiman P. Hughes M. Darby L. Wick G. et al . (2016). Understanding the role of atmospheric rivers in heavy precipitation in the southeast united states. Mon. Weather Rev.144, 1617–1632. doi: 10.1175/mwr-d-15-0279.1
32
Manton M. J. Della-Marta P. M. Haylock M. R. Hennessy K. J. Nicholls N. Chambers L. E. et al . (2001). Trends in extreme daily rainfall and temperature in southeast Asia and the south pacific: 1961–1998. Int. J. Climatol.21, 269–284. doi: 10.1002/joc.610
33
Mundhenk B. D. Barnes E. A. Maloney E. D. (2016). All-season climatology and variability of atmospheric river frequencies over the north pacific. J. Clim.29, 4885–4903. doi: 10.1175/jcli-d-15-0655.1
34
Neiman P. J. Ralph F. M. Moore B. J. Hughes M. Mahoney K. M. Cordeira J. M. et al . (2013). The landfall and inland penetration of a flood-producing atmospheric river in arizona. part I: Observed synoptic-scale, orographic, and hydrometeorological characteristics. J. Hydrometeorol.14, 460–484. doi: 10.1175/jhm-d-12-0101.1
35
Oh J.-H. Kim K.-Y. Lim G.-H. (2012). Impact of MJO on the diurnal cycle of rainfall over the western maritime continent in the austral summer. Clim. Dyn.38, 1167–1180. doi: 10.1007/s00382-011-1237-4
36
Pan M. Lu M. (2019). A novel atmospheric river identification algorithm. Water Resour. Res.55, 6069–6087. doi: 10.1029/2018WR024407
37
Pan M. Lu M. (2020). East Asia Atmospheric river catalog: Annual cycle, transition mechanism, and precipitation. Geophys. Res. Lett.47, e2020GL089477. doi: 10.1029/2020GL089477
38
Park C.-K. Park D.-S. R. Ho C.-H. Park T.-W. Kim J. Jeong S. et al . (2020). A dipole mode of spring precipitation between southern China and southeast Asia associated with the Eastern and central pacific types of ENSO. J. Clim.33, 10097–10111. doi: 10.1175/jcli-d-19-0625.1
39
Peatman S. C. Matthews A. J. Stevens D. P. (2014). Propagation of the madden–Julian oscillation through the maritime continent and scale interaction with the diurnal cycle of precipitation, q. j. r. Meteorol. Soc, 140, 814–825. doi: 10.1002/qj.2161
40
Pullen J. Gordon A. L. Flatau M. Doyle J. D. Villanoy C. Cabrera O. (2015). Multiscale influences on extreme winter rainfall in the Philippines. J. Geophys. Res.-Atmos.120, 3292–3309. doi: 10.1002/2014JD022645
41
Raghavan S. V. Liu J. Nguyen N. S. Vu M. T. Liong S.-Y. (2018). Assessment of CMIP5 historical simulations of rainfall over southeast Asia. Theor. Appl. Climatol.132, 989–1002. doi: 10.1007/s00704-017-2111-z
42
Ramos A. M. Tomé R. Trigo R. M. Liberato M. L. R. Pinto J. G. (2016). Projected changes in atmospheric rivers affecting Europe in CMIP5 models. Geophys. Res. Lett.43, 9315–9323. doi: 10.1002/2016GL070634
43
Reid K. J. King A. D. Lane T. P. Short E. (2020). The sensitivity of atmospheric river identification to integrated water vapor transport threshold, resolution, and regridding method. J. Geophys. Res. Atmos.125, e2020JD032897. doi: 10.1029/2020JD032897
44
Rhoades A. M. Jones A. D. Srivastava A. Huang H. O'Brien T. A. Patricola C. M. et al . (2020). The shifting scales of Western U.S. landfalling atmospheric rivers under climate change. Geophys. Res. Lett.47, e2020GL089096. doi: 10.1029/2020GL089096
45
Rutz J. J. Shields C. A. Lora J. M. Payne A. E. Guan B. Ullrich P. et al . (2019). The atmospheric river tracking method intercomparison project (ARTMIP): Quantifying uncertainties in atmospheric river climatology. J. Geophys. Res.-Atmos.124, 13777–13802. doi: 10.1029/2019JD030936
46
Rutz J. J. Steenburgh W. J. Ralph F. M. (2015). The inland penetration of atmospheric rivers over Western north America: A Lagrangian analysis. Mon. Weather Rev.143, 1924–1944. doi: 10.1175/mwr-d-14-00288.1
47
Saragih R. M. Fajarianti R. Winarso P. A. (2018). Atmospheric study of the impact of Borneo vortex and madden-Julian oscillation over Western Indonesian maritime area. J. Phys.: Conf. Ser.997, 12004. doi: 10.1088/1742-6596/997/1/012004
48
Sellars S. L. Gao X. Sorooshian S. (2015). An object-oriented approach to investigate impacts of climate oscillations on precipitation: A western united states case study. J. Hydrometeorol.16, 830–842. doi: 10.1175/JHM-D-14-0101.1
49
Sengupta A. Nigam S. (2019). The northeast winter monsoon over the Indian subcontinent and southeast Asia: Evolution, interannual variability, and model simulations. J. Clim.32, 231–249. doi: 10.1175/jcli-d-18-0034.1
50
Shields C. A. Rutz J. J. Leung L. Y. Ralph F. M. Wehner M. Kawzenuk B. et al . (2018). Atmospheric river tracking method intercomparison project (ARTMIP): project goals and experimental design. Geosci. Model. Dev.11, 2455–2474. doi: 10.5194/gmd-11-2455-2018
51
Smith B. L. Yuter S. E. Neiman P. J. Kingsmill D. E. (2010). Water vapor fluxes and orographic precipitation over northern California associated with a landfalling atmospheric river. Mon. Weather Rev.138, 74–100. doi: 10.1175/2009mwr2939.1
52
Suhaila J. Deni S. M. Wan Zin W. Z. Jemain A. A. (2010). Spatial patterns and trends of daily rainfall regime in peninsular Malaysia during the southwest and northeast monsoons: 1975–2004. Meteorol. Atmos. Phys.110, 1–18. doi: 10.1007/s00703-010-0108-6
53
Suhaila J. Jemain A. A. (2012). Spatial analysis of daily rainfall intensity and concentration index in peninsular Malaysia. Theor. Appl. Climatol.108, 235–245. doi: 10.1007/s00704-011-0529-2
54
Tangang F. Farzanmanesh R. Mirzaei A. Supari Salimun E. Jamaluddin A. F. et al . (2017). Characteristics of precipitation extremes in Malaysia associated with El niño and la niña events. Int. J. Climatol.37, 696–716. doi: 10.1002/joc.5032
55
Wang Z. Chang C.-P. (2012). A numerical study of the interaction between the Large-scale monsoon circulation and orographic precipitation over south and southeast Asia. J. Clim.25, 2440–2455. doi: 10.1175/jcli-d-11-00136.1
56
Wang J. K. Yu J.-Y. Johnson K. R. (2020). Pacific and Atlantic controls of the relationship between mainland southeast Asia and East China interannual precipitation variability. Clim. Dyn.54, 4279–4292. doi: 10.1007/s00382-020-05227-0
57
Wheeler M. Hendon H. H. (2004). An all-season real-time multivariate MJO index: Development of an index for monitoring and prediction, Mon. Weather Rev.132, 1917–1932. doi: 10.1175/1520-0493(2004)132<1917:Aarmmi>2.0.Co;2
58
World Bank (2013). Postdam institute for climate impact research and climate analytics rep, in turn down the heat: Climate extremes, regional impacts, and the case for resilience. 254. (Washington, DC: World Bank). doi: 10.1596/978-1-4648-0055-9
59
Wu P. Hara M. Fudeyasu H. Yamanaka M. D. Matsumoto J. Syamsudin F. et al . (2007). The impact of trans-equatorial monsoon flow on the formation of repeated torrential rains over Java island. SOLA.3, 93–96. doi: 10.2151/sola.2007-024
60
Wu C. H. Hsu H. H. (2009). Topographic influence on the MJO in the maritime continent. J. Clim.22, 5433–5448. doi: 10.1175/2009JCLI2825.1
61
Xavier P. Rahmat R. Cheong W. K. Wallace E. (2014). Influence of madden-Julian oscillation on southeast Asia rainfall extremes: Observations and predictability. Geophys. Res. Lett.41, 4406–4412. doi: 10.1002/2014GL060241
62
Yang Y. Zhao T. Ni G. Sun T. (2018). Atmospheric rivers over the bay of Bengal lead to northern Indian extreme rainfall. Int. J. Climatol.38, 1010–1021. doi: 10.1002/joc.5229
63
Yao C. Qian W. Yang S. Lin Z. (2010). Regional features of precipitation over Asia and summer extreme precipitation over southeast Asia and their associations with atmospheric–oceanic conditions. Meteorol. Atmos. Phys.106, 57–73. doi: 10.1007/s00703-009-0052-5
64
Yao C. Yang S. Qian W. Lin Z. Wen M. (2008). Regional summer precipitation events in Asia and their changes in the past decades. J. Geophys. Res.-Atmos.113, D17107. doi: 10.1029/2007JD009603
65
Yatagai A. Krishnamurti T. N. Kumar V. Mishra A. K. Simon A. (2014). Use of APHRODITE rain gauge–based precipitation and TRMM 3B43 products for improving Asian monsoon seasonal precipitation forecasts by the superensemble method. J. Clim.27, 1062–1069. doi: 10.1175/jcli-d-13-00332.1
66
Zhao B. Yang D. Yang S. Santisirisomboon J. (2022). Spatiotemporal characteristics of droughts and their propagation during the past 67 years in northern Thailand. Atmosphere.13, 277. doi: 10.3390/atmos13020277
67
Zhu Y. Newell R. E. (1994). Atmospheric rivers and bombs. Geophys. Res. Lett.21, 1999–2002. doi: 10.1029/94GL01710
68
Zhu Y. Newell R. E. (1998). A proposed algorithm for moisture fluxes from atmospheric rivers. Mon. Weather Rev.126, 725–735. doi: 10.1175/1520-0493(1998)126<0725:Apafmf>2.0.Co;2
69
Zin W. Z. W. Jemain A. A. (2010). Statistical distributions of extreme dry spell in peninsular Malaysia. Theor. Appl. Climatol.102, 253–264. doi: 10.1007/s00704-010-0254-2
Summary
Keywords
atmospheric rivers, Southeast Asia, precipitation, coastal area, Madden-Julian oscillation
Citation
Yong Y, Liang J and Yang K (2023) Distinct characteristics of western Pacific atmospheric rivers affecting Southeast Asia. Front. Mar. Sci. 10:1137982. doi: 10.3389/fmars.2023.1137982
Received
05 January 2023
Accepted
27 February 2023
Published
27 March 2023
Volume
10 - 2023
Edited by
Zhaoyun Chen, Shantou University, China
Reviewed by
Jing Ma, Nanjing University of Information Science and Technology, China; Ying Chen, Paul Scherrer Institut (PSI), Switzerland; Zhixiang Xiao, Nanning Normal University, China
Updates
Copyright
© 2023 Yong, Liang and Yang.
This is an open-access article distributed under the terms of the Creative Commons Attribution License (CC BY). The use, distribution or reproduction in other forums is permitted, provided the original author(s) and the copyright owner(s) are credited and that the original publication in this journal is cited, in accordance with accepted academic practice. No use, distribution or reproduction is permitted which does not comply with these terms.
*Correspondence: Ju Liang, j.liang@exeter.ac.uk
This article was submitted to Coastal Ocean Processes, a section of the journal Frontiers in Marine Science
Disclaimer
All claims expressed in this article are solely those of the authors and do not necessarily represent those of their affiliated organizations, or those of the publisher, the editors and the reviewers. Any product that may be evaluated in this article or claim that may be made by its manufacturer is not guaranteed or endorsed by the publisher.