Abstract
Due to the impacts of climate change, there is an urgent need to scale up existing, and develop novel, renewable energy technologies. Although there are many types of renewable energy technology, ocean renewable energy, including established offshore wind, and novel wave and tidal energy converters, offers many opportunities due to the abundance of the resource, availability of sea space, and (for tidal) predictability. However, the extraction of energy from the ocean environment will influence sediment dynamics and morphodynamics at various temporal and spatial scales. Detailed knowledge of seabed properties is also important for device installation, affecting foundation design and cabling. In this study, 36 seabed sediment samples were collected across a region of the Irish Sea extending from the west of Anglesey into Liverpool Bay up to a maximum distance of around 35 km offshore – a region where there are many existing and planned ocean renewable energy projects. Particle size analysis at quarter phi intervals was used to calculate the statistical properties of the seabed sediment samples, including Mean grain size, Sorting, Skewness and Kurtosis. These properties were compared against the outputs of wave (SWAN) and tidal (TELEMAC) models of the region to investigate the relationship between environmental variables and sediment characteristics, and to determine the impact and challenges of renewable energy technologies deployed in the region. Most of the sediments in the study area are medium sand, polymodal, very poorly sorted, coarse skewed, and very platykurtic. We found that mean water depth and peak current speed have the largest influence on Median grain size, and Sorting can be affected by tidal range, in addition to water depth and peak current speed. Moreover, minimal influence of wave climate was found on the sediments. A thorough discussion based on a literature review of the environmental issues of various energy converters (tidal energy converter (both individual and arrays), tidal barrage/lagoons, and wind turbines) was used to determine how devices in the study region, and at other sites throughout the world, would interact with sediment dynamics. We make recommendations on ways to minimize environmental impacts of ocean energy technologies.
1 Introduction
In recent decades, global climate change has become a major concern, applying pressure on many aspects of humankind. The combustion of fossil fuels and emission of greenhouse gases (GHG) such as carbon dioxide ( ) are playing a crucial role in the gradual rise in the overall temperature of the atmosphere (Romm, 2022). The consequences of climate change include changes in rainfall patterns, increased flood risk, severe storms, droughts, loss of species, fires, and sea-level rise (De Pryck, 2021). This, in turn, is affecting species distributions, habitats, and processes in the marine environment, leading to serious repercussions (Birchenough et al., 2015). Various methods for reducing or minimizing have been suggested (e.g. Hepburn et al. (2019)); however it seems that the most sustainable alternative is taking advantage of renewable energy resources (Newell et al., 2021), hence the demand for renewable energy has grown rapidly as a response to climate change (Dannheim et al., 2020).
Marine energy is the energy that resides in waves, tides, ocean currents, and ocean temperature and salinity gradients, which is available for conversion into electricity (Zabihian and Fung, 2011). In addition, many developments in renewable energy are taking place at sea (e.g. arrays of offshore wind turbines) due to the magnitude of the resource, available sea space, and reduced visual impact (Pelc and Fujita, 2002). However, the presence of marine renewable energy devices can disrupt their environment, from the disturbance of marine mammals during construction (underwater noise) (Madsen et al., 2006) and increased risk of bird collisions (Loss et al., 2013), to changes in hydrodynamics and sediment dynamics. The extraction of energy from the water column could directly impact marine sediment dynamics and affect the stability of morphodynamic features such as offshore sand banks (Neill et al., 2017). The seabed will also be disturbed during the construction and decommissioning of the energy conversion technologies and their associated infrastructure (e.g. foundations and cabling) (Rui et al., 2022). Removal of sediments leads to direct habitat loss, and turbidity will increase because of suspended particle matter (SPM). These resuspended sediments will be transported by the tidal currents, which could represent an additional source of contamination during the construction phase (Gill, 2005).
This study aims to characterize seabed sediments at a range of sites suitable for various offshore renewable energy technologies, relating the sediment properties to environmental variables such as wave height and tidal current speed. The study is based on the processing and analysis of seabed sediment samples collected at sea, compared against environmental data generated by validated wave and tidal models of the region.
2 Study area
The study area is the region of the Irish Sea extending from the west of Anglesey into Liverpool Bay, with 36 seabed sediment samples collected at a maximum distance of around 35 km offshore (Figure 1). The Irish Sea can broadly be regarded as a North-South aligned channel where the semi-diurnal (M2 and S2) tidal constituents dominate the tidal dynamics in the region, and the diurnal tides (K1 and O1) are relatively weak (Coughlan et al., 2021). The combination of relatively shallow water depths and strong currents are responsible for generally high bed shear stress over much of the region (Coughlan et al., 2021).
Figure 1
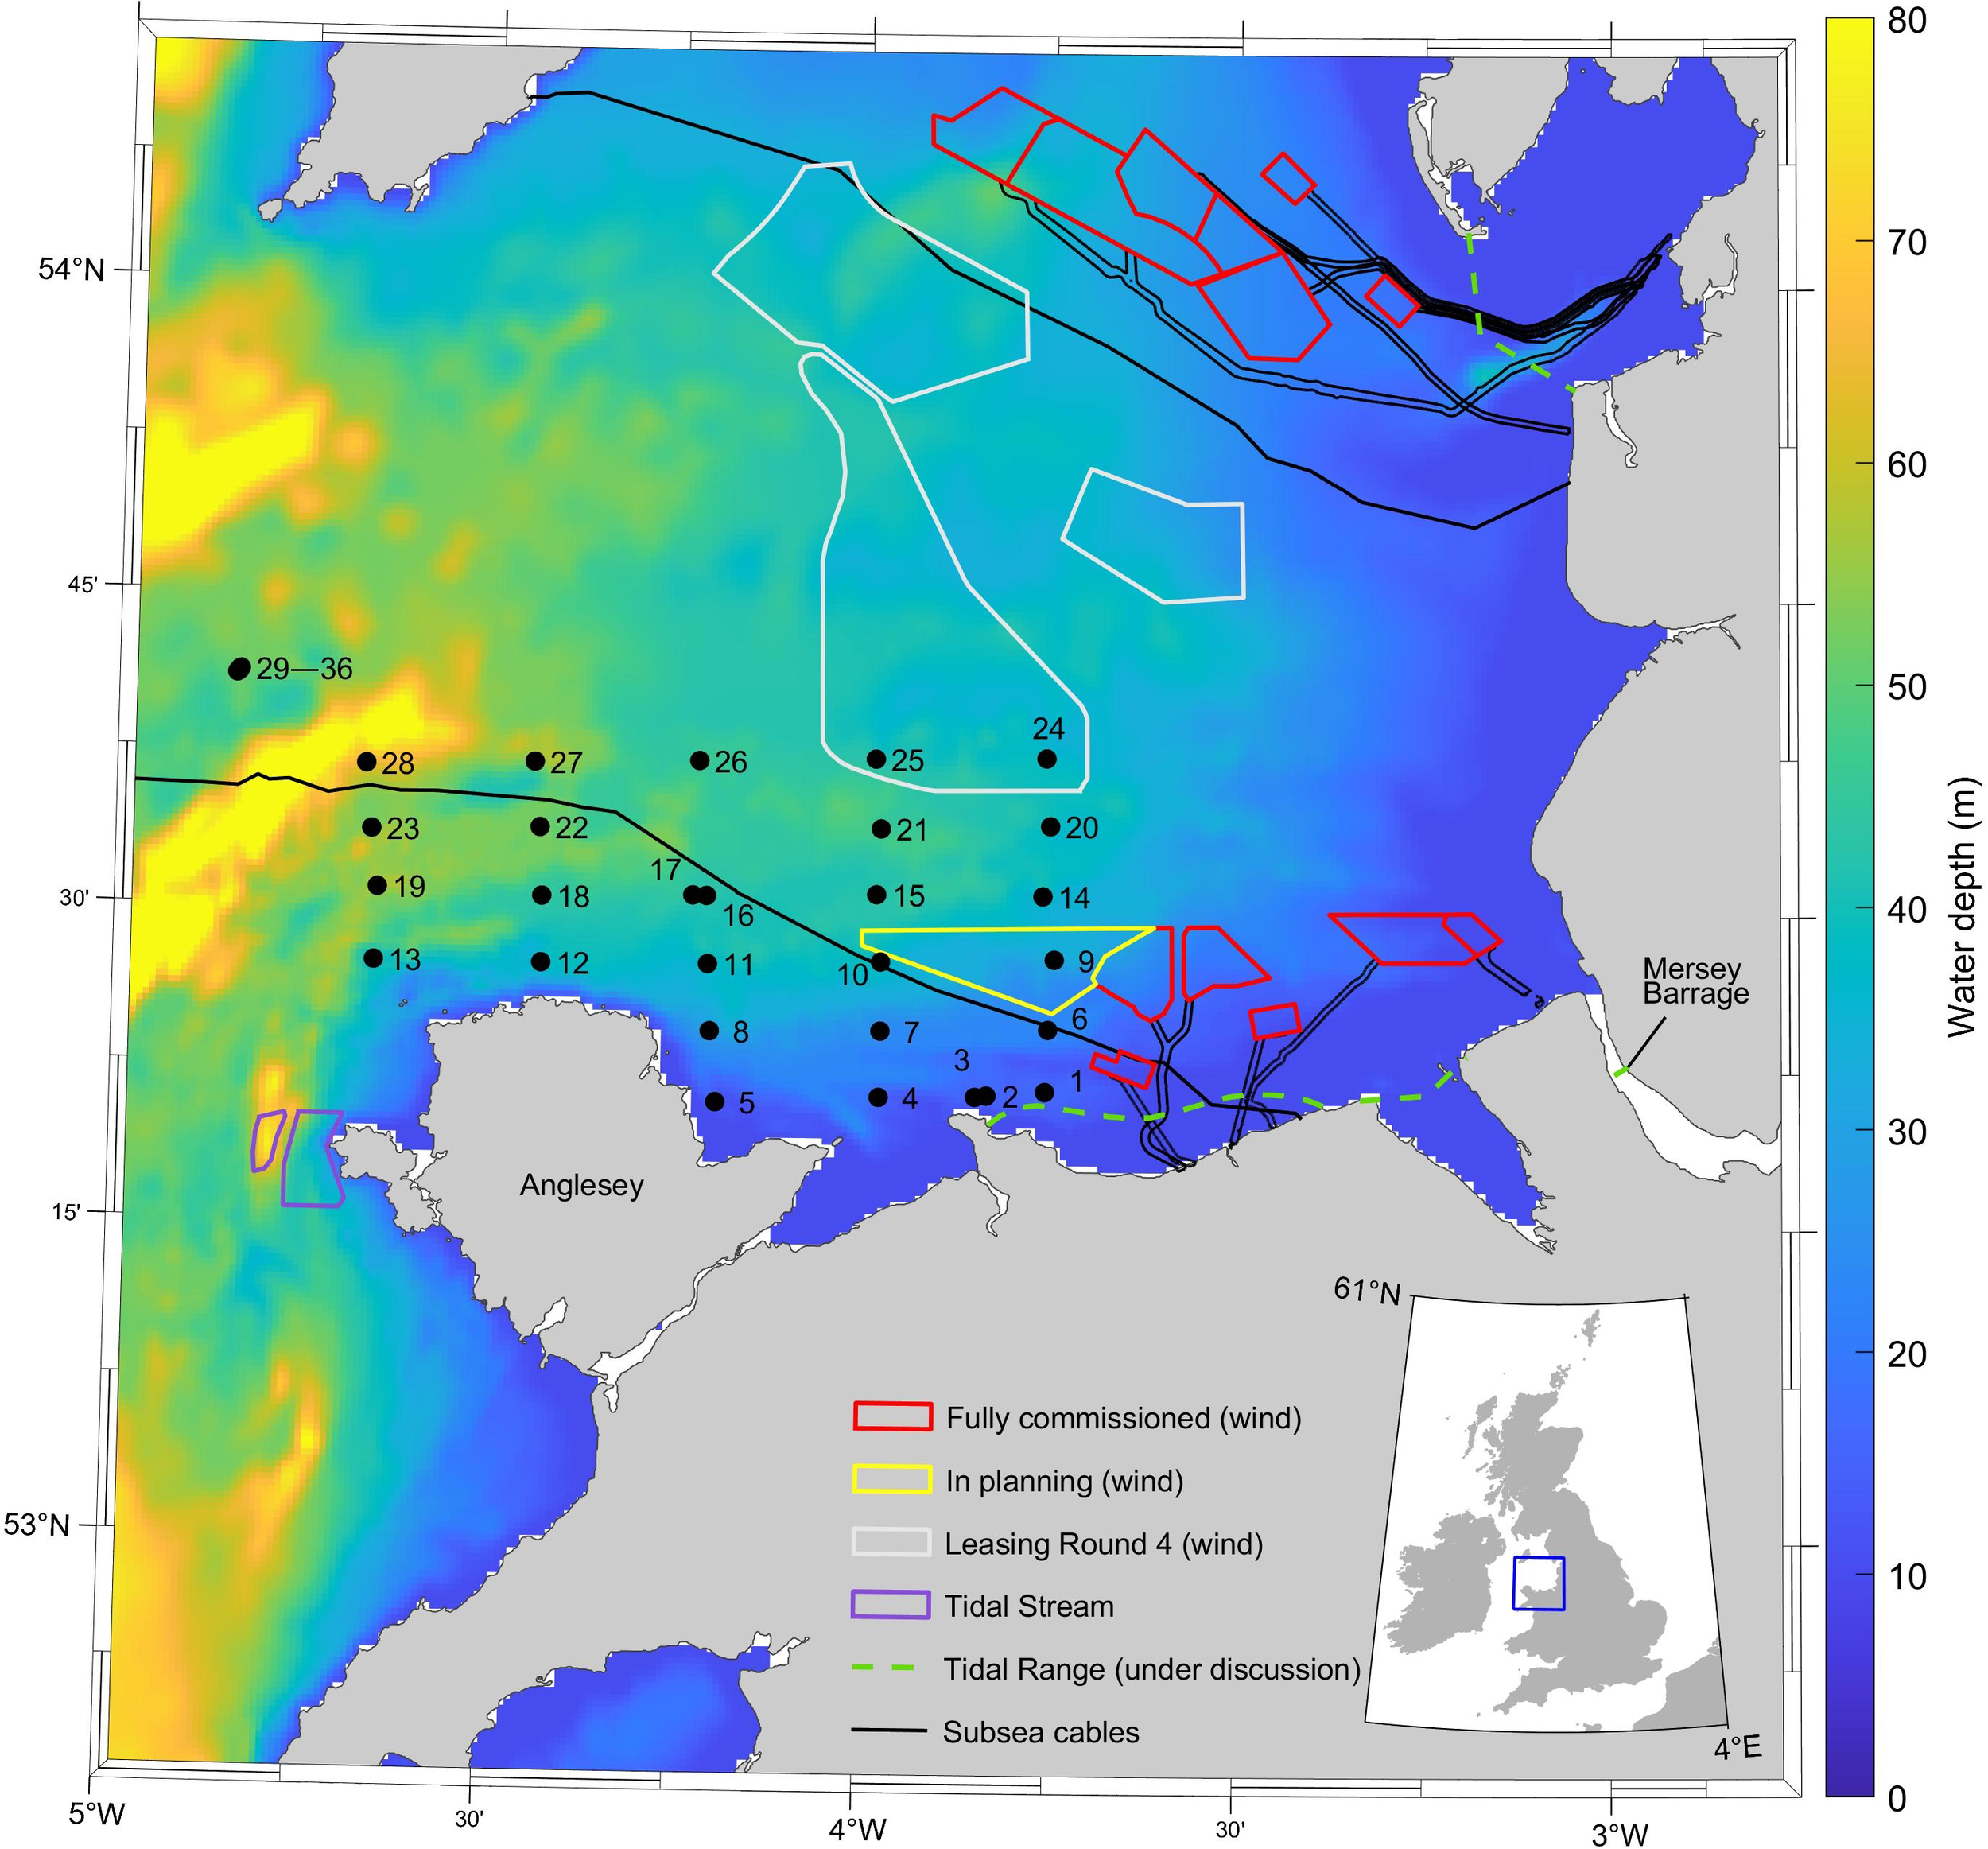
Map of sample locations in the Irish Sea and location of existing and proposed wind farms, tidal stream consented sites and tidal range proposed sites. Background color scale is bathymetry (from GEBCO) in meters relative to mean sea level. Wind farm, cables and tidal stream data from The Crown Estate.
The tidal wave propagates South to North along the Irish sea, primarily via the St. George channel and the North Channel, which connects the North Atlantic to the Northwest European shelf sea (Coughlan et al., 2021). Moreover, Anglesey and the narrow North Channel, which provide sheltering from the North Atlantic waves, prevent external swells from propagating into the Eastern Irish Sea. Since the Eastern Irish Sea has limited fetch, the waves in this region are often young, but due to shallow depths they can contribute to bed shear stress (Brown and Wolf, 2009).
Seabed sediments throughout the Irish Sea, which was formerly glaciated, are largely composed of reshaped glacial and postglacial material (Dobson et al., 1971; Holmes and Tappin, 2005). These sediments span a wide range of grain-size classes that are capable of being mobilized by waves, and particularly tidal currents (Xu et al., 2017). Moreover, the Central and Southern parts of the Irish Sea are dominated by sediments of sand and gravel grade (Jackson et al., 1995), also an area of muddy sediments called the Western Irish Sea Mud Belt (WISMB) is in the North Irish Sea, West of the Isle of Man. This area experiences seasonal stratification due to the formation of a dome of cold, dense water beneath a strong thermocline (Horsburgh et al., 2000). In this area, seabed sediments are mud to sand and can reach more than 40 m in thickness (Belderson, 1964; Coughlan et al., 2020). Most notably offshore Anglesey and the Southern Irish coast, gravel-grade material is expected to occur closer to the shore and within the Central Western Trough (Coughlan et al., 2021). In addition, sediment transport in the Irish Sea can be determined predominantly by wave action at the inshore waters, while further offshore sediment transport is more dependent on tidal currents (Van Dijk and Kleinhans, 2005; Van Landeghem et al., 2009).
The Irish Sea has considerable potential for renewable energy because of the ideal geographical position for wind generation due to close proximity to the Atlantic (Onoufriou et al., 2021). Considering the frequency and consistency of the wind which areas like Ireland and the United Kingdom experience, can make these regions possible to convert wind energy, especially at large scale (Onoufriou et al., 2021). Due to a large tidal range and strong tidal currents, the region is also host to many planned tidal energy projects, including the multiple tidal ranges schemes in Liverpool Bay (Neill et al., 2018) and the tidal stream array in the Anglesey Skerries (Robins et al., 2014).
3 Methods
36 seabed sediment samples were collected from the RV Prince Madog1 using a Shipek Sediment Grab Sampler from 3rd – 13th June 2021 (Figure 1). The mean water depth at the sampling locations varies from 12 m to 79 m. Four of the locations were sampled twice, i.e. there are 32 unique locations within the 36 samples.
3.1 Laboratory work
We used the dry sieving method for particle size analysis. Each sample was washed (eliminating the salt content) before applying Buchner funnel vacuum filtration, a technique for separating solid products from reaction mixtures. A Buchner funnel was used to pass the mixture through Whatman grade 50 filter papers (nominal particle retention 2.7 m); solids are trapped in the filter while liquids are drawn into the flask under the funnel. A vacuum system was used to speed up the filtration process. When all the water is vacuumed into the flask, the sediment is washed with fresh water, which is retained as it contains the majority of the fine sediments. This retained water was evaporated under a heating lamp to obtain the fine sediment content2.
Next, the sediment samples were dried in the oven for 24 h at C (grain size is not affected by this temperature as it will only remove unbound water, and the temperature is sufficiently low to prevent baking the clay minerals). Once cooled, the samples were weighed, and if they exceeded 500 g (Krumbein and Pettijohn, 1939) a random bulk splitter was used to divide them into three equal parts, with one portion being used for sieving.
For the mechanical analysis we assembled a phi () sieve stack increasing from 0.063 mm (4 phi) to 63 mm (-6 phi), where
with the grain diameter in millimeters. The sieve stack was placed on a mechanical shaker for 15 minutes (Ingram, 1971) where the sediment passed through a series of progressively finer meshes. The mass retained on each sieve was recorded (in grams to two decimal places) for subsequent data analysis.
3.2 Data analysis
The samples are characterized using the grain size distribution and statistics package GRADISTAT (Blott and Pye, 2001), which analyzes grain size statistics from any standard measurement technique, including sieving and laser granulometry, by both the method of moments and the Folk and Ward (1957) method (Folk and Ward, 1957). The scale is based on the logarithmic Udden-Wentworth size classification, where each size class boundary differs by a factor of two. Additionally, grade scale boundaries are transformed into phi values () (Eq. 1) to facilitate the graphical presentation and statistical analysis of grain size frequency data.
The sample statistics used in this study are calculated using the logarithmic graphical method developed by Folk and Ward (1957) for granulometric analysis (Folk and Ward, 1957). Based on this method, there are four parameters that describe the grain size distribution:
1. Graphical mean () of sediment size, calculated as follows:
2. where 16, 50, and 84 are the 16th, 50th, and 84th percentile of the grain size distribution, respectively. Sorting (), which refers to the uniformity of grain size of the sediments, and called the Inclusive Graphic Standard Deviation, found by the formula:
3. where 84, 16, 95, 5 represent the values of at 84, 16, 95, and 5 percentiles. Skewness (), statistically defined as the degree of asymmetry between grain size distribution. The measure of Inclusive Graphic Skewness is calculated by:
4. Kurtosis (), a measure of the ratio of the sorting in the central part of the distribution compared with the distribution at the tails. It is defined as:
The results of the calculation can also be characterized using descriptive expressions for sediment size classification (Table 1). Various sediment types were encompassed by the sample collection, including Clay grain size ( mm), Silt ( mm), Sand ( mm) and Gravel ( mm) (Blott and Pye, 2001), also median grain size () is the most regular measurement, which is used for grain size, at which 50% of the particles are smaller in mass (Martins, 2003).
Table 1
| Sorting (σ1) | Skewness (Sk1) | Kurtosis (KG) | |||
|---|---|---|---|---|---|
| Very well sorted | < 0.35 | Very Fine Skewed | +0.3 to +1.0 | Very platykurtic | < 0.67 |
| Well sorted | 0.35 − 0.50 | Fine Skewed | +0.1 to +0.3 | Platykurtic | 0.67 − 0.90 |
| Moderately well sorted | 0.50 − 0.70 | Symmetrical | +0.1 to -0.1 | Mesokurtic | 0.90 − 1.11 |
| Moderately sorted | 0.70 − 1.00 | Coarse skewed | 0.1 to -0.3 | Leptokurtic | 1.11 − 1.50 |
| Poorly sorted | 1.00 − 2.00 | Very coarse skewed | -0.3 to -1.0 | Leptokurtic | 1.50 − 3.00 |
| Very poorly sorted | 2.00 − 4.00 | Extremely leptokurtic | > 3.00 | ||
| Extremely poorly sorted | > 4.00 | ||||
Descriptive expressions for different categories of sorting, skewness and kurtosis (Blott and Pye, 2001).
3.3 Environmental variables
Time series of depth-averaged current speed and variation in water depths were extracted from a two-dimensional (depth-averaged) tidal model (TELEMAC) (Robins et at., 2019). TELEMAC uses an unstructured-mesh, with the resolution varying from high resolution at the coastline to coarser resolution offshore. The model was run for one month to encompass model spin up and provide a suitable time period to resolve the tidal constituents (Robins et al., 2019). The tidal forcing at the model boundaries consists of 13 diurnal, semi-diurnal and quarter-diurnal harmonic constituents (M2, S2, N2, K2, K1, O1, P1, Q1, M4, MS4, MN4, Mf, and Mm) extracted from the TPXO global tidal database ( resolution) (Egbert et al., 1994).
Wave properties were extracted from a spectral wave model (SWAN) of the study region (Roche et al., 2016). The SWAN model of the Irish Sea is nested within an outer coarser SWAN model of the North Atlantic (Neill and Hashemi, 2013). The model was run for one year (2014) and variables (significant wave height and mean wave period) output 3-hourly at the seabed sediment sample locations. The SWAN model had a spectral resolution of 40 frequencies (from 0.04 to 1.0 Hz) and 45 directions. Wind forcing was from ERA-5 (Soares et al., 2020) which is 3-hourly at a resolution of 0.75 degrees (applied to both inner and outer grids). The full wave energy spectrum is transferred from the outer model to the boundary points of the inner grid, which has a resolution of (Roche et al., 2016). Although there will be significant inter-annual variability in the wave climate, the one year selected for the study is sufficient to test whether wave properties were strongly related to the seabed sediment characteristics, particularly as the site is relatively sheltered from swell waves (Section 3). If a relationship is found, this could be the subject of a future, more focused, investigation using a longer time series of wave modelling. By taking advantage of MATLAB and Excel (Regression and Pearson test) the relationship between seabed sediment properties and environmental characteristics was assessed.
4 Results
4.1 Particle size analysis
Various sediment properties relating to each analyzed Shipek grab sample are presented in Table 2. The raw data is available in the Supplementary Materials. The analysis of grain size distribution spans from Very Fine Sand (0.063 m) to Gravel (63 mm), and is summarized as follows.
Table 2
| Sample | Highest-Class Weight (mm) | Mode | Mean () | Sorting () | Skewness () | Kurtosis () |
|---|---|---|---|---|---|---|
| 1 | 11.20 | Polymodal | -1.568 | 2.413 | 0.274 | 0.544 |
| 2 | 11.20 | Polymodal | -1.518 | 2.583 | 0.431 | 0.523 |
| 3 | 0.25 | Bimodal | 1.791 | 0.661 | -0.374 | 1.836 |
| 4 | 0.25 | Bimodal | 2.078 | 0.353 | 0.311 | 0.858 |
| 5 | 0.30 | Bimodal | 1.830 | 0.526 | 0.475 | 1.151 |
| 6 | 0.30 | Unimodal | 1.574 | 0.216 | -0.011 | 1.726 |
| 7 | 0.30 | Trimodal | 1.846 | 0.708 | -0.232 | 2.744 |
| 8 | 11.20 | Polymodal | -1.222 | 2.152 | 0.350 | 0.588 |
| 9 | 0.50 | Unimodal | 1.045 | 0.460 | -0.153 | 1.971 |
| 10 | 0.30 | Polymodal | 0.807 | 1.546 | -0.519 | 1.028 |
| 11 | 0.30 | Trimodal | 1.794 | 0.767 | -0.192 | 2.389 |
| 12 | 0.50 | Polymodal | -1.844 | 2.343 | -0.007 | 0.491 |
| 13 | 22.40 | Polymodal | -2.347 | 1.997 | 0.259 | 0.667 |
| 14 | 0.30 | Polymodal | 1.214 | 0.866 | -0.220 | 1.543 |
| 15 | 2.00 | Bimodal | 0.561 | 1.278 | -0.324 | 0.547 |
| 16 | 31.50 | Polymodal | -1.873 | 2.563 | 0.229 | 0.534 |
| 17 | 31.50 | Bimodal | -3.027 | 2.190 | 0.506 | 0.711 |
| 18 | 16.00 | Unimodal | -1.716 | 2.194 | 0.225 | 0.564 |
| 19 | 16.00 | Polymodal | -2.416 | 2.110 | 0.365 | 0.798 |
| 20 | 0.30 | Polymodal | 0.914 | 1.284 | -0.379 | 0.800 |
| 21 | 31.50 | Polymodal | -2.167 | 2.641 | 0.238 | 0.508 |
| 22 | 0.35 | Polymodal | -1.501 | 2.453 | 0.138 | 0.604 |
| 23 | 2.00 | Bimodal | 0.036 | 1.082 | 0.255 | 0.515 |
| 24 | 0.60 | Polymodal | 0.743 | 0.945 | -0.061 | 1.232 |
| 25 | 0.32 | Polymodal | 0.140 | 1.854 | -0.459 | 0.798 |
| 26 | 26.50 | Polymodal | -0.978 | 2.560 | -0.538 | 0.762 |
| 27 | 0.30 | Polymodal | -0.557 | 2.075 | -0.139 | 0.646 |
| 28 | 26.50 | Polymodal | -2.181 | 2.753 | 0.395 | 0.532 |
| 29 | 2.00 | Polymodal | -1.762 | 2.437 | -0.444 | 1.328 |
| 30 | 0.50 | Bimodal | 0.500 | 1.277 | -0.208 | 1.203 |
| 31 | 0.43 | Polymodal | -0.443 | 2.033 | -0.486 | 0.775 |
| 32 | 0.43 | Polymodal | -0.556 | 1.853 | -0.437 | 0.689 |
| 33 | 2.00 | Trimodal | -0.298 | 0.657 | -0.139 | 0.609 |
| 34 | 2.00 | Trimodal | -0.290 | 0.650 | -0.190 | 0.615 |
| 35 | 0.71 | Bimodal | 0.373 | 0.969 | -0.163 | 1.542 |
| 36 | 2.00 | Bimodal | 0.313 | 1.095 | -0.188 | 1.354 |
Parameters for describing grain size distribution.
The Highest-Class Weight found at each location is given in the second column of Table 2, and the percentage of grain size distribution across the study area summarized in Figure 2. Only 10.2% of the mass of all the collected sediment samples was classified as fine sand. 28% of grain size distribution is medium sand, and can be seen mostly in the stations further offshore. There is 17.8 coarse sand in the sediment samples across the study region, 8.1 very coarse sand, and 11.4 very fine gravel, 6.2 fine gravel, 5.9 medium gravel, 8.3 coarse gravel, 2.5 and 0.7 are very coarse gravel and mud clay respectively. Sediments in the western part of the study area are predominantly gravel (Figure 3A). 13/36 (i.e. around 36%) of the samples are sandy gravel, and 16/36 (i.e. around 44%) of the samples are gravelly sand.
Figure 2
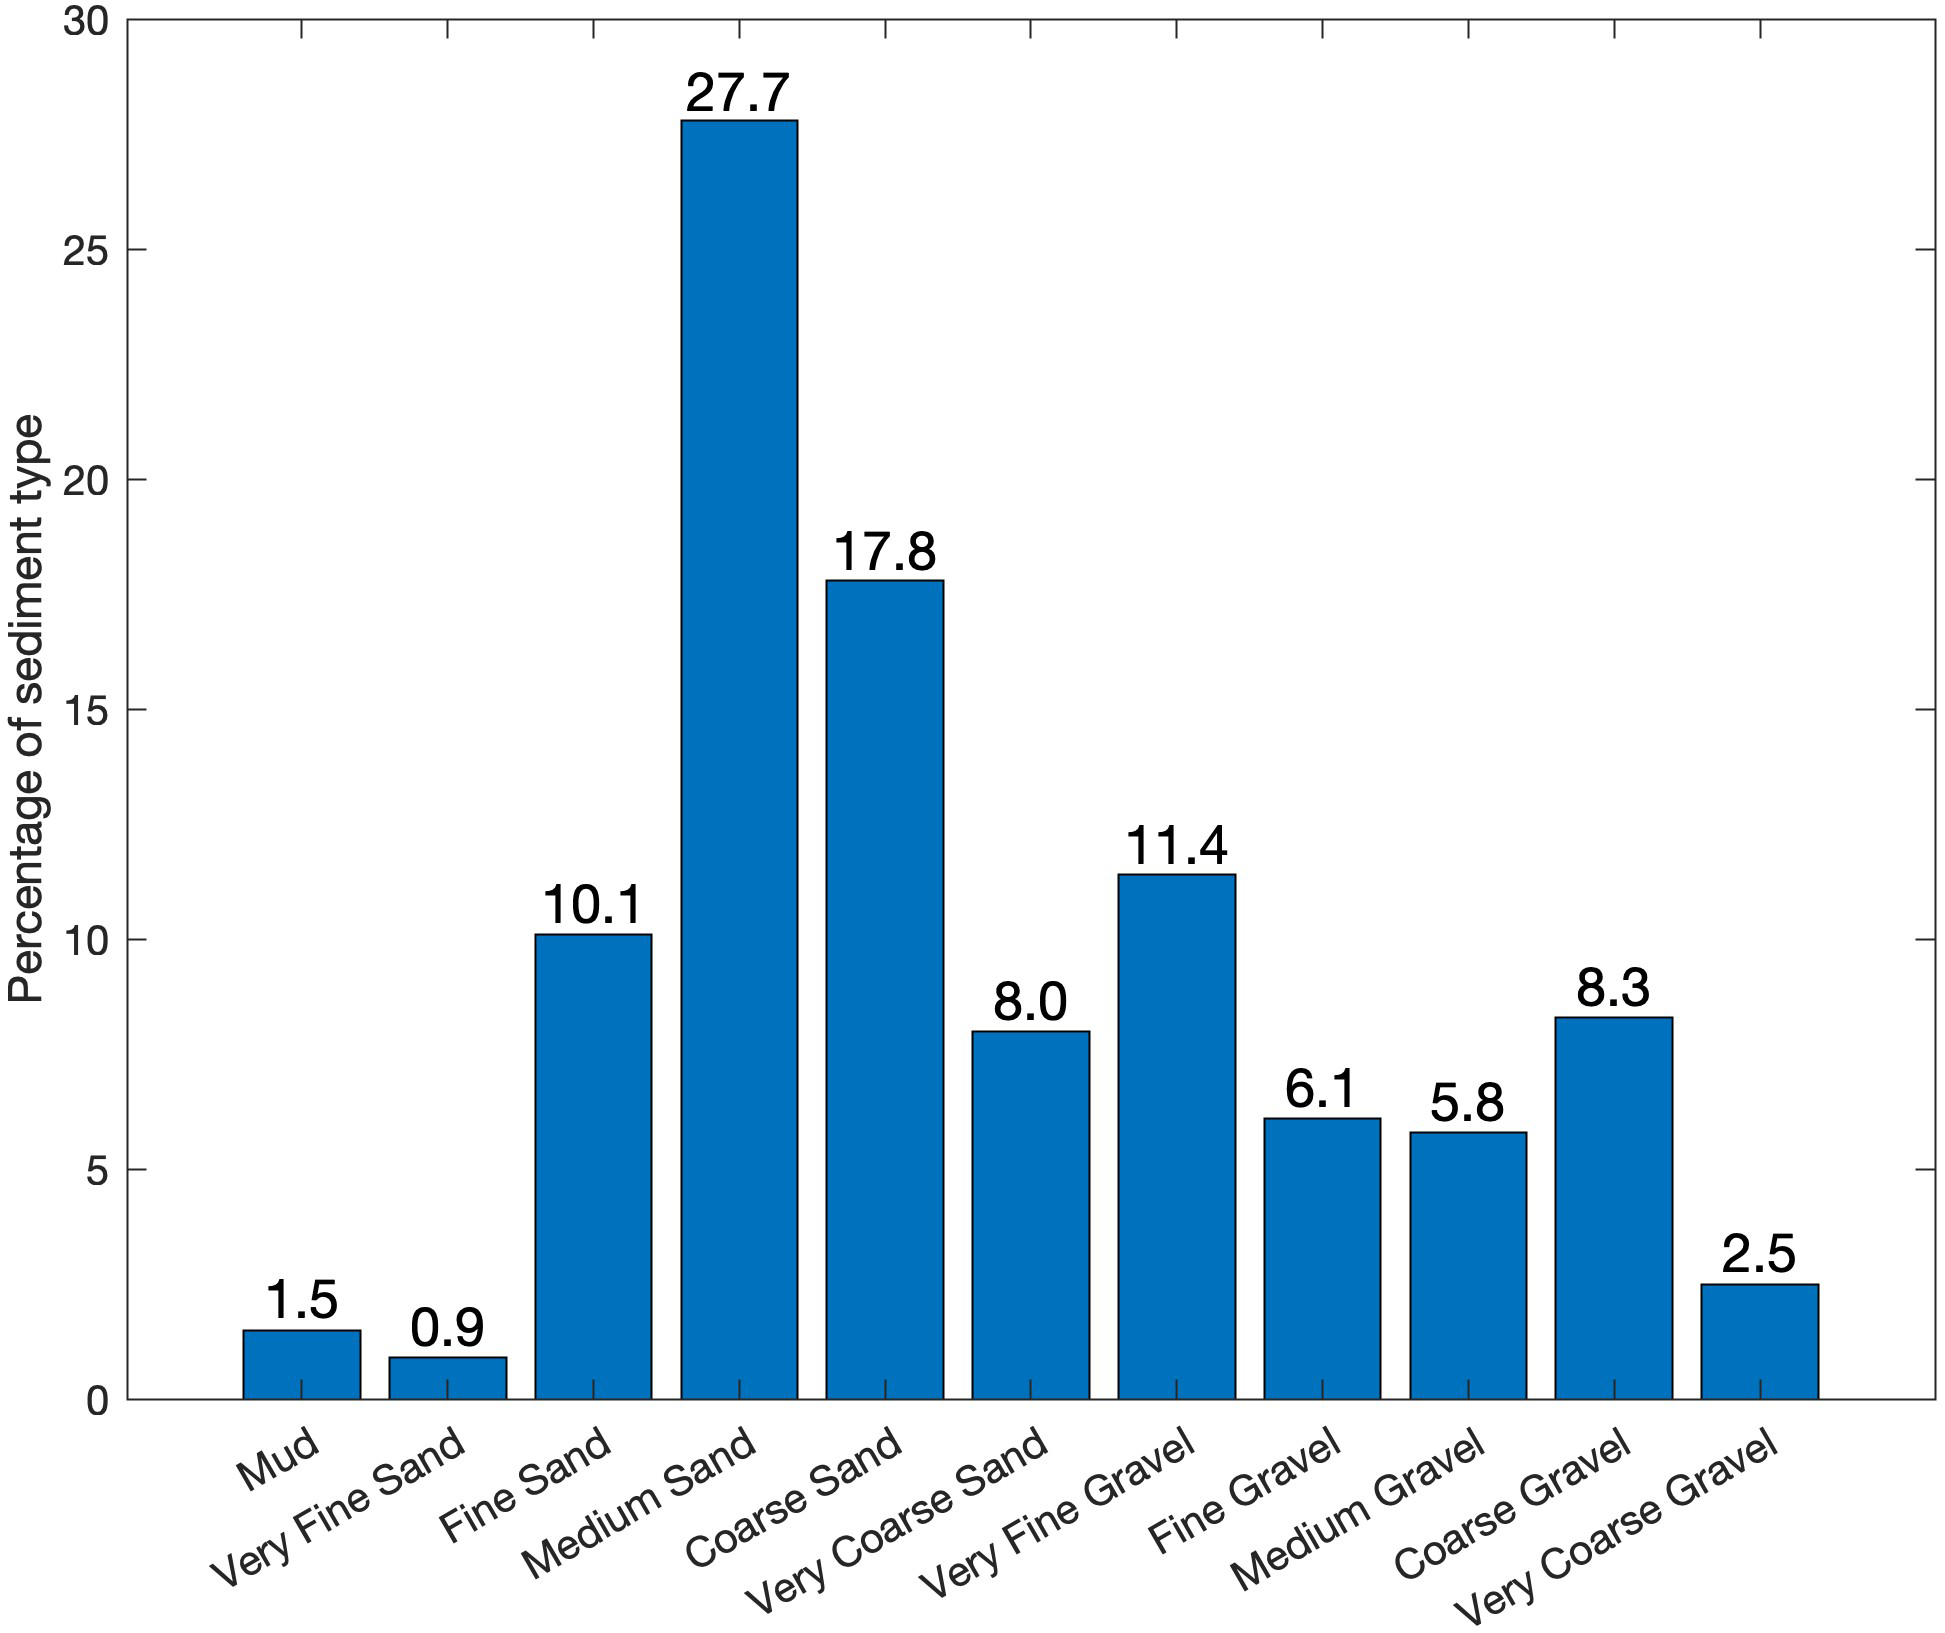
Percentage of sediment type across all seabed samples.
Figure 3
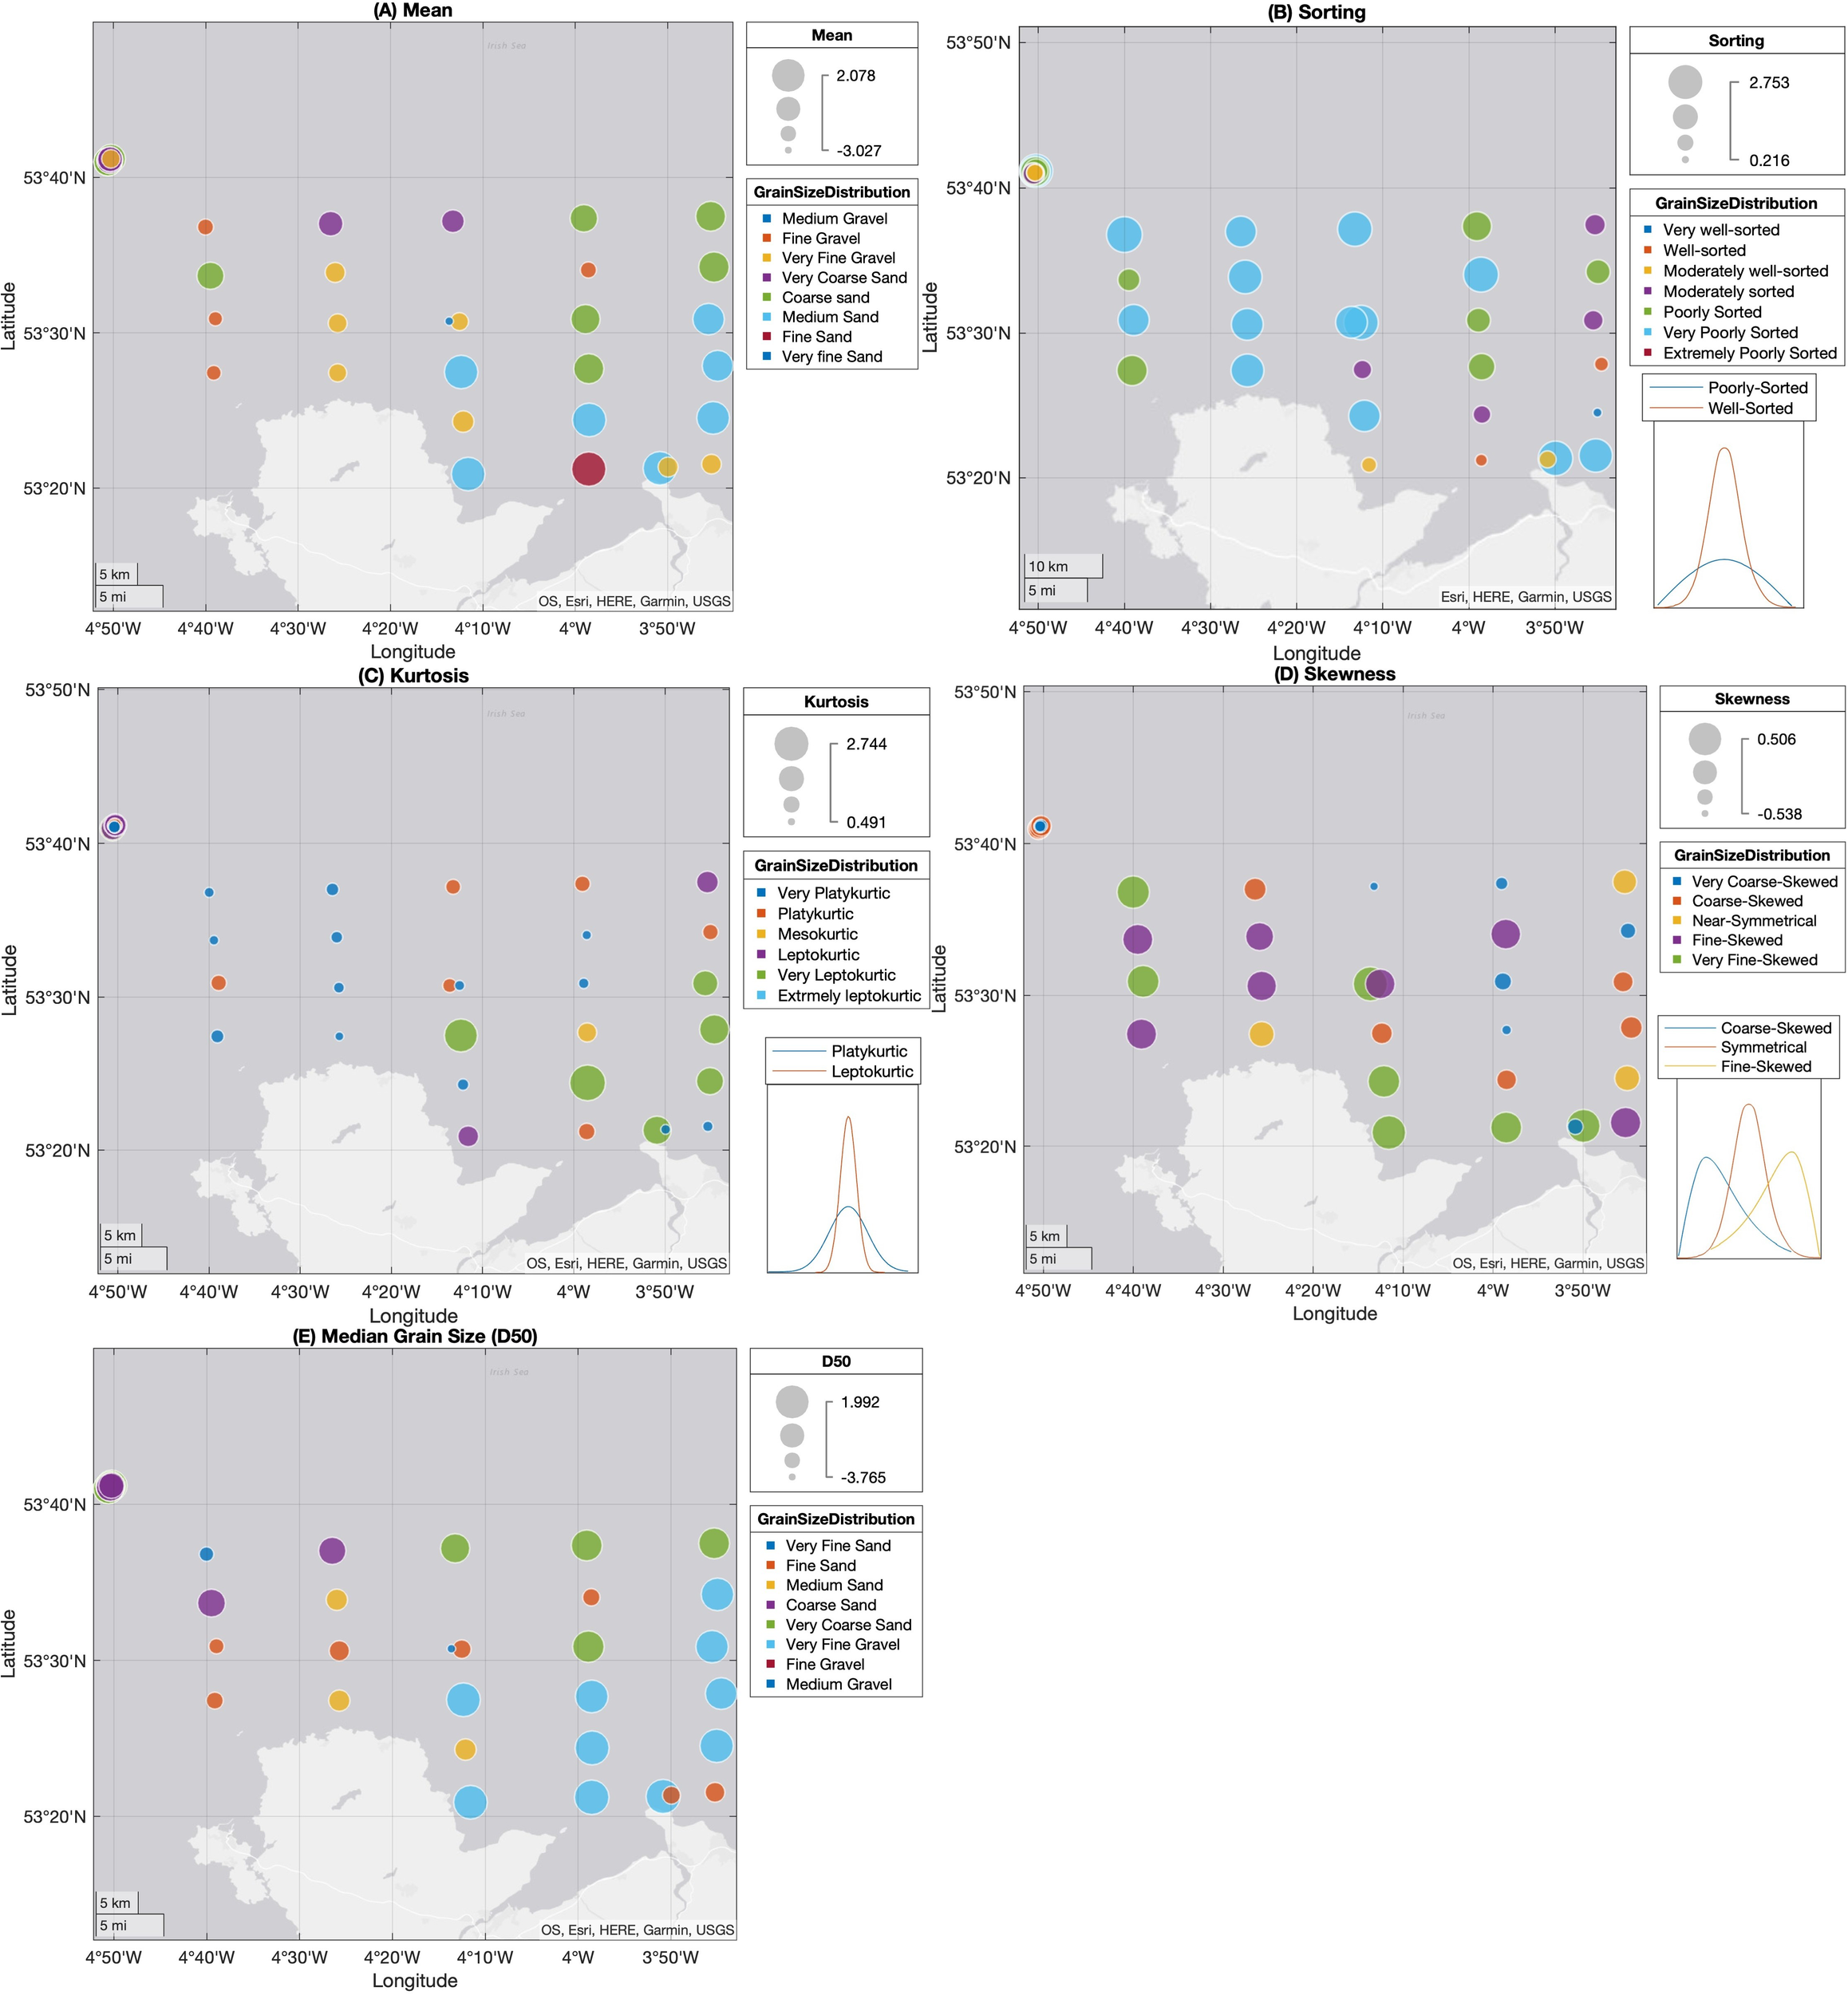
Distribution of (A) Mean, (B) Sorting, (C) Kurtosis, (D) Skewness, and (E) Median grain size across the study area.
The result of sediment analysis in terms of Mode (Unimodal, Bimodal, Trimodal, Polymodal) are given in Table 2 and Figure 4. Most samples are either bimodal (i.e. the majority of samples contain both fine and coarse sediments) or polymodal; consequently this could be considered the reason behind the high percentage of poorly-sorted (39% of samples) grain-size distributions.
Figure 4
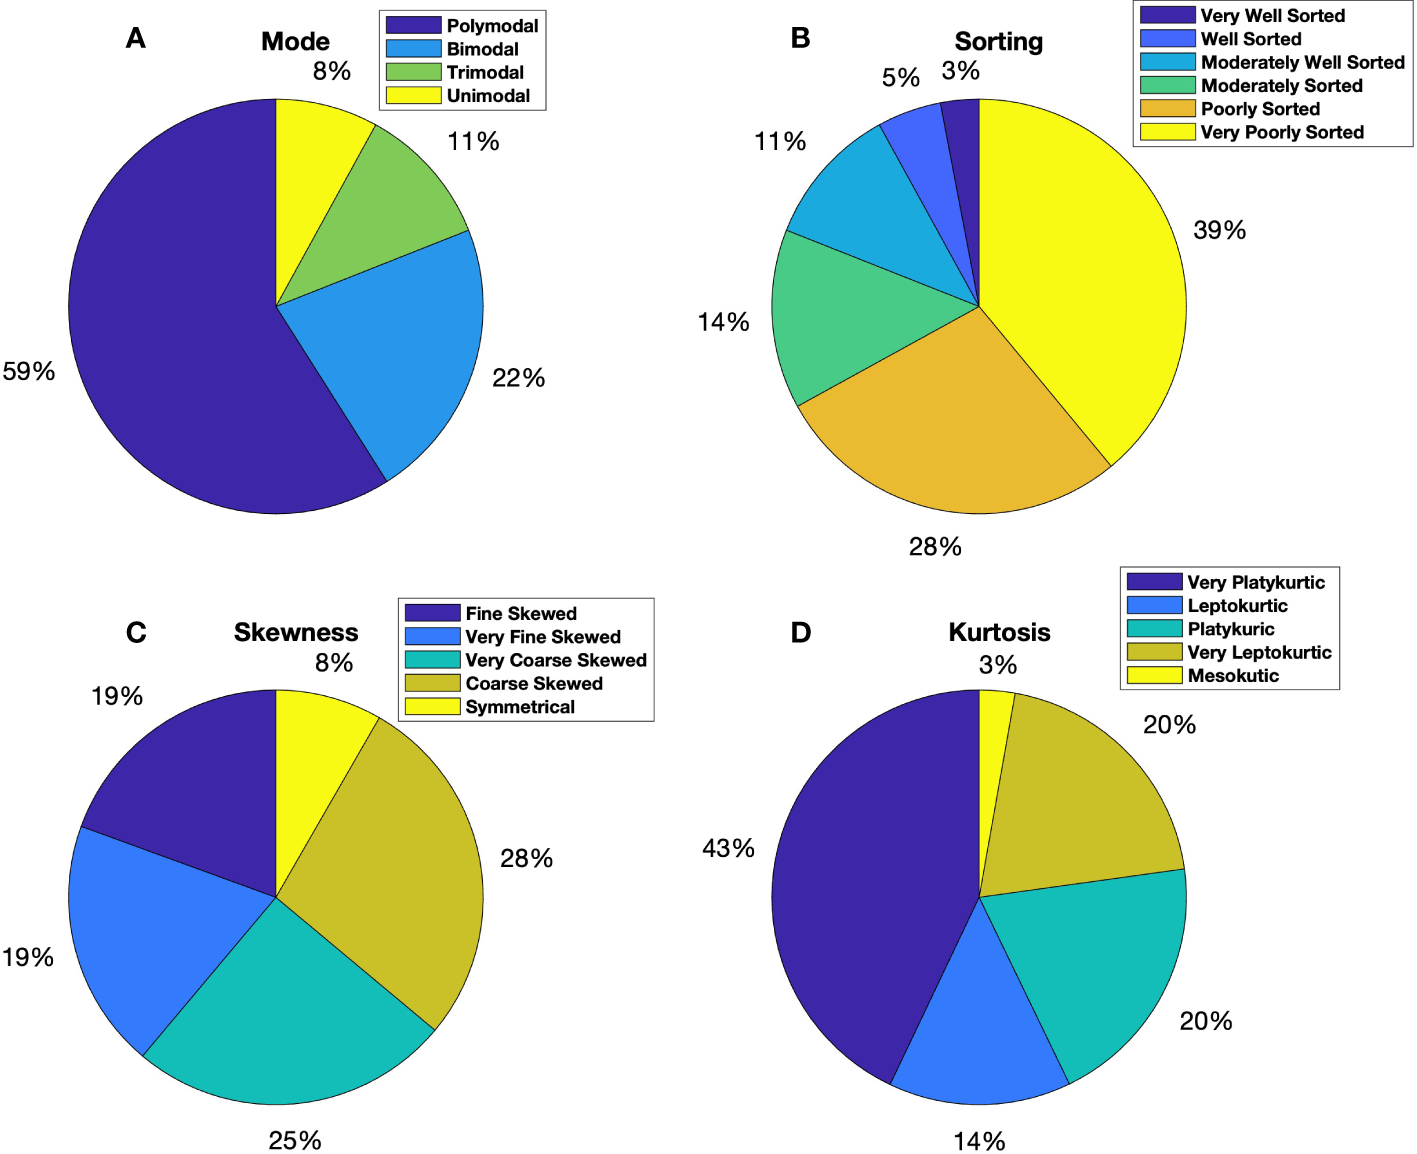
The percentage of Grain-Size (A) Mode, (B) Sorting, (C) Skewness and (D) Kurtosis across the study area.
An important parameter that should be considered in terms of sediment properties is sorting since, for example, it is difficult to calculate the median grain size for a mixed (poorly sorted) sample of sediment (Folk and Ward, 1957). As can be seen in Table 2 and Figure 4, sorting of each sediment is analyzed and described based on Table 1. Approximately 40% of the samples are very poorly sorted, particularly in the Central-to-Western part of the study area (Figure 3B). The seabed sediments in the Eastern region of the domain are generally moderately to very well sorted, with the exception of two stations in the Southeast (samples 1 and 2) being very poorly sorted. The samples at the most offshore locations (samples 29 to 36) vary from very poorly sorted to moderately well sorted.
Figure 3C indicated that the Northen section (i.e. offshore) the nearshore stations off the North coast of Anglesey are generally platykurtic (i.e. low kurtosis, indicating less kurtosis than normal distribution (less than 3 or negative excess values )). The Southeastern section, towards Colwyn Bay, is more mixed in terms of kurtosis, although 50% of these samples are classified as very leptokurtic. The offshore samples () vary from very leptokurtic (distribution with high kurtosis (numerous outliers)) to very platikurtic (distribution with low kurtosis (infrequent outliers)), and can both impact on normal distribution. In Figure 5, detailed grain size distributions from two contrasting locations were illustrated.
Figure 5
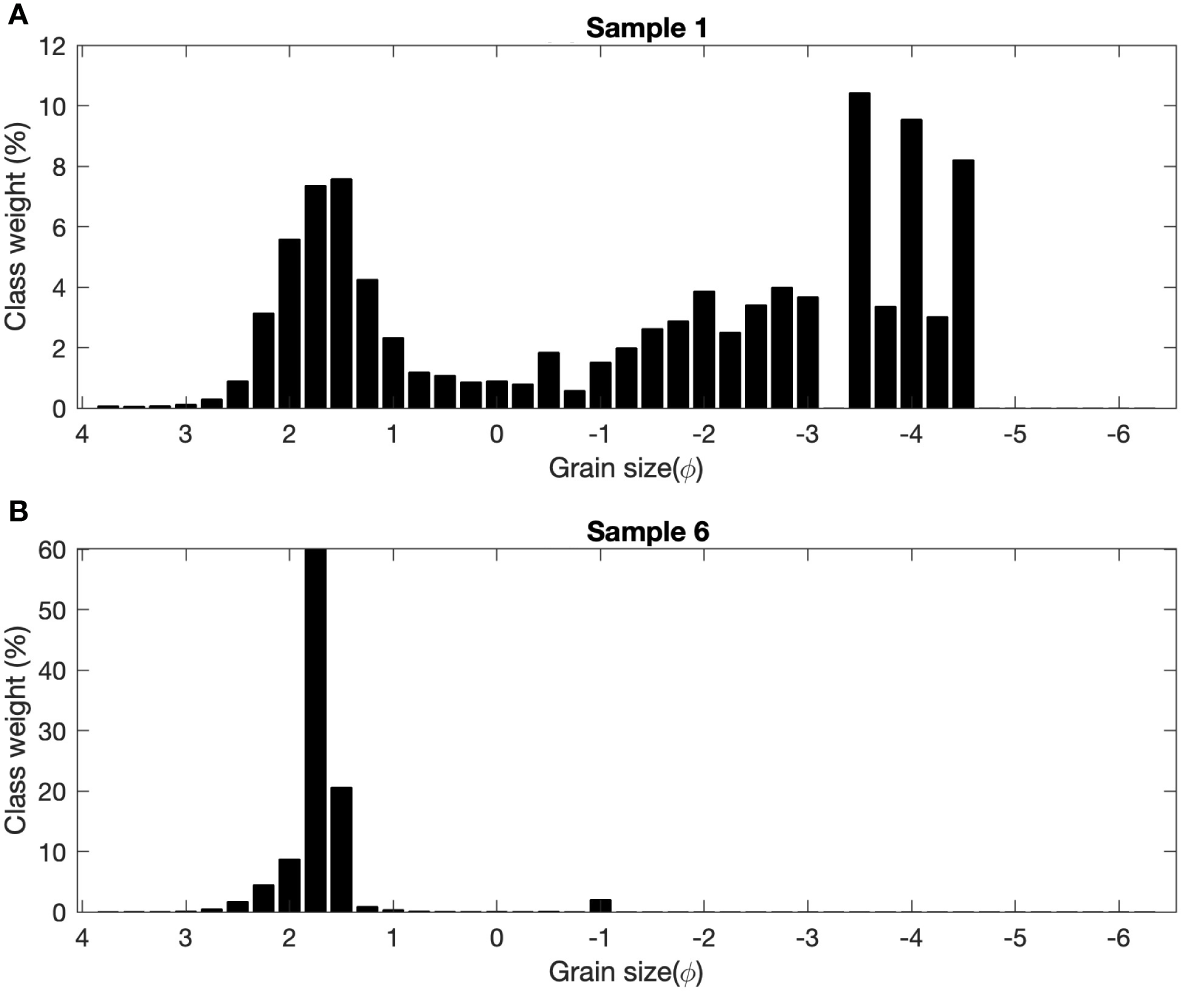
Typical sediment grain size distributions shown for two contrasting sites. (A) Sample 1 is Sandy Gravel, Polymodal, Very Poorly Sorted, Fine Skewed, Very Platykurtic, and D50 = -2.127 . (B) Sample 6 is Slightly Gravelly Sand, Unimodal, Very Well Sorted, Symmetrical, very Leptokurtic, and D50 = 1.598 .
Skewness is one of the most sensitive sediment properties, and deposition conditions have the greatest impact on skewness. Negative skewness indicates that the medium in which the deposit is being made is subject to turbulent energy conditions, and positive skewness indicates that the sedimentation environment is relatively calm and steady (Awasthi, 1970). As can be seen in Figure 3D, near-shore stations are mostly characterized by very fine to fine skewness (positive skewness). Further offshore and towards the eastern region of the study area the samples are mostly on the opposite side of the spectrum, i.e. very coarse and coarse skewed. This is relevant, as the proposed wind farms (Figure 1) would be located in a relatively energetic environment. Regarding the Northwest cluster of stations (), they also present a coarse to very coarse skewness.
4.2 Comparison of sediment properties with environmental variables
Significant wave height () and mean wave period () were extracted from a SWAN spectral wave model of the study region (Roche et al., 2016). The model output frequency is 3-hourly throughout 2014. Figure 6 shows the variability of and over a year across all of the sample sites. We used these environmental properties to find correlations of waves with sediment properties at the sample locations.
Figure 6
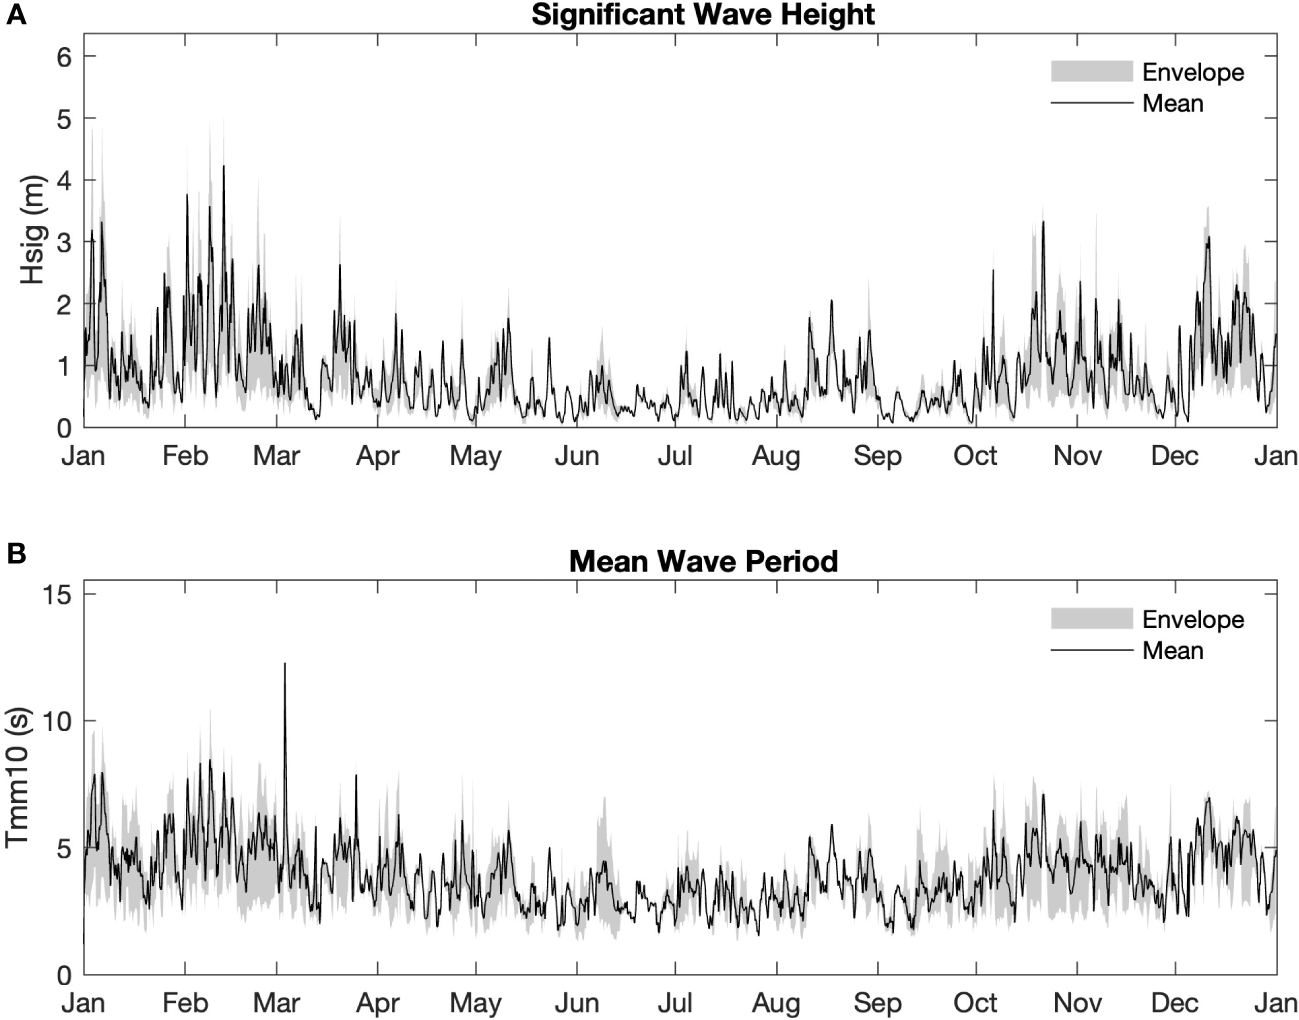
Simulated mean, minimum and maximum (A) significant wave height () and (B) mean wave period () across all sample locations during 2014.
The tidal range across the region was extracted from the TELEMAC model (Robins et al., 2019). As the patterns are similar across the sites, we only plot the sites that experience the largest and smallest tidal range (Figure 7). In general, the tidal range was 8 m (spring), 4 m (neap) and 3.3 m (mean) across the sites. In addition, the tidal elevations are in-phase with one another across the sampling sites, indicative of the standing wave system that is known to occur in the area (Neill et al., 2018). Peak current speed at each location was also extracted from the TELEMAC model, in addition to mean water depths (from the model bathymetry).
Figure 7
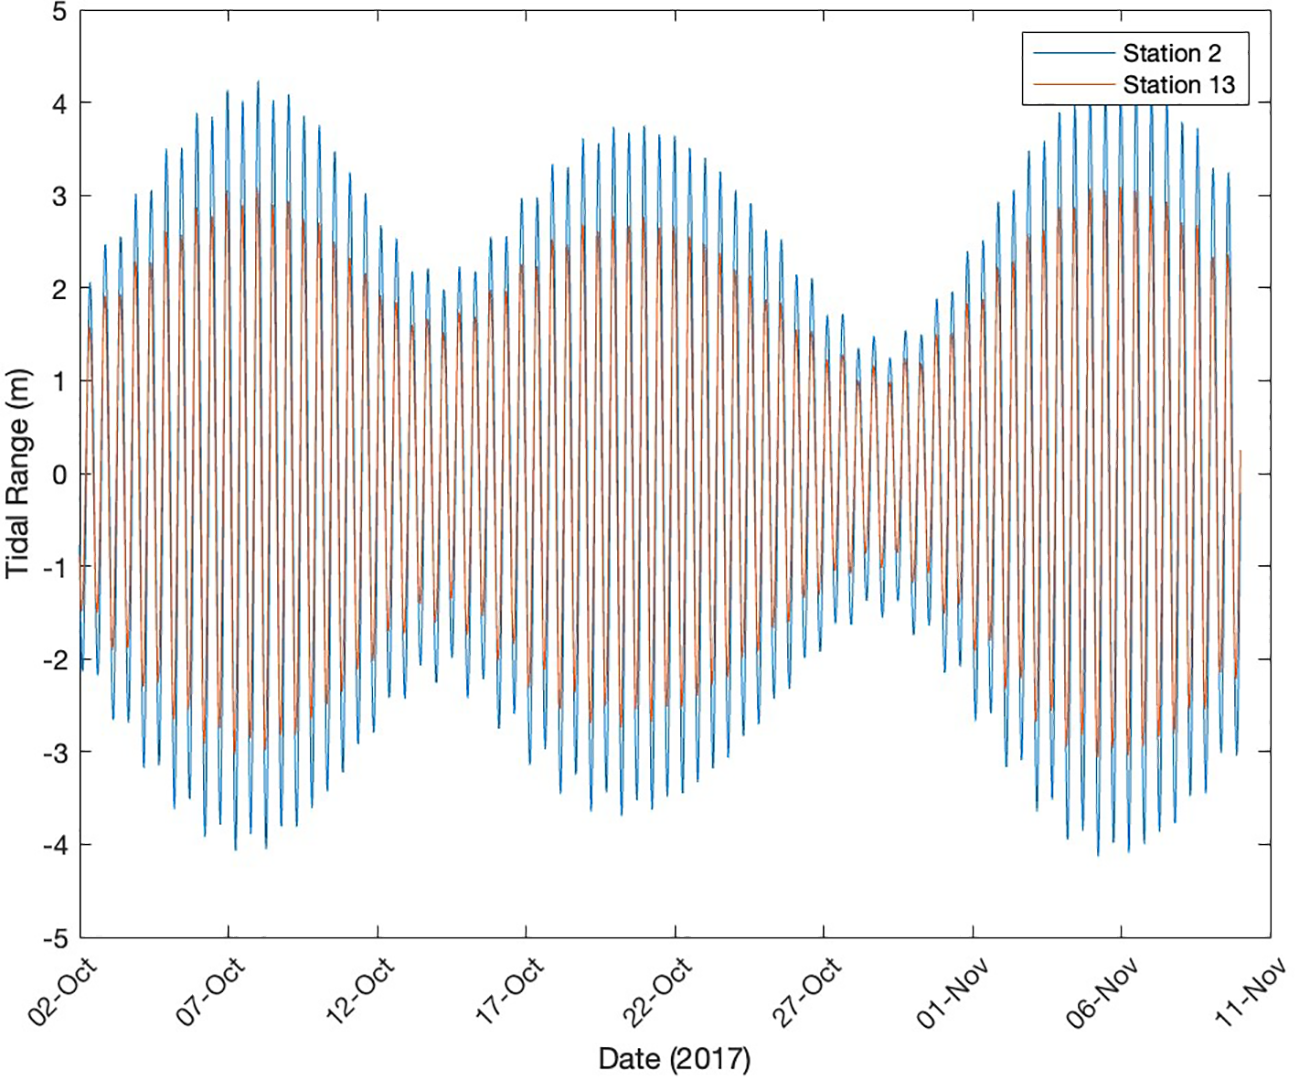
Time series of simulated tidal elevations for two contrasting sites across the study region, i.e. the locations that exhibited the highest (sample 2) and lowest (sample 13) tidal range.
The available environmental variables (mean water depth, peak current speed, spring tidal range, significant wave height, and bed shear stress) are plotted against the primary sediment properties (Median Grain Size, Mean, Sorting, Skewness, Kurtosis) on Figures 8–11. The value and p-values were calculated for each relationship.
Figure 8
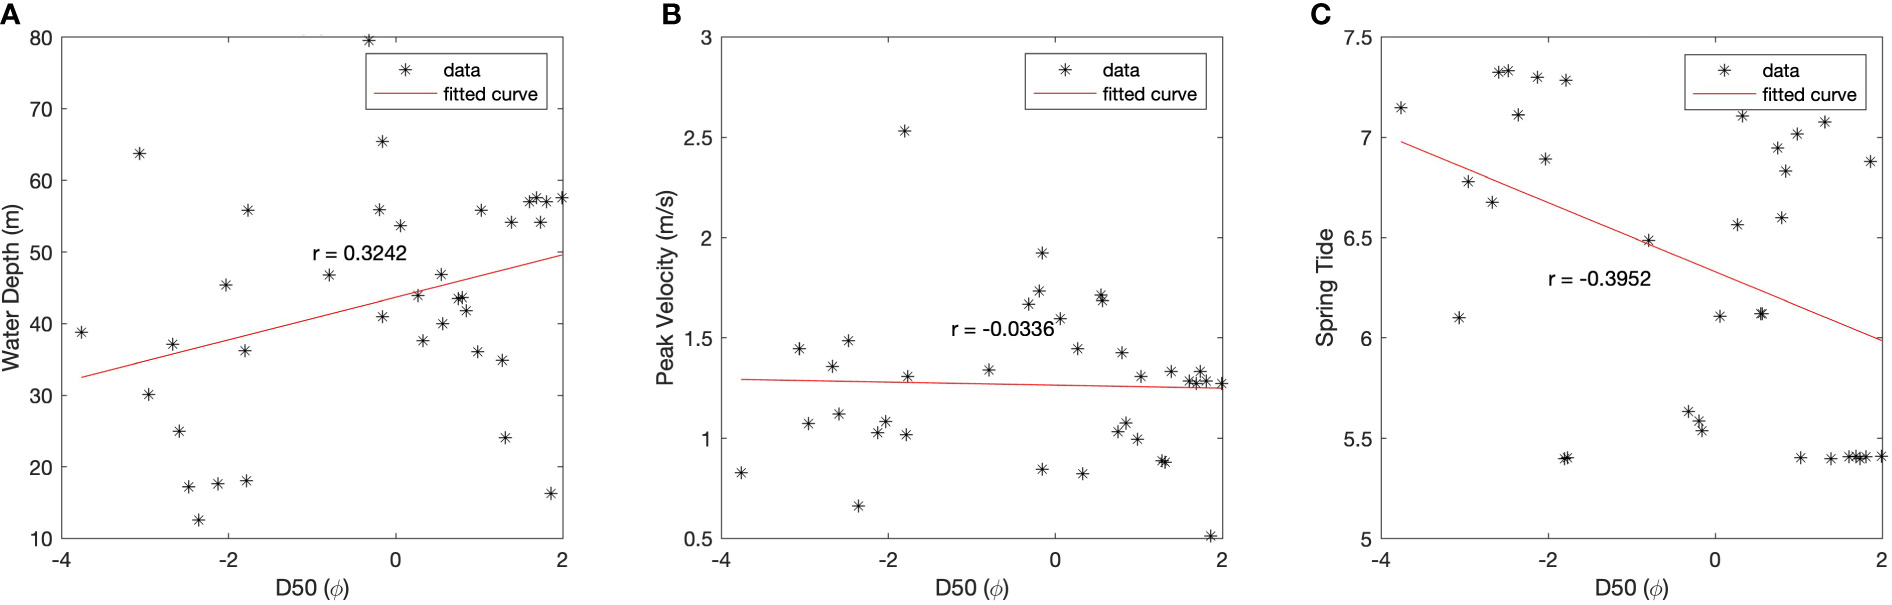
Correlation between and environmental variables: (A) water depth, (B) peak tidal velocity (C) spring tide.
Figure 9
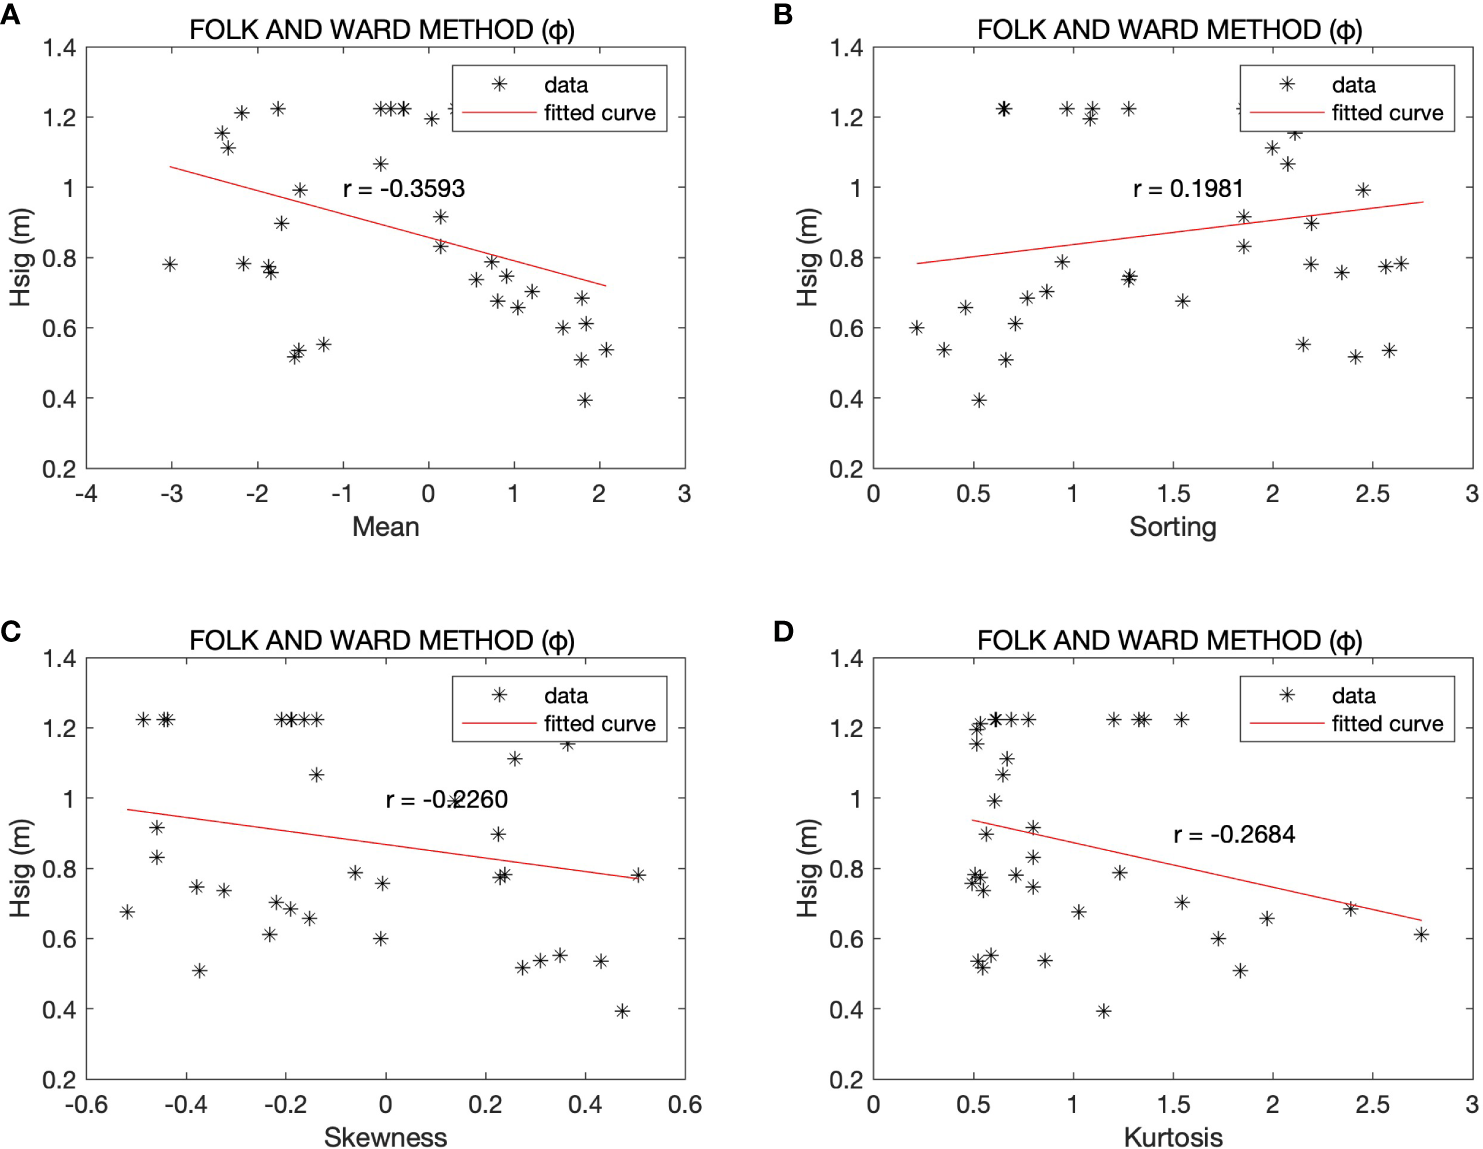
Correlation between and sediment properties: (A) Mean, (B) Sorting, (C) Skewness, (D) Kurtosis of seabed sediment samples.
Figure 10
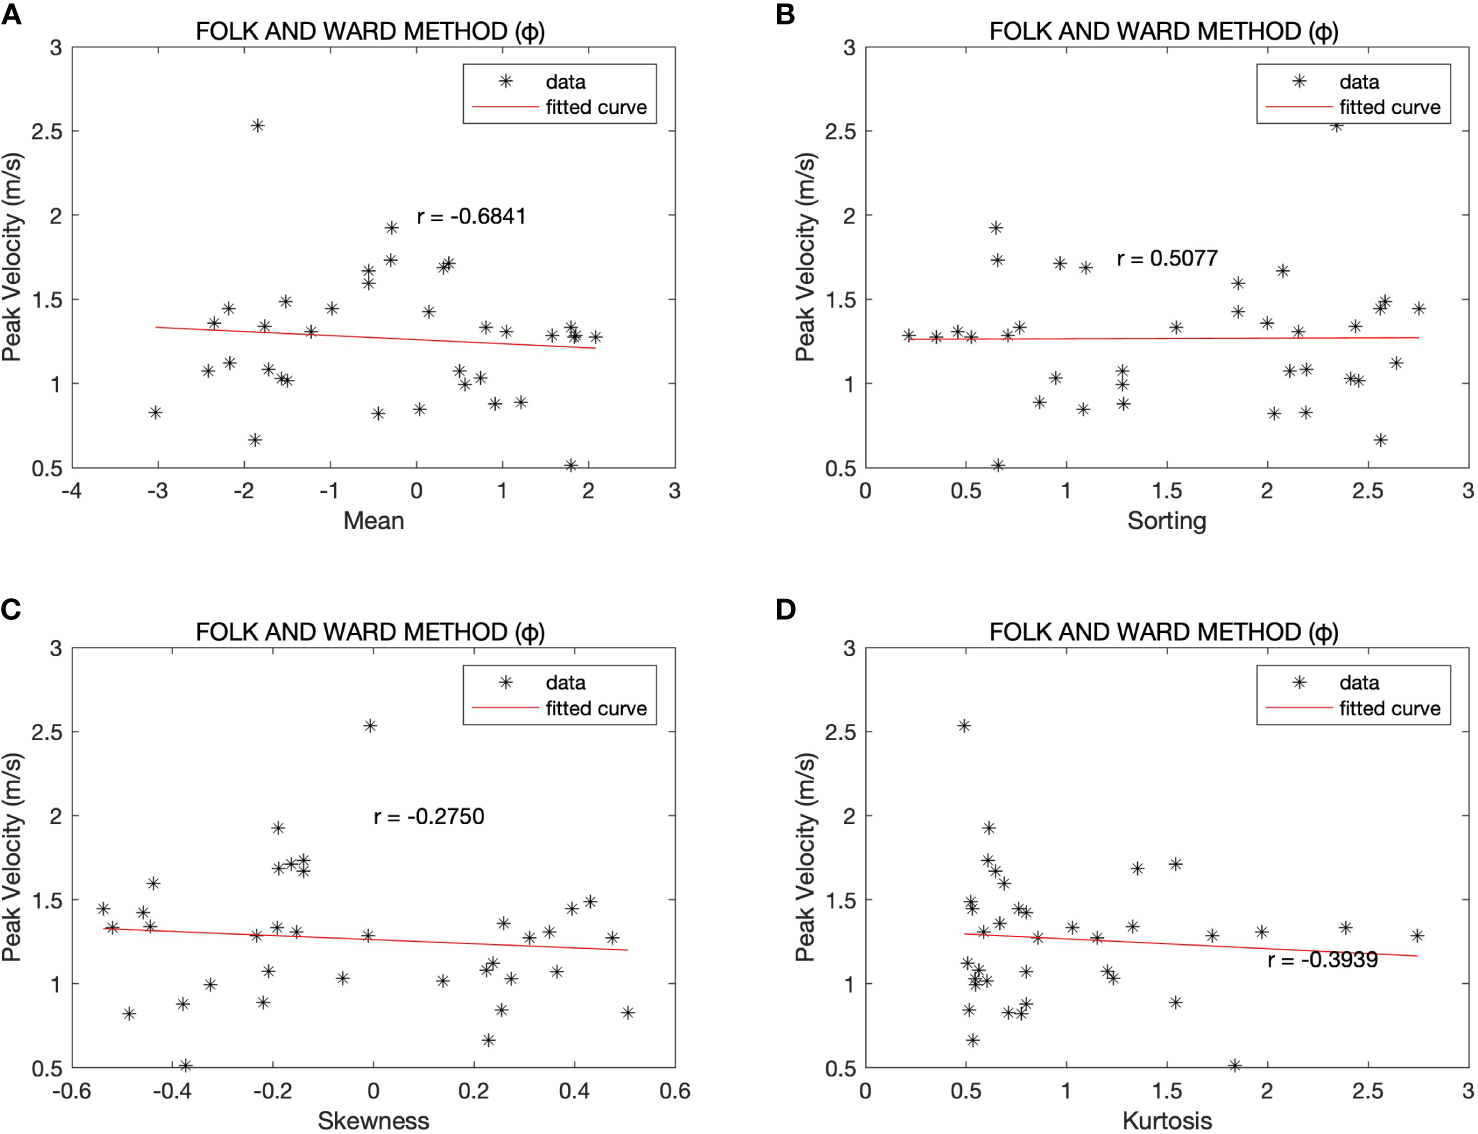
Correlation between Peak Velocity and sediment properties: (A) Mean, (B) Sorting, (C) Skewness, (D) Kurtosis.
Figure 11
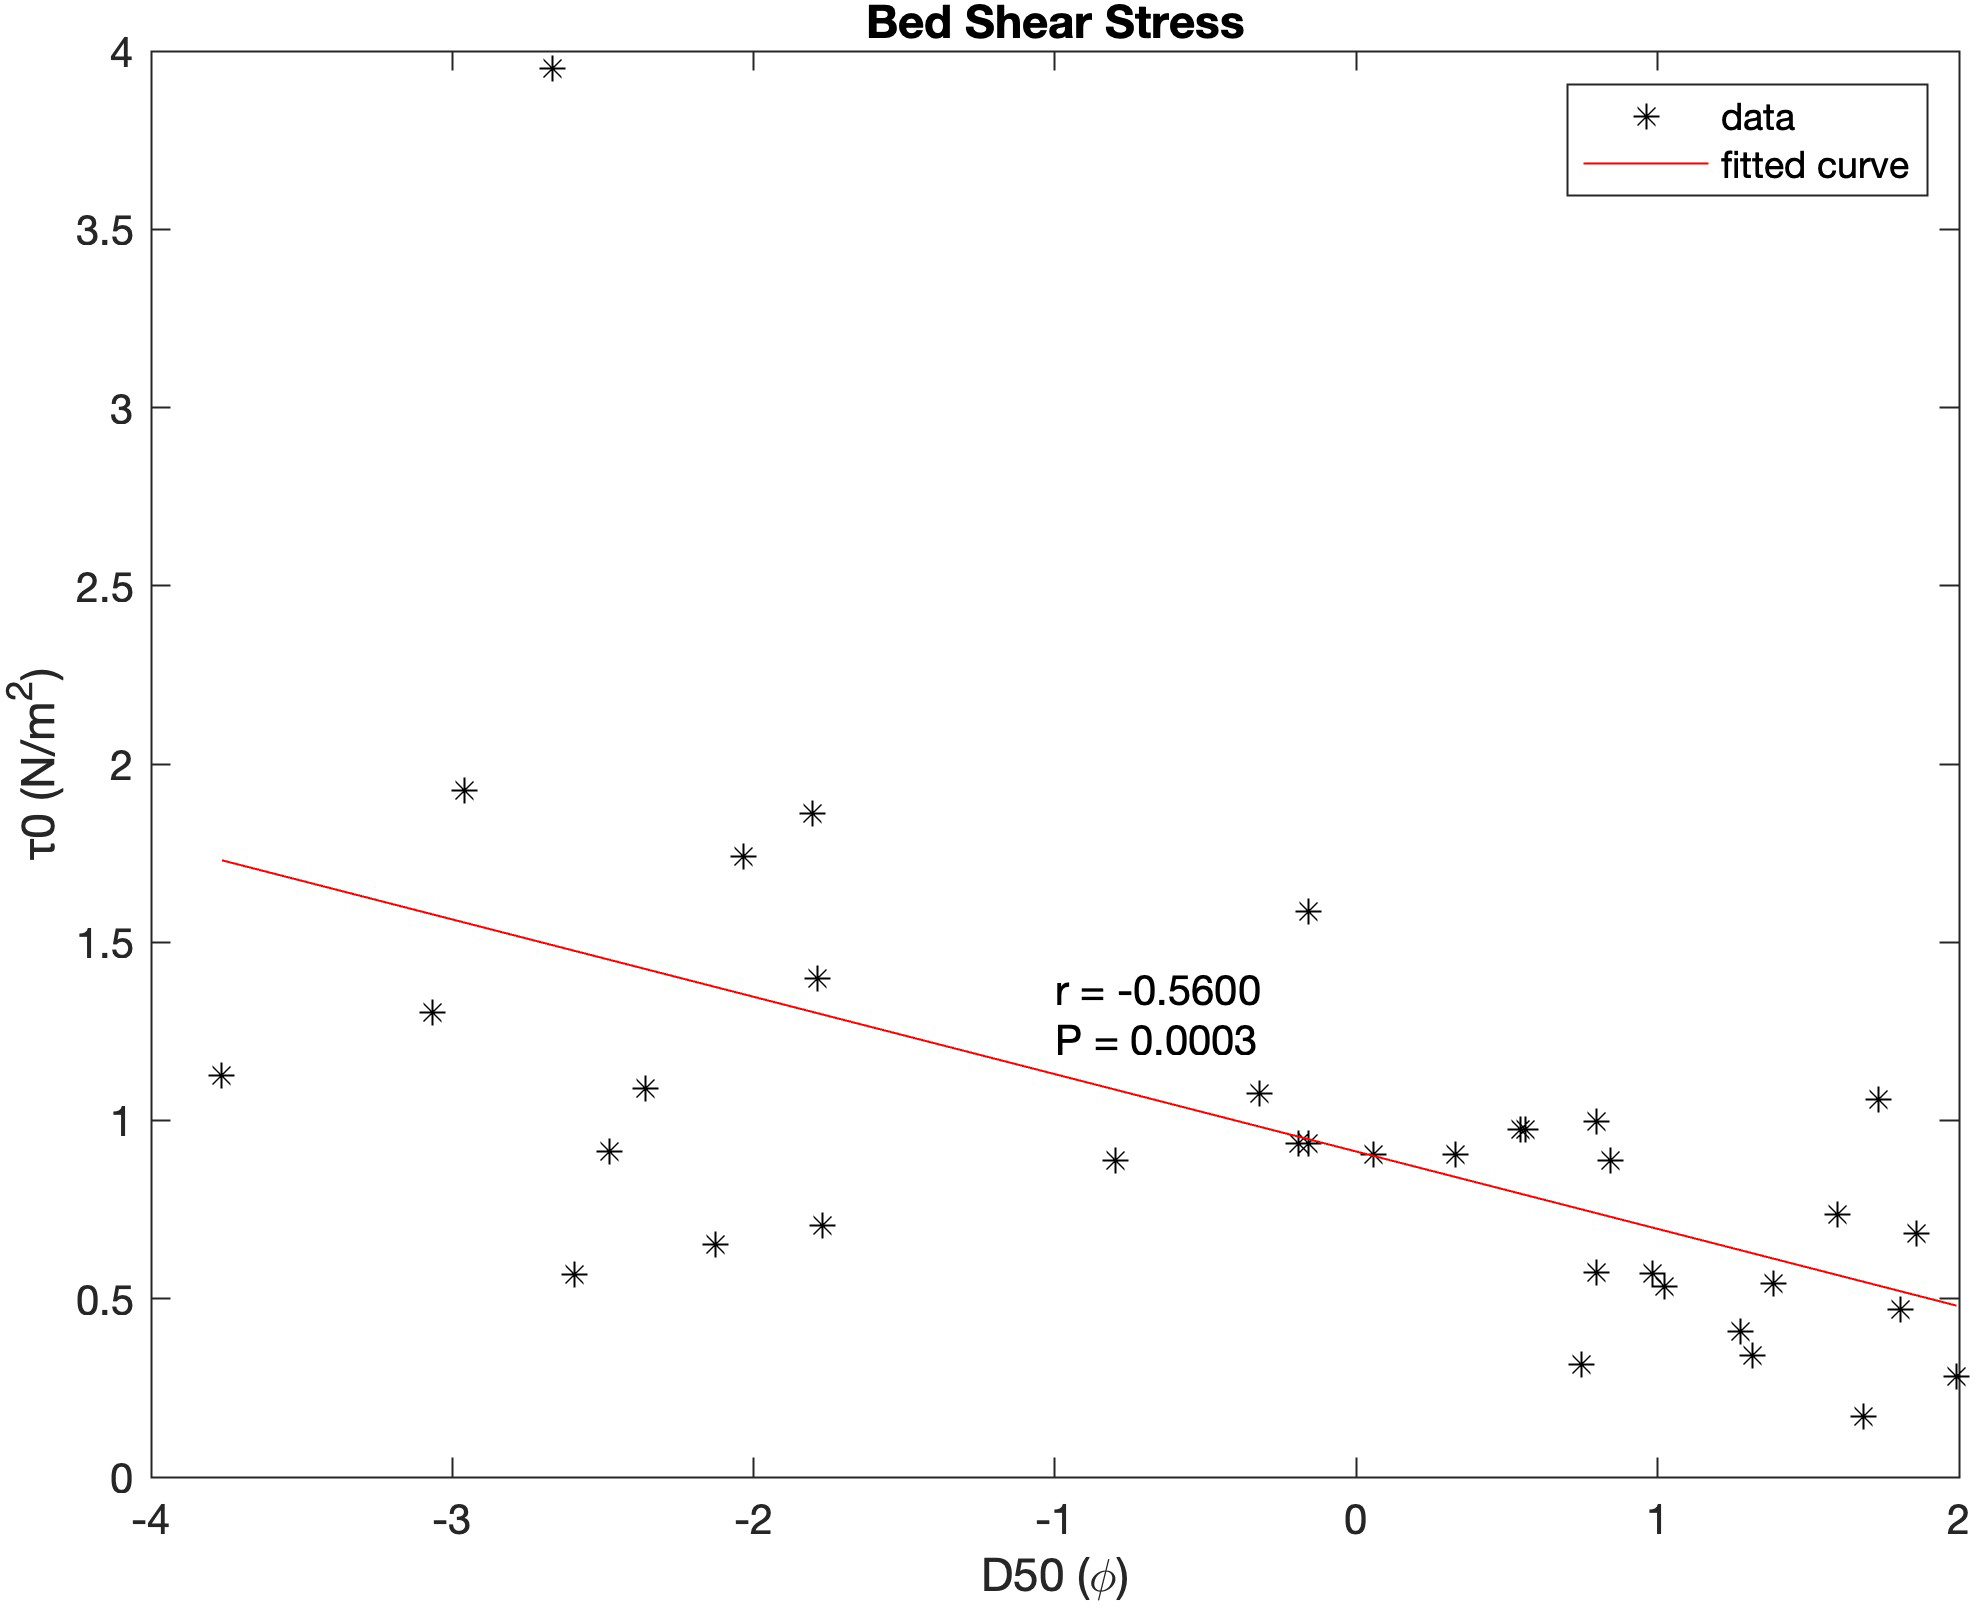
The correlation of and bed shear stress.
Based on Figure 8, water depth and median grain size have a weak negative correlation. Spring tide and grain size have weak positive correlation. Peak velocity and grain size have moderate negative correlation, in addition the p-value of each variable is calculated. Spring tide and grain size positive correlation (negligible correlation). Also, the regression of the D50 and environmental variables are calculated, and is 51, which means that environmental parameters as an independent variable can impact on median grain size as a dependent variable 51. Furthermore, the p-value for determining the relationship between mentioned variable is calculated (Figure 12), and the result shows that water depth and peak velocity have relationship with D50.
Figure 12
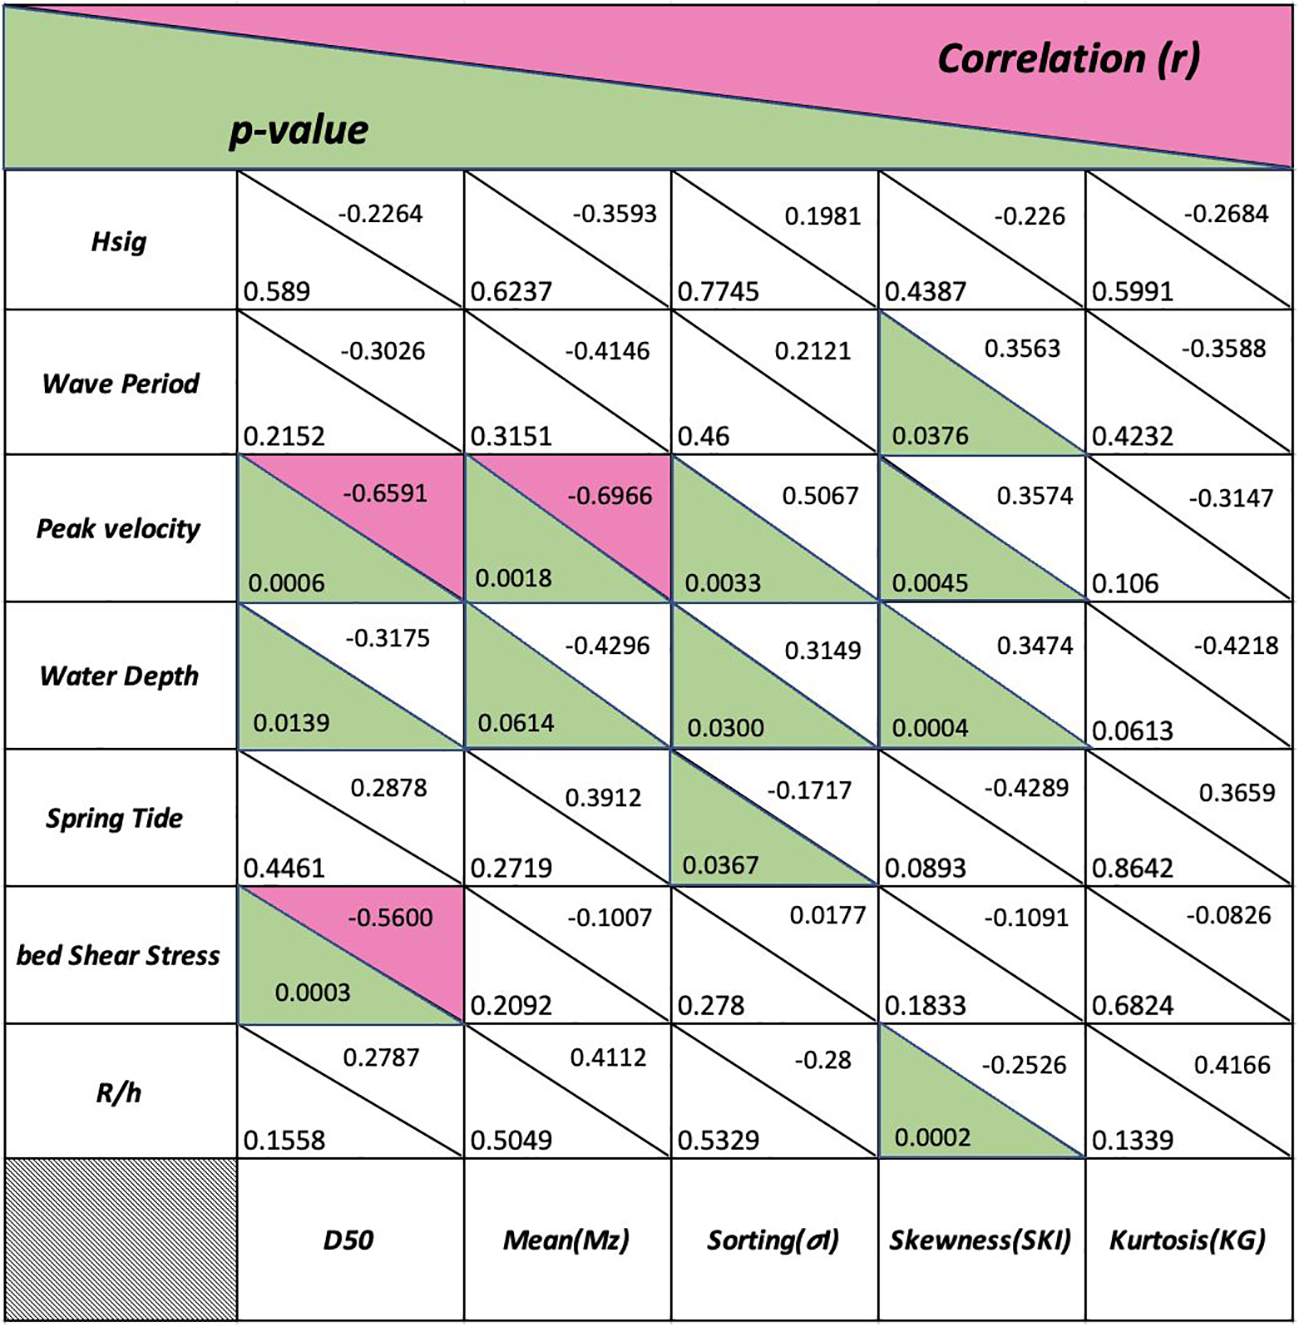
The result of Correlation and Regression analysis (green color indicates p-value , and pink shows moderate or strong correlation ()). is the ratio of spring tidal range () to water depth ().
Figure 9 indicated the correlation between the sediment properties and environmental variable. and p-values were calculated for each sediment properties and environmental variable. As can be seen, the trends and relationship were shown on the graph, and all the correlation and relationship were presented on Figure 12.
Also, the bed shear stress () at each location was calculated using
where is the density of the ocean water (taken as 1027 kg/m3), and is shear stress velocity, calculated using
where is the drag coefficient (), and is the depth-averaged current speed.
The correlation between median grain size and bed shear stress is moderate negative, with a p-value indicating a strong relationship Figure 11. In addition, some samples, for example, sample 13 which in terms of textural can be considered fine gravel has the highest bed shear stress because of high velocity in this region, consequently seabed sediment types can correlate to the bed shear stress (Ward et al., 2015).
Figures 3A–D indicated the distribution of mean, sorting, kurtosis, and skewness across the study area. As can be seen the majority of samples in the eastern part of the study area, are mostly very fine gravel and in the Western part fine coarse sand are more. Moreover, Sample 17 (-3.765 ) has the largest median grain size and sample 4 has the smallest median grain size (1.992 ). The results of linear correlation and regression between environmental variables and sediment properties are shown in Figure 12. When p-value is (), it should be considered a statistical significance, in addition the Pearson correlation coefficient () of sediment properties and environmental climate were calculated.
D50 has strong relationship with water depth and peak velocity (p-value), and is 59 which shows how much the environmental variables can impact on D50 (Figure 12); consequently, 59 of changes in D50 can be driven by environmental parameters. It is also worth noting that D50 has moderate negative correlation with peak velocity. The result of p-value indicated that peak velocity and water depth have strong relationship with mean, and is 58%. It shows that independent variables (environmental parameters), 58% can impact on dependent variable (mean). Furthermore, mean and peak velocity have moderate negative correlation. Based on p-value analysis it seems that sorting has strong relationship with peak velocity, water depth, and spring tide.
5 Discussion
The results indicate that the seabed in the eastern part of the study area, a region with much marine renewable energy activity, is comprised mostly of sandy sediments (fine, medium, and coarse sand), whereas the Western region is generally characterized by very fine gravel, and fine gravel. Further, the sediments in the region are generally polymodal, and very poorly sorted. The result of Pearson correlation coefficient indicated that median grain size (D50) and the tidal range have a weak relationship. Velocity can impact on the D50, and they have negative relationship, noting that D50 is in phi values (i.e. -log2 of the grain size in mm). Peak velocity also has an impact on the mean and sorting of the seabed sediments. Bed shear stress, which is a fundamental factor in estimating sediment transport, has moderate negative relationship with D50, with 31. However, D50 has negligible correlation with tidal range. Significant wave height has negligible correlation with all the sediment properties (D50, Mean, Sorting, Kurtosis, Skewness), so it seems that seabed sediment properties in the study area are dominated by tidal currents. In addition, peak velocity has a moderate negative correlation with mean, and a positive moderate correlation with sorting and D50, so velocity can impact on uniformity of grain size and median grain size. Also, velocity has a negligible correlation with skewness, and weak negative correlation with kurtosis. Overall, it seems that peak current speed and water depth have the strongest relationship among all the environmental parameters with sediment properties, consistent with previous studies (e.g. (Ward et al., 2015)).
The marine renewable energy industry is currently exploring coastal regions that are in close proximity to electricity grids for development (Neill et al., 2014). Knowledge of seabed sediment characteristics at a range of sites and across a range of environments that are suitable for a variety of offshore renewable technologies could lead to pairing each location with the most appropriate renewable energy technology. Further, it could be possible to co-locate wind and wave energy (or other renewable energy combinations) at a single location to share infrastructure costs (e.g. cabling) and minimize the variability in power output (Stoutenburg and Jacobson, 2010).
The influence of marine energy converters on hydrodynamic and sediment dynamics is not well known, and primarily theoretical, since collecting samples in these dynamic marine environments is difficult (Auguste et al., 2019), and it is challenging to assess sediment properties pre- and post-construction. To select a suitable site for the installation and operation of a marine energy technology, it will be necessary to understand the hydrography of the area (Bozgeyik, 2019). In most cases, marine renewable energy installations, with the exception of offshore wind, are comprised of a single demonstration device, but the industry is now moving towards demonstration and commercial arrays of at least ten devices, with the final goal of installing large arrays that exceed 100 devices (Shields et al., 2011).
The remainder of the discussion explores various ocean renewable energy technologies and their impact on the hydrodynamic and sediment dynamics, within the context of the analysis of seabed sediments.
5.1 Offshore wind turbines
The selection of an appropriate site for offshore wind farm is a complex process that takes into consideration many factors such as technical/mechanical, environmental, socioeconomic, as well as national legislation and regulations. However, some significant criteria for desirable regions are water depth, wind-energy potential (Vasileiou et al., 2017), and distance-to-shore (Díaz and Soares, 2020).
Water depth has a fundamental role in the installation formula. Present technology enables marine applications to be developed up to a maximum depth of around 60 m (Adelaja et al., 2012; Chaouachi et al., 2017). The water depths at our sampling locations varied from m, which demonstrates their suitability for various wind turbines technologies.
In the offshore wind industry, there are two primary types of foundations: floating foundations and bottom fixed foundations. It is acceptable for bottom fixed foundations (Figure 13A) to be installed in water depths of up to 60 m. Nevertheless, when water depths exceed 40 m, these structures experience increased hydrodynamic loads, leading to increased cost (Leontaris et al., 2016). The floating concept has been proposed as a solution to this problem (Hernandez C et al., 2021). There are five various types of bottom fixed foundation (Gravity, Monopile, Tripod, Jacket, Tripile foundation) (Hernandez C et al., 2021). Monopiles are the most frequently installed type (81), followed by jackets (8) (Selot et al., 2019).
Figure 13
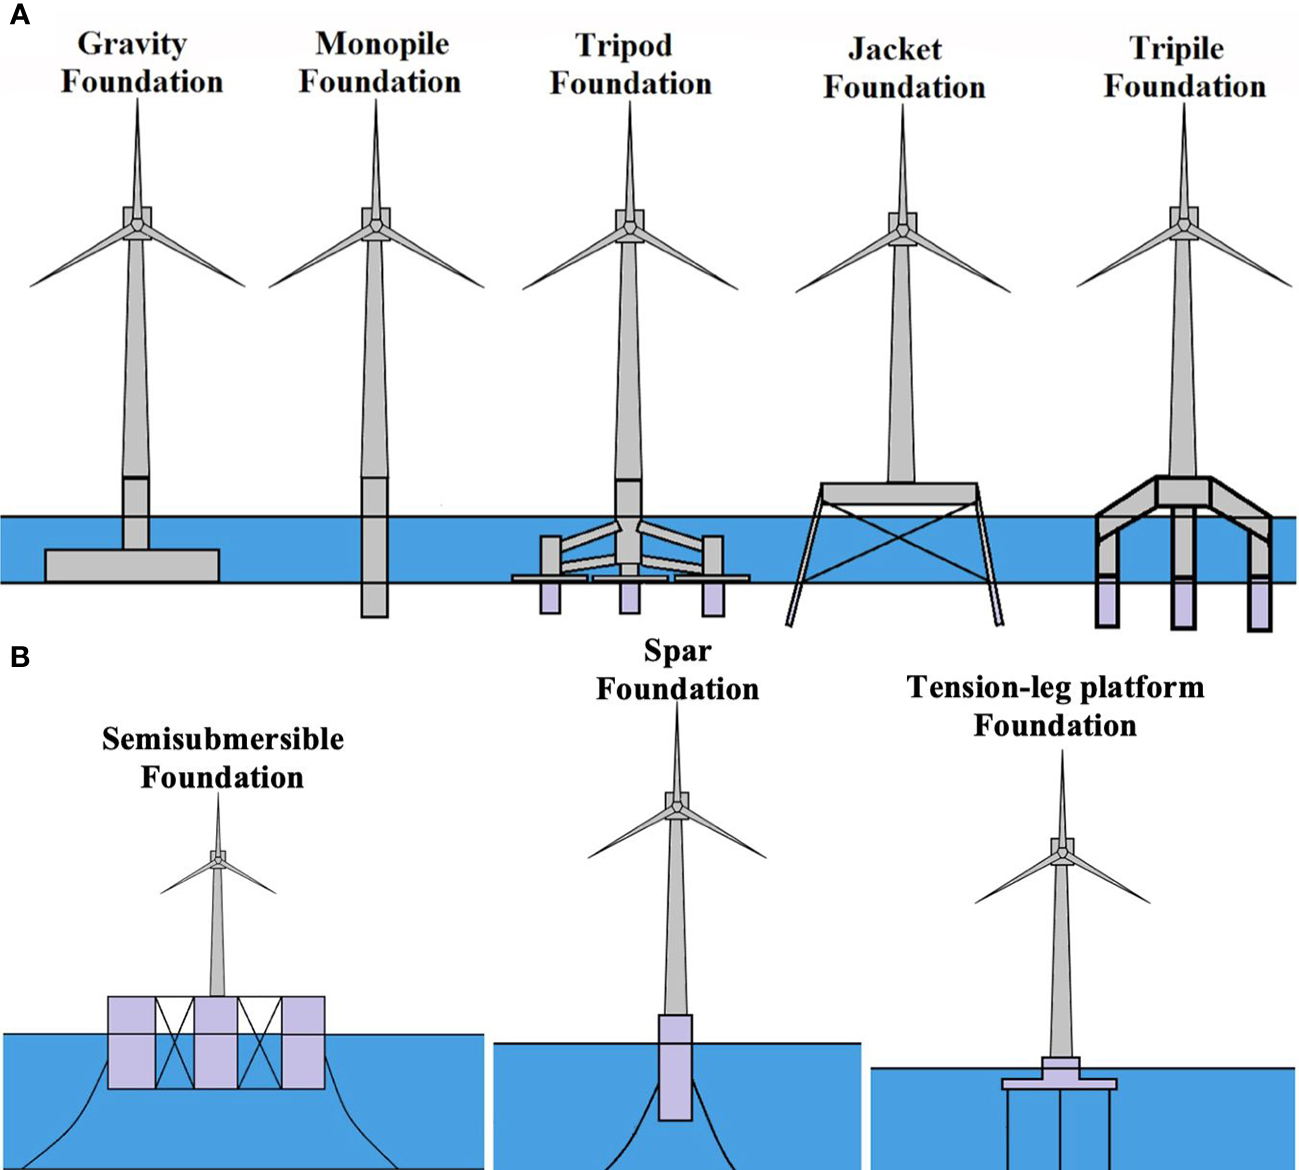
(A) Various types of bottom fixed foundation of offshore wind turbines, (B) Offshore wind turbine floating foundations (Hernandez C et al., 2021).
There are three types of floating foundation (Figure 13B): semisubmersible foundation, spar foundation, and tension-leg platform (TLP) foundation. Note that floating foundations have only been deployed in a small number of projects (Selot et al., 2019).
The presence of offshore wind turbines presents issues relating to sediment properties. One of the most significant challenges is scouring around the piles of the wind turbines due to interaction with waves and currents (Aminoroayaie Yamini et al., 2018). Waves induce scour of the sediment around the turbine’s pile and make it unstable (Aminoroayaie Yamini et al., 2018). Based on laboratory examination it has been observed that maximum scour depth value was reduced by roughly 41 when the bed particle diameter was increased by 50; nevertheless when the particle diameter decreases by 50, the maximum scour depth value increases (Aminoroayaie Yamini et al., 2018).
Wakes are considered the other problem of the presence of offshore wind foundations (Vanhellemont and Ruddick, 2014).There can be a wide variety of wake effects depending on the foundation type, due to differences in the diameters of foundation structures and the volumes of impermeable structures in the water column and on the seafloor (Zhang et al., 2020). In contrast to monopile foundations, tripod, tripile, and jack-up foundations are estimated to have reduced wake effects due to smaller diameters (Zhang et al., 2020). However, by taking advantage of jacket foundations, the wake effect could be minimized because of a smaller volume of structure in the water column as well as at floating foundations, where there are weaker currents near the seabed (Zhang et al., 2020). Installation of offshore foundations are primarily responsible for the release of suspended sediment (Zhang et al., 2020), sediment transport and downstream sedimentation (Vanhellemont and Ruddick, 2014). During installation, gravity foundations requiring seabed preparation (e.g. dredging) and monopiles that employ reverse circular drilling will have the greatest impact on sediment (Zhang et al., 2020). Consequently, suspended sediments concentrations will increase in the wake of turbine monopiles within an offshore wind farm (Vanhellemont and Ruddick, 2014).
5.2 Tidal energy
Tidal energy conversion, either by tidal stream (kinetic energy) or tidal range (potential energy) will impact sediment dynamics over various temporal and spatial scales (Shields et al., 2011; Ahmadian et al., 2012).
5.2.1 Tidal stream devices
Tidal Energy Converters (TEC) can be installed in locations with ideal flow conditions (i.e., high velocity with low turbulence). They are normally installed close to coastlines, in straits and near headlands, where topography and bathymetry will enhance flow speeds (Shields et al., 2011). The current generation of Tidal Stream Energy devices require flow speeds in excess of 2.5 m/s and water depths between 25 and 50 m (Lewis et al., 2019). Moreover, the seabed at most tidal energy sites will be characterized by medium to coarse sands and gravels, and sediment concentrations are not likely to impose significant loadings on turbine blades (Neill et al., 2017). Tidal stream devices can be installed individually or in arrays. An individual tidal energy converter (TEC) consists of a support structure and a rotor, generally in the horizontal axis configuration. It is also worth noting that a wake is generated by both the rotor and the support structure (Neill and Elliott, 2004); consequently sediment dynamics are likely to be altered by turbine operation. Firstly, because of strong tidal flows, localized scouring will occur (Den Boon et al., 2004), and to avoid foundation erosion, developers will have to consider scour protection, such as rock armor, when installing turbines in regions with sufficient sources of mobile sediment. Secondly, wakes cause sediments to be winnowed (Wolanski et al., 1984), in this case, a poorly sorted sediment is dispersed (enhance sorting), consequently, the coarser fraction remains (increase the grain size). It is possible that well-sorted sediment could develop in the wake zone, contributing to further erosion issues (Neill et al., 2017). Moreover, based on the analysis presented here, sorting can be affected by current speed, water depth, and tidal range (Figure 12). Velocity and sorting have weak positive correlation, and with increasing velocity, sediments would become more well-sorted. In contrast, velocity and mean have negative moderate correlation which means with increasing velocity the mean (grain size) is reduced. Consequently, in the presence of a tidal stream device, the risk of erosion is higher in the wake – due to reduced velocity the mean (the average size) of sediments increase, and wake effect can make it intensify (towards well-sorted). Overall, it has been found that even though single turbines will have local impacts (less than 1 km) (Neill et al., 2009; Mekhilef et al., 2012) the development of large TEC arrays will exceed the natural variability of morphodynamic features such as offshore sand banks due to their potential near-field and far-field effects (Neill et al., 2012; Robins et al., 2014).
5.2.2 Tidal range power plants
Tidal barrages and tidal lagoons can generate considerable power when the tidal range is sufficient (Neill et al., 2017). A tidal barrage spans the entire width of a seaway or estuary (Waters and Aggidis, 2016), whereas a tidal lagoon only partly impounds a seaway (Neill et al., 2017). A Tidal range power plant would reduce the magnitude of the tidal currents and thus reduce the suspended sediment load while providing greater bed stability, encouraging the colonization of an otherwise highly suppressed ecosystem (Kirby and Shaw, 2005).As can be seen in Figure 12, based on the analysis of the sediment samples, velocity has negative correlation with median grain size and mean, and by reducing the velocity the median grain size and mean will increase. Also, sorting and velocity are positively correlated, and decreasing the velocity will lead to decreased sorting. Barrages and lagoons are also likely to increase sediment deposition in certain areas, the location and magnitude of which will depend upon specific design and the prevailing source of the sediment (Mekhilef et al., 2012). Moreover, sediments are transported outside the lagoon, and are accumulated inside the lagoon (Neill et al., 2017). In addition, counter-rotating eddies might emerge in the turbine wake because of the focusing of turbines and sluices in particular parts of the lagoon wall (Wang et al., 2009) leading to concentrated sediment resuspension and scour. Equally spacing turbines around the lagoon (although at likely increased cost) can reduce this impact (Wang et al., 2009).
6 Conclusion
Seabed sediment samples collected across one of the most energetic regions of the Irish Sea were analyzed, and the relationship with environmental characteristics assessed. Most of the sediments within the study area are medium sand, polymodal, very poorly sorted, coarse skewed, and very platykurtic. In addition, environmental parameters such as water depth and current speeds have a strong impact on median and mean grain size. Moreover, water depth, current speed, and tidal range can influence sorting. Skewness (which quantifies the asymmetry of grain size distribution) can be affected by wave period, velocity, water depth and tidal range. Because skewness is affected by a wider range of factors than the other sediment properties, it is the most sensitive statistic. Furthermore, in agreement with previous model studies, bed shear stress and median grain size are strongly related. Since marine renewable energy has received increased attention in recent years, it is essential to investigate the optimal site, foundations, and cable technologies, in addition to environmental impact of the devices. Wakes generated either by offshore wind or tidal stream turbines lead to winnowing of seabed sediments (i.e. removal of the fine content), leading to well sorted sediments which are further susceptible to erosion. In addition, the development of tidal range power plants can alter current speeds, leading to changes in the rate of deposition. Although it is not possible to fully assess the impact such large structures will have on seabed sediment prior to construction, it is possible to minimize such impacts by careful planning, for example equally spacing the turbines around the embankment. The only variables that were both significant and strongly correlated to environmental properties were median grain size (related to peak current speed and bed shear stress) and mean grain size (related to peak current speed). Although sorting and skewness were both found to be significant, the correlations across all environmental variables were low. Our general recommendation is to minimize impacts of marine renewable energy technologies that affect both the mean and median grain size. This relates primarily to tidal energy conversion, both tidal range and tidal stream. We recommend that the scale of such schemes be restricted in high energy regions.
Statements
Data availability statement
The original contributions presented in the study are included in the article/Supplementary Material. Further inquiries can be directed to the corresponding author.
Author contributions
PA and SN contributed to the conception and design of the study. PA processed the sea bed sediment samples and performed the statistical analysis SN extracted the environmental variables from the models PA wrote the first draft of the manuscript. SN and VM wrote sections of the manuscript. All authors contributed to the article and approved the submitted version.
Funding
We acknowledge the support of SEEC (Smart Efficient Energy Centre) at Bangor University, part-funded by the European Regional Development Fund (ERDF), administered by the Welsh Government.
Acknowledgments
Many thanks to Guy Walker-Springett for his advice during sediment lab work, and Peter Robins for providing TELEMAC Model output of the study region.
Conflict of interest
The authors declare that the research was conducted in the absence of any commercial or financial relationships that could be construed as a potential conflict of interest.
Publisher’s note
All claims expressed in this article are solely those of the authors and do not necessarily represent those of their affiliated organizations, or those of the publisher, the editors and the reviewers. Any product that may be evaluated in this article, or claim that may be made by its manufacturer, is not guaranteed or endorsed by the publisher.
Supplementary material
The Supplementary Material for this article can be found online at: https://www.frontiersin.org/articles/10.3389/fmars.2023.1156486/full#supplementary-material
Footnotes
1.^A 34.9 m research vessel with a maximum draft of 3.5 m.
2.^The total fine sediment content is found by adding this component to the mass that remains on the ‘pan’ after passing through the 63 µm sieve following dry sieving.
References
1
Adelaja A. McKeown C. Calnin B. Hailu Y. (2012). Assessing offshore wind potential. Energy Policy42, 191–200. doi: 10.1016/j.enpol.2011.11.072
2
Ahmadian R. Falconer R. Bockelmann-Evans B. (2012). Far-field modelling of the hydro-environmental impact of tidal stream turbines. Renewable Energy38, 107–116. doi: 10.1016/j.renene.2011.07.005
3
Aminoroayaie Yamini O. Mousavi S. H. Kavianpour M. R. Movahedi A. (2018). Numerical modeling of sediment scouring phenomenon around the offshore wind turbine pile in marine environment. Environ. Earth Sci.77, 1–15. doi: 10.1007/s12665-018-7967-4
4
Auguste C. Nader J.-R. Marsh P. Cossu R. (2019). “Influence of tidal energy converters on sediment dynamics in tidal channel,” in Proc. 13th European Wave and Tidal energy Conf. 1–6. Available at: https://espace.library.uq.edu.au/view/UQ:5ac15f1.
5
Awasthi A. (1970). Skewness as an environmental indicator in the solani river system, roorkee (India). Sedimentary Geology4, 177–183. doi: 10.1016/0037-0738(70)90010-2
6
Belderson R. (1964). Holocene Sedimentation in the western half of the Irish Sea. Mar. Geology2, 147–163. doi: 10.1016/0025-3227(64)90032-5
7
Birchenough S. N. Reiss H. Degraer S. Mieszkowska N. Borja Á. Buhl-Mortensen L. et al . (2015). Climate change and marine benthos: a review of existing research and future directions in the north Atlantic. Wiley Interdiscip. reviews: Climate Change6, 203–223. doi: 10.1002/wcc.330
8
Blott S. J. Pye K. (2001). GRADISTAT: a grain size distribution and statistics package for the analysis of unconsolidated sediments. Earth Surface Processes Landforms26, 1237–1248. doi: 10.1002/esp.261
9
Bozgeyik M. E. (2019). Application of suitability index to Turkish coasts for wave energy site selection (Middle East Technical University).
10
Brown J. M. Wolf J. (2009). Coupled wave and surge modelling for the eastern Irish Sea and implications for model wind-stress. Continental Shelf Res.29, 1329–1342. doi: 10.1016/j.csr.2009.03.004
11
Chaouachi A. Covrig C. F. Ardelean M. (2017). Multi-criteria selection of offshore wind farms: Case study for the Baltic states. Energy Policy103, 179–192. doi: 10.1016/j.enpol.2017.01.018
12
Coughlan M. Guerrini M. Creane S. O’Shea M. Ward S. L. Van Landeghem K. J. et al . (2021). A new seabed mobility index for the irish sea: Modelling seabed shear stress and classifying sediment mobilisation to help predict erosion, deposition, and sediment distribution. Continental Shelf Res.229, 104574. doi: 10.1016/j.csr.2021.104574
13
Coughlan M. Long M. Doherty P. (2020). Geological and geotechnical constraints in the Irish Sea for offshore renewable energy. J. Maps16, 420–431. doi: 10.1080/17445647.2020.1758811
14
Dannheim J. Bergström L. Birchenough S. N. Brzana R. Boon A. R. Coolen J. W. et al . (2020). Benthic effects of offshore renewables: identification of knowledge gaps and urgently needed research. ICES J. Mar. Sci.77, 1092–1108. doi: 10.1093/icesjms/fsz018
15
Den Boon J. Sutherland J. Whitehouse R. Soulsby R. Stam C. Verhoeven K. et al . (2004). “Scour behaviour and scour protection for monopile foundations of offshore wind turbines,” in Proceedings of the European Wind Energy Conference, Vol. 14 (London, UK: EWEC).
16
De Pryck K. (2021). Intergovernmental expert consensus in the making: the case of the summary for policy makers of the IPCC 2014 synthesis report. Global Environ. Politics21, 108–129. doi: 10.1162/glep_a_00574
17
Díaz H. Soares C. G. (2020). Review of the current status, technology and future trends of offshore wind farms. Ocean Eng.209, 107381. doi: 10.1016/j.oceaneng.2020.107381
18
Dobson M. Evans W. James K. (1971). The sediment on the floor of the southern Irish Sea. Mar. Geology11, 27–69. doi: 10.1016/0025-3227(71)90083-1
19
Egbert G. D. Bennett A. F. Foreman M. G. (1994). TOPEX/POSEIDON tides estimated using a global inverse model. J. Geophysical Research: Oceans99, 24821–24852. doi: 10.1029/94JC01894
20
Folk R. L. Ward W. C. (1957). Brazos river bar [Texas]; a study in the significance of grain size parameters. J. Sedimentary Res.27, 3–26. doi: 10.1306/74D70646-2B21-11D7-8648000102C1865D
21
Hernandez C. Shadman M. Maali Amiri M. Silva C. Segen F. Estefen SF. et al . (2021). Environmental impacts of offshore wind installation, operation and maintenance, and decommissioning activities: A case study of Brazil. Renewable Sustain. Energy Rev.144, 110994. doi: 10.1016/j.rser.2021.110994
22
Gill A. B. (2005). Offshore renewable energy: ecological implications of generating electricity in the coastal zone. J. Appl. Ecol.42 (4), 605–615. doi: 10.1111/j.1365-2664.2005.01060.x
23
Hepburn C. Adlen E. Beddington J. Carter E. A. Fuss S. Mac Dowell N. et al . (2019). The technological and economic prospects for CO2 utilization and removal. Nature575, 87–97. doi: 10.1038/s41586-019-1681-6
24
Holmes R. Tappin D. (2005). DTI strategic environmental assessment area 6, Irish Sea, seabed and surficial geology and processes. British Geological Survey Commissioned Report, CR/05/057.
25
Horsburgh K. Hill A. Brown J. Fernand L. Garvine R. Angelico M. (2000). Seasonal evolution of the cold pool gyre in the western Irish Sea. Prog. Oceanogr.46, 1–58. doi: 10.1016/S0079-6611(99)00054-3
26
Ingram R. L. (1971). Sieve analysis. Procedures Sedimentary Petrology, 49–67.
27
Jackson D. I. Jackson A. A. Evans D. Wingfield R. T. R. Barnes R. P. Arthur M. J. (1995). JUnited Kingdom offshore regional report: the geology of the Irish Sea. (London: HMSO for the British Geological Survey)
28
Kirby R. Shaw T. (2005). “Severn Barrage, UK – environmental reappraisal,” in Proceedings of the institution of civil engineers-engineering sustainability158 (1), 31–39. doi: 10.1680/ensu.2005.158.1.31
29
Krumbein W. Pettijohn F. (1939). Manual of sedimentary petrography. XIV (New York and London: Taylor & Francis), 225–227. doi: 10.1080/11035893909452786
30
Leontaris G. Morales-Nápoles O. Wolfert A. R. (2016). Probabilistic scheduling of offshore operations using copula based environmental time series–an application for cable installation management for offshore wind farms. Ocean Eng.125, 328–341. doi: 10.1016/j.oceaneng.2016.08.029
31
Lewis M. J. Palmer T. Hashemi R. Robins P. Saulter A. Brown J. et al . (2019). Wave-tide interaction modulates nearshore wave height. Ocean Dynam.69, 367–384. doi: 10.1007/s10236-018-01245-z
32
Loss S. R. Will T. Marra P. P. (2013). Estimates of bird collision mortality at wind facilities in the contiguous united states. Biol. Conserv.168, 201–209. doi: 10.1016/j.biocon.2013.10.007
33
Madsen P. T. Wahlberg M. Tougaard J. Lucke K. Tyack P. (2006). Wind turbine underwater noise and marine mammals: implications of current knowledge and data needs. Mar. Ecol. Prog. Ser.309, 279–295. doi: 10.3354/meps309279
34
Martins L. (2003). Recent sediments and grain-size analysis. Gravel1, 90–105.
35
Mekhilef S. Saidur R. Kamalisarvestani M. (2012). Effect of dust, humidity and air velocity on efficiency of photovoltaic cells. Renewable Sustain. Energy Rev.16, 2920–2925. doi: 10.1016/j.rser.2012.02.012
36
Neill S. P. Angeloudis A. Robins P. E. Walkington I. Ward S. L. Masters I. et al . (2018). Tidal range energy resource and optimization–past perspectives and future challenges. Renewable Energy127, 763–778. doi: 10.1016/j.renene.2018.05.007
37
Neill S. Elliott A. (2004). In situ measurements of spring–neap variations to unsteady island wake development in the firth of forth, Scotland. Estuarine Coast. Shelf Sci.60, 229–239. doi: 10.1016/j.ecss.2004.01.001
38
Neill S. P. Hashemi M. R. (2013). Wave power variability over the northwest European shelf seas. Appl. Energy106, 31–46. doi: 10.1016/j.apenergy.2013.01.026
39
Neill S. P. Hashemi M. R. Lewis M. J. (2014). The role of tidal asymmetry in characterizing the tidal energy resource of Orkney. Renewable Energy68, 337–350. doi: 10.1016/j.renene.2014.01.052
40
Neill S. P. Jordan J. R. Couch S. J. (2012). Impact of tidal energy converter (TEC) arrays on the dynamics of headland sand banks. Renewable Energy37, 387–397. doi: 10.1016/j.renene.2011.07.003
41
Neill S. P. Litt E. J. Couch S. J. Davies A. G. (2009). The impact of tidal stream turbines on large-scale sediment dynamics. Renewable Energy34, 2803–2812. doi: 10.1016/j.renene.2009.06.015
42
Neill S. P. Robins P. E. Fairley I. (2017). “The impact of marine renewable energy extraction on sediment dynamics,” in Marine renewable energy (Cham: Springer International Publishing), 279–304. doi: 10.1007/978-3-319-53536-4_12
43
Newell R. Raimi D. Villanueva S. Prest B. (2021). Global energy outlook 2021: Pathways from Paris. Resour. Future8.
44
Onoufriou J. Russell D. J. Thompson D. Moss S. E. Hastie G. D. (2021). Quantifying the effects of tidal turbine array operations on the distribution of marine mammals: Implications for collision risk. Renewable Energy180, 157–165. doi: 10.1016/j.renene.2021.08.052
45
Pelc R. Fujita R. M. (2002). Renewable energy from the ocean. Mar. Policy26, 471–479. doi: 10.1016/S0308-597X(02)00045-3
46
Robins P. E. Cooper D. Malham S. K. Jones D. L. (2019). Viral dispersal in the coastal zone: A method to quantify water quality risk. Environ. Int.126, 430–442. doi: 10.1016/j.envint.2019.02.042
47
Robins P. E. Neill S. P. Lewis M. J. (2014). Impact of tidal-stream arrays in relation to the natural variability of sedimentary processes. Renewable Energy72, 311–321. doi: 10.1016/j.renene.2014.07.037
48
Roche R. Walker-Springett K. Robins P. Jones J. Veneruso G. Whitton T. et al . (2016). Research priorities for assessing potential impacts of emerging marine renewable energy technologies: Insights from developments in Wales (UK). Renewable Energy99, 1327–1341. doi: 10.1016/j.renene.2016.08.035
49
Romm J. (2022). Climate change: What everyone needs to know (New York: Oxford University Press).
50
Rui S. Guo Z. Wang L. Wang H. Zhou W. (2022). Inclined loading capacity of caisson anchor in south china sea carbonate sand considering the seabed soil loss. Ocean Eng.260, 111790. doi: 10.1016/j.oceaneng.2022.111790
51
Selot F. Fraile D. Brindley G. (2019). Offshore wind in Europe-key trends and statistics 2018. WalshC.WindEurope. eds (Brussels: WindEurope).
52
Shields M. A. Woolf D. K. Grist E. P. Kerr S. A. Jackson A. C. Harris R. E. et al . (2011). Marine renewable energy: The ecological implications of altering the hydrodynamics of the marine environment. Ocean Coast. Manage.54, 2–9. doi: 10.1016/j.ocecoaman.2010.10.036
53
Soares P. M. Lima D. C. Nogueira M. (2020). Global offshore wind energy resources using the new ERA-5 reanalysis. Environ. Res. Lett.15, 1040a2. doi: 10.1088/1748-9326/abb10d
54
Stoutenburg E. Jacobson M. (2010). “Optimizing offshore transmission links for marine renewable energy farms,” in OCEANS 2010 MTS/IEEE SEATTLE. (Seattle: IEEE), 1–9. doi: 10.1109/OCEANS.2010.5664506
55
Van Dijk T. A. Kleinhans M. G. (2005). Processes controlling the dynamics of compound sand waves in the north Sea, Netherlands. J. Geophysical Research: Earth Surface110. doi: 10.1029/2004JF000173
56
Vanhellemont Q. Ruddick K. (2014). Turbid wakes associated with offshore wind turbines observed with landsat 8. Remote Sens. Environ.145, 105–115. doi: 10.1016/j.rse.2014.01.009
57
Van Landeghem K. J. Uehara K. Wheeler A. J. Mitchell N. C. Scourse J. D. (2009). Post-glacial sediment dynamics in the Irish Sea and sediment wave morphology: Data–model comparisons. Continental Shelf Res.29, 1723–1736. doi: 10.1016/j.csr.2009.05.014
58
Vasileiou M. Loukogeorgaki E. Vagiona D. G. (2017). Gis-based multi-criteria decision analysis for site selection of hybrid offshore wind and wave energy systems in Greece. Renewable Sustain. Energy Rev.73, 745–757. doi: 10.1016/j.rser.2017.01.161
59
Wang Z. Li X. Ren C. Yong Z. Zhu J. Luo W. et al . (2009). Growth of Ag nanocrystals on multiwalled carbon nanotubes and Ag-carbon nanotube interaction. Sci. China Ser. E: Technol. Sci.52, 3215–3218. doi: 10.1007/s11431-009-0278-y
60
Ward S. L. Neill S. P. Van Landeghem K. J. Scourse J. D. (2015). Classifying seabed sediment type using simulated tidal-induced bed shear stress. Mar. Geology367, 94–104. doi: 10.1016/j.margeo.2015.05.010
61
Waters S. Aggidis G. (2016). Tidal range technologies and state of the art in review. Renewable Sustain. Energy Rev.59, 514–529. doi: 10.1016/j.rser.2015.12.347
62
Wolanski E. Imberger J. Heron M. L. (1984). Island wakes in shallow coastal waters. J. Geophysical Research: Oceans89, 10553–10569. doi: 10.1029/JC089iC06p10553
63
Xu Y. Ren Q. Zheng Z.-J. He Y.-L. (2017). Evaluation and optimization of melting performance for a latent heat thermal energy storage unit partially filled with porous media. Appl. Energy193, 84–95. doi: 10.1016/j.apenergy.2017.02.019
64
Zabihian F. Fung A. S. (2011). Review of marine renewable energies: case study of Iran. Renewable Sustain. Energy Rev.15, 2461–2474. doi: 10.1016/j.rser.2011.02.006
65
Zhang F. Cohen M. Barr A. (2020). Economic impact study of new offshore wind lease auctions by BOEM. Available at: https://tethys.pnnl.gov/sites/default/files/publications/Offshore-wind-economic-impact-analysis.pdf.
Summary
Keywords
sediment dynamics, renewable energy, wind energy, tidal energy, wave energy, Shipek, Irish Sea
Citation
Amjadian P, Neill SP and Martí Barclay V (2023) Characterizing seabed sediments at contrasting offshore renewable energy sites. Front. Mar. Sci. 10:1156486. doi: 10.3389/fmars.2023.1156486
Received
01 February 2023
Accepted
20 March 2023
Published
04 April 2023
Volume
10 - 2023
Edited by
Zefeng Zhou, Norwegian Geotechnical Institute (NGI), Norway
Reviewed by
Yufei Wang, Norwegian Geotechnical Institute (NGI), Norway; Yubin Ren, Dalian University of Technology, China
Updates
Copyright
© 2023 Amjadian, Neill and Martí Barclay.
This is an open-access article distributed under the terms of the Creative Commons Attribution License (CC BY). The use, distribution or reproduction in other forums is permitted, provided the original author(s) and the copyright owner(s) are credited and that the original publication in this journal is cited, in accordance with accepted academic practice. No use, distribution or reproduction is permitted which does not comply with these terms.
*Correspondence: Pegah Amjadian, pgm21ryc@bangor.ac.uk
This article was submitted to Ocean Solutions, a section of the journal Frontiers in Marine Science
Disclaimer
All claims expressed in this article are solely those of the authors and do not necessarily represent those of their affiliated organizations, or those of the publisher, the editors and the reviewers. Any product that may be evaluated in this article or claim that may be made by its manufacturer is not guaranteed or endorsed by the publisher.