Abstract
Subterranean estuaries are connective zones between inland aquifers and the open sea where terrestrial freshwater and circulating seawater mix and undergo major biogeochemical changes. They are biogeochemical reactors that modify groundwater chemistry prior to discharge into the sea. We propose that subterranean estuaries of high-energy beaches are particularly dynamic environments, where the effect of the dynamic boundary conditions propagates tens of meters into the subsurface, leading to strong spatio-temporal variability of geochemical conditions. We hypothesize that they form a unique habitat with an adapted microbial community unlike other typically more stable subsurface environments. So far, however, studies concerning subterranean estuaries of high-energy beaches have been rare and therefore their functioning, and their importance for coastal ecosystems, as well as for carbon, nutrient and trace element cycling, is little understood. We are addressing this knowledge gap within the interdisciplinary research project DynaDeep by studying the combined effect of surface (hydro- and morphodynamics) on subsurface processes (groundwater flow and transport, biogeochemical reactions, microbiology). A unique subterranean estuary observatory was established on the northern beach of the island of Spiekeroog facing the North Sea, serving as an exemplary high-energy research site and model system. It consists of fixed and permanent infrastructure such as a pole with measuring devices, multi-level groundwater wells and an electrode chain. This forms the base for autonomous measurements, regular repeated sampling, interdisciplinary field campaigns and experimental work, all of which are integrated via mathematical modelling to understand and quantify the functioning of the biogeochemical reactor. First results show that the DynaDeep observatory is collecting the intended spatially and temporally resolved morphological, sedimentological and biogeochemical data. Samples and data are further processed ex-situ and combined with experiments and modelling. Ultimately, DynaDeep aims at elucidating the global relevance of these common but overlooked environments.
1 Introduction
The connective zone between inland aquifers and the sea has been termed subterranean estuary (STE) and is an important component of coastal ecosystems (Moore, 1999). The fresh groundwater and recirculating seawater discharging from the STE are referred to as submarine groundwater discharge (SGD; e.g. Michael et al., 2005; Robinson et al., 2007b). Most STE and SGD research is motivated by the recognition of SGD as a major input pathway for water constituents to coastal waters, therefore modifying coastal carbon, nutrient- and trace element cycling (e.g. Santos et al., 2008; Moore, 2010; Moore et al., 2011; Rodellas et al., 2015; Ehlert et al., 2016; Lecher et al., 2016; Beck et al., 2017; Liu et al., 2018b; Moosdorf et al., 2021). Fresh and saline groundwater undergo major biogeochemical changes in the STE prior to discharge and STEs are hence considered powerful biogeochemical reactors (e.g. Moore, 1999; Charette and Sholkovitz, 2006; Anschutz et al., 2009; Linkhorst et al., 2017). Despite its importance in many geochemical cycles and budgets, the interplay between hydrodynamics, geochemical reactions and microbial transformations in the STE is still poorly understood (Sawyer et al., 2016; Robinson et al., 2018). SGD research has so far mostly focused on fluxes rather than processes within the STE, while the characteristics of the STE as a unique microbial habitat have only recently received increasing attention (Archana et al., 2021, Ruiz-González et al., 2021).
STE research has been growing in the past decade. So far, field studies have mostly been conducted at embayed, sheltered low- or moderate energy sites that are not exposed to the open sea and have rather low mean significant wave heights and/or mean tidal ranges. STE study sites that were at least temporally equipped with observation wells to extract pore-water include, amongst others (only one reference given per site): Îles-de-la-Madeleine, Canada (Chaillou et al., 2018), Waquoit Bay, USA (Abarca et al., 2013), Santa Barbara, USA (Goodridge and Melack 2014), Gloucester Point, USA (Beck et al., 2016), Truc Vert, France (Charbonnier et al., 2016), Rio Formosa, Portugal (Ibánhez and Rocha, 2016), Spiekeroog (Beck et al., 2017), Cape Henlopen, USA (Heiss and Michael, 2014), Greenwich Bay, USA (Addy et al., 2005), Moreton Bay, Australia (Robinson et al., 2007a), Turkey Point, USA (Santos et al., 2008), Cockburn Sound, Australia (Loveles and Oldham 2010), Ho Bay, Denmark (Andersen et al., 2007), Argentona, Spain (Ruiz-González et al., 2021) and Tolo Harbor, Hong Kong (Liu et al., 2018a). Mostly, investigations were done in the shallow STE (< 5 m) which is usually sufficient under low to moderate energy conditions. The only high-energy sites exposed to the open sea in the list are Santa Barbara, Truc Vert and Spiekeroog, whereby none of these have, until now, been extensively instrumented.
The state-of-the-art concept of groundwater flow and transport in a tidally influenced STE is that a saline recirculation cell (upper saline plume, USP) overlies a freshwater discharge tube (FDT) overtopping a saltwater wedge (Figure 1). Fresh- and saline SGD discharge around the mean low water line (MLWL). Although the transient dynamics of the USP have been recognized (Abarca et al., 2013; Heiss and Michael, 2014; Liu et al., 2018a) most studies conceptualize these compartments (USP, FDT and saltwater wedge) as comparatively stable hydrological features (e.g. Michael et al., 2005; Robinson et al., 2006; Robinson et al., 2007a; Robinson et al., 2014). Studies from Spiekeroog beach (Waska et al., 2019; Greskowiak and Massmann, 2021; Grünenbaum et al., 2023), however, recently indicated that this might not hold for high-energy beaches with intensive wave and tidal energy, causing frequent and substantial sediment relocation, permanently changing the beach topography. Extensive geochemical analysis of the shallow beach groundwater in the intertidal zone by Waska et al. (2019) revealed high spatial heterogeneity related to a runnel and ridge topography. Results from a numerical groundwater model accounting for morphodynamics and studying its effect on groundwater flow and transport suggest that for high-energy conditions with variable topographies, the salinity distribution in the STE constantly changes in time and space. SGD is then associated with the topographic lows, causing saltwater-freshwater interfaces to move through the entire STE, leading to rather chaotic flow paths (Greskowiak and Massmann, 2021). Figure 1 visualizes the difference between the classic “stable” (static topography) and “transient” (variable topography) case, whereby the salinity distribution in the latter is a snapshot of the model by Greskowiak and Massmann (2021). This effect of hydro- and morphodynamics on subsurface flow and transport under high-energy conditions has so far not been studied in the field and related consequences on biogeochemical reactions and microbial habitat characteristics have so far not been explored.
Figure 1
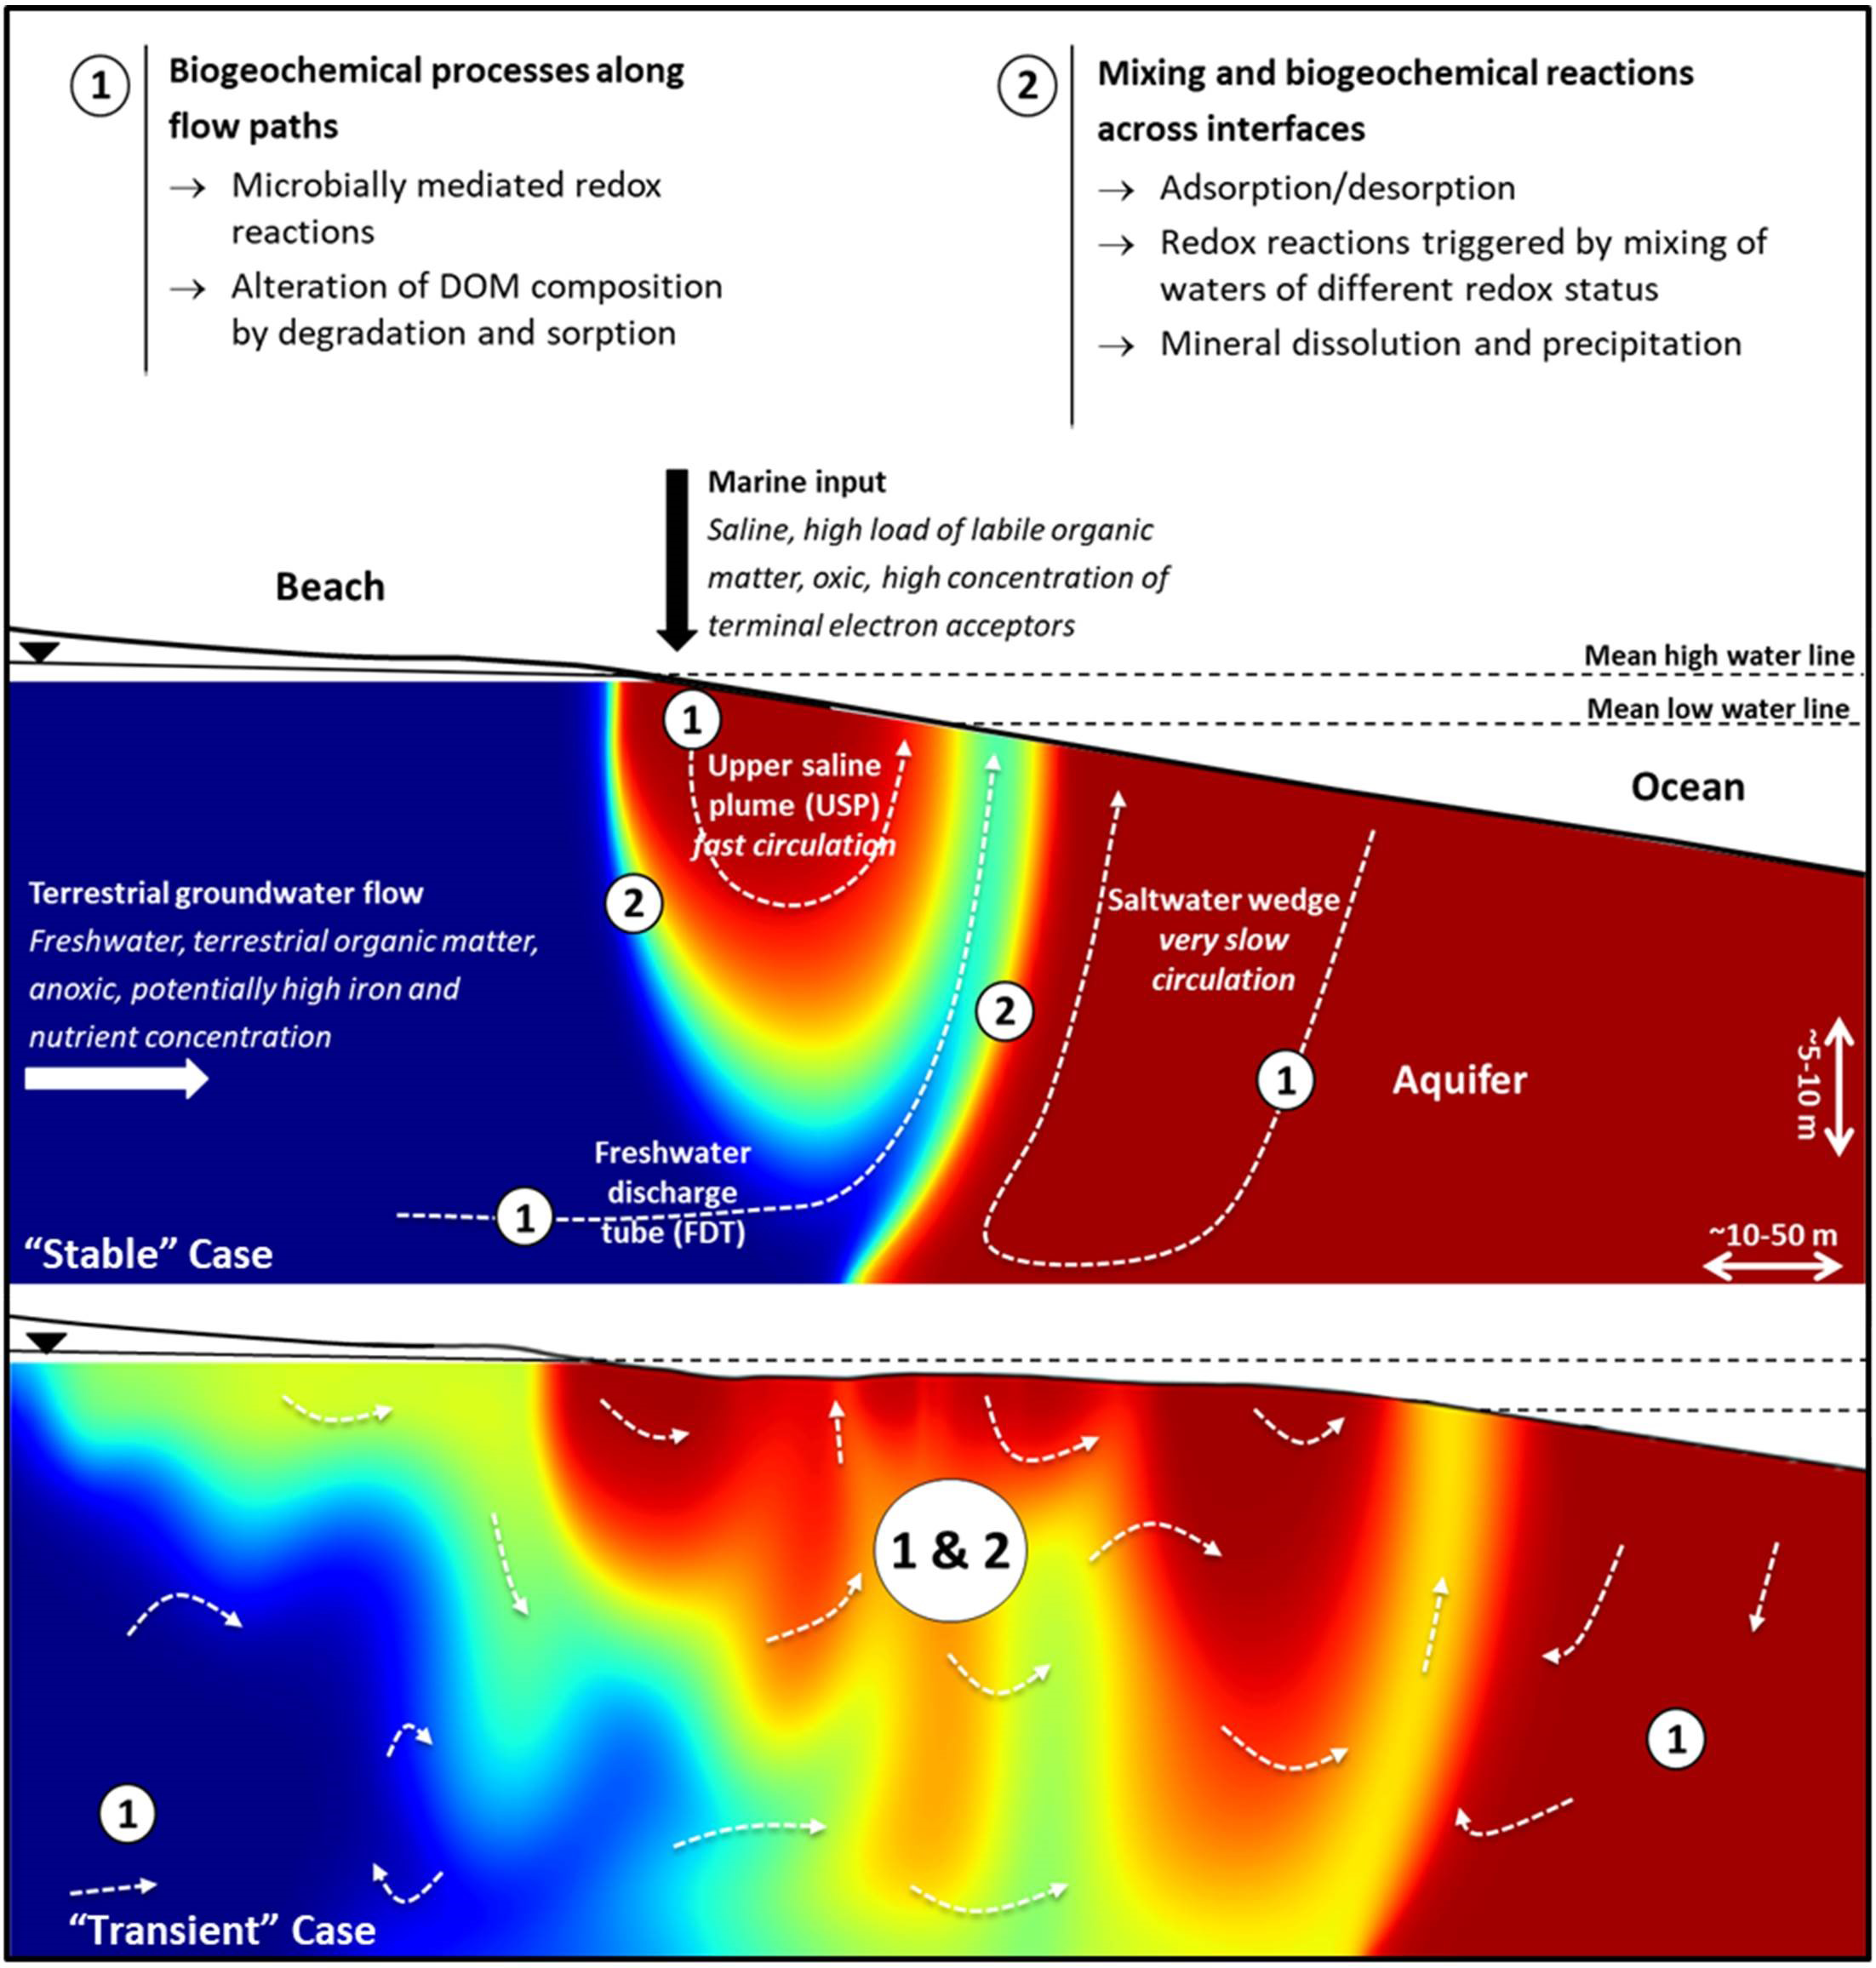
Proposed conceptual model of the STE as a biogeochemical reactor with general features and groundwater salinities (saltwater red, freshwater blue). Major biogeochemical processes expected along flow paths (#1) and at interfaces (#2) are listed. The current state-of-the-art perception of tidal STEs with an upper saline plume, a freshwater discharge tube and a saltwater wedge is shown at the top (“stable” case). The contrasting “transient” case below is based on a model by Greskowiak and Massmann (2021) that suggests that STEs under high-energy conditions function differently: Stable interfaces likely do not exist and flow paths as indicated by white arrows change constantly. Implications for reactions #1 and #2 and for the role of the STE as a habitat are unclear.
Grünenbaum et al. (2023) applied electrical resistivity tomography (ERT) supported by direct push (DP) salinity probing at the northern high-energy beach on Spiekeroog, covering the intertidal zone and the adjacent upper beach up to the dune line. Results support findings from the model by Greskowiak and Massmann (2021), with a salinity distribution resembling that of Figure 1 (bottom) with a visible separation of the tidal saltwater circulation cell into several compartments by topographic highs and lows (see also background in Figure 2). The effects of the dynamic boundaries appear to propagate tens of meters into the subsurface under the given high-energy conditions.
Figure 2
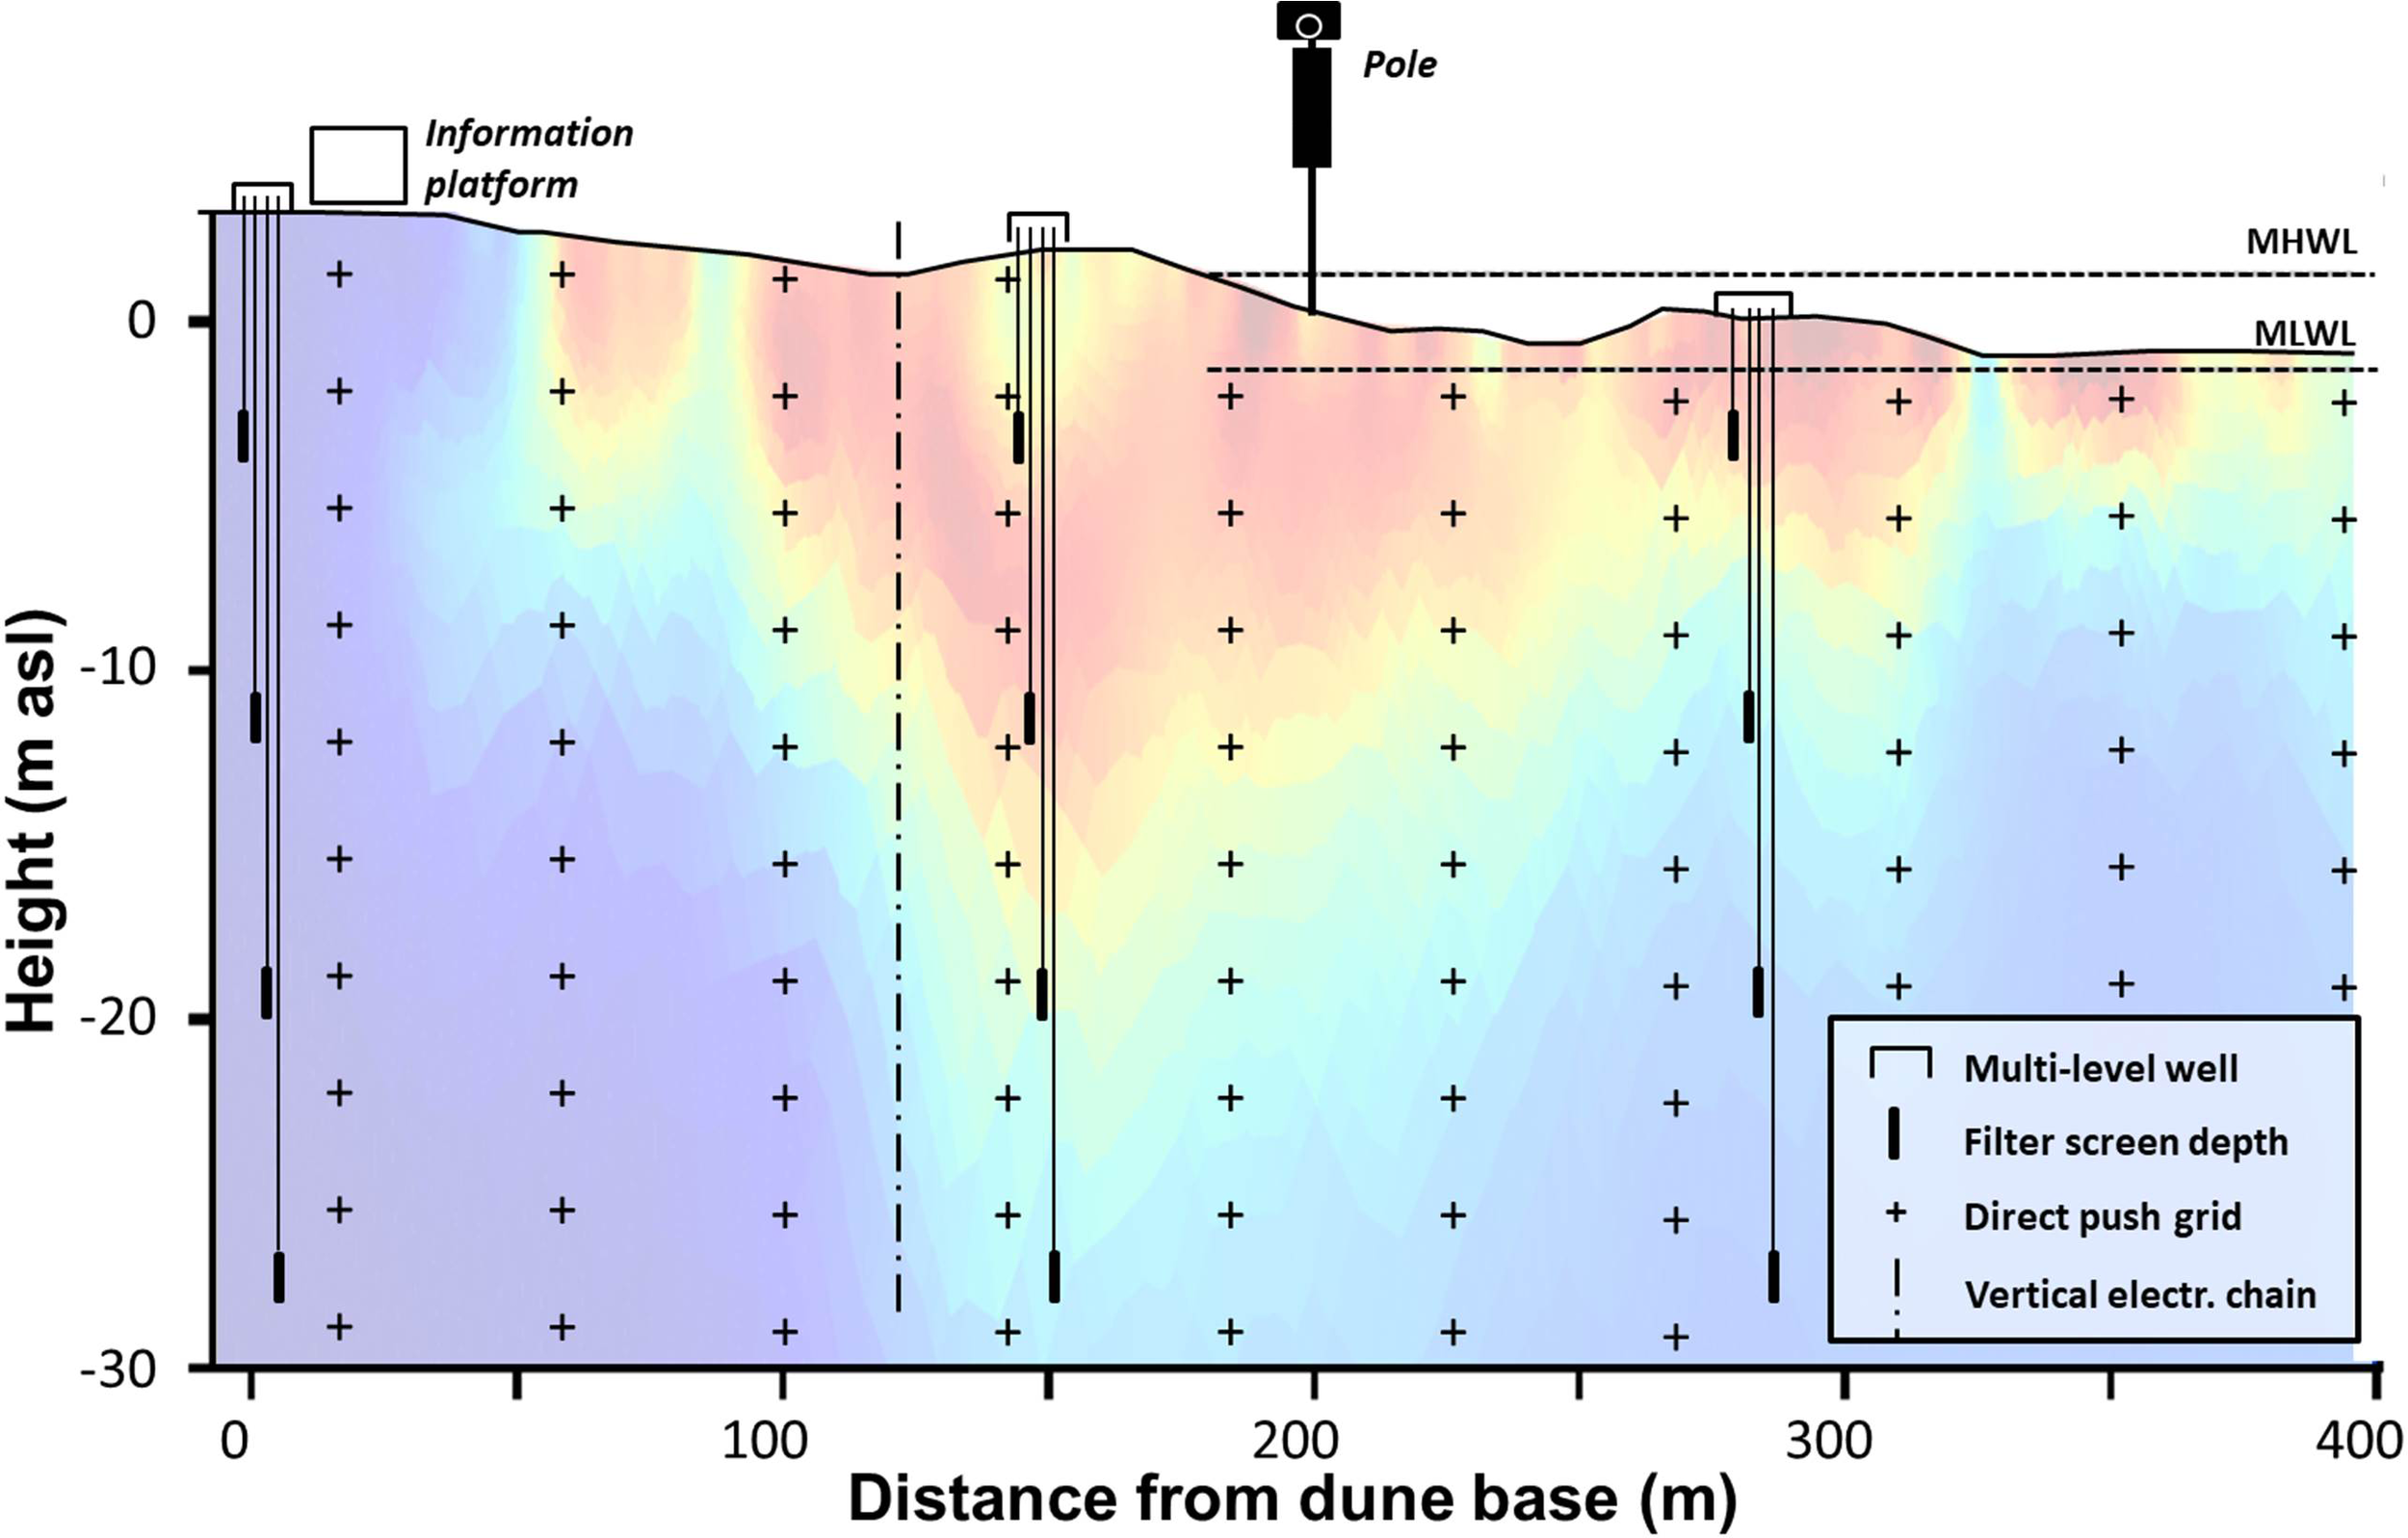
Concept of the permanent infrastructure of the DynaDeep STE observatory. The DP strategy for continuous salinity probing and porewater sampling between dune base and MLWL is indicated by the crosses. The colored background originates from the first ground-based geophysical (ERT) campaign in 2019 and was added for orientation. The color scheme is similar to Figure 1 (data from Grünenbaum et al., 2023), whereby blue colors are fresh and red colors saltwater.
Together with the previous biogeochemical studies from the shallow subsurface of Spiekeroog beach (Beck et al., 2017; Reckhardt et al., 2017; Waska et al., 2019; Ahrens et al., 2020; Degenhardt et al., 2020; Ahrens et al., 2021; Degenhardt et al., 2021a; Degenhardt et al., 2021b; Seibert et al., 2021; Waska et al., 2021), the findings published in Greskowiak and Massmann (2021) and Grünenbaum et al. (2023) provide the conceptual foundation for the interdisciplinary research project DynaDeep that commenced in 2021. The aim of this paper is to introduce the DynaDeep approach and project, with emphasis on the conceptual idea and hypotheses, the infrastructure installed on Spiekeroog beach in 2022, the ex-situ sample processing chain and first results from the site, highlighting the possibilities and direction of the research envisioned in the coming years.
2 The DynaDeep approach
2.1 Hypothesis and research objectives
The central hypothesis addressed in DynaDeep is that STEs of high-energy beaches are bioreactors affected by dynamic boundary conditions propagating deep into the subsurface, leading to strong spatio-temporal variability of geochemical conditions, thus creating a unique habitat for adapted microbial communities.
The northern beach of the German barrier island Spiekeroog was selected as a representative high-energy site to test this hypothesis. A joint cooperative effort of an interdisciplinary research team (a so-called “research unit” funded by the German Research Foundation) is needed to significantly advance the present understanding of STEs under high-energy conditions that likely function different than any other deep subsurface habitat.
DynaDeep addresses the following central research questions:
-
Boundary conditions: How do morphodynamics, hydrodynamics, sediment properties and matter input control biogeochemical variability and which factor dominates where in the STE?
-
Variability: What are the frequencies and amplitudes of temporal biogeochemical variability in the STE and how do they translate into spatial gradients?
-
Niche space: Which redox processes overlap or occur simultaneously, how do they increase the biogeochemical niche space and how do they translate to functional diversity of indigenous microbial communities?
-
Global relevance: How ubiquitous is the dynamic deep subsurface bioreactor? How does it communicate back to coastal ecosystems and geochemical cycles on a global scale?
DynaDeep consists of six scientific subprojects that closely cooperate and are linked to each other. All projects rely on i) the infrastructure of the DynaDeep STE observatory established in 2022, ii) coordinated joint field campaigns that commenced in 2022 and a common data pool and iii) joint experimental work as well as iv) integrative mathematical modelling.
2.2 Relevant processes and parameters targeted
The biogeochemical processes that are likely influenced by the dynamic forcings of high-energy beaches that are low in organic matter (OM) include microbial OM degradation, redox reactions, mineral dissolution/precipitation and surface adsorption/desorption (Figure 1). The schematic in Figure 3 further highlights the most relevant processes and parameters likely encountered in high-energy STEs that are studied in DynaDeep.
Figure 3
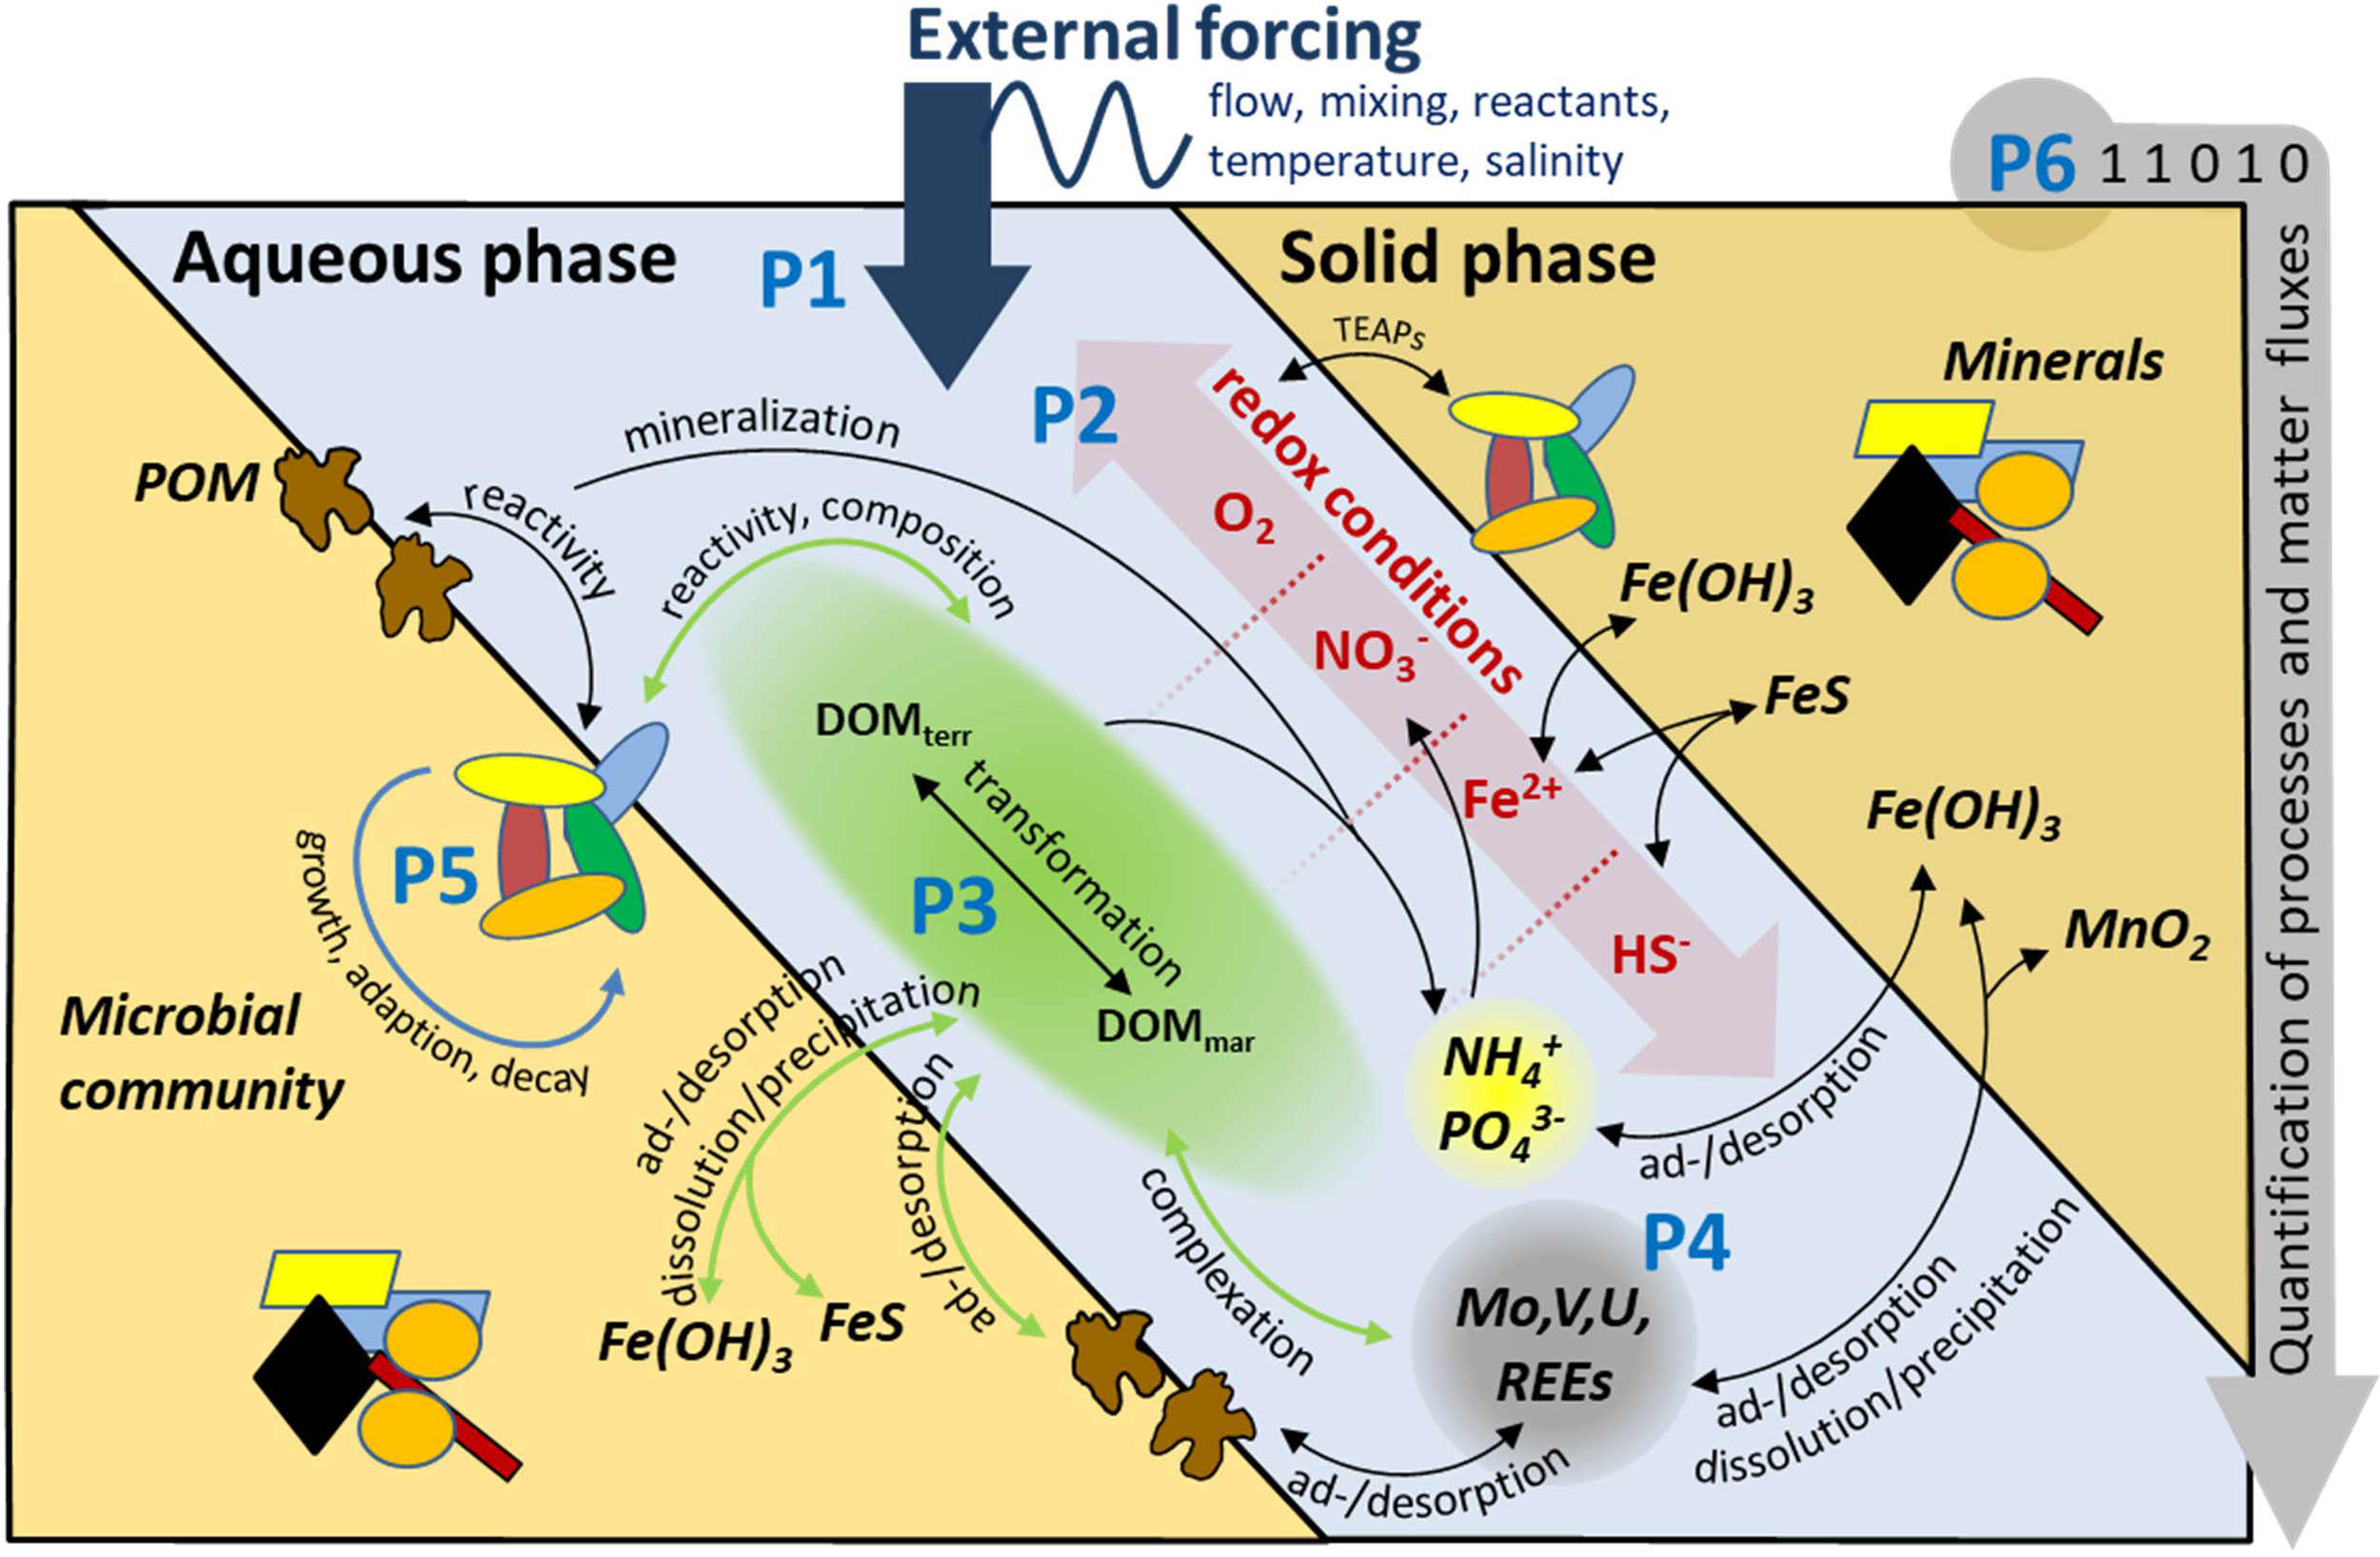
Conceptual depiction of processes and properties in the STE biogeochemical reactor expected under high-energy conditions and their allocation between solid (yellow) and aqueous (blue) phase. Note that this figure is schematic and not meant to show processes in a particular pore. P1-P6 denote the different DynaDeep subprojects focussing on specific aspects. POM, particulate organic matter; DOM, dissolved organic matter; TEAPs, terminal electron acceptors. Green arrows are associated with DOM.
Infiltrating seawater supplies oxygen and marine fresh dissolved organic matter (DOM) with high functional and molecular diversity to the subsurface (Seidel et al., 2015) that is subsequently mineralized and reduced along flow paths (e.g. Reckhardt et al., 2015; Charbonnier et al., 2016). In the STE, this infiltrating seawater encounters older, mostly anoxic terrestrial groundwater (e.g. Charette and Sholkovitz, 2006; Reckhardt et al., 2017). Mixing at the interfaces between the geochemically different seawater and terrestrial groundwater can trigger the precipitation of Fe(III)-(hydr)oxides referred to as “iron curtain” (e.g. Charette and Sholkovitz, 2002) which can act as a geochemical barrier for DOM and inorganic water constituents that may get adsorbed (e.g. Linkhorst et al., 2017; Reckhardt et al., 2017). In case of higher OM contents and microbial sulfate reduction producing sulfide, Fe(III)-(hydr)oxides may potentially be further transformed to Fe(II)-sulfides (McAllister et al., 2015; Liu et al., 2019). Depending on the properties of the STE, relevant redox processes involve oxic respiration, nitrification, denitrification, anammox, manganese-, iron- and sulfate reduction and methane production/oxidation. Metabolic rates of oxic and anoxic respiratory processes are thereby likely a function of spatial physical and chemical heterogeneities as well as temporal fluctuations in relation to boundary conditions (Ahmerkamp et al., 2015; Marchant et al., 2017; Ahmerkamp et al., 2020). OM, as DOM and particulate organic matter (POM) as the electron donor for respiratory processes is transformed both abiotically and microbially in the STE. The mobility of trace elements such as molybdenum (Mo), uranium (U) or thallium (Tl) are likewise strongly affected by microbial DOM transformation and the corresponding redox regime, as well as by mixing of fresh and saline groundwater causing Fe(II)-mineral formation (Reckhardt et al., 2017; Ahrens et al., 2021).
The microbial community in the STE is central for the geochemistry as it catalyses the oxidation of OM. Subsurface sediments typically exhibit a stable redox zonation caused by the succession of these metabolic pathways with decreasing energy yields (Froelich et al., 1979; D'Hondt et al., 2004; Engelen and Cypionka, 2009). The resulting redox environment, in turn, defines the ecological niche space (Larcombe et al., 2018) for indigenous microorganisms and shapes their community composition. Given the transient conditions we propose, the niche space likely increases due to moving saltwater-freshwater interfaces (Figure 1) and likewise redox boundaries. We expect this to result in the formation of a unique microbial habitat that fundamentally differs from other, more stable deep subsurface environments.
2.3 Expected temporal and spatial scales
The depth where dynamic changes in physico-chemical parameters (i.e. temperature, salinity, redox conditions) are still observed is expected to be in the order of several tens of meters at the Spiekeroog site based on modelling (Greskowiak and Massmann, 2021, Greskowiak et al. submitted) and the geophysical results by Grünenbaum et al. (2023). With regard to the temporal dynamics, we defined the following time scales that we aim to disentangle within the project:
-
τmorph is the time scale on which relevant morphological changes take place; i.e. beach surface dynamics as a reaction to tides, storms, and seasons
-
τadvect is the porewater residence time
-
τsal is the frequency of the salinity variation (and variation in other parameters differing between the marine and terrestrial endmember, for example DOM-type)
-
τreact is the scale of a specific reaction (defined here as the electron acceptor half-life time for redox reactions)
-
τredox is the time scale on which redox conditions vary
-
τadapt is the time for the microbial community to adapt to changing conditions
Figure 4 shows their expected ranges for high-energy beaches like Spiekeroog that are low in OM. Based on preliminary work on Spiekeroog (“transient” model, Greskowiak and Massmann, 2021) we expect τmorph to vary largely depending on the event (i.e. waves to extreme stormfloods), whereby effects of the less frequent major events like stormfloods will naturally be much larger and reach deeper. τadvect generally increases with depth, however at exfiltration zones decades old water can also be expected at shallow depths as observed by Grünenbaum et al. (2020b). The magnitudes of τsal and τredox are difficult to estimate; so far time-series of the first model attempt are the only way of approximating τsal (Greskowiak and Massmann, 2021) and τredox (Greskowiak et al. submitted) and indicate that these may be in the order of weeks to months. For τreact values for sandy sediments were taken from literature and preliminary work (e.g., Kim et al., 2019; Seibert et al., 2019b). Finally τadapt is likely to be in the order of hours to days (Zhou et al., 2023). One of the outcomes of DynaDeep will be to identify whether the estimates as shown in Figure 4 are realistic, how they are connected through adaptation and relaxation processes, and how they transfer to other high-energy sites.
Figure 4
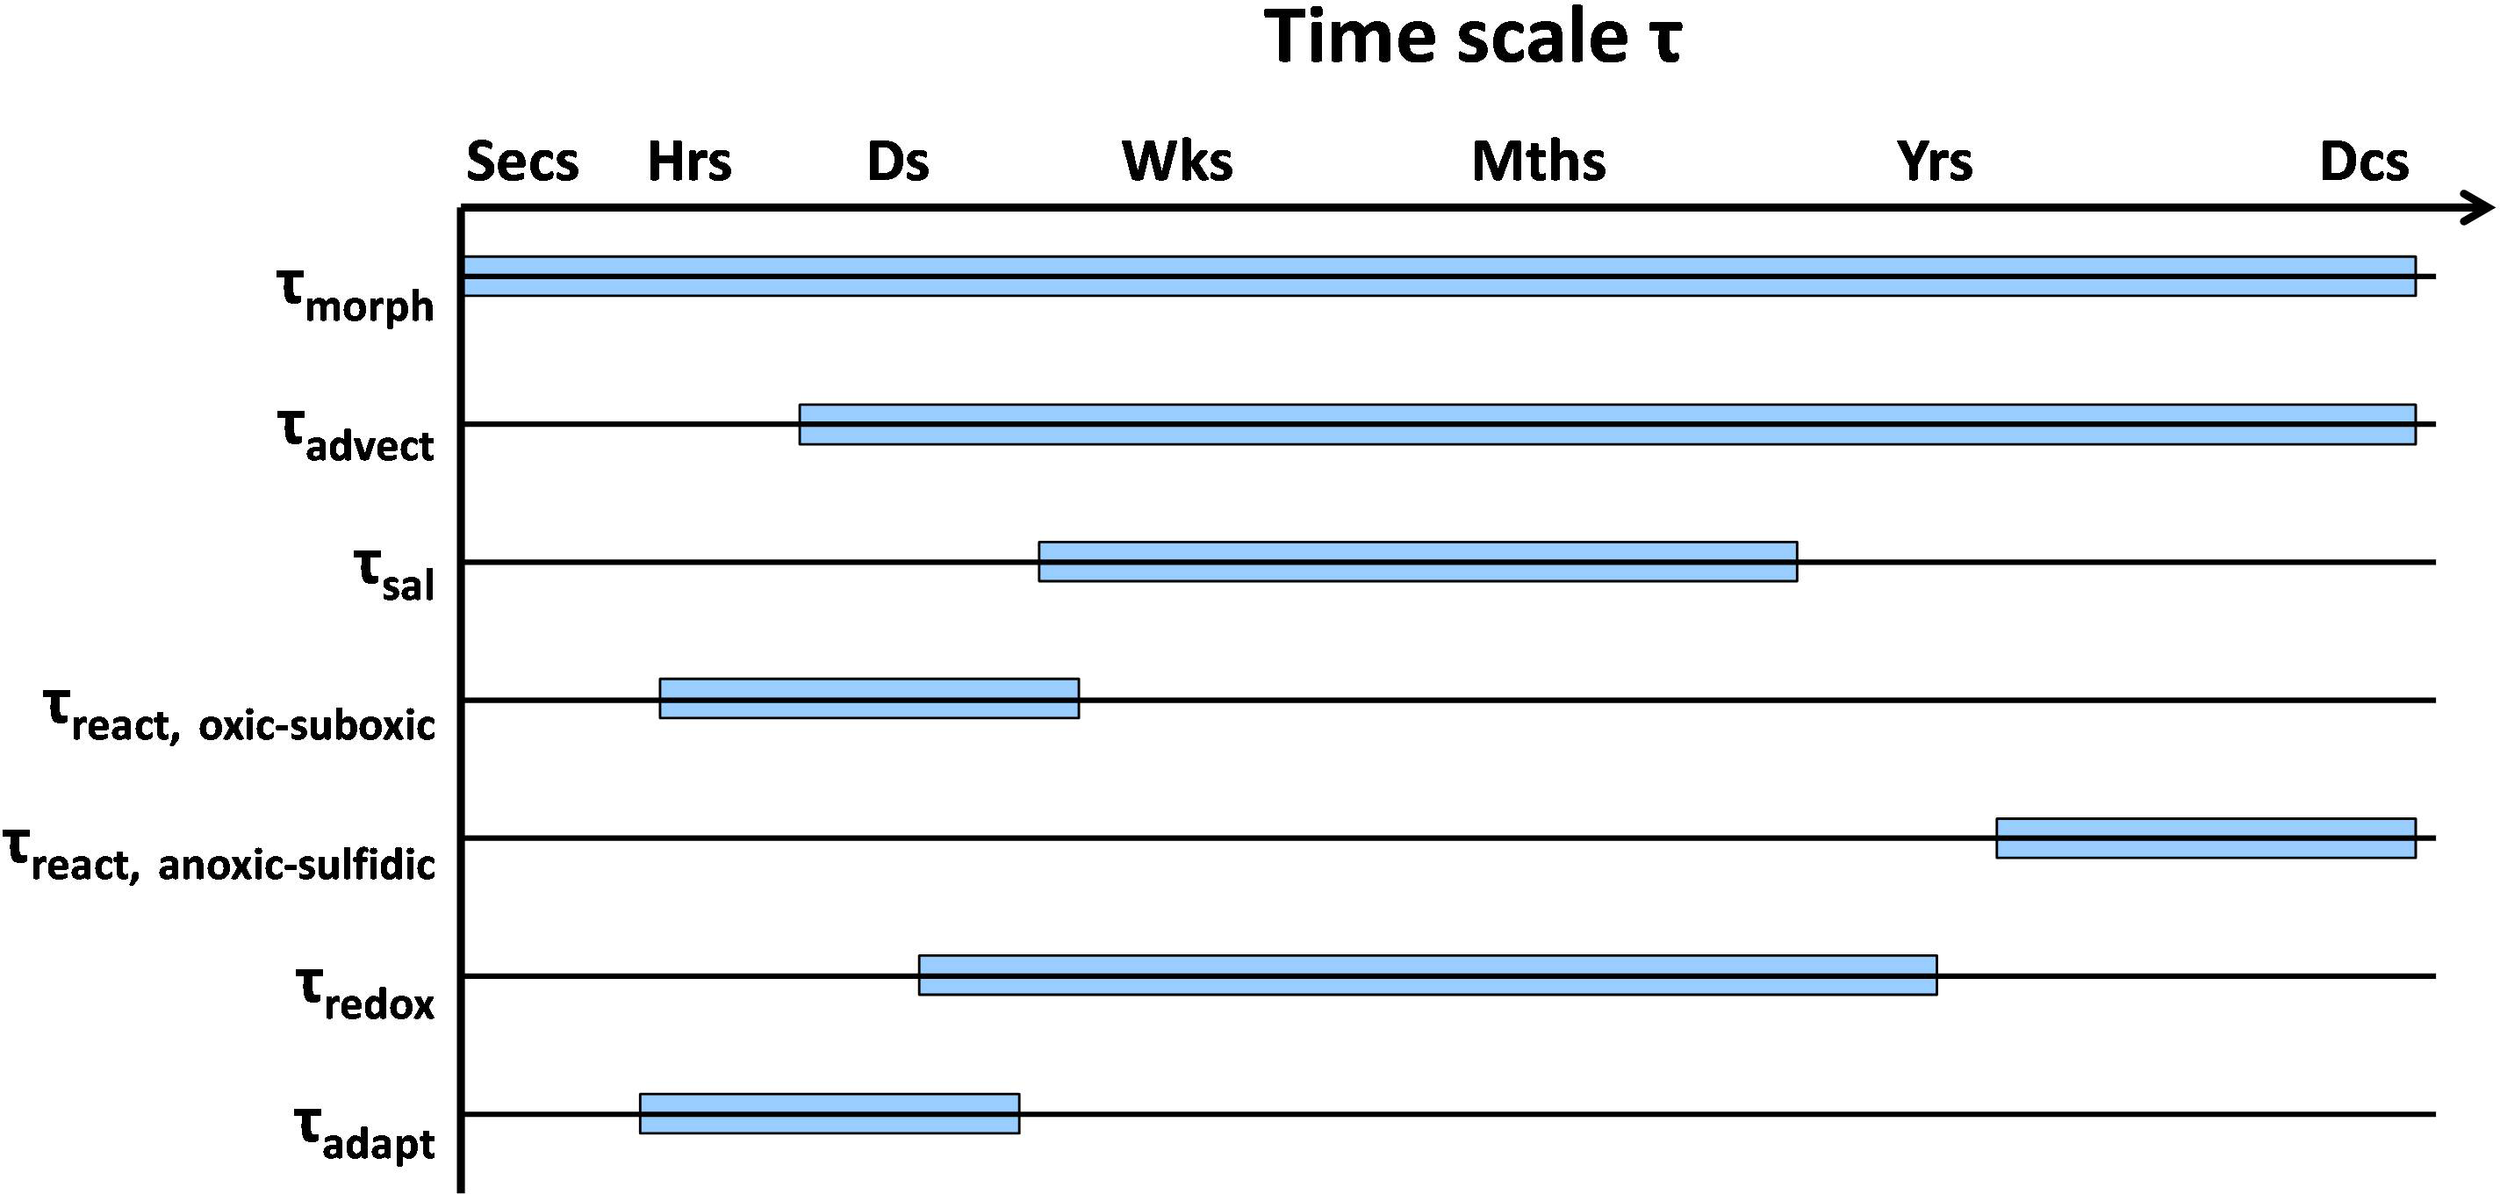
Expected time scales for the high-energy beach of Spiekeroog.
2.4 The DynaDeep observatory and research strategy
The DynaDeep STE observatory and research strategy was conceptualized to identify the temporal and spatial scales (Figure 4) of proposed flow and transport processes (Figure 1) as well as (bio)geochemical reactions and respective rates (Figure 3) as explained above. The DynaDeep approach combines regular beach sampling campaigns with permanent monitoring, off-site analytics, experimental work and numerical modelling. When referring to the DynaDeep STE observatory within this paper, emphasis is on the introduction of the permanent infrastructure and sampling events on site that will feed into the off-site ex-situ laboratory and modelling work.
The permanent infrastructure of the DynaDeep STE observatory as well as the envisaged locations for DP porewater sampling and electrical conductivity (EC) logging is illustrated in the conceptual Figure 2. A pole near the low water line continuously measures hydrodynamic and weather parameters. Beach and swash zone facing cameras mounted on the pole in combination with drone surveys provide high-resolution information on the tides, wave run-up and morphodynamics of the beach system. The groundwater salinity distribution is mapped regularly (approximately every six weeks) by DP vertical soundings accompanied by ground-based hydrogeophysics. Multi-level observation wells allow for regular groundwater sampling as well as sensor installation to generate high frequency time-resolved physical and hydrochemical data. During well installation, sediment cores were collected for microbiological, petrological and geochemical analyses as well as for laboratory experimental studies. A vertical electrode chain (SAMOS, see Grinat et al., 2010) complements regular 2D geophysical imaging and monitors electrical conductivities (as bulk ECs) in its surrounding with higher temporal resolution. A shipping container provides an information platform for the public and allows storage of equipment.
Quarterly DP sampling delivers dense spatial information of groundwater hydrochemistry as indicated in Figure 2 (crosses). A large suite of parameters is analyzed in the laboratory, ranging from environmental tracers, redox indicators and organic water constituents, trace elements and metal isotopes to microbial proxies and key-organisms. These regular sampling events are accompanied by additional campaigns depending on hydrological (e.g. tidal cycle, storm surge) and biological (e.g. algal bloom) boundary conditions in the scope of the project. Sediments are repeatedly retrieved with the DP to analyze geochemical rates and parameters as well as microbial community compositions and metabolic functions. Selected samples are transferred to the laboratory to be used for joint experiments. Numerical reactive transport modelling further uses field and laboratory data generated to simulate the transient groundwater flow and transport and accompanying hydrobiogeochemical processes that occur in high-energy beaches. The different infrastructural elements of the DynaDeep observatory in the field are listed in Table 1 and further explained in detail in chapter 4.
Table 1
| Element | Sensor/Parameter | Sampling type | Logging/sampling frequency |
|---|---|---|---|
| Pole | Camera Tidal wave recorder (sea-level) Weather station (wind speed, -direction, air temperature, -pressure, precipitation, illuminance) |
Pictures Logging |
Every 10 minutes 5 Hertz to 1 minute |
| Drones, GPS | Topography | Pictures, data | Every 6 weeks |
| SAMOS electrode chain | Electrical conductivity/salinity | Logging | Every 12 hours |
| Ground-based geophysics | Electrical conductivity/salinity | 2D imaging | Every 6 weeks |
| Push point locations | Electrical conductivity/salinity major ions, nutrients, redox indicators, organic water constituents, trace elements, metal isotopes, microbial proxies and key-organisms |
DP probing DP water sampling |
Quarterly Quarterly (alternating) |
| Observation wells | Pressure, electrical conductivity/salinity, temperature (all wells) Dissolved oxygen, nitrate, CDOM, FDOM (some wells) Major ions, nutrients, redox indicators, organic water constituents, trace elements, stable isotopes, microbial proxies and key-organisms |
Logging Logging Water sampling with pump |
Every 5 minutes Every 5 minutes Every 6 weeks |
| Sediment coring | Geochemical composition, mineral phases, microbial community structure, metabolic functions | Drilling by external company and DP | 2 deep cores and individual smaller campaigns |
| Container | Information platform and storage facility at the site | ||
Overview on elements of the DynaDeep observatory, sensors deployed/parameter analyzed, sampling frequencies and types of sampling.
3 Spiekeroog Island
The core field site of DynaDeep is located on Spiekeroog, a barrier island at the southern North Sea coast in North-Western Germany (Figure 5). Spiekeroog extends ~10 km in west-to-east direction and the maximum north-to-south extent is ~2.3 km. The island was chosen as the study site for several reasons: The north-facing beach is characterized by high-energy, meso-tidal conditions (tidal range ~2.7 m, WSV 2017) and exposed to predominant wave directions from northwest with mean significant wave heights of 1.4 m (Herrling and Winter, 2015). Moreover, since Spiekeroog belongs to the Wadden Sea National Park of Lower Saxony, the anthropogenic influence is relatively small, ensuring that a near-natural system is investigated. The site has the further advantage that it has previously been studied with regard to the shallow beach subsurface (e.g., Beck et al., 2017; Waska et al., 2019; Ahrens et al., 2020; Grünenbaum et al., 2020a; Ahrens et al., 2021; Waska et al., 2021; Grünenbaum et al., 2020b, Degenhardt et al., 2020; Degenhardt et al., 2021a, Degenhardt et al., 2021b) as well as the freshwater end-member (i.e., freshwater lens) underneath the island (Röper et al., 2012; Seibert et al., 2018; Seibert et al., 2019b; Reckhardt et al., 2021; Seibert et al., 2021), which is also used for local drinking water production (Figure 6).
Figure 5
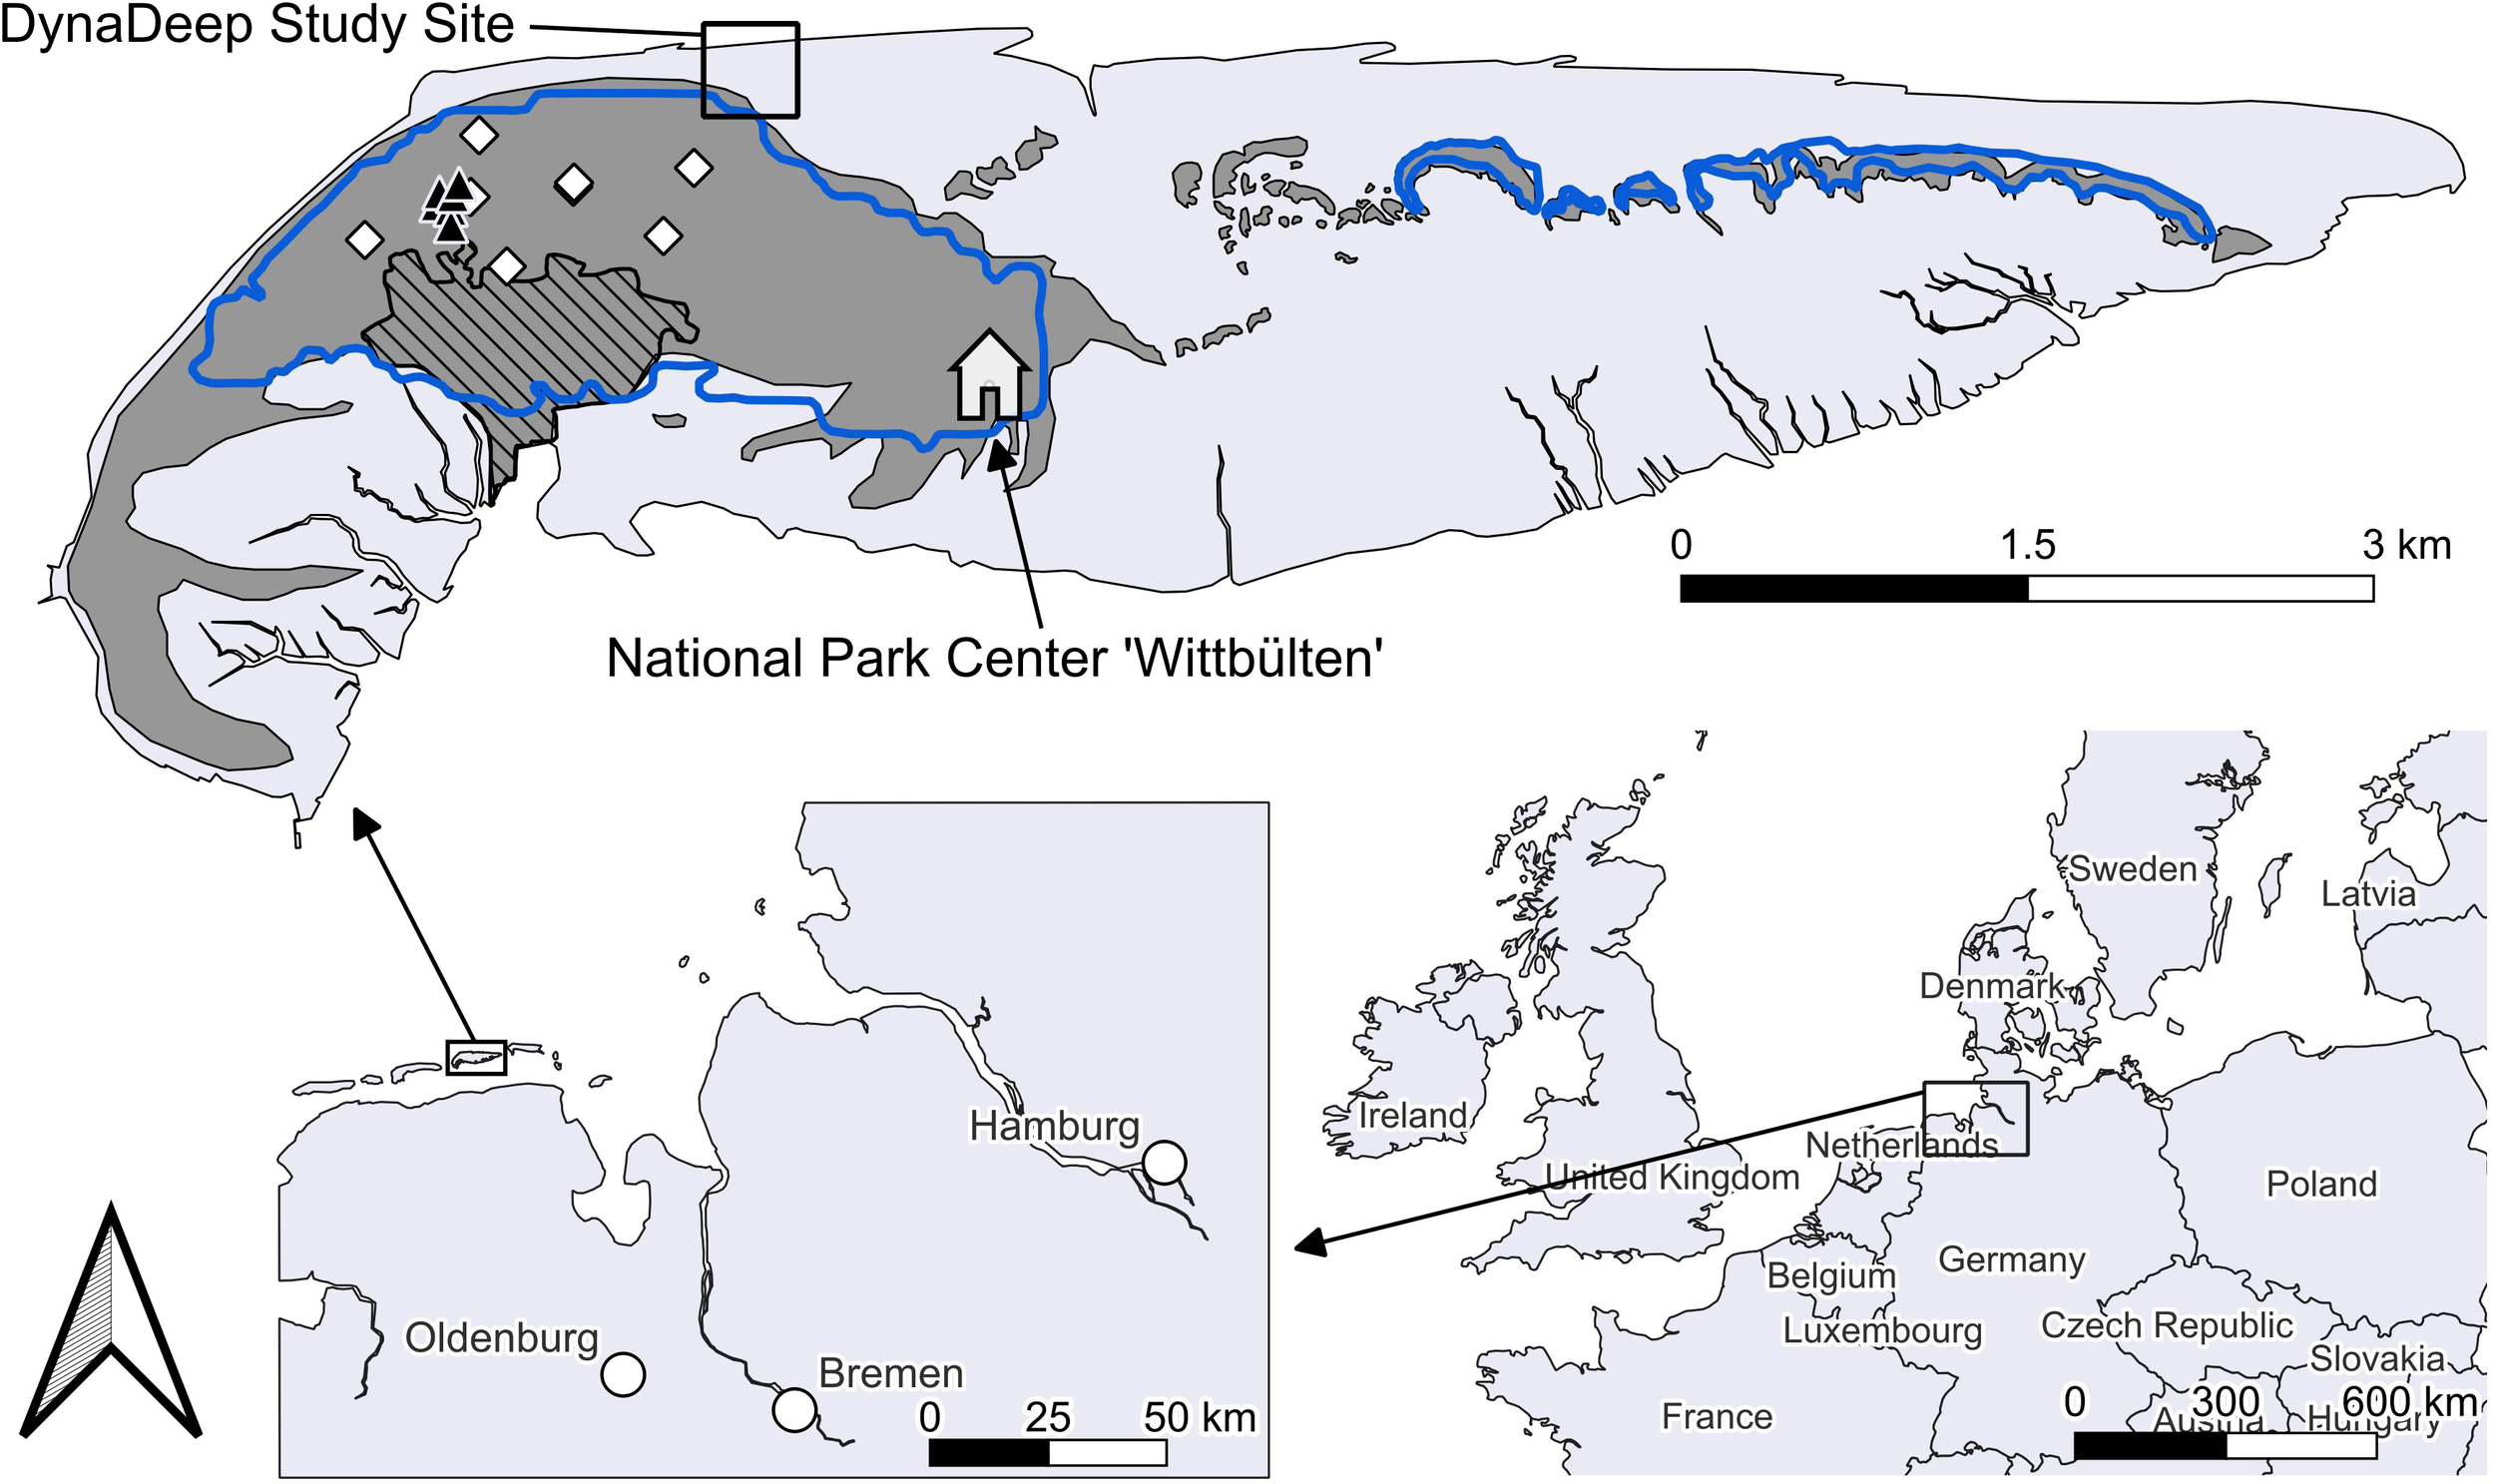
Map of Spiekeroog Island at the German coastline, featuring sandy dunes (dark grey areas, after Röper et al., 2013), urban areas (black hatched area) and the main freshwater lens in the west as well as developing young freshwater lenses in the east (blue lines, based on Tronicke et al., 1999 and Holt et al., 2017). Monitoring wells (white diamonds) and production wells (black triangles) are operated by the local water supplier and were sampled in groundwater studies by Röper et al. (2012), Seibert et al. (2018, 2019b) and Reckhardt et al. (2021). The DynaDeep study site (black square in top figure) is located at the northern beach.
Figure 6
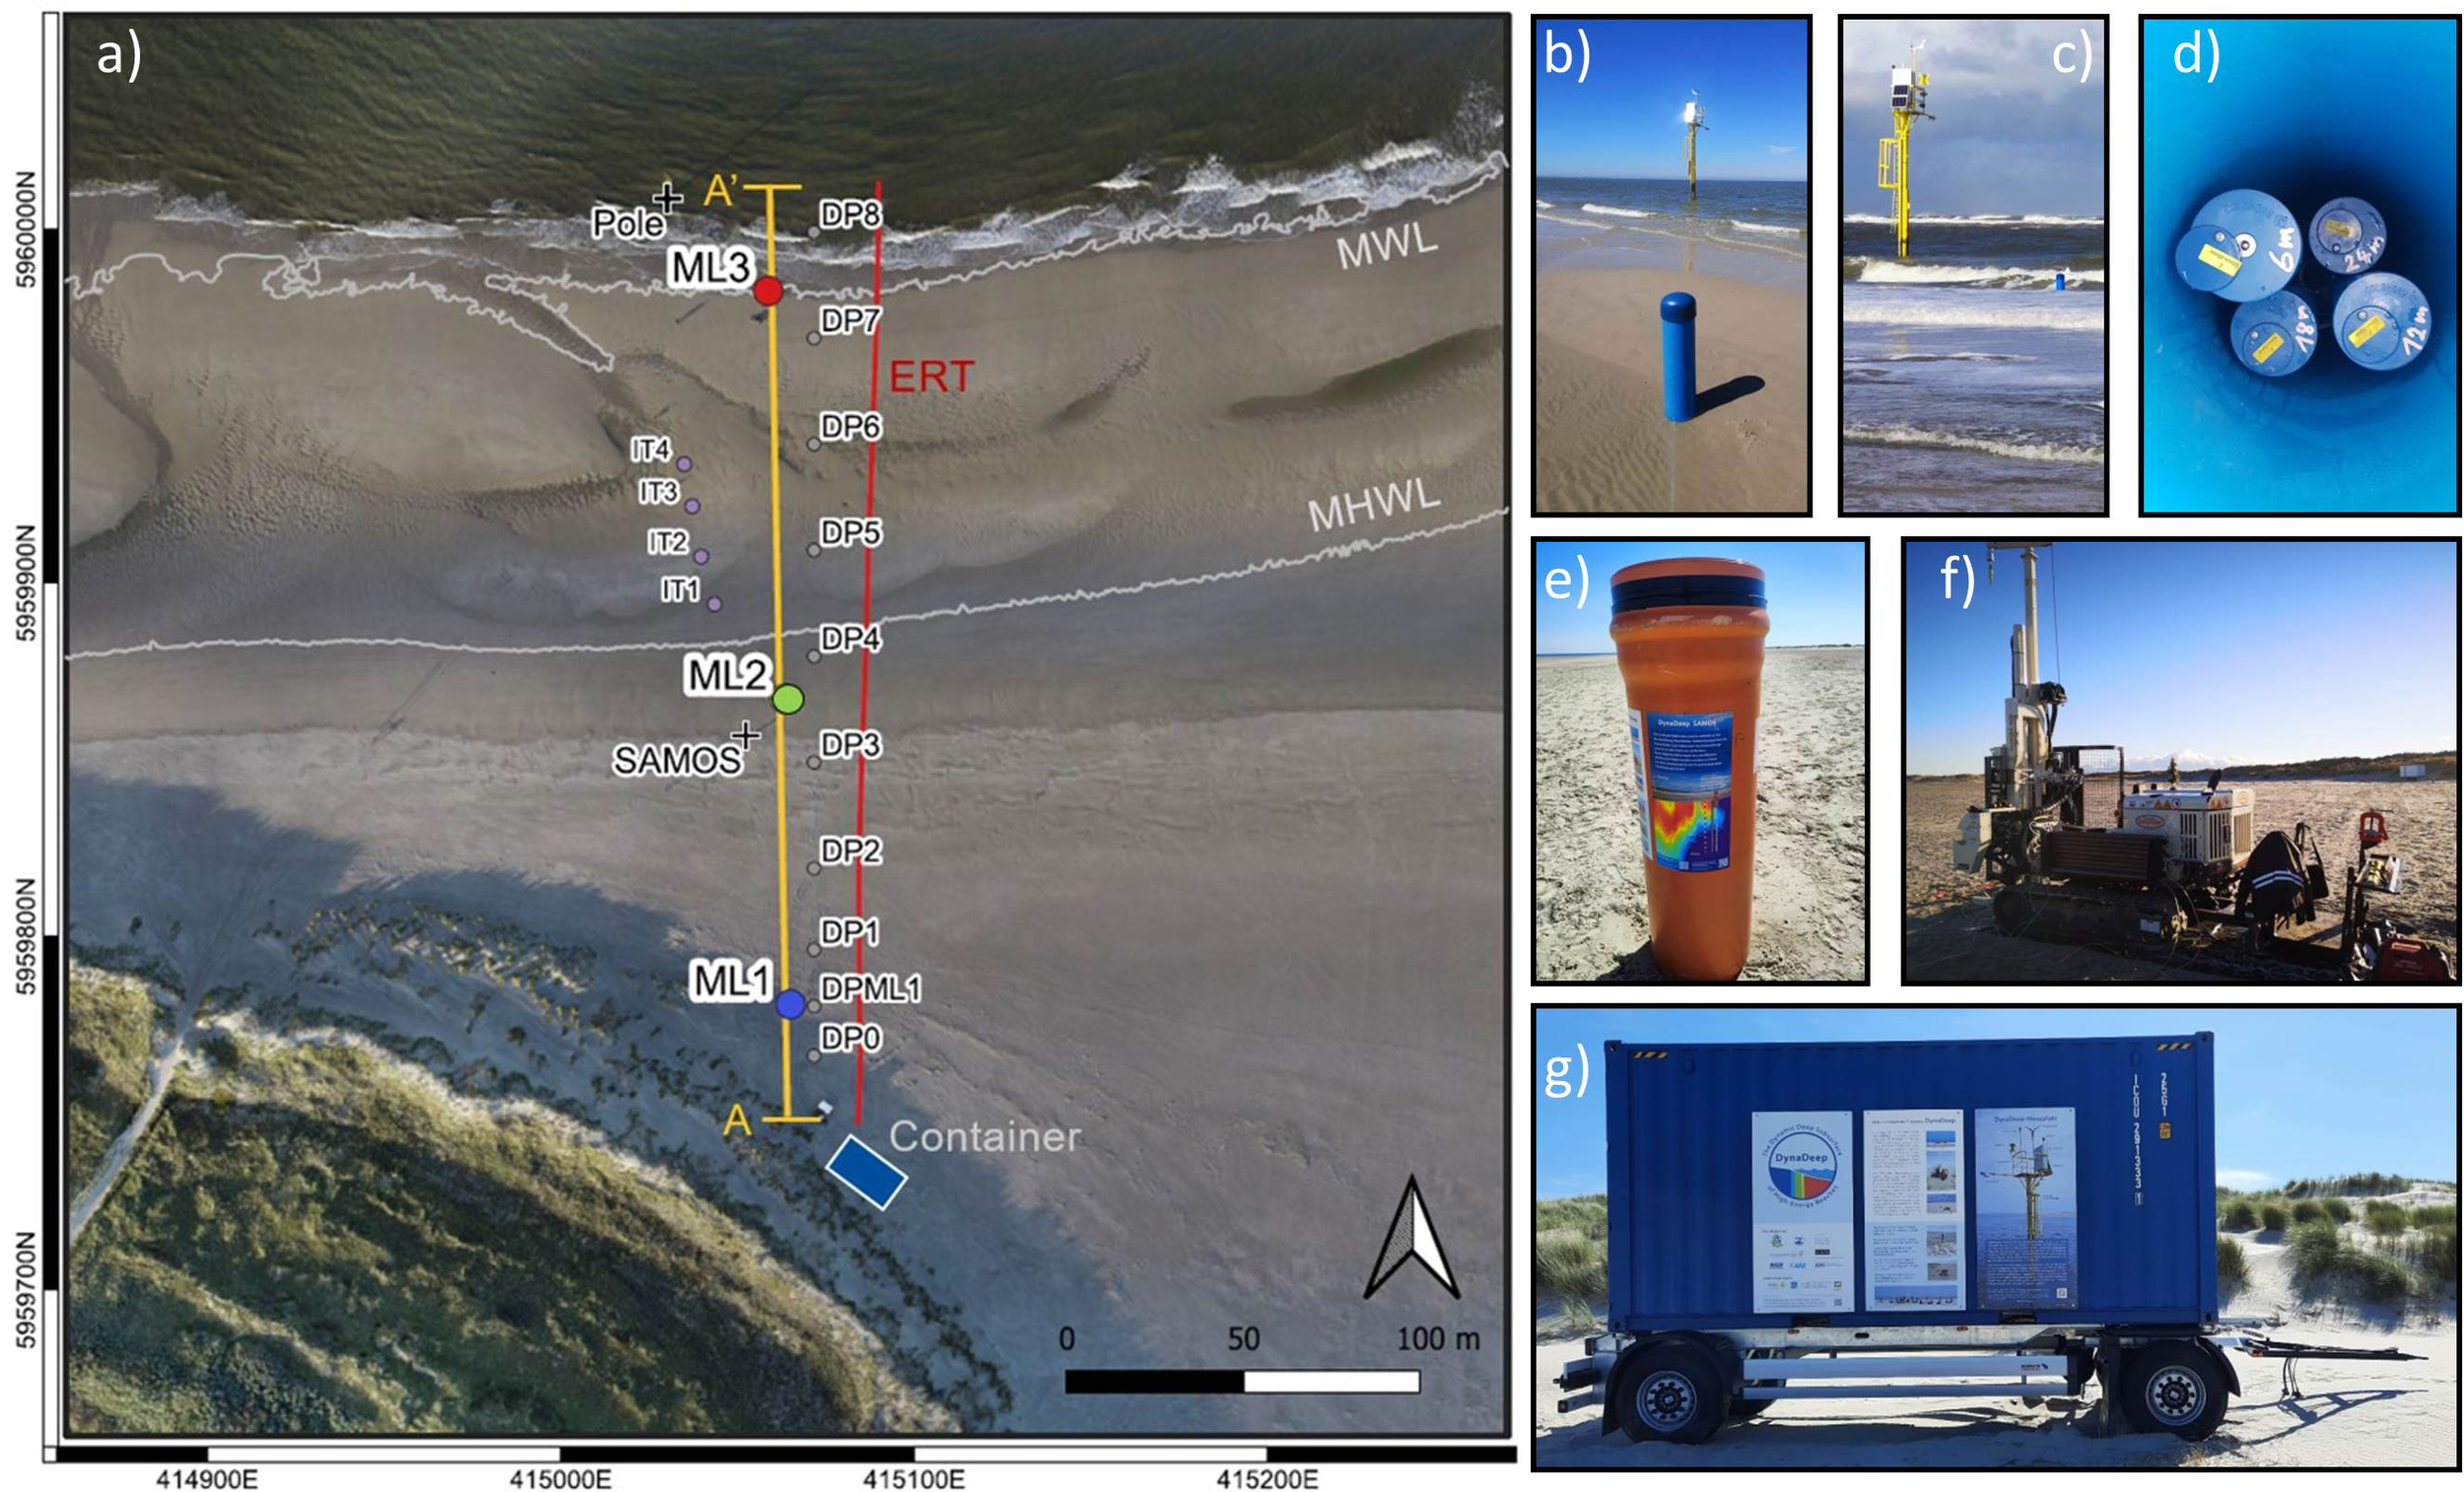
DynaDeep study site (compare inlet Figure 5) with location and images of permanent infrastructure: Pole (black cross in the water, B, C), multi-level wells ML1-ML3 (blue, green and red circles, B–D), SAMOS electrode chain (black cross, E), information platform/container (blue rectangle, G). Location of the regular campaign based measurements with the direct push (denoted DP, small circles in A, F), infiltration transect (IT) (May 2022), ERT profile location and drone flight area (A, entire area). The orthophoto in the basemap of the extent of the drone area was assembled from 503 drone images taken on 25.10.2022 at low tide at 4.44 pm and 70 m height. The position of the mean water line (MWL) and mean high water line (MHWL) on the beach on 25.10.2022 based on the ten year (2010-2020) water level average of the Pegel Wangerooge Nord (pegelonline, 2022) are indicated as white lines.
Marine and aeolian processes have strongly shaped and transformed Spiekeroog over the past centuries. Today, a dune arc with a succession of white, grey to brown dunes characterizes the central western inhabited part of the island (Pollmann et al., 2018, Figure 5). The eastern part, called ‘Ostplate’, evolved during the past decades and shows the formation of white and grey dunes as well as widespread saltmarshes (Röper et al., 2013). The geology of the island is dominated by fine- to coarse-grained sands, originating from Pliocene, Pleistocene and Holocene (compare Röper et al., 2012; Röper et al., 2013, and references therein). Locally, embedded layers of gravel, clay, peat and shales are found (Sindowski, 1970; Seibert et al., 2019a). A specific feature of Spiekeroog is a continuous clay layer that exists below the main dune area at approximately 40 mbsl (m below sea-level) with a varying thickness of 1.5 to 15 m (Röper et al., 2012).
The DynaDeep observatory forms part of the so called Spiekeroog Coastal Observatory (SCO), a scientific infrastructure that bundles all research elements on and around the island (Zielinski et al., 2022). The SCO is a long-term research site, which has been part of LTER-D (German Long-Term Ecosystem Research) since 2018. It is oriented towards interdisciplinary ecosystem-level research at the land-sea realm and combines physical, biological, and geochemical long-term observations as well as various project studies. Its infrastructure includes a Time Series Station in the tidal channel south-west of Spiekeroog that is part of the Coastal Observing System for the Northern and Arctic Seas (COSYNA) network (Baschek et al., 2017). The SCO has provided quality-controlled data of hydrographic and meteorological parameters within online databases since 2002 and will allocate important baseline information to DynaDeep. DynaDeep can also rely on experiences gained in relation to SCO’s role as an educational platform fostering the dialogue with the public, e.g. through exhibitions in the National Park Centre Wittbülten or various citizen science projects. While DynaDeep profits substantially from the LTER-D network and infrastructure, the SCO Spiekeroog LTER-D site is in turn further strengthened and complemented with the DynaDeep STE observatory. DynaDeep can hence build on a well-established network of local and regional partners such as the National Park Administration and the National Park Centre Wittbülten with its research infrastructure, including modern laboratory facilities and apartments for scientists on Spiekeroog.
4 Elements of the DynaDeep STE observatory
The DynaDeep sampling and monitoring network was successfully installed at the beach of Spiekeroog in 2022, thus creating a unique high-energy beach STE observatory. It consists of several elements that were introduced conceptually in Figure 2 and Table 1 and are presented in more detail in the following. In the supplementary, a video filmed from the drone during a DynaDeep campaign in August 2022 is provided, showing the groundwater wells (blue), the SAMOS electrode chain (orange), the DP drilling device, DynaDeep scientists at work and the drilling of ML3 from a ship that fell dry in the intertidal zone as well as the pole near the water line. Figure 6A is a map illustrating the final location of the different elements of the observatory at the study site at the northern beach of Spiekeroog (see square at Figure 5), with images of the pole (B, C), multi-level groundwater wells (B, C, D), SAMOS electrode chain (E), DP device (F) and information platform/container (G).
4.1 Pole, cameras and drones
The visual flagship of the DynaDeep measuring field is a ~7,5 m high pole located in the intertidal zone above the MLWL, which was constructed by the workshop of the coastal authorities of Lower Saxony (NLWKN). The steel pole has a diameter of 30 cm and a total length of 12 m up to the small platform (Figure 7). It was jetted into the sand to a depth of ~4.5 m from an NLWKN ship during high-tide. Powered by solar panels and a wind generator, an ultrasonic wave recorder provides measurements of water levels and wave heights. Also weather information (wind speed and –direction, air temperature, relative humidity, air pressure, precipitation amount and illuminance) is continuously collected, transmitted, and displayed on the project website. Beach cameras are mounted on the pole to derive high frequency information on the beach state (Blossier et al., 2017) and wave dynamics (e.g. Montaño et al., 2020). In combination with drones, terrestrial GPS surveys, and 3-D lidar measurements, the beach morphological and sedimentological states are monitored with high spatial and temporal resolution.
Figure 7
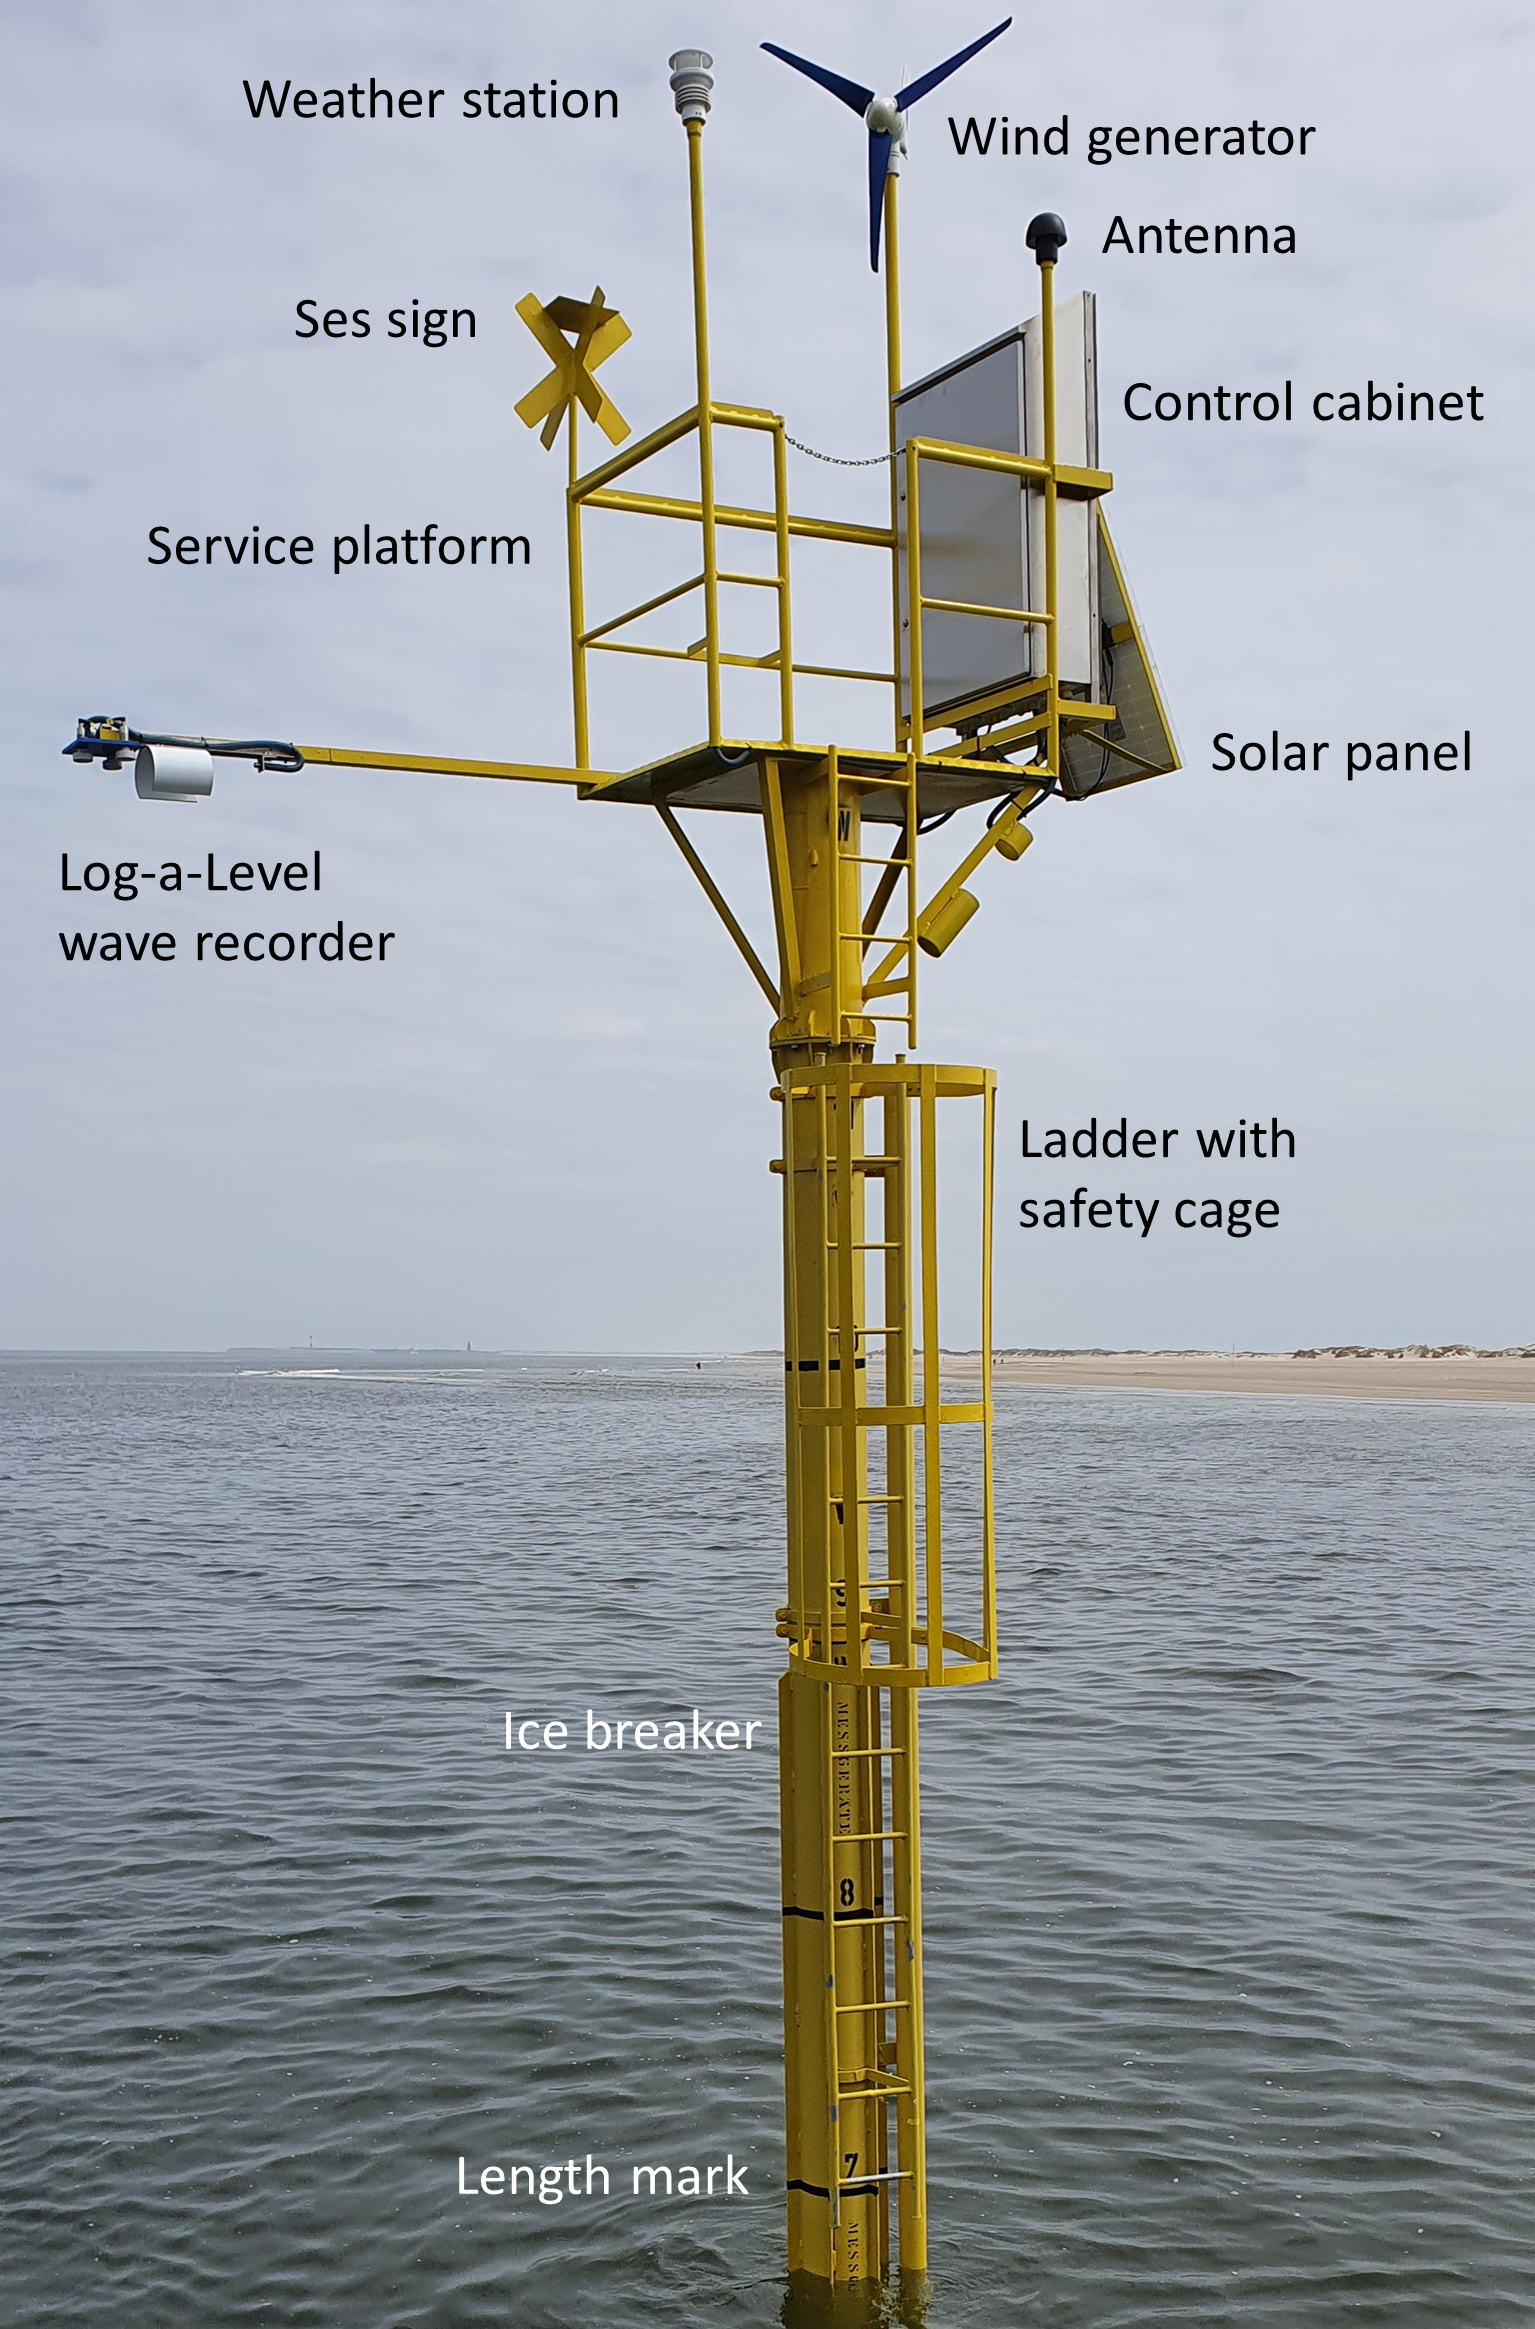
Technical elements of the pole.
Regular observations of the morphological and sedimentological state of Spiekeroog beach started in March 2022 after a preliminary campaign in December 2021. The beach topography data is retrieved from various sets of drone aerial images taken from 80 m height during (or close to) low tide (Figure 6). Each set of aerial images contains between 300 and 600 high resolution photos that are stitched together using photogrammetry software (Agisoft Metashape Pro). When meteorological conditions are unsuitable for drone flights, manual Real-Time-Kinematic (RTK) Differential GPS-surveys are performed for measuring beach profiles. Sediment samples are routinely taken from 10 spots distributed along the central transect (A-A’ in Figure 6, extended into the dunes) of the beach and analyzed for sedimentological parameters.
4.2 Sediment drilling, groundwater well installation and sampling
Three multi-level observation well nests (Figure 6D) were installed on the beach along a ~200 m long transect perpendicular to the shore (orange line A-A’ in Figure 6). One multi-level well nest was installed close to the dune base (ML1), one near the mean high water line (MHWL, ML2) and one near the mean water line (ML3), at the time of installation close to the mean low water line (MLWL) due to a rather steep slope of the lower beach at the time. Figures 6B, C show ML3 at low and high tide respectively. Each multi-level observation well nest consists of four separate observation wells made of PVC (ø 5.08 cm). The 1 m long well screens (slot size 0.3 mm) were placed at ~ 6 m, 12 m, 18 m and 24 m below the ground surface (mbgs) at the time at each location. During the well installation, the direct surrounding from ~0.5 m below to one meter above the filter screen was filled with filter gravel (ø 0.7-1.2 mm) followed by 1 m of bentonite on top to act as flow barrier. The remaining borehole was refilled with the ambient sand from drilling. An eight-inch PVC casing surrounds the well nests and protects the wells against destruction. At ML3, small holes were drilled into the bottom of the outer casing to avoid floating and to allow water to flow out of the casing when the tide falls. All individual wells are equipped with CTD data loggers to measure pressure, electrical conductivity (EC) and temperature (T; EC & T by Driesen & Kern GmbH, Pressure & T by Eigenbrodt GmbH & Co).
The well installation was carried out by a company with a rotary drilling rig (Nordmeyer DSB 1-6). ML1, ML2 and the SAMOS installation (see below) were drilled in May 2022 from land. For drilling of ML3 in the intertidal zone, a drilling ship was deployed (see video in Supplementary). The ship had two pole anchors that allowed it to move up and down with the tides while remaining on a stable position (see graphical abstract). For the drilling the same equipment as for ML1 and ML2 was used, whereby drilling was done through a hole at the bottom of the drilling ship. As weather conditions had to be very calm, drilling was performed later in August 2022, when conditions were feasible.
Prior to the installation of ML1 and ML2, a continuous 24 m long undisturbed core was taken at the respective sites by dry drilling following DIN EN ISO 22475-1. The core pieces of 1 m length (PVC liner, ø 10 cm) were directly transported to the laboratories of the National Park Centre Wittbülten on Spiekeroog using a hand wagon. Here, liners were cut into halves of 0.5 m each on the same day and sampled at the preserved middle part of the core piece. One sample aliquot was immediately added to 20% Zn-Acetate solution for later analysis of total reduced inorganic sulfur (TRIS) and sulfur isotopic composition. Another aliquot was kept frozen until freeze drying for subsequent bulk analyses and leaching experiments. Bulk geochemical analyses include total C and S, total inorganic C as well as the major and trace element composition. Additionally, 1 ml samples were taken for microbial cell count and community analysis and OM substrate characterization. For molecular analyses of microbial communities, the sediment was sampled with sterile cut-off syringes and frozen immediately at -20°C. Additionally, 2 cm3 of sediment were mixed with RNA-protect and frozen at -80°C. For cell counts 0.5 cm3 sediment were fixed in 1 ml glutardialdehyde (3%). After an incubation for one hour, the fixative was washed off and the samples were stored at -20°C before they were stained with SybrGreen and counted using epifluorescence microscopy. A further 2 cm3 of sediment obtained was fixed overnight at 4°C using 1.5% paraformaldehyde (PFA). Samples were cleaned three times using ethanol and sterile filtered seawater solution (1:1, v/v) and stored in the same solution at -20° C for later CARD-FISH analysis. 20 cm3 of sediment corresponding to the well depths were added into serum bottles, degassed with N2 and topped up with sterile-filtered-degassed pore water obtained from same depth and sampling location in order to determine nitrogen cycling, sulfate reduction and methane cycling rates using stable isotope tracers. The sediment cores were subsequently transported to the ICBM laboratories in Wilhelmshaven for further processing (see below).
Since well installation, groundwater from all 12 observation wells has been regularly sampled (in a 6-weeks interval) using a submersible pump (Eijkelkamp, Tauchpumpe “Gigant”). At each campaign, in-situ parameters are measured in a flow-through cell connected to the sampling tube and a WTW 3630 IDS multi-sensor device to avoid exposure to oxygen (O2). The obtained field parameters are EC, redox potential, O2 concentration and saturation, pH and temperature. Samples are preserved for further analysis in the laboratories, whereby nutrient, major ion/metal, Mo and Fe isotope/rare earth element (REE) samples are filtered through 0.2 µm polyethersulfone (PES) filters into cleaned HDPE bottles and preserved by acidification (metal/REE samples) and HgCl2 poisoning (nutrient samples), respectively. Samples for ion chromatography (IC) measurements of chloride and sulfate, and alkalinity titration are similarly filtered into high-density polyethylene (HDPE) vials and then kept cool and dark until analysis a few days after sampling. Water for concentration and isotope analysis of dissolved inorganic carbon (DIC) and nitrous oxide is preserved using HgCl2 and stored in glass vials. Water for concentration analysis of methane is preserved with copper chloride and stored in glass vials. H2S and S-isotope samples are added to polyethylene (PE) vials containing 5% Zn-Acetate solution and samples for water isotope analysis are filled into small glas vials. Water samples for quantification and molecular characterization of DOM are filtered (pre-combusted glass fiber filters, Whatman GFF, 0.7 µm) and acidified to pH2 (HCl, ultrapure grade). For molecular analyses of the microbial communities and for cell counts 600 ml porewater are sampled. Samples are transported to the laboratories for further analysis (see below).
4.3 SAMOS and ground-based geophysics
The saltwater monitoring system (SAMOS) developed by the Leibniz Institute for Applied Geophysics (Grinat et al., 2010) quasi-continuously measures the bulk EC just above the MHWL by means of a 20 m long vertical electrode chain (Figures 6, 8). The measurements allow depth-differentiated monitoring of the groundwater salinity (Ronczka et al., 2020) and thus provide information on the location of the saltwater-freshwater interfaces, but are restricted to a single location. Contrarily, surface ERT allows for 2D imaging, but is limited in vertical resolution. An ERT cross-shore transect (see red line in Figure 6) is measured every six weeks using a multi-electrode instrument with 2 electrode chains of each 32 electrodes, evenly spaced in 2.5 m distance (Figure 8). The use of a multi-gradient array (Dahlin and Zhou, 2004) allows the 320 m long layout to penetrate the subsurface down to a depth of about 40 m.
Figure 8
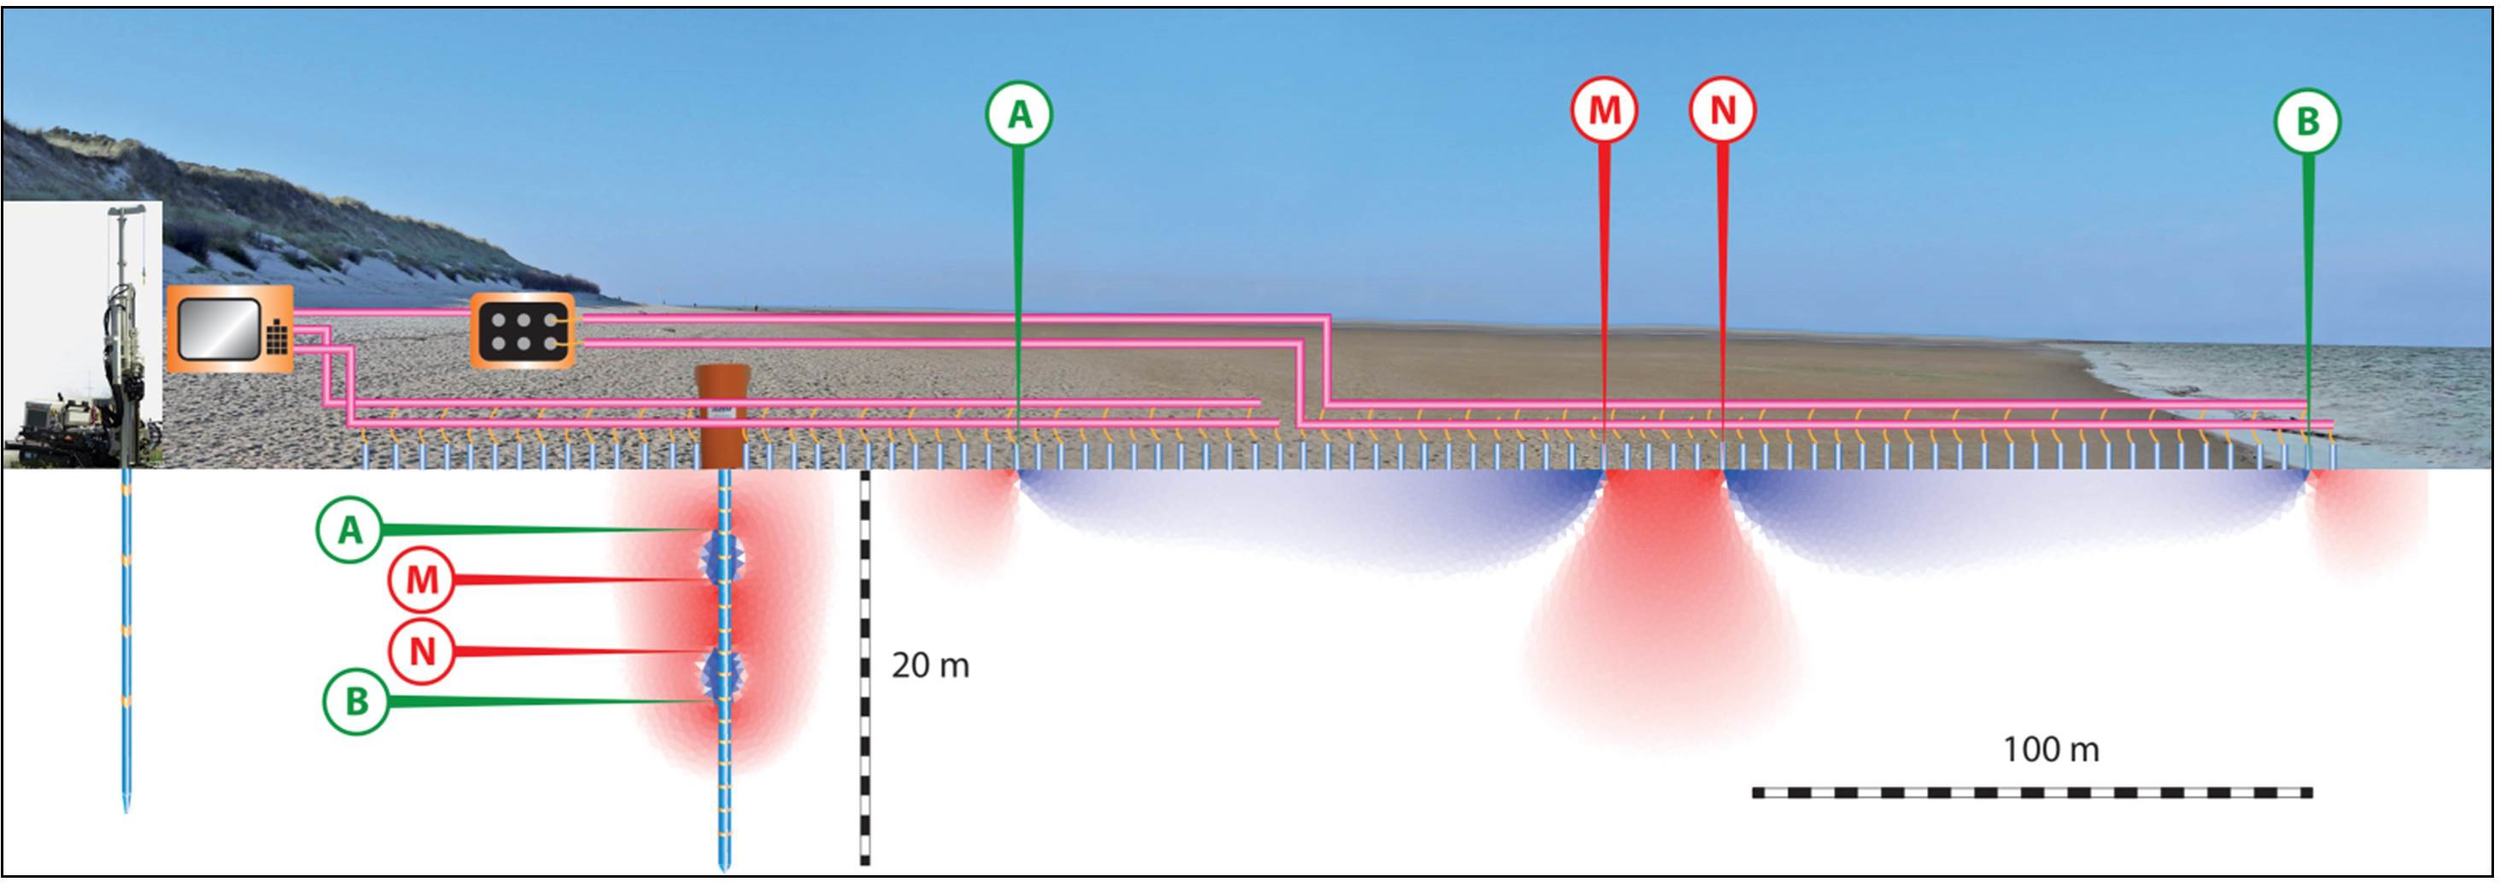
Schematic view of the geophysical measurements along the cross-shore transect (Figure 6), illustrated by exemplary sensitivity distributions: SAMOS installation (daily sequence) for depth probing with 20 cm electrode spacing, surface ERT layout with 128 electrodes spaced 2.5m along with DP probe lowered in 5 cm steps (6-week sequence). A and B denote current injection, M and N potential electrodes.
The data analysis is described in more detail in Grünenbaum et al. (2023), presenting a pre-study for the DynaDeep project at the same location. Geostatistical operators (Hermans et al., 2012) are used for regularizing the inverse problem of reconstructing the EC distribution from the number of about 3000 to 4000 single measurements. DP data are used to constrain the model and improve the reliability of the subsurface image, particularly at greater depths where resolution is low (Wunderlich et al., 2018).
4.4 Direct Push scientific drilling, bulk EC logging and groundwater sampling
A 7822DT drilling device from Geoprobe® (Figure 6F) was purchased from the European Geoprobe® distributor based in Belgium to be stationed on the island to enable regular sampling events throughout the project. It is a mobile drilling device capable to carry out a wide range of measurements, perform sediment samplings and enable the construction of small groundwater wells by either hammering or auger drilling. The DynaDeep DP drilling device runs on rubber tracks, has a Kubota four-cylinder turbodiesel engine, can be equipped with a variety of gear for the desired application, and is operated mainly autonomously. It was modified to be able to pull a small car trailer with additional material on the beach. As Spiekeroog is part of the Wadden Sea National Park, special requirements apply for drilling, e.g. the hydraulics had to be converted to the use of biodegradable oil.
For the DynaDeep project, the following four systems are applied: Probes for EC and HPT (Hydraulic Profiling Tool) measurements as well as groundwater and sediment sampling systems. The focus of the regular field campaigns in the DynaDeep project is on EC measurements and groundwater sampling, alternately performed every six weeks. With the help of the DP, groundwater samples are taken at regular (mostly 3 m) intervals to depths of up to 24 m, and continuous depth profiles of EC are recorded in ~ 15 cm steps. Compared to the permanently installed groundwater monitoring wells, the DP enables depth-differentiated sampling that is spatially flexible, but does not allow for continuous data logging.
The extraction of the groundwater is done with the GWP 1.75’’ probe and is adjoined to 4 feet long single rods. The probe has a length of 10 cm with 20 openings protected by steel screens. It operates with a 2-way hose system with one inlet for flushing and one outlet for sampling. Flushing is necessary to avoid clogging of the filter screens during drilling. Distilled water is constantly pumped through the probe during hammering and used to ensure a large contrast to the surrounding medium. Around 50 L of distilled water are needed for the sampling of one station over 24 m. Before porewater sampling, flushing is stopped and the flow reversed. Usually, around 2 L are pumped until the EC has reached a constant value to ensure that uncontaminated ambient groundwater is sampled. Groundwater samples are processed for further analyses in the same way as those taken from the permanent wells (see above).
For bulk EC measurements, the probe is connected via a cable to a separate control unit. The probe is checked for functioning before and after each measurement within predefined parameters. It measures the voltage between two poles about 10 cm apart and relates this voltage to the incoming voltage. This divergence is used to calculate the resistance and thus the corresponding bulk EC of the surrounding medium. The DP vertical soundings in combination with ground-based hydrogeophysics (see above) thus allow the temporal and spatial localization of the dynamic saltwater-freshwater interfaces in the subsurface.
Furthermore, depth-differentiated sediment samples with a length of 4 feet and a diameter of 1.4 inch can be obtained with the drilling device. Rods with 2.25’’ diameter are required for sediment sampling. Sampling is done only at the bottom of the targeting depth. To reach the required depth without contamination, an inner-rod is placed into each outer-rod. Only at the last step the inner-rod is left out to obtain the desired sample. Sediment sampling is only done in specific campaigns, mainly to retrieve fresh sediment for experimental work (see below).
4.5 Surface sediment sampling at the infiltration zone
Surface sediments of the infiltration zone are sampled every two months. Along four locations (IT1-4, Figure 6) and down to 1 m depth O2 distribution, O2 consumption rates and total organic carbon (TOC) content as a function of morphodynamics, POM filtration efficiency and seasonal changes of sea water O2 and particulate organic carbon (POC) concentrations are determined. Groundwater samples are extracted from shallow depths using porewater lances, followed by determination of O2 concentrations in a flow through cell (Pyroscience OXFTC). Additionally, continuous in-situ measurements are carried out using sensor probes (Pyroscience OXROB/OXROBSC) buried for several tidal cycles. Sediment from the infiltration zone is retrieved by first removing and sampling 5 cm layers by hand down to 15 cm depth and thereafter by inserting a 90 cm long push core (3.5 cm diameter) down to 1 m depth. Sediments are sampled for chemical and grain size analysis as described below and further used to conduct O2 consumption rate measurements on the same day.
4.6 Information platform/container
A standard 20’ high cube (HC) container is stationed at the dune base on the beach from April to October and at Wittbülten from October to April during the storm season. Loading rails allow for the DP to drive into the container for safe storage between campaigns. Additional equipment like a ladder to reach the pole and geophysical equipment are also stored in the container. Three large panels at the outside of the container give information on the project partners, the project itself and the pole (Figure 6G). A QR code provides a link to a section of the DynaDeep webpage with brief information in plain language for the public (https://uol.de/en/icbm/dynadeep/summary). Similar information on the project and the SAMOS electrode chain is available at its outer orange casing all year round (Figure 6E). In addition, the container serves as a meeting point for the half-hour “beach walks” that regularly accompany the field campaigns and are led by a researcher from the DynaDeep team. These walks are part of the public outreach measures of the project and are announced online and in the local newspaper.
4.7 Ex situ sample processing and analytics
The sediment cores retrieved during well installation were cut open and described geologically at the ICBM laboratories in Wilhelmshaven in summer 2022. Samples were taken from the cores in accordance to sediment layering. Samples are analyzed for grain size and particle shape distribution at Christian-Albrechts-University Kiel (CAU) grainsize laboratory. For bulk sediment analyses, freeze-dried sediments are homogenized in an agate mill. Total C, and S and inorganic C are then determined using the CS analyser CS580 (Eltra). Total organic carbon is calculated as the difference between total C and total inorganic C. The total major element composition is determined by x-ray fluorescence analysis on glass beads. Sediment leaching (0.5 M HCl, 1 h; Kostka & Luther, 1994) and total digestion produce solutions, which are analyzed for major and trace element and DOM composition with the same analytical techniques as outlined for groundwater samples below. Total reduced inorganic sulfur (essentially pyrite) is analyzed spectrophotometrically after chemical extraction (Cline, 1969; Fossing and Jørgensen, 1989), and δ34S is determined by means of gas mass spectrometry as described by Koebsch et al. (2019). Furthermore, SEM-EDX is used for sediment mineral identification and imaging at Leibniz Institute for Baltic Sea Research (IOW, Böttcher et al., 2012).
Additionally, shallow sediment samples are regularly taken in the infiltration zone (infiltration transect, Figure 6) and analyzed for TOC, chlorophyll a, labile iron(II) and C/N. For TOC analysis, the samples are dried (60°C), ground and acidified (HCl 20%) and TOC content is measured in a CS analyzer (Eltra CS 800). For chlorophyll a determination, an extraction with acetone is performed and the concentration in the extraction solutions is determined spectrophotometrically (Jeffrey and Humphrey, 1975). The labile Fe fraction is extracted with 0.5 M HCl (Voelz et al., 2019). Iron(II) and the total extracted Fe is measured spectrophotometrically using an improved Ferrozine method (Viollier et al., 2000). Further, for C/N analysis, the fine fraction of the sediments is washed out with purified water and filtered onto 0.7 µm GF/F filters. C/N content of the fine fraction is analyzed in a CHNSO analyser (Hekatech Euro EA).
The preserved groundwater samples retrieved from the observation wells and the DP are further processed and analyzed for a large suite of parameters. Major ions, Si, Mn and Fe are measured at the ICBM, Oldenburg, by inductively coupled plasma optical emission spectrometry (ICP-OES, Thermo Fisher Scientific). Cl- and are determined in the laboratory by a Metrohm 883 ICplus ion chromatograph. Nitrogen species (NOx, , ) are measured by photometric methods using the Multiscan GO Microplate Spectrophotometer (Thermo Fisher Scientific) and the EasyChem Plus discrete analysers (AMS-SYSTEA) and the methods described by Schnetger and Lehners (2014) and Benesch and Mangelsdorf (1972), respectively. Total alkalinity is determined by acid titration (Reckhardt et al., 2015).
Further, trace metals, REE and P are measured with a triple quadrupole inductively coupled plasma mass spectrometer (ICP-MS, Thermo Fisher Scientific). To decipher respective processes leading to transformations, isotope fingerprinting (δ56Fe, δ98Mo) complement element analyses in porewater and sediments. Mo and Fe isotopes are analyzed by multi-collector inductively coupled mass spectrometry (MC-ICP-MS) at GEOMAR, Kiel and ICBM, Oldenburg, respectively. At IOW, dissolved sulfide is measured spectrophometrically (Cline, 1969), stable O and H isotopes are measured via cavity ring-down spectroscopy (Böttcher and Schmiedinger, 2021), the concentration and stable isotope composition of dissolved inorganic C by means of gasbench-gas mass spectrometry coupling (Winde et al., 2014), and the S and O isotopes of dissolved SO4 is done on precipitated BaSO4 as described by Koebsch et al. (2019). Dissolved organic carbon (DOC) and total dissolved nitrogen (TDN) are quantified through high-temperature catalytic oxidation using a Shimadzu TOC-VCPH instrument with a nitrogen unit at ICBM. The molecular composition of DOM is characterized via ultra-high-resolution Fourier-transform ion cyclotron resonance mass spectrometry at ICBM (FT-ICR-MS; Seidel et al., 2015). Stable and radiocarbon isotopes (δ13C and Δ14C) of DOM in selected samples further delineate sources and transformations of OM (Beck et al., 2017) and are analyzed via isotope ratio mass spectrometry (Finnigan MAT 253 IRMS) at IOW, and accelerator mass spectrometry (mini carbon dating system, MICADAS) at the Alfred-Wegener-Institute (AWI) Bremerhaven, respectively. Microbiological methods include the quantification of microbial cells and next-generation sequencing of 16S rRNA genes and transcripts, accompanied by metagenome and -transcriptome analyses to identify metabolic functions. In the laboratory, 57.6 ml porewater are fixed with 2.4 ml glutardialdehyde (25%) and frozen at -20°C after an incubation of 1 hour. 250 ml porewater are filtered with polycarbonate filters with 0.1 µm pore size (pre-filtered with 3 µm pore size) and the filters are frozen at -20°C for a subsequent DNA extraction. Filtration is repeated likewise and the filters are stored in RNA-protect at -80°C for RNA-extraction.
4.8 Rate measurements and experimental laboratory work
In order to better constrain how processes, rates and microbial communities change in response to the varying biogeochemical conditions caused by the movement of saltwater-freshwater and redox interfaces, various additional ex-situ experiments are conducted. For example, sediment is incubated in flow through reactors (FTRs); in these systems porewater flow and therefore solute concentrations/redox concentrations through the sediment can be tightly controlled and manipulated to observe biotic and abiotic responses. The ability to resample sediment via DP drilling and obtain porewater from multiple locations means that such experimental work can be carried out in an iterative fashion.
At shallow depths, the first steps of the redox cascade (O2, , and Mn and Fe oxide consumption) and temperature fluctuations are expected to be more relevant, whereas we assume that conditions will generally be more reducing (anoxic, sulfidic) due to net microbial sulfate reduction with little temperature changes at greater depths (Greskowiak et al. submitted). Salinity fluctuations are, however, expected throughout the entire STE (Greskowiak and Massmann, 2021). Experiments are first conducted to determine steady-state rates as base-line information and later to investigate transient conditions. We hypothesize that rates will be higher at shallow depths and lower in the deep subsurface. At depth, conventional FTRs may be impractical, as to see a change between the inlet and outlet, either very long retention times or very long cores would be needed. Therefore, so-called slurry incubations are used instead. The various planned incubation setups are depicted in Figure 9.
Figure 9
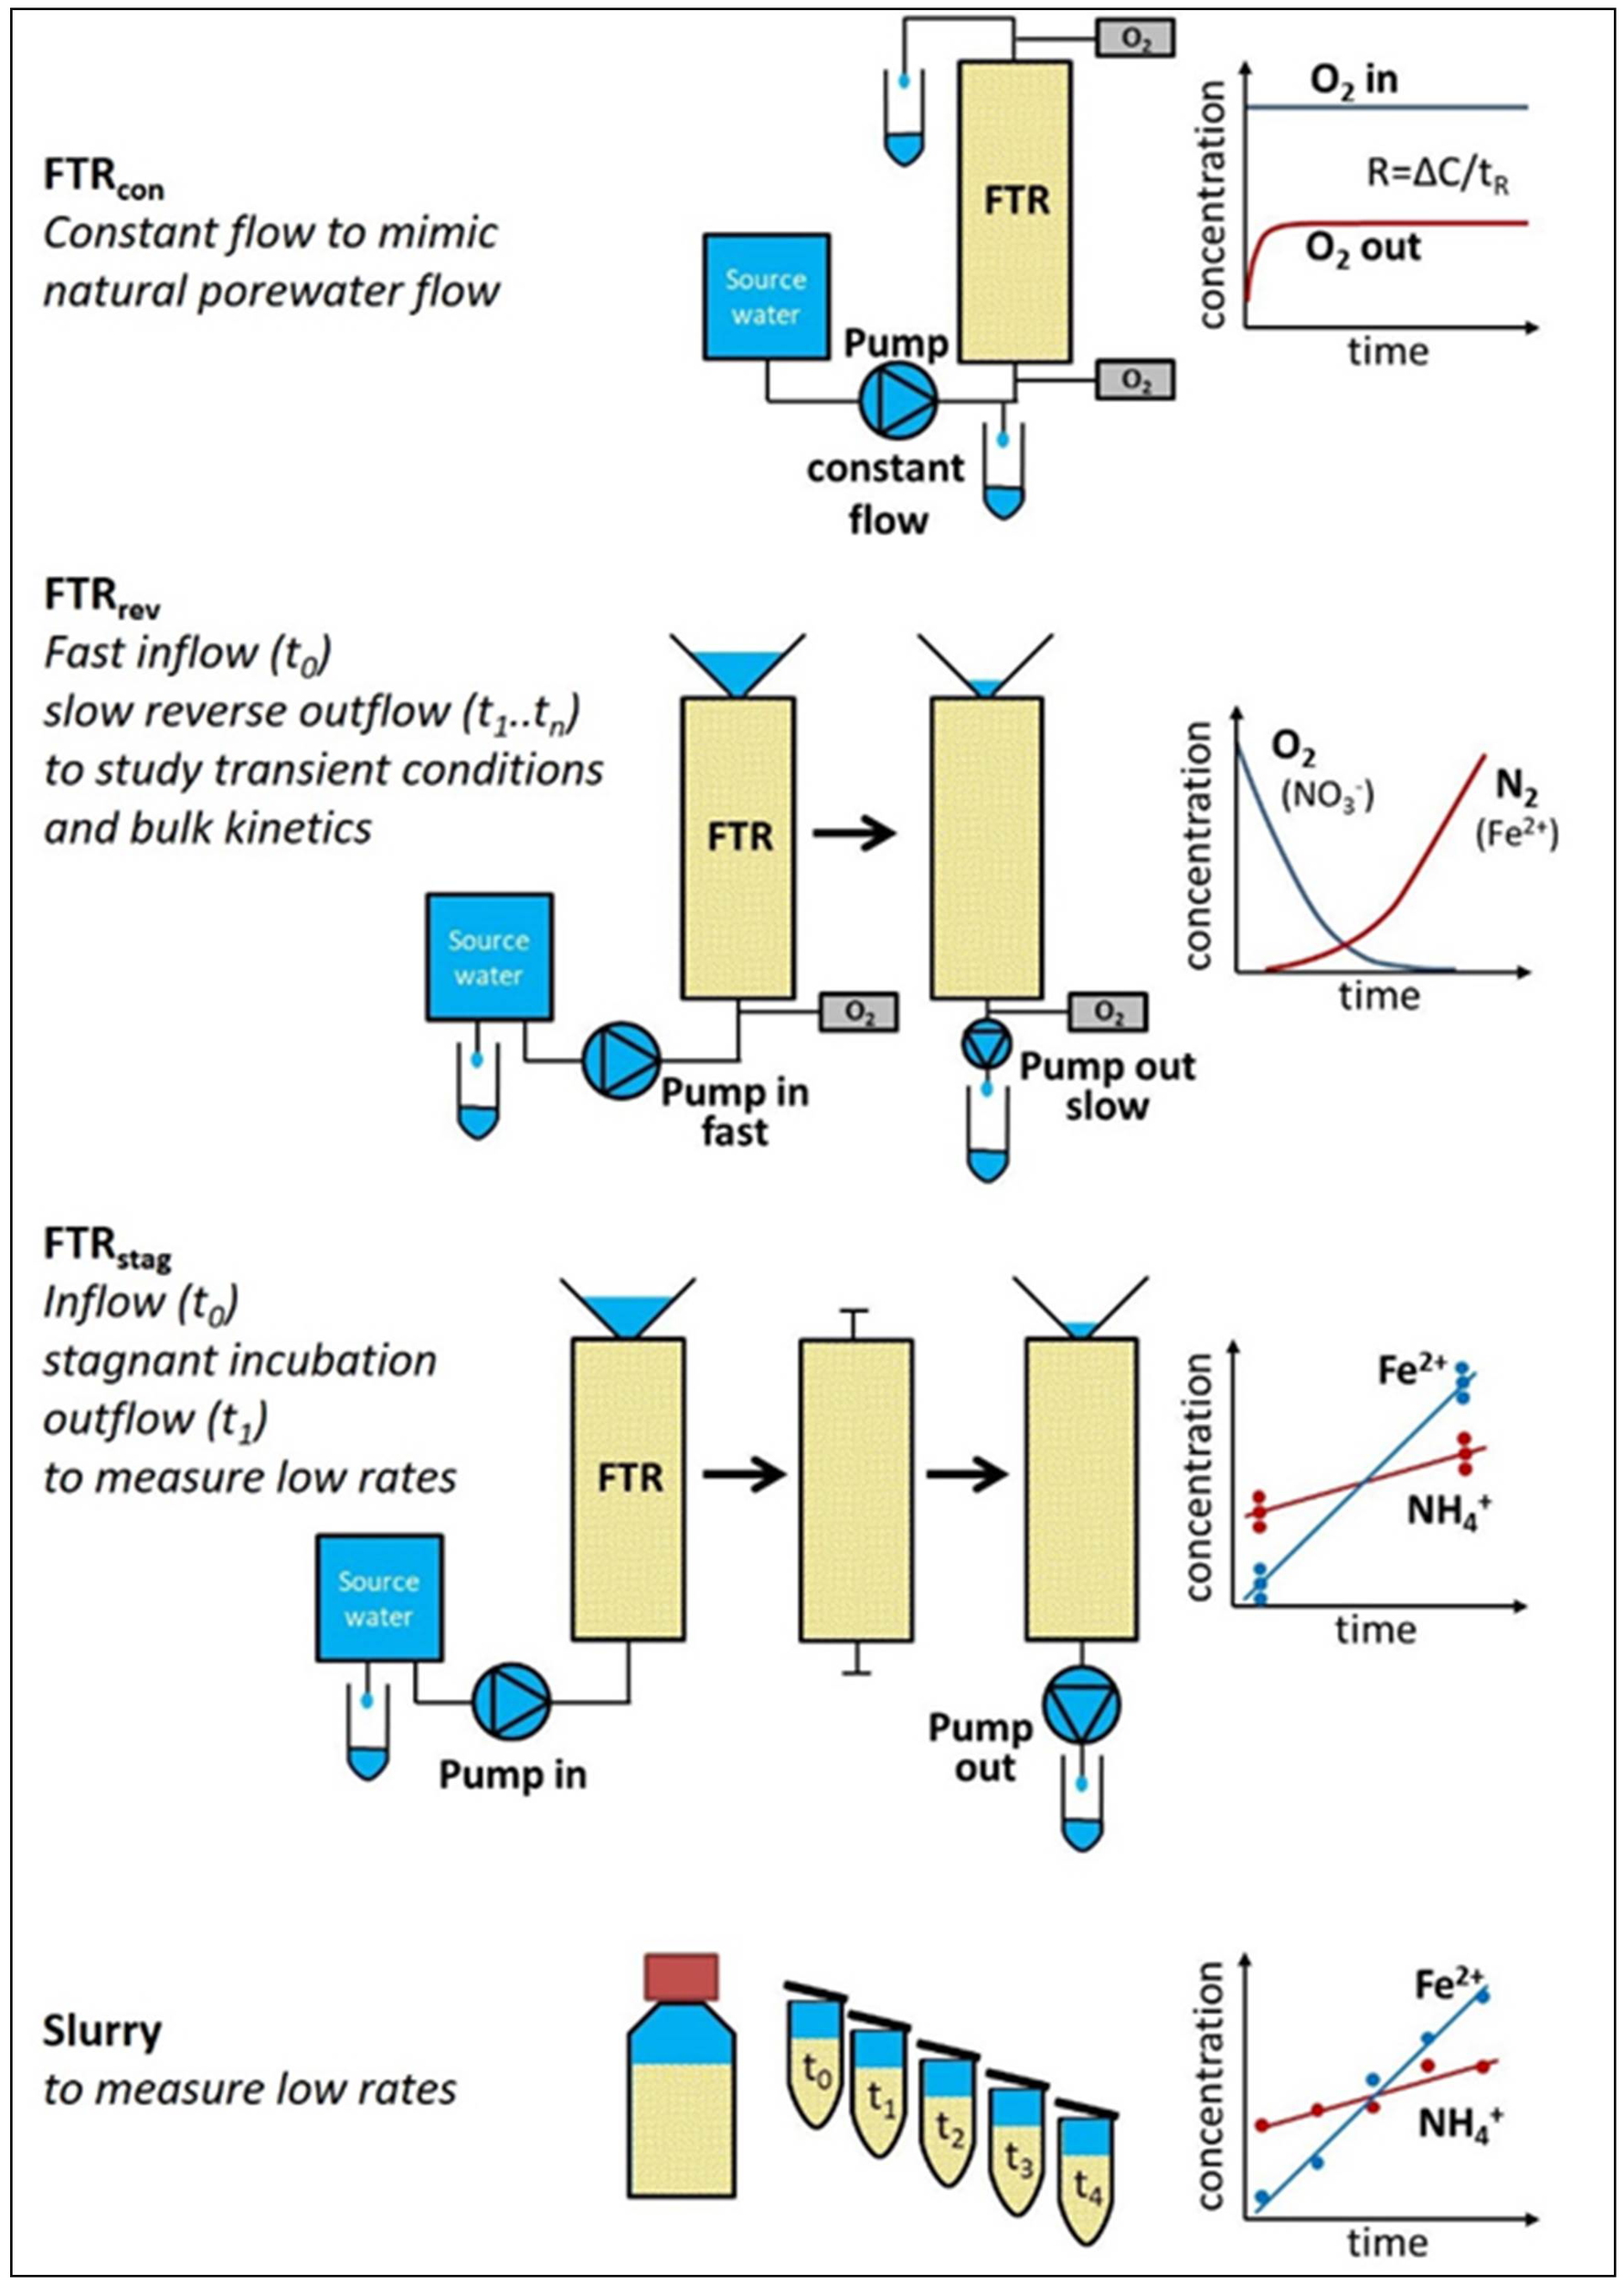
Overview on different incubation setups for experimental determination of transformation rates. O2 is measured with optodes.
FTR with constant flow through (FTRcon) is the typical setup to measure microbial reactions under constant advective conditions. Ambient porewater is continuously pumped through the FTR filled with permeable sediment from the field site to reach realistic flow velocities. The concentration difference between inlet and outlet and the residence time of the water in the FTR determine the reaction rate (Rao et al., 2007). For FTR with reverse flow (FTRrev) permeable sediment is rapidly flushed with water to produce similar initial redox conditions throughout the sediment column. The change in concentration over time is subsequently measured in subsamples slowly extracted by reverse pumping. In FTRrev, reaction rates can be determined as a function of bulk concentrations, which allows studying especially the overlapping consumption of different electron acceptors (Marchant et al., 2014). FTR for stagnant incubation (FTRstag) is envisaged for deeper sediments where rates are expected to decrease by several orders of magnitude. In order to detect such low rates, the retention time of the porewater in the FTR has to be greatly increased. Here, FTRs are first flushed with ambient water and then sealed for the time of the incubation, which may last up to several days. To prevent O2 contamination, sealed FTRs are placed in degassed water. After incubation, the altered porewater is retrieved quickly which minimizes O2 contamination. Lastly, sediment is transferred to vials for slurry incubations, topped with groundwater from the same depth and incubated. Subsamples are taken over time. When low rates are expected, the time intervals can be up to several days. Unlike FTR incubations, the liquid and solid phases are not separated. Slurry incubations are thus recommended when also the solid phase needs to be processed as in case of sulfate reduction rate measurements (Røy et al., 2014).
First experimental results reported on below were conducted to compare aerobic respiration rates from flow through reactors (FTRcon and FTRrev, Figure 9) and slurry incubations. Experiments were conducted with sediments retrieved from shallow depths taken at the infiltration transect (Figure 6A) in May and August 2022. The top 15 cm were subsampled in 3 horizons (0-5, 5-10 and 10-15 cm) and incubated with 0.2 µm filtered air-saturated seawater at temperatures of 21-24°C. For slurry incubations, sediments (6-8 ml) were filled into gastight vials (Labco Exetainer® 12 ml) equipped with O2 sensor spots (Pyroscience, OXSP5) and incubated in duplicate (May) or triplicate (August) in the dark on a rotating wheel to mimic natural groundwater flow. The FTR setup and incubations are described in detail in Ahmerkamp et al. (2020). In short, FTRs (diameter: 9 cm) were filled with sediment up to a height of 18 cm. Flow was driven by a peristaltic pump (ISMATEC, Reglo ICC 4408) generating porewater velocities from 16-70 µm/s. O2 concentrations at the in- and outlet of the cores were measured in flow through cells (Pyroscience, TOFTC2). For each sediment layer, duplicate experiments were conducted. In the FTRcon setup, incubations were performed at 3 different porewater velocities and rates were determined from steady state O2 readings at in- and outlet (Figure 9, FTRcon). In the FTRrev setup, incubations were performed under non-steady state conditions by feeding the reactor with air saturated seawater under fast porewater velocities (1 mm/s, pump: Masterflex L/S) and subsequently extracting the porewater by slow reverse pumping (5-6 µm/s).
4.9 Flow and reactive transport modelling
SEAWAT (Langevin et al., 2008) is first applied to simulate density dependent groundwater flow and transport, whereby due to the complexity of the system, the expectation is rather to replicate general patterns than exact data matching. The code PHT3D (Post & Prommer, 2007) is further used to simulate the transient biogeochemical processes. Numerical reactive transport modelling builds on field and laboratory data obtained from the site and is essential for the integration and interpretation of DynaDeep results. It allows for validation of the developed working hypotheses on the overall functioning of the deep STE biogeochemical reactor. For example, the effect of morphodynamics on subsurface flow and transport was previously tested in a model by Greskowiak and Massmann (2021). It was further transferred into a reactive transport model simulating the primary terminal electron acceptor processes, aerobic respiration, and nitrate, iron and sulfate reduction (Greskowiak et al. submitted) before depth-resolved field data was even available. This was done in order to obtain an up-front estimate of the redox change time-scales τredox within the STE depending on the various dynamic boundary conditions. Modelling hence also guided the planning of experiments and field campaigns at an early project stage by conducting preliminary simulations. Modelling of experiments further allows for a transfer of the experimentally derived parameterization to the field scale model. The implementation and parameterization of processes is constantly updated and revised based on the new findings to mimic real-life conditions as best as possible.
5 First results from the Spiekeroog high-energy beach
5.1 Hydrodynamics and meteorology
The measuring pole provides a stable fixing point in seven meters height above the beach surface for high resolution field observations. High resolution data of the sea level is now available, together with the local meteorological parameters (Figure S1). Preliminary data of water level and wave climate show the main characteristics of the tidal environment, and a wind driven wave climate. Data is made available online in real-time on the project webpage. Water level predictions from the nearby water level gauge at Wangerooge North are added in real-time on an internal webpage, which is important to plan accessibility for sampling events in the intertidal zone.
5.2 Beach morphodynamics
So far, the orthophotos from field campaigns throughout 2022 (Figure 10A) reveal only small changes in terms of coastline fluctuations. From March to October, when mostly fair-weather conditions prevailed, the shoreline retreated between 10-15 m within the high-resolution flying area. The integration of drone and satellite images show the eastward migration and subsequent attachment (in September 2022) of a spit that was first documented in March 2022 (Figure 10B). The area where the spit was initially located gained +45% of sand when comparing the respective imagery, broadening the intertidal zone at that specific section (Figure 10C).
Figure 10
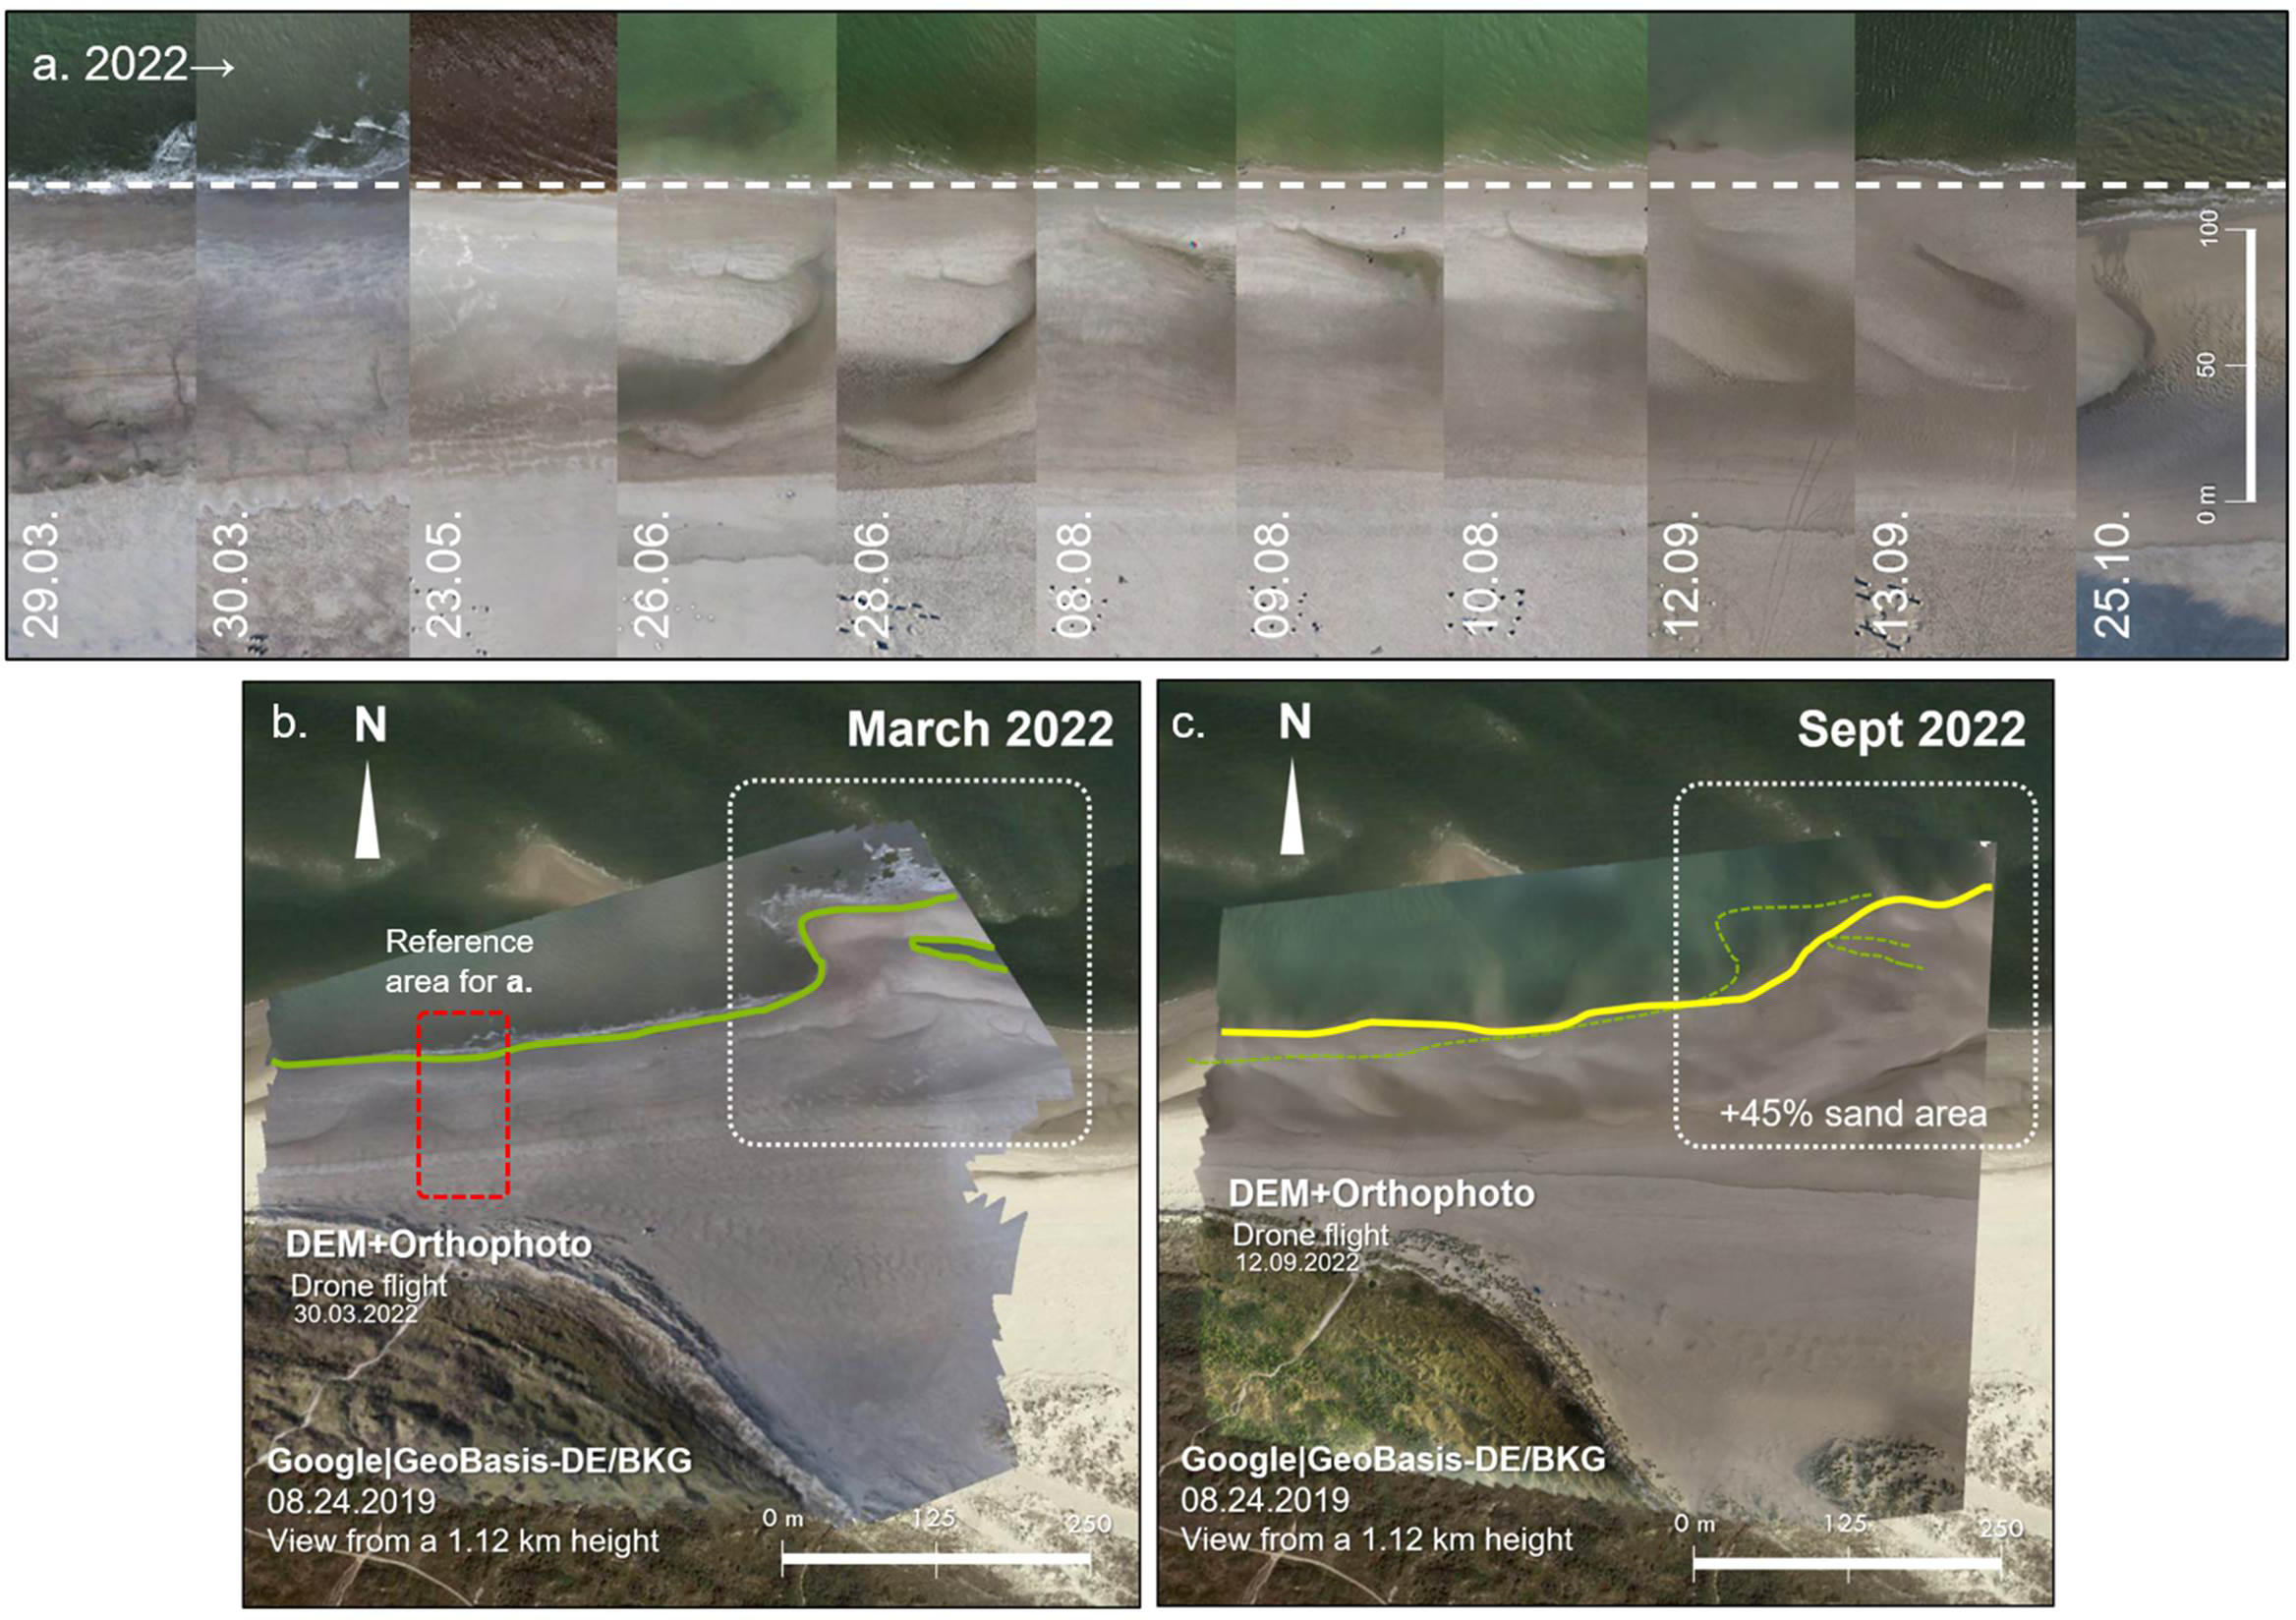
(A) Study area orthophotos from 29.03.2022 to 25.10.2022; (B, C) Integrated orthophotos and satellite images from March and September 2022 showing the coastline evolution at the DynaDeep site and the spit attachment.
Besides, dynamics of ridge-runnel systems on the beach were observed (Figure 11). These appeared for the first time in the orthophotos from June 2022, with two well-formed major channels within the intertidal zone. They started to dissipate in August and September 2022, developing a beach with a more uniform long-shore and cross-shore configuration. The two channels reappeared before the October field campaign, but shifted their position to the west. The beach profile (Figure 11E) from the central transect (similar to A-A’ Figure 6 but extended to the dunes) from June 2022 shows a ~0.5 m beach ridge (at +280 m) that belongs to one of the ridge-runnel systems displayed in Figure 11A. This feature was gone after two months (by September 2022, Figure 11C) due to the channel dissipation and migration. During that period, the beach sand was redistributed, generating a flatter slope in the intertidal zone (a slightly more dissipative profile caused by waves, currents, and tides), and sediment accretion in the backshore and the dunes resulting from aeolian processes.
Figure 11
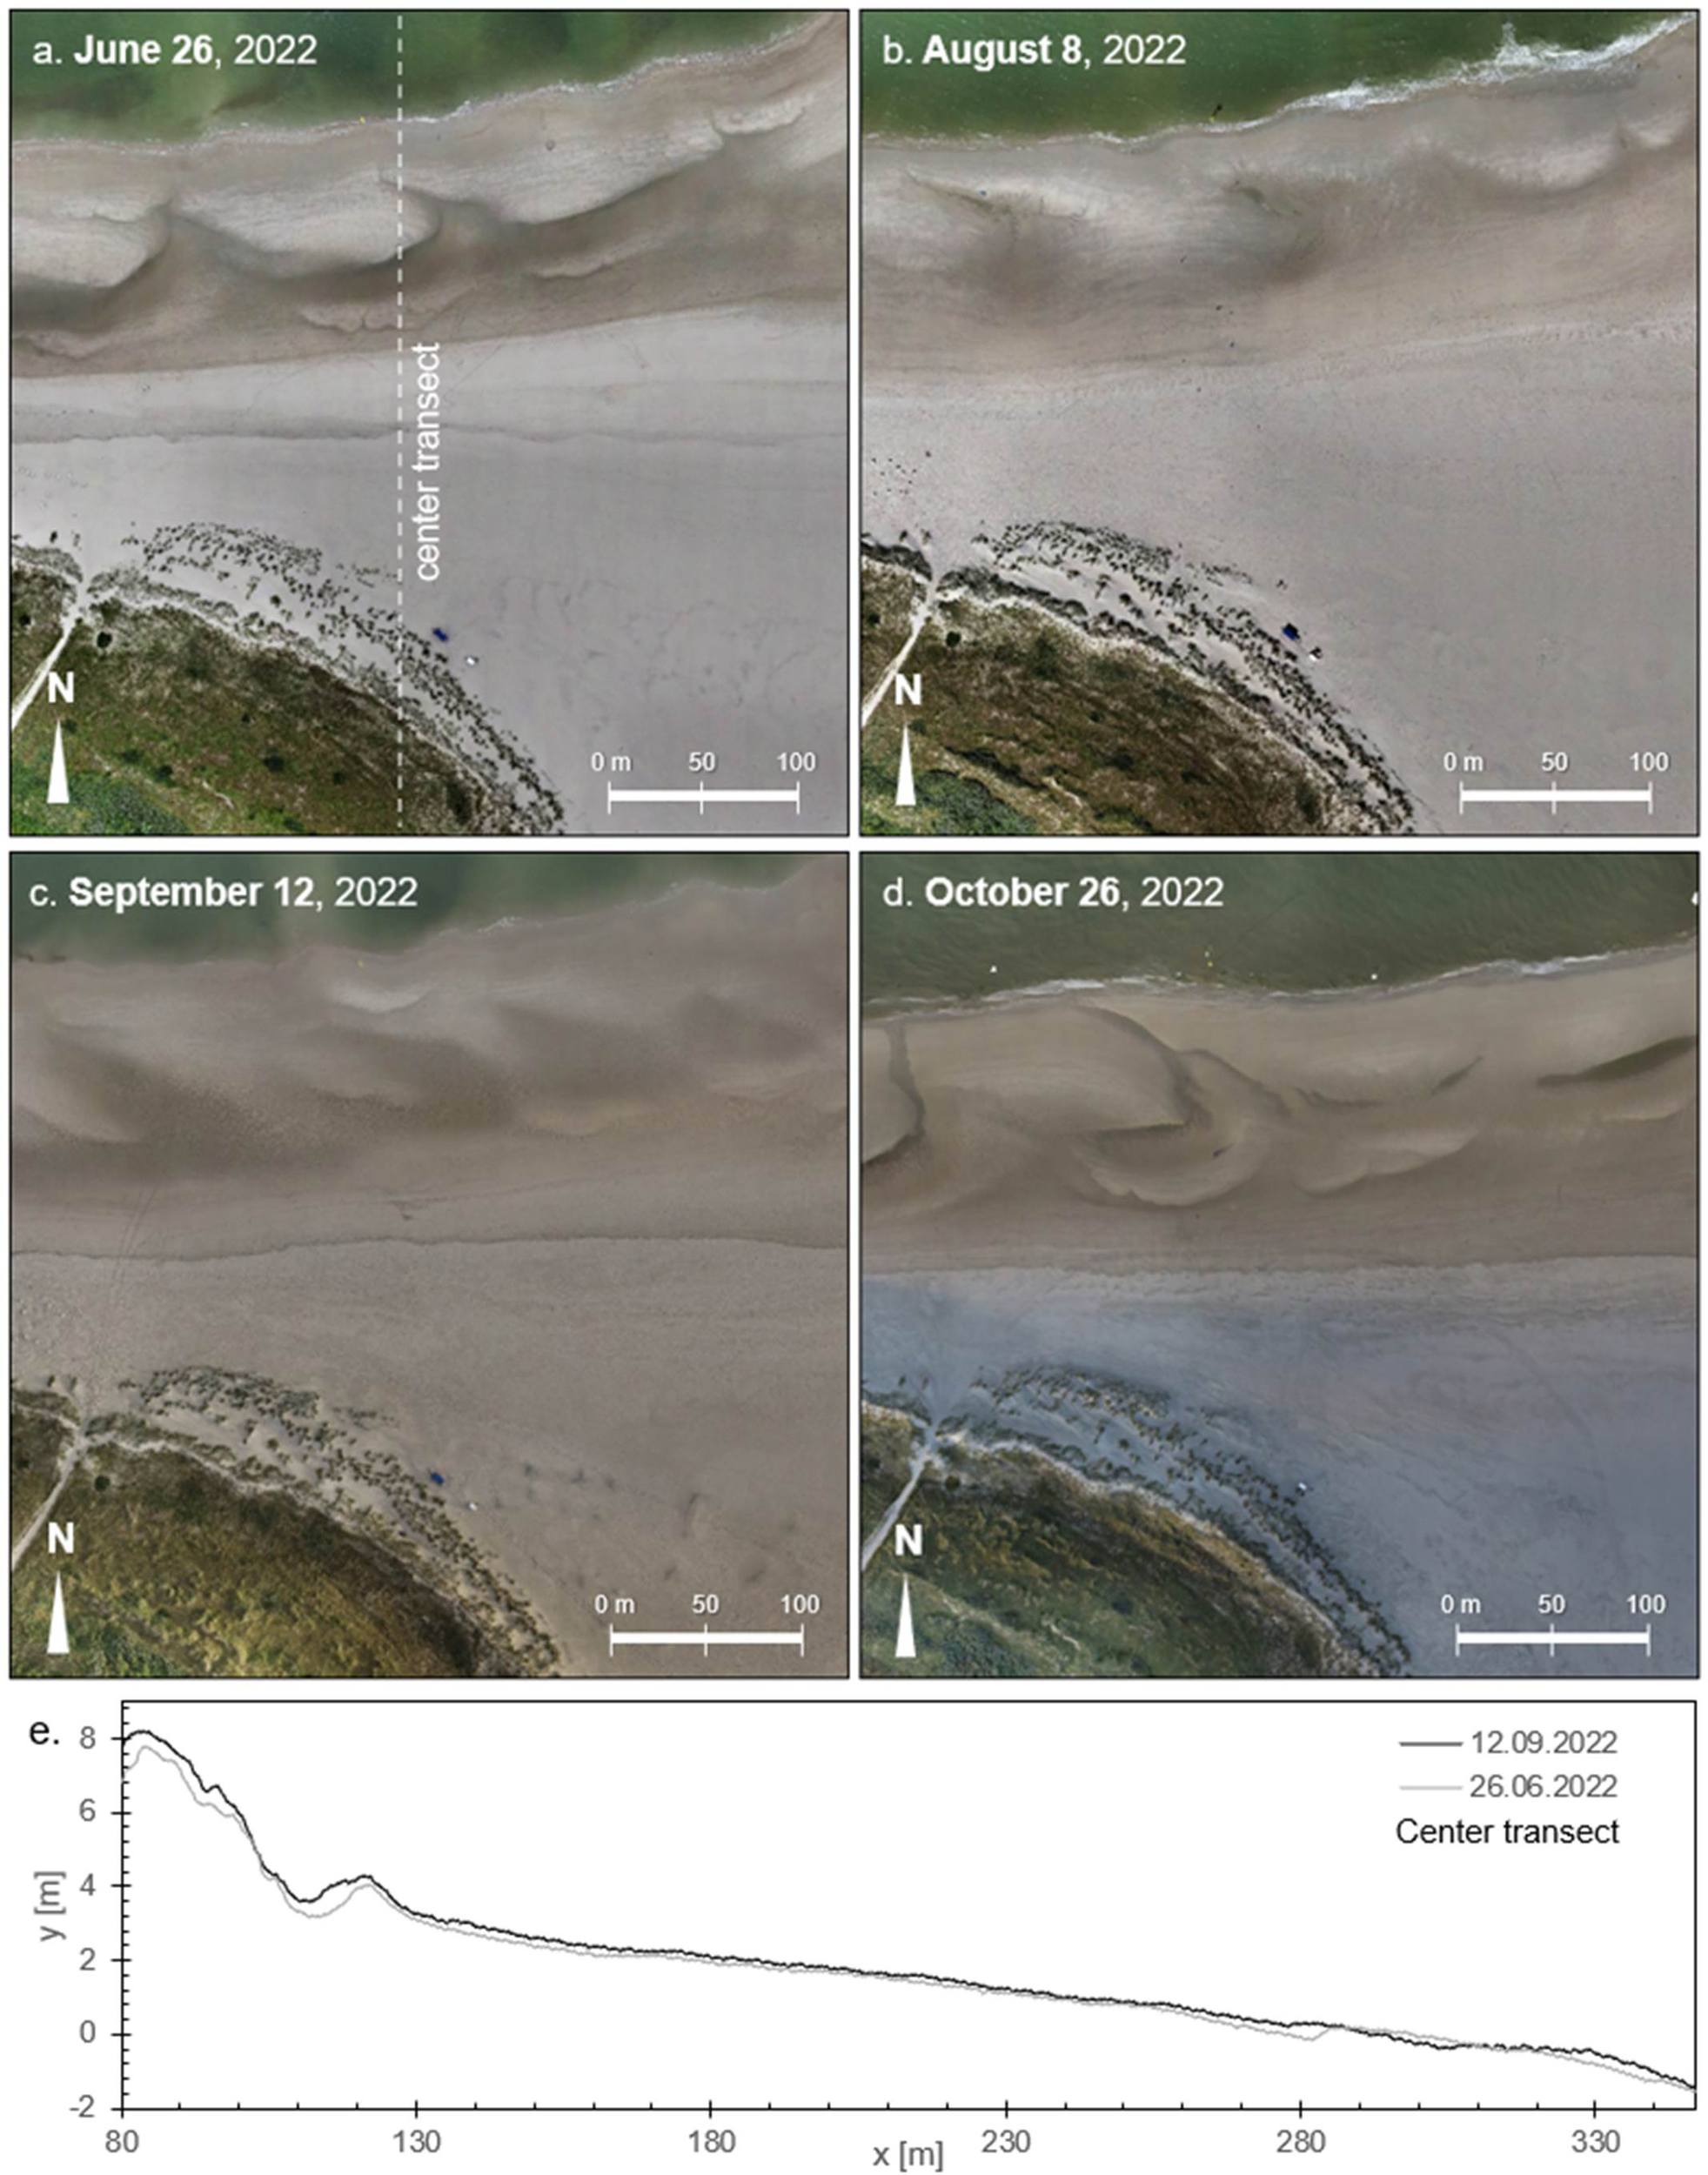
(A–D) Orthophotos from the field campaigns of June, August, September, and October 2022 displaying the ridge-runnel systems on the beach; (E) Beach profiles from the center transect in June (grey line) and September (black line) 2022 showing the evolution of beach dunes and shoreface.
In terms of sediment grain sizes, surficial sediments at the central DynaDeep transect are mostly composed of well-sorted fine and medium sands. Fine sands were present in the area of dunes and backshore, and medium sands in the intertidal zone in March 2022. All sediment samples have a unimodal distribution, with mean grain-sizes of about 240 μm for the fine sands and 300 μm for the medium sands. As rather fair-weather conditions prevailed from March to October 2022, the water table did not cover significant portions of the backshore on a regular basis, exposing this area to wind action.
Morphological and sedimentological processes require further analysis since the data gathered so far correspond primarily to fair-weather conditions. The ridge-runnel systems are far less pronounced than in previous years (Waska et al., 2019; Grünenbaum et al., 2020a). Storm events with specific characteristics (e.g., wave direction, period, and height) can strongly modify the beach configuration, creating new hydrodynamic conditions that lead to diverse sediment transport patterns and grain-size distributions.
5.3 Hydrogeology
A (hydro)geological cross-section based on visual geological description of the three deep drillings and two 24 m long sediment cores is sketched in Figure 12, illustrating the hydrogeological conditions that correspond in general to the overall geological setting in the area (Streif, 1990). The upper 5 m of the beach mainly consist of relatively homogenous light brown fine sand with low carbonate content and few shell fragments (beach sediments). The ~15-20 m below are composed of heterogeneous fine to coarse sand with varying contents of shell fragments and medium to high carbonate content, partly layered and intersected with small clay lenses or coarser sand and single occurrences of distributed peat pieces. The color varies from beige and brown to grey and black. This formation likely represents tidal flat and channel sediments and forms the Holocene base. The underlain sediments are composed of fine to coarse sand, beige to bright brown in color, mostly shell and carbonate free with single occurrences of up to 5 cm large gravel pieces. These sediments are of glacio-fluvial origin. The base of the aquifer is assumed to be at a depth of 44–55 mbsl, where an underlying rather continuous clay layer that acts as an aquitard has previously been described (Röper et al., 2012).
Figure 12
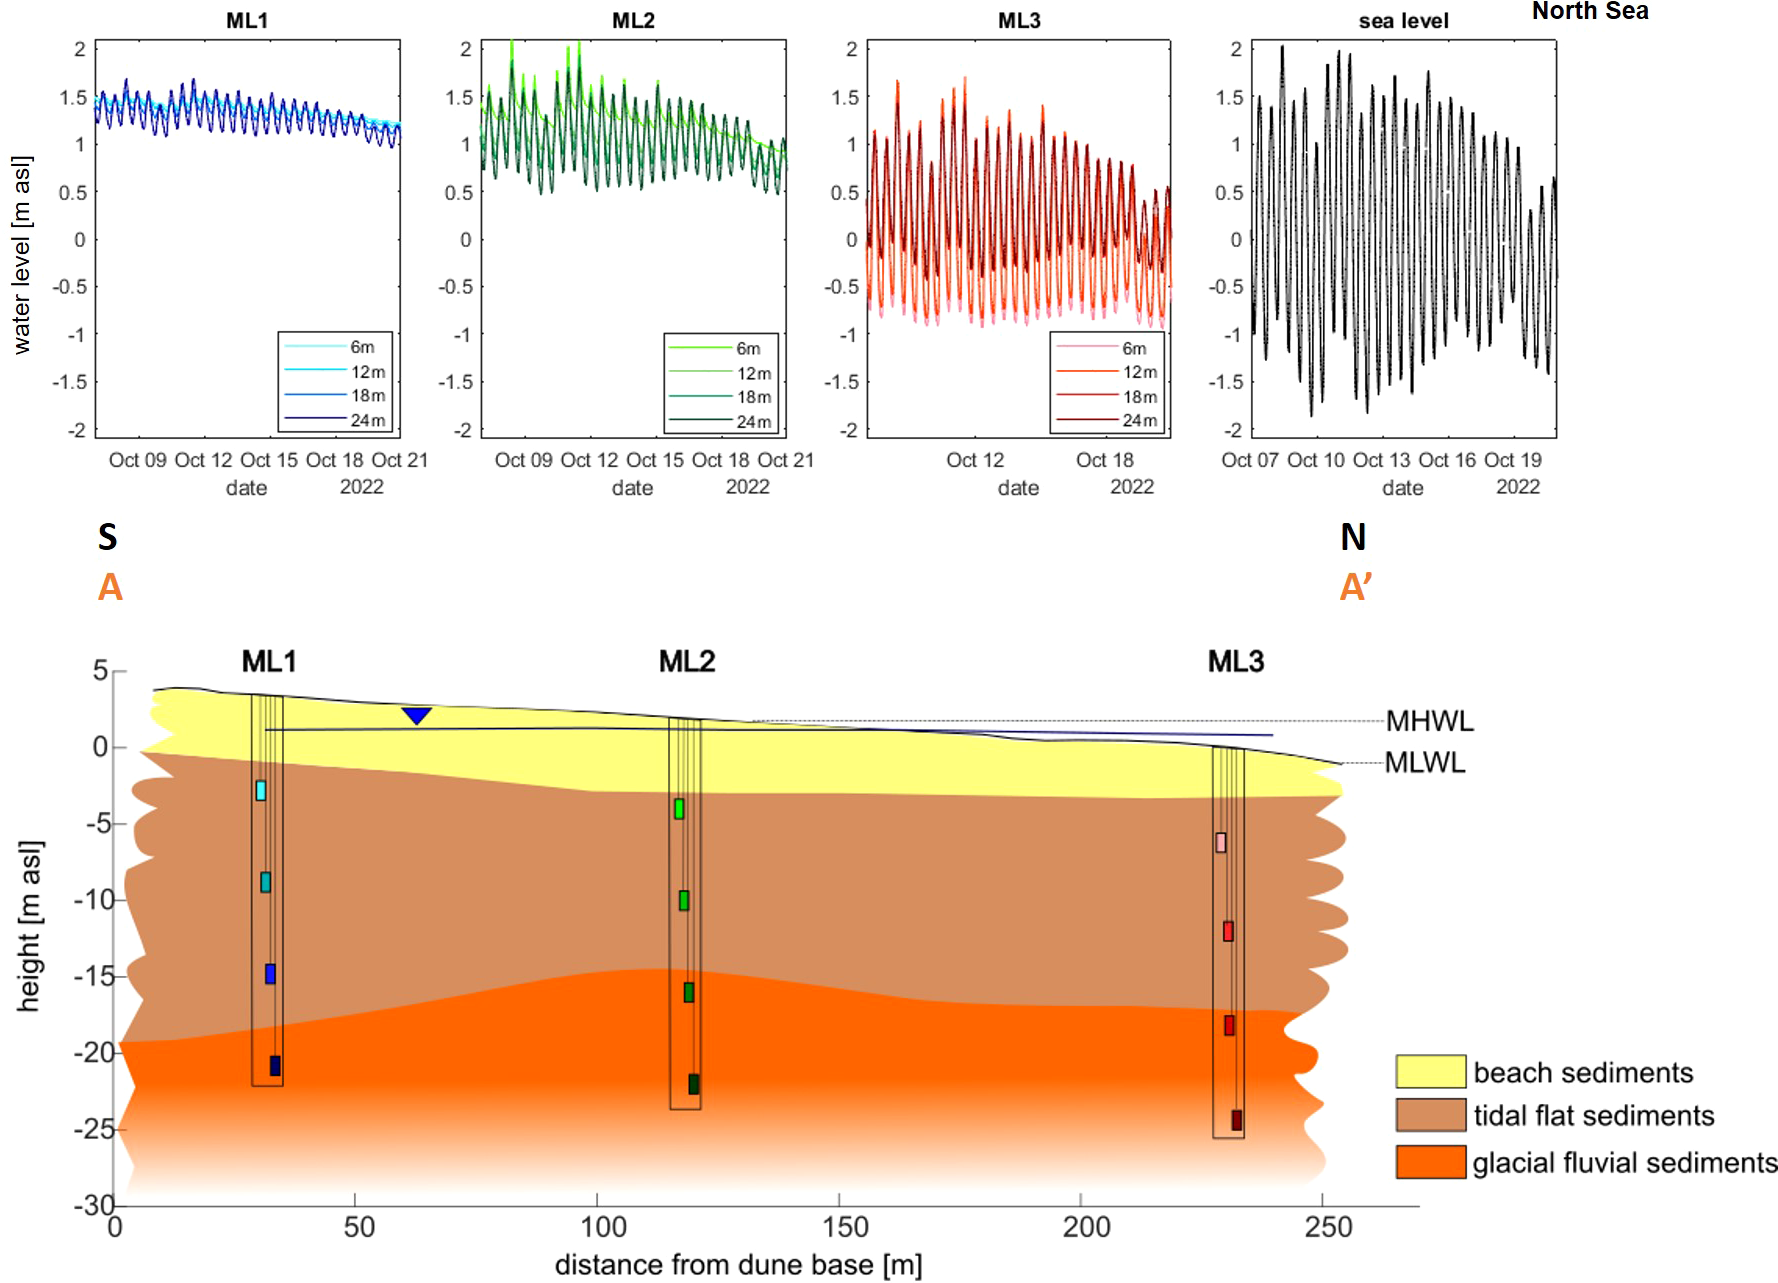
Cross-section from dune base to the sea (A-A’ in Figure 6) with main lithological units and well locations and filter screens. Equivalent freshwater heads from data loggers (colors identical to those of well screens) over an exemplarily period of two weeks (7.10-21.10.2022) are shown as well as the sea-level data from Wangerooge Nord (www.pegelonline.wsv.de). Mean high (MHWL) and mean low water line (MLWL) as well as the mean shallow groundwater level based on the 6 m filters are indicated.
The dominant occurrence of fine to coarse sand results in an overall conductive hydraulic system. However, lenses of finer or coarser material might locally cause preferential flow paths. In the beach aquifer, freshwater from Spiekeroog’s freshwater lens and local freshwater recharge at the beach mix with the saltwater from the North Sea. The hydraulic heads generally increase towards the dunes. The tidal signal of the North Sea propagates through the STE, with decreasing amplitudes from the shore towards the dunes as observed in the multilevel groundwater wells (Figure 12). At location ML1, the tidal signal is reflected stronger in the deeper wells and more damped in the shallow ones. At a closer look, the heads observed in the shallow wells (6 m and to a smaller extent also at 12 m) near the MHWL at ML2, do not follow the typical tidal signal of sinusoidal shape but are rather influenced by the beach slope, revealing the so-called tidal overheight (Nielsen, 1990). Moreover, the head observed in ML2 at 6 m is even higher than the incoming tidal signal of the North Sea which can be related to the occurrence of high-energy waves near the MHWL (Waska et al., 2019). The wells closer to the MLWL react differently: At ML3 the hydraulic heads recorded in the shallower wells show higher amplitudes than the deeper ones.
5.4 Groundwater salinity distribution
Figure 13A–L exemplarily shows results from the August 2022 campaign, including DP, ERT and groundwater logger data. Both ERT and DP methods measure the bulk EC of the subsurface (mS/m) over depth (DP, Figures 13A–H) or color-coded along the transect (ERT, Figure 13L). The black dotted lines (l) show the position and extend of the DP data. Additional DP data will be acquired in the intertidal zone between DP4 and ML3 in future campaigns.
Figure 13
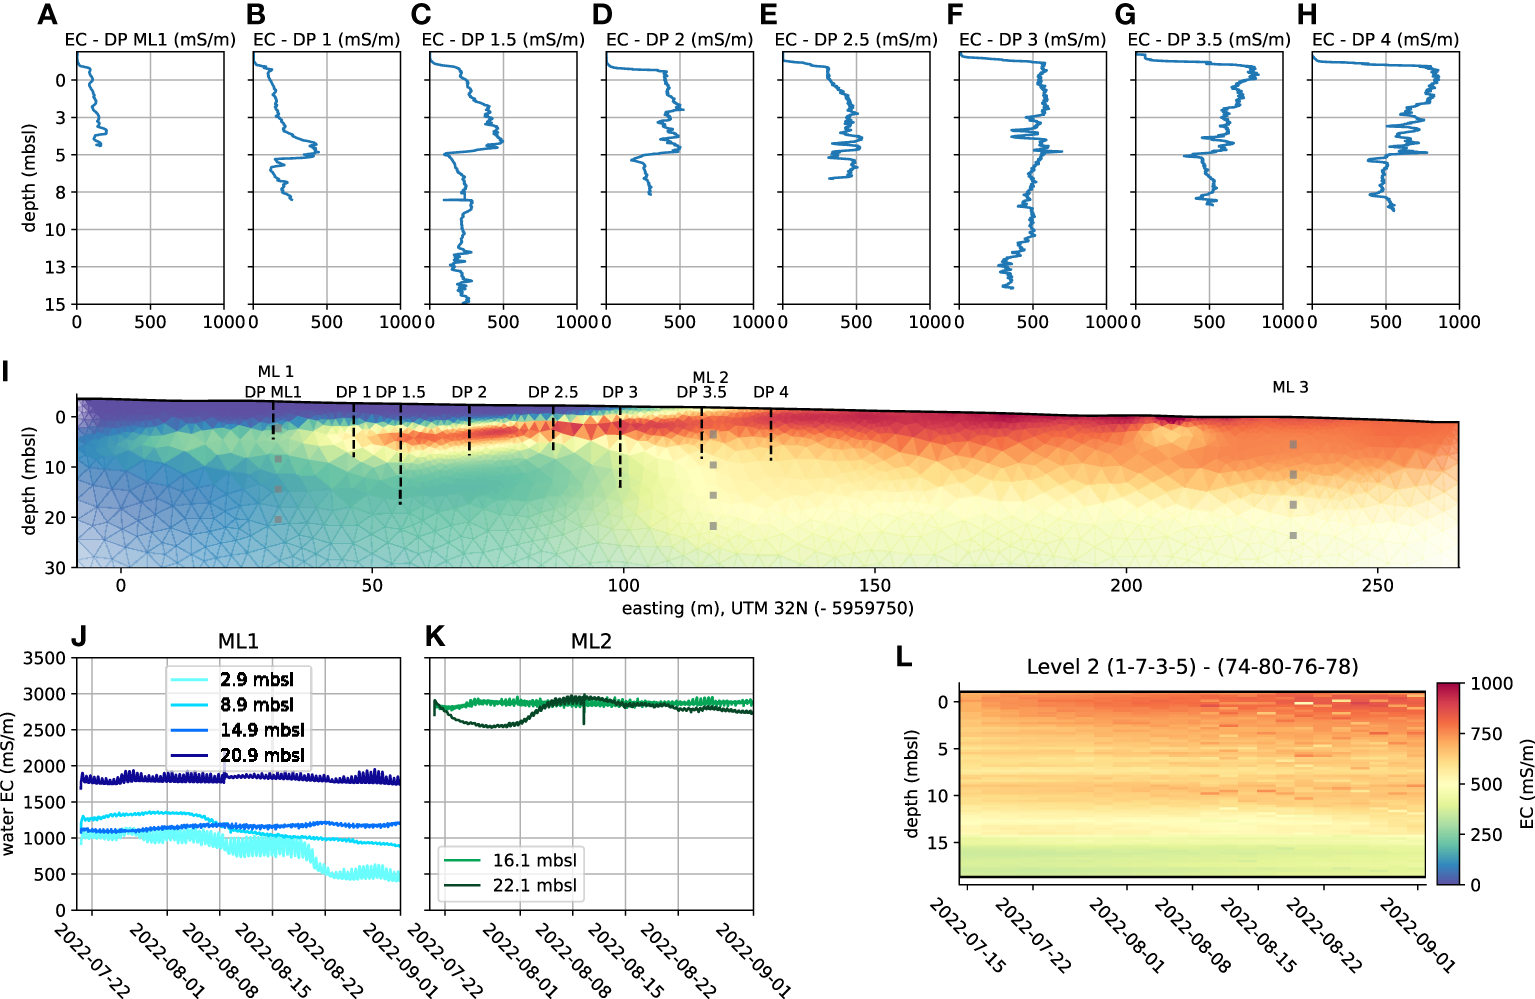
Results of the geophysics (A–H): Bulk conductivity from DP measurements in August 2022 at the DynaDeep site (Figure 6); (I) bulk EC derived from inversion of ERT data from August 2022 with positions of DP (black dashed lines) and multi-level wells ML1, ML2, and ML3 (grey dots) indicated; groundwater EC from multi-level loggers at ML1 (J) and ML2 (K) from mid July to end of August 2022 (color code as in Figure 6, L) bulk EC from SAMOS data as a function of depth and time during the same period (color scale as in i).
First results from the DP indicate a general increase in bulk EC after one or two meters depth below ground (mdbg) when reaching the groundwater table. For the DP measurements near the dunes (Figures 13A–E, DP 1, 1.5 and 2) a decrease in EC at a depth of about 5 m below sea-level (mbsl) is visible. This can also be seen in the ERT result and is possibly connected to a downward moving saltwater front from a previous storm flood. For the DP data near ML2 and towards the shore (Figures 13F–H), the change in bulk EC with depth is smoother, indicating a broader mixing zone between the salt- and freshwater. This observation is also supported by the ERT model, showing a smooth distribution in the intertidal zone (Figure 13I). In the lower part of the ERT (> 20 meter depth), a slow decrease in conductivity can be observed, likely representing the top of the freshwater discharge tube. Multiple saltwater circulation cells as observed by Grünenbaum et al. (2023) are not visible in August 2023, likely because a pronounced ridge-runnel system was lacking at the time.
Time-series of groundwater EC from data loggers in ML1 (at depths of ~6, 12, 18, and 24 mbgs, respective depths in mbsl shown in the Figure) and ML2 (~18 and 24 mbgs) are shown for a period of roughly 6 weeks from mid July until end of August (Figures 13J, K). ECs generally decrease towards the dunes and increase with depth near the dunes (ML1). For the same period, SAMOS data (Figure 13L) show bulk EC as function of depth (for a mean side penetration of some 20 cm). Highest SAMOS bulk EC values are seen at the surface, decreasing slightly and then more pronounced at about 16 m depth. For this short interval, the time-series reveal only minor EC changes except for ML1 (6 m), where EC is decreasing by a factor of two. The SAMOS data show an overall increase over time. The water at greater depths of nearby ML2 does not indicate such an increase with time. The reason for the high-frequency changes in EC in some of the groundwater loggers related to the tidal cycles of 12h 25min is somewhat unclear and could be related to vertical water movement due to the tide induced expansion and compression of air inside the well tubing.
5.5 Groundwater chemistry
The spatial distribution of the dissolved groundwater constituents salinity, O2, Si, , DOC and Fe from one campaign at the DynaDeep study site are shown as an example in the cross-sectional Figure 14. The figure reveals the previously unknown depth of the redox transition from oxic to anoxic conditions at the upper beach. O2 as well as , which is generally produced by O2 consuming nitrification (Froelich et al., 1979), penetrate 12-15 m deep into the subsurface. Near the mean water level (ML3), conditions are anoxic at all sampled depths (6-24 mbgs). Dissolved Fe is mainly present in nitrate-free groundwater, except for a few sites, where denitrification and Fe(hydr)oxide reduction seemingly co-occur. Hence, redox zones partly overlap, which may be the result of the dynamic conditions that we hypothesized to be characteristic for high-energy beaches.
Figure 14
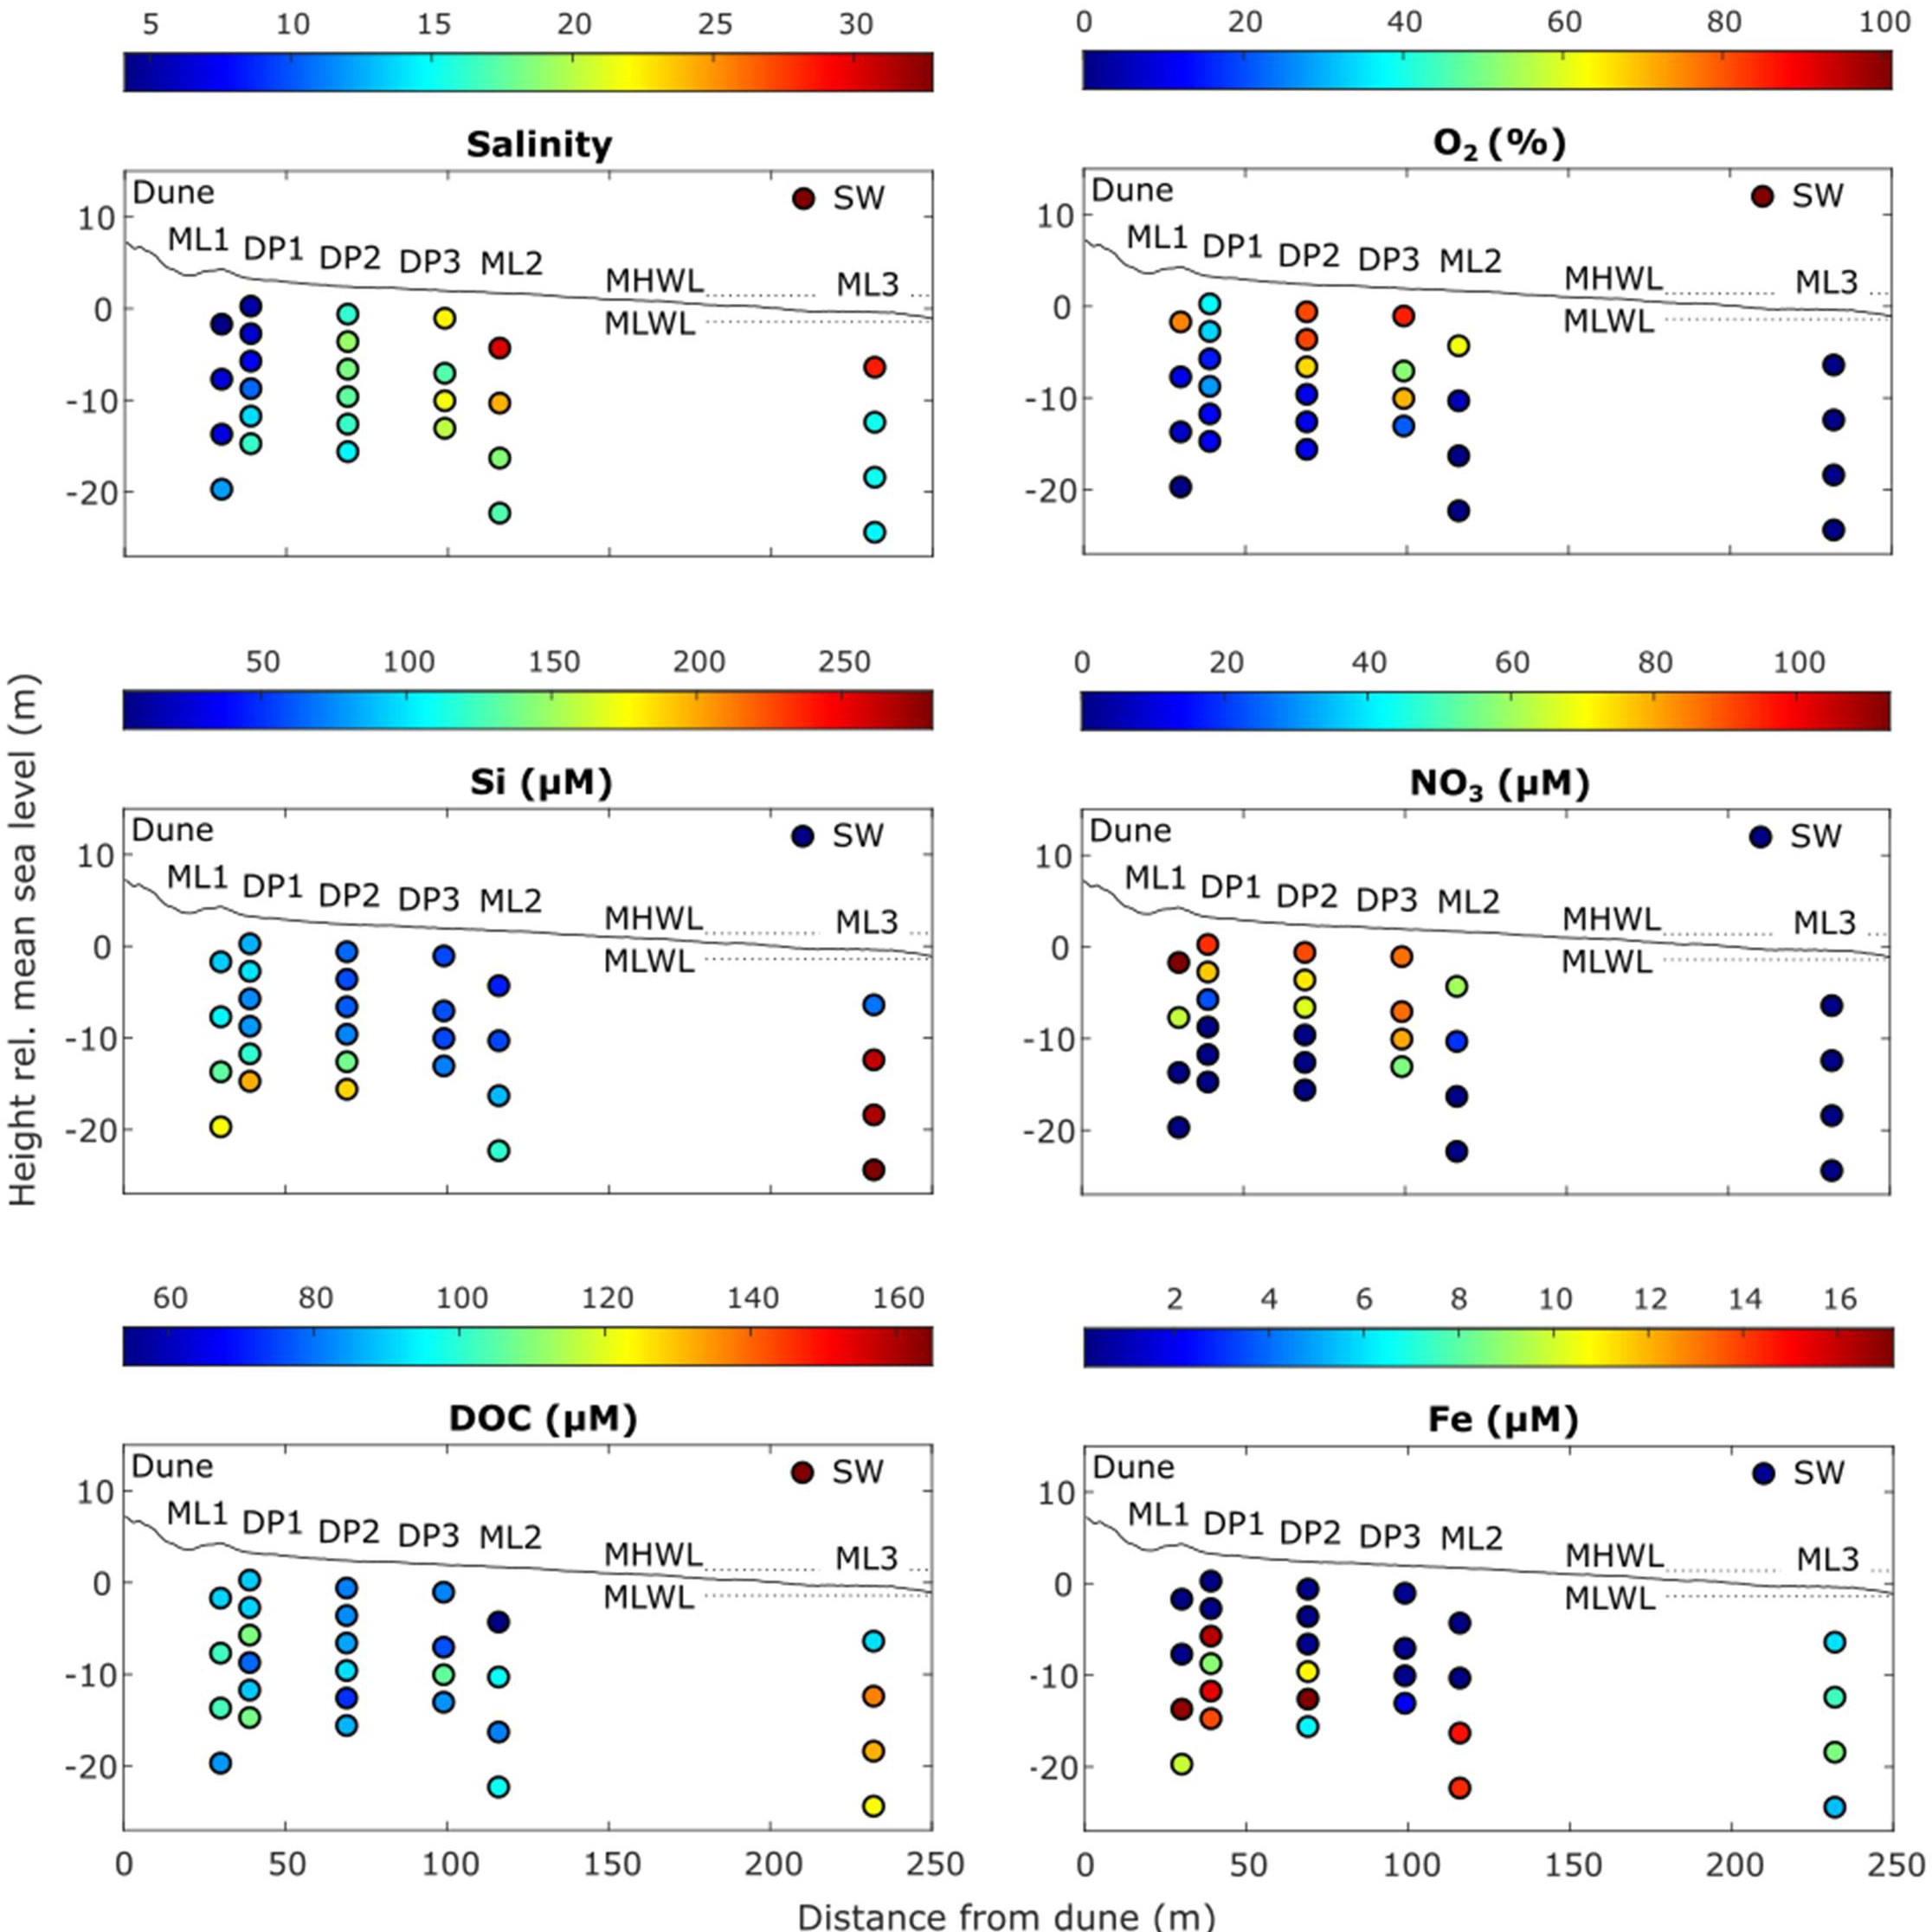
Spatial distribution of selected dissolved groundwater constituents along the DynaDeep cross-shore transect on Spiekeroog Island in September 2022. The dotted lines indicate the mean high water level (MHWL) and the mean low water level (MLWL).
Si concentrations generally increase with depth and are highest in the deeper, freshwater diluted parts at ML3. Si concentrations are generally related to groundwater residence time and mainly released over time due to quartz dissolution (Ehlert et al., 2016). Hence, maximum Si concentrations at ML3 indicate discharge of old groundwater from deeper parts of the island’s freshwater lens in the intertidal zone. Groundwater from the deeper parts of the freshwater lens was found to be ~50 years old (Seibert et al., 2018) and could previously be traced up to the shallow discharge areas in the lower intertidal zone (Grünenbaum et al., 2020b) Similar to Si, DOC concentrations are highest at ML3 at depths ≥ 12 mbgs, possibly due to inputs from the deep freshwater lens, as indicated by the concurrent low salinities. However, in contrast to Si, DOC concentrations in all groundwater samples are lower than in seawater, in line with previous suggestions that Spiekeroog Island could be a net sink for dissolved OM (Waska et al., 2021).
5.6 Oxygen consumption rates and FTR experiments
The results from first exemplary FTR experiments indicate that respiration rates compare well between FTRcon and slurry incubations (Figures 15A, C), except for the sediments from 0-5 cm in May. The standard deviation of the FTRcon rates resulted from incubations at different porewater velocities rather than differences in duplicate incubations. The duplicate/triplicate slurry incubations displayed some variability, especially in the top 10 cm. Due to the comparability of rates in the two setups, the imposed porewater flow in the slurry incubations is assumed to be in the range of the applied velocities in the FTRcon setup.
Figure 15
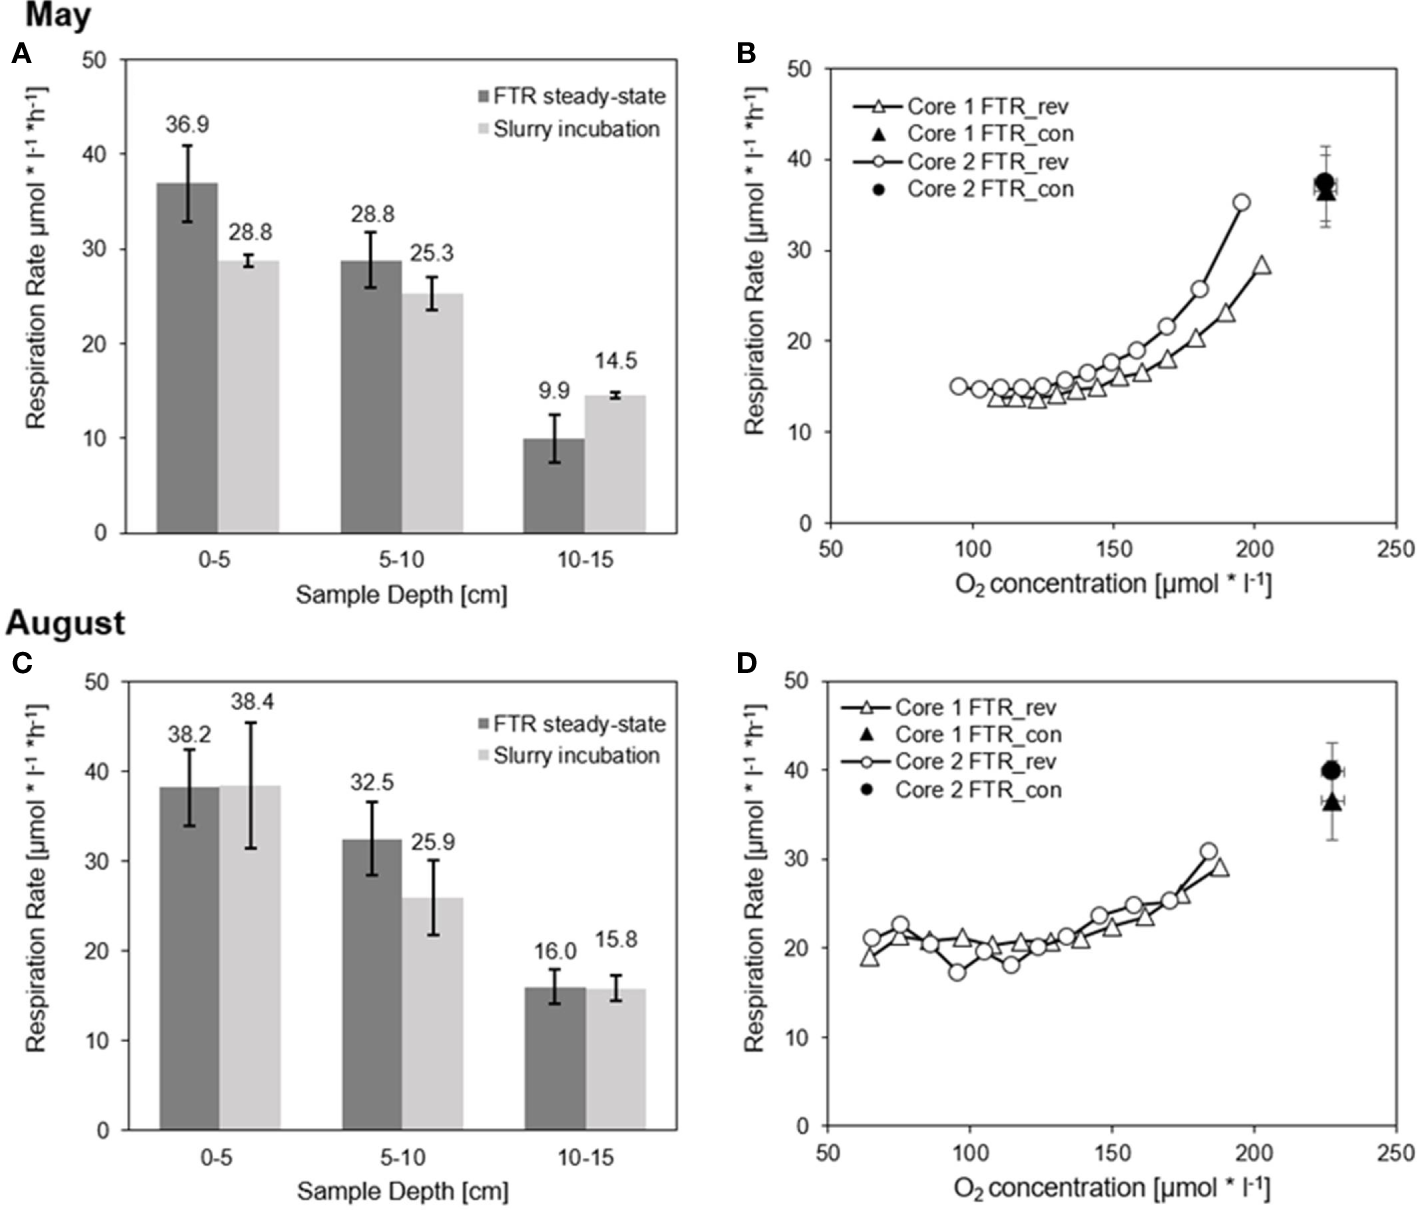
Comparison of first exemplary respiration rates determined in FTRcon and slurry incubation setups (A, C) and rates as a function of bulk O2 concentrations measured under non-steady state conditions in FTRrev setups (B, D).
Respiration rates derived from non-steady state incubations are shown as a function of the bulk O2 concentration for the duplicate FTRrev incubation of sediment from 0-5 cm (Figures 15B, D). Rates near saturation concentrations (O2,airsat (T = 21.4°C, Sal = 32 PSU) = 228.9 µmol/l) were similar to rates determined at low porewater velocities in steady-state (mean of rates from FTRcon shown as a function of inlet O2 concentration). The successive decrease in respiration rates with O2 concentration indicates a dependency of the rates on O2 availability.
Regarding the application possibilities of the compared setups, slurry incubations allow for a higher sample throughput due to less laborious sample preparation and require less sample volume (10-20 ml compared to more than 1000 ml in the FTR). This approach is for example suitable for highly resolved respiration rate profiles of sediments acquired by small push cores. FTRs, however, allow controlling boundary conditions such as porewater flow and redox conditions, thus permitting detailed studies of different factors controlling O2 respiration rates.
6 Conclusions and outlook
In 2022, the cooperative project DynaDeep commenced with a unique approach to study high-energy STEs that are proposed to be deep, highly dynamic bioreactors. DynaDeep started with the installation of a STE observatory on Spiekeroog Island. The DynaDeep observatory consists of permanent infrastructure such as a pole, SAMOS electrode chain and multi-level groundwater observation wells that are so far withstanding the rough conditions at the site. It is complemented with mobile devices such as the DP, drones and ground-based ERT measurements. A container to store equipment and to inform the public about the project is located on the beach during summer. The installation and maintenance of this STE observatory is the key to all field and labbased activities that commenced with regular sampling events, ex-situ laboratory work and modelling in 2022.
The DynaDeep study and observatory is unique in the sense that it is a holistic, highly multidisciplinary, multi-method approach to study the exchange processes at the land-sea interface from different scientific angles and disciplines, i.e. collecting data and combining methods from geomorphology (drones and pole), geophysics (ERT, SAMOS), hydrogeology (multi-level wells), hydrochemistry (DP, FTRs, DOM, trace metals, isotopes), biogeochemistry (sediment core sampling, rate determination), microbiology (cell counts and gene sequencing) as well as numerical modeling (reactive variable-density groundwater flow and salt transport modeling). It is one of very few high-energy STEs that have ever been studied. What is also special is that we are observing and sampling the deep STE (>20 m) of a high-energy beach in high-spatial and temporal resolution. From a geochemical perspective the focus is on the microbial bioreactor as such and how this reactor is regulated by physical/chemical boundary conditions rather than on the SGD (nutrient) fluxes and their impact on the coastal ecosystems. In terms of the microbiology it is unique that our approach allows us to access both sediments and porewater from the deep beach subsurface. As the majority of microorganisms in sandy sediments are sand-grain attached this is necessary to get a full picture of what is driving geochemical changes, allowing us to open what, until now, has been almost entirely a black box. The integration of information from all subprojects into a holistic modeling framework, the participatory approach with public outreach elements as well as the long-term perspective (at least 4 years) add to the novelty of the DynaDeep observatory. Hence, it is the combination of all these points that make our approach novel.
Morphological and sedimentological processes in particular require further analysis, since the weather conditions were fair so far and major stormfloods have not occurred yet. In addition, the ridge-runnel system was by far less pronounced in 2022 than in previous years (e.g. Waska et al., 2019; Grünenbaum et al., 2020a). This likely affects the dynamics in the subsurface. Moreover, it has so far not been possible to acquire DP data from the intertidal zone below the MHWL as a safety plan had to be developed. This is now in place and it is planned to work with the DP in the intertidal zone from spring 2023 onwards. The permanently installed wells (ML1-3) are sampled every six weeks and the geochemical data reveals that the chosen sites provide ideal conditions to observe spatio-temporal dynamics of groundwater salinity and hydrochemistry.
The beach was rather flat during the campaigns so far and a single USP is visible in the ERT images from the intertidal zone, which is in contrast to 2019, when several 10–20 m deep reaching individual saline recirculation cells were observed at a time when a pronounced runnel-ridge beach system existed. Instead, the upper dry beach is characterized by a layer with high bulk EC, likely a relict from the previous storm-flood season. The groundwater chemistry shows that old, anoxic groundwater discharges close to the MLWL while the shallow groundwater is more oxic above the MHWL, with a redox transition to anoxic, iron-reducing conditions at a depth of 12-15 m.
Overall, the preliminary results from the starting phase are very promising. They demonstrate the successful implementation and proper functioning of the STE observatory - the core for our investigations in DynaDeep. Complementary field, laboratory work and modelling studies are expected to provide an in-depth understanding of the coupled physical, biogeochemical, and microbial processes in the subsurface of high-energy beaches that is currently lacking. In the next few years, our integrative approach will extend knowledge on how this understudied but critical contact zone between terrestrial and coastal marine ecosystems functions as a biogeochemical reactor. We encourage researchers that are interested in accessing this unique high-energy beach observatory to contact us for cooperation.
Statements
Data availability statement
The original contributions presented in the study are included in the article/Supplementary Material. Further inquiries can be directed to the corresponding author.
Author contributions
GM, TD, BE, JG, MH, HM, MM-P, JN, KP, VP, AR, HW, CW, and OZ conceptualized the DynaDeep project and manuscript. GM, TB, CB, TG, GH, MM-P, DP, KS, CW, and OZ are responsible for installation, permissions and maintenance of the permanent infrastructure in the field. GA, KA, FA, SB, IC, JC, TG, GH, RM, AR, DP, MR, KS, and NS regularly carry out field work and analyze the results. GM, GA, KA, FA, MB, SB, IC, JC, BE, HF, TG, GH, MH, HM, RM, MM-P, JN, KP, AR, MR, KS, CS, NS, HW, and CW contributed to the data. JG, VP, and SS are responsible for data management and reactive transport modelling. GM led the manuscript writing and FA, MB, SB, JC, JG, TG, MH, HM, RM, MM-P, JN, KP, AR, KS, SS, HW, and OZ wrote parts of the manuscript and/or contributed figures. All authors contributed to the article and approved the submitted version.
Funding
This study was conducted within the research unit FOR 5094: The Dynamic Deep subsurface of high-energy beaches (DynaDeep), funded by the German Research Foundation (Deutsche Forschungsgemeinschaft, DFG).
Acknowledgments
We are thankful to the support and permission of the responsible authorities, including the Niedersächsischer Landesbetrieb für Wasserwirtschaft, Küsten und Naturschutz (NLWKN), the Landkreis Wittmund, the Wasserstraßen- und Schifffahrtsamt Ems-Nordsee, the Gemeinde Spiekeroog and Nationalparkverwaltung Niedersächsisches Wattenmeer (NLPV), whereby we thank in particular Dr. Gregor Scheiffarth and Claus Schulz from NLPV and the mayor of Spiekeroog, Patrick Kösters for their continuous support. We are grateful for the pole that was constructed in the workshop of the Coastal Research Station of the NLWKN. We thank Olaf Büscher and Holger Karow for its planning, construction and installation. On Spiekeroog, we receive major support by the Umweltzentrum Wittbülten (Swaantje Fock and Carsten Heithecker), the NLWKN (Joachim Ihnken) and the NLPV ranger Christopher Riechmann. Special thanks to Helmo Nicolai, Gerrit Behrens and Waldemar Siewert, from the ICBM workshop in Wilhelmshaven, for their support with maintenance, servicing and modifications to the DP drilling unit and the infrastructure on and around Spiekeroog in general. Mattes Brinkmann is thanked for his help during field work.
Conflict of interest
The authors declare that the research was conducted in the absence of any commercial or financial relationships that could be construed as a potential conflict of interest.
Publisher’s note
All claims expressed in this article are solely those of the authors and do not necessarily represent those of their affiliated organizations, or those of the publisher, the editors and the reviewers. Any product that may be evaluated in this article, or claim that may be made by its manufacturer, is not guaranteed or endorsed by the publisher.
Supplementary material
The Supplementary Material for this article can be found online at: https://www.frontiersin.org/articles/10.3389/fmars.2023.1189281/full#supplementary-material
Supplementary Figure 1Exemplary raw data on sea-level, wind speed, wind direction and precipitation measured at the pole on five days in February 2023. Depending on the conditions, the pole falls dry around low water as visible in the sea-level plot.
Supplementary 2Video of drone flight during a DynaDeep campaign in August 2022, showing the groundwater wells (blue), the SAMOS electrode chain (orange), the DP drilling device, DynaDeep scientists at work and the drilling of ML3 from a ship that fell dry in the intertidal zone as well as the pole near the water line.
References
1
Abarca E. Karam H. Hemond H. F. Harvey C. F. (2013). Transient groundwater dynamics in a coastal aquifer: the effects of tides, the lunar cycle, and the beach profile. Water Resour. Res.49 (5), 2473–2488. doi: 10.1002/wrcr.20075
2
Addy K. Gold A. Nowicki B. McKenna J. Stolt M. Groffman P. (2005). Denitrification capacity in a subterranean estuary below a Rhode island fringing salt marsh. Estuaries28 (6), 896–908. doi: 10.1007/BF02696018
3
Ahmerkamp S. Marchant H. K. Peng C. Probandt D. Littmann S. Kuypers M. M. M. et al . (2020). The effect of sediment grain properties and porewater flow on microbial abundance and respiration in permeable sediments. Sci. Rep.10 (1), 3573. doi: 10.1038/s41598-020-60557-7
4
Ahmerkamp S. Winter C. Janssen F. Kuypers M. M. Holtappels M. (2015). The impact of bedform migration on benthic oxygen fluxes. J.Geophys. Res. Biogeosci.120, 2229–2242. doi: 10.1002/2015JG003106
5
Ahrens J. Beck M. Böning P. Degenhardt J. Pahnke K. Schnetger B. et al . (2021). Thallium cycling in pore waters of intertidal beach sediments. Geochimica Cosmochimica Acta306, 321–339. doi: 10.1016/j.gca.2021.04.009
6
Ahrens J. Beck M. Marchant H. K. Ahmerkamp S. Schnetger B. Brumsack H. J. (2020). Seasonality of organic matter degradation regulates nutrient and metal net fluxes in a high energy sandy beach. J. Geophys Res: Biogeosci.125, e2019JG005399. doi: 10.1029/2019JG005399
7
Andersen M. S. Baron L. Gudbjerg J. Gregersen J. Chapellier D. Jakobsen R. et al . (2007). Discharge of nitrate-containing groundwater into a coastal marine environment. J. Hydrology336 (1), 98–114. doi: 10.1016/j.jhydrol.2006.12.023
8
Anschutz P. Smith T. Mouret A. Deborde J. Bujan S. Poirier D. et al . (2009). Tidal sands as biogeochemical reactors. Estuar. Coast. Shelf Sci.84, 84–90. doi: 10.1016/j.ecss.2009.06.015
9
Archana A. Francis C. A. Boehm A. B. (2021). The beach aquifer microbiome: research gaps and data needs. Front. Environ. Sci.9, 653568. doi: 10.3389/fenvs.2021.653568
10
Baschek B. Schroeder F. Brix H. Riethmüller R. Badewien T. H. Breitbach G. et al . (2017). The coastal observing system for northern and Arctic seas (COSYNA). Ocean Sci.13, 379–410. doi: 10.5194/os-13-379-2107
11
Beck A. J. Kellum A. A. Luek J. L. Cochran M. A. (2016). Chemical flux associated with spatially and temporally variable submarine groundwater discharge, and chemical modification in the subterranean estuary at Gloucester point, VA (USA). Estuaries Coasts39 (1), 1–12. doi: 10.1007/s12237-015-9972-0
12
Beck M. Reckhardt A. Amelsberg J. Bartholomä A. Brumsack H.-J. Cypionka H. et al . (2017). The drivers of biogeochemistry in beach ecosystems: a cross-shore transect from the dunes to the low water line. Mar. Chem.190, 35–50. doi: 10.1016/j.marchem.2017.01.001
13
Benesch R. Mangelsdorf P. (1972). Eine methode zur colorimetrischen bestimmung von ammoniak in meerwasser. Helgoland Mar. Res.375, 365e375. doi: 10.1007/BF01609682
14
Blossier B. Bryan K. R. Daly C. J. Winter C. (2017). Spatial and temporal scales of shoreline morphodynamics derived from video camera observations for the island of sylt, German wadden Sea. Geo-Mar Lett.37, 111–123. doi: 10.1007/s00367-016-0461-7
15
Böttcher M. E. Effenberger H. S. Gehlken P.-L. Grathoff G. Schmidt B. Geprägs P. et al . (2012). BaMn[CO3]2 – a previously unrecognized double carbonate in low-temperature environments: structural, spectroscopic, and textural tools for future identification. Geochemistry72, 85–89. doi: 10.1016/j.chemer.2012.01.001
16
Böttcher M. E. Schmiedinger I. (2021). The impact of temperature on the water isotope (2H/1H, 17O/16O, 18O/16O) fractionation upon transport through a low-density polyethylene membrane. Isot. Env. Health Stud.57, 183–192. doi: 10.1080/10256016.2020.1845668
17
Chaillou G. Lemay-Borduas F. Larocque M. Couturier M. Biehler A. Tommi-Morin G. (2018). Flow and discharge of groundwater from a snowmelt-affected sandy beach. J. Hydrol.557, 4–15. doi: 10.1016/j.jhydrol.2017.12.010
18
Charbonnier C. Anschutz P. Deflandre B. Bujan S. Lecroart P. (2016). Measuring porewater oxygen of a high-energy beach using buried probes. Estuar. Coast. Shelf Sci.179, 66–78. doi: 10.1016/j.ecss.2015.12.004
19
Charette M. A. Sholkovitz E. R. (2002). Oxidative precipitation of groundwater-derived ferrous iron in the subterranean estuary of a coastal bay. Geophys Res. Lett.29, 4. doi: 10.1029/2001GL014512
20
Charette M. A. Sholkovitz E. R. (2006). Trace element cycling in a subterranean estuary: part 2. geochemistry of the porewater. Geochim Cosmochim Acta70, 811–826. doi: 10.1016/j.gca.2005.10.019
21
Cline J. (1969). Spectrophotometric determination of hydrogen sulfide in natural waters. Limnol Oceanogr14, 454e458. doi: 10.4319/lo.1969.14.3.0454
22
D'Hondt S. Jørgensen B. B. Miller D. J. Batzke A. Blake R. Cragg B. A. et al . (2004). Distributions of microbial activities in deep subseafloor sediments. Science306, 2216–2221. doi: 10.1126/science.1101155
23
Dahlin T. Zhou B. (2004). A numerical comparison of 2D resistivity imaging with 10 electrode arrays. Geophys Prosp52 (5), 379–398. doi: 10.1111/j.1365-2478.2004.00423.x
24
Degenhardt J. Dlugosch L. Ahrens J. Beck M. Waska H. Engelen B. (2020). Seasonal dynamics of microbial diversity at a sandy high energy beach reveal a resilient core community. Front. Mar. Sci.869. doi: 10.3389/fmars.2020.573570
25
Degenhardt J. Khodami S. Milke F. Waska H. Engelen B. Arbizu P. M. (2021a). The three domains of life within the discharge area of a shallow subterranean estuary at a high energy beach. Front. Environ. Sci. 9, 642098. doi: 10.3389/fenvs.2021.642098
26
Degenhardt J. Merder J. Heyerhoff B. Simon H. Engelen B. Waska H. (2021b). Cross-shore and depth zonations in bacterial diversity are linked to age and source of dissolved organic matter across the intertidal area of a sandy beach. Microorganisms9 (8), 1720. doi: 10.3390/microorganisms9081720
27
Ehlert C. Reckhardt A. Greskowiak J. Liguori B. T. P. Böning P. Paffrath R. et al . (2016). Transformation of silicon in a sandy beach ecosystem: insights from stable silicon isotopes from fresh and saline groundwaters. Chem. Geology440, 207–218. doi: 10.1016/j.chemgeo.2016.07.015
28
Engelen B. Cypionka H. (2009). The subsurface of tidal flats as a model for the deep biosphere. Ocean Dynam59, 385–391. doi: 10.1007/s10236-008-0166-1
29
Fossing H. Jørgensen B. B. (1989). Measurement of bacterial sulfate reduction in sediments: evaluation of a single-step chromium reduction method. Biogeochemistry8 (3), 205–222. doi: 10.1007/BF00002889
30
Froelich P. N. Klinkhammer G. P. Bender M. L. Luedtke N. A. Heath G. R. Cullen D. et al . (1979). Early oxidation of organic matter in pelagic sediments of the eastern equatorial Atlantic: suboxic diagenesis. Geochim Cosmochim Acta43, 1075–1090. doi: 10.1016/0016-7037(79)90095-4
31
Goodridge B. M. Melack J. M. (2014). Temporal evolution and variability of dissolved inorganic nitrogen in beach pore water revealed using radon residence times. Environ. Sci. Technol.48 (24), 14211–14218. doi: 10.1021/es504017j
32
Greskowiak J. Massmann G. (2021). The impact of morphodynamics and storm floods on pore water flow and transport in the subterranean estuary. Hydrological Processes35, e14050. doi: 10.1002/hyp.14050
33
Greskowiak J. Seibert S. L. Post V. Massmann G. Redox-zoning in high-energy subterranean estuaries as a function of storm floods, temperatures, seasonal groundwater recharge and morphodynamics. Coast. Estuar. Shelf Sci.
34
Grinat M. Südekum W. Epping D. Grelle T. Meyer R. (2010). “An automated electrical resistivity tomography system to monitor the freshwater/saltwater zone on a north sea island,” in Near surface 2010 – 16th EAGE European meeting of environmental and engineering geophysics (Zurich, Switzerland: EAGE Publications). doi: 10.3997/2214-4609.20144785
35
Grünenbaum N. Ahrens J. Beck M. Gilfedder B. S. Greskowiak J. Kossack M. et al . (2020a). A multi-method approach for quantification of in-and exfiltration rates from the subterranean estuary of a high energy beach. Front. Earth Sci.8. doi: 10.3389/feart.2020.571310
36
Grünenbaum N. Greskowiak J. Sültenfuß J. Massmann G. (2020b). Groundwater flow and residence times below a meso-tidal high-energy beach: a model-based analyses of salinity patterns and 3H-3He groundwater ages. J. Hydrol.587, 124948. doi: 10.1016/j.jhydrol.2020.124948
37
Grünenbaum N. Günther T. Greskowiak J. Vienken T. Müller-Petke M. Massmann G. (2023). Salinity distribution in the subterranean estuary of a meso-tidal high-energy beach characterized by electrical resistivity tomography and direct push technology. J. Hydrol.617, 129074. doi: 10.1016/j.jhydrol.2023.129074
38
Heiss J. W. Michael H. A. (2014). Saltwater-freshwater mixing dynamics in a sandy beach aquifer over tidal, spring-neap, and seasonal cycles. Water Resour. Res.50 (8), 6747–6766. doi: 10.1002/2014WR015574
39
Hermans T. Vandenbohede A. Lebbe L. Martin R. Kemna A. Beaujean J. et al . (2012). Imaging artificial salt water infiltration using electrical resistivity tomography constrained by geostatistical data. J. Hydrol.438, 168–180. doi: 10.1016/j.jhydrol.2012.03.021
40
Herrling G. Winter C. (2015). Tidally- and wind-driven residual circulation at the multiple-inlet system East Frisian wadden Sea. Cont Shelf Res.106, 45–59. doi: 10.1016/j.csr.2015.06.001
41
Holt T. Seibert S. L. Greskowiak J. Freund H. Massmann G. (2017). Impact of storm tides and inundation frequency on water table salinity and vegetation on a juvenile barrier island. J. Hydrology554, 666–679. doi: 10.1016/j.jhydrol.2017.09.014
42
Ibánhez J. S. P. Rocha C. (2016). Oxygen transport and reactivity within a sandy seepage face in a mesotidal lagoon (Ria Formosa, southwestern Iberia). Limnology Oceanography61 (1), 61–77. doi: 10.1002/lno.10199
43
Jeffrey S. W. Humphrey G. F. (1975). New spectrophotometric equations for determining chlorophylls a, b, c1 and c2 in higher plants, algae and natural phytoplankton. Biochemie und Physiologie der Pflanzen167 (2), 191–194. doi: 10.1016/S0015-3796(17)30778-3
44
Kim K. H. Michael H. A. Field E. K. Ullman W. J. (2019). Hydrologic shifts create complex transient distributions of particulate organic carbon and biogeochemical responses in beach aquifers. J. Geophysical Research: Biogeosciences124 (10), 3024–3038. doi: 10.1029/2019JG005114
45
Koebsch F. Winkel M. Liebner S. Liu B. Westphal J. Schmiedinger I. et al . (2019). Sulfate deprivation triggers high methane production in a disturbed and rewetted coastal peatland. Biogeosciences16, 1937–1953. doi: 10.5194/bg-16-1937-2019
46
Kostka J. E. Luther G. W. (1994). Partitioning and speciation of solid phase iron in saltmarsh sediments. Geochim Cosmochim Acta58 (7), 1701–1710. doi: 10.1016/0016-7037(94)90531-2
47
Langevin C. D. Thorne D. T. Jr. Dausman A. M. Sukop M. C. Guo W. (2008) SEAWAT version 4: a computer program for simulation of multi-species solute and heat transport (6-A22). Available at: http://pubs.er.usgs.gov/publication/tm6A22.
48
Larcombe M. J. Jordan G. J. Bryant D. Higgins S. I. (2018). The dimensionality of niche space allows bounded and unbounded processes to jointly influence diversification. Nat. Commun.9 (1), 4258. doi: 10.1038/s41467-018-06732-x
49
Lecher A. L. Chien C. T. Paytan A. (2016). Submarine groundwater discharge as a source of nutrients to the north pacific and Arctic coastal ocean. Mar. Chem.186, 167–177. doi: 10.1016/j.marchem.2016.09.008
50
Linkhorst A. Dittmar T. Waska H. (2017). Molecular fractionation of dissolved organic matter in a shallow subterranean estuary: the role of the iron curtain. Environ. Sci. Technol.51, 1312–1320. doi: 10.1021/acs.est.6b03608
51
Liu Y. Jiao J. J. Liang W. (2018a). Tidal fluctuation influenced physicochemical parameter dynamics in coastal groundwater mixing zone. Estuaries Coasts41, 988–1001. doi: 10.1007/s12237-017-0335-x
52
Liu Y. Liang W. Jiao J. J. (2018b). Seasonality of nutrient flux and biogeochemistry in an intertidal aquifer. J. Geophys Res. Oceans123, 6116–6135. doi: 10.1029/2018jc014197
53
Liu Y. Not C. Jiao J. J. Liang W. Lu M. (2019). Tidal induced dynamics and geochemical reactions of trace metals (Fe, Mn, and Sr) in the salinity transition zone of an intertidal aquifer. Sci. Total Environ.664, 1133–1149. doi: 10.1016/j.scitotenv.2019.01.374
54
Loveless A. M. Oldham C. E. (2010). Natural attenuation of nitrogen in groundwater discharging through a sandy beach. Biogeochemistry98 (1–3), 75–87. doi: 10.1007/s10533-009-9377-x
55
Marchant H. K. Ahmerkamp S. Lavik G. Tegetmeyer H. E. Graf J. Klatt J. M. et al . (2017). Denitrifying community in coastal sediments performs aerobic and anaerobic respiration simultaneously. ISME J.11, 1799–1812. doi: 10.1038/ismej.2017.51
56
Marchant H. K. Lavik G. Holtappels M. Kuypers M. M. M. (2014). The fate of nitrate in intertidal permeable sediments. PloS One9, e104517. doi: 10.1371/journal.pone.0104517
57
McAllister S. M. Barnett J. M. Heiss J. W. Findlay A. J. MacDonald D. J. Dow C. L. et al . (2015). Dynamic hydrologic and biogeochemical processes drive microbially enhanced iron and sulfur cycling within the intertidal mixing zone of a beach aquifer. Limnology Oceanography60, 329–345. doi: 10.1002/lno.10029
58
Michael H. A. Mulligan A. E. Harvey C. F. (2005). Seasonal oscillations in water exchange between aquifers and the coastal ocean. Nature436, 1145–1148. doi: 10.1038/nature03935
59
Montaño J. Blossier B. Osorio A. F. Winter C. (2020). The role of frequency spread on swash dynamics. Geo-Mar Lett.40, 243–254. doi: 10.1007/s00367-019-00591-1
60
Moore W. S. (1999). The subterranean estuary: a reaction zone of ground water and sea water. Mar. Chem.65, 111–125. doi: 10.1016/S0304-4203(99)00014-6
61
Moore W. S. (2010). The effect of submarine groundwater discharge on the ocean. Annu. Rev. Mar. Sci.2, 59–88. doi: 10.1146/annurev-marine-120308-081019
62
Moore W. S. Beck M. Riedel T. van der Loeff M. R. Dellwig O. Shaw T. J. et al . (2011). Radium-based porewater fluxes of silica, alkalinity, manganese, DOC, and uranium: a decade of studies in the German wadden Sea. Geochim Cosmochim Acta75, 6535–6555. doi: 10.1016/j.gca.2011.08.037
63
Moosdorf N. Böttcher M. E. Adyasari D. Erkul E. Gilfedder B. Greskowiak J. et al . (2021). A state-of-the-art perspective on the characterization of subterranean estuaries at the regional scale. Front. Earth Sci.9, 601293. doi: 10.3389/feart.2021.601293
64
Nielsen P. (1990). Tidal dynamics of the water table in beaches. Water Resour Res.26, 2127–2134. doi: 10.1029/WR026i009p02127
65
pegelonline (2022). Available at: https://www.pegelonline.wsv.de/gast/stammdaten?pegelnr=9420030.
66
Pollmann T. Junge B. Giani L. (2018). Landscapes and soils of north Sea barrier islands: a comparative analysis of the old West and young East of spiekeroog island (Germany). Erdkunde72, 273–286. doi: 10.3112/erdkunde
67
Post V. E. A. Prommer H. (2007). Multicomponent reactive transport simulation of the elder problem: effects of chemical reactions on salt plume development. Water Resour Res.43 (10), W10404. doi: 10.1029/2006WR005630
68
Rao A. M. F. McCarthy M. J. Gardner W. S. Jahnke R. A. (2007). Respiration and denitrification in permeable continental shelf deposits on the south Atlantic bight: rates of carbon and nitrogen cycling from sediment column experiments. Continental Shelf Res.27 (13), 1801–1819. doi: 10.1016/j.csr.2007.03.001
69
Reckhardt A. Beck M. Greskowiak J. Schnetger B. Böttcher M. E. Gehre M. et al . (2017). Cycling of redox-sensitive elements in a sandy subterranean estuary of the southern north Sea. Mar. Chem.188, 6–17. doi: 10.1016/j.scitotenv.2021.144964
70
Reckhardt A. Beck M. Seidel M. Riedel T. Wehrmann A. Bartholomä A. et al . (2015). Carbon, nutrient and trace metal cycling in sandy sediments: a comparison of high-energy beaches and backbarrier tidal flats. Estuar. Coast. Shelf Sci.159, 1–14. doi: 10.1016/j.ecss.2015.03.025
71
Reckhardt A. Seibert S. L. Holt T. Ahrens J. Beck M. Massmann G. et al . (2021). Cycling of redox-sensitive trace metals in barrier island freshwater lenses. Sci. Total Environ.768, 144964. doi: 10.1016/j.scitotenv.2021.144964
72
Robinson C. Gibbes B. Carey H. Li L. (2007a). Salt-freshwater dynamics in a subterranean estuary over a spring-neap tidal cycle. JGR Oceans112, 9. doi: 10.1029/2006JC003888
73
Robinson C. Gibbes B. Li L. (2006). Driving mechanisms for groundwater flow and salt transport in a subterranean estuary. Geophys Res. Lett.33, L03402. doi: 10.1029/2005GL025247
74
Robinson C. Li L. Barry D. A. (2007b). Effect of tidal forcing on a subterranean estuary. Adv. Water Resour.30, 851–865. doi: 10.1016/j.advwatres.2006.07.006
75
Robinson C. Xin P. Li L. Barry D. A. (2014). Groundwater flow and salt transport in a subterranean estuary driven by intensified wave conditions. Wat Resour Res.50, 165–181. doi: 10.1002/2013WR013813
76
Robinson C. E. Xin P. Santos I. R. Charette M. A. Li L. Barry D. A. (2018). Groundwater dynamics in subterranean estuaries of coastal unconfined aquifers: controls on submarine grundwater discharge and chemical inputs to the ocean. Adv. Water Res.115, 315–331. doi: 10.1016/j.advwatres.2017.10.041
77
Rodellas V. Garcia-Orellana J. Masque P. Feldman M. Weinstein Y. (2015). Submarine groundwater discharge as a major source of nutrients to the Mediterranean Sea. PNAS112, 3926–3930. doi: 10.1073/pnas.1419049112
78
Ronczka M. Günther T. Grinat M. Wiederhold H. (2020). Monitoring freshwater-saltwater interfaces with SAMOS – installation effects on data and inversion. Near Surf Geophys18 (4), 369–383. doi: 10.1002/nsg.12115
79
Röper T. Greskowiak J. Freund H. Massmann G. (2013). Freshwater lens formation below juvenile dunes on a barrier island (Spiekeroog, Northwest Germany). Estuar. Coast. Shelf Sci.121, 40–50. doi: 10.1016/j.ecss.2013.02.004
80
Röper T. Kroger K. F. Meyer H. Sultenfuss J. Greskowiak J. Massmann G. (2012). Groundwater ages, recharge conditions and hydrochemical evolution of a barrier island freshwater lens (Spiekeroog, northern Germany). J. Hydrol.454, 173–186. doi: 10.1016/j.jhydrol.2012.06.011
81
Røy H. Weber H. S. Tarpgaard I. H. Ferdelman T. G. Jørgensen B. B. (2014). Determination of dissimilatory sulfate reduction rates in marine sediment via radioactive 35S tracer. Limnol Oceanogr-meth12 (4), 196–211. doi: 10.4319/lom.2014.12.196
82
Ruiz-González C. Rodellas V. Garcia-Orellana J. (2021). The microbial dimension of submarine groundwater discharge: current challenges and future directions. FEMS Microbiol. Rev.455, fuab010. doi: 10.1093/femsre/fuab010
83
Santos I. R. Burnett W. C. Chanton J. Mwashote B. Suryaputra I. G. N. A. Dittmar T. (2008). Nutrient biogeochemistry in a gulf of Mexico subterranean estuary and groundwater-derived fluxes to the coastal ocean. Limnol Oceanogr.53, 705–718. doi: 10.4319/lo.2008.53.2.0705
84
Sawyer A. H. David C. H. Famiglietti J. S. (2016). Continental patterns of submarine groundwater discharge reveal coastal vulnerabilities. Science353, 705–707. doi: 10.1126/science.aag1058
85
Schnetger B. Lehners C. (2014). Determination of nitrate plus nitrite in small volume marine water samples using vanadium(III)chloride as a reduction agent. Mar. Chem.160, 91e98. doi: 10.1016/j.marchem.2014.01.010
86
Seibert S. L. Böttcher M. E. Schubert F. Pollmann T. Giani L. Tsukamoto S. et al . (2019a). Iron sulfide formation in young and rapidly-deposited permeable sands at the land-sea transition zone. Sci. Total Environ.649, 264–283. doi: 10.1016/j.scitotenv.2018.08.278
87
Seibert S. L. Böttcher M. E. Waska H. Holt T. Pollmann T. Greskowiak J. et al . (2021). Hydrogeochemistry of near-surface groundwater on a developing barrier island (Spiekeroog, germany): the role of inundation, season and vegetation. J. Hydrology597, 126139. doi: 10.1016/j.jhydrol.2021.126139
88
Seibert S. L. Greskowiak J. Prommer H. Böttcher M. E. Massmann G. (2019b). Modeling of biogeochemical processes in a barrier island freshwater lens (Spiekeroog, Germany). J. Hydrology575, 1133–1144. doi: 10.1016/j.jhydrol.2019.05.094
89
Seibert S. L. Holt T. Reckhardt A. Ahrens J. Beck M. Pollmann T. et al . (2018). Hydrochemical evolution of a freshwater lens below a barrier island (Spiekeroog, germany): the role of carbonate mineral reactions, cation exchange and redox processes. Appl. Geochem92, 186–208. doi: 10.1016/j.apgeochem.2018.03.001
90
Seidel M. Beck M. Greskowiak J. Riedel T. Waska H. Suryaputra I. G. N. A. et al . (2015). Benthic-pelagic coupling of nutrients and dissolved organic matter composition in an intertidal sandy beach. Mar. Chem.176, 150–163. doi: 10.1016/j.marchem.2015.08.011
91
Sindowski K. H. (1970). Erläuterungen zu blatt spiekeroog nr. 2212, niedersächsisches landesamt für bodenforschung (Hannover: Niedersächsisches Landesamt für Bodenforschung).
92
Streif H. (1990). Das ostfriesische küstengebiet (Inseln, Watten und Marschen. Sammlung geologischer Führer, Gebrüder Borntraeger, Berlin- Stuttgart: Nordsee).
93
Tronicke J. Blindow N. Groß R. Lange M. A. (1999). Joint application of surface electrical resistivity- and GPR-measurements for groundwater exploration on the island of spiekeroog – northern Germany. J. Hydrol223, 44–53. doi: 10.1016/S0022-1694(99)00111-0
94
Viollier E. Inglett P. Hunter K. Roychoudhury A. Van Cappellen P. (2000). The ferrozine method revisited: fe (II)/Fe (III) determination in natural waters. Appl. Geochem15, 785–790. doi: 10.1016/S0883-2927(99)00097-9
95
Voelz J. L. Johnson N. W. Chun C. L. Arnold W. A. Penn R. L. (2019). Quantitative dissolution of environmentally accessible iron residing in iron-rich minerals: a review. ACS EarthSpace Chem.3, 1371–1392. doi: 10.1021/acsearthspacechem.9b00012
96
Waska H. Greskowiak J. Ahrens J. Beck M. Ahmerkamp S. Böning P. et al . (2019). Spatial and temporal patterns of pore water chemistry in the inter-tidal zone of a high energy beach. Front. Mar. Sci.6, 154. doi: 10.3389/fmars.2019.00154
97
Waska H. Simon H. Ahmerkamp S. Greskowiak J. Ahrens J. Seibert S. L. et al . (2021). Molecular traits of dissolved organic matter in the subterranean estuary of a high-energy beach: indications of sources and sinks. Front. Mar. Sci.8. doi: 10.3389/fmars.2021.607083
98
Winde V. Böttcher M. E. Escher P. Böning P. Beck M. Liebezeit G. et al . (2014). Tidal and spatial variations of DI13C and aquatic chemistry in a temperate tidal basin during winter time. J. Mar. Syst.129, 394–402. doi: 10.1016/j.jmarsys.2013.08.005
99
Wunderlich T. Fischer P. Wilken D. Hadler H. Erkul E. Mecking R. et al . (2018). Constraining electric resistivity tomography by direct push electric conductivity logs and vibracores: an exemplary study of the fiume morto silted riverbed (Ostia antica, Western Italy). Geophysics83 (3), B87–B103. doi: 10.1190/geo2016-0660.1
100
Zhou Z. Henkel S. Kasten S. Holtappels M. (2023). The iron “redox battery” in sandy sediments: its impact on organic matter remineralization and phosphorus cycling. Sci. Total Environ.865, 161168. doi: 10.1016/j.scitotenv.2022.161168
101
Zielinski O. Pieck D. Schulz J. Thölen C. Wollschläger J. Albinus M. et al . (2022). The spiekeroog coastal observatory: a scientific infrastructure at the land-sea transition zone (southern north Sea). Front. Mar. Science section Ocean Observation754905. doi: 10.3389/fmars.2021.754905
Summary
Keywords
beach, land-sea interface, submarine groundwater discharge (SGD), groundwater, morphodynamics, Spiekeroog, biogeochemistry, infrastructure
Citation
Massmann G, Abarike G, Amoako K, Auer F, Badewien TH, Berkenbrink C, Böttcher ME, Brick S, Cordova IVM, Cueto J, Dittmar T, Engelen B, Freund H, Greskowiak J, Günther T, Herbst G, Holtappels M, Marchant HK, Meyer R, Müller-Petke M, Niggemann J, Pahnke K, Pommerin D, Post V, Reckhardt A, Roberts M, Schwalfenberg K, Seibert SL, Siebert C, Skibbe N, Waska H, Winter C and Zielinski O (2023) The DynaDeep observatory – a unique approach to study high-energy subterranean estuaries. Front. Mar. Sci. 10:1189281. doi: 10.3389/fmars.2023.1189281
Received
18 March 2023
Accepted
29 May 2023
Published
22 June 2023
Volume
10 - 2023
Edited by
Jiapeng Wu, Guangzhou University, China
Reviewed by
Henry Bokuniewicz, The State University of New York (SUNY), United States; Yi Liu, The Hong Kong University of Science Technology (Guangzhou), China
Updates
Copyright
© 2023 Massmann, Abarike, Amoako, Auer, Badewien, Berkenbrink, Böttcher, Brick, Cordova, Cueto, Dittmar, Engelen, Freund, Greskowiak, Günther, Herbst, Holtappels, Marchant, Meyer, Müller-Petke, Niggemann, Pahnke, Pommerin, Post, Reckhardt, Roberts, Schwalfenberg, Seibert, Siebert, Skibbe, Waska, Winter and Zielinski.
This is an open-access article distributed under the terms of the Creative Commons Attribution License (CC BY). The use, distribution or reproduction in other forums is permitted, provided the original author(s) and the copyright owner(s) are credited and that the original publication in this journal is cited, in accordance with accepted academic practice. No use, distribution or reproduction is permitted which does not comply with these terms.
*Correspondence: Gudrun Massmann, gudrun.massmann@uni-oldenburg.de
Disclaimer
All claims expressed in this article are solely those of the authors and do not necessarily represent those of their affiliated organizations, or those of the publisher, the editors and the reviewers. Any product that may be evaluated in this article or claim that may be made by its manufacturer is not guaranteed or endorsed by the publisher.