Abstract
Fresh submarine groundwater discharge (FSGD) influences the biogeochemistry of coastal areas and can be a proxy for potential untapped resources of offshore freshened groundwater (OFG). In most areas however, the onshore-offshore connection and the recharge characteristics of offshore aquifers are poorly constrained, making a potential exploitation of this resource challenging. Offshore Wellington (New Zealand), a well-defined onshore aquifer system extends beneath the harbour, where substantial amounts of freshwater seep out from the ocean floor. The aquifer system has been studied in detail and recently the first attempts worldwide have been made here to use the offshore groundwater as a future source of drinking water. However, the locations and extent of FSGD as well as its influence on seafloor morphology are still poorly understood. Exact localisation of FSGD sites is essential to sample and quantify discharging waters but remains challenging due to a lack of robust and appropriate measurement procedures. Novel sensing strategies, such as the influence of seeping groundwater on hydroacoustic water column reflectivity could greatly improve the identification of groundwater discharge locations worldwide. Therefore, we use a multidisciplinary dataset and evaluate different methodologies to map the spatial extent of FSGD sites and determine their geomorphologic expressions on the seafloor of Wellington Harbour. In this study, single and multibeam hydroacoustics and towfish (temperature, salinity and turbidity) transects were combined with remotely operated vehicle (ROV) dives and sediment cores to better characterise FSGD sites. We observed several hundred seafloor depressions (pockmarks) that we attribute to continuous seepage of gas and groundwater from the seafloor. Different pockmark morphologies indicate different fluid flow regimes and the persistent flow allows even small pockmarks to remain unchanged over time, while the geomorphologic expressions of anchor scours on the seafloor diminish in the same region. Enhanced hydroacoustic reflections in the water column within and above the pockmarks indicate suspended sediment particles, which are likely kept in suspension by discharging groundwater and density boundaries.
1 Introduction
Submarine groundwater discharge (SGD) is a common global phenomenon that describes the flow of fresh or saline waters from the subsurface into the ocean. Fresh submarine groundwater discharge (FSGD) generally occurs in regions where onshore aquifers with higher terrestrial hydraulic heads compared to the sea-level are hydraulically connected to the ocean (Moore, 1996). Where confined aquifers extend beneath the ocean, offshore freshened groundwater systems (OFGs) can form. The latter have increasingly gained scientific interest in the past decade due to their potential to mitigate freshwater scarcity in coastal areas (Post et al., 2013; Berndt and Micallef, 2019; Micallef et al., 2020a). With the advance of climate change and an expected increase in global droughts, coastal populations and pollution, coastal aquifers are under increasing pressure (Seager et al., 2007; IPCC and Core Writing Team, 2014; Neumann et al., 2015). Generally, onshore aquifer systems are well constrained by wells, geochemical groundwater characterisation and monitoring, while the offshore component remains hidden beneath the ocean. SGD is often the only available insight into the OFG compartment. Since the global volume of SGD supplies the same amount or even more nutrients to coastal areas compared to global rivers (Seitzinger and Harrison, 2008; Knee and Paytan, 2011; Santos et al., 2021), SGD locally drives primary productivity (Rocha et al., 2015), influences marine ecological systems (Starke et al., 2020) and can trigger harmful algal blooms (Hu et al., 2006; Lee et al., 2010; Luo and Jiao, 2016). Additionally, SGD not only influences the local submarine geomorphology (Rousakis et al., 2014; Purkamo et al., 2022) but is also thought to create mechanical instabilities in continental margins, potentially shaping submarine landscapes at regional scale (Saadatkhah et al., 2023). Although SGD has been intensively investigated worldwide, the sources and locations of discharge often remain unknown due to the discrete nature of point measurements generally used in geochemical characterisations. Therefore, robust monitoring techniques and a better understanding of the onshore-offshore connectivity between OFG systems are urgently required to assess the potential of OFG as an unconventional future resource (Arévalo-Martínez et al., 2023).
In Aotearoa/New Zealand, OFG bodies have been identified offshore Canterbury by Micallef et al., (2020b) whereas the likelihood of OFG around New Zealand’s coasts was further investigated by Morgan and Mountjoy (2022). Groundwater is an important source of potable water in the Te Whanganui-a-Tara/Wellington Region at the bottom of the North Island, where the Hutt Valley supplies about a third of Wellington’s water supply from alluvial deposits (Jones and Baker, 2005). Although the onshore and offshore part of the confined aquifers in the Lower Hutt Valley is well constrained, the FSGD into the harbour is still poorly understood.
Here we improve the general understanding of offshore confined aquifer systems by investigating the spatial and temporal characteristics of FSGD from a well-defined and spatially constrained aquifer system offshore Wellington, New Zealand (Figure 1). We focus on naturally occurring groundwater seepage sites within Wellington Harbour and aim to: 1) use a combination of hydroacoustic and towfish data for rapid mapping of FSGD; 2) characterise the spatial distribution of FSGD; 3) evaluate influences of FSGD on seafloor morphology; and 4) develop a conceptual model of the aquifer and FSGD system.
Figure 1
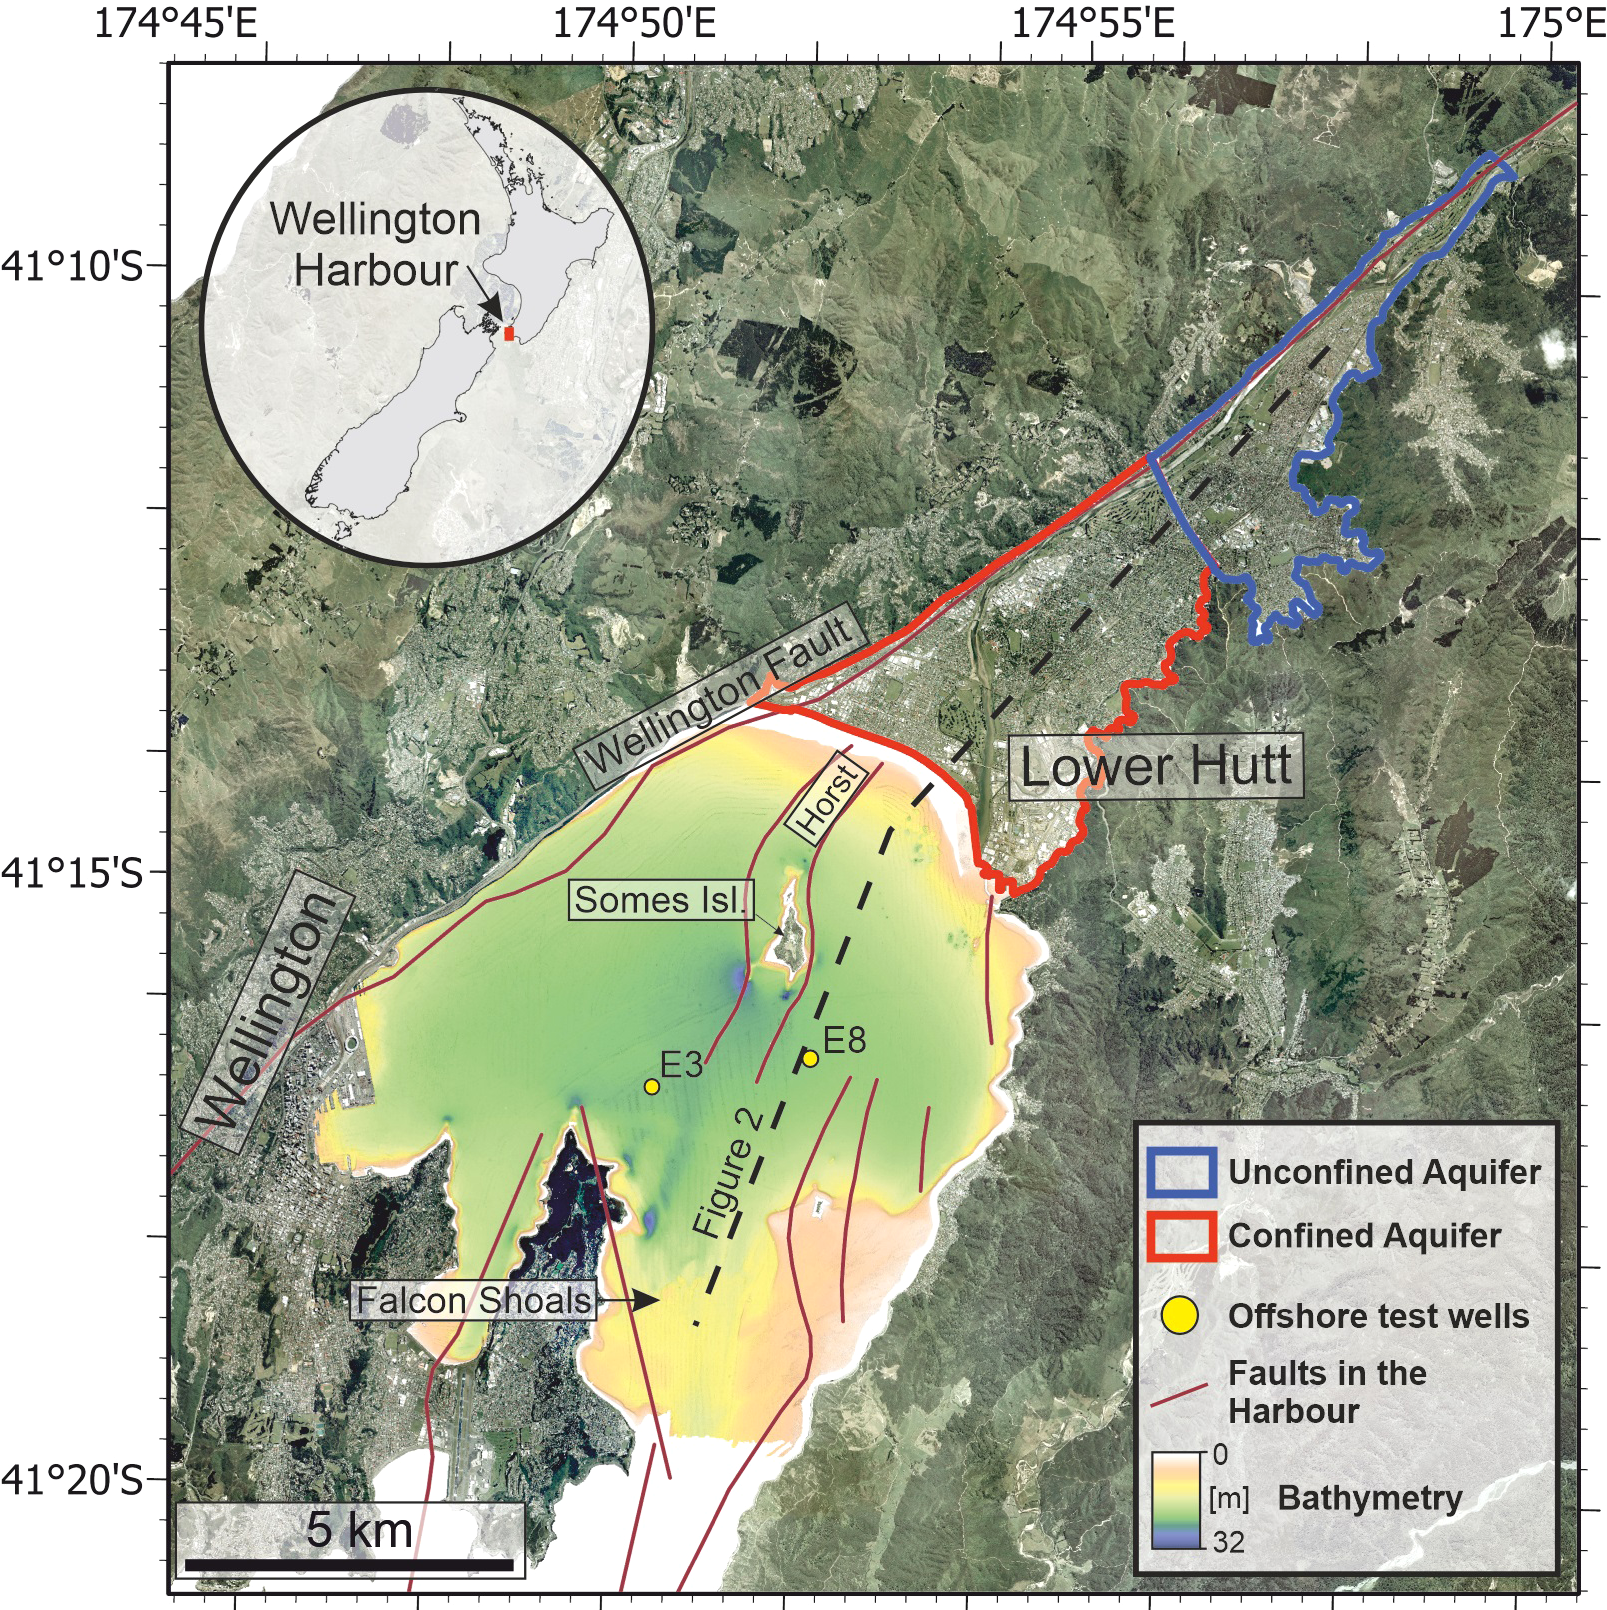
Bathymetry of the Wellington Harbour with the Lower Hutt aquifer system and groundwater test wells.
2 Study site
The Lower Hutt Valley evolved as a result of movement along the Wellington Fault. Sediments in the basin accumulated to thicknesses of a few meters in the north near Taita Gorge, and to over 600 m in the harbour, since the middle to late Quaternary period (Jones and Baker, 2005). The sediments are confined in the east by the Wellington Fault and onlap toward the west on the basement rock. They mainly consist of gravel, sands and silts sourced from the southern Tararua Range and deposited by the Hutt River. These alluvial sediments are interbedded with fine-grained marine sediments that were deposited within the last 350 ka during eustatic sea-level high stands (Mildenhall, 1994). While the alluvial gravel deposits form the high-yielding aquifers of the region, the repeated marine sequences act as aquicludes and confining units. The first bore discovering the artesian waters in the Lower Hutt valley was drilled in 1883 (Hughes and Morgan, 2001). Since then, the artesian aquifer has been intensively investigated and today supplies the majority of Lower Hutt and Wellingtons potable water. The aquifers remain unconfined in the higher elevated regions in the north of the Hutt Valley (north of Kennedy Good Bridge) and become confined in the southwest (Figures 1, 2). Recharge occurs predominantly by the Hutt River in the unconfined parts, while rainfall recharge comprises a minor component (Donaldson and Campbell, 1977).
Figure 2
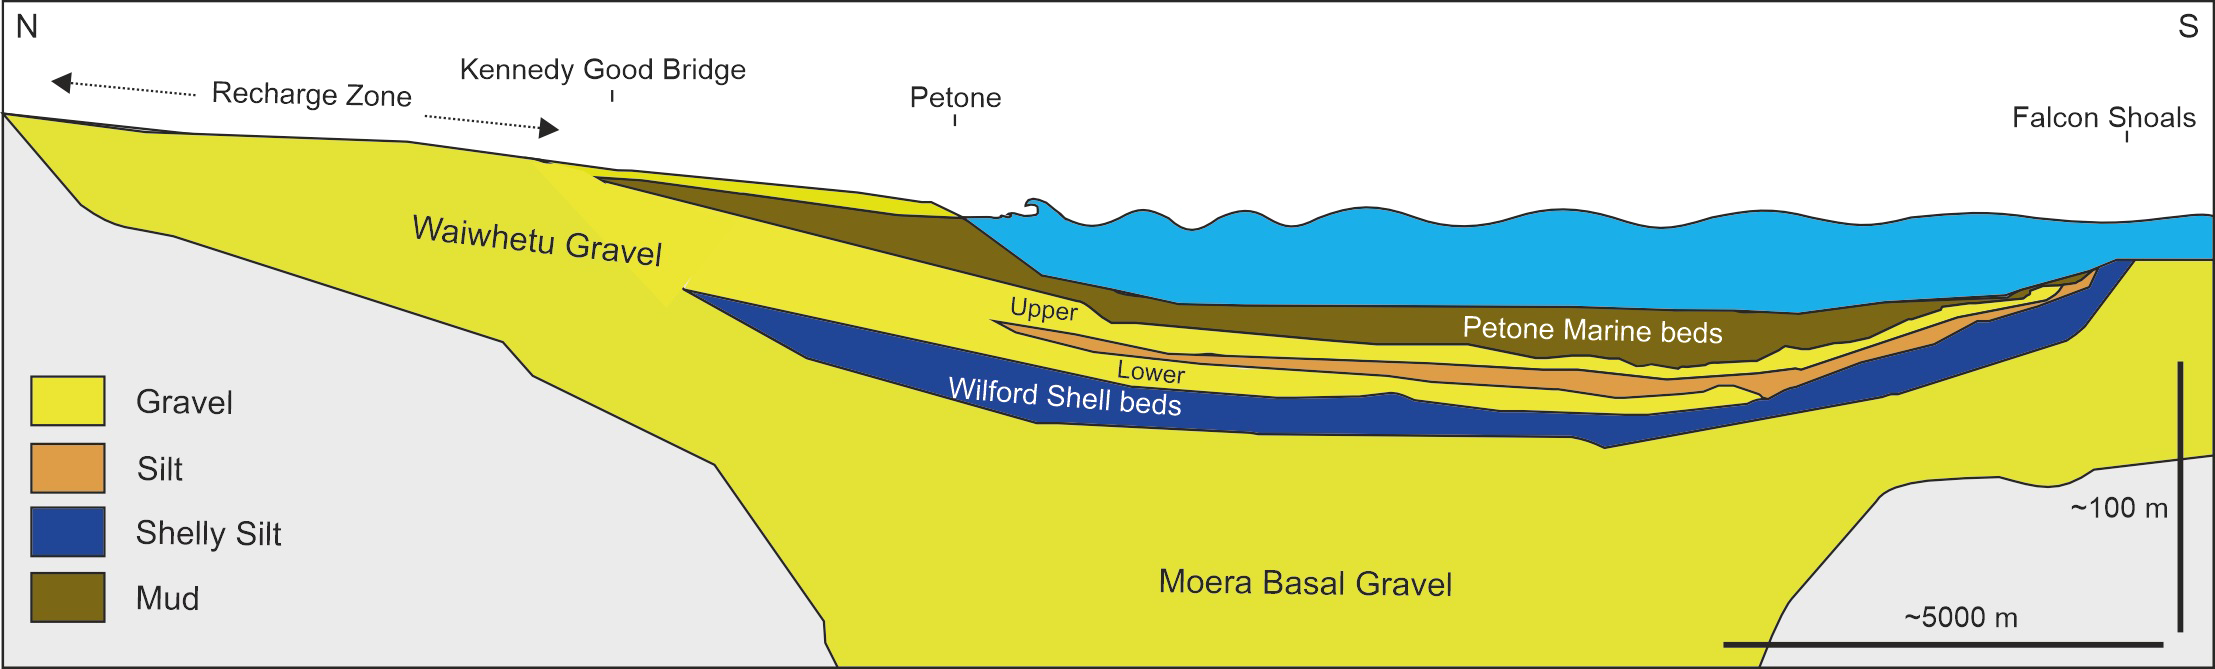
Conceptual cross section through the harbour based on well and seismic interpretations from Stevens (1974); Donaldson and Campbell (1977); Wood and Davy (1992); Brown and Jones (2000), and Gyopari et al. (2018).
Two main confined aquifer systems extend down the Valley: the Waiwhetu and Moera gravels, which are separated by the low permeable marine Wilford Shell Beds (Figure 2). The Waiwhetu aquifer is further sub-divided by a continuous fine-grained layer into upper and lower units. The Upper Waiwhetu is the primary aquifer, with transmissivity values up to 25000 m²/day, while the Moera and Lower Waiwhetu are less productive (Brown and Jones, 2000; Jones and Baker, 2005). The aquifers extend offshore beneath the Wellington Harbour and are thought to extend southward as far as the harbour entrance at Flacon Shoals (Stevens, 1974). In the northeast of the harbour, a horst structure subaerially exposes the basement rock, forming Matiu/Somes Island. The Waiwhetu aquifer forms around this island and is confined at the top by the Petone Marine Beds, which form the upper aquiclude and present-day seafloor in the Wellington Harbour.
Acoustic blanking, likely associated to shallow free gas within the sediment, occurs extensively in the harbour, especially in water depths greater than 18 m (Lewis and Mildenhall, 1985; Nodder et al., 2018; Barnes et al., 2019). The gas is thought to be of microbial origin forming due to the decomposition of the organic rich mud (Barnes et al., 2019). The gas mainly occurs in the north, south and west of Somes Island, while no blanking is observed in the east (Nodder et al., 2018). Seafloor depressions, so called pockmarks, were previously identified in single beam echosounder data and described by Harding (2000). Pockmarks generally form due to fluid seepage (e.g. gas or groundwater) from the seafloor (Judd and Hovland, 2009). These features are abundant around New Zealand (mostly in deeper waters on the continental slopes), but often their origin remains unknown (Davy et al., 2010; Greinert et al., 2010; Hillman et al., 2015; Hoffmann et al., 2019; Stott et al., 2019; Maier et al., 2021; Micallef et al., 2022).
Two offshore wells E3 and E8 were drilled into the harbour aquifers with depths below the seafloor of 79.3 m and 71.15 m respectively (Gyopari et al., 2018)(Figure 1). The aim was to explore the use of offshore freshwater as a supply for drinking water and thereby improving the resilience of Wellingtons water supply to natural hazards such as a rupture of the Wellington Fault and associated rupture of water pipelines (Rowan and Pipe, 2019). This pioneering work was the first attempt worldwide to use OFG as a source for significant drinking water supply. The required treatment (to reduce elevated arsenic, iron and manganese concentrations) of the offshore groundwater to meet drinking water standards meant the resource is likely not economically viable (Rowan and Pipe, 2019). Isotopic analysis of wells on Somes Island indicate residence times of 18-20 years in the Upper Waiwhetu aquifer, while groundwater from the E3 and E8 bores (Figure 1) have an average age of at least 100 years (Rowan and Pipe, 2019). This shows how flow velocities within the offshore component of the harbour decrease with distance from land.
3 Methods
3.1 Multibeam echosounder
Two different multibeam echosounder (MBES) datasets, covering two different time periods, were used within this study to examine morphological changes over time. The first dataset was acquired in 2009 by Pallentin et al. (2009). The data were acquired using a 300 kHz Kongsberg EM3000 and processed at 1 m resolution to create a bathymetric grid of the Wellington Harbour seafloor. The second dataset was acquired on the RV Ikatere during cruise IKA2011 in 2020. A Kongsberg EM2040 was deployed through RV Ikatere’s moonpool and operated at a constant frequency of 300 kHz. The EM2040 was motion compensated and calibrated over a ship wreck (South Seas). Sound velocity profiles of the water column were collected using an AML Base X2 sound velocity probe to correct the bathymetric and water column data. The 2020 dataset resurveyed pockmarks around the Petone foreshore and Somes Island (Figure 3).
Figure 3
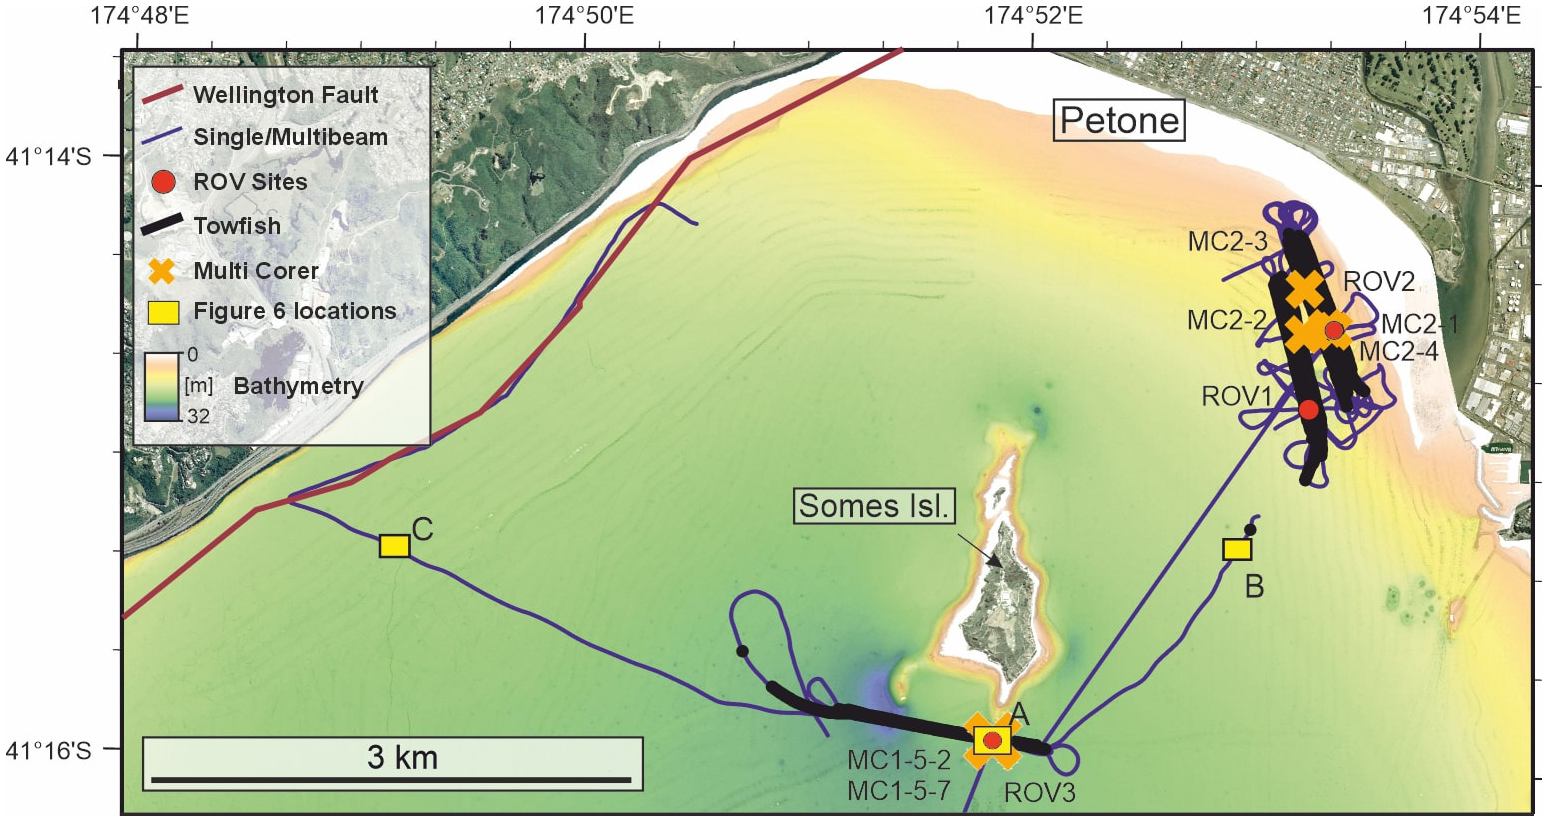
Locations and areas investigated during IKA2011 cruise with sediment cores, ROV dives, towfish transects, acoustic data coverage and locations of Figure 6.
Both datasets were postprocessed and visualized using QPS Qimera, FMMidwater and FMGeocoder. Although tide gauges within the harbour were made available and all bathymetry data were tide-corrected, vertical inaccuracies and differences in vessel configurations make an exact vertical comparison between the datasets difficult. Therefore, only morphological changes were considered for the comparison of the two datasets.
3.2 Single beam echosounder
Two individual Kongsberg Simrad EK80 fisheries echosounders were operated in chirp mode. The two sounders simultaneously emitted wideband frequency sweep signals of 55-90 kHz (70 kHz primary frequency) and 90-170 kHz (120 kHz primary frequency) respectively. This setup allowed us to determine the wideband frequency response of specific targets in the water column. The sounders were calibrated for target strength prior to the survey using a calibrated sphere and the data were analysed using ESP3 software (Ladroit et al., 2020).
3.3 Towfish
“BIO-FISH” (ADM Elektronik) is a towed multi-parameter system which measured pressure, temperature, conductivity (salinity), and turbidity of the water column at a 1 Hz interval while underway. The depth of the towfish is manually controlled using a joystick to adjust the control fins (wings), with the aim of “flying” the instrument in transects about 1 m above the seafloor. An acoustic transducer, mounted to the vessel transom, provided an upcoming seafloor morphology trace to allow for fine scale adjustments in towfish depth with changes in bathymetry. Towfish transects were measured in conjunction with single and MBES transects to provide comparative temperature, salinity, and turbidity observations with hydroacoustic data.
3.4 Sediment cores
We collected 8 sediment cores in different regions of the harbour using a multi- and gravity-corer. Sediment recovery ranged between 17 and 80 cm (Figures 3–5). In the muddy deeper regions within the harbour, a multi corer provided good core recoveries, ranging between 17 and 53 cm, while a gravity corer, with 1.5 m long barrels, was necessary to extract sediment cores in the shelly and hard seafloor habitats around the harbour entrance at Falcon Shoals. We used Rhizon samplers with a diameter of 2.5 mm (Rhizosphere Research Products) to extract porewaters from all collected cores. Intervals for porewater extraction increased with depth of the core from 2 cm at the top to 8 cm at the bottom. The Rhizon samplers were inserted into predrilled holes in the core tubes (2 cm interval), which were sealed off with adhesive tape prior to subsampling. We used Rhizon Samplers CSS, 5 cm porous, 12 cm tubing, female luer with male luer 10 ml syringes and wood bricks to hold syringes open. The samples were filtered through Sartorius minisart syringe filters (45 µm) and subsequently analysed by a Dionex ICS 2000 ion chromatograph. Due to insufficient sample yield through the Rhizons and resulting measuring issues, 4% of the analysed samples showed unrealistically high salinity values of up to 125 PSU. These samples were excluded from Figure 5. All measured samples including the erroneous data are provided in the Supplementary Figure 1.
Figure 4
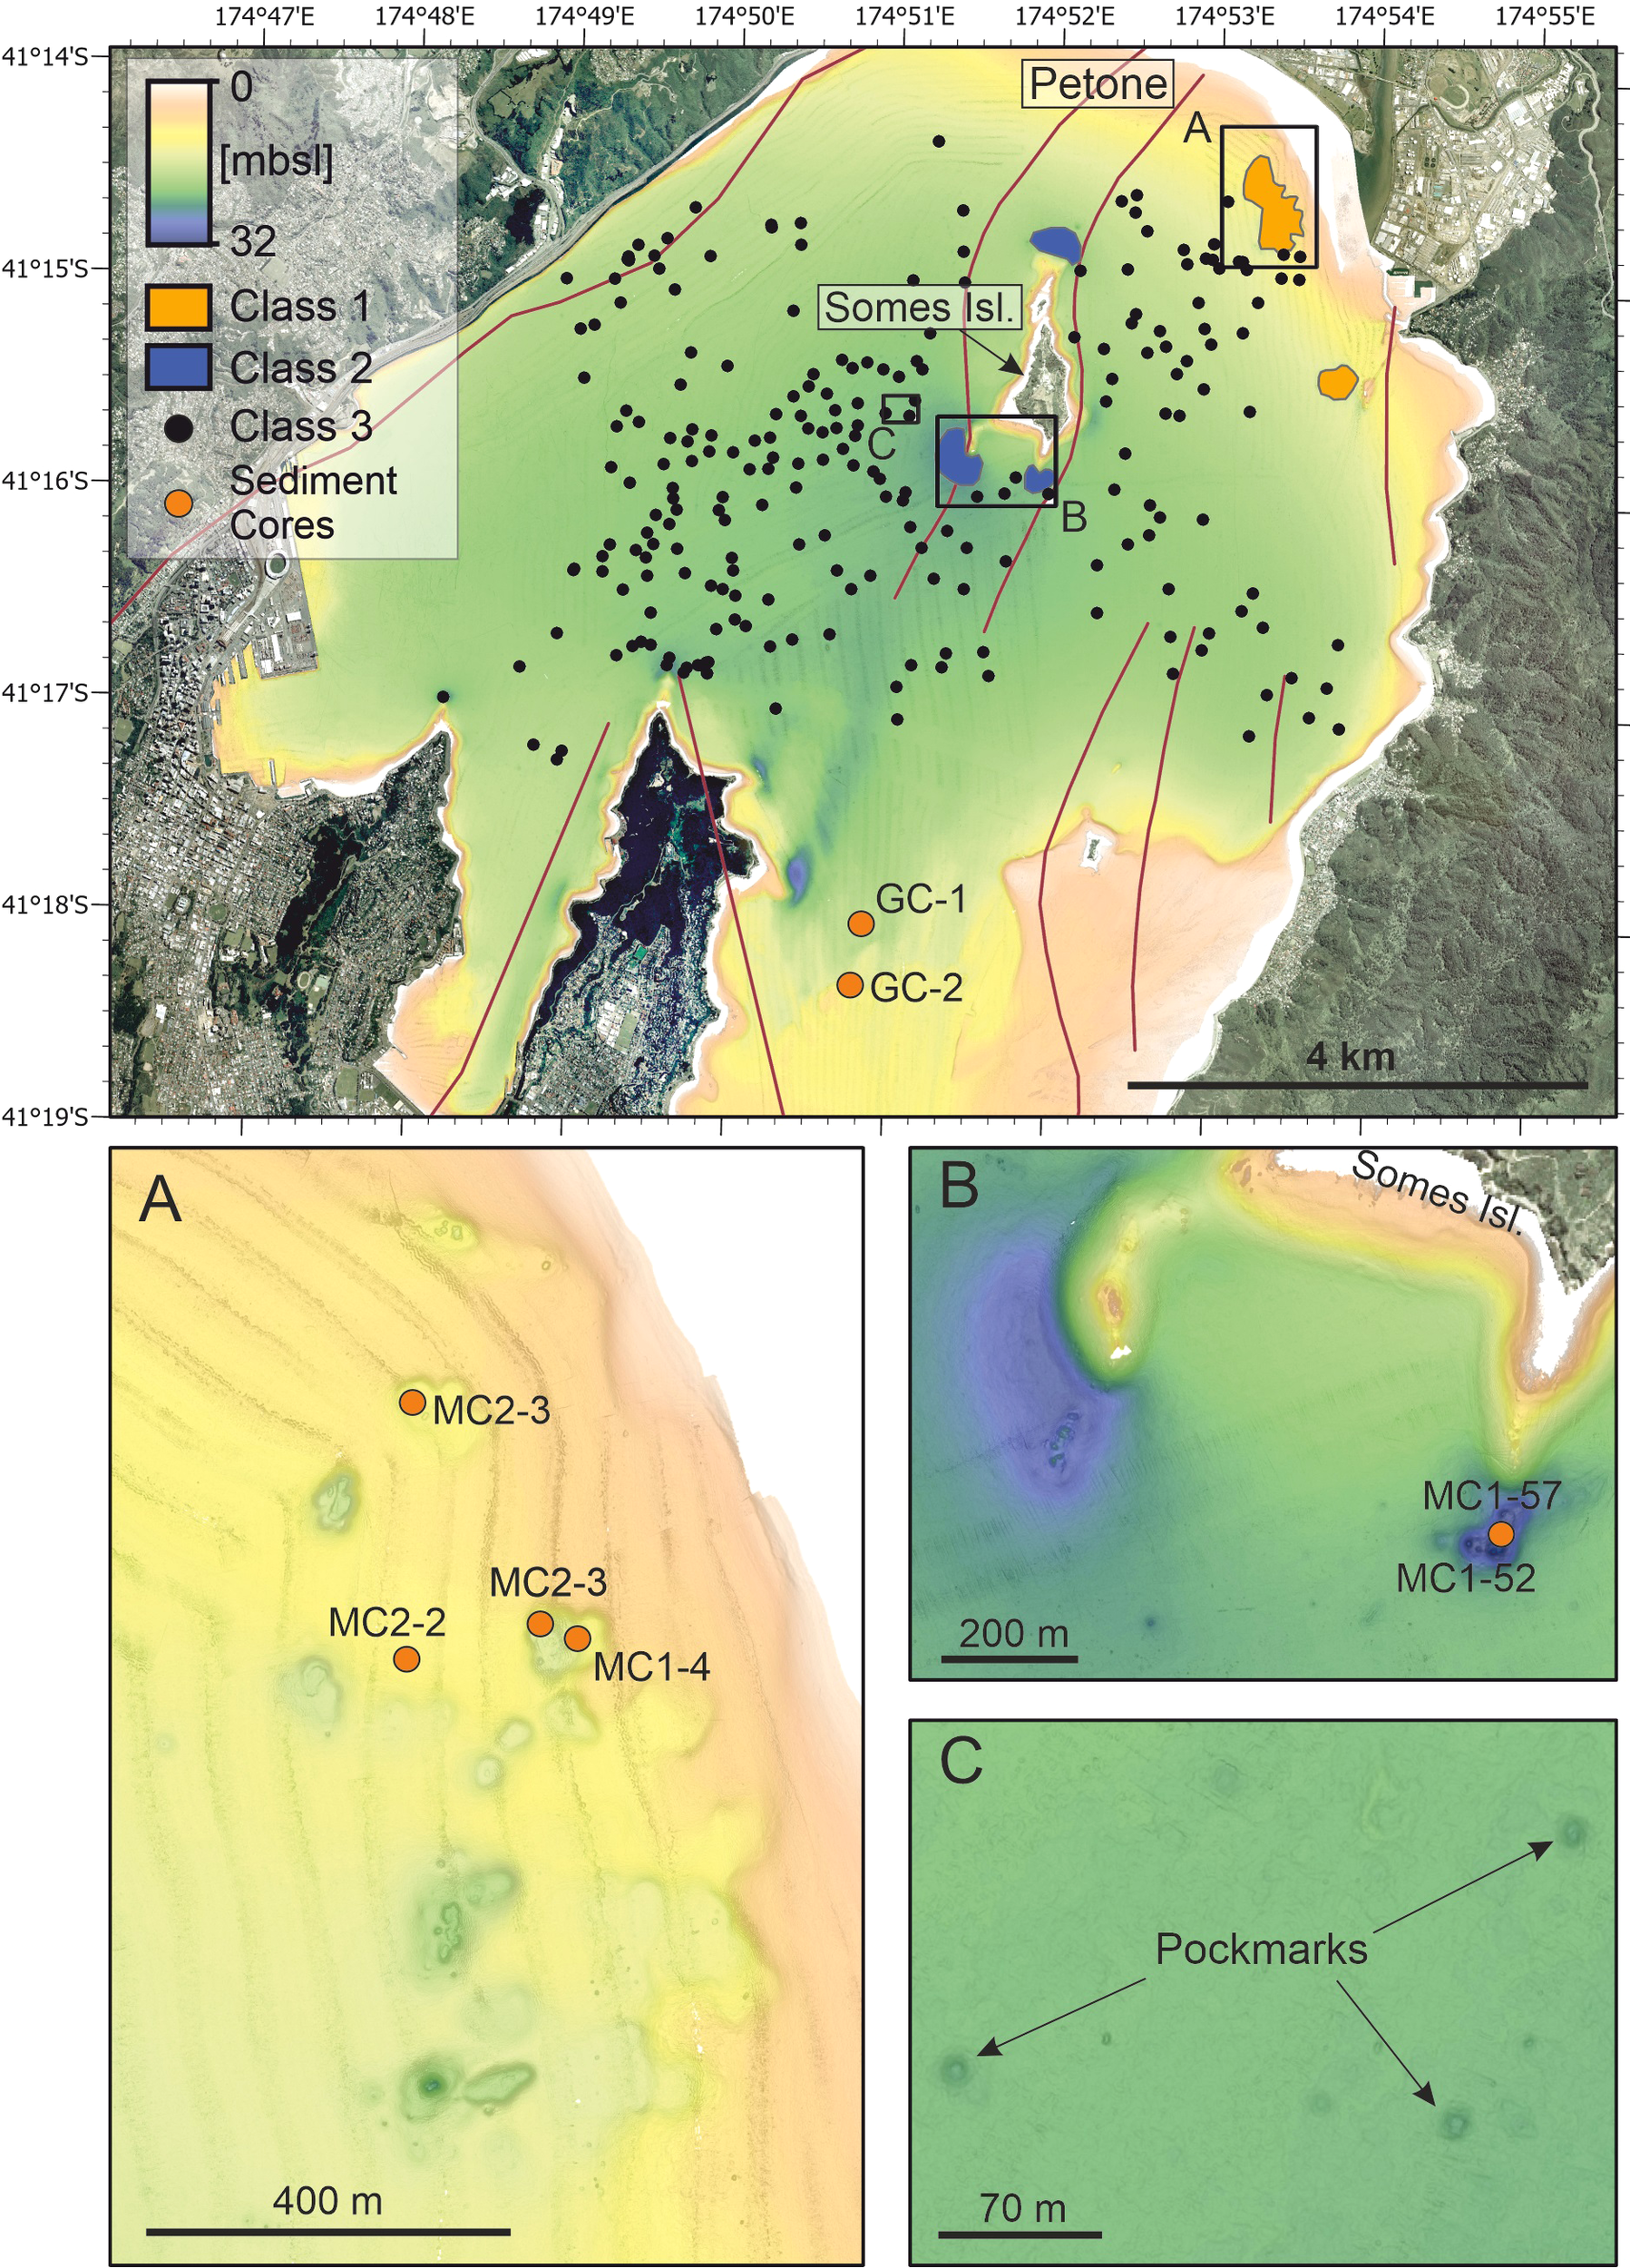
Overview of pockmark locations and classifications [Class 1 – (A), Class 2 – (B), Class 3 – (C)] in the Wellington Harbour with the distribution of sediment cores shown in Figure 5C.
Figure 5
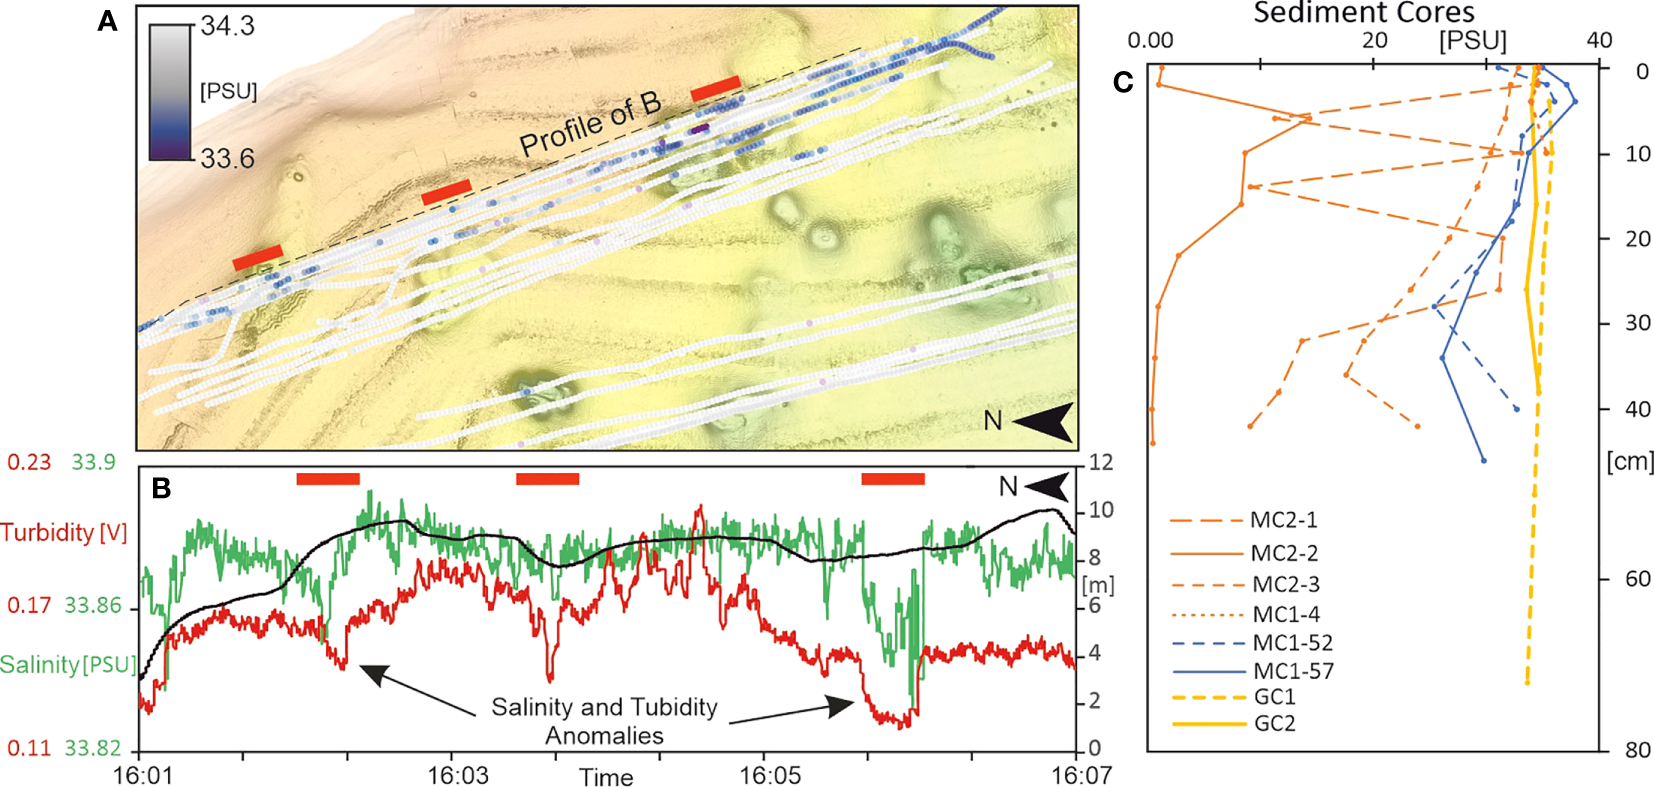
Salinity distribution within and around Class 1 pockmarks (Figure 4A). (A) Bathymetric features with overlaid towfish salinity transects (grey high and blue lower salinities). (B) Towfish transect across the pockmarks showing several salinity and turbidity anomalies indicated by red bars. (C) Sediment cores show a general decrease of salinity with depth within as well as outside (MC2-2) of the pockmarks (locations in Figure 4).
3.5 Remotely operated vehicle
To further investigate the nature of the seafloor and the occurrence of FSGD, we used a small remotely operated vehicle (ROV), which delivered uncompressed 4K video in real-time via a fibre-optic tether. The Boxfish™ (Boxfish Research Ltd) ROV was equipped with a Sony© RX100V camera, high-powered LED lighting and four parallel scaling lasers. In the sheltered harbour with comparatively little currents, the ROV was easily deployed and recovered by hand. We equipped the ROV with a RBRconcerto³, measuring conductivity, temperature, depth, and turbidity. In total the ROV was deployed four times in different locations (Figure 3). During initial exploratory dives, only video was recorded, however, upon finding visible evidence for FSGD, the CTD was attached to the ROV for close inspection of FSGD characteristics at two sites ROV3 and ROV4. While no USBL positioning system was used in this study, the shallow depths and position holding of the research vessel allowed the ROV to navigate to the pockmarks identified by MBES.
4 Results
4.1 Geomorphology of the Wellington Harbour
The Wellington Harbour seafloor is dominated by Holocene mud, the Petone marine beds. Circular to complex seafloor depressions, or pockmarks, occur throughout the harbour basin, varying in size from 3 m up to 500 m in diameter. Morphologies were highly diverse ranging from perfectly circular to halfmoon shaped and other irregular forms. We separate the pockmarks into three classes depending on their morphological expression, size, and location within the harbour (Figure 4).
Class 1 pockmarks are characterised by complex morphologies caused by the coalescence of individual depressions and extend over a region of about 0.3 km2. These are located in the northeast of the harbour, approximately 1 km from the coast, in water depths between 7 m and 14 m. They occur on a seafloor slope of approximately 1°, from the shallow shore into the deeper part of the harbour. Within the intermingled pockmarks, that are about 100 m wide individually, smaller depressions of about 5 to 20 m form in their centre and on their sides. They are often asymmetric, with the eastern landward side of the pockmark being much steeper compared to the western downslope side.
Class 2 pockmarks are the largest within the harbour and located on the edges of Somes Island. The pockmarks wrap around the hard, outcropping triangular basement rock and especially in the south of the island form halfmoon shaped depressions (Figure 4). The pockmarks are up to 500 m in diameter and are up to 10 m deep compared to the surrounding seafloor. These pockmarks form the deepest part of the harbour at 32 m. Similar to Class 1 pockmarks, smaller depressions form in the centre and on their slopes. While the pockmarks on the southwestern side and in the north show outcropping rocks in their centre, the southeastern pockmark (Figure 6A) has no elevated objects in its centre.
Figure 6
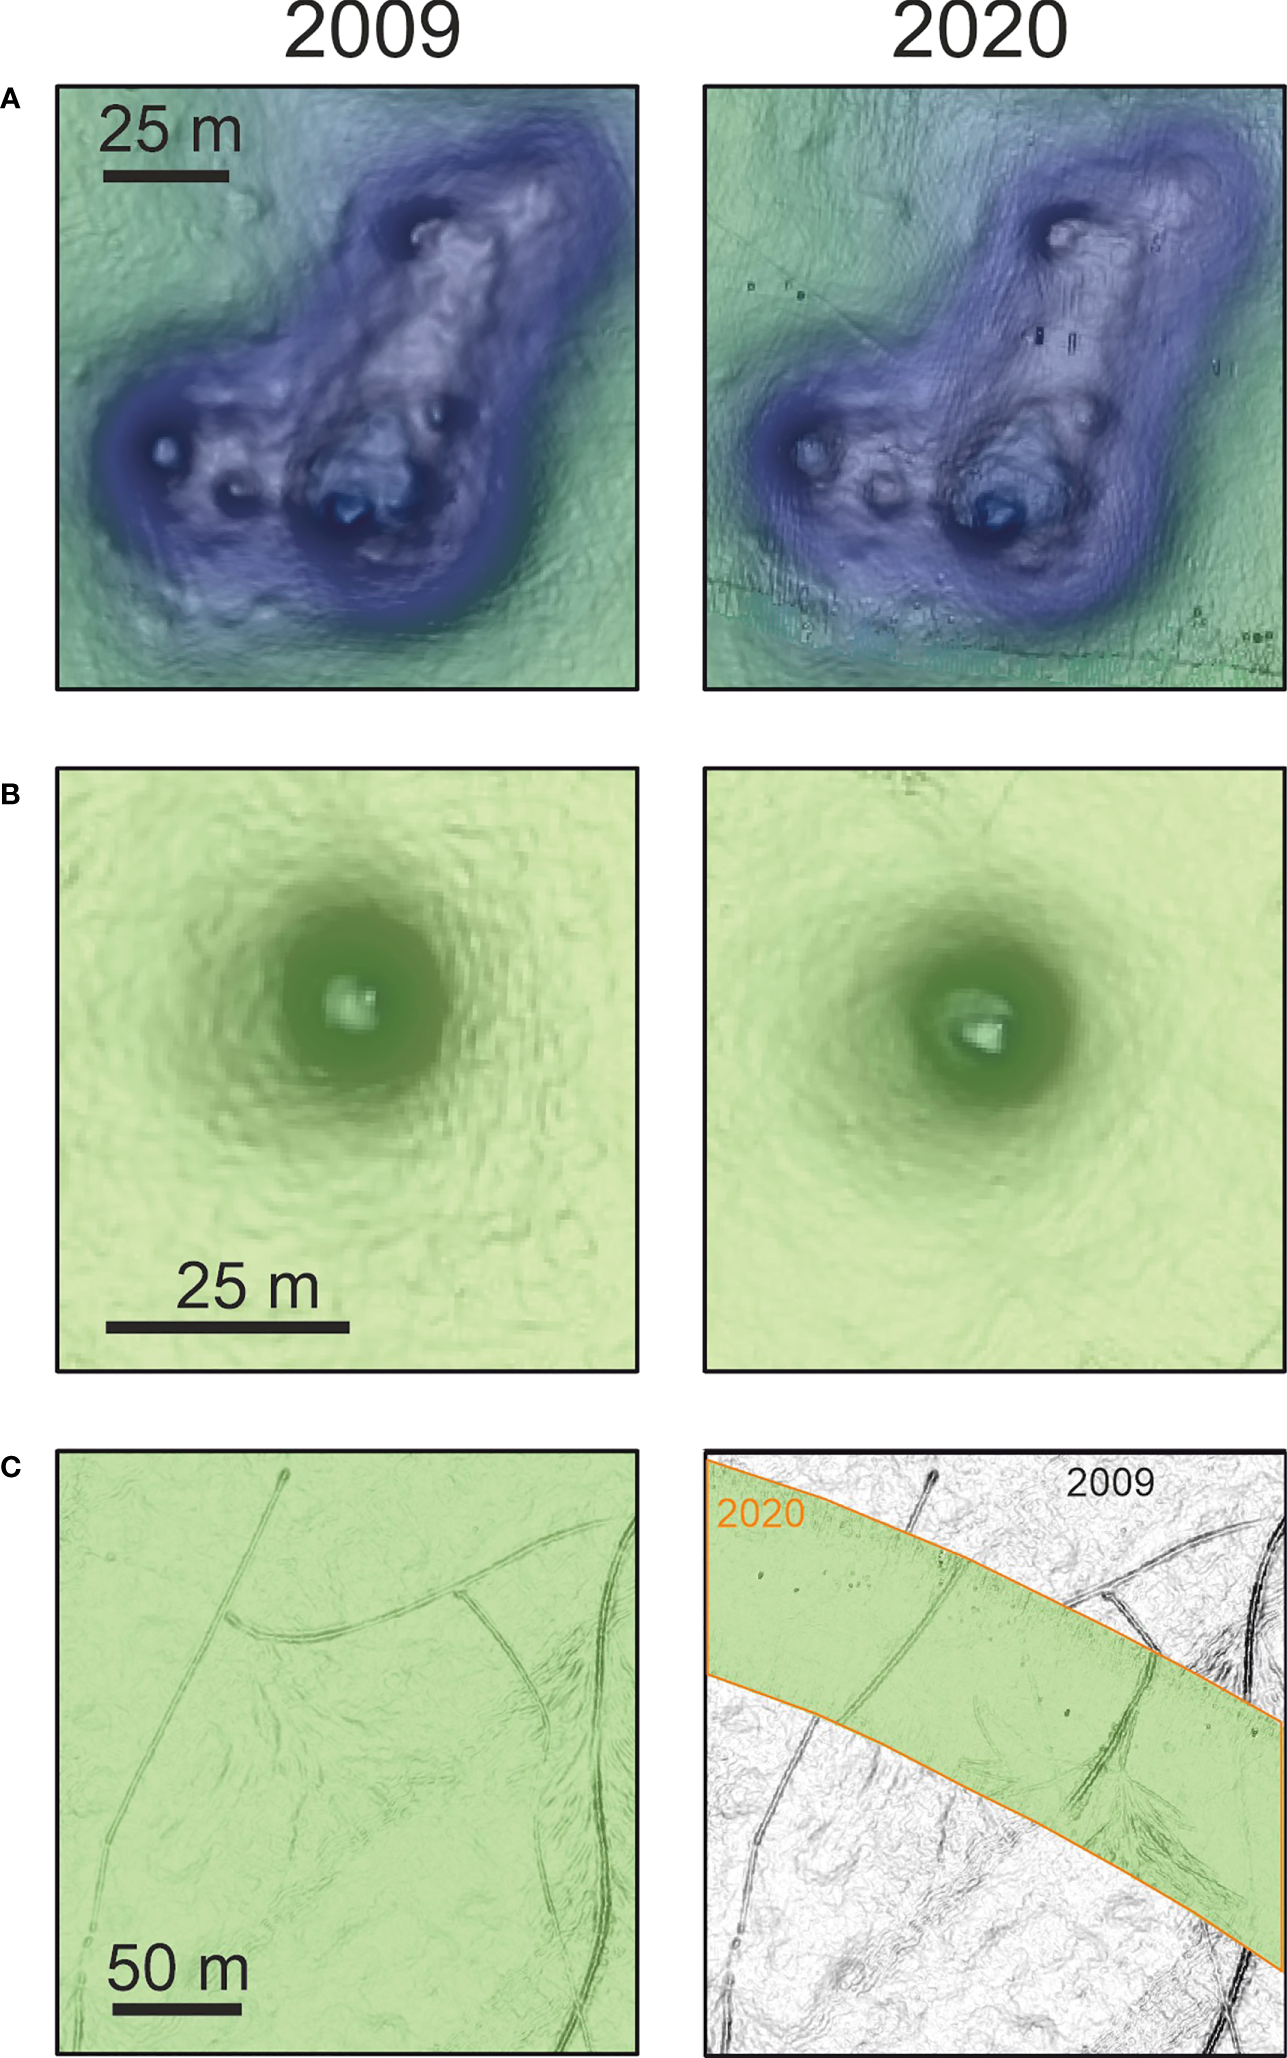
Comparison of bathymetric surveys conducted in 2009 and 2020. While the pockmarks show no or only minor changes in morphology (A, B), anchor scours (C) disappear over time (orange inner region shows new data overlain on top of the grey scaled slope data from 2009). Locations are shown in Figure 3.
Pockmarks of Class 3 are the smallest and most abundant features and are distributed throughout the deeper parts of the harbour floor in water depth between 10 m and 22 m. They range in size from 3 to 25 m. The pockmarks are characterised by perfectly circular shapes with depth of 0.5 m to 1 m compared to the surrounding seafloor.
We also observe various scours in the sediment caused by anchors and their associated chains in the western part of the Wellington Harbour (Watson et al., 2022). These scours show incision depths of around 60-70 cm into the sediment and reach lengths of over 1.5 km. We find linear scours associated with anchor emplacement or recovery as well as zones of abrasion, which are attributed to the anchor chain and the swinging of the vessel while on anchor.
A comparison of the data acquired in 2009 and the 2020 shows that the pockmark locations and morphologies remain unchanged over time. In contrast, most of the observed anchor scours in the 2009 bathymetric dataset either completely vanished or were significantly diminished in the newly acquired data. Multiple new scours were observed in the 2020 dataset in the same region, but the remains of previous scours and zones of abrasion have largely disappeared (Figure 6). The new scours show similar characteristics to the previously observed ones with incision depth of about 60 cm compared to the surrounding seafloor.
4.2 Salinity and turbidity
The salinity distribution in the water column and the sediments of the harbour were investigated using the towfish and sediment porewater samples. The towfish captured strong vertical salinity gradients in the water column, with lower saline waters in the upper (about 31 - 33.6 PSU) and higher salinity waters in the deeper part (about 34 -34.3 PSU). This is the result of low-density freshwater inputs from the Hutt River discharges that freshen the upper water column while denser higher saline ocean waters flow in at the bottom through the harbour entrance (Gall and Davies-Colley, 2021).
Keeping the towfish at a constant height (1 m) above the seafloor, we were able to investigate the lateral spatial salinity distribution rather than vertical profiles. Using this technique, we were able to cover large areas and detect several salinity anomalies in the bottom waters that do not correspond to the vertical salinity gradient. Around the northern Class 1 pockmarks, salinity decreases in several locations associated with low turbidity values (Figure 5B). Groundwater is generally well-filtered by the sediments of the aquifer and is likely to be less turbid compared to the surrounding seawater (Karpen et al., 2004). It is apparent, that low turbidity and salinity values do not always coincide with pockmarks on the seafloor, but also occur in the relatively flat areas between the pockmarks. This is supported by sediment core MC2-2, which was acquired in the space between individual pockmarks (Figures 4, 5) and shows the lowest salinities of all cores. Salinity within Class 2 pockmarks, south of Somes Island, decrease from 34.15 PSU outside of the pockmarks near the seafloor to about 33.9 PSU within the pockmark. Porewaters within the cores from these pockmarks show a distinct decrease from 35 PSU at the sediment-water interface down to about 24 PSU at about 30 cm depth (MC1, Figure 5).
4.3 Water column reflectivity
We used the two EK60 fisheries echosounders to investigate the water column reflectivity across the harbour. We identified several vertical strong reflectivity anomalies that are generally indicative of gas escape (gas flares, Supplementary Figure 2A). Isolated smaller non-vertical high reflectance anomalies generally correspond to the presence of fish (Figure 7). Although gas escape is apparent within the pockmarks, high reflectance anomalies, indicative of gas, are also found in other areas of the harbour. We could not find a direct correlation between gas escape features from the seafloor and the pockmarks.
Figure 7
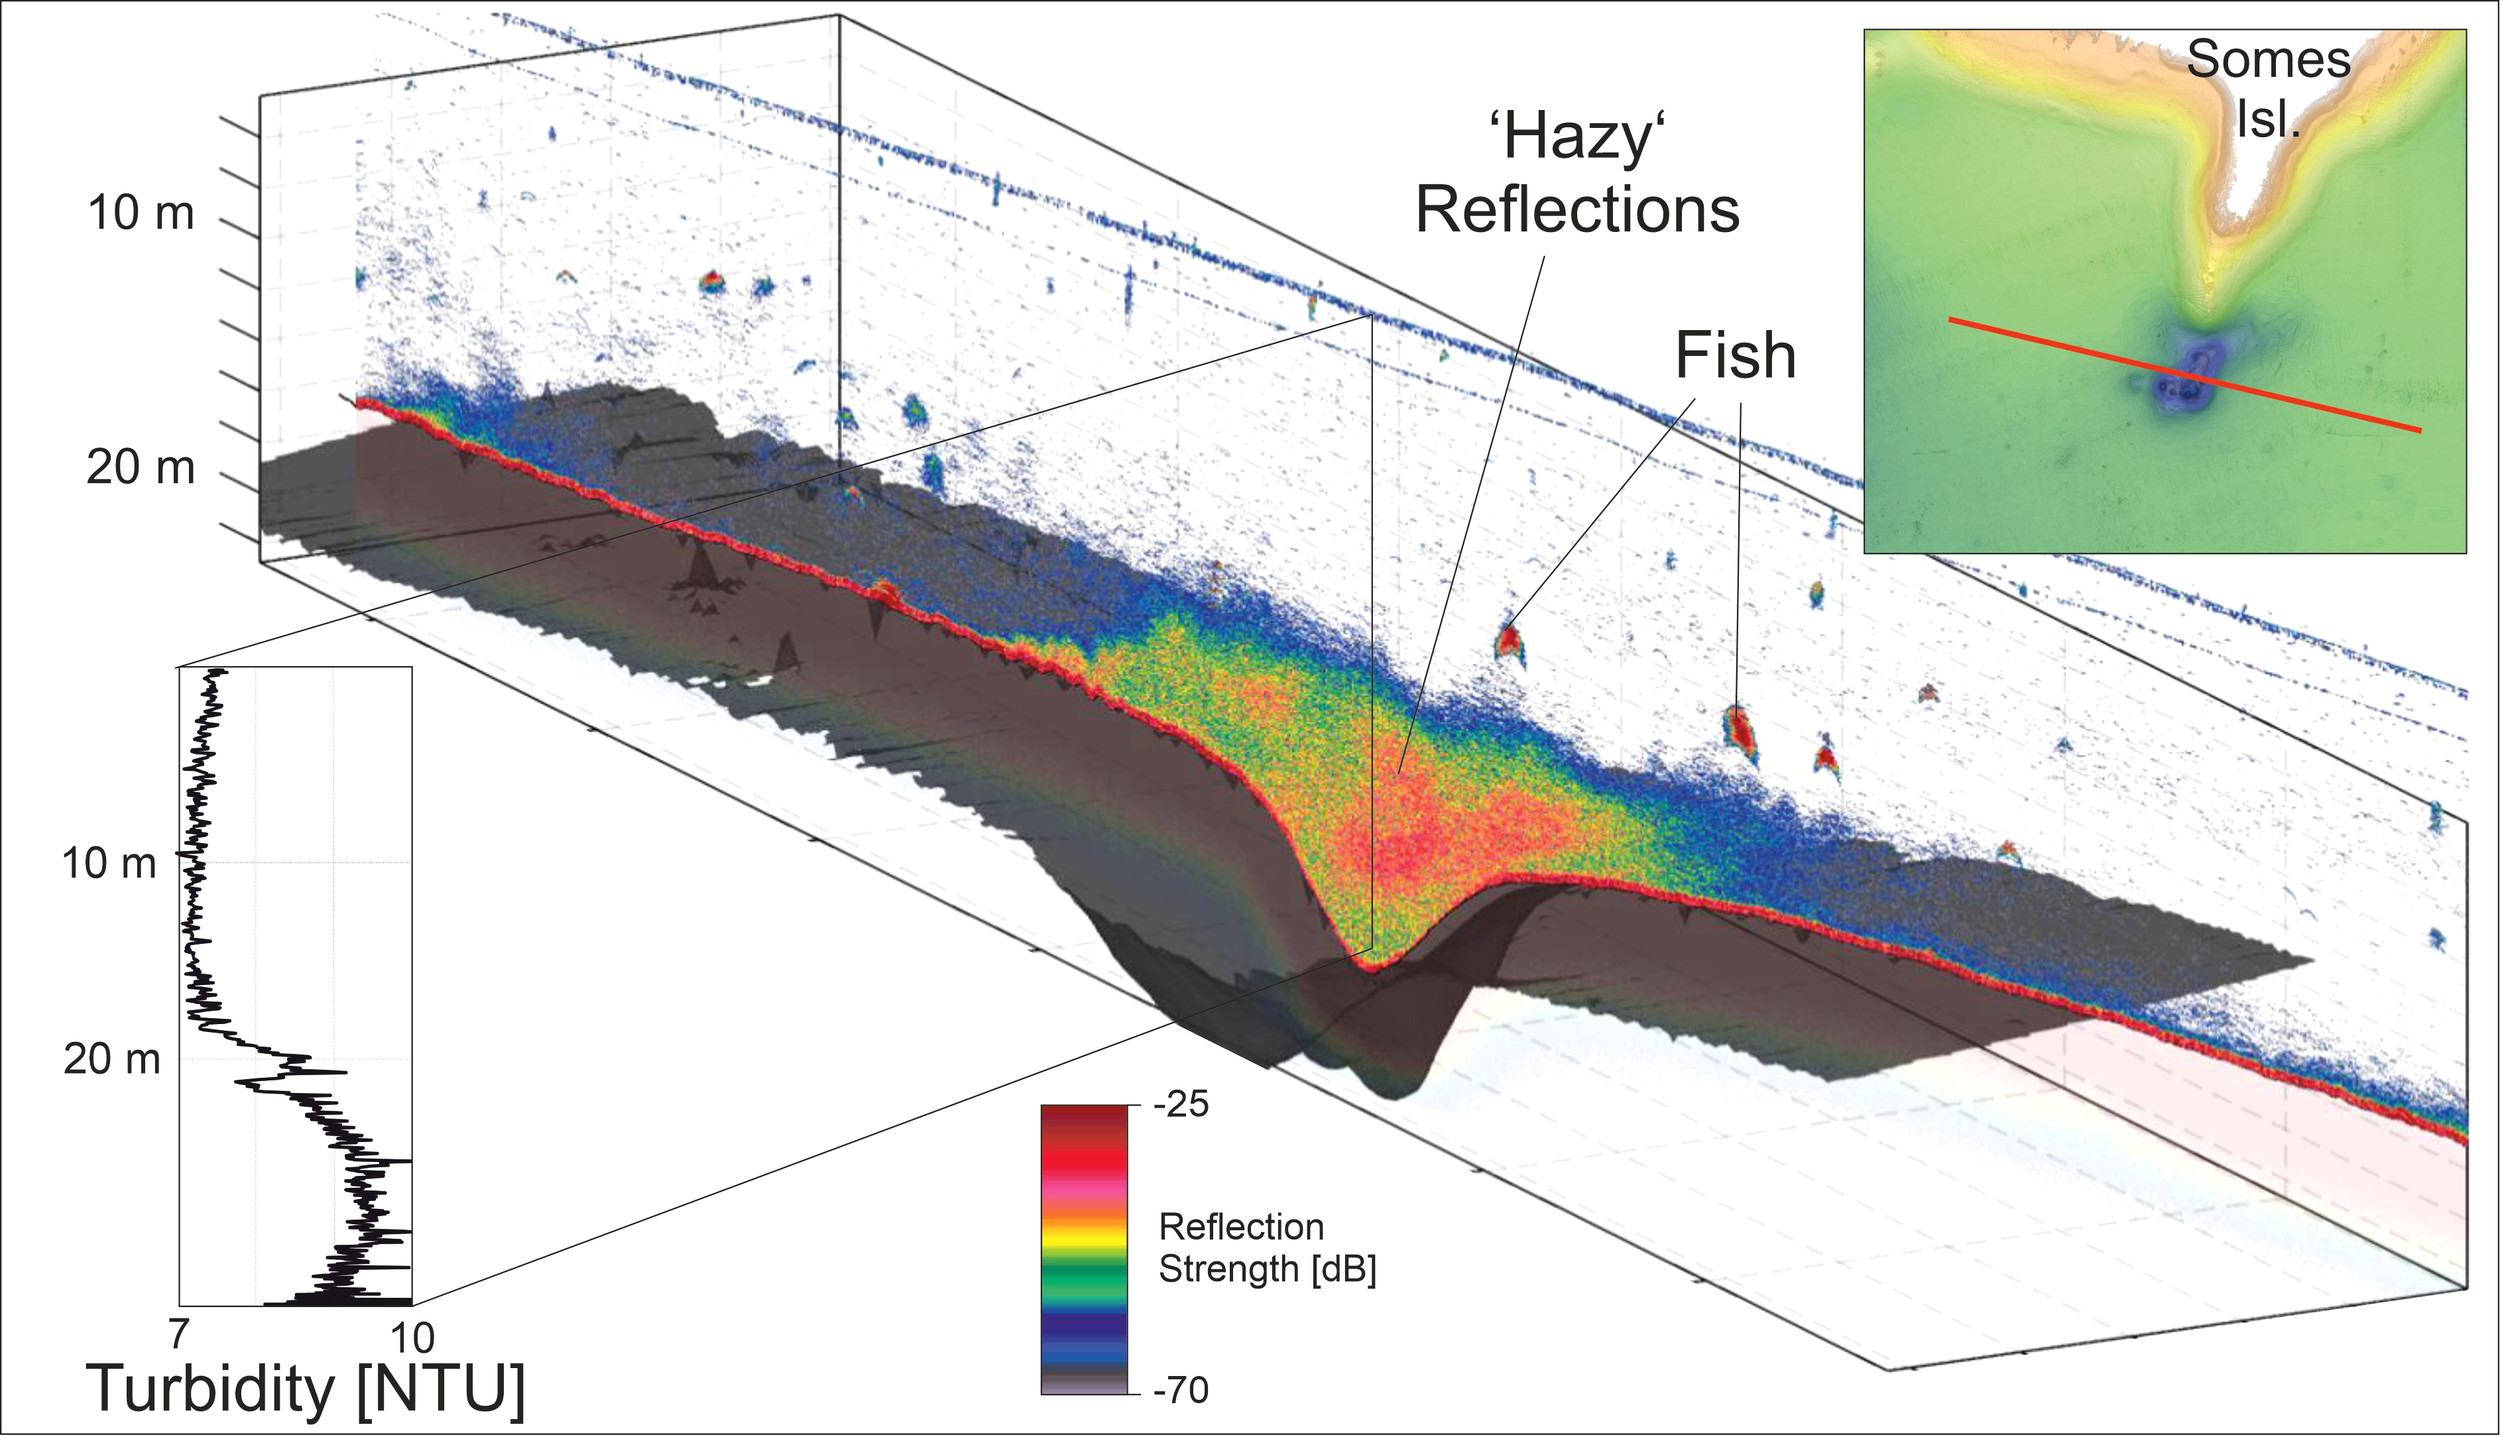
Profile over a Class 2 pockmark shows hazy reflectivity in the water column above the depression corresponding to high turbidity values measured with the ROV during the descent to the bottom.
In addition to the high energy backscatter from gas and fish, we also find enhanced, hazy reflectivity within and above pockmarks (Figure 7, Supplementary Figures 2B, C). Reflection strengths of these features are small compared to the gas bubbles and fish, and the reflections are less localized but distributed over larger areas. They generally occur closer to the seafloor and only rise up 5 to 10 m above the seafloor into the water column. Within the Category 2 pockmarks (shown in Figure 7) the hazy reflections fill out the entire pockmark and extend well above the surrounding flat seafloor. In Category 1 pockmarks we find more localised regions within individual pockmarks that show hazy reflections in the centre or on the side of the depressions (Supplementary Figure 2B). Turbidity values measured by the ROV during its descent down into the Category 2 pockmark show a sharp increase in turbidity where the hazy reflections start. The increase in turbidity in the Category 2 pockmark correspond to an increase in salinity that follows the general trend in the harbour where salinities increase with depth in the harbour.
4.4 Visual inspection of FSGD
We used a Boxfish ROV to visually inspect the seafloor within the pockmarks. In numerous locations, we were able to visually identify blurry zones (so called ‘schlieren’) where groundwater was seeping from the seafloor and changes the refractive index (Figure 8). The CTD readings of the ROV confirm the freshwater seepage that we visually inspected (Figure 8). Rather than a confined single spring on the seafloor we find that many small individual discharge sites exist within each pockmark. Salinities in the water column at about 50 cm above the seafloor seeps decrease to 32.5 PSU from the surrounding 34.4 PSU. The water temperature within the pockmark remains approximately the same around 14.8°C. The lack of seepage meters prevented a quantification of discharge at specific locations. Therefore, discharge was only qualitatively examined, with the amount of blurred zone observed in the videos giving us the best indication of large or low discharge rates. We find that the Class 2 pockmarks on the south-eastern end of Somes Island experiences many zones of groundwater discharge. Based on the visual data, we find that seepage in all pockmark classes inspected does not occur preferentially from the deepest part of the pockmarks but rather from many small discrete locations situated on the sidewalls as well as in the central parts. No visual discharges were observed in the region around Falcon Shoals.
Figure 8
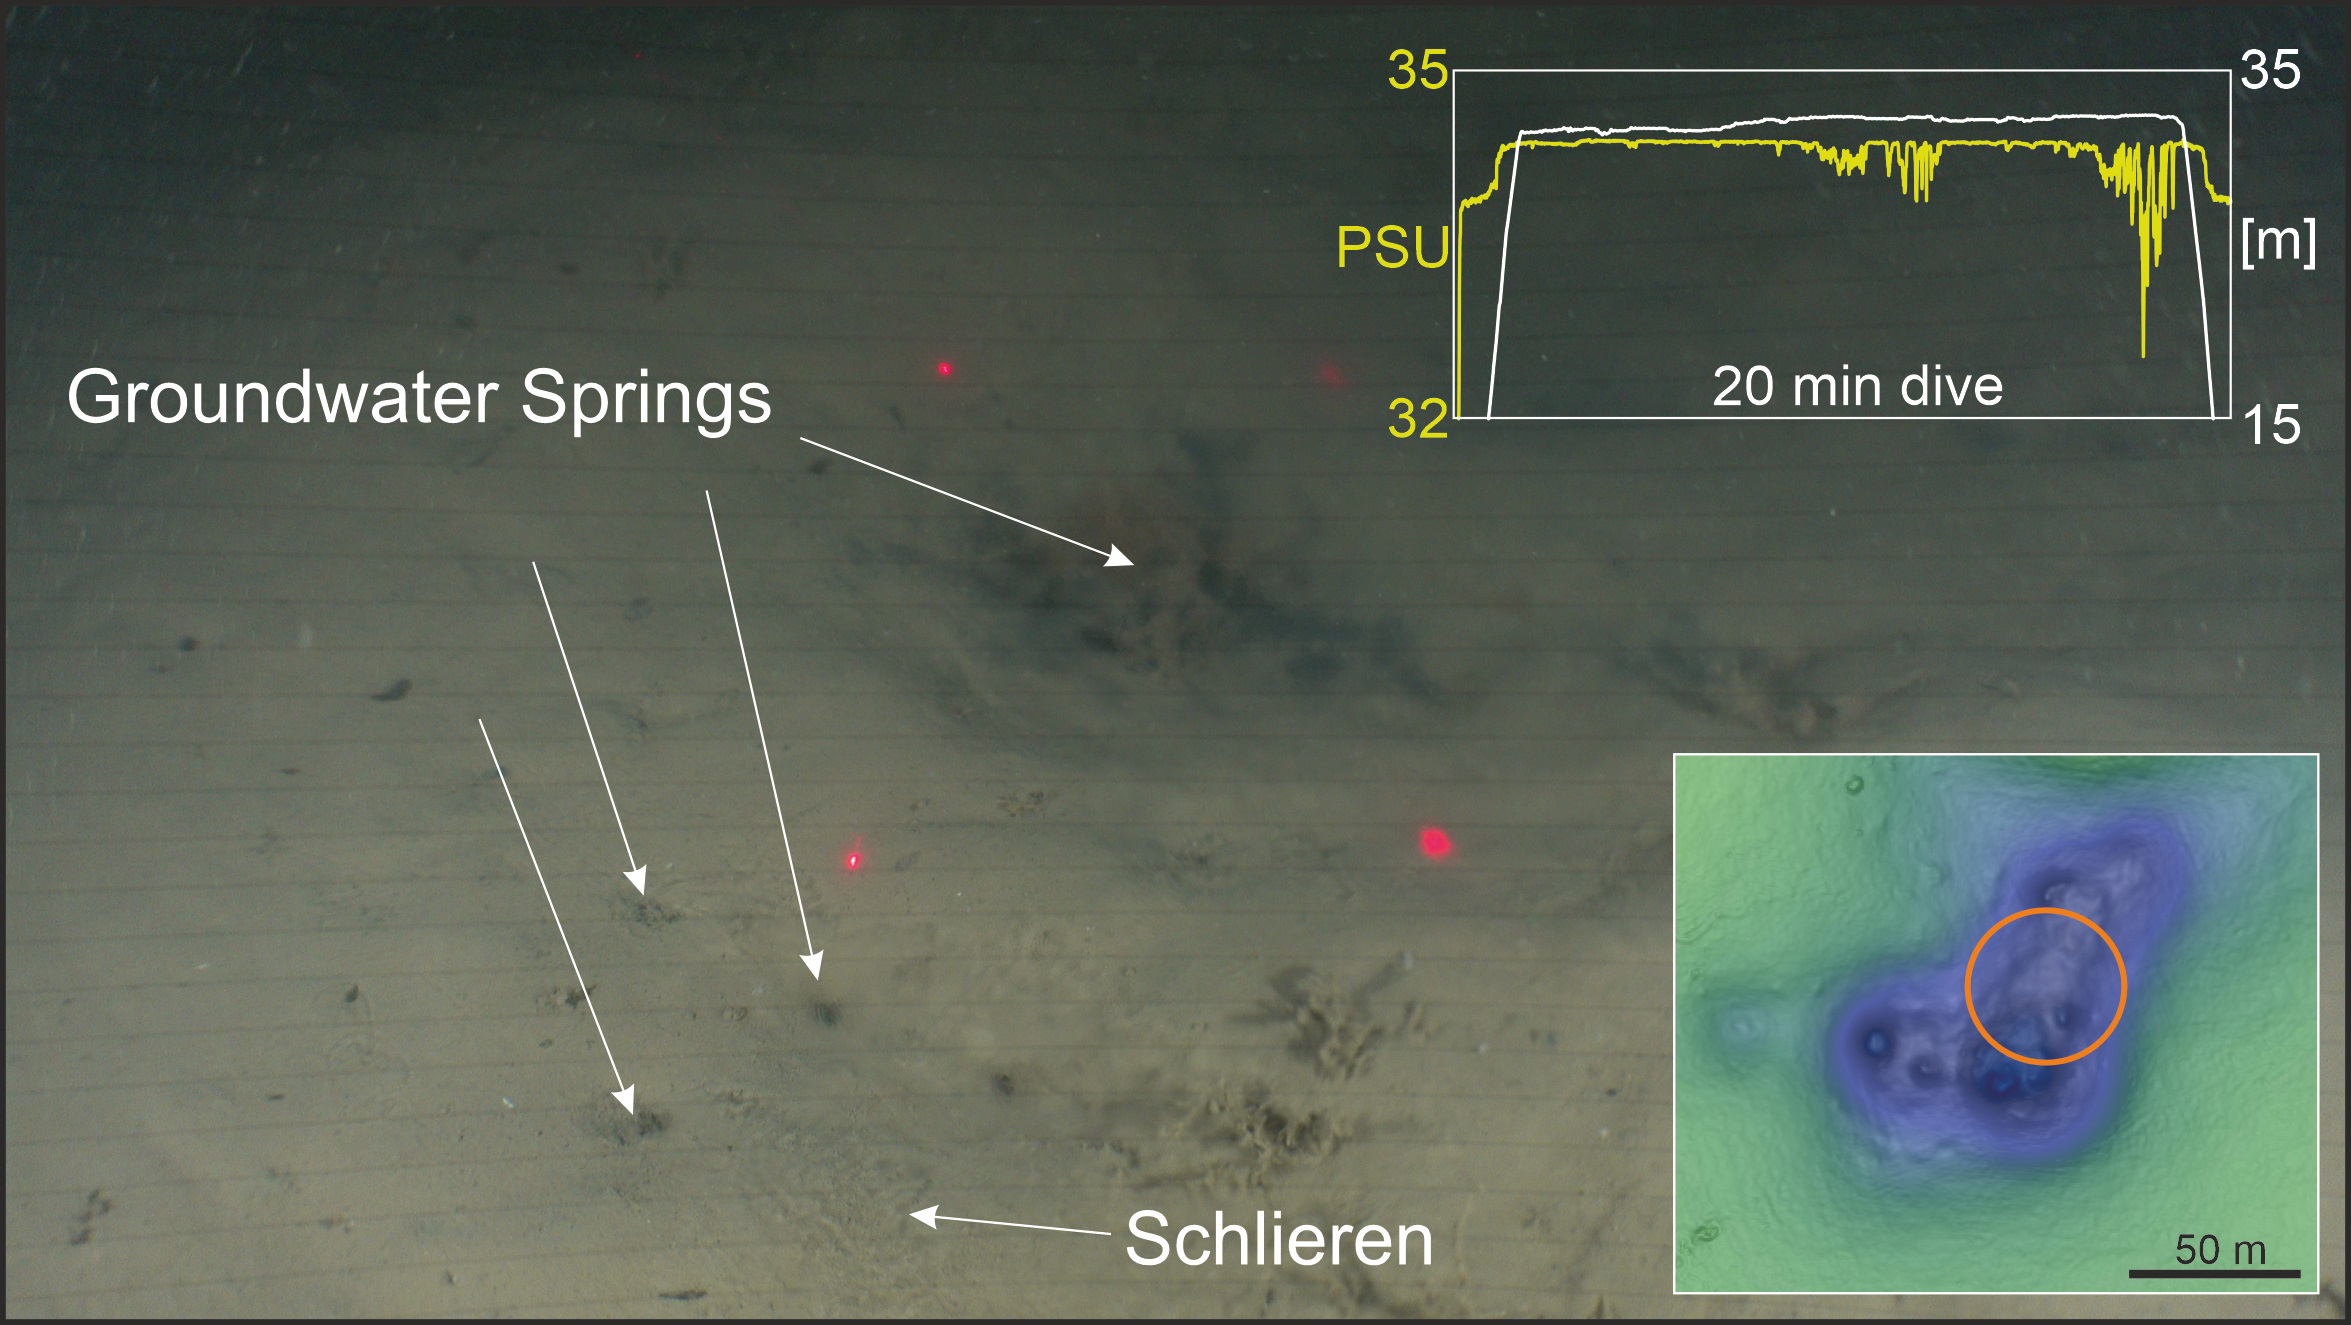
Photo of schlieren in the seawater where groundwater discharges from the seafloor at the Class 2 pockmark south of Somes Island (location of ROV3 in Figure 3). Salinities drop from over 34 to nearly 32 PSU at about 50 cm above the seafloor.
5 Discussion
5.1 Pockmark formation mechanisms
Pockmarks on the seafloor are frequently attributed to fluid venting, however their formation mechanism or the fluid involved in the venting often remains unknown (Paull et al., 2002; Judd and Hovland, 2009). In Wellington Harbour, our results show the three classes of pockmarks identified have distinct distributions. Class 1 and 2 pockmarks show freshwater seepage, as determined from sediment cores, salinity readings in the water column and, ROV video footage. We do not have any data to confirm if Class 3 pockmarks are associated with freshwater seepage. We infer that the formation of Class 1 and 2 pockmarks is mainly associated with FSGD weakening the surface sediments and localising erosion by bottom currents. Although we associate both classes to the same process, significant geomorphological differences exist related to the environment in which they have formed. Class 1 pockmarks occur nearest to the foreshore and therefore where aquifer pressure is potentially higher. They formed within shallow harbour sediments near the shore, which are likely to be more spatially heterogeneous than deep water sediments thereby potentially influencing pockmark geometry, leading to intermingled pockmarks. In contrast, Class 2 pockmarks occur on the edges of Somes Island where the aquifer onlaps against basement rock, resulting in a more halfmoon shaped pockmark geometry wrapping around the tips of the island. We interpret that groundwater migrates upwards along the sediment-rock interface and that tidal current speeds are exacerbated around the island headlands, enhancing scouring and thereby enlarging the Class 2 pockmarks.
Class 3 pockmarks are much smaller and more widely distributed within the bay and were not directly sampled due to positioning inaccuracies of the vessel and the deployed gear in the water. Hydroacoustic water column reflectivity data suggest not only groundwater, but also gas seepage in the harbour. We could not associate any of the pockmark classes directly to gas seepage, which appears to occur not only from the pockmarks but also in other areas of the harbour. Albert et al. (1998) and Hoffmann et al. (2020) show that upward migrating groundwater within the sediment can enhance gas concentrations close to the seafloor by shifting the sulfate methane transition zone upwards. This can lead to gas saturation of the porewater and free gas in the pore spaces, which induce additional sediment instabilities and subsequent sediment erosion. While the Class 3 pockmarks extend throughout the harbour, seismic data interpreted by Nodder et al. (2018) show that acoustic blanking associated to shallow gas occurs primarily in the west of the harbour and is absent to the east of Somes Island. Wood and Davy (1992) suggest a thickening of the Waiwhetu aquifer towards the Wellington Fault which suggests that freshwater likely occurs in most regions of the harbour. Since Class 3 pockmarks are widely distributed throughout the harbour and also occur to the west of Somes Island, where no acoustic blanking is observed, it seems likely that freshwater is the main driving factor for these pockmarks as well. SGD might not only shift the sulfate methane transition zone closer to the seafloor, but additionally enhance upward migration of dissolved methane in the groundwater. This may locally increase methane concentrations close to the seafloor to levels exceeding the saturation without causing widespread acoustic blanking. We therefore cannot attribute a specific fluid to the formation process of Class 3 pockmarks but distributed freshwater expulsion is a plausible factor in their genesis.
5.2 Extent of freshwater seepage
Assuming that all three classes of pockmarks are associated with FSGD, our results suggest that the areal extent of FSGD is much larger than previously thought. The southern extent of the aquifers is still under debate. The two gravity cores we acquired at the harbour entrance around Falcon shoals consisted mainly of unconsolidated shell fragments with high permeabilities. Stevens (1974) suggests that the Waiwhetu aquifer extends approximately down to this point, where the confining Petone Marine Beds and gravel beds run out. Strong tidal currents around the harbour entrance prevent smaller sediment particles from accumulating at the bottom in this area. Within the coarse-grained sediments no morphological indications for freshwater seepage, such as pockmarks, occur. Porewater samples from the two gravity cores acquired in this region show only a minor decrease of salinity with depth. This may result from high permeabilities of the shells, where mixing of upward migrating freshwater and seawater from above occurs deeper within the sbusurface. The best evidence for leakage from the Waiwhetu Aquifer at Falcon Shoals is still the measurements made by Harding (2000). Groundwater expulsion in the harbour, and associated loss of freshwater, results in a decreasing hydraulic head in the aquifer towards the harbour entrance. Although our indications for FSGD are limited, we assume that the remaining water pressure at Falcon Shoals is generally still high enough to push the water up to the seabed.
5.3 Persistence of seafloor disturbances
The persistence of seafloor irregularities and disturbances depends on many factors, but mainly the hydrodynamic system (Bruns et al., 2020; Hoffmann et al., 2022), sedimentation rates (Gilkinson et al., 2015) and sediment type (Roberts et al., 2000; Mérillet et al., 2018). While the morphological expression of anchor scours or trawl marks in exposed shallow regions generally disappears within several months, these disturbances can persist over decades in fine-grained sheltered regions (Bruns et al., 2020). In the western part of Wellington Harbour towards the port area, anchor scours were previously described by Watson et al. (2022). We found that most of the morphology of the described scours on the muddy seafloor of Wellington Harbour had vanished within a decade, or were barely visible in the newly acquired dataset compared to 2009. In contrast to the anchor scours, we find that pockmarks in the harbour did not significantly change over the observed time period of 11 years. Even Class 3 pockmarks with similar incision depth to the trawl marks remain unchanged over time. Since the pockmarks and anchor scours occur in close proximity to one another and therefore in the same hydrodynamic and sedimentary environment, we infer that the longevity of the pockmarks compared to the anchor scours results from ongoing fluid seepage. Gas and groundwater seepage into the harbour seem to continuously occur through the same pathways and prevent the pockmarks from being infilled by sediment. It seems likely that upward migrating groundwater and gases influence settling particles and keep them buoyant in the water column rather than settling down in the pockmarks.
5.4 Water column reflectivity as an indirect indicator for FSGD
Hydroacoustic water column imaging is widely used to investigate marine biology, such as fish or plankton, to locate marine gas seeps, and to measure sediment particle distribution in the water column (Reine et al., 2002; Simmonds and MacLennan, 2008; Schneider von Deimling et al., 2013). Gas bubbles show a characteristic narrow and sub-vertical acoustic signature also called ‘flare’. The acoustic response of fish is generally less vertically aligned and often more isolated and distributed throughout the water column without a connection to the seabed. Since acoustic reflections associated with fish mainly result from the fish’s air bladder they have similar reflection strength to gas bubbles. In contrast, sediment particles have a smaller impedance contrast to the surrounding water than gas and therefor result in lower reflected energies. Multiple gas flares were identified within the harbour but not always related to pockmarks on the seafloor. We characterised the water column reflectivity within the Wellington Harbour, observing fish schools and free gas bubbles escaping the gaseous sediments, along with wider areas of enhanced ‘hazy’ reflections within and above pockmarks. These reflections appeared most pronounced in the Class 2 pockmarks of Somes Island (Figure 7). The ROV video observations indicated the highest abundance of groundwater discharge sites within these pockmarks. The enhanced hazy reflectivity within the pockmarks can be clearly distinguished from gas flares and fish by their reflection strength, distribution, and characteristics. The turbidity sensor mounted on the ROV suggests that these enhanced reflections are caused by suspended sediment particles in the water column within and above the pockmark. Generally, groundwater shows relatively low turbidity values compared to surface waters as it is naturally filtered during percolation through the soil. This is also observed by the towfish data, where we find much lower turbidity values compared to the surrounding ocean water, in the water column directly above FSGD sites (Figure 5). Therefore, it seems unlikely that the high turbidity values are caused by an enhanced sediment load of the discharging groundwater. Sediment resuspension from the seafloor by upward migrating freshwater similarly seems unlikely since the turbidity directly above the seep sites was low during our field measurements. Although not directly observed during our campaign, high discharge events might still locally resuspend sediments from the seafloor.
Several other mechanisms might play a role in the elevated sediment load in the water column within and above the pockmarks. The Hutt River is the primary source of sediment accumulating in the Wellington Harbour and observed discoloured freshwater movements at the water surface within the harbour suggest that parts of the sediments are supplied in suspension (van der Linden, 1967). This suspended matter will slowly settle in the deeper parts of the harbour to form the present-day silty mud. The depressions in the seafloor themselves likely act as sinks for small particles during calm weather periods where particulate matter can accumulate. The stratification of the water column, with an increased salinity with depth, will also affect the vertical particle distribution where particles tend to settle on boundary layers (MacIntyre et al., 1995; Prairie et al., 2015). These mechanisms could partly explain elevated turbidity especially within the Category 2 pockmarks but do not account for the more localised and flare like enhanced particle concentrations above and within the Category 1 pockmarks (Supplementary Figure 2). Pau et al. (2014) show how the interaction of bottom currents with the pockmark geometry can result in enhanced water turbulence in the depressions. We assume that the particles that should uniformly settle to the seafloor are kept in suspension and are prevented from settling by discharging and upward migrating freshwater that further enhances the turbulence in the water column (Figure 9). Although the general increase in salinity with depth is also apparent through the pockmarks and the discharging freshwater is quickly mixed and diluted by the seawater, the hydrodynamic impulse and related turbulence of the water column could reach much further than the salinity anomalies. It seems likely that the particles are kept in suspension by this enhanced turbulence within pockmarks and are subsequently transported away by currents during the next storm event. This is supported by the persistence and unchanged morphological expression of the pockmarks. The sediment plumes might therefore give indirect indications for isolated groundwater seepage sites.
Figure 9
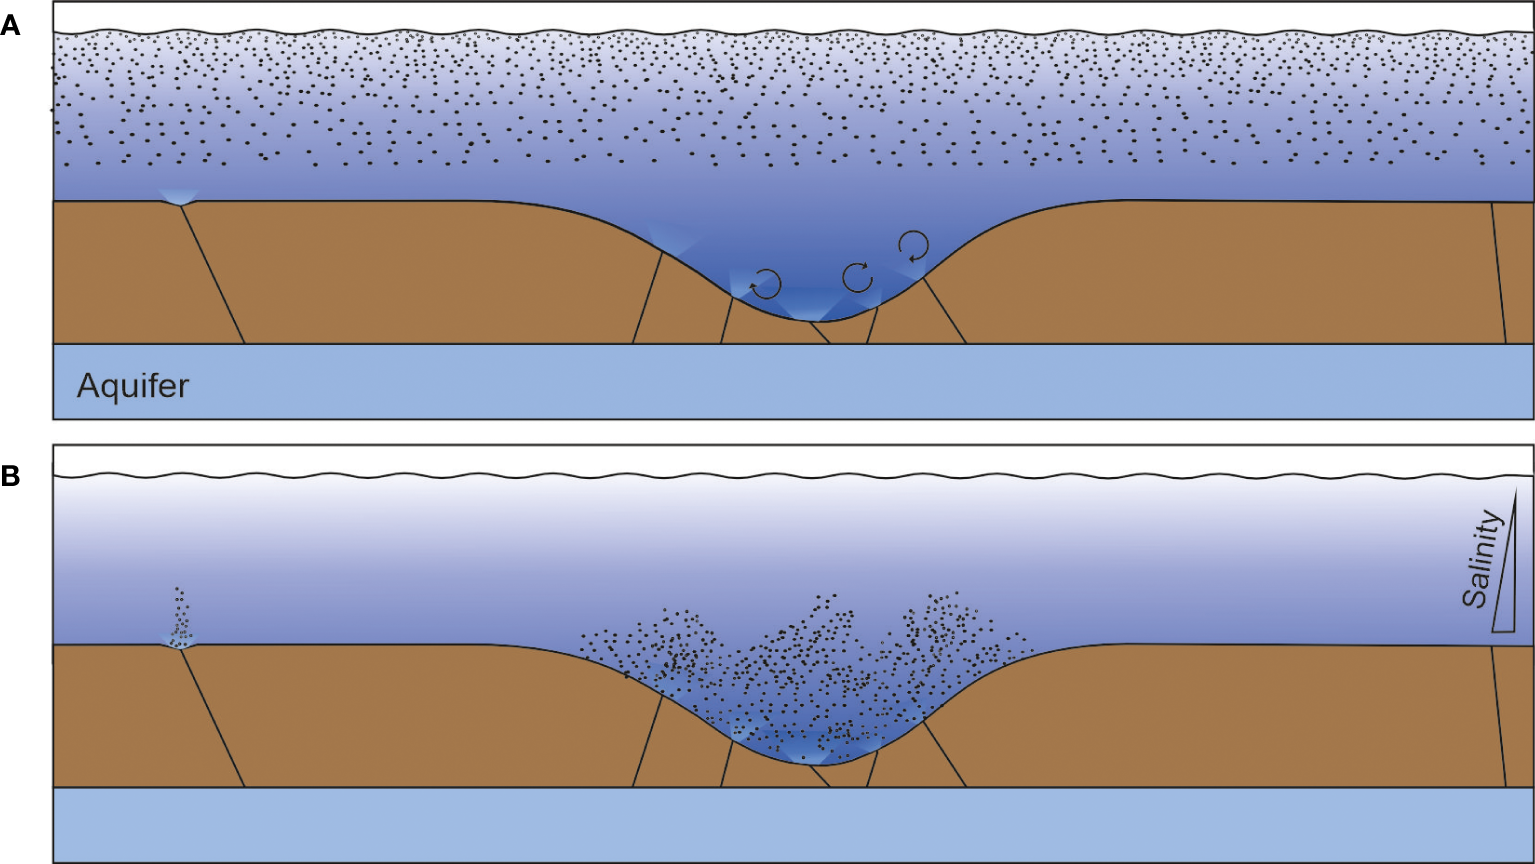
Conceptual model of FSGD and increased turbidity above pockmark sites. (A) Particle settling after sediment was supplied by a river plume. (B) Particles settle uniformly outside of the pockmarks but are kept in suspension by enhanced turbulence within the depressions induced by freshwater input and current interactions.
6 Conclusions
In this study we employed a multidisciplinary approach to investigate FSGD into Wellington Harbour, providing geochemical, geomorphological, and geophysical evidence for widespread discharge locations connected to an offshore aquifer system that is recharged from land. As the onshore groundwater system, as well as its offshore component and discharge, is an important resource to Wellington City, our approach and data provide further monitoring options and an improved understanding that can assist proper management of this valuable resource.
Three different classes of pockmarks, likely related to groundwater discharge, are evident in the harbour. The upward migrating groundwater might locally enhance gas concentrations close to the seafloor and thereby trigger gas escape into the water column especially from Class 3 pockmarks. Although it appears like the seafloor morphology would be the most indicative parameter to determine discharge locations, towfish and sediment core porewater samples show that FSGD also occurs in proximity to but outside of pockmarks, potentially indicating newly developing spring sites. ROV dives within the pockmarks show that the groundwater discharge is not solely occurring from one location at the bottom of the depressions but from many individual small sites that are distributed throughout the depression; this points to many small rather than one large fluid conduit in the subsurface. In a comparison with previous surveys (11 years apart), the pockmarks did not seem to change considerably, although anchor scours in the same region diminished or disappeared. This shows that fluid flow persistently occurs through the same conduits, permitting sediments to accumulate. We assume that in these regions the rising freshwater induces turbulence and stirs up the water column which prevent sediment particles from settling. These particles are identified in hydroacoustic data as a plume of sediment above the pockmarks, which in turn can indicate FSGD.
Statements
Data availability statement
The raw data supporting the conclusions of this article will be made available by the authors, without undue reservation.
Author contributions
JH and JM contributed to the conception and design of the study. JH, MG, ES, YL and LT contributed to data acquisition in the field and subsequent analysis. JH wrote the first draft of the manuscript and JM, MG, ES, LT and AM contributed sections to the manuscript. All authors contributed to the article and approved the submitted version.
Funding
Funding for this work has been provided by the New Zealand Ministry of Business, Innovation and Employment (MBIE) through the Strategic Science Investment Fund (SSIF) administered by NIWA’s Oceans Centre. This research was also supported by the Marie Curie action KARST, under the EU H2020 program, project number 101027303 and from CA21112 - Offshore freshened groundwater: An unconventional water resource in coastal regions? – OFF-SOURCE”, supported by COST (European Cooperation in Science and Technology).
Acknowledgments
We are grateful to the skipper and crew of RV Ikatere for managing the vessel during the survey. We thank Steven Harding for interesting discussions about his unpublished Master’s Thesis work. Wellington Water Ltd. are thanked for discussion and provision of data and reports. I acknowledge support by the Open Access Publication Funds of Alfred-Wegener-Institut Helmholtz-Zentrum für Polar- und Meeresforschung.
Conflict of interest
The authors declare that the research was conducted in the absence of any commercial or financial relationships that could be construed as a potential conflict of interest.
Publisher’s note
All claims expressed in this article are solely those of the authors and do not necessarily represent those of their affiliated organizations, or those of the publisher, the editors and the reviewers. Any product that may be evaluated in this article, or claim that may be made by its manufacturer, is not guaranteed or endorsed by the publisher.
Supplementary material
The Supplementary Material for this article can be found online at: https://www.frontiersin.org/articles/10.3389/fmars.2023.1204182/full#supplementary-material
References
1
Albert D. B. Martens C. S. Alperin M. J. (1998). Biogeochemical processes controlling methane in gassy coastal sediments—Part 2: groundwater flow control of acoustic turbidity in Eckernförde Bay Sediments. Cont. Shelf Res.18, 1771–1793. doi: 10.1016/S0278-4343(98)00057-0
2
Arévalo-Martínez D. L. Haroon A. Bange H. W. Erkul E. Jegen M. Moosdorf N. et al . (2023). Ideas and perspectives: Land–ocean connectivity through groundwater. Biogeosciences20, 647–662. doi: 10.5194/bg-20-647-2023
3
Barnes P. M. Nodder S. D. Woelz S. Orpin A. R. (2019). The structure and seismic potential of the Aotea and Evans Bay faults, Wellington, New Zealand. New Zeal. J. Geol. Geophys.62, 46–71. doi: 10.1080/00288306.2018.1520265
4
Berndt C. Micallef A. (2019). Could offshore groundwater rescue coastal cities? Nature574, 36. doi: 10.1038/d41586-019-02924-7
5
Brown L. J. Jones A. (2000). Moera Gravel Aquifer Investigation Bore (Wellington Regional Council). Publication No. WRC/RINV-T-00/30, Wellington, New Zealand.
6
Bruns I. Holler P. CapPerucci R. M. Papenmeier S. Bartholomä A. (2020). Identifying trawl marks in north sea sediments. Geosci10, 1–31. doi: 10.3390/geosciences10110422
7
Davy B. Pecher I. A. Wood R. Carter L. Gohl K. (2010). Gas escape features off New Zealand: Evidence of massive release of methane from hydrates. Geophys. Res. Lett.37, 1–5. doi: 10.1029/2010GL045184
8
Donaldson I. G. Campbell D. G. (1977). Groundwater of the Hutt Valley-Port Nicholson Alluvial Basin - A Resource Evaluation. (DSIR Infor. Lower Hutt: New Zeland: Department of Scientific and Industrial Research).
9
Gall M. Davies-Colley R. (2021). A portable underway flow-through sampler for rapid survey of contaminated river plumes in coastal waters. Limnol. Oceanogr. Methods19, 67–80. doi: 10.1002/lom3.10405
10
Gilkinson K. King E. L. Li M. Z. Roddick D. Kenchington E. Han G. (2015). Processes of physical change to the seabed and bivalve recruitment over a 10-year period following experimental hydraulic clam dredging on Banquereau, Scotian Shelf. Cont. Shelf Res.92, 72–86. doi: 10.1016/j.csr.2014.11.006
11
Greinert J. Lewis K. B. Bialas J. Pecher I. A. Rowden A. Bowden D. A. et al . (2010). Methane seepage along the Hikurangi Margin, New Zealand: Overview of studies in 2006 and 2007 and new evidence from visual, bathymetric and hydroacoustic investigations. Mar. Geol.272, 6–25. doi: 10.1016/j.margeo.2010.01.017
12
Gyopari M. Grant K. Begg J. Nodder S. Knowling M. van der Raaij R. (2018). Wellington Harbour Exploration Bores Project - Hydrogeological Analysis of SP1a Exploration Phase: Abstraction Feasibility Assessment & Recommendations (Wellington, New Zealand: Wellington Water Limited).
13
Harding S. J. (2000). The characteristics of the waiwhetu artesian aquifer beneath wellington harbour including the spatial distribution and causes of submarine spring discharge. Marster Thesis, Victoria University, Wellington.
14
Hillman J. I. T. Gorman A. R. Pecher I. A. (2015). Geostatistical analysis of seafloor depressions on the southeast margin of New Zealand’s South Island - Investigating the impact of dynamic near seafloor processes on geomorphology. Mar. Geol.360, 70–83. doi: 10.1016/j.margeo.2014.11.016
15
Hoffmann J. J. L. Gorman A. R. Crutchley G. J. (2019). Seismic evidence for repeated vertical fluid flow through polygonally faulted strata in the Canterbury Basin, New Zealand. Mar. Pet. Geol.109, 317–329. doi: 10.1016/j.marpetgeo.2019.06.025
16
Hoffmann J. J. L. Michaelis R. Mielck F. Bartholomä A. Sander L. (2022). Multiannual seafloor dynamics around a subtidal rocky reef habitat in the north sea. Remote Sens.14. doi: 10.3390/rs14092069
17
Hoffmann J. J. L. Schneider von Deimling J. Schröder J. F. Schmidt M. Held P. Crutchley G. J. et al . (2020). Complex eyed pockmarks and submarine groundwater discharge revealed by acoustic data and sediment cores in Eckernförde bay, SW Baltic Sea. Geochem. Geophys. Geosys.21. doi: 10.1029/2019GC008825
18
Hu C. Muller-Karger F. E. Swarzenski P. W. (2006). Hurricanes, submarine groundwater discharge, and Florida’s red tides. Geophys. Res. Lett.33, 1–5. doi: 10.1029/2005GL025449
19
Hughes B. Morgan M. (2001). “Wellington,” in Groundwaters of New Zealand. Eds. RosenM. R.WhiteP. A. (Wellington: New Zealand Hydrological Society Inc), 397–410.
20
IPCC Core Writing Team (2014). Climate Change 2014: Synthesis Report. Contribution of Working Groups I, II and III to the Fifth Assessment Report of the Intergovernmental Panel on Climate Change. Eds. PachauriR. K.MeyerL. A. (Geneva, Switz.: IPCC), 151.
21
Jones A. Baker T. (2005). Groundwater monitoring technical report (Greater Wellington Regional Council publication). GW/RINV-T-05/86, Wellington, New Zealand
22
Judd A. G. Hovland M. (2009). Seabed fluid flow: the impact on geology, biology and the marine environment. (Cambridge, England: Cambridge University Press).
23
Karpen V. Thomsen L. Suess E. (2004). A new ‘schlieren’ technique application for fluid flow visualization at cold seep sites. Mar. Geol.204, 145–159. doi: 10.1016/S0025-3227(03)00370-0
24
Knee K. L. Paytan A. (2011). “Submarine Groundwater Discharge: A Source of Nutrients, Metals, and Pollutants to the Coastal Ocean,” in Treatise on Estuarine and Coastal Science (Elsevier), 205–233. doi: 10.1016/B978-0-12-374711-2.00410-1
25
Ladroit Y. Escobar-Flores P. C. Schimel A. C. G. O’Driscoll R. L. (2020). ESP3: An open-source software for the quantitative processing of hydro-acoustic data. SoftwareX12, 100581. doi: 10.1016/j.softx.2020.100581
26
Lee Y.-W. Kim G. Lim W.-A. Hwang D.-W. (2010). A relationship between submarine groundwater borne nutrients traced by Ra isotopes and the intensity of dinoflagellate red-tides occurring in the southern sea of Korea. Limnol. Oceanogr.55, 1–10. doi: 10.4319/lo.2010.55.1.0001
27
Lewis K. B. Mildenhall D. C. (1985). The late quaternary seismic, sedimentary and palynological stratigraphy beneath evans bay, wellington harbour. New Zeal. J. Geol. Geophys.28, 129–152. doi: 10.1080/00288306.1985.10422281
28
Luo X. Jiao J. J. (2016). Submarine groundwater discharge and nutrient loadings in Tolo Harbor, Hong Kong using multiple geotracer-based models, and their implications of red tide outbreaks. Water Res.102, 11–31. doi: 10.1016/j.watres.2016.06.017
29
MacIntyre S. Alldredge A. L. Gotschalk C. C. (1995). Accumulation of marines now at density discontinuities in the water column. Limnol. Oceanogr.40, 449–468. doi: 10.4319/lo.1995.40.3.0449
30
Maier K. Orpin A. Neil H. (2021). Seafloor pockmarks on the South Westland margin of the South Island/Te Waipounamu, Aotearoa New Zealand. New Zeal. J. Geol. Geophys. 66 (1), 42–58. doi: 10.1080/00288306.2021.2011328
31
Mérillet L. Méhault S. Rimaud T. Piton C. Morandeau F. Morfin M. et al . (2018). Survivability of discarded Norway lobster in the bottom trawl fishery of the Bay of Biscay. Fish. Res.198, 24–30. doi: 10.1016/j.fishres.2017.10.019
32
Micallef A. Averes T. Hoffmann J. Crutchley G. Mountjoy J. J. Person M. et al . (2022). Multiple drivers and controls of pockmark formation across the Canterbury Margin, New Zealand. Basin Res.34 (4), 1–26. doi: 10.1111/bre.12663
33
Micallef A. Person M. Berndt C. Bertoni C. Cohen D. Dugan B. et al . (2020a). Offshore freshened groundwater in continental margins. Rev. Geophys.59, 1–54. doi: 10.1029/2020RG000706
34
Micallef A. Person M. Haroon A. Weymer B. A. Jegen M. Schwalenberg K. et al . (2020b). 3D characterisation and quantification of an offshore freshened groundwater system in the Canterbury Bight. Nat. Commun.11, 1372. doi: 10.1038/s41467-020-14770-7
35
Mildenhall D. C. (1994). Palynostratigraphy and paleoenvironments of Wellington, New Zealand, during the last 80 ka, based on palynology of drillholes. New Zeal. J. Geol. Geophys.37, 421–436. doi: 10.1080/00288306.1994.9514631
36
Moore W. S. (1996). Large groundwater inputs to coastal waters revealed by 226Ra enrichments. Nature380, 612–614. doi: 10.1038/380612a0
37
Morgan L. K. Mountjoy J. J. (2022). Likelihood of offshore freshened groundwater in New Zealand. Hydrogeol. J.30, 2013–2026. doi: 10.1007/s10040-022-02525-1
38
Neumann B. Vafeidis A. T. Zimmermann J. Nicholls R. J. (2015). Future coastal population growth and exposure to sea-level rise and coastal flooding - A global assessment. PloS One10. doi: 10.1371/journal.pone.0118571
39
Nodder S. Begg J. Gyopari M. Woelz S. Lamarche G. Gerring P. (2018). Geological and geophysical summary, Te Whanganui a Tara/Wellington Harbour - Development of the Geological Model for hydrogeological investigations, NIWA Client Report prepared for Stantec MWH/Wellington Water Ltd (March 2018). NIWA Client Report 201841WN. Wellington: National Institute of Water and Atmospheric Research (NIWA).
40
Pallentin A. Verdier A. L. Mitchell J. (2009). Beneath the waves: Wellington Harbour (Wellington: National Institute of Water and Atmospheric Research (NIWA)).
41
Pau M. Gisler G. Hammer Ø. (2014). Experimental investigation of the hydrodynamics in pockmarks using particle tracking velocimetry. Geo-Marine Lett.34, 11–19. doi: 10.1007/s00367-013-0348-9
42
Paull C. Ussler W. Maher N. M. Greene H. G. Rehder G. Lorenson T. D. et al . (2002). Pockmarks off Big Sur, California. Mar. Geol.181, 323–335. doi: 10.1016/S0025-3227(01)00247-X
43
Post V. E. A. Groen J. Kooi H. Person M. Ge S. Edmunds W. M. (2013). Offshore fresh groundwater reserves as a global phenomenon. Nature504, 71–78. doi: 10.1038/nature12858
44
Prairie J. C. Ziervogel K. Camassa R. McLaughlin R. M. White B. L. Dewald C. et al . (2015). Delayed settling of marine snow: Effects of density gradient and particle properties and implications for carbon cycling. Mar. Chem.175, 28–38. doi: 10.1016/j.marchem.2015.04.006
45
Purkamo L. von Ahn C. M. E. Jilbert T. Muniruzzaman M. Bange H. W. Jenner A.-K. et al . (2022). Impact of submarine groundwater discharge on biogeochemistry and microbial communities in pockmarks. Geochim. Cosmochim. Acta334, 14–44. doi: 10.1016/j.gca.2022.06.040
46
Reine K. J. Clarke D. G. Dickerson C. (2002). "Acoustic characterization of suspended sediment plumes resulting from barge overflow," Army Engineer Research and Development Center, Vicksburg, MS. Available at: www.wes.army.mil/el/dots/doer.
47
Roberts J. M. Harvey S. M. Lamont P. A. Gage J. D. Humphery J. D. (2000). Seabed photography, environmental assessment and evidence for deep-water trawling on the continental margin west of the Hebrides. Hydrobiologia441, 173–183. doi: 10.1023/A:1017550612340
48
Rocha C. Wilson J. Scholten J. Schubert M. (2015). Retention and fate of groundwater-borne nitrogen in a coastal bay (Kinvara Bay, Western Ireland) during summer. Biogeochemistry125, 275–299. doi: 10.1007/s10533-015-0116-1
49
Rousakis G. Karageorgis A. P. Georgiou P. (2014). Geological structure and seabed morphology of the Stoupa submarine groundwater discharge system, Messinia, Greece. Environ. Earth Sci.71, 5059–5069. doi: 10.1007/s12665-013-2910-1
50
Rowan O. Pipe H. (2019). Wellington Harbour Bores – Exploratory Drilling Findings (Hamilton, New Zealand: Water, New Zealand Conference & Expo).
51
Saadatkhah N. Kassim A. Siat Q. A. Micallef A. (2023). Salt leaching by freshwater and its impact on seafloor stability: An experimental investigation. Mar. Geol.455, 106959. doi: 10.1016/j.margeo.2022.106959
52
Santos I. R. Chen X. Lecher A. L. Sawyer A. H. Moosdorf N. Rodellas V. et al . (2021). Submarine groundwater discharge impacts on coastal nutrient biogeochemistry. Nat. Rev. Earth Environ.2, 307–323. doi: 10.1038/s43017-021-00152-0
53
Schneider von Deimling J. Weinrebe W. Tóth Z. Fossing H. Endler R. Rehder G. et al . (2013). A low frequency multibeam assessment: Spatial mapping of shallow gas by enhanced penetration and angular response anomaly. Mar. Pet. Geol.44, 217–222. doi: 10.1016/j.marpetgeo.2013.02.013
54
Seager R. Ting M. Held I. Kushnir Y. Lu J. Vecchi G. et al . (2007). Model projections of an imminent transition to a more arid climate in Southwestern North America. Science316, 1181–1184. doi: 10.1126/science.1139601
55
Seitzinger S. P. Harrison J. A. (2008). “Land-Based Nitrogen Sources and Their Delivery to Coastal Systems,” in Nitrogen in the Marine Environment (Elsevier), 469–510. doi: 10.1016/B978-0-12-372522-6.00009-8
56
Simmonds J. MacLennan D. N. (2008). Fisheries acoustics: theory and practice. (New York, USA: John Wiley & Sons).
57
Starke C. Ekau W. Moosdorf N. (2020). Enhanced productivity and fish abundance at a submarine spring in a coastal lagoon on Tahiti, French Polynesia. Front. Mar. Sci.6. doi: 10.3389/fmars.2019.00809
58
Stevens G. R. (1974). Rugged Landscape: The Geology of Central New Zeland. including Wellington, Wairarapa, Manawatu, and the Marlborough Sounds (Wellington). Wellington: Reed.
59
Stott L. Davy B. Shao J. Coffin R. Pecher I. Neil H. et al . (2019). CO2 release from pockmarks on the chatham rise-bounty trough at the glacial termination. Paleoceanogr. Paleoclimatol.32(11), 1726–1743. doi: 10.1029/2019pa003674
60
van der Linden W. J. M. (1967). A textural analysis of Wellington Harbour sediments. New Zeal. J. Mar. Freshw. Res.1, 26–37. doi: 10.1080/00288330.1967.9515189
61
Watson S. J. Ribó M. Seabrook S. Strachan L. J. Hale R. Lamarche G. (2022). The footprint of ship anchoring on the seafloor. Sci. Rep.12, 1–11. doi: 10.1038/s41598-022-11627-5
62
Wood R. Davy B. (1992). Interpretation of Geophysical Data Collected in Wellington Harbour (Wellington, New Zealand). Client report no. 1992/78.
Summary
Keywords
Waiwhetu Aquifer, Wellington Harbour, offshore freshened groundwater, pockmarks, fluid seepage, gas escape
Citation
Hoffmann JJL, Mountjoy JJ, Spain E, Gall M, Tait LW, Ladroit Y and Micallef A (2023) Fresh submarine groundwater discharge offshore Wellington (New Zealand): hydroacoustic characteristics and its influence on seafloor geomorphology. Front. Mar. Sci. 10:1204182. doi: 10.3389/fmars.2023.1204182
Received
11 April 2023
Accepted
24 July 2023
Published
11 August 2023
Volume
10 - 2023
Edited by
Min Luo, Shanghai Ocean University, China
Reviewed by
Peter Feldens, Leibniz Institute for Baltic Sea Research (LG), Germany; Hiroyuki Matsumoto, Japan Agency for Marine-Earth Science and Technology (JAMSTEC), Japan
Updates
Copyright
© 2023 Hoffmann, Mountjoy, Spain, Gall, Tait, Ladroit and Micallef.
This is an open-access article distributed under the terms of the Creative Commons Attribution License (CC BY). The use, distribution or reproduction in other forums is permitted, provided the original author(s) and the copyright owner(s) are credited and that the original publication in this journal is cited, in accordance with accepted academic practice. No use, distribution or reproduction is permitted which does not comply with these terms.
*Correspondence: Jasper J. L. Hoffmann, jasper.hoffmann@awi.de
Disclaimer
All claims expressed in this article are solely those of the authors and do not necessarily represent those of their affiliated organizations, or those of the publisher, the editors and the reviewers. Any product that may be evaluated in this article or claim that may be made by its manufacturer is not guaranteed or endorsed by the publisher.