Abstract
Sea ice algae have a broad salinity tolerance but can experience stress during rapid decreases in salinity that occur with seasonal ice melt and during ice sample melt. This study investigated the impact of salinity on the photophysiological responses of bottom-ice algal communities from two Svalbard fjords (Tempelfjorden and Van Mijenfjorden). To further investigate the impact of salinity alone, and particularly to rapid freshening, the responses of a lab-cultured ice algal community from Van Mijenfjorden were assessed. Photophysiological responses were mainly determined via 14C-based incubations which provided photosynthesis-irradiance curves. Main findings showed that i) the bottom-ice algal community in Tempelfjorden was characterized by lower photosynthetic efficiency and chlorophyll a biomass than the Van Mijenfjorden communities, and ii) a lab-cultured ice algal community from Van Mijenfjorden dominated by pennate diatoms had significantly lower photosynthetic efficiency, maximum photosynthesis and photoacclimation index after a decrease in salinity from 33 to 10. The lower photosynthetic efficiency and chlorophyll a biomass at Tempelfjorden may be attributed to the almost two-fold lower bulk-ice salinity in Tempelfjorden compared to Van Mijenfjorden, which was likely associated with freshwater inputs from the tidewater glacier Tunabreen during sea ice formation. Other factors such as under-ice light intensities, brine volume fraction and brine nutrient concentrations likely also contributed to variability in ice algal response. Furthermore, experimental results indicated that the cultured Van Mijenfjorden community was negatively impacted by a rapid (within 4 to 24 h) reduction in salinity from 33 to 10. We further documented a significant start of recovery of these algae after 168 h. From this work, we surmise that decreases in surface water salinity, for example arising from the intensifying freshening of fjord waters, may only cause temporary changes in ice algal photoacclimation state and thus in chlorophyll a biomass. Further, this study also supports the need for salinity buffered melt of sea ice samples to reduce artificial bias in biological measurements.
1 Introduction
Sea ice algae contribute between 2–26% of the total annual marine primary productivity in seasonally sea ice-covered coastal waters of the Arctic (Legendre et al., 1992a; Arrigo, 2017). These photosynthetic organisms play an important role in the marine carbon cycle through their assimilation of inorganic carbon and generation of organic carbon (Wassmann et al., 2011). The majority of sea ice algal growth within coastal first-year ice (FYI) occurs in the spring (Leu et al., 2015), and communities are typically concentrated in the bottommost skeletal layer of the ice (Meiners et al., 2018; Van Leeuwe et al., 2018). Here, these bottom-ice algae experience growth conditions largely governed by the characteristics of the underlying water column, with salinities usually in the range of 30 − 35 (Arrigo, 2014). In late spring-summer, bottom-ice algae must seasonally cope with large salinity decreases in the sea ice and surface waters, from more than 30 down to as low as zero, with snow and sea ice melt (Holt and Digby, 1985; Gradinger et al., 2010; Arrigo, 2014).
Such decreases in salinity may become especially significant in fjord systems in the future with glacial calving, and release of meltwater intensifies with climate change (Błaszczyk et al., 2019; Halbach et al., 2019). Increases in sea ice melt within coastal areas due to increased precipitation over the Arctic Ocean (Bintanja and Andry, 2017; IPCC, 2019) could additionally contribute to the overall freshening of Arctic coastal surface waters. The resultant freshening of surface waters may lower bulk-ice salinity with reduced permeability of sea ice in the area, and in turn, reduce the amount of habitable space for sea ice algae to grow (e.g., Vonnahme et al., 2021). Bottom-ice algae may be directly exposed to these fresher surface waters due to their concentrated growth at the ice-ocean interface, although the extent of exposure for these algae to the fresher conditions will also depend on the sea ice location [e.g., with latitude, sea ice type (first-year ice versus multi-year ice)] and with the time at which the freshening occurs (e.g., seasonality spring versus summer). Western Svalbard fjords are thought to be especially prone to increases in freshwater with climate change, with drastic declines in winter ice cover (Pavlova et al., 2019; Urbański and Litwicka, 2021), and increased freshwater inputs from glaciers (Calleja et al., 2017; Błaszczyk et al., 2019; Fransson et al., 2020) or rivers (McGovern et al., 2020; Pogojeva et al., 2022) already documented. The fjords adjacent to the West Spitsbergen Shelf are also subject to strong seasonality, including the widespread freshening of surface waters with local precipitation events, snow and sea ice melt, river runoff, as well as the direct discharge that comes from the nearby calving glaciers (Svendsen et al., 2002).
The impact of freshening (i.e., low salinity) has been often observed to change sea ice algal photophysiology (e.g., Bates and Cota, 1986; Campbell et al., 2019), and reduce sea ice algal chlorophyll a (Chl a) or biomass (e.g., Haecky and Andersson, 1999; Granskog et al., 2003; Campbell et al., 2019), as well as to facilitate a greater proportion of flagellate cells in the algal community (e.g., Piiparinen et al., 2010; Rintala et al., 2014). A number of these assessments focused on the impact of sea ice sample melt. To minimize hypoosmotic stress, some studies have advocated to add three to four parts of filtered seawater (FSW) to one part of ice (e.g., Garrison and Buck, 1986; Mikkelsen and Witkowski, 2010; Campbell et al., 2019), while still others used a direct melting of bulk-ice samples without adding FSW (e.g., Søgaard et al., 2010; Kaartokallio et al., 2013; Fernández-Méndez et al., 2018) since the addition of FSW is suggested to enhance primary productivity via the introduction of nutrients (Rintala et al., 2014). This highlights a lack of consensus in standardizing the methodology for obtaining accurate photophysiological parameters, Chl a and community composition from sea ice algae. Furthermore, despite work to date on melt procedure, it remains uncertain what the long-term acclimation response (i.e., more than 48 h) of Arctic bottom-ice algal communities is to decreasing salinity. Acclimation is defined, in this study, as the ability of sea ice algae to become accustomed to new surrounding conditions (e.g., salinity, nutrients, light) through physiological processes. Acclimation and physiological responses to reduced salinities occur on short-term (times scale of hours) and/or comparatively long-term (time scales of days). Previous research suggested that sea ice algae may have the capability to recover from hypoosmotic stress after a period of 72 h, but this potential capability for recovery remains uncertain (Campbell et al., 2019).
In this study, we aim to determine the responses of bottom-ice algal communities to differences in salinity, and experimentally, to rapid decreases in salinity (i.e., freshening) on short-term (i.e., 4 h-24 h) and comparatively longer-term (i.e., 168 h) time scales. We tested the hypothesis that low Chl a, reduced photosynthetic capability, and greater abundance of flagellates are characteristics of more freshwater influenced sea ice environments by contrasting the natural communities of bottom-ice algae in two seasonally ice-covered western Svalbard fjords of varying freshwater inputs; Tempelfjorden (TF) and Van Mijenfjorden (VM). These two fjords were selected due to the presence of the tidewater glacier Tunabreen in TF that was likely to provide comparatively greater freshwater inputs to TF compared to VM (Hald et al., 2001; Murray et al., 2003; Fransson et al., 2015; Larsen et al., 2018; Fransson et al., 2020; Pogojeva et al., 2022). We further conducted controlled experiments to assess the impacts of a rapid decrease in salinity on a cultured community collected in VM through short and long-term laboratory-based salinity acclimation experiments. Through this work, we provide insight on the potential consequences of the freshening of Arctic coastal waters on sea ice algal communities and their ability to acclimate to changing salinity conditions. We also outline recommendations on the best practice for ice melting procedure.
2 Materials and methods
2.1 Environmental characteristics of Tempelfjorden and Van Mijenfjorden
2.1.1 Description of study areas and sampling sites
Sampling took place in TF and VM in spring 2021. Water at the ice-ocean interface and sea ice samples were collected at one site in TF (TF1) on 12 April, and at two sampling sites in VM that are referred to as Site 1 (VM1) on 17 April and Site 2 (VM2) on 14 April (Figure 1). The TF site is located at the easternmost (inner) part of Isfjorden. This 14-km-long and 5-km-wide fjord (Forwick et al., 2010; Pogojeva et al., 2022) lacks a distinct sill at its opening (Fransson et al., 2020) and is divided into two basins (Fransson et al., 2020; Pogojeva et al., 2022). Van Mijenfjorden is the second largest fjord on the west coast of Spitsbergen, with a length of 50 km and width of 10 km (Larsen et al., 2018). It is located further south than TF and is also divided into two basins (Larsen et al., 2018). At the mouth of VM fjord is the island of Akseløya, which together with an outer sill of 34 m restricts the inflow of comparatively warm and saline Atlantic waters and protects the landfast sea-ice (fast-ice) cover from significant wave action (Skarðhamar and Svendsen, 2010).
Figure 1
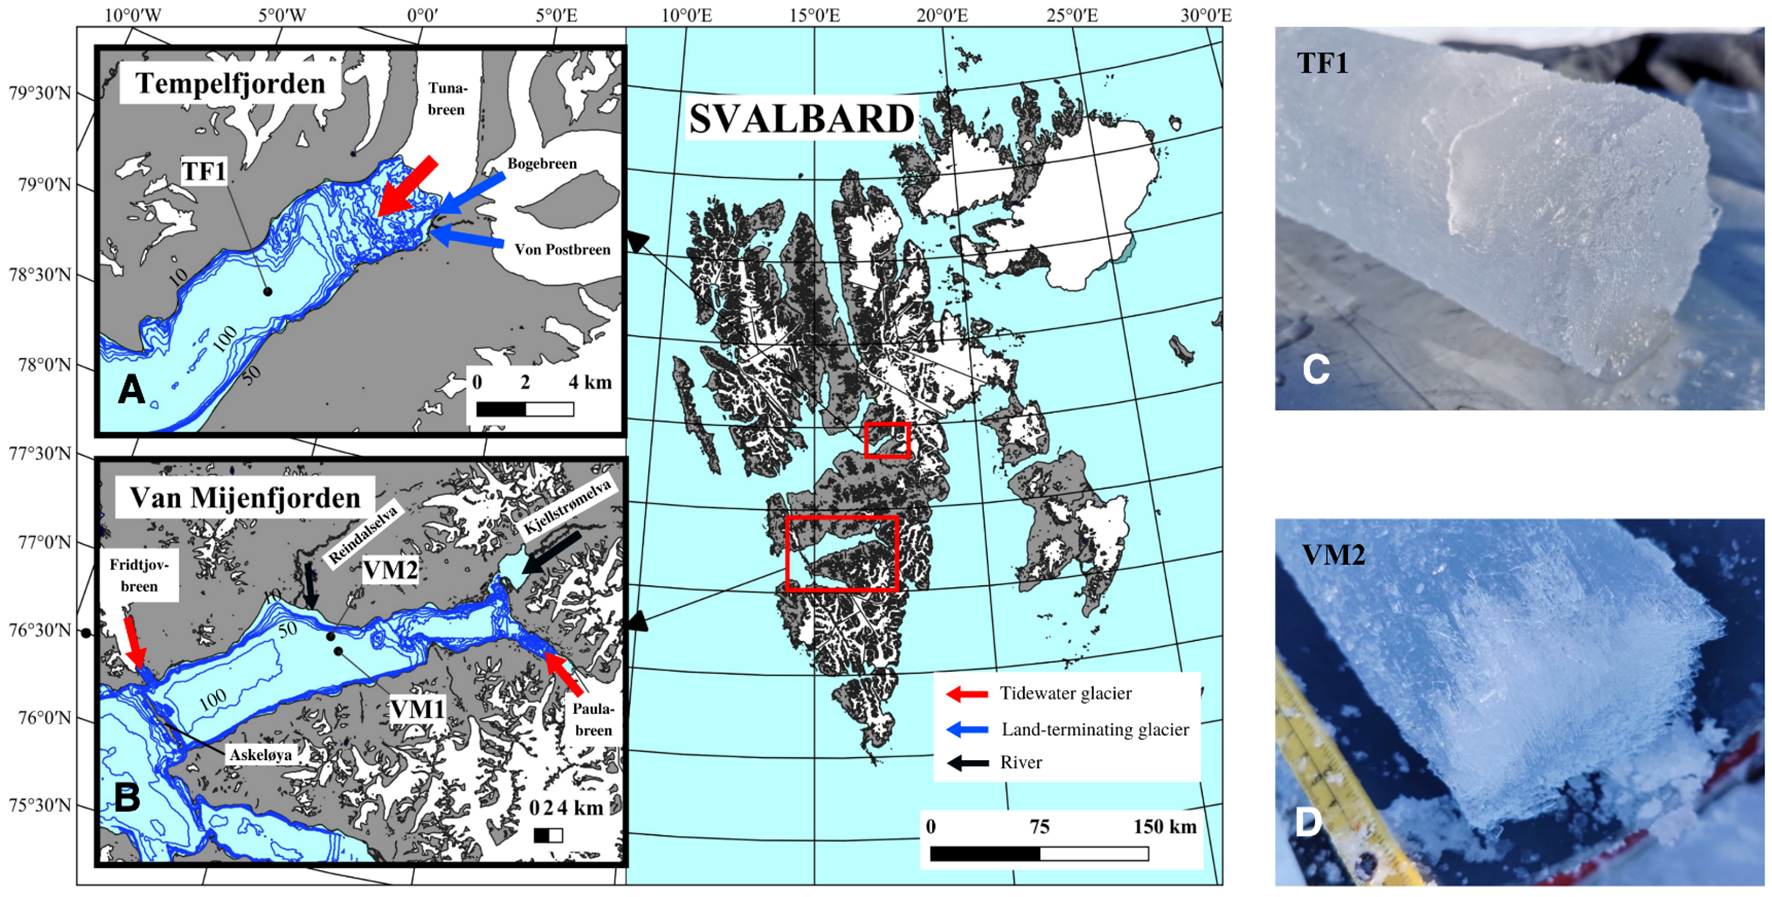
Map of the field study sampling sites in two Svalbard fjords at Tempelfjorden (A): TF1, and at Van Mijenfjorden (B): VM1 and VM2 (Definitions Sections 1, 2.1.1). The land, glaciers (e.g., Tunabreen, Bogebreen, Von Postbreen, Paulabreen and Fridtjovbreen) and fjord water are colored in grey, white and light blue, respectively. Black lines represent the two rivers flowing into Van Mijenfjorden (i.e., Reindaselva and Kjellstrømelva). The arrows represent the freshwater inflow either from a tidewater glacier (red), a land-terminating glacier (blue) or a river (black). The size of the arrows indicates the importance of the freshwater inflow for the fjord system in TF (Fransson et al., 2015; Fransson et al., 2020; Pogojeva et al., 2022) and in VM (Hald et al., 2001; Murray et al., 2003; Larsen et al., 2018). Map layer is from the Norwegian Polar Institute Map Data and Services. Blue isobaths represent the bathymetry based on Geonorge (version 13.3.655). Visible skeletal layer was absent at TF1 (C) while a more-defined skeletal layer (roughly 2 cm) was observed at VM2 (D) which was similarly seen at VM1.
The tidewater glacier Tunabreen and the land-terminating glaciers Bogebreen and Von Postbreen are important freshwater sources in TF (Fransson et al., 2015; Fransson et al., 2020; Pogojeva et al., 2022) and were close to our sampling site TF1 (about 8 – 9 km away) (Figure 1). Despite VM receiving freshwater from the tidewater glaciers Fridtjovbreen (Murray et al., 2003), and Paulabreen (Hald et al., 2001), as well as from the Kjellstrømelva river in the Kjellstrømdalen valley (Hjelle, 1993; Larsen et al., 2018), the sampling sites VM2 and VM1 were further away from these freshwater sources (20 km or more) compared to the proximity of TF1 to Tunabreen. Reindalselva was the closest freshwater source from VM2 (about 6 km away) and VM1 (about 9 km away) (Figure 1), but was considered to have a low freshwater influence (i.e., less significant freshwater influence than, for instance, ice melt or glacial meltwater release, and which therefore results in lower exposure of sea ice algae to rapid decreases in salinity) since rivers in Svalbard typically release more freshwater in late spring-summer, after our sampling events (Hjelle, 1993; McGovern et al., 2022). Therefore, the rivers in VM were considered to have a negligible freshwater influence on VM2 and VM1, at the time of sampling, specifically compared to the influence of Tunabreen on TF1.
2.1.2 Environmental characteristics
Prior to the collection of each ice core, average of snow depth, ice thickness and freeboard for individual sampling sites were measured. Ice cores were collected at TF1 (total n = 13), VM1 (n = 7) and VM2 (n = 12) using a 9-cm (inner diameter) ice core barrel (Kovacs Enterprise Mark II). A total of eight, four and five of these ice cores from TF1, VM1 and VM2 were pooled and melted, respectively, with the addition of interface-FSW (0.2 μm) at an approximate ratio of three parts FSW to one part ice (FSW3:1) based on the method used by Campbell et al. (2019) for primary productivity and photophysiology assessments, and for further measurements of particulate organic carbon-nitrogen and Chl a (Section 2.1.3). The FSW added to the samples was prepared from surface seawater which was sampled within 10 cm of the ice-ocean interface at all sites through an ice core hole using a peristaltic pump (Masterflex® L/S® Portable Sampling Pump) and which was immediately filtered (0.2 μm) following transport to the laboratory. Here, bulk-ice samples were melted in a saltwater solution (0.2 μm FSW) to avoid the decreases in salinity, and are compared to undiluted bulk-ice salinity treatments of about 3 or 10 (Weeks and Ackley, 1982). This would otherwise cause cell damage and reductions in Chl a, cell abundance and/or community composition (Garrison and Buck, 1986; Mikkelsen and Witkowski, 2010; Chamberlain et al., 2022), primary productivity, and shifts in algal photophysiology (Ralph et al., 2007; Campbell et al., 2019). All ice samples were melted at room temperature in darkness over a period of 24 h and regularly checked for complete melt. The melting procedure was stopped as soon as the last pieces of sea ice had melted in order to prevent the samples from warming up to room temperature. One ice core was collected at VM1 and VM2 for obtaining Chl a profiles of the entire ice column. The bottom 10 cm of each core were sectioned into 0 − 3 and 3 − 10 cm segments (distance from ice – ocean-interface) and then further sectioned at an interval of 10 − 13 cm from 10 cm toward the top (sea ice surface). Each segment was then melted with FSW dilution prior to processing for obtaining Chl a measurements. An additional ice core was collected at each sampling site to measure ice temperature and bulk-ice salinity profiles. Each of these cores were sectioned into bottom 2.5 cm and above 5 cm thick sections prior to melting without FSW dilution. Additionally, one ice core was collected and sectioned at each sampling site for measurement of inorganic nutrients and dissolved inorganic carbon. These measurements were only taken in the 3 cm bottom-ice segments after melting without FSW dilution.
Under-ice light measurements were done using an Underwater Hyperspectral Imager (UHI, Model 4, Ecotone AS, Norway). Briefly, during each survey the UHI was mounted on an under-ice arm, lowered under the ice through three overlapping ice core holes (14 cm internal diameter) and subsequently lifted-up by pivoting at a point just below the hole so that the arm could extend the UHI sensor 1.1 m towards the sun to minimize any influence of the hole on the transmitted photosynthetically active radiation (PAR, 400 − 700 nm) measured by the UHI. The UHI surveys covered a bottom-ice area of approximately 1.0 x 0.5 m, consisting of 968 x ~ 2000 pixels. Each pixel collected spectral radiance in 214 wavelength bins. Spectral radiance values were integrated over the PAR wavelength range (W m–2 sr–1) and converted to irradiance over the entire survey region (W m–2). Irradiance was then converted to photon fluxes (µmol photons m–2 s–1) using 1 µmol photons m–2 s–1 = 0.217 W m–2 (Nicolaus and Katlein, 2013).
Temperature was measured directly at the ice-ocean interface at all sites using a CTD (SonTek Castaway®). Unfortunately, only temperature measurements could be taken from the Castaway due to technical issues of the instrument´s conductivity sensor. Interface salinity was instead measured using a conductivity meter (ProfiLine Cond 3110-WTW) in the laboratory, after surface seawater was sampled within 10 cm of the ice-ocean interface at all sites through an ice core hole, using a peristaltic pump (Masterflex® L/S® Portable Sampling Pump). Physical parameters such as sea ice temperature and bulk-ice salinity were measured for the entire ice core at a vertical resolution of 5 cm. Sea ice temperature was measured along an entire ice core, starting at 2.5 cm distance from the ice-ocean interface and continuing in 5 cm intervals over the entire core length using a thermometer probe (RS PRO RS 1720), which was inserted into ca. 4 cm deep holes drilled into the core at each measurement spot. The same core was then immediately sectioned into bottom 2.5 cm and above 5 cm thick sections and melted back at laboratory facilities. Following a 24 h melt period and complete melt, bulk-ice salinity was measured using a conductivity meter (ProfiLine Cond 3110-WTW). Brine volume fraction was calculated from bulk-ice salinity and sea ice temperature measurements using the equation based on Frankenstein and Garner (1967) for a bulk-ice temperature between −8.2°C − −2.06°C.
2.1.3 Biogeochemical characteristics in Tempelfjorden and Van Mijenfjorden
Additional measurements of chemical-biological parameters were completed on bottom-ice sections (0 − 3 cm) following undiluted sample melt (i.e., individual section melt without FSW additions), including: inorganic nutrients [nitrite + nitrate (NO2 + NO3), phosphate (PO4) and silicic acid (Si(OH)4)], dissolved inorganic carbon (DIC), and particulate organic carbon (POC) and nitrogen (PON), and also following diluted pooled sample melt (i.e., 3 cm pooled core sections melting into cooler jugs filled up with FSW), including DIC, Chl a, ice algal community composition (method described further below), and gross primary productivity (GPP; method described Section 2.1.4).
Pseudo-duplicate samples (i.e., two samples which were taken from the same ice core) for analysis of inorganic nutrients were also collected from the ice-ocean interface water at each site, as well as from undiluted melted 3 cm individual ice core sections. Wearing vinyl gloves, seawater or melted ice samples were filtered through an acid washed swinnex filter holder assembled with 25 mm GF/F filter (Whatman) into 15 mL acid washed Falcon tubes. The samples were stored at −20°C until analysis within six months on a nutrient autoanalyzer (QuAAtro 39, SEAL Analytical, Germany), following the method described by Vonnahme et al. (2021). As sea ice algae live within brine channels, the in situ brine nutrient concentrations were further calculated by first calculating brine salinity following the equation from Assur (1960) for a bulk-ice temperature above −8.2°C, and then by multiplying the nutrient concentrations with the ratio of brine salinity to bulk-ice salinity. Molar ratios of NO2 + NO3 to PO4 (N:P) and NO2 + NO3 to Si(OH)4 (N:Si) were also calculated for the ice-ocean interface, bulk-ice and brine.
Dissolved inorganic carbon (DIC) was measured on sea ice from undiluted melted 3 cm individual ice core sections and also from diluted melted 3 cm pooled ice core sections incubated for measuring GPP (Section 2.1.4), following the method used by Hu et al. (2018). In the field, bottom-ice core sections were sealed in impermeable gas bags (Nylon/Poly bags) using a vacuum sealer (Cabela’s brand sealer). Ice samples were then melted in darkness and sub-sampled in duplicate within 24 h of collection. This was done by using a glass syringe to fill 15 mL exetainers before spiking with 20 µL of HgCl2 and storage at 4°C in the dark. Analysis of DIC samples was conducted within six months of collection using an Infrared CO2 analyzer (Apollo SciTech Inc., United States), and were further verified to be within ± 3 μmol kg–1 following a routine analysis of Certified Reference Materials provided by A. G. Dickson, Scripps Institution of Oceanography, San Diego, California.
Samples of particulate organic carbon and nitrogen (POC/N), Chl a and community composition were all completed on the diluted meltwater of 3 cm pooled ice core sections described above. For POC/N, volumes of 60 to 400 mL were filtered onto 21 mm GF/F filters (Whatman) previously combusted at 450°C for 6 h. A blank with only FSW was included for each sampling event. All samples were stored at −20°C in the dark and were processed in the laboratory within six months on a CHN Analyzer (Lab-Leeman CEC 440, United Kingdom) following the method described by Reigstad et al. (2008). Pseudo-duplicates of Chl a were filtered onto a 25 mm GF/F filter (Whatman) before placement into 20 mL glass vials (Wheaton) and pigment extraction into 10 mL of 90% acetone at 4°C in darkness for 24 h. Following extraction, raw fluorescence measurements were taken using a Turner Designs Trilogy fluorometer (Parsons et al., 1984) before and after addition of 2N HCl. Community composition was assessed by subsampling 100 mL of the pooled ice samples into a Nalgene bottle and fixation with 10 mL of a 20% formalin solution before storage at 4°C, giving a final concentration of 2% in the sample. Cell identification was based on previous research from von Quillfeldt (1996) and Hasle et al. (1994), and it was done under an inverted microscope (Leica DM IL LED, Germany), largely to genus level, and were counted in an Utermöhl chamber (Hydro-Bios, 2.973 mL) over three transects of 20 mm for a total of 400 cells (at minimum). Samples with low cell concentrations from TF1 and VM2 were first settled using a sedimentation column (Hydro-Bios, total sedimentation volume of 10 mL), while the samples from VM1 were directly transferred into the Utermöhl counting chamber (Hydro-Bios, 2.973 mL).
2.1.4 Measurement of gross primary productivity on sea ice samples
Gross primary productivity (GPP) was measured at each site following the method of Campbell et al. (2016). Here, 10 to 12 60 mL polystyrene culture flasks (Corning) were each filled with 50 mL sample of pooled ice meltwater and were incubated for 3 h at −2°C, with the addition of 1 mL of a 14C radioactive solution (4 µCi mL–1) (Strickland and Parsons, 1972). This was done in a light chamber providing an irradiance range of approximately 10 to 300 µmol photons m–2 s–1 using cool white light emitting diode (LED; Co/tech 15W IP65). The average (n = 3) integrated PAR for each flask position was determined immediately prior to each incubation using a Walz US-SQS/L probe. One or two darkened polystyrene flasks were used as blanks, being incubated with 50 µL of 3-3,4-dichlorophenyl-1,1-dimethylurea (DCMU) at 25 µmol L–1 to inhibit photosynthetic activity and thus to only quantify 14C passively entering the algal cells via osmosis (Legendre et al., 1983). This was done to correct 14C active uptake measurements obtained when algal cells carry out photosynthesis. Following incubation, each sample was filtered onto a 25 mm GF/F filter (Whatman) and filters were placed into 20 mL glass scintillation vials before acidification with 0.5 N HCl. After the filters dried over 24 h, 10 mL of Ecolume scintillation cocktail were added to the glass scintillation vials. Radioactivity of these samples were measured using a scintillation counter (Tri-Carb 2900 TR) within one month. Photosynthesis versus irradiance (PI) curves were modelled using the exponential function in the presence of photoinhibition (Platt et al., 1980). The Chl a-normalized photophysiological parameters known as maximum photosynthetic rate in the absence or presence of photoinhibition (μg C μg Chl a–1 h–1), respectively, photosynthetic efficiency (μg C μg Chl a–1 h–1 [μmol photons m–2 s–1]–1), photoacclimation index Ik (μmol photons m–2 s–1), photoinhibition rate (μg C μg Chl a–1 h–1 [μmol photons m–2 s–1]–1) were determined with Matlab (R2020b (9.9.0), Mathworks Inc., USA). The exponential equation from Platt et al. (1980) was specified for the fittype function of Curve Fitting Toolbox, Matlab R2020b (9.9.0), Mathworks Inc., USA.
2.2 Laboratory-based experiments on a Van Mijenfjorden cultured ice algal community
2.2.1 Collection and growth of Van Mijenfjorden culture
Algae from VM2 on 14 April were collected for experiments at UiT The Arctic University of Norway. This was done by placing a subsample of the pooled ice meltwater into pre-prepared sterile Guillard F/2 growth media containing silica (Andersen, 2005) before transport for experimentation. The VM2 algae were grown at 4°C (INCU-Line 150R Premium incubator) and 30 μmol photons m–2 s–1 in artificial seawater (salinity 33) following the American Society for Testing and Materials (ASTM D1141-98) composition and containing the same Guillard F/2 growth media with silica (Andersen, 2005). Cultures were acclimated to these growth conditions for approximately four months prior to experimentation at the same temperature and light conditions. 10% of the algal culture was placed in 50 mL fresh media every two weeks over the four-month period. Algae were placed in new media and mixing occurred each time new media was made. Experiments were done with this culture in a stage of exponential growth phase (Supplementary Figure 1), corresponding to a specific growth rate of 0.36 d–1. The community composition of cultures was assessed at the time of experimentation (see details Section 3.2.1).
2.2.2 Experimental procedure
The experiment consisted of growing VM2 cultures under irradiance of 30 μmol photons m–2 s–1 for 4, 24 and 168 h in two salinity treatments: one control ocean surface water salinity treatment of 33, to which the VM2 cultured algae were acclimated, and one lowered salinity treatment of 10 (Figure 2). The salinity 33 was selected as the stock culture and control salinity treatment since Arctic surface water salinities typically range from 30 – 35 (Arrigo, 2014), and because the VM2 community had been acclimated to an in situ surface water salinity of approximately 30 (Section 3.1.1). Similarly, 10 was chosen as the experimental treatment as the melting of sea ice core sections, without buffering with FSW, may lead to a bulk-ice salinity of 10 (Campbell et al., 2019), but is also similar to what bottom-ice algae can experience during the melt season (Hop et al., 2011; Mundy et al., 2011; Smith et al., 2022). To start a given experimental treatment, 5% of cultured algae were transferred to individual sterile cell culture flasks (Thermo scientific Nunc EasYFlask) containing media at either control or experimental salinities.
Figure 2
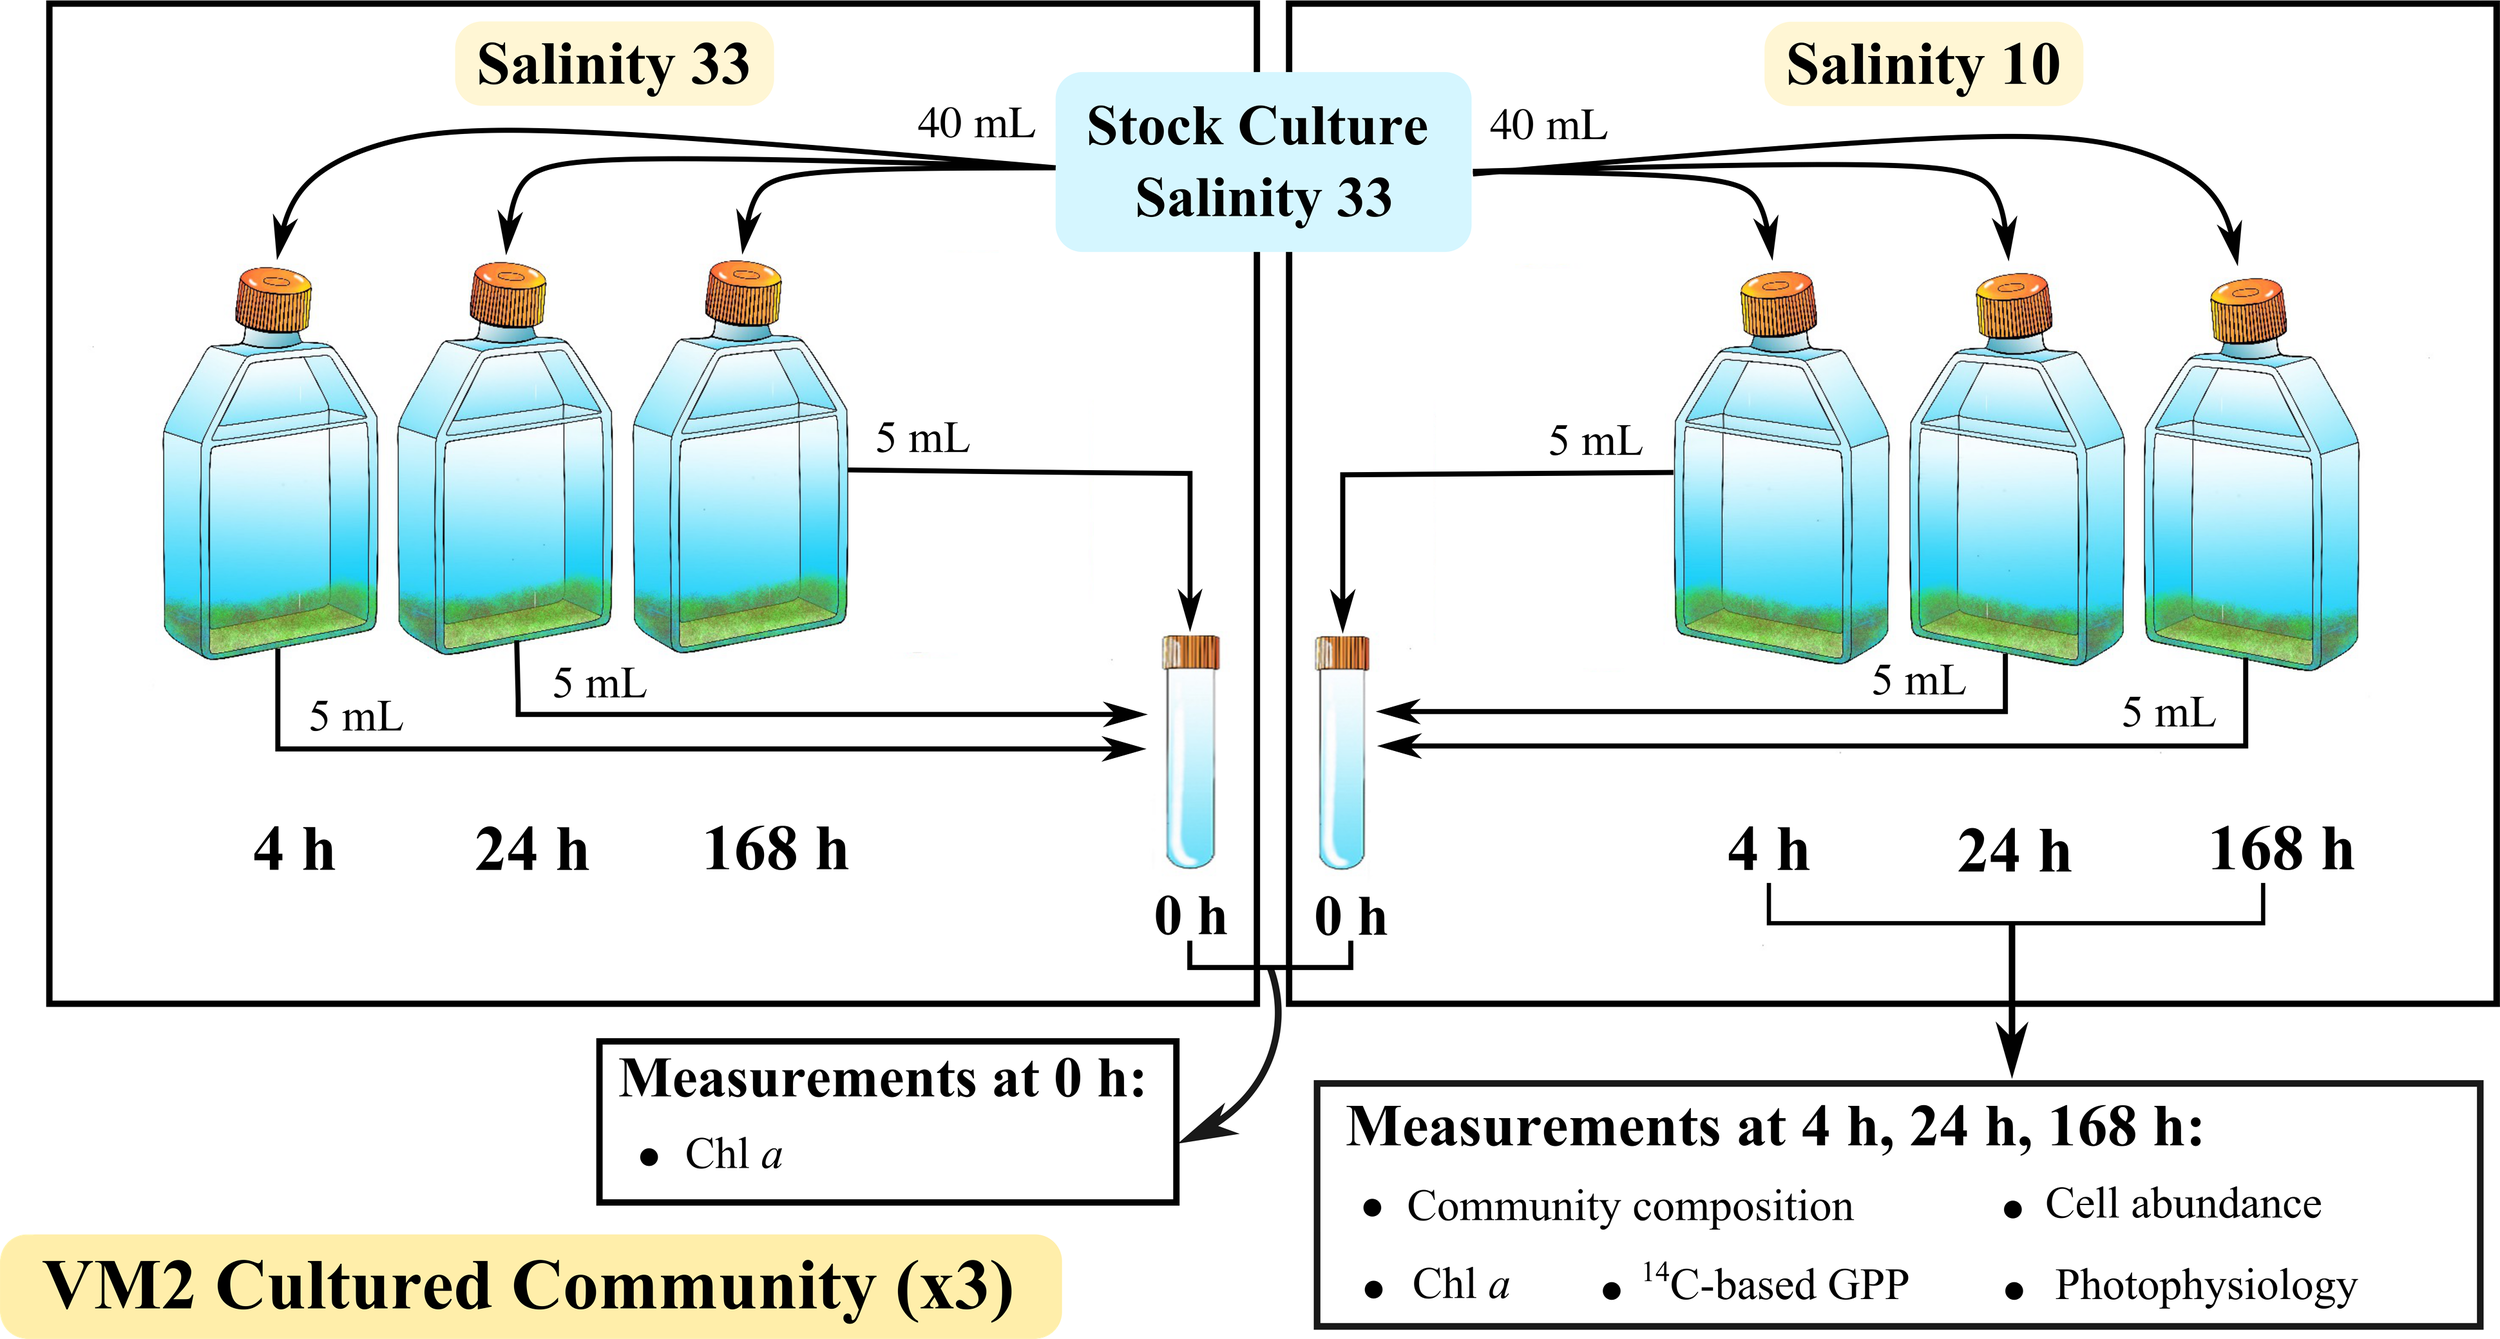
Experimental design for two treatments of salinity: Control 33 and low 10, showing measurements at the initial time (0 h) of the experiment and after a 4 h, 24 h and 168 h growth of a VM2 cultured ice algal community (Definitions Sections 1, 2.1.1, 2.2.1), in a given salinity treatment. Definitions of the measurements are given in Sections 1, 2.1.3, 2.2.2.
To assess acclimation responses of the VM2 cultured ice algal community to decreases in salinity, Chl a, relative community composition (%), cell abundance (cells L–1), 14C-based GPP and photophysiology were measured at each defined time point (Figure 2), using the methodologies outlined above (Sections 2.1.3 and 2.1.4). In this study, the new acclimation state (i.e., recovery) of cultured ice algae to low salinity of 10 was mainly determined by significant increases in photophysiological parameters ( and ) towards the values observed in the control salinity of 33, restoring their pre-exposure levels. The Chl a concentration was also measured at initial time of the experiment (0 h) to investigate the evolution of algal biomass in the treatments over time. All measurements from culture experiments followed the methodology described previously for field samples, with the exception that samples for community composition and cell abundance were fixed with acidic lugol solution, and theoretical DIC concentrations assuming 100% saturation (Parsons et al., 1984) were used rather than directly measured. This experiment was conducted in triplicate over the course of four months.
2.3 Statistical analyses
All statistical analyses were conducted using the statistical software SPSS (IBM version 28.0.0). Prior to running any statistical tests, assumptions of normality and homogeneity of variances were verified conducting a Shapiro-Wilk test and Levene’s test, respectively. When comparing culture-based measurements in the two salinity treatments, an independent t-test was conducted if variances were found to be homogenous and an unequal variance Welch t-test was conducted if they were not homogenous. Independent and Welch t-tests are reported with t-statistic t (df), where df is the degrees of freedom.
When comparing culture-based measurements between the three time points at a given salinity, a one-way ANOVA was conducted. If the assumption of normality or homogeneity of variances was not verified, the data were log transformed prior and the assumptions were verified again. In the case the log transformed data still did not verify one of the previous assumptions, a Kruskal Wallis H test was conducted. The ANOVA tests of significance (p < 0.05) were further processed with Fisher´s post hoc test of significance. ANOVA results are reported with the F-statistic F (df1, df2) where df1 is the degrees of freedom pertaining to time points, and df2 is the number of observations less the number of time points. Kruskal Wallis H results were reported with the H-statistic, H (df1). Post hoc tests were not run since the results of the Kruskal Wallis H test were never significant (p > 0.05). Respective p-values were reported for all statistical tests. Significance for all statistical analyses in this study was determined for p-values < 0.05.
3 Results
3.1 Dynamics of Tempelfjorden and Van Mijenfjorden systems
3.1.1 Environmental characteristics of the sampling sites
Snow depth was the thickest at VM1 with an average of 14.9 ± 0.6 cm, followed by TF1 (4.1 ± 0.7 cm) and VM2 (3.0 ± 0.0 cm) (Table 1). Overall, sea ice was 10.8 – 22.3 cm thicker at VM1 (39.8 ± 1.0 cm) and VM2 (51.3 ± 0.3 cm), respectively, than at TF1 (29.0 ± 1.2 cm) (Table 1). Negative ice freeboard was only measured at VM1 (−1.0 ± 0.7 cm) (Table 1). Under-ice PAR was the lowest at VM1 (0.8 μmol photons m–2 s–1) and about two-fold higher at TF1 (5.1 μmol photons m–2 s–1) than at VM2 (2.1 μmol photons m–2 s–1). Temperature of the water collected directly at the ice-ocean interface was distinct between TF1 (−1.2°C) and VM (−1.8°C) (Table 1). Salinity of this interface water was also similar across all sampling sites, ranging from 29.9 – 30.0 (Table 1). Bottom-ice bulk-ice salinity was almost two-fold lower at TF1 (4.1) than at VM1 (7.4) or VM2 (7.6) (Table 1). Moreover, the bulk-ice salinity profile at TF1 differed from those at VM1 and VM2, as bulk-ice salinity was the greatest at the snow-ice surface and lowest in the ice-ocean bottom at TF1 (Figure 3). Brine volume fraction was lower in the 2.5 cm bottom-ice at TF1 (6.5%) than at VM1 (16.2%) and VM2 (14.9%) (Figure 3). A more-defined skeletal layer of roughly 2 cm was documented at the bottom-ice of VM1 and VM2, which is in contrast to the bottom-ice of TF1 where no visible skeletal layer was observed (Figure 1; Supplementary Figure 2).
Table 1
| TF1 | VM1 | VM2 | ||||||||
|---|---|---|---|---|---|---|---|---|---|---|
| General | ||||||||||
| Date | 12/04/2021 | 17/04/2021 | 14/04/2021 | |||||||
| Coordinates | 78.41 °N, 17.08 °E | 77.80 °N, 15.76 °E | 77.82 °N, 15.71 °E | |||||||
| Snow depth (cm) | 4.1 ± 0.7 | 14.9 ± 0.6 | 3.0 ± 0.0 | |||||||
| Ice thickness (cm) | 29.0 ± 1.2 | 39.8 ± 1.0 | 51.3 ± 0.3 | |||||||
| Ice Freeboard (cm) | 0.4 ± 0.5 | −1.0 ± 0.7 | 4.7 ± 0.7 | |||||||
| PAR (μmol photons m–2 s–1) | 5.1 | 0.8 | 2.1 | |||||||
| Environment | IO a | BI b | PC c | IO | BI | PC | IO | BI | PC | |
| Physical | ||||||||||
| IO a | Temperature (°C) | −1.2 | — | — | −1.8 | — | — | −1.8 | — | — |
| Chemical | ||||||||||
| IO/Bulk-ice | Salinity | 30.0 | 4.1 | 23.5 | 30.0 | 7.4 | 25.9 | 29.9 | 7.6 | 25.7 |
| NO2 + NO3 (μmol L–1) | 7.94 ± 0.00 | 0.28 ± 0.02 | —d | 7.85 ± 0.54 | 7.76 ± 0.12 | — | 7.77 ± 0.22 | 1.83 ± 0.00 | — | |
| PO4 (μmol L–1) | 0.67 ± 0.00 | 0.18 ± 0.00 | — | 0.62 ± 0.05 | 0.45 ± 0.03 | — | 0.63 ± 0.02 | 0.41 ± 0.02 | — | |
| Si(OH)4 (μmol L–1) | 4.42 ± 0.00 | 0.79 ± 0.42 | — | 4.06 ± 0.00 | 0.50 ± 0.09 | — | 3.91 ± 0.16 | 1.30 ± 0.00 | — | |
| N:P | 11.9 | 1.6 | — | 12.7 | 17.2 | — | 12.3 | 4.5 | — | |
| N:Si | 1.8 | 0.4 | — | 1.9 | 15.5 | — | 2.0 | 1.4 | — | |
| DIC (μmol kg–1) | — | 230.6 ± 1.4 | 1743.3 ± 4.7 | — | 635.4 ± 5.8 | 1893.3 ± 2.2 | — | 675.0 ± 0.5 | 1898.2 ± 14.6 | |
| Brine | NO2 + NO3 (μmol L–1) | — | 3.72 ± 0.25 | — | — | 40.74 ± 0.61 | — | — | 10.50 ± 0.01 | — |
| PO4 (μmol L–1) | — | 2.40 ± 0.01 | — | — | 2.39 ± 0.14 | — | — | 2.37 ± 0.11 | — | |
| Si(OH)4 (μmol L–1) | — | 10.41 ± 5.48 | — | — | 2.63 ± 0.48 | — | — | 7.45 ± 0.01 | — | |
| N:P | — | 1.6 | — | — | 17.0 | — | — | 4.4 | — | |
| N:Si | — | 0.4 | — | — | 15.5 | — | — | 1.4 | — | |
| Biological | ||||||||||
| IO/Bulk-ice | POC (mg C m–2) | — | 45.6 | 52.3 | — | 215.8 | 247.7 | — | 64.8 | 74.4 |
| PON (mg N m–2) | — | 3.7 | 4.2 | — | 32.3 | 37.1 | — | 7.2 | 8.3 | |
| POC : PON | — | 14.4 | — | — | 7.8 | — | — | 10.5 | — | |
| Chl a (μg L–1) | 0.2 ± 0.0 | 3.6 ± 0.0 | 3.7 ± 0.0 | 0.1 ± 0.0 | 65.3 ± 4.7 | 84.8 ± 7.0 | 0.2 ± 0.0 | 10.9 ± 0.4 | 11.4 ± 0.9 | |
| Chl a (mg m–2) | — | 0.4 ± 0.0 | 0.4 ± 0.0 | — | 7.4 ± 0.5 | 10.0 ± 0.8 | — | 1.3 ± 0.1 | 1.3 ± 0.1 | |
Environmental characteristics of three sampling sites TF1, VM1 and VM2 (Definitions Sections 1, 2.1.1).
Ice-ocean interface (10 cm).
Bottom-ice (3 cm).
Pooled cores (3 cm) with added filtered seawater.
Em dashes indicate when data were not collected or measured.
Definitions of the parameters are given in Sections 2.1.2, 2.1.3. Measurements are presented as average values with their respective standard deviation (n = 8 at TF1, n = 4 at VM1, n = 5 at VM2 for snow depth, ice thickness and freeboard; n = 2 for nutrients, DIC and Chl a) except for the ice-ocean interface temperature and salinity, the bulk-ice salinity, and POC/N (n = 1).
Figure 3
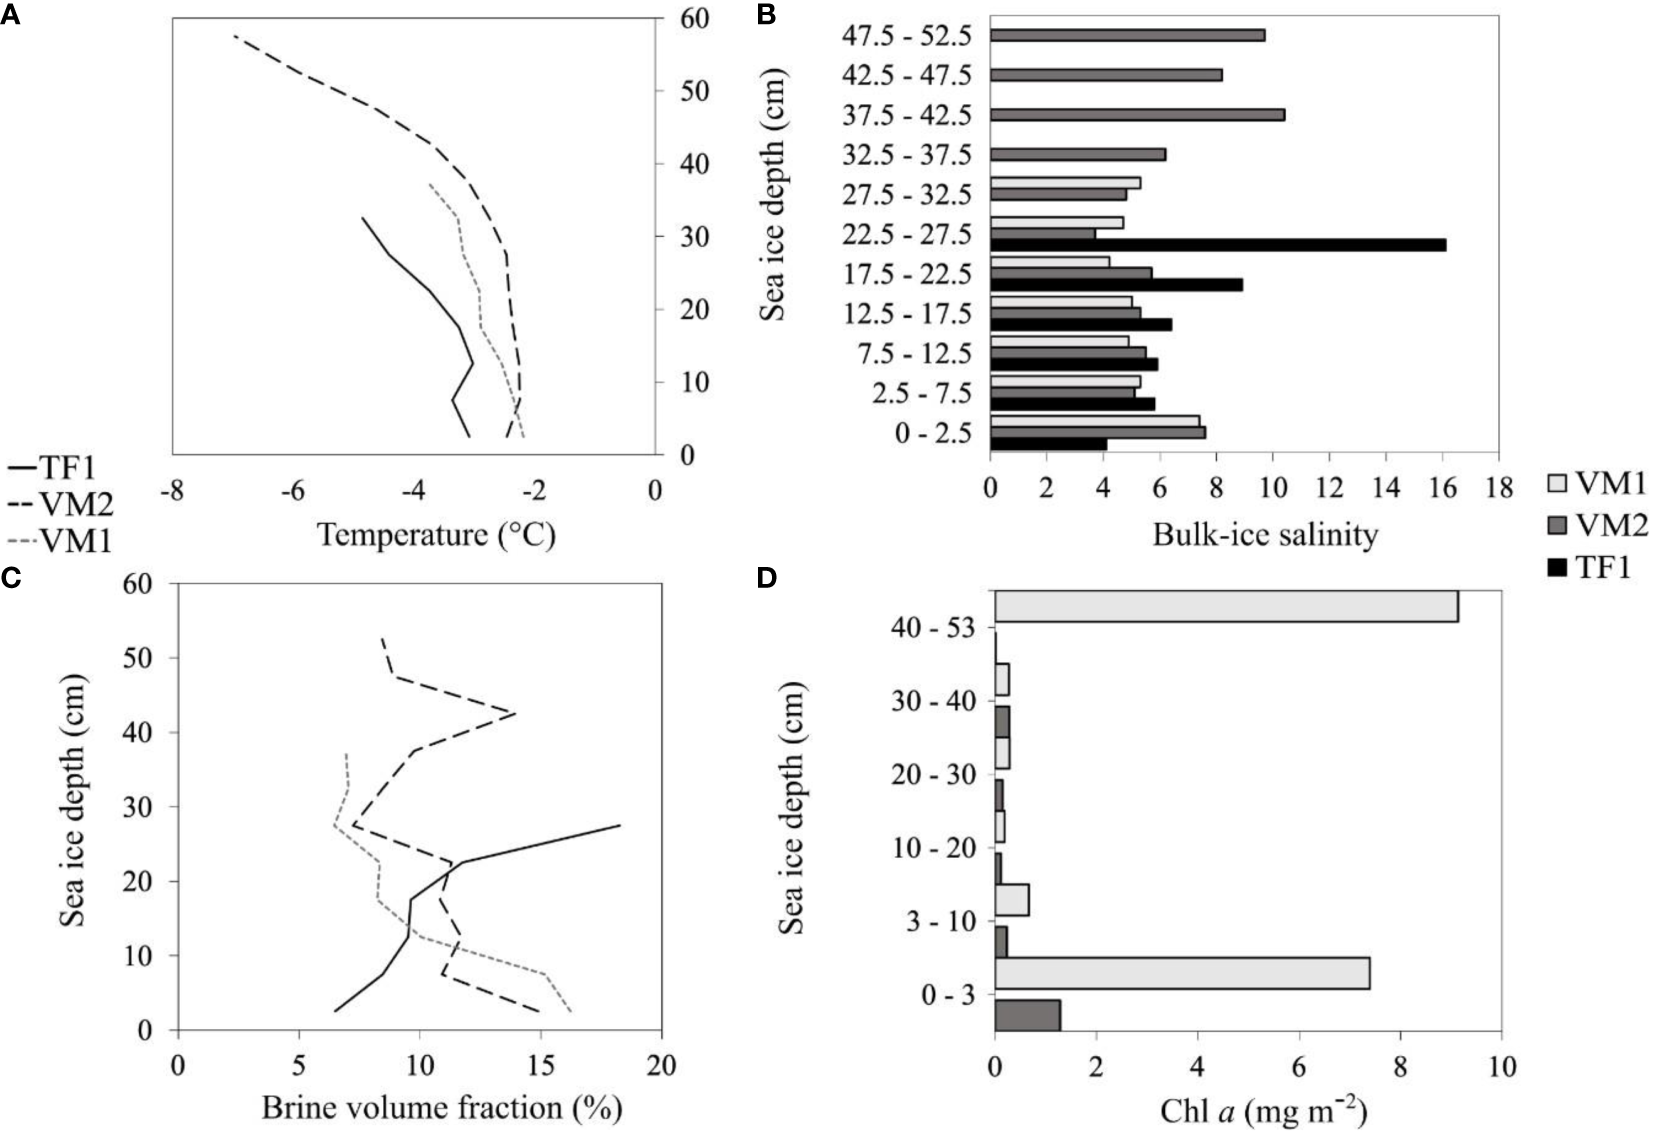
Sea ice profiles of temperature (A), bulk-ice salinity (B), brine volume fraction (C) and Chl a(D) from the bottom-ice upwards (zero is at bottom-ice) (Definition Sections 1 and 2.1.2). Black solid lines and black bars; light grey dashed lines and solid light grey bars; black dashed lines and dark grey bars correspond to the sea ice profiles at TF1, VM1 and VM2, respectively (Definitions Sections 1 and 2.1.1). Sea ice profiles of Chl a were obtained for VM1 and VM2 but not for TF1 (data not collected).
Nutrient concentrations (NO2 + NO3, PO4 and Si(OH)4) were similar at the ice-ocean interface of the two fjords, which were always greater than in the bulk-ice samples (Table 1). In contrast to the ice-ocean interface, notable differences in the nutrient concentrations were found in the bottom (bulk)-ice of the three sampling sites. Here, the bulk-ice NO2 + NO3 concentrations were approximately seven-fold and nearly twenty-eight-fold lower at TF1 (0.28 ± 0.02 μmol L–1) than at VM2 (1.83 ± 0.00 μmol L–1) and at VM1 (7.76 ± 0.12 μmol L–1), respectively (Table 1). Bulk-ice PO4 of the bottom-ice was also the lowest in TF1 (0.18 ± 0.00 μmol L–1), but similar at the VM sites (VM1: 0.45 ± 0.03 μmol L–1; VM2: 0.41 ± 0.02 μmol L–1) (Table 1). However, bulk-ice Si(OH)4 was the lowest at VM1 (0.50 ± 0.09 μmol L–1) followed by TF1 (0.79 ± 0.42 μmol L–1) and was the highest at VM2 (1.30 ± 0.00 μmol L–1) (Table 1). The bulk-ice molar ratios of dissolved inorganic N:P and N:Si were the lowest at TF1 (N:P: 1.6; N:Si: 0.4) followed by VM2 (N:P: 4.5; N:Si: 1.4) and VM1 (N:P: 17.2; N:Si: 15.5) (Table 1). Similar to the trend in the bulk-ice, NO2 + NO3 concentrations were largely lower in the brine at TF1 (3.72 ± 0.25 μmol L–1) than at VM2 (10.50 ± 0.01 μmol L–1) and at VM1 (40.74 ± 0.61 μmol L–1). In contrast to the bulk-ice, PO4 was similar in the brine of the three sampling sites (TF1: 2.40 ± 0.01 μmol L–1; VM1: 2.39 ± 0.14 μmol L–1; VM2: 2.37 ± 0.11 μmol L–1), and Si(OH)4 was higher at TF1 (10.41 ± 5.48 μmol L–1) than at VM2 (7.45 ± 0.01 μmol L–1) and at VM1 (2.63 ± 0.48 μmol L–1) (Table 1). Nevertheless, molar ratios were identical in the brine and in the bulk-ice (Table 1). The DIC concentrations were about three-fold lower in the bottom-ice of TF1 (230.6 ± 1.4 μmol kg–1) than at VM1 (635.4 ± 5.8 μmol kg–1) and VM2 (675.0 ± 0.5 μmol kg–1) (Table 1).
3.1.2 Biological characteristics of the sampling sites
Concentrations of POC/N were the lowest at TF1 in the bulk-ice (POC: 45.6 mg C m–2; PON: 3.7 mg N m–2) and they were the highest at VM1 in the bulk-ice (POC: 215.8 mg C m–2; PON: 32.3 mg N m–2) (Table 1). Bulk-ice POC : PON molar ratios were found the highest at TF1 (14.4), followed by VM2 (10.5) and VM1 (7.8). Overall, Chl a was higher in the bottom-ice (ranging from 3.6 ± 0.0 to 65.3 ± 4.7 μg L–1, also reported as 0.4 ± 0.0 to 7.4 ± 0.5 mg m–2) than in the ice-ocean interface (ranging from 0.1 ± 0.0 to 0.2 ± 0.0 μg L–1) (Table 1). The Chl a in the bottom-ice of TF1 was lower (0.4 ± 0.0 mg m–2) than at VM2 (1.3 ± 0.5 mg m–2) and at VM1 (7.4 ± 0.5 mg m–2). The Chl a at the snow-ice interface of VM1 was greater than at the bottom-ice at this location, which contrasts with the sea ice Chl a profile of VM2 (Figure 3). The community at TF1 was characterized by pennate diatoms being the most abundant group (66%) and also by flagellates (34%) (Figure 4). The bottom-ice algal communities in VM were clearly dominated by pennate diatoms [at VM1 (99%) and VM2 (96%)], especially Nitzschia spp. [mainly N. frigida (Grunow)] at VM2, but were characterized by a lower abundance of flagellates [at VM1 (1%) and VM2 (4%)], by contrast to TF1 (Figure 4).
Figure 4
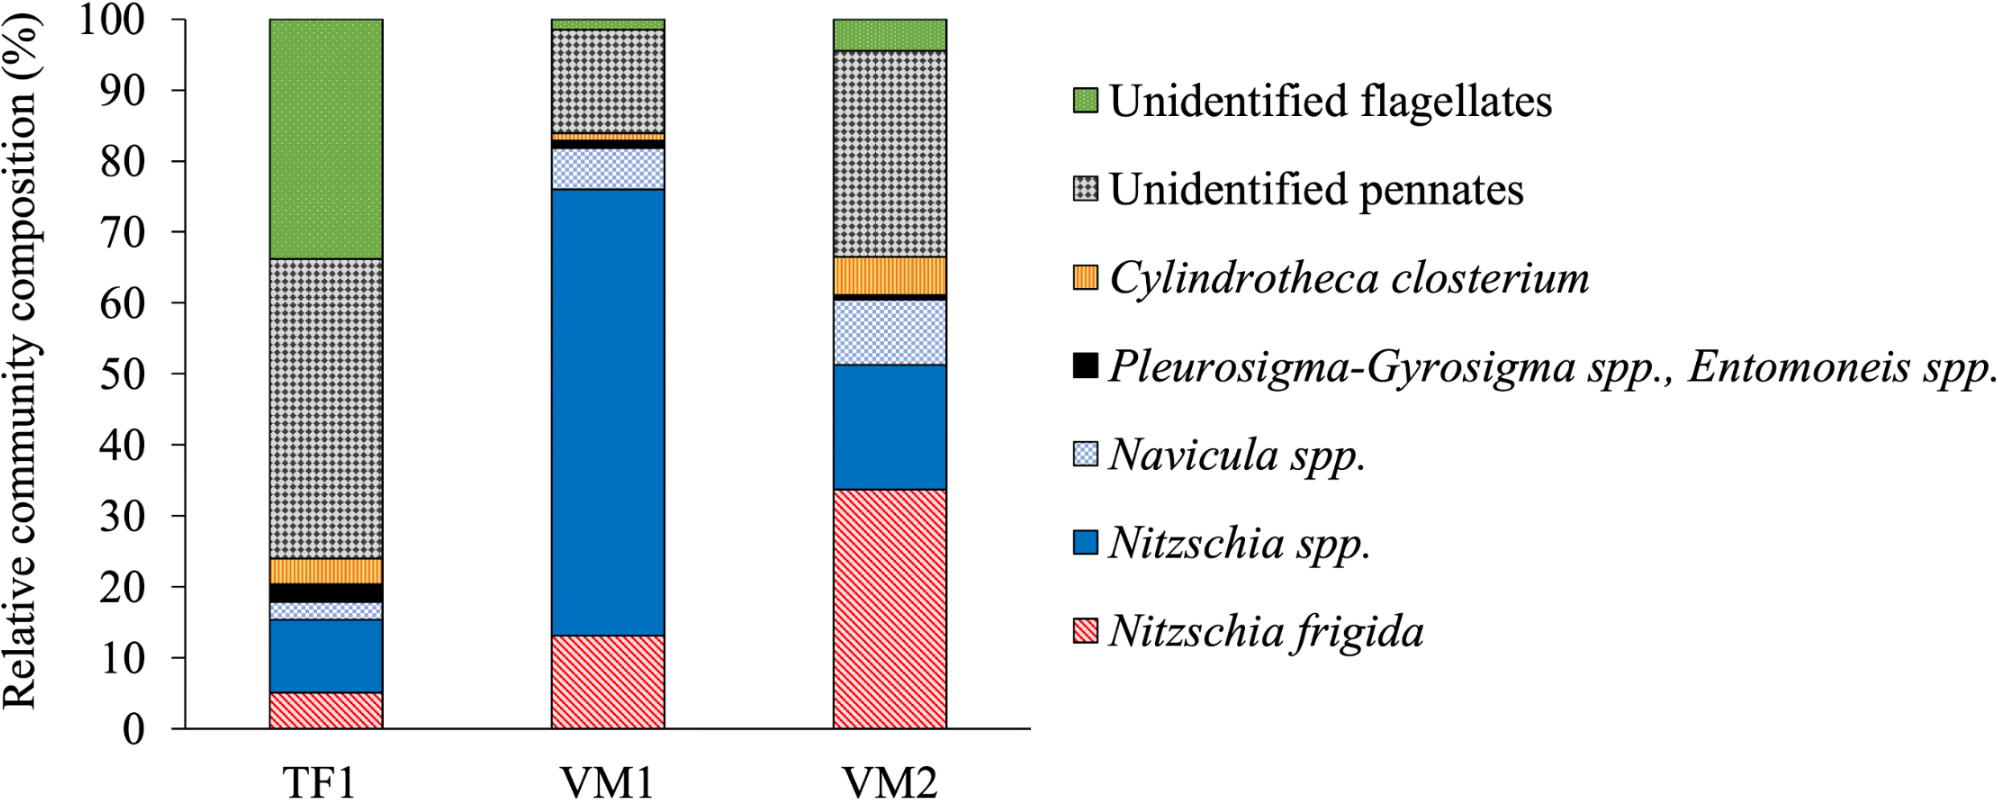
Relative algal community composition in the bottom-ice core sections (3 cm) of TF1, VM1 and VM2 (Definitions Sections 1, 2.1.1).
3.1.3 Photophysiology of natural fjord communities
The shape of the PI curves highlights variability in the photophysiological parameters (Figure 5), specifically the curve for the VM1 community (Figure 5B), which clearly shows the steepest initial slope representative of the highest photosynthetic efficiency (145.3 x 10⁻⁴ μg C μg Chl a–1 h–1 [μmol photons m–2 s–1]–1), and the steepest photoinhibition slope, which is indicative of the highest photoinhibition rate βB (5.9 x 10⁻⁴ μg C μg Chl a–1 h–1 [μmol photons m–2 s–1]–1). Overall, maximum photosynthetic rates , were comparable between communities from all sites. However, the TF1 community showed a lower (52.9 x 10⁻⁴ μg C μg Chl a–1 h–1 [μmol photons m–2 s–1]–1) and a greater photoacclimation index Ik (49.0 μmol photons m–2 s–1) (Figure 5A) than either of the VM sites (Figures 5B, C). Photoinhibition rates βB were documented in all samples, with the highest rate for the VM1 community, and similar rates for the TF1 and VM2 communities, respectively.
Figure 5
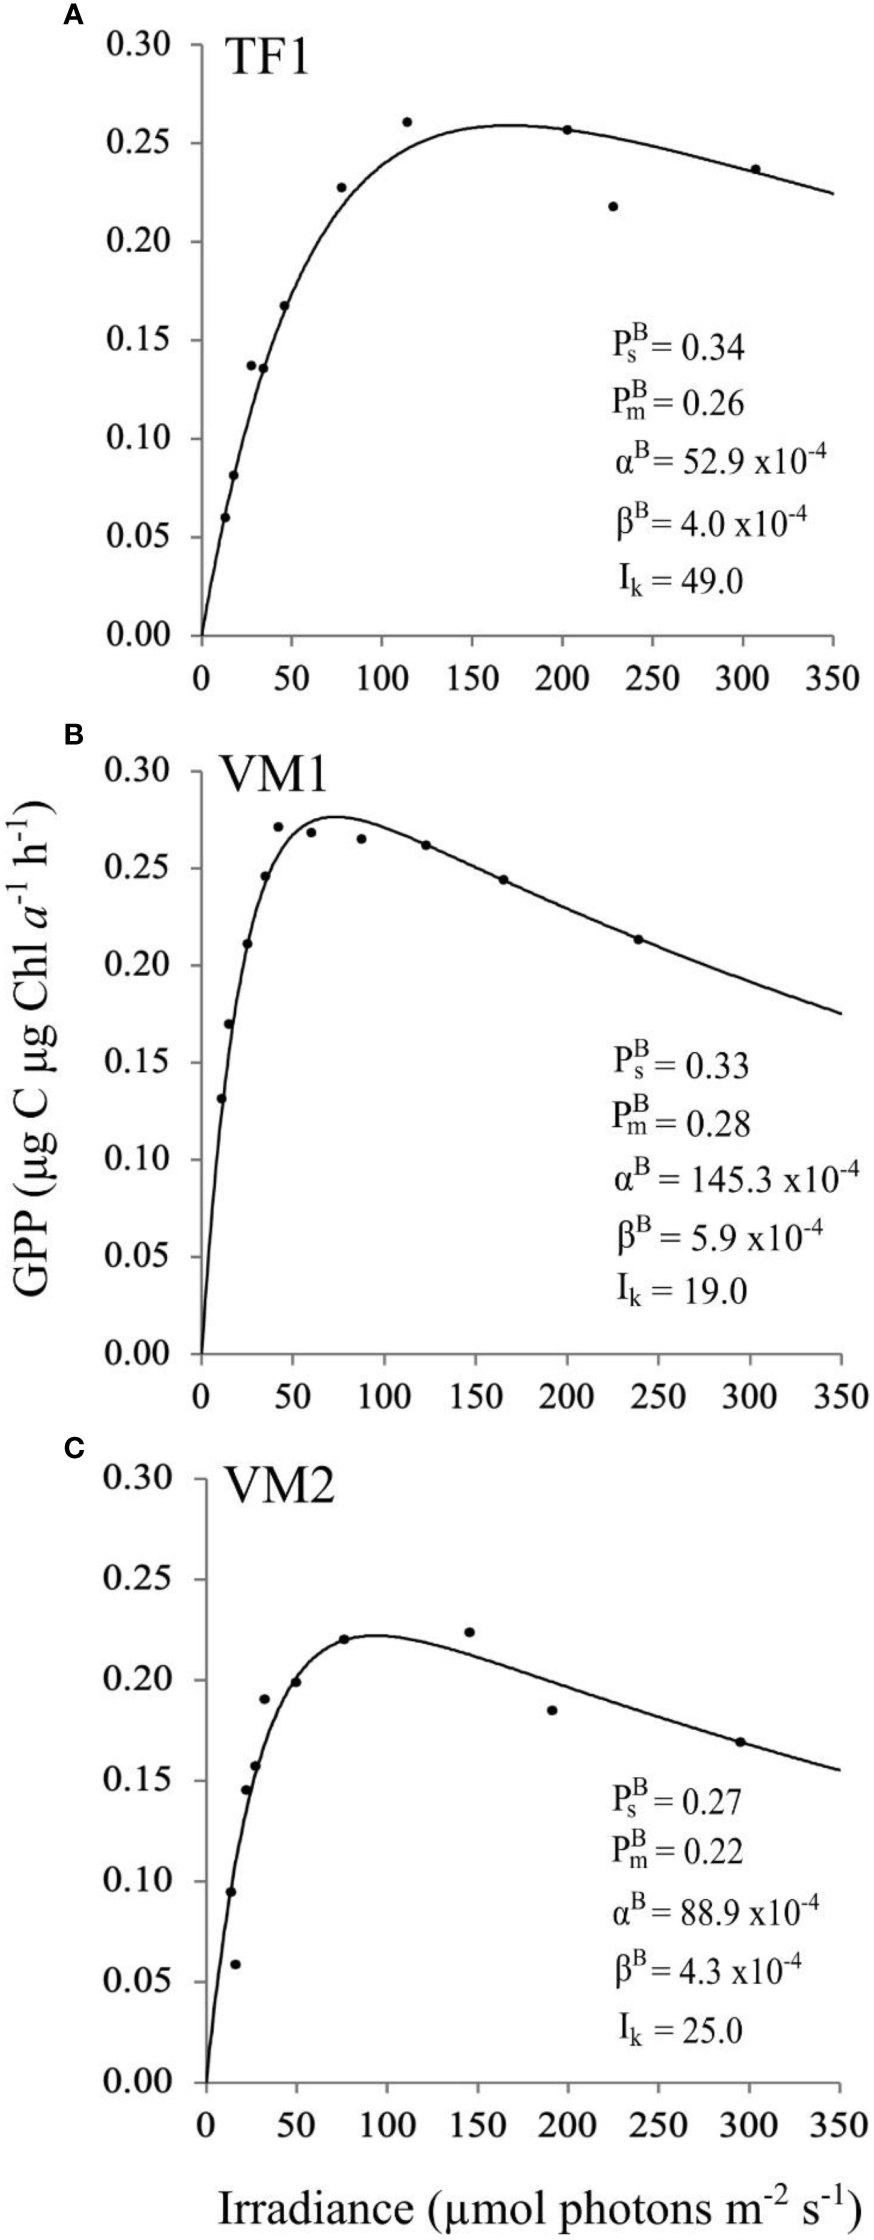
PI curves (Definition Section 2.1.4), fitted with the exponential model (Platt et al., 1980) and presented with the respective photophysiological parameters (Definitions Section 2.1.4), of the natural bottom-ice algal communities collected at TF1 (A), VM1 (B), VM2 (C) (Definitions Sections 1, 2.1.1). The definition of GPP is given in Section 2.1.3.
3.2 Culture-based experimentation
3.2.1 Temporal changes in chlorophyll a, cell abundance and community composition
Over the course of the entire experiment, Chl a ranged from an average of 16.6 – 319.4 μg L–1 in the control salinity treatment of 33 and from 23.6 – 69.5 μg L–1 in the lowered salinity experimental treatment of 10 (Figure 6). The concentration of Chl a was significantly lower at salinity 10 than at 33 after 168 h (Figure 6; Table 2). Moreover, a significant increase in Chl a was observed after 24 h at salinity 33 compared to the initial Chl a at the start of the experiment (Figure 6; Table 2). In contrast, no significant difference from initial Chl a was found at salinity 10 after 4 h or 24 h exposure (Figure 6; Table 2). However, significant increases in Chl a were observed in both salinity treatments after 168 h compared to the initial Chl a concentration (Figure 6; Table 2).
Figure 6
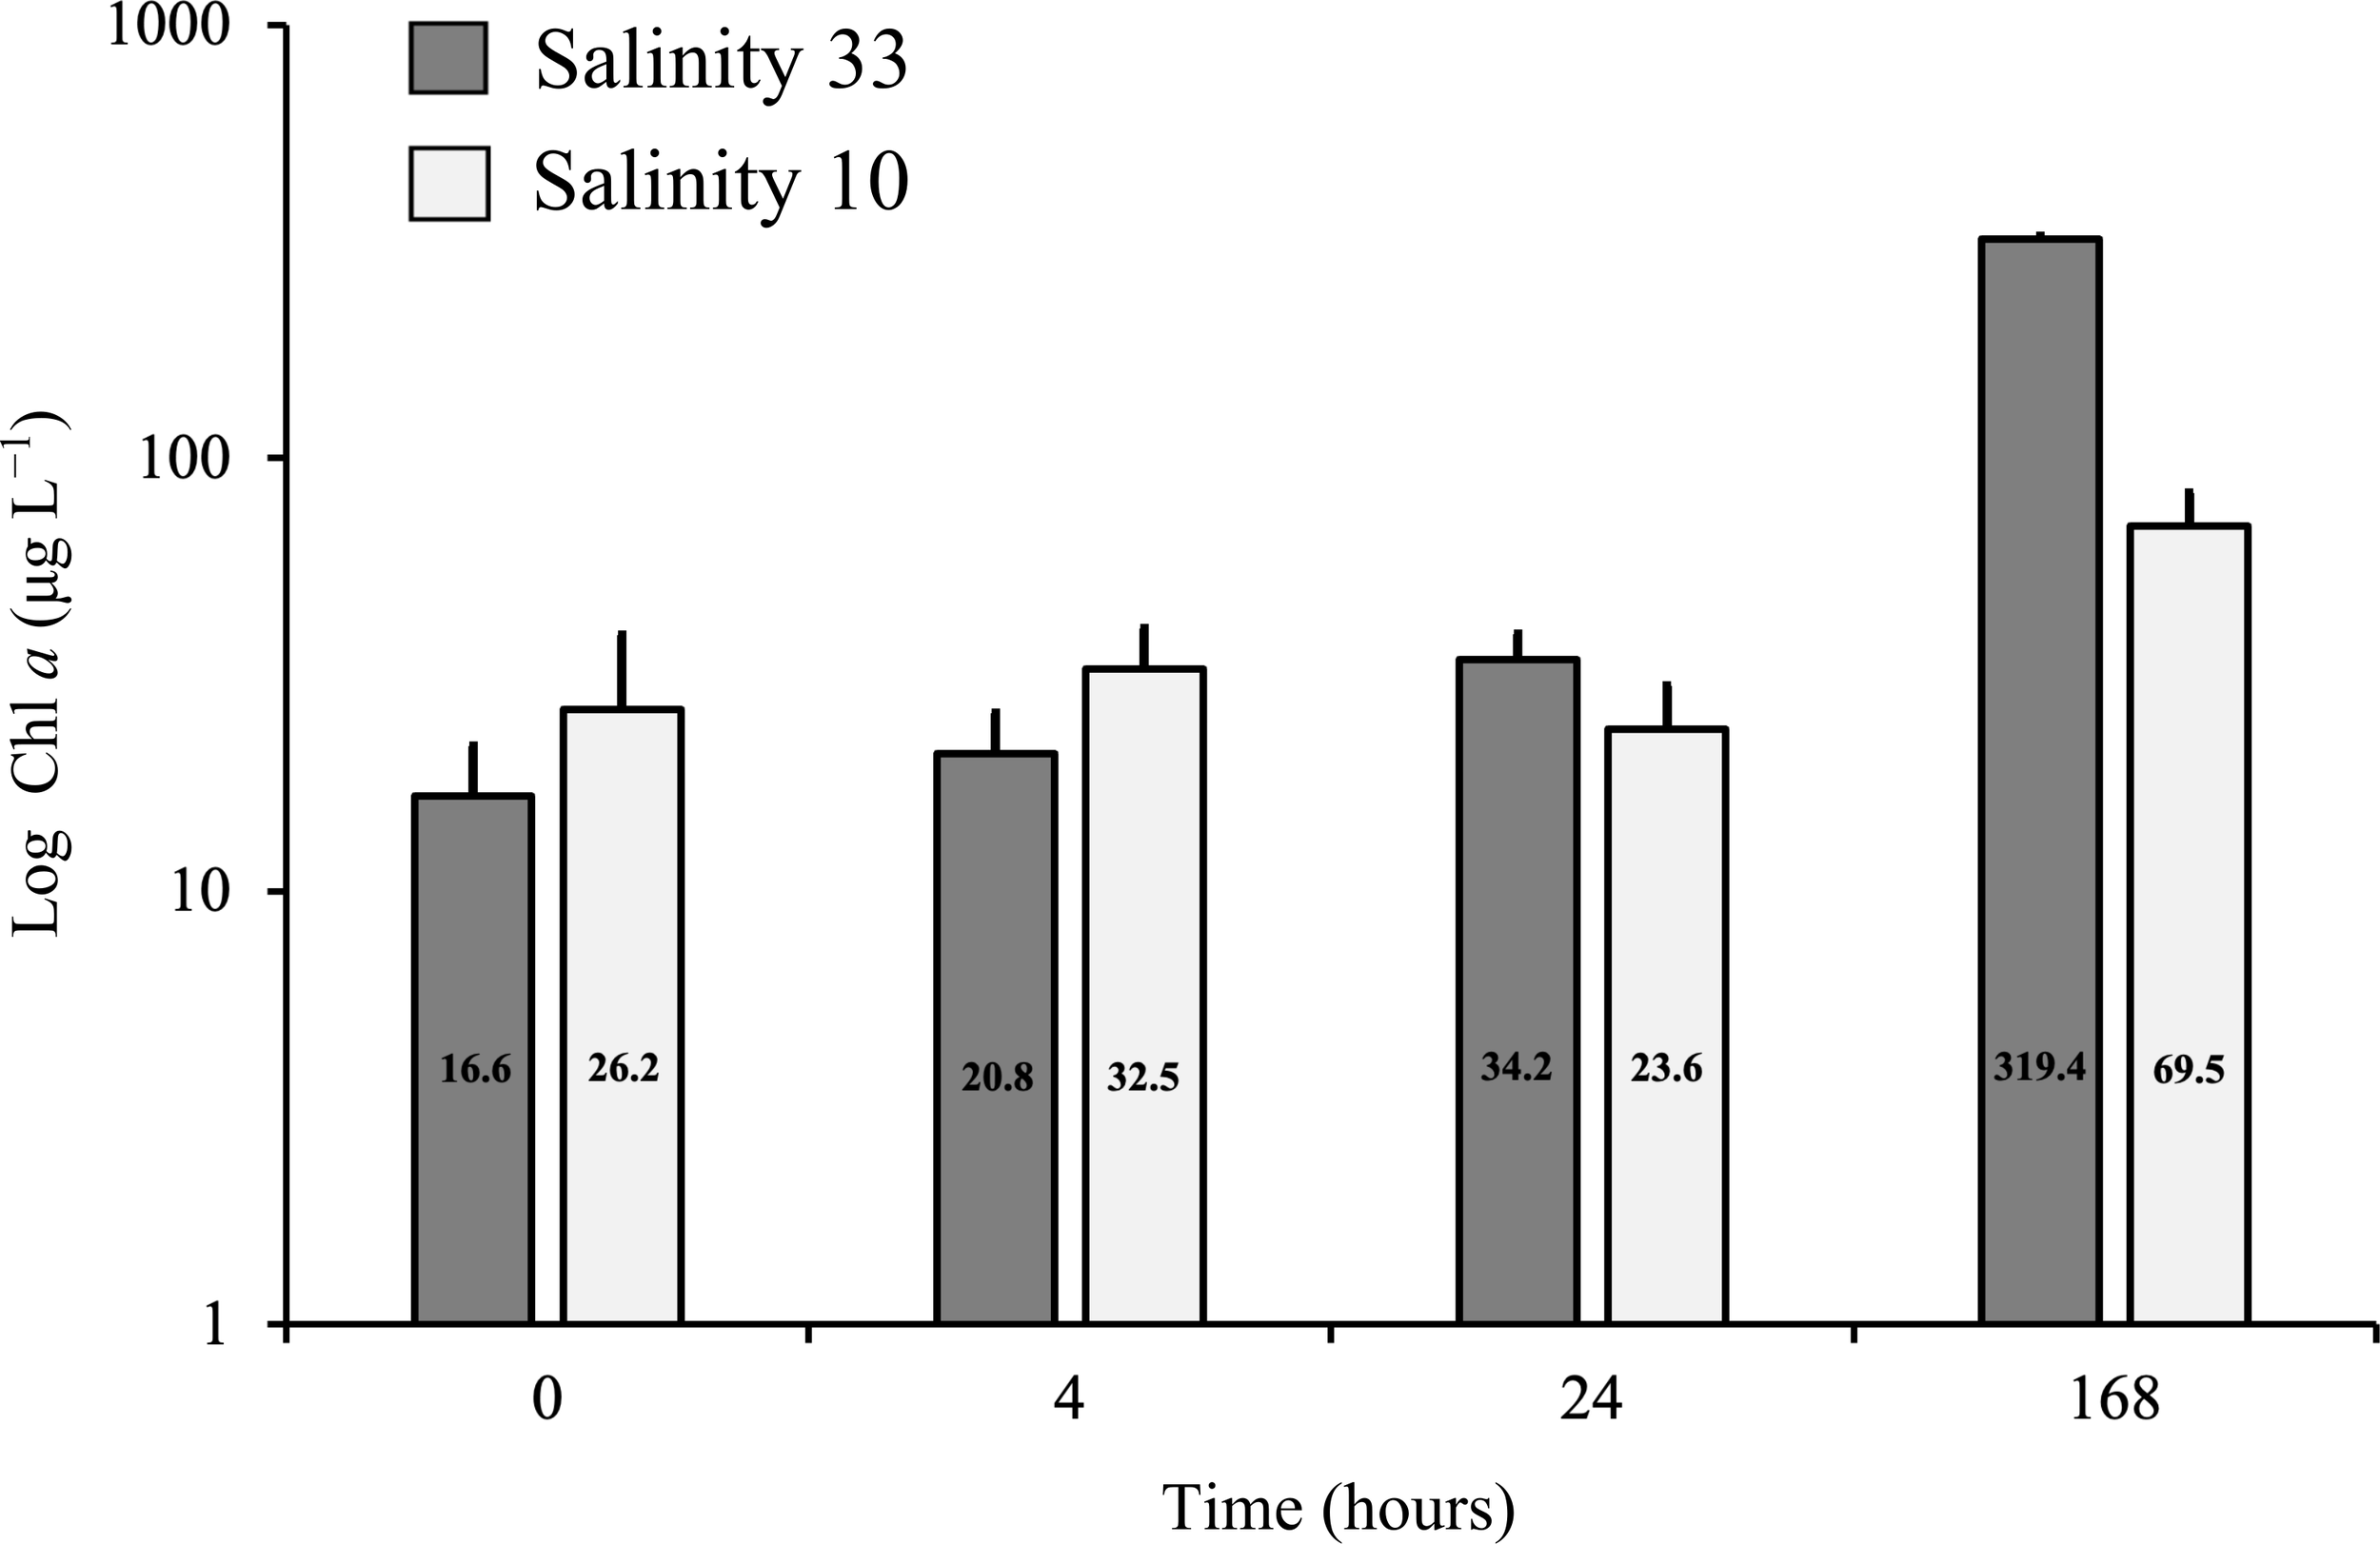
Average (n = 3) Chl a concentrations (Definition Sections 1, 2.1.3), with standard deviation of a VM2 cultured ice algal community (Definitions Sections 1, 2.1.1, 2.2.1), after growing for 4 h to 168 h in two salinity treatments, 33 (control; dark grey) and 10 (lowered salinity; light grey). Average (n = 4) Chl a is also presented at initial time (0 h), with standard deviation. Chl a is here given in log-scale.
Table 2
| PsB | αB | Ik | Chl a | Flagellates | Cell abundance |
||
|---|---|---|---|---|---|---|---|
| Welch t-test | 33 vs. 10 | 8.331a (8.997)c < 0.001 | 5.332 (8.692) < 0.001 | 3.591 (11.106) 0.004 | — | — | — |
| Independent t-test | 4 h33 vs. 4 h10 | —d | — | — | — | — | −5.007a (4) 0.007 |
| 24 h33 vs. 24 h10 | — | — | — | −1.379 (4) 0.240 |
— | 0.614 (4) 0.572 | |
| 168 h33 vs 168 h10 | — | — | — | 4.584 (4) 0.010 |
— | 5.380 (4) 0.006 | |
| One-way ANOVA (F), or Kruskal Wallis H test (H) | 4 h33 vs. 24 h33 vs. 168 h33 | (H) 5.067 (2) 0.079 |
(F) 0.693b (2,6) 0.536 | (H) 1.156 (2) 0.561 | (F) 46.909 (3,9)< 0.001 | (H) 1.424 (2) 0.491 | (F) 38.120 (2,6)< 0.001 |
| 4 h10 vs. 24 h10 vs. 168 h10 | (F) 17.612 (2,6) 0.003 |
(F) 8.490 (2,6) 0.018 | (F) 0.694 (2,6) 0.536 | (F) 11.998 (3,9) 0.002 | (F) 0.695 (2,6) 0.535 | (F) 11.992 (2,6)0.008 | |
| ANOVA - Fisher´s Post hoc test of significance | 0 h33 vs. 4 h33 | — | — | — | 0.333 | — | — |
| 0 h33 vs. 24 h33 | — | — | — | 0.023 | — | — | |
| 0 h33 vs. 168 h33 | — | — | — | < 0.001 | — | — | |
| 4 h33 vs. 24 h33 | — | — | — | 0.142 | — | 0.781 | |
| 168 h33 vs 4 h33 | — | — | — | < 0.001 | — | < 0.001 | |
| 168 h33 vs 24 h33 | — | — | — | < 0.001 | — | < 0.001 | |
| 0 h10 vs. 4 h10 | — | — | — | 0.464 | — | — | |
| 0 h10 vs. 24 h10 | — | — | — | 0.764 | — | — | |
| 0 h10 vs. 168 h10 | — | — | — | < 0.001 | — | — | |
| 4 h10 vs. 24 h10 | 0.580 | 0.935 | — | 0.341 | — | 0.340 | |
| 168 h10 vs. 4 h10 | 0.002 | 0.011 | — | 0.002 | — | 0.011 | |
| 168 h10 vs. 24 h10 | 0.003 | 0.012 | — | < 0.001 | — | 0.003 |
Statistical analyses comparing the photophysiological parameters , , and Ik (Definitions Section 2.1.4), Chl a (Definition Sections 1, 2.1.3), the relative abundance of flagellates to the community composition and the cell abundance of cultured algae (Definitions Section 2.2.2), either between the two salinity treatments without considering time points (33 vs. 10), or between the two salinity treatments at the same time point (e.g., 4 h33 vs. 4 h10), or between time points in a given salinity treatment (e.g., 4 h33 vs. 24 h33 vs. 168 h33).
aThe t-value is reported for the Welch t-test (unequal variance t-test) and for the independent t-test (equal variance t-test).
bThe F statistic and H statistic values are reported for the one-way ANOVA test and the Kruskal Wallis H test, respectively.
cp values and Degrees of freedom (df) are reported for all tests. Fisher´s post-hoc test p-value is also reported. Significant values (p < 0.05) are in bold.
dEm dashes indicate that the test was not run for the given treatment.
The species composition of the ice algal culture (Figure 7) differed from the community composition in the original sample (Figure 4). Overall, the cultured community was dominated in terms of cell abundance (>70%) by pennate diatoms mainly including Synedropsis hyperborea (Grunow) as well as other unidentified pennate diatoms. Unidentified flagellates were also present in the culture (<30%) in much greater relative abundance than in the natural community (4%). Some of these flagellates resembled chlorophytes of the genera Chlamydomonas and Pyramimonas. No centric diatoms were observed in our cultured samples. Furthermore, there were no noticeable changes in the relative community composition between the two salinity treatments (Figure 7), and the relative abundance of flagellates between the three time points within a given experimental treatment did not appear to vary (Table 2). However, significant differences in the cell abundance between the salinity 33 and 10 treatments were evident after 4 h and 168 h of exposure (Table 2), with notable lower abundance after 4 h at salinity 33 (Figure 7A) and after 168 h at salinity 10 (Figure 7B). In both 33 and 10 salinity treatments, cell abundances were significantly greater after 168 h in comparison to 4 h and 24 h treatments (Figure 7; Table 2). Dead pennate diatoms (i.e., empty frustules) were found in greater relative abundance in the lowered salinity treatment of 10 (from 8 ± 5 to 10 ± 5%) than in the control salinity treatment of 33 (from 1 ± 1 to 3 ± 1%) for each time point (Supplementary Table 1).
Figure 7
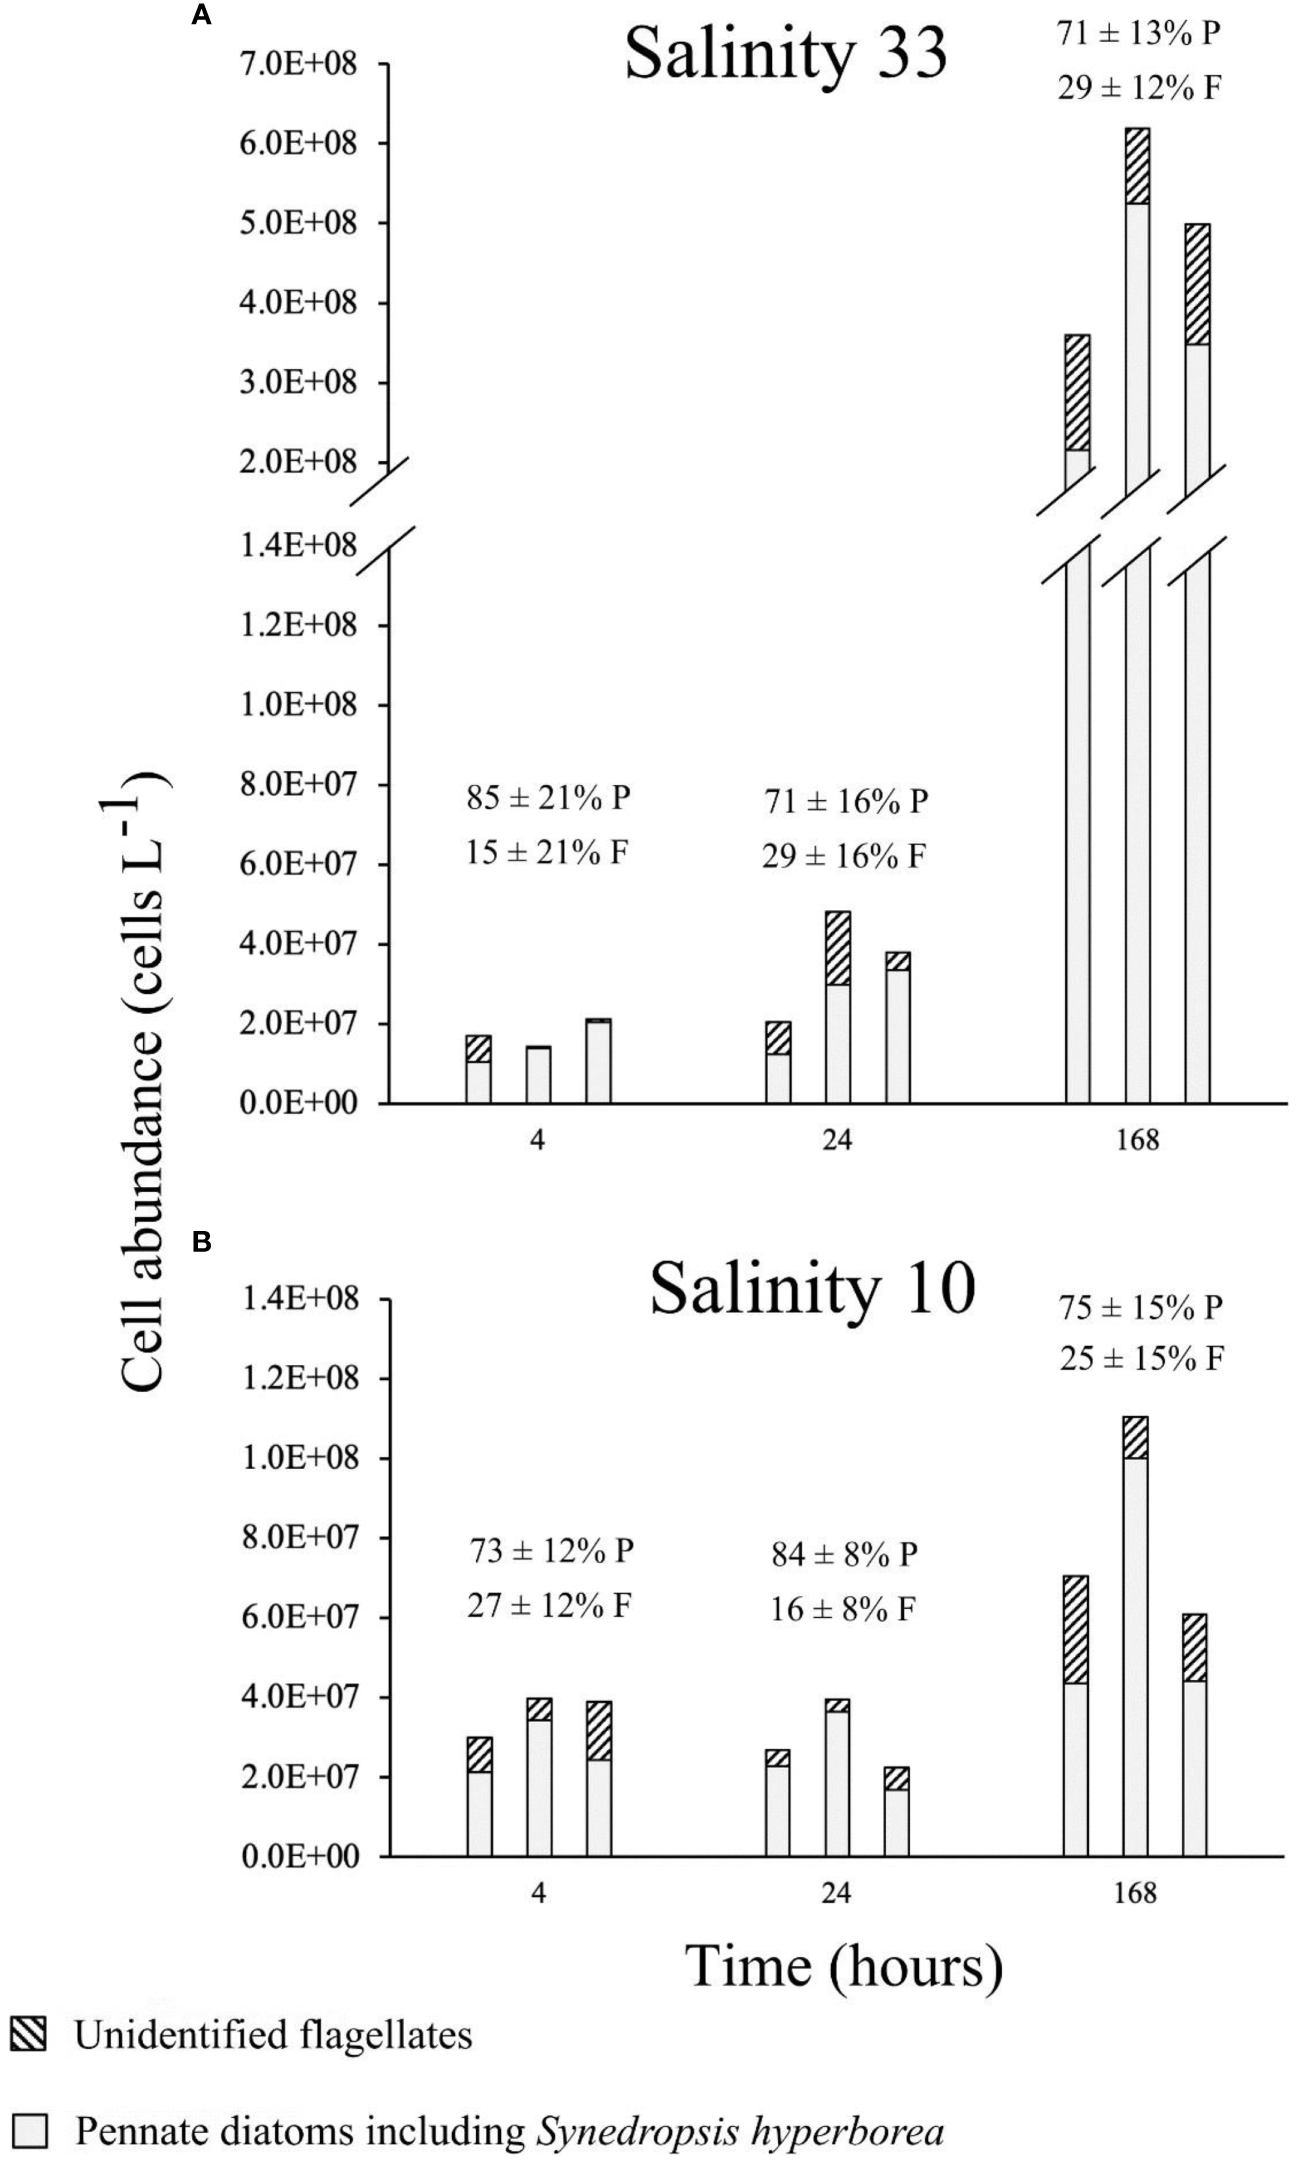
Algal abundances (triplicates) of the VM2 cultured ice algal community (Definitions Sections 1, 2.1.1, 2.2.1), after growing for 4 h, 24 h and 168 h in two salinity treatments, 33 [control; *(A)] and 10 [lowered salinity; (B)]. Relative community composition is also shown with the average (n = 3) relative abundance of pennate diatoms (P) and flagellates (F) with standard deviation.
3.2.2 Photophysiology of cultured ice algae
The PI curves and photophysiological parameters (i.e., , and Ik), were significantly lower at salinity 10 versus 33, at all time points (Figures 8, 9; Table 2). The photophysiological parameters in the lowered salinity treatment of 10 did not appear to change between 4 h and 24 h but did increase after 168 h (Figures 8, 9). This increase was significant for and between 4 h and 168 h, and also between 24 h and 168 h (Table 2). These parameters were largely constant over time in the control salinity treatment of 33, with a visual but insignificant decrease in after 168 h (Figures 8, 9; Table 2).
Figure 8
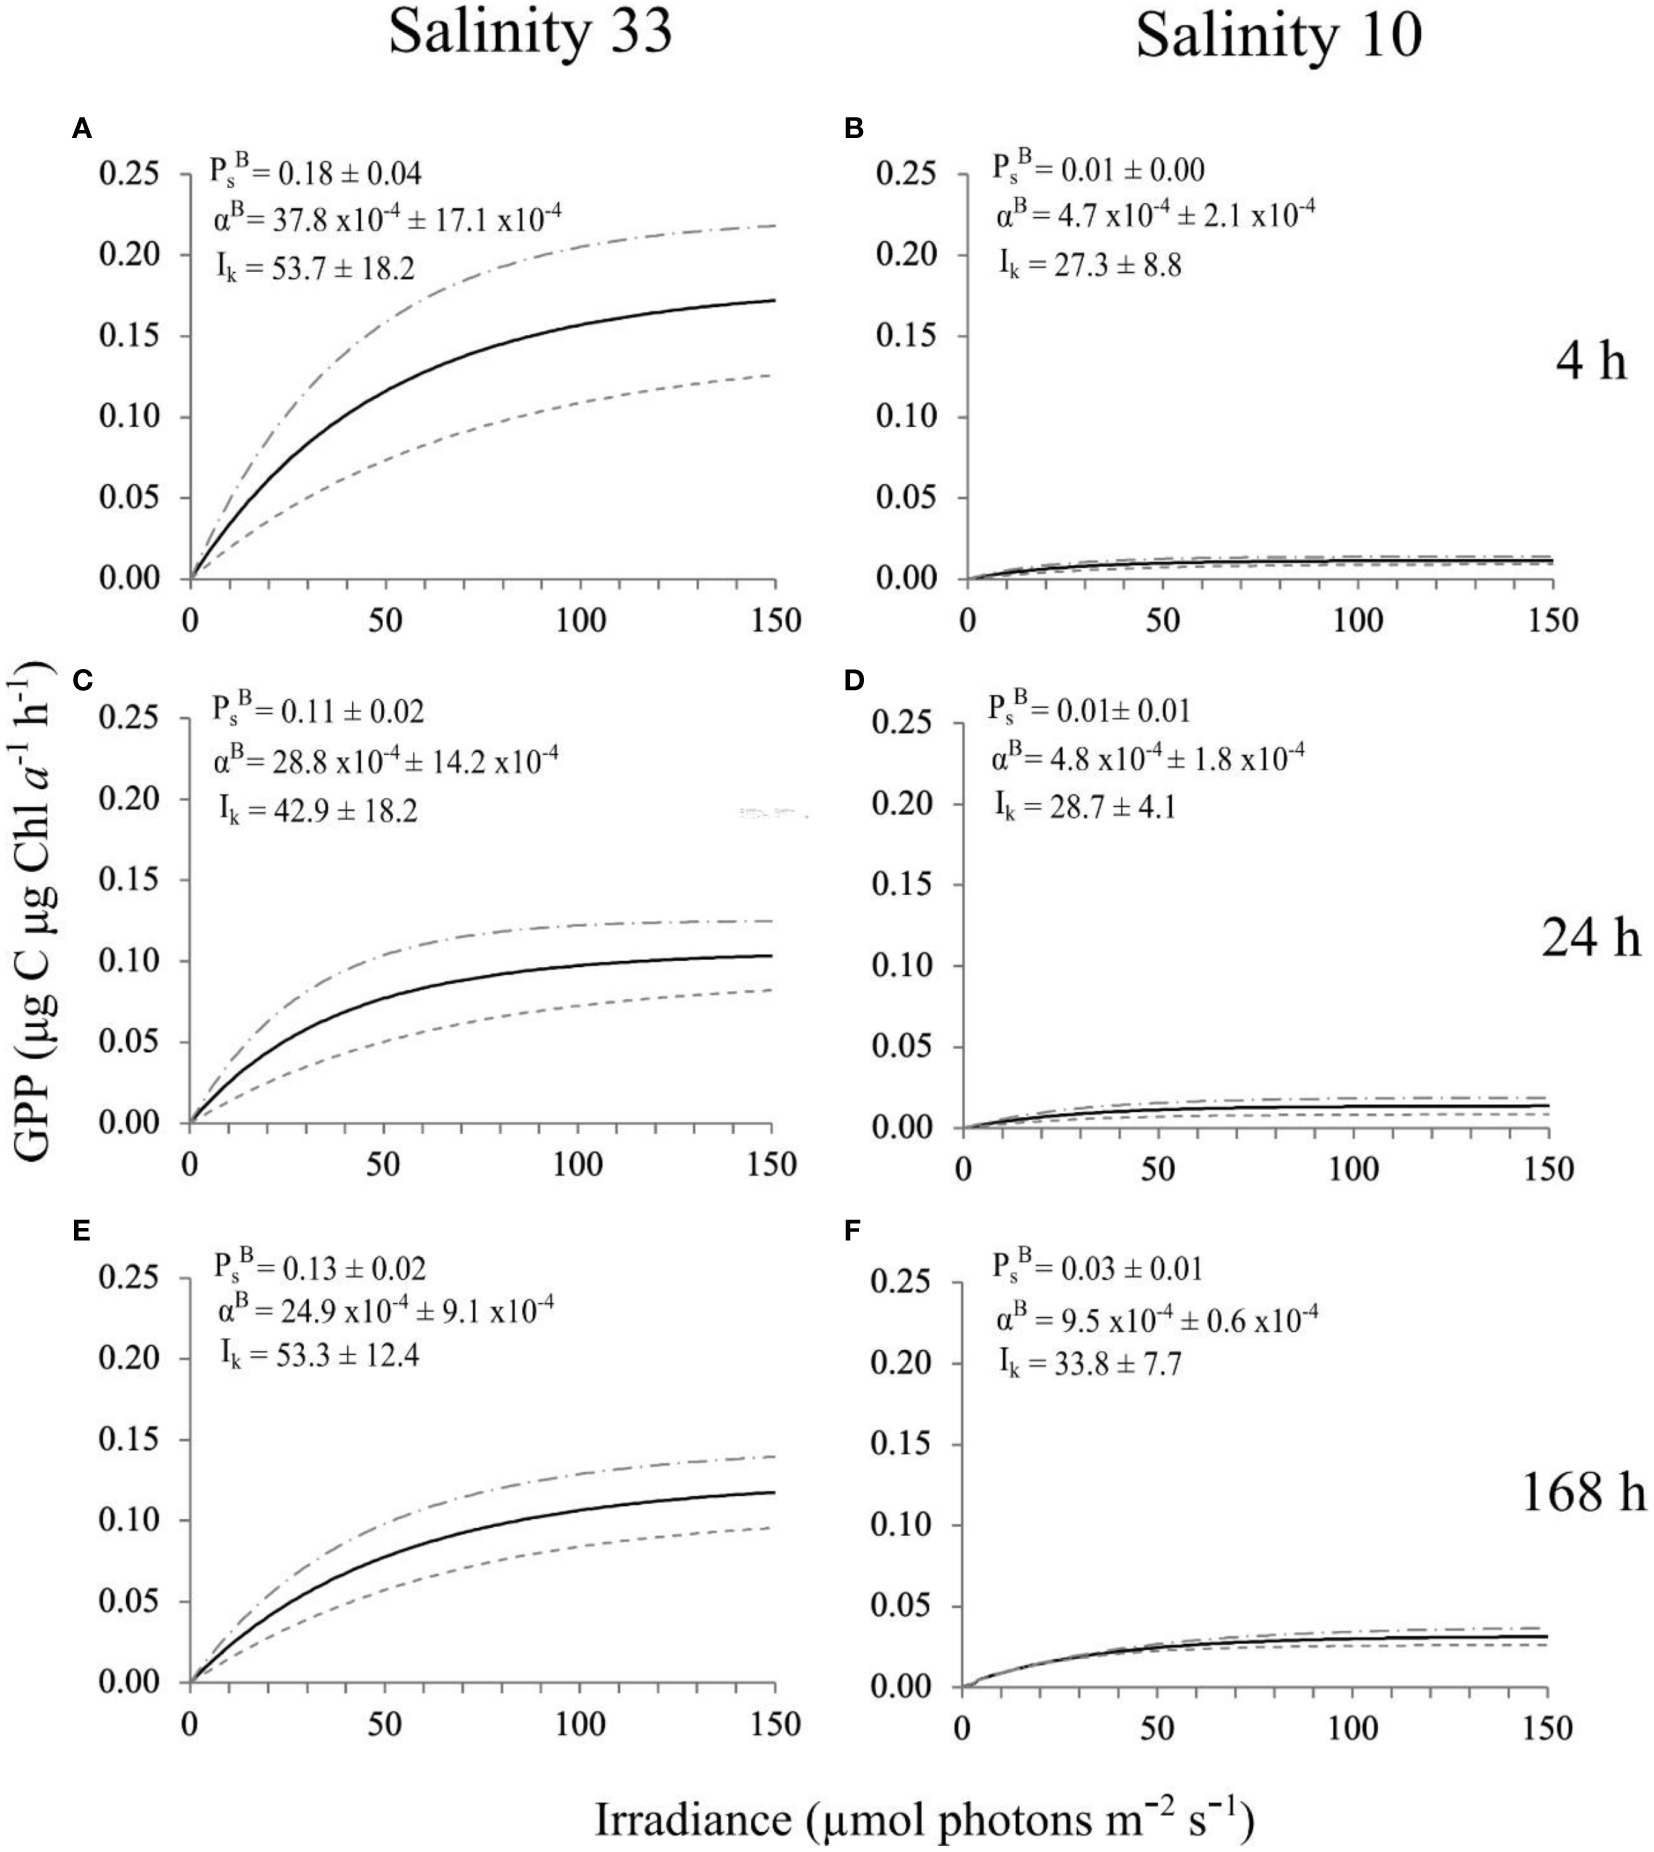
PI curves (Definition Section 2.1.4), fitted with the exponential model (Platt et al., 1980), and respective photophysiological parameters (Definitions Section 2.1.4), of a VM2 cultured ice algal community (Definitions Sections 1, 2.1.1, 2.2.1), after growing for 4 h, 24 h and 168 h in two salinity treatments, 33 [control; (A, C, E)], and 10 [lowered salinity; (B, D, F)]. The black solid line corresponds to the average (n = 3) photophysiological responses of the cultures and grey dashed lines represent the ± standard deviation. The definition of GPP is given in Sections 2.1.3, 2.1.4.
Figure 9
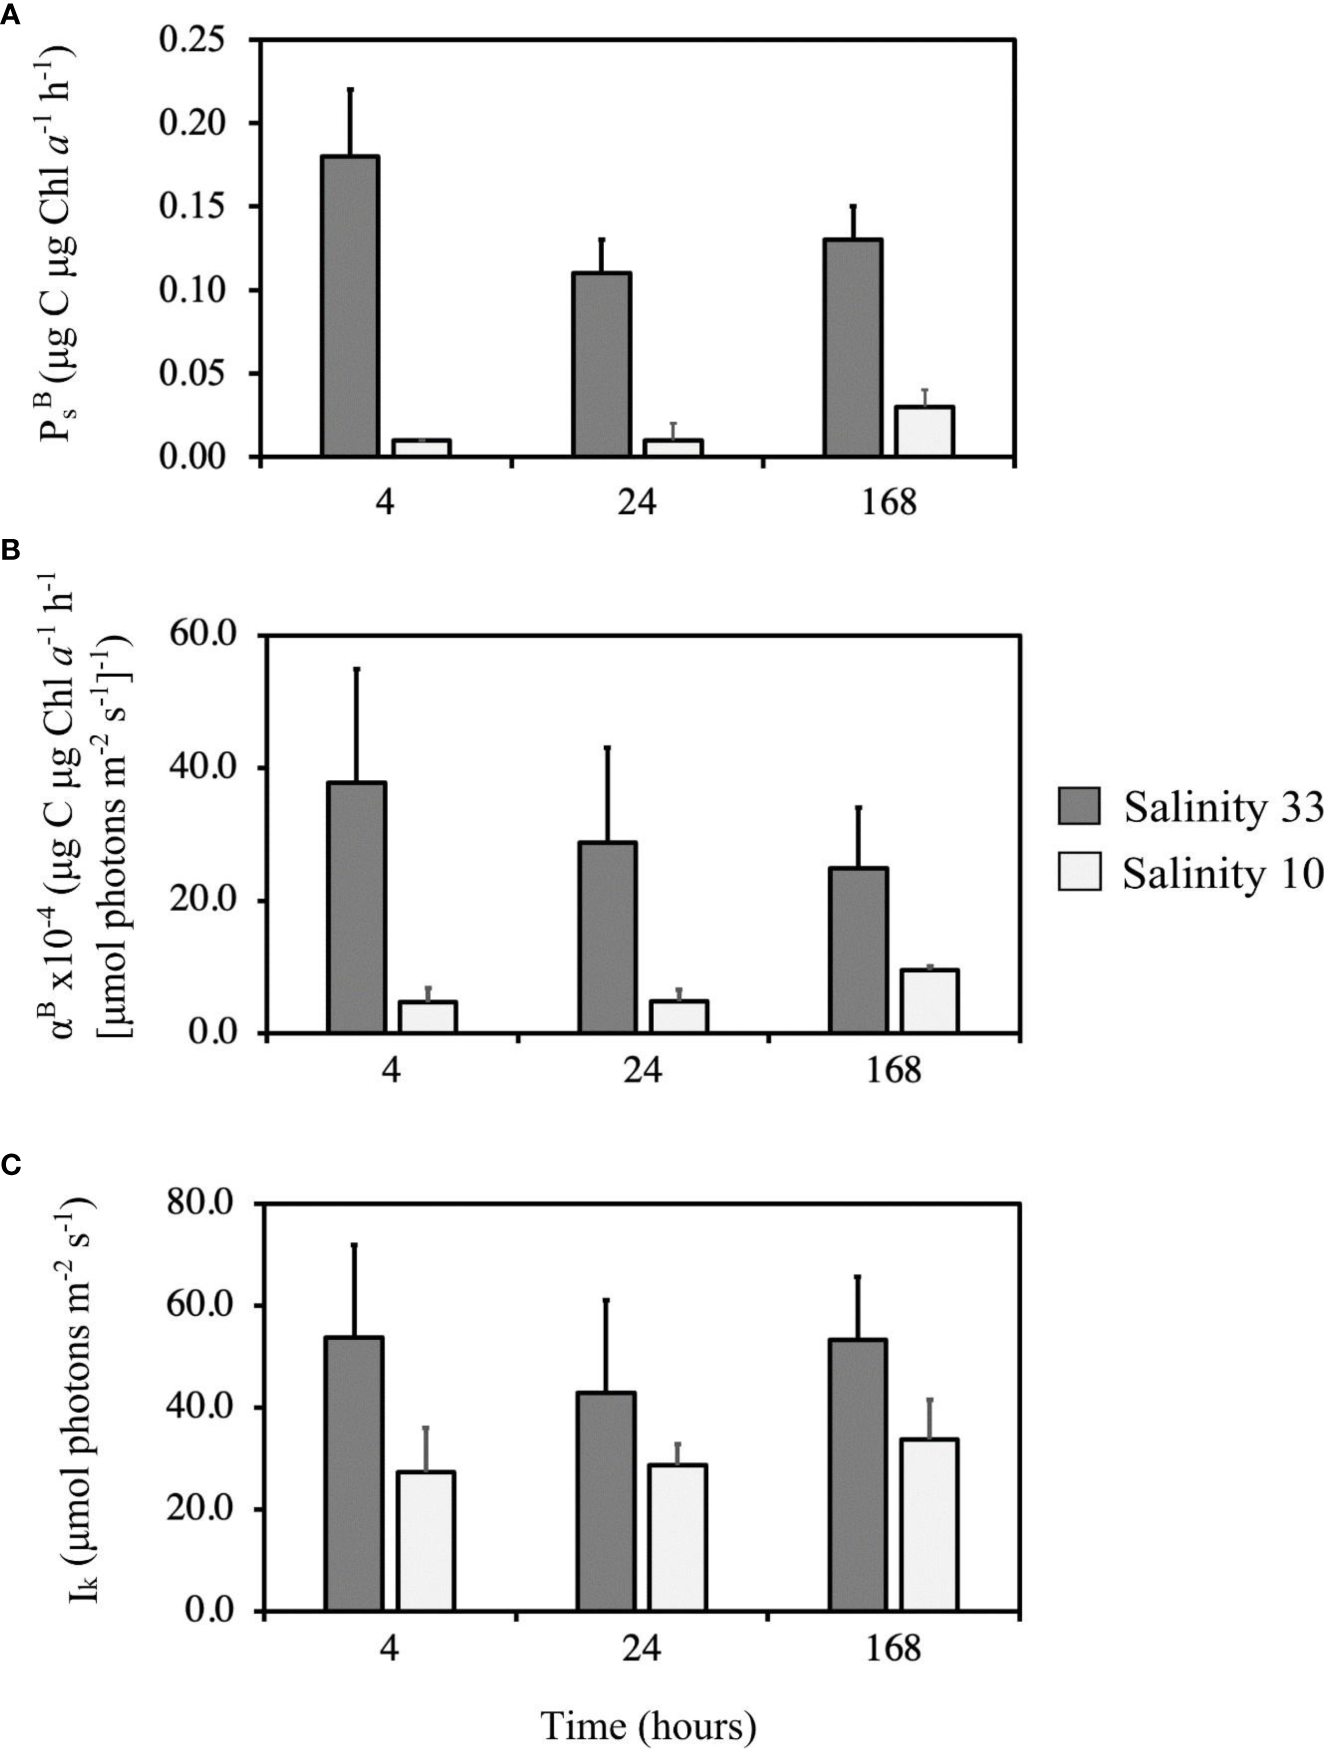
Average (n = 3) photophysiological parameters [(A), (B), and Ik(C), (Definitions Section 2.1.4)], with respective standard deviation of a VM2 cultured ice algal community (Definitions Sections 1, 2.1.1, 2.2.1), after growing for 4 h, 24 h and 168 h in two salinity treatments, 33 (control; darker grey) and 10 (lowered salinity; light grey).
4 Discussion
4.1 Variability in sea ice algal abundances between Tempelfjorden and Van Mijenfjorden sampling sites
4.1.1 Distribution of ice algal chlorophyll a
A typical Chl a distribution for Arctic FYI (Thomas, 2017), with maximum concentrations near-to the ice-ocean interface, was clearly seen at VM2 (Figure 3). However, VM1 showed a more atypical Chl a profile, with greatest values at the snow-ice interface. Together with the negative freeboard at VM1 (Table 1), this indicates the presence of surface flooding and of an infiltration community. Surface flooding has not been considered a common feature of the Arctic, but it is increasingly observed with ongoing climate change, particularly in the vicinity of the Barents Sea, where the sea ice has become thinner and is thus more easily pushed below sea level by its snow cover (McMinn and Hegseth, 2004; Provost et al., 2017; Fernández-Méndez et al., 2018).
Snow depth has a large influence on light availability for bottom-ice algae due to its high albedo and attenuation of incoming solar radiation (Grenfell and Maykut, 1977; Nicolaus et al., 2010; Järvinen and Leppäranta, 2011), with higher Chl a typically found under thin versus thicker snow covers in early to mid-spring (Campbell et al., 2015; Leu et al., 2015; Lange et al., 2017), and typically during the early phase of bloom development. However, our study shows the opposite trend, with lowest Chl a in the bottom-ice of TF1 and VM2, which had thinner snow depths and higher under-ice irradiances than VM1, which had the highest Chl a under thickest snow depth and lowest under-ice irradiances (Table 1). This observation may be a result of variable weather conditions between the sites, as milder atmospheric temperatures were reported in TF just three days prior sampling (9 April 2021, −1.3°C on average) (Seklima, 2021a), than in VM (11 April 2021, −7.5°C on average; 14 April 2021, −15°C on average) (Seklima, 2021b). Here, this difference in temperature likely enhanced the melting of fast-ice at TF1. Besides, we surmise that the algal community was more developed at VM1 due to an earlier time of ice formation (MET, 2021), as evidenced by the thicker ice cover in combination with a thicker snow cover at this site (Table 1). This would have reduced sloughing of algae from the ice at VM1 compared to the two other sites.
4.1.2 Fjord freshwater and nutrient regimes
The impact of glacial freshwater runoff on reducing bulk-ice salinity in TF has been documented previously, where bottom-ice bulk salinities of 2.5 – 4 and mid-top bulk-ice salinities of 4.5 – 10 were reported (Alkire et al., 2015; Fransson et al., 2020). The bulk-ice salinity profile from our study at TF1 aligns with these reported values (Figure 3), and supports a similar influence of freshwater. Interannual variability in the amount of glacial-derived freshwater has been shown for TF with data from stable oxygen isotopic ratios (δO18) of sea ice cores (Fransson et al., 2020) demonstrating the possibility of five-fold difference in the volume of glacial meltwater inputs between consecutive April months. The data for our TF site are comparable to April 2012 in Fransson et al. (2020), where the bulk-ice salinity of the bottom-ice was approximately 4, due to documented freshwater inputs from the tidewater glacier Tunabreen. Here, the sea ice that measured 23 cm in thickness was shown to be 54% sourced from glacial meltwater, on average. We could not detect the presence of low salinity melt water below the sea ice in our surface water salinity data nor do we have oxygen isotope data as an alternative indicator (Table 1). However, our snapshot sea ice data are similar in terms of ice thickness and bulk-ice salinity to the Fransson et al. (2020) study suggesting that the TF site could have been influenced by glacial meltwater input. Furthermore, we noted the absence of a pronounced skeletal layer at TF1 (Figure 1; Supplementary Figure 2). This may result from the above-freezing temperature of the ice-ocean interface at TF1 (Table 1), which could have promoted sea ice melt at the time of sampling and thus potentially led to hypoosmotic stress of ice algal cells. It is also possible that our interface sampling approach via a peristaltic pump missed the freshwater layer immediately beneath the ice, as this can occur in very thin layers directly at the ice water interface. We suggest that freshwater inputs from glacial run-off occurred mainly at the time of ice formation prior to our sampling events as evidenced by the lower bulk-ice salinity. Also, the presence or absence of low salinity surface water at the time of sampling does not necessarily reflect the conditions during ice growths, that determine the bulk-ice salinity. We exclude for example the age of sea ice as a major factor explaining the differences in bulk-ice salinities as suggested for example for multi-year ice versus first-year ice (e.g., Lange et al., 2015) or drainage with increasing ice age (Cox and Weeks, 1988), given the similar age of the ice present. We therefore used the low bulk salinity as strongest indicator for low surface water salinity impact during ice formation as known from other Arctic sites (e.g., Vonnahme et al., 2021) or brackish surface water sea ice systems like the Baltic Sea (e.g., Geilfus et al., 2021). Furthermore, it is plausible that a freshwater layer in TF1 was not detected in our study, due to wave propagated mixing, which has previously been measured in TF (Rabault et al., 2016; Sutherland and Rabault, 2016). The latter insight is supported by wind gust data for TF of 16.4 m s–1 on 11 April, 2021 (the day prior to fieldwork), and up to 20.6 m s–1 on 07 April, 2021 (five days prior to fieldwork), thus indicating gale or even strong gale prior to sampling (Seklima, 2021c). Wave propagation could also potentially have disrupted the formation of a clearly defined skeletal layer at TF1. In contrast to observations at TF1, the bulk-ice salinity in VM formed typical C-shaped profiles for young growing Arctic FYI (Thomas, 2017), with higher salinities at the bottom and the surface than in the middle of the profile (Figure 3). From this typical profile, we infer no direct indication of freshwater impacts at the VM sites. Sea ice was also saltier at the bottom-ice of VM sites than at TF1, since the average bulk-ice salinity of 7.5 was relatively high compared to 4.1. Thus, we conclude that sea ice algae at TF1 were likely exposed to freshwater inputs than at the VM sites.
The comparatively low Chl a in TF versus VM may be at least in-part explained by the differences in sea ice physical properties related to freshwater influence. Here, greater freshwater in TF could have i) reduced the colonization and subsequent accumulation of Chl a by altering the bottom-ice microstructure (i.e., ice porosity, permeability and extent of skeletal layer) (Arrigo, 2014; Arrigo, 2017; Thomas, 2017), and/or ii) reduced algal growth through hypoosmotic stress (Legendre et al., 1992b). An impact of freshwater on habitable space for sea ice algae has been observed previously in the Baltic Sea, where brackish sea ice with low bulk-ice salinity and low brine volume fraction supported low algal biomass on the order of 0.2 to 1.2 mg Chl a m–2 (Haecky and Andersson, 1999; Granskog et al., 2003). As detailed above, similarities to the Fransson et al. (2020) study and a documented lower bulk-ice salinity, lower brine volume fraction in TF1 compared to VM sites (Table 1; Figure 3) and visual observations of a poorly-defined skeletal layer at TF1 (Figure 1; Supplementary Figure 2) suggest freshwater influence impact on ice algal Chl a in our study. We note that indirectly, the lower ice porosity would have also reduced the permeability of the bottom-ice to nutrient-carrying ocean water (Granskog et al., 2006; Vonnahme et al., 2021), inducing nutrient stress on TF1 ice algae. Such a phenomenon of nutrient limitation is supported by the low bulk-ice nutrient concentrations at TF1 (Table 1), which were similar to nutrient concentrations reported elsewhere in Arctic fjords cited as having nutrient limited conditions (NO3 + NO2:<2.5 μmol L–1, PO4:<1 μmol L–1, Si(OH)4:<2 μmol L–1), including TF and VM (Mikkelsen et al., 2008; Kaartokallio et al., 2013; Fransson et al., 2020; Kvernvik et al., 2021).
The POC : PON molar ratio (14.4) at TF1 was considerably higher than the average Redfield ratio (6.6) that is typical for marine phytoplankton in deep oceans, but also above the Sterner ratio (8.3), which can be used to compare POC : PON in the Arctic Ocean and shelves (Frigstad et al., 2014). This suggests potential nitrogen limitation (Demers et al., 1989; Gosselin et al., 1990). It is important to mention that POC : PON molar ratios may range from 3 – 24 mol:mol in the sea ice (e.g., Arctic Canadian shelves) (Niemi and Michel, 2015), which means these ratios can be well-above the Redfield and Sterner ratios in sea ice. However, the highest values reported in that review stem from situations where algal material probably did not account for the majority of particulate organic matter (i.e., outside blooms, during winter). It is also worth considering that non-algal particulate organic matter including detritus and extracellular polymeric substances (EPS) can be important carbon sources, specifically outside the sea ice algal bloom period (e.g., Riedel et al., 2008), this can lead to highly variable POC : PON ratios (Niemi and Michel, 2015), thus limiting their use as indicators of algal physiological status. However, since the markedly increased POC : PON molar ratio at TF1 in this study was measured during spring algal bloom succession (Frigstad et al., 2014), we consider it indicative of a physiological state affected by nitrogen shortage. This is further in line with findings from an earlier study of sea ice algal seasonal succession in VM that showed a clear effect of decreasing nitrate concentrations on POC : PON molar ratios, as well as on photosynthetic yield (Leu et al., 2020; Kvernvik et al., 2021). Further evidence pointing towards nitrate as the limiting nutrient at TF1 comes from additional ratios such as N:P (1.6) which was lower than the Redfield (16) and the Sterner (20) molar ratios and N:Si (0.4) which was also lower than the ratio (1.07) for marine diatoms growing under continuous light (Brzezinski, 1985). Additionally, the lower bulk-ice salinity and Chl a at TF1 also suggest a potential greater hypoosmotic stress on ice algal cells. Other drivers which may have contributed to the lower Chl a at TF1 include snow depth (Section 4.1.1), ice thickness and age. The sea ice was thinner at TF1 than at VM1 and VM2 (Table 1), which could suggest that it was younger in TF. This suggestion is confirmed by Svalbard ice charts showing that fast-ice only started covering TF1 around 22 March, 2021 while fast-ice already started covering VM1 and VM2 around 15 February, 2021 (MET, 2021). This difference in ice age has likely led to later cell incorporation in TF than in VM sea ice and therefore to less time for the algal biomass to accumulate.
Despite higher Chl a at VM2 and VM1 sites, low bulk-ice nutrient concentrations (Table 1) were likely to have also limited algal growth in at least part of this fjord. Similar to TF1, the POC : PON (10.5) and N:P (4.5) ratios at VM2 were greater and lower than the Redfield and Sterner ratios, respectively. By contrast, VM1 had the highest nitrogen (NO2 + NO3) concentrations of any site (Table 1), and the bulk-ice POC : PON molar ratio (7.8) as well as molar ratios of N:P (17.2) were similar to Redfield ratios and slightly lower than Sterner ratios. This suggests potential nitrogen replete growth conditions at VM1 which could explain the highest Chl a value at VM1.
Our insights on Redfield and Sterner organic matter and nutrient ratios and Chl a variability demonstrate that ice algal communities exposed to the same water masses, with separation on the scale of only a few kilometers, could exhibit different states of nutrient limitation (Leu et al., 2010; Leu et al., 2020). This is perhaps unsurprising given that previous studies have shown states of ice algal nutrient limitation to vary over even finer horizontal scales (e.g., meters), although for reasons of snow depth-related differences in nutrient demand (Campbell et al., 2016). Bulk-ice nutrient concentrations represent a proxy for nutrient availability but are themselves often considered to be an underestimate of nutrient availability to sea ice algae living within the brine channels. As a result, we also considered salinity corrected values of nutrients in the brine (Section 3.1.1), while investigating variability in sea ice algal photophysiology and growth. Since previous studies found that decreases in can be caused by a reduction in salinity (e.g., Bates and Cota, 1986; Campbell et al., 2019), or by nutrient-limited growth conditions (e.g., Cota and Horne, 1989; Campbell et al., 2016), we suggest here that the lowest at TF1 (Figure 5), could also be explained by the low bulk-ice salinity and low nutrient concentrations in the brine at that site, specifically of NO2 + NO3 (Table 1), while the higher at VM2 and VM1 (Figure 5), could be due to higher bulk-ice salinity and the higher NO2 + NO3 concentrations in the brine of these two sites (Table 1). Despite the differences in bulk-ice salinity and nutrient concentrations, were similar across sites. , are influenced by the rate of electron transport within a cell and the size of the photosynthetic unit, which collectively respond to variations in environment like temperature, light and nutrient conditions. It is thus conceivable that sites of different nutrient availability may have similar maximum photosynthetic rates if there are contrasting influences from other environmental factors. For example, we documented that TF1 and VM2 likely had greater nutrient limitation (which could lower , ), but also greater light availability (which could reduce the pigmentation and density of reaction centers within a given cell, and thus reduce , ). Together, these effects may have balanced the net impact on , at TF1 and VM2 relative to VM1 (which had more nutrients but lower light intensities).
It is also important to mention that sea ice algal biomass indicators like POC/N, Chl a and photophysiological responses may vary according to seasons (Leu et al., 2010; Leu et al., 2020; Kvernvik et al., 2021). Nevertheless, it is still worth discussing the differences between sampling sites in POC/N and Chl a, especially since the occurrence of lower Chl a in sea ice of lower bulk-ice salinity in our study is supported by previous studies (Granskog et al., 2003; Vonnahme et al., 2021). We would have ideally collected several times, but this was made impossible due to logistical setbacks (e.g., high avalanche risk, thin ice cover). Algal succession scenarios and thus are only representative for the time of sampling.
The molar ratios of dissolved inorganic N:Si at VM1 (15.5) and VM2 (1.4) were above the typical ratio of 1.07 while the molar ratio at TF1 (0.4) was well-below it. The higher silicate concentrations relative to nitrate at TF1 compared to VM1 and VM2 is likely the result of greater exposure to land run-off (glacial or riverine inputs) at TF1 as glaciers have been shown to be major sources of silicate to marine systems (Tréguer and Rocha, 2013; Meire et al., 2016; Fransson et al., 2020). This further supports glacial meltwater as a major source of freshwater at TF1. Besides, a surplus of silicate can be observed in sea ice (Fripiat et al., 2017; Yoshida et al., 2020) and dissolved silicate concentration in ice are governed by diatom growth, abundance and frustule dissolution in addition to exchange with the water column below. In our study, the pennate diatom abundance was relatively high at VM1 (99% of the relative abundance) and assuming a low silica dissolution rate (Nelson et al., 1991), this could also explain the high N:Si ratio at that site. Furthermore, marine diatoms can efficiently store nutrients (e.g., NO3) and release these nutrients in significant concentrations under stress (Lomas and Glibert, 2000). It is here suggested that the direct melting of individual ice cores for nutrient measurements may have led to cell lysis (Garrison and Buck, 1986), and thus to the release of internal nitrogen pools, while Si(OH)4 remained bound to the silica frustule of diatoms. Nevertheless, it is noteworthy that the bulk-ice Si(OH)4 and PO4 concentrations were generally comparable to bottom-ice values reported for spring sea ice of other Arctic fjords, which similarly reported nutrient limited growth conditions (Mikkelsen et al., 2008; Kaartokallio et al., 2013; Kvernvik et al., 2021).
4.1.3 Community composition and seasonal progression of sea ice algae
The fjords of this study were characterized by different community compositions. The VM communities were dominated by pennate diatoms like Nitzschia spp. (including Nitzschia frigida (Grunow)), which are typical of Arctic sea ice (Poulin et al., 2011). The community at TF1 was also dominated by pennate diatoms, but displayed a greater relative abundance of flagellates (Figure 4). High relative contributions of flagellates to total community composition are often characteristic of brackish ice-covered waters like the Baltic Sea (Piiparinen et al., 2010; Rintala et al., 2014), at times of low salinity during melt season (Van Leeuwe et al., 2018), or during periods of limited nutrient availability (Gradinger, 1999). Thus, the TF1 community composition provides further evidence to our hypothesis that the TF sea ice algae may have been influenced by freshwater to a greater degree than in VM, and that they experienced the greatest nutrient limitation within this study.
The variability in community composition between the two fjords may also be explained by differences in the seasonal progression of sea ice algae. The phenology of sea ice algae is influenced by both the timing of ice freeze-up, as well as by seasonal changes in the physical-chemical ice environment, for instance in light, nutrient, or salinity conditions (Tedesco et al., 2019). Based on observations from MET (2021) sea ice started to form earlier at the VM sites (around 15 February) than at TF1 (around 22 March). Lower algal Chl a and greater abundance of flagellates in the bottom-ice of TF1 may thus be in-part a result of an earlier stage in the seasonal progression of sea ice algae, where the typically high spring accumulation of diatoms had not yet begun, due to later formation of sea ice in the spring. In comparison, higher Chl a and the greater abundance of diatoms in the bottom-ice of VM suggests that the seasonal progression of sea ice algae was at a more advanced stage, and that the algae were in their accumulation phase of growth (Leu et al., 2015), especially at VM1 where Chl a was the highest and where pennate diatoms represented more than 98% of the algal community (Figure 4). This is also in accordance with spring algal successional patterns in newly formed Arctic sea ice which transitioned from a community resembling the composition of its source water towards a more matured, typical ice algal community (Kauko et al., 2018). Another factor which potentially led to differences in flagellate abundance between the two fjords is the seeding assemblage in the surface water, at the time of ice formation and in each site location. It is possible that there was greater abundance of flagellates at TF1 than at the VM sites when sea ice formed, although we do not have any data to support this assumption.
4.1.4 Dependence of photophysiology on under-ice characteristics and research methodology
Photophysiological parameters reported in this study are within the previously reported range of values summarised by Van Leeuwe et al. (2018). In comparison to our study, the maximum photosynthetic rate Pmax, the photosynthetic efficiency α, and the photoacclimation index Ik documented in early May, 2017, for VM sea ice algae by Kvernvik et al. (2021), were different compared to our reported values. We attribute these differences to the use of different methodological approaches, sampling time and environmental conditions between the studies. For example, we measured GPP by incubating bottom-ice algae with 14C for 3 h in vivo after melting bulk-ice samples with FSW (salinity of about 30 from the ice-ocean interface water) at room temperature for 24 h, while Kvernvik et al. (2021) measured net primary productivity (NPP) by incubating algal samples with 14C for 24 h underneath the sea ice, immediately after scraping the algae off from the lowermost layer of the ice core. Furthermore, our study took place approximately two weeks earlier, had a dominance of pennate diatoms (versus a mixed community of unidentified coccoidal cells and diatoms), and was covered by less snow.
In addition to the potential influence of salinity and nutrients as described above (Section 4.1.2), further differences in the photophysiological parameters and Ik may be a result of differences in the under-ice light regimes. Indeed, was seen to decrease with increasing irradiance as a result of snow depth and the transition from early to late spring melt (Cota, 1985). A clear negative correlation between irradiance and α was also found in the seasonal study from VM in 2017 (Kvernvik et al., 2021). Thus, our lower at TF1 and VM2 with snow depths thinner by approximately a factor of four and five, respectively, compared to VM1 that had the greatest , supports this photophysiological response of ice algal communities. In contrast to , the Ik in our study was greater at TF1 by a factor of approximately two to three compared to the VM communities (Figure 5). This suggests that the TF1 community had photoacclimated to higher irradiance, which is in agreement with the higher PAR value at this site under thin snow depth (Table 1). This is perhaps unsurprising in the context of similar responses documented, as is understood to be inversely proportional to Ik (Platt et al., 1980; Cota and Horne, 1989). Besides, the highest βB at VM1 (Figure 5B), indicates a greater sensitivity to high irradiance levels compared to the TF1 and VM2 (Platt et al., 1980; Geider and Osborne, 1992). A heightened sensitivity is likely explained by the thickest snow depth at VM1 and thus the lowest light availability at that same site (Table 1), consistent with algae being more shade-acclimated as a result. Nevertheless, it is difficult to conclude about the influence of under-ice light regimes on the photophysiology of TF1, VM1 and VM2 sea ice algal communities due to daily and seasonal variations. Ideally, light transmission data and photoprotective pigments to Chl a ratios would have been required to better understand the potential of light as a main driver of the photophysiological responses of these sea ice algal communities, but these measurements are not available.
In addition to the under-ice light regimes, it is important to consider ice-ocean interface salinity and ice-ocean interface nutrients to which sea ice algae are acclimated (Arrigo, 2014). These were similar across sites based on measurements of our study (Table 1). Nevertheless, we cannot exclude that we did not capture the true ice-ocean interface salinity, for instance due to methodological challenges (Section 4.2.1). The definite cause of variability in Chl a and photophysiology is impossible to determine only based on the fieldwork results since the influence of salinity, light intensities and nutrient availability often overlaps when assessing photophysiological responses under variable co-factors. Lower Chl a and could still indicate the occurrence of environmental stressors such as lower salinity and nutrient availability (Section 4.1.2), and may represent acclimation responses to higher light intensities due to photoprotective mechanisms (e.g., decreasing Chl a under increased light intensity conditions) (e.g., Campbell et al., 2015). Unfortunately, the logistical constraints of our study reduced the number of sampling events and thus limit the application of robust statistics. Given the strong differences between sites, combined with evidence from previous studies, we suggest that salinity could have been one of the drivers of variable Chl a and photophysiology between the two fjords.
4.2 Impact of salinity on the photophysiological responses of a Van Mijenfjorden cultured ice algal community
The field data did not provide evidence of significant and independent effects of low salinity on the VM communities, neither directly (i.e., hypoosmotic stress) nor indirectly (i.e., reduced ice porosity) (Table 1; Figure 3). However, experimental results on cultures from VM2 showed that a rapid decrease in salinity (i.e., within 24 h) had the capability to negatively affect cell Chl a and photophysiology (Figures 6, 8, 9). The impact of low salinity on Chl a was especially significant after 168 h of exposure (Figure 6; Table 2), while the photophysiolgical response was more sensitive with a significant impact documented at all time points (4 h to 168 h) (Figures 8, 9; Table 2). Sea ice algal growth and photophysiology are often considered optimal at salinities ranging from 30 – 50 (Arrigo and Sullivan, 1992; Søgaard et al., 2011), although they may survive salinities below 10 and above 60 (Grant and Horner, 1976; Kottmeier and Sullivan, 1988; Kirst, 1990). Deviations from these ranges of optimal salinity can have a detrimental effect on ice algal cells to the point of causing cell death (Ralph et al., 2007).
Previous studies have shown that Chl a may be reduced under conditions of low salinity stress (e.g., Campbell et al., 2019; Yan et al., 2020; Chamberlain et al., 2022), and other studies have found that growth rates of Arctic sea ice diatoms were lower at salinities less than 12 in comparison to higher salinities ranging from 15 – 50 (Grant and Horner, 1976; Zhang et al., 1999). This supports the observed slower algal growth (i.e., lower Chl a) in our lowered salinity treatment of 10 after 168 h. Previous studies have also found lower or and for Arctic sea ice algae exposed to salinities less than 20 following acclimation to a salinity of 30 (Bates and Cota, 1986; Campbell et al., 2019), which is in further agreement with our significantly lower and in the lowered salinity treatment of 10. Based on these results, we suggest that in situ melting of sea ice, glacial and riverine run-off, rain and snow events, as well as the lab-based ice melting procedure are likely to negatively impact the photophysiology of sea ice algae on the short-term (4 – 24 h) and Chl a on the longer-term (168 h). This would be a result of freshwater sources having the potential to rapidly dilute the salinity of the surface water to 10 under the sea ice (Hop et al., 2011; Mundy et al., 2011; Smith et al., 2022) or to lower salinity during lab-based experiments (Weeks and Ackley, 1982; Campbell et al., 2019).
Shifts in community composition and cell abundance due to changes in salinity have been suggested by a number of previous studies. For instance, with centric diatoms and flagellates outcompeting pennate diatoms under comparatively low in situ salinity conditions (e.g., Campbell et al., 2018), and the documented abundance of flagellates in sea ice of brackish waters in the Baltic Sea (Piiparinen et al., 2010; Rintala et al., 2014) or in surface melt ponds in the high Arctic (Lee et al., 2011; Mundy et al., 2011). Additionally, previous studies have reported a dominance of centric diatoms or flagellates over pennate diatoms in ice algal communities exposed to a decrease in salinity from about 32 to 29 (Yan et al., 2020) and 12 (Zhang et al., 1999). However, in this experimental study we found no evidence of salinity affecting community composition (Figure 7; Table 2), and thus no preference for flagellates over diatoms to grow under comparatively low salinity conditions. An undocumented change in community composition could be a result of unsufficient exposure time of 168 h (i.e., one week) to low salinity conditions in our experiment (e.g., Kauko et al., 2018). Future studies should further investigate shifts in community composition to low salinity stress over longer-term acclimation time (e.g., a month). Although no notable changes were found in the relative community composition, significant changes in the cell abundance of cultured algae were found between the control salinity treatment of 33 and the lowered salinity treatment of 10, after 4 h and 168 h (Figure 7; Table 2). The significant difference at 4 h could have been a result of variable start Chl a concentrations for experimental work (Figure 6), although both treatments were initiated during the period of exponential growth. Similar to discussion on differences in Chl a during experimentation (Section 4.2), the lower cell abundance after 168 h at salinity 10 supports slower algal growth with comparatively long-term exposure to low salinity. The greater relative abundance of dead pennate diatoms at salinity 10 than at 33 (Supplementary Table 1), also indicates that the algae could have been more stressed in the low salinity treatment, leading even to cell mortality.
Despite the lack of change in the relative community composition with low salinity stress exposure, we note that changes in community composition of the VM2 cultured ice algal community (Figure 7) occurred relative to the in situ fjord community (Figure 4). For example, a loss of Nitzschia frigida and a shift towards dominance of Synedropsis hyperborea was seen in the cultures. These changes in community composition have occurred during the four-month period cultures were grown in the laboratory prior to experimentation. In turn, this would have introduced variability into the specific photophysiological parameters measured during experiments. Changes in community composition of our culture from VM during this could have been due to temperature stress [growth at 4 °C in the laboratory versus at −1.8 °C in situ), alternations to growth nutrients of media (enriched Guillard F/2 growth media in the laboratory versus low nutrient concentrations in field (Table 1)] and acclimation to culturing light intensities of 30 μmol photons m–2 s–1 versus acclimation to 2.1 μmol photons m–2 s–1 in the field). Additionally, the VM2 cultured community had a fast growth rate (Supplementary Figure 1), which could have led to nutrient shortage and therefore enhanced competition for nutrients between species, where Synedropsis hyperborea may have better acclimated to the limited nutrient availability than other species, explaining its observed dominance. Another factor which could explain the dominance of this Synedropsis hyperborea is that this species attaches well to surfaces (e.g., walls of culture bottles) as it is an epiphytic species growing on other diatoms (von Quillfeldt et al., 2009). The loss of Nitzschia frigida in the cultured community is unfortunate as this pennate diatom species often dominates the Arctic bottom-ice (Poulin et al., 2011; Van Leeuwe et al., 2018) and is therefore highly representative of Arctic bottom-ice algal communities. Nevertheless, Synedropsis hyperborea has also been reported as a dominating pennate diatom in the Arctic sea ice (Tamelander et al., 2009; von Quillfeldt et al., 2009), specifically under summer melting conditions where only the frustules of other diatoms remained (Hegseth and von Quillfeldt, 2022), and it is also a common epiphyte of the Arctic centric diatom Melosira arctica (Hasle et al., 1994; Poulin et al., 2014). Thus, the magnitude of the responses of the VM2 cultured community dominated by Synedropsis hyperborea in our results supports the strong impact of low salinity stress that likely apply to sea ice pennate diatom-dominated communities in general. This outcome is also supported by previous studies showing that the growth and photophysiological performance of the characteristic Arctic pennate diatom Nitzschia frigida was negatively impacted by low salinity stress (e.g., Zhang et al., 1999; Campbell et al., 2019). Nevertheless, we suggest that future culture experiments should be run closer to the sampling time to avoid changes in community composition, and thus to obtain responses as representative as possible of natural bottom-ice algal communities.
It could however be worth mentioning observed differences between Synedropsis hyperborea and Nitzschia frigida, especially since photophysiological parameters may increase with increasing cell size (e.g., Taguchi, 1976). In our taxonomic analysis, we distinguished Synedropsis hyperborea and Nitzschia frigida primarily by colony structure, with Synedropsis hyperborea typically exhibiting non-branched colonies, and individual cell morphology and size. Notably, previous studies reported a size range of 13 – 96 μm for Synedropsis hyperborea and 45 – 75 μm for Nitzschia frigida (Grøntved, 1950; Medlin and Hasle, 1990; Hasle et al., 1994). In our study, cultured Synedropsis hyperborea cells measured 40 – 45 μm in apical length, while in situ Nitzschia frigida cells averaged approximately 60 μm. This suggests that the photophysiological responses we studied in the lab might not have been as intense as they could have if Nitzschia frigida had been dominating the culture. Unfortunately, we could not confirm this hypothesis since the species did not grow in the laboratory.
4.2.1 Impacts of salinity on temporal changes in the photophysiological responses of culture experiments
To avoid death, sea ice algae must acclimate by releasing osmolytes and salts (ions) or by altering the ion permeability via changes in the protein structure of cell membranes to cope with intracellular influx of water. This can take days to weeks before full recovery is achieved (Grant and Horner, 1976; Vargo et al., 1986; Kirst, 1990). Based on the significantly greater values of and in the control versus lowered salinity treatment of 10 after 168 h (in comparison to 4 h or 24 h) (Figures 8, 9, Table 2), we suggest that the VM2 cultured algae faced hypoosmotic stress after short-term exposure (after 4 h and 24 h) but were capable of recovering, to some extent, on a longer-term basis. However, the photophysiological parameters , and Ik remained significantly lower at salinity 10 than at 33 at all time points of our experiment, indicating that within a 168 h time period, full recovery from the hypoosmotic stress was not possible. In contrast to this recovery response documented at low salinity 10, photophysiological parameters were largely consistent across time points in the control salinity of 33 (Figures 8, 9). This is with the exception of a decrease in that could highlight nutrient limitation and cell self-shading effect (Borowitzka and Vonshak, 2017), especially provided that the VM2 cultured community was relatively fast-growing (Supplementary Figure 1), and reached high Chl a (319.4 μg L–1) after a 168 h growth at salinity 33 (Figure 6).
It is worth mentioning that the photophysiological responses measured in our study are likely to be representative of the most salinity tolerant species, to the control salinity of 33 and to the low salinity of 10. We surmise that our measurements are mainly representative of Synedropsis hyperborea´s responses since it was the predominant species in our cultured community and also because it has previously been observed in meltwater environments (e.g., Hegseth and von Quillfeldt, 2022). In addition, some microalgae potentially recovered better to the rapid decrease in salinity than others, but this assumption, unfortunately, cannot be supported from our dataset. We believe that future studies could isolate sea ice algal species from a cultured community and grow them separately in axenic cultures to further investigate and predict their specific photophysiological and acclimation responses to rapid decreases in salinity likely to occur in the Arctic coastal waters.
Our observations of limited recovery in photophysiological responses of the VM2 cultured community (i.e., only after 168 h) suggest a longer acclimation time than previously documented for a bottom-ice algal community from the Sea of Okhotsk. There, ice algae subject to smaller decreases in salinity from about 32 to 29 showed full recovery of the photosynthetic activity within 80 h (Yan et al., 2020). However, the slight recovery of photophysiological responses in our study was greater than the Southern Ocean bottom-ice algal community studied by Ryan et al. (2004), where cells were unable to recover even after 5 days of growth at a reduced salinity of 10 (Ryan et al., 2004). Such differences in the time required for acclimation could be explained by the extent of salinity change/existing acclimation status, where the difference of 23 in our study was far greater than the change of 3.4 in Yan et al. (2020) However, the differences in salinity between our study and Ryan et al. (2004) were comparable. Contrasting community composition could also be a factor in the differing responses between these reported studies, since the Sea of Okhotsk community of Yan et al. (2020) was dominated by centric diatoms (Thalassiosira), which may have better acclimation capability than pennate diatoms (Yan et al., 2020). By contrast, the Antarctic pack-ice community in Ryan et al. (2004) and our VM2 cultured community were dominated by pennate diatoms (Fragilariopsis curta versus Synedropsis hyperborea, respectively) and had limited ability to recover to the low salinity of 10. Another environmental factor that could explain the difference in the time required for photosynthetic recovery is nutrient availability. Indeed, the sea-ice algae studied by Yan et al. (2020) were sampled close to the land under high macro- and micro-nutrient concentrations (Kanna et al., 2014; Kanna et al., 2020), while the bottom-ice algae collected by Ryan et al. (2004) low Fe concentrations in Southern Ocean surface waters (Boyd et al., 2007) and sea ice (Pankowski and McMinn, 2008), which might delay photosynthetic recovery. In contrast, nutrient concentrations in our study were rather low but typical for Svalbard fjords. Despite differences in acclimation responses, all three studies showed that bottom-ice algal communities were stressed by short-term exposure to rapid decreases in salinity. The ability of Arctic sea ice diatoms to recover from salinity stress is less clear, but we assume that it is feasible given the likelihood this was required for their evolution in coping with seasonal variations in salinity that are typical for the ice-ocean interface of the Arctic Ocean.
It is also worth mentioning that our study only investigated the effects of a decrease in salinity from 33 to 10 (difference of 23), representing a rapid drop in salinity as observed in nature during rain events on sea ice or during unbuffered melting of ice core sections (e.g., Galindo et al., 2014; Campbell et al., 2019). Ideally, we would have also assessed the acclimation responses of sea ice algae to decreases in salinity of less intensity (e.g., from 33 to 25, or to 20), which was unfortunately limited due to time constraints. Future studies could assess the physiological acclimation responses of sea ice algae to increases and decreases in salinity as observed in nature, which are known to strongly impact ice algal growth and diversity (e.g., Grant and Horner, 1976; Zhang et al., 1999).
4.3 Potential implications of freshening of the Arctic coastal waters and ongoing climate warming
The potential negative effects of freshening on the ice algal biomass/photophysiological in natural sea ice and the significant experimental evidence of negative short-term salinity reductions on ice algal growth and photophysiology, suggest that increased amounts of freshwater accumulating in Arctic coastal waters through glacial meltwater run-off, increased riverine input and precipitation, have the potential to negatively impact ice algal Chl a and primary productivity. A similar suggestion was made regarding freshwater impacts on phytoplankton in Arctic coastal waters (e.g., Chucki sea), during the summer season, with negative impact on the primary productivity and biomass of coastal phytoplankton (Yun et al., 2014; Yun et al., 2016). Our results also indicate the potential of sea ice algae to slowly acclimate to a decreased salinity in terms of primary productivity and photosynthetic efficiency. Nevertheless, predicting the potential effects of less-saline conditions are difficult since different sea ice algal communities may respond differently on long-term exposure (e.g., see section 4.2.1), although based on our study, lower algal Chl a and cell abundance could be expected after a week of growth in a decreased salinity. Despite the lack of changes in community composition in our results, we consider it is still important to assess this variable while predicting future changes in sea ice algal photophysiological responses, especially since other studies have observed shifts in taxa and species after a decrease in salinity (e.g., Zhang et al., 1999; Yan et al., 2020), and because it may have an impact on higher trophic levels (Thomas, 2017). However, all predicted consequences based on our results and mentioned above may vary, for instance with: i) the specific ability of different bottom-ice algal species and communities to acclimate to lower salinity, ii) sea ice regionality and seasonality (e.g., differences in regional and seasonal sea ice characteristics), iii) alterations in other environmental factors than salinity (e.g., light and nutrient availability) arising from Arctic freshening (e.g., Brown et al., 2020).
4.4 Recommendations for best practice
Rapid versus gradual melting of bulk-ice samples leads to sharp decreases in salinity that are likely to be harmful for ice algae, as seen in their photophysiological responses (Garrison and Buck, 1986; Mikkelsen and Witkowski, 2010). In contrast to previous studies that recommend rapid direct melt of bulk-ice samples (at room temperature for about 12 h) (Rintala et al., 2014), or a slow melt without the addition of FSW to buffer changes in salinity (at 4 °C for 4.5 days) (Mikkelsen and Witkowski, 2010), we advocate against directly melting bulk-ice samples due to the significant impact of a salinity reduction from 33 to 10 on Chl a (Figure 6), cell abundance (Figure 7), and photophysiological parameters of experimental cultures (Figures 8, 9). Instead, we support recommendations to buffer bulk-ice samples by adding FSW, thus yielding a final bulk-ice salinity on the order of 20 – 30 (Campbell et al., 2019). Alternatively, samples can be buffered such that the final salinity of melted ice is representative of in situ salinities of ice-ocean interface or brine environments (Campbell et al., 2019). We also recommend to gradually melt the bulk-ice samples to avoid rapid decreases in salinity and intense hypoosmotic stress, for instance, for 24 h. However, melting ice samples for days prior to measurements should be avoided as decreases in salinity may lead to the underestimation of Chl a and cell abundance on long-term exposure, and it is likely to alter the algal photophysiology from normal in situ states of acclimation.
5 Conclusion
The sea ice in two Arctic fjords (Tempelfjorden and Van Mijenfjorden) had different bulk-ice salinities at the time of sampling, which alongside differences in brine nutrient concentrations, under-ice light availability, and other factors (e.g., community composition/seasonal progression of sea ice algae, ice permeability and age), may help explain observed variability in ice algal Chl a and photophysiology. A direct effect of freshening (i.e., low salinity) on the photophysiological responses of Svalbard bottom-ice algal communities could not be determined from the field data however we suggest that the low bulk-ice salinity and associated factors (brine volume fraction, nutrient availability) caused regional differences between the two studies fjords. The results from laboratory-based experiments demonstrated that a rapid drop in salinity, representative of influx of meltwater/freshwater run-off in fjord systems, has the potential to negatively affect Chl a biomass and algal photophysiology.
Our results suggest that the freshening of Arctic fjord waters due to climate warming, and proximity to freshwater sources (e.g., tidewater glaciers), specifically in late spring, and could result in lower sea ice algal primary productivity and photosynthetic efficiency on short-term growth (i.e., 4 – 24 h) under decreased salinity conditions as well as to lower Chl a and cell abundance on comparatively longer-term growth (i.e., 168 h). Nevertheless, this remains uncertain as sea ice algal community composition may change in response to freshening, highlighting the need for further species-specific studies on salinity stress responses. We note that since sea ice algal photophysiological responses are not only dependent on salinity, but also on other environmental factors that are likely to vary with the freshening of Arctic coastal waters and ongoing climate warming, we advocate sea ice scientists to investigate the combined effects of decreased salinity and other predicted environmental stressors on the long-term acclimation responses of bottom-ice algal communities growing in Arctic coastal regions. Areas of specific interests are regions where freshening is likely to increase or develop earlier in the season due to enhanced meltwater run-off from land (riverine inputs, glacial meltwater input, ice sheet melting) and sea ice melt.
Statements
Data availability statement
The datasets analyzed for this study can be found in the Norwegian Polar Institute (NPI) database on the following link: https://data.npolar.no/dataset/9c525398-0b05-4781-a236-15de282d34b0.
Author contributions
This work was conducted by ZLF and KC, and was based on the scientific experimental design of KC. All figures and tables were prepared by ZLF. Co-authors KC, BAL, RG, PA, LMG, JEO, MAG, JES and EL provided input either during the field season or/and during the laboratory experiments, as well as during the writing and editing of the article that was led by ZLF.
Funding
The author(s) declare financial support was received for the research, authorship, and/or publication of this article. This research was supported by PHOTA (Physical drivers of ice algal HOTspots in a changing Arctic Ocean) funded by the Fram Centre Arctic Ocean Flagship Program (Tromsø, Norway, #66014), Diatom-ARCTIC (Diatom Autoecological Responses with Changes To Ice Cover) project funded by the NERC Science of the Environment (NE/R012849/1; 03F0810A) and OASYS (Ocean-Air synoptic operations using coordinated autonomous robotic SYStems and micro underwater gliders) funded by the Research Council of Norway (project # 284477). Parts of this work were supported by the Norwegian Polar Institute’s Arctic Ocean and Svalbard programs, and the Research Council of Norway through projects CAATEX (grant no 280531), HAVOC (grant no 280292) and the Arctic Field Grant (AFG # 322575 to ZLF). It was also funded by ACCES (project funding UNIS sea ice work): JES was funded through the 2017-2018 Belmont Forum and BiodovERsA joint call for research proposals, under the BiodivScen ERA-Net COFUND programme with Norwegian Research Council (grant no 296836) being the funding organization. This work also represents a contribution to the Scientific Coalition of Oceanographic Research (SCOR) working group ECV-Ice (Essential Climate Variables). The work by KC is also supported by the RCN BREATHE (Bottom sea ice Respiration and nutrient Exchanges Assessed for THE Arctic, grant # 325405) project.
Acknowledgments
ZLF would like to specifically acknowledge Paul Dubourg and Ulrike Dietrich for their support in the laboratory; Cecilie von Quillfeldt for sharing her diatom taxonomy expertise, thus allowing more accurate identification of main taxa and species of sea ice algae; Eirik Hellerud and Geir Ove Aspnes from NPI logistics in Longyearbyen for keeping us safe and warm during the fieldwork.
Conflict of interest
The authors declare that the research was conducted in the absence of any commercial or financial relationships that could be construed as a potential conflict of interest.
Publisher’s note
All claims expressed in this article are solely those of the authors and do not necessarily represent those of their affiliated organizations, or those of the publisher, the editors and the reviewers. Any product that may be evaluated in this article, or claim that may be made by its manufacturer, is not guaranteed or endorsed by the publisher.
Supplementary material
The Supplementary Material for this article can be found online at: https://www.frontiersin.org/articles/10.3389/fmars.2023.1221639/full#supplementary-material
Abbreviations
Chl a, Chlorophyll a; DIC, Dissolved inorganic carbon; FSW, Filtered seawater; NO2 + NO3, Nitrite + nitrate; PO4, Phosphate; POC/N, Particulate organic carbon and nitrogen; Si(OH)4, Silicate; GPP, Gross primary productivity; PI Curves, Photosynthesis-irradiance curves; , Photosynthetic efficiency; , Maximum photosynthetic rate in the absence of photoinhibition; , Maximum photosynthetic rate in the presence of photoinhibition; Ik, Photoacclimation index; βB, Photoinhibition rate; PAR, Photosynthetically active radiation; TF, Tempelfjorden; VM, Van Mijenfjorden; TF1, Tempelfjorden – Site 1; VM1, Van Mijenfjorden – Site 1; VM2, Van Mijenfjorden – Site 2.
References
1
Alkire M. B. Nilsen F. Falck E. Søreide J. Gabrielsen T. M. (2015). Tracing sources of freshwater contributions to first-year sea ice in Svalbard fjords. Cont. Shelf Res.101, 85–97. doi: 10.1016/j.csr.2015.04.003
2
Andersen R. A. (2005). Algal culturing techniques. 1st ed. (Burlington, MA: Elsevier Academic Press), 589.
3
Arrigo K. R. (2014). Sea ice ecosystems. Annu. Rev. Mar. Sci.6, 439–467. doi: 10.1146/annurev-marine-010213-135103
4
Arrigo K. R. (2017). “Sea ice as a habitat for primary producers,” in Sea ice, 3rd ed. Ed. N.ThomasD. (Hoboken, NJ: Wiley-Blackwell), 352–369.
5
Arrigo K. R. Sullivan C. W. (1992). The influence of salinity and temperature covariation on the photophysiological characteristics of Antarctic sea ice microalgae. J. Phycol.28, 746–756. doi: 10.1111/j.0022-3646.1992.00746.x
6
Assur A. (1960). Composition of sea ice and its tensile strength. 1st ed. (University of California: US Army Snow, Ice and Permafrost Research Establishment), 58.
7
Bates S. S. Cota G. F. (1986). Fluorescence induction and photosynthetic responses of Arctic ice algae to sample treatment and salinity. J. Phycol.22, 421–429. doi: 10.1111/j.1529-8817.1986.tb02484.x
8
Bintanja R. Andry O. (2017). Towards a rain-dominated arctic. Nat. Clim. Change7, 263–267. doi: 10.1038/nclimate3240
9
Błaszczyk M. Ignatiuk D. Uszczyk A. Cielecka-Nowak K. Grabiec M. Jania J. et al . (2019). Freshwater input to the Arctic fjord Hornsund (Svalbard). Polar Res.38, 1–18. doi: 10.33265/polar.v38.3506
10
Borowitzka M. A. Vonshak A. (2017). Scaling up microalgal cultures to commercial scale. Eur. J. Phycol.52, 407–418. doi: 10.1080/09670262.2017.1365177
11
Boyd P. W. Jickells T. Law C. S. Blain S. Boyle E. A. Buesseler K. O. et al . (2007). Mesoscale iron enrichment experiments 1993-2005: synthesis and future directions. Science315, 612–617. doi: 10.1126/science.1131669
12
Brown K. A. Holding J. M. Carmack E. C. (2020). Understanding regional and seasonal variability is key to gaining a pan-Arctic perspective on Arctic Ocean freshening. Front. Mar. Sci.7. doi: 10.3389/fmars.2020.00606
13
Brzezinski M. A. (1985). The Si: C: N ratio of marine diatoms: interspecific variability and the effect of some environmental variables. J. Phycol.21, 347–357. doi: 10.1111/j.0022-3646.1985.00347.x
14
Calleja M. L. Kerhervé P. Bourgeois S. Kędra M. Leynaert A. Devred E. et al . (2017). Effects of increase glacier discharge on phytoplankton bloom dynamics and pelagic geochemistry in a high Arctic fjord. Prog. Oceanogr.159, 195–210. doi: 10.1016/j.pocean.2017.07.005
15
Campbell K. Mundy C. Barber D. Gosselin M. (2015). Characterizing the sea ice algae chlorophyll a–snow depth relationship over Arctic spring melt using transmitted irradiance. J. Mar. Syst.147, 76–84. doi: 10.1016/j.jmarsys.2014.01.008
16
Campbell K. Mundy C. Belzile C. Delaforge A. Rysgaard S. (2018). Seasonal dynamics of algal and bacterial communities in Arctic sea ice under variable snow cover. Polar Biol.41, 41–58. doi: 10.1007/s00300-017-2168-2
17
Campbell K. Mundy C. Juhl A. R. Dalman L. A. Michel C. Galley R. J. et al . (2019). Melt procedure affects the photosynthetic response of sea ice algae. Front. Earth Sci.7. doi: 10.3389/feart.2019.00021
18
Campbell K. Mundy C. Landy J. Delaforge A. Michel C. Rysgaard S. (2016). Community dynamics of bottom-ice algae in Dease Strait of the Canadian Arctic. Prog. Oceanogr.149, 27–39. doi: 10.1016/j.pocean.2016.10.005
19
Chamberlain E. Balmonte J. Torstensson A. Fong A. Snoeijs-Leijonmalm P. Bowman J. (2022). Impacts of sea ice melting procedures on measurements of microbial community structure. Elem. Sci. Anth.10, 1–17. doi: 10.1525/elementa.2022.00017
20
Cota G. F. (1985). Photoadaptation of high Arctic ice algae. Nature315, 219–222. doi: 10.1038/315219a0
21
Cota G. F. Horne E. P. (1989). Physical control of Arctic ice algal production. Mar. Ecol. Prog. Ser.52, 111–121.
22
Cox G. Weeks W. (1988). Numerical simulations of the profile properties of undeformed first-year sea ice during the growth season. J. Geophys. Res.: Oceans93, 12449–12460. doi: 10.1029/JC093iC10p12449
23
Demers S. Legendre L. Maestrini S. Y. Rochet M. Ingram R. G. (1989). Nitrogenous nutrition of sea-ice microalgae. Polar Biol.9, 377–383. doi: 10.1007/BF00442528
24
Fernández-Méndez M. Olsen L. M. Kauko H. M. Meyer A. Rösel A. Merkouriadi I. et al . (2018). Algal hot spots in a changing Arctic Ocean: Sea-ice ridges and the snow-ice interface. Front. Mar. Sci.5. doi: 10.3389/fmars.2018.00075
25
Forwick M. Vorren T. O. Hald M. Korsun S. Roh Y. Vogt C. et al . (2010). Spatial and temporal influence of glaciers and rivers on the sedimentary environment in Sassenfjorden and Tempelfjorden, Spitsbergen. Geol. Soc London Spec. Publ.344, 163–193. doi: 10.1144/SP344.13
26
Frankenstein G. Garner R. (1967). Equations for determining the brine volume of sea ice from –0.5° to –22.9°C. J. Glaciol.6, 943–944. doi: 10.3189/S0022143000020244
27
Fransson A. Chierici M. Nomura D. Granskog M. A. Kristiansen S. Martma T. et al . (2015). Effect of glacial drainage water on the CO2 system and ocean acidification state in an Arctic tidewater-glacier fjord during two contrasting years. J. Geophys. Res.: Oceans120, 2413–2429. doi: 10.1002/2014JC010320
28
Fransson A. Chierici M. Nomura D. Granskog M. A. Kristiansen S. Martma T. et al . (2020). Influence of glacial water and carbonate minerals on wintertime sea-ice biogeochemistry and the CO2 system in an Arctic fjord in Svalbard. Ann. Glaciol.61, 320–340. doi: 10.1017/aog.2020.52
29
Frigstad H. Andersen T. Bellerby R. G. Silyakova A. Hessen D. O. (2014). Variation in the seston C: N ratio of the Arctic Ocean and pan-Arctic shelves. J. Mar. Syst.129, 214–223. doi: 10.1016/j.jmarsys.2013.06.004
30
Fripiat F. Meiners K. M. Vancoppenolle M. Papadimitriou S. Thomas D. N. Ackley S. F. et al . (2017). Macro-nutrient concentrations in Antarctic pack ice: Overall patterns and overlooked processes. Elem Sci. Anth5, 1–13. doi: 10.1525/elementa.217
31
Galindo V. Levasseur M. Mundy C. J. Gosselin M. Tremblay J.É. Scarratt M. et al . (2014). Biological and physical processes influencing sea ice, under-ice algae, and dimethylsulfoniopropionate during spring in the Canadian Arctic Archipelago. J. Geophys. Res.: Oceans119, 3746–3766. doi: 10.1002/2013JC009497
32
Garrison D. L. Buck K. R. (1986). Organism losses during ice melting: A serious bias in sea ice community studies. Polar Biol.6, 237–239. doi: 10.1007/BF00443401
33
Geider R. J. Osborne B. A. (1992). “The photosynthesis-light response curve,” in Algal photosynthesis, 1st ed. (New York, NY: Springer Science), 156–191. doi: 10.1007/978-1-4757-2153-9_7
34
Geilfus N.-X. Munson K. Eronen-Rasimus E. Kaartokallio H. Lemes M. Wang F. et al . (2021). Landfast sea ice in the Bothnian Bay (Baltic Sea) as a temporary storage compartment for greenhouse gases. Elem Sci. Anth9, 28. doi: 10.1525/elementa.2021.00028
35
Gosselin M. Legendre L. Therriault J. C. Demers S. (1990). Light and nutrient limitation of sea-ice microalgae (Hudson Bay, Canadian Arctic). J. Phycol.26, 220–232. doi: 10.1111/j.0022-3646.1990.00220.x
36
Gradinger R. (1999). Vertical fine structure of the biomass and composition of algal communities in Arctic pack ice. Mar. Biol.133, 745–754. doi: 10.1007/s002270050516
37
Gradinger R. Bluhm B. Iken K. (2010). Arctic sea-ice ridges—Safe heavens for sea-ice fauna during periods of extreme ice melt? Deep Sea Res. Part II Top. Stud. Oceanogr.57, 86–95. doi: 10.1016/j.dsr2.2009.08.008
38
Granskog M. Kaartokallio H. Kuosa H. Thomas D. N. Vainio J. (2006). Sea ice in the Baltic Sea–a review. Estuar. Coast. Shelf Sci.70, 145–160. doi: 10.1016/j.ecss.2006.06.001
39
Granskog M. Kaartokallio H. Shirasawa K. (2003). Nutrient status of Baltic Sea ice: Evidence for control by snow-ice formation, ice permeability, and ice algae. J. Geophys. Res.: Oceans108, 1–9. doi: 10.1029/2002JC001386
40
Grant W. Horner R. A. (1976). Growth responses to salinity variation in four Arctic ice diatoms. J. Phycol.12, 180–185. doi: 10.1111/j.1529-8817.1976.tb00498.x
41
Grenfell T. C. Maykut G. A. (1977). The optical properties of ice and snow in the Arctic Basin. J. Glaciol.18, 445–463. doi: 10.3189/S0022143000021122
42
Grøntved J. (1950). Phytoplankton studies. First ed (Copenhaguen: I kommission hos Munksgaard), 1–27.
43
Haecky P. Andersson A. (1999). Primary and bacterial production in sea ice in the northern Baltic Sea. Aquat. Microb. Ecol.20, 107–118. doi: 10.3354/ame020107
44
Halbach L. Vihtakari M. Duarte P. Everett A. Granskog M. A. Hop H. et al . (2019). Tidewater glaciers and bedrock characteristics control the phytoplankton growth environment in a fjord in the Arctic. Front. Mar. Sci.6. doi: 10.3389/fmars.2019.00254
45
Hald M. Dahlgren T. Olsen T.-E. Lebesbye E. (2001). Late holocene palaeoceanography in van mijenfjorden, svalbard. Polar Res.20, 23–35. doi: 10.3402/polar.v20i1.6497
46
Hasle G. R. Medlin L. K. Syvertsen E. E. (1994). Synedropsis gen. nov., a genus of araphid diatoms associated with sea ice. Phycologia33, 248–270. doi: 10.2216/i0031-8884-33-4-248.1
47
Hegseth E. N. von Quillfeldt C. (2022). The sub-ice algal communities of the Barents sea pack ice: temporal and spatial distribution of biomass and species. J. Mar. Sci. Eng.10, 1–29. doi: 10.3390/jmse10020164
48
Hjelle A. (1993). Geology of svalbard (First ed (Oslo: Norsk Polarinstitutt), 162).
49
Holt B. Digby S. A. (1985). Processes and imagery of first-year fast sea ice during the melt season. J. Geophys. Res.: Oceans90, 5045–5062. doi: 10.1029/JC090iC03p05045
50
Hop H. Mundy C. J. Gosselin M. Rossnagel A. L. Barber D. G. (2011). Zooplankton boom and ice amphipod bust below melting sea ice in the Amundsen Gulf, Arctic Canada. Polar Biol.34, 1947–1958. doi: 10.1007/s00300-011-0991-4
51
Hu Y. B. Wang F. Boone W. Barber D. Rysgaard S. (2018). Assessment and improvement of the sea ice processing for dissolved inorganic carbon analysis. Limnol. Oceanogr.: Methods16, 83–91. doi: 10.1002/lom3.10229
52
IPCC (2019). IPCC special report on the ocean and cryosphere in a changing climate. PörtnerH.-O.RobertsD. C.Masson-DelmotteV.ZhaiP.TignorM.PoloczanskaE.et al (eds.). (Cambridge, UK and New York, NY, USA: Cambridge University Press), 755 pp. doi: 10.1017/9781009157964
53
Järvinen O. Leppäranta M. (2011). Transmission of solar radiation through the snow cover on floating ice. J. Glaciol.57, 861–870. doi: 10.3189/002214311798043843
54
Kaartokallio H. Søgaard D. Norman L. Rysgaard S. Tison J.-L. Delille B. et al . (2013). Short-term variability in bacterial abundance, cell properties, and incorporation of leucine and thymidine in subarctic sea ice. Aquat. Microb. Ecol.71, 57–73. doi: 10.3354/ame01667
55
Kanna N. Lannuzel D. van der Merwe P. Nishioka J. (2020). Size fractionation and bioavailability of iron released from melting sea ice in a subpolar marginal sea. Mar. Chem.221, 1–8. doi: 10.1016/j.marchem.2020.103774
56
Kanna N. Toyota T. Nishioka J. (2014). Iron and macro-nutrient concentrations in sea ice and their impact on the nutritional status of surface waters in the southern Okhotsk Sea. Prog. Oceanogr.126, 44–57. doi: 10.1016/j.pocean.2014.04.012
57
Kauko H. M. Olsen L. M. Duarte P. Peeken I. Granskog M. A. Johnsen G. et al . (2018). Algal colonization of young Arctic sea ice in spring. Front. Mar. Sci.5. doi: 10.3389/fmars.2018.00199
58
Kirst G. (1990). Salinity tolerance of eukaryotic marine algae. Annu. Rev. Plant Biol.41, 21–53. doi: 10.1146/annurev.pp.41.060190.000321
59
Kottmeier S. T. Sullivan C. W. (1988). Sea ice microbial communities (SIMCO). Polar Biol.8, 293–304. doi: 10.1007/BF00263178
60
Kvernvik A. C. Hoppe C. J. M. Greenacre M. Verbiest S. Wiktor J. M. Gabrielsen T. M. et al . (2021). Arctic sea ice algae differ markedly from phytoplankton in their ecophysiological characteristics. Mar. Ecol. Prog. Ser.666, 31–55. doi: 10.3354/meps13675
61
Lange B. A. Flores H. Michel C. Beckers J. F. Bublitz A. Casey J. A. et al . (2017). Pan-Arctic sea ice-algal chl a biomass and suitable habitat are largely underestimated for multiyear ice. Glob. Change Biol.23, 4581–4597. doi: 10.1111/gcb.13742
62
Lange B. A. Michel C. Beckers J. F. Casey J. A. Flores H. Hatam I. et al . (2015). Comparing springtime ice-algal chlorophyll a and physical properties of multi-year and first-year sea ice from the Lincoln Sea. PloS One10, e0122418. doi: 10.1371/journal.pone.0122418
63
Larsen E. Lyså A. Rubensdotter L. Farnsworth W. R. Jensen M. Nadeau M. J. et al . (2018). Lateglacial and Holocene glacier activity in the Van Mijenfjorden area, western Svalbard. Arktos4, 1–21. doi: 10.1007/s41063-018-0042-2
64
Lee S. H. McRoy C. P. Joo H. M. Gradinger R. Cui X. Yun M. S. et al . (2011). Holes in progressively thinning Arctic sea ice lead to new ice algae habitat. Oceanography24, 302–308. doi: 10.5670/oceanog.2011.81
65
Legendre L. Ackley S. Dieckmann G. Gulliksen B. (1992a). Ecology of sea ice biota. part 2. Global Significance. Polar Biol.12, 429–444. doi: 10.1007/BF00243114
66
Legendre L. Demers S. Yentsch C. M. Yentsch C. S. (1983). The 14C method: Patterns of dark CO2 fixation and DCMU correction to replace the dark bottle. Limnol. Oceanogr.28, 996–1003. doi: 10.4319/lo.1983.28.5.0996
67
Legendre L. Martineau M.-J. Therriault J.-C. Demers S. (1992b). Chlorophyll a biomass and growth of sea-ice microalgae along a salinity gradient (southeastern Hudson Bay, Canadian Arctic). Polar Biol.12, 445–453. doi: 10.1007/BF00243115
68
Leu E. Brown T. A. Graeve M. Wiktor J. Hoppe C. J. Chierici M. et al . (2020). Spatial and temporal variability of ice algal trophic markers—with recommendations about their application. J. Mar. Sci. Eng.8, 676. doi: 10.3390/jmse8090676
69
Leu E. Mundy C. Assmy P. Campbell K. Gabrielsen T. Gosselin M. et al . (2015). Arctic spring awakening–Steering principles behind the phenology of vernal ice algal blooms. Prog. Oceanogr.139, 151–170. doi: 10.1016/j.pocean.2015.07.012
70
Leu E. Wiktor J. Søreide J. Berge J. Falk-Petersen S. (2010). Increased irradiance reduces food quality of sea ice algae. Mar. Ecol. Prog. Ser.411, 49–60. doi: 10.3354/meps08647
71
Lomas M. W. Glibert P. M. (2000). Comparisons of nitrate uptake, storage, and reduction in marine diatoms and flagellates. J. Phycol.36, 903–913. doi: 10.1046/j.1529-8817.2000.99029.x
72
McGovern M. Borgå K. Heimstad E. Ruus A. Christensen G. Evenset A. (2022). Small Arctic rivers transport legacy contaminants from thawing catchments to coastal areas in Kongsfjorden, Svalbard. Environ. Pollut.304, 1–7. doi: 10.1016/j.envpol.2022.119191
73
McGovern M. Pavlov A. K. Deininger A. Granskog M. A. Leu E. Søreide J. E. et al . (2020). Terrestrial inputs drive seasonality in organic matter and nutrient biogeochemistry in a high Arctic fjord system (Isfjorden, Svalbard). Front. Mar. Sci.7. doi: 10.3389/fmars.2020.542563
74
McMinn A. Hegseth E. (2004). Quantum yield and photosynthetic parameters of marine microalgae from the southern Arctic Ocean, Svalbard. J. Mar. Biol. Assoc. United Kingdom84, 865–871. doi: 10.1017/S0025315404010112h
75
Medlin L. K. Hasle G. R. (1990). Some Nitzschia and related diatom species from fast ice samples in the Arctic and Antarctic. Polar Biol.10, 451–479. doi: 10.1007/BF00233693
76
Meiners K. M. Vancoppenolle M. Carnat G. Castellani G. Delille B. Delille D. et al . (2018). Chlorophyll-a in Antarctic landfast sea ice: A first synthesis of historical ice core data. J. Geophys. Res.: Oceans123, 8444–8459. doi: 10.1029/2018JC014245
77
Meire L. Meire P. Struyf E. Krawczyk D. Arendt K. Yde J. et al . (2016). High export of dissolved silica from the Greenland Ice Sheet. Geophys. Res. Lett.43, 9173–9182. doi: 10.1002/2016GL070191
78
MET . (2021). Norway. Available at: https://cryo.met.no/archive/ice-service/icecharts/quicklooks/ (Accessed 19 April 2022).
79
Mikkelsen D. M. Rysgaard S. Glud R. N. (2008). Microalgal composition and primary production in Arctic sea ice: a seasonal study from Kobbefjord (Kangerluarsunnguaq), West Greenland. Mar. Ecol. Prog. Ser.368, 65–74. doi: 10.3354/meps07627
80
Mikkelsen D. M. Witkowski A. (2010). Melting sea ice for taxonomic analysis: a comparison of four melting procedures. Polar Res.29, 451–454. doi: 10.3402/polar.v29i3.6088
81
Mundy C. J. Gosselin M. Ehn J. K. Belzile C. Poulin M. Alou E. et al . (2011). Characteristics of two distinct high-light acclimated algal communities during advanced stages of sea ice melt. Polar Biol.34, 1869–1886. doi: 10.1007/s00300-011-0998-x
82
Murray T. Luckman A. Strozzi T. Nuttall A.-M. (2003). The initiation of glacier surging at Fridtjovbreen, Svalbard. Ann. Glaciol.36, 110–116. doi: 10.3189/172756403781816275
83
Nelson D. M. Ahern J. A. Herlihy L. J. (1991). Cycling of biogenic silica within the upper water column of the Ross Sea. Mar. Chem.35, 461–476. doi: 10.1016/S0304-4203(09)90037-8
84
Nicolaus M. Gerland S. Hudson S. R. Hanson S. Haapala J. Perovich D. K. (2010). Seasonality of spectral albedo and transmittance as observed in the Arctic Transpolar Drift in 2007. J. Geophys. Res.: Oceans115, 1–21. doi: 10.1029/2009JC006074
85
Nicolaus M. Katlein C. (2013). Mapping radiation transfer through sea ice using a remotely operated vehicle (ROV). Cryosphere7, 763–777. doi: 10.5194/tc-7-763-2013
86
Niemi A. Michel C. (2015). Temporal and spatial variability in sea-ice carbon: nitrogen ratios on Canadian Arctic shelves. Elem. Sci. Anth.3, 1–12. doi: 10.12952/journal.elementa.000078
87
Pankowski A. McMinn A. (2008). Ferredoxin and flavodoxin in eastern Antarctica pack ice. Polar Biol.31, 1153–1165. doi: 10.1007/s00300-008-0451-y
88
Parsons T. R. Maita Y. Lalli C. M. (1984) A manual of chemical & biological methods for seawater analysis (New York, NY: Pergamon Press, Elsevier) (Accessed First ed).
89
Pavlova O. Gerland S. Hop H. (2019). “Changes in sea-ice extent and thickness in Kongsfjorden, Svalbard, (2003–2016),” in The ecosystem of kongsfjorden, svalbard (Cham: Springer Nature), 105–136. doi: 10.1007/978-3-319-46425-1_4
90
Piiparinen J. Kuosa H. Rintala J.-M. (2010). Winter-time ecology in the Bothnian Bay, Baltic Sea: nutrients and algae in fast ice. Polar Biol.33, 1445–1461. doi: 10.1007/s00300-010-0771-6
91
Platt T. Gallegos C. Harrison W. G. (1980). Photoinhibition of photosynthesis in natural assemblages of marine phytoplankton. J. Mar. Res.38, 687–701.
92
Pogojeva M. Polukhin A. Makkaveev P. Staalstrøm A. Berezina A. Yakushev E. (2022). Arctic inshore biogeochemical regime influenced by coastal runoff and glacial melting (case study for the Templefjord, Spitsbergen). Geosciences12, 1–29. doi: 10.3390/geosciences12010044
93
Poulin M. Daugbjerg N. Gradinger R. Ilyash L. Ratkova T. von Quillfeldt C. (2011). The pan-Arctic biodiversity of marine pelagic and sea-ice unicellular eukaryotes: a first-attempt assessment. Mar. Biodivers.41, 13–28. doi: 10.1007/s12526-010-0058-8
94
Poulin M. Underwood G. J. Michel C. (2014). Sub-ice colonial Melosira arctica in Arctic first-year ice. Diatom Res.29, 213–221. doi: 10.1080/0269249X.2013.877085
95
Provost C. Sennéchael N. Miguet J. Itkin P. Rösel A. Koenig Z. et al . (2017). Observations of flooding and snow-ice formation in a thinner Arctic sea-ice regime during the N-ICE2015 campaign: Influence of basal ice melt and storms. J. Geophys. Res.: Oceans122, 7115–7134. doi: 10.1002/2016JC012011
96
Rabault J. Sutherland G. Ward B. Christensen K. H. Halsne T. Jensen A. (2016). Measurements of waves in landfast ice using inertial motion units. IEEE Trans. Geosci54, 6399–6408. doi: 10.1109/TGRS.2016.2584182
97
Ralph P. J. Ryan K. G. Martin A. Fenton G. (2007). Melting out of sea ice causes greater photosynthetic stress in algae than freezing in. J. Phycol.43, 948–956. doi: 10.1111/j.1529-8817.2007.00382.x
98
Reigstad M. Wexels Riser C. Wassmann P. Ratkova T. (2008). Vertical export of particulate organic carbon: Attenuation, composition and loss rates in the northern Barents Sea. Deep Sea Res. Part II Top. Stud. Oceanogr.55, 2308–2319. doi: 10.1016/j.dsr2.2008.05.007
99
Riedel A. Michel C. Gosselin M. LeBlanc B. (2008). Winter–spring dynamics in sea-ice carbon cycling in the coastal Arctic Ocean. J. Mar. Syst.74, 918–932. doi: 10.1016/j.jmarsys.2008.01.003
100
Rintala J.-M. Piiparinen J. Blomster J. Majaneva M. Müller S. Uusikivi J. et al . (2014). Fast direct melting of brackish sea-ice samples results in biologically more accurate results than slow buffered melting. Polar Biol.37, 1811–1822. doi: 10.1007/s00300-014-1563-1
101
Ryan K. Ralph P. McMinn A. (2004). Acclimation of Antarctic bottom-ice algal communities to lowered salinities during melting. Polar Biol.27, 679–686. doi: 10.1007/s00300-004-0636-y
102
Seklima . (2021a). Svalbard lufthavn (Norway: The Norwegian Meteorological Institute). Available at: https://seklima.met.no (Accessed 8 May 2022).
103
Seklima . (2021b). Sveagruva (Norway: The Norwegian Meteorological Institute). Available at: https://seklima.met.no (Accessed 8 May 2022).
104
Seklima . (2021c). Svalbard lufthavn (Norway: The Norwegian Meteorological Institute). Available at: https://seklima.met.no (Accessed 23 August 2023).
105
Skarðhamar J. Svendsen H. (2010). Short-term hydrographic variability in a stratified Arctic fjord. Geol. Soc London Spec. Publ.344, 51–60. doi: 10.1144/SP344.5
106
Smith M. M. von Albedyll L. Raphael I. A. Lange B. A. Matero I. Salganik E. et al . (2022). Quantifying false bottoms and under-ice meltwater layers beneath Arctic summer sea ice with fine-scale observations. Elem. Sci. Anth.10, 1–19. doi: 10.1525/elementa.2021.000116
107
Søgaard D. H. Hansen P. J. Rysgaard S. Glud R. N. (2011). Growth limitation of three Arctic sea ice algal species: effects of salinity, pH, and inorganic carbon availability. Polar Biol.34, 1157–1165. doi: 10.1007/s00300-011-0976-3
108
Søgaard D. H. Kristensen M. Rysgaard S. Glud R. N. Hansen P. J. Hilligsøe K. M. (2010). Autotrophic and heterotrophic activity in Arctic first-year sea ice: seasonal study from Malene Bight, SW Greenland. Mar. Ecol. Prog. Ser.419, 31–45. doi: 10.3354/meps08845
109
Strickland J. D. H. Parsons T. R. (1972). A practical handbook of seawater analysis. 2nd ed. (Ottawa, ON: Fisheries Research Board of Canada), 310.
110
Sutherland G. Rabault J. (2016). Observations of wave dispersion and attenuation in landfast ice. J. Geophys. Res.: Oceans121, 1984–1997. doi: 10.1002/2015JC011446
111
Svendsen H. Beszczynska-Møller A. Hagen J. O. Lefauconnier B. Tverberg V. Gerland S. et al . (2002). The physical environment of Kongsfjorden–Krossfjorden, an Arctic fjord system in Svalbard. Polar Res.21, 133–166. doi: 10.3402/polar.v21i1.6479
112
Taguchi S. (1976). Relationship between photosynthesis and cell size of marine diatoms. J. Phycol.12, 185–189. doi: 10.1111/j.1529-8817.1976.tb00499.x
113
Tamelander T. Reigstad M. Hop H. Ratkova T. (2009). Ice algal assemblages and vertical export of organic matter from sea ice in the Barents Sea and Nansen Basin (Arctic Ocean). Polar Biol.32, 1261–1273. doi: 10.1007/s00300-009-0622-5
114
Tedesco L. Vichi M. Scoccimarro E. (2019). Sea-ice algal phenology in a warmer Arctic. Sci. Adv.5, 1–12. doi: 10.1126/sciadv.aav4830
115
Thomas D. N. (2017). Sea ice. 3rd ed. (Hoboken NJ: Wiley-Blackwell), 664. doi: 10.1002/9781118778371
116
Tréguer P. J. Rocha C. L. D. L. (2013). The world ocean silica cycle. Annu. Rev. Mar. Sci.5, 477–501. doi: 10.1146/annurev-marine-121211-172346
117
Urbański J. A. Litwicka D. (2021). Accelerated decline of Svalbard coasts fast ice as a result of climate change. Cryosphere.2021, 1–15. doi: 10.5194/tc-2021-21
118
Van Leeuwe M. A. Tedesco L. Arrigo K. R. Assmy P. Campbell K. Meiners K. M. et al . (2018). Microalgal community structure and primary production in Arctic and Antarctic sea ice: A synthesis. Elem. Sci. Anth.6, 1–25. doi: 10.1525/elementa.267
119
Vargo G. Fanning K. Heil C. Bell L. (1986). Growth rates and the salinity response of an Antarctic ice microflora community. Polar Biol.5, 241–247. doi: 10.1007/BF00446092
120
Vonnahme T. R. Persson E. Dietrich U. Hejdukova E. Dybwad C. Elster J. et al . (2021). Early spring subglacial discharge plumes fuel under-ice primary production at a Svalbard tidewater glacier. Cryosphere15, 2083–2107. doi: 10.5194/tc-15-2083-2021
121
von Quillfeldt C. H. (1996). Ice algae and phytoplankton in north Norwegian and Arctic waters: species composition, succession, and distribution. PhD thesis (Tromsø: University of Tromsø).
122
von Quillfeldt C. H. Hegseth E. N. Sakshaug E. Johnsen G. Syvertsen E. E. (2009). “Ice algae,” in Ecosystem barents sea. Eds. SakshaugE.KovacsG.J. &K. M. (Trondheim: Tapir Academic Press), 285–302.
123
Wassmann P. Duarte C. M. Agusti S. Sejr M. K. (2011). Footprints of climate change in the Arctic marine ecosystem. Glob. Change Biol.17, 1235–1249. doi: 10.1111/j.1365-2486.2010.02311.x
124
Weeks W. F. Ackley S. F. (1982). “The growth, structure, and properties of sea ice,” in The geophysics of sea ice (Boston, MA: Springer), 9–164. doi: 10.1007/978-1-4899-5352-0_2
125
Yan D. Yoshida K. Nishioka J. Ito M. Toyota T. Suzuki K. (2020). Response to sea ice melt indicates high seeding potential of the ice diatom Thalassiosira to spring phytoplankton blooms: a laboratory study on an ice algal community from the Sea of Okhotsk. Front. Mar. Sci.7. doi: 10.3389/fmars.2020.00613
126
Yoshida K. Hattori H. Toyota T. McMinn A. Suzuki K. (2020). Differences in diversity and photoprotection capability between ice algae and under-ice phytoplankton in Saroma-Ko Lagoon, Japan: a comparative taxonomic diatom analysis with microscopy and DNA barcoding. Polar Biol.43, 1873–1885. doi: 10.1007/s00300-020-02751-x
127
Yun M. S. Whitledge T. E. Kong M. Lee S. H. (2014). Low primary production in the Chukchi Sea shelf 2009. Cont. Shelf Res.76, 1–11. doi: 10.1016/j.csr.2014.01.001
128
Yun M. Whitledge T. Stockwell D. Son S. Lee J. Park J. et al . (2016). Primary production in the Chukchi Sea with potential effects of freshwater content. Biogeosciences13, 737–749. doi: 10.5194/bg-13-737-2016
129
Zhang Q. Gradinger R. Spindler M. (1999). Experimental study on the effect of salinity on growth rates of Arctic-sea-ice algae from the Greenland Sea. Boreal Environ. Res.4, 1–8.
Summary
Keywords
hypoosmotic stress, photoacclimation, primary productivity, sea ice algae, Svalbard fjords, Arctic coastal waters, freshwater, climate change
Citation
Forgereau ZL, Lange BA, Gradinger R, Assmy P, Osanen JE, García LM, Søreide JE, Granskog MA, Leu E and Campbell K (2023) Photophysiological responses of bottom sea-ice algae to fjord dynamics and rapid freshening. Front. Mar. Sci. 10:1221639. doi: 10.3389/fmars.2023.1221639
Received
12 May 2023
Accepted
26 October 2023
Published
13 December 2023
Volume
10 - 2023
Edited by
Yanpei Zhuang, Jimei University, China
Reviewed by
Kazuhiro Yoshida, Saga University, Japan
Marius Nils Müller, Macau University of Science and Technology, Macau SAR, China
Pat Wongpan, University of Tasmania, Australia
Updates
Copyright
© 2023 Forgereau, Lange, Gradinger, Assmy, Osanen, García, Søreide, Granskog, Leu and Campbell.
This is an open-access article distributed under the terms of the Creative Commons Attribution License (CC BY). The use, distribution or reproduction in other forums is permitted, provided the original author(s) and the copyright owner(s) are credited and that the original publication in this journal is cited, in accordance with accepted academic practice. No use, distribution or reproduction is permitted which does not comply with these terms.
*Correspondence: Zoé L. Forgereau, zoe.figaro@orange.fr; Karley Campbell, karley.campbell@uit.no
Disclaimer
All claims expressed in this article are solely those of the authors and do not necessarily represent those of their affiliated organizations, or those of the publisher, the editors and the reviewers. Any product that may be evaluated in this article or claim that may be made by its manufacturer is not guaranteed or endorsed by the publisher.