 Tommaso Paoloni1*
 Babette Hoogakker1*
 Alba Navarro Rodriguez1
 Ryan Pereira1
 Erin L. McClymont2
 Luigi Jovane3
 Clayton Magill1
- 1The Lyell Centre, Heriot-Watt University, Edinburgh, United Kingdom
- 2Department of Geography, Durham University, Durham, United Kingdom
- 3Departamento de Oceanografia Física, Quimica e Geologica, São Paulo, Brazil
Introduction: Foraminiferal shells are extensively used to reconstruct the marine environment in the geological past. The foraminifera test-bound organic material (FBOM), sheltered by the test from potential diagenetic alteration and contamination, has great feasibility to improve our understanding of carbon and nitrogen cycling. The FBOM δ13C has been proposed as a proxy for reconstructing past environmental conditions. However, to fully exploit the proxy potential of FBOM, its molecular composition and the influence of the latter on the FBOM δ13C need to be assessed.
Method: Here we use a novel combination of gas chromatography-mass spectrometry, flame ionization detection (GC-MS/FID) and liquid chromatography organic carbon and nitrogen detection (LC-OCD/ OND) analyses to study the FBOM chemical composition.
Results: Our results indicate that polysaccharides and proteins dominate FBOM, as proposed by earlier studies, with no evidence of detectable lipids (alkyl lipids, trimethylsilyl ethers of fatty alcohols, trimethylsilyl esters of fatty acids and steranes derivatives were targeted).
Discussion: Previous studies suggested that FBOM δ13C may be used to reconstruct past atmospheric CO2 concentrations. However, our results indicate that the use of FBOM δ13C to reconstruct CO2 carries an approximate uncertainty of ±21 ppm for past atmospheric CO2 abundance. We suggest that FBOM δ13C can be used as a novel proxy to reconstruct particulate organic material (POM) δ13C. This is also supported by the recently confirmed minor fractionation between POM and FBOM δ13C.
1 Introduction
The calcite making up foraminifera hard shells (called the ‘test’) has been extensively used to study biogeochemical cycling in the oceans. The carbon isotopic composition of foraminifera calcite tests (δ13C) has been widely applied to infer changes in carbon cycling between the oceans and land/atmosphere reservoirs, as well as ocean circulation (Duplessy et al., 1984; Mackensen and Bickert, 1999; Marchitto and Broecker, 2006; Oliver et al., 2010). Foraminifera grow in size by adding consecutive chambers, that are connected to previous chambers through the foramen. Calcification of these chambers takes place through precipitation of calcite on the inner and outer side of a thin organic sheet, that has been called organic primary envelope, primary organic lining, anlage, or primary organic membrane (e.g., Spero, 1988; Sabbatini et al., 2014). This organic template is not technically a membrane, and therefore we will refer to it as primary organic sheet (POS), following the suggestion of Erez (2003) and the recommendation of Nooijer et al. (2014). With every new chamber added, a layer of calcite is also precipitated upon previous chambers, and the entire test is then covered by an outer organic layer (Sabbatini et al., 2014). The POS and much of the outer organic layer, excluding the last chamber, will be sheltered by the calcite test, giving them a chance of being preserved in fossil foraminifera tests. We assume that the inner organic layer, which separates the foraminifera chambers from the cytoplasm, has a lower preservation potential since it is not entirely protected by the calcium carbonate test (Figure 1).
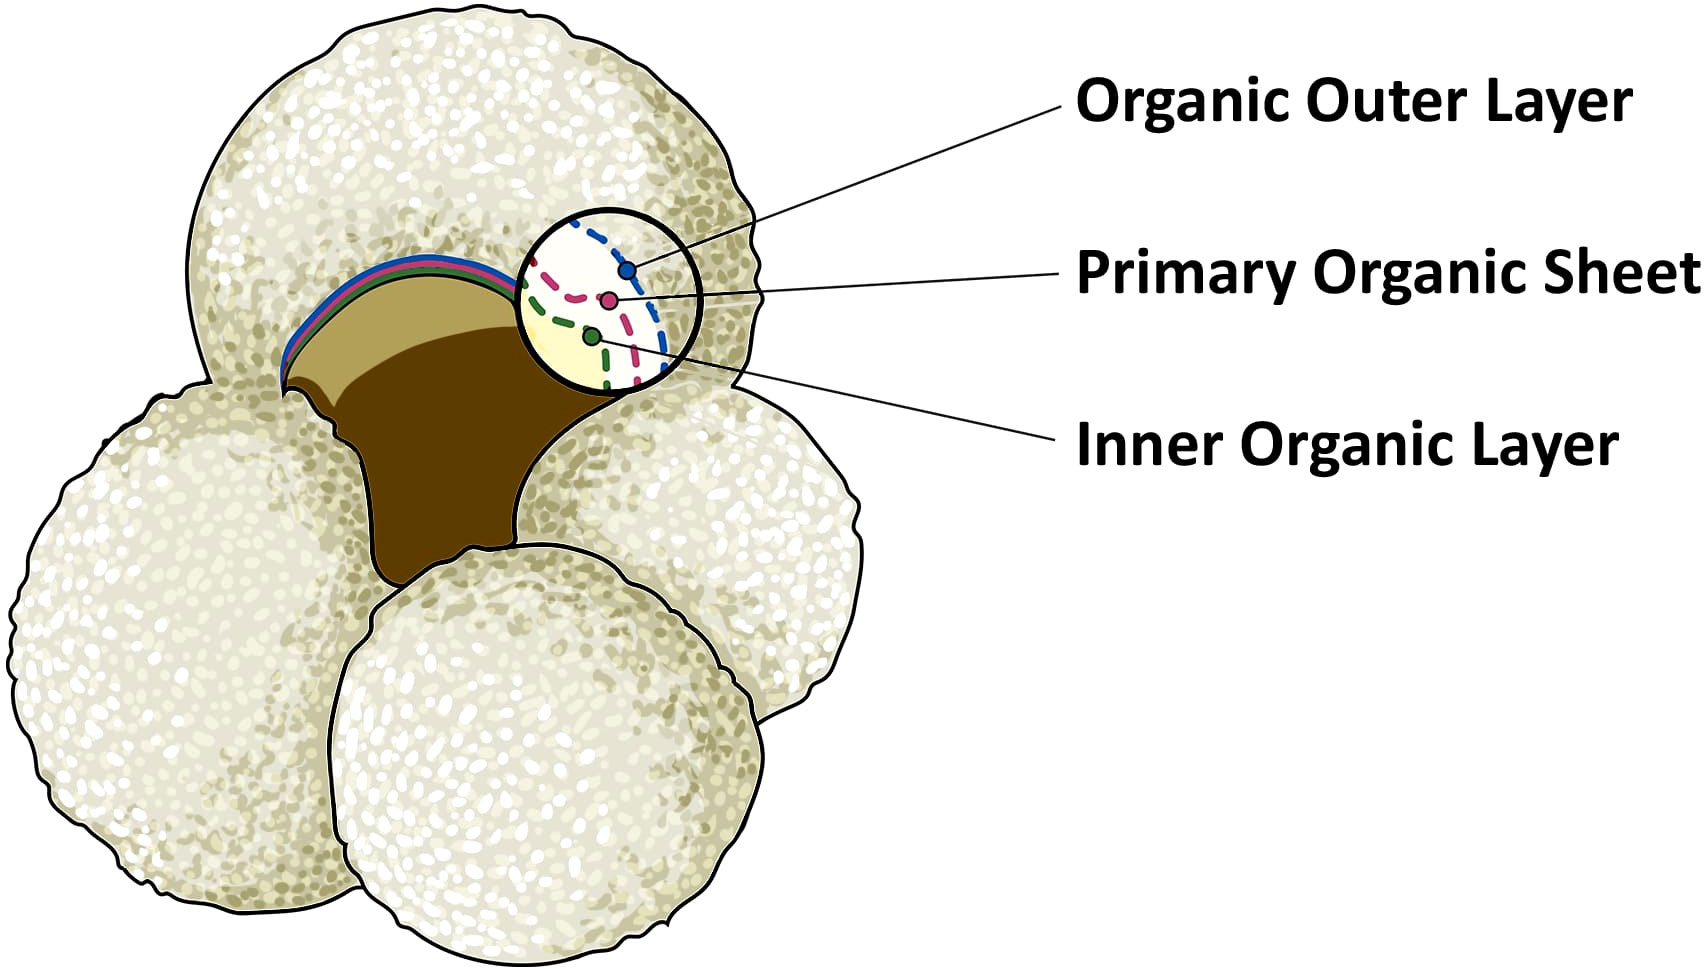
Figure 1 Illustration of planktonic foraminifera Globigerina bulloides. The magnified inset shows the foraminifera test composition of the last chamber. The yellow area represents the inner and empty area of a fossil foraminifera. This is covered by the inner organic layer, represented by the dotted green line. The organic outer layer is indicated in blue. Finally, the primary organic sheet, in red, is the thin layer which acts as template for the nucleation and the precipitation of CaCO3, represented by the white area. In bilaminar planktonic foraminifera, calcification takes place on both sides of the primary organic sheet.
Foraminifera test-bound organic material (FBOM), represented by the POS and the outer organic layer, is not widely utilized for molecular organic geochemical analysis. Current applications of FBOM include the analysis of nitrogen isotopes to study the past nitrogen cycle (Uhle et al., 1999; Ren et al., 2009; Ren et al., 2012; Ren et al., 2017; Smart et al., 2020; Auderset et al., 2022). A few studies have looked at the possibility of FBOM δ13C values as a proxy to reconstruct atmospheric CO2 concentrations (Stott, 1992; Maslin et al., 1996; Swart et al., 2021). All these studies have in common that FBOM δ13C appears 4.5 to 7 ‰ 13C-depleted (more negative δ13C values) compared to that of regional particulate organic matter (POM), contrary to trophic inferences (DeNiro and Epstein, 1978; McCutchan et al., 2003). Swart et al. (2021) argue that their depleted FBOM δ13C values compared with that of POM is due to a substantial amount of lipids contained within planktonic foraminifera organic matter. This explanation contrasts with other studies suggesting that FBOM is predominantly composed of polysaccharides and proteins (King and Hare, 1972; Hottinger and Dreher, 1974; Robbins and Brew, 1990; Langer, 1992; Weiner and Addadi, 1997; Fhlaithearta et al., 2013; Sabbatini et al., 2014; Tyszka et al., 2021).
To assess whether FBOM has a significant lipid content, we analyzed its composition through gas and liquid chromatography. Gas chromatography–flame ionization detection (GC-FID) is used for separating and analyzing compounds that can be vaporized without decomposition and allows detection of trace amounts of organic carbon containing compounds (Wang et al., 1994; Tvrzická et al., 2002). Gas chromatography–mass spectrometry (GC-MS) is an analytical technique used to identify organic substances within complex and heterogenous sample mixtures (Christie, 1998; Mondello et al., 2004). Liquid chromatography with organic carbon and nitrogen detection (LC-OCD/OND) is a separation analytical technique for the identification and quantification of natural organic matter constituents in aquatic environments and water-soluble synthetic organic matter in waters (Huber et al., 2011; Villacorte et al., 2015).
2 Materials and methods
2.1 Material
The sample material used in this study was collected from Ocean Drilling Program (ODP) Site 1088C (Gersonde et al., 1999) (Figure 2). The samples were obtained from 0-1 (1.57 ka) and 3-4 cm depth (2.93 ka), as represented in Table 1. The age model for ODP Site 1088 is based on oxygen isotope (δ18O) stratigraphy, aligning the planktonic foraminifera species Globigerina bulloides δ18O record of Hoogakker et al. (2022) to that of the nearby ODP Site 1090 of Shuttleworth et al. (2021) (Appendix Figure S1). For the δ18O analysis ~40 specimens of G. bulloides were picked from the >300 μm size fraction and analyzed using a VG Prism (isotope ratio mass spectrometer) at the Department of Earth Sciences (University of Oxford). Calibration was to Vienna Pee Dee Belemnite via NBS19 standards (precision 0.07 ‰).
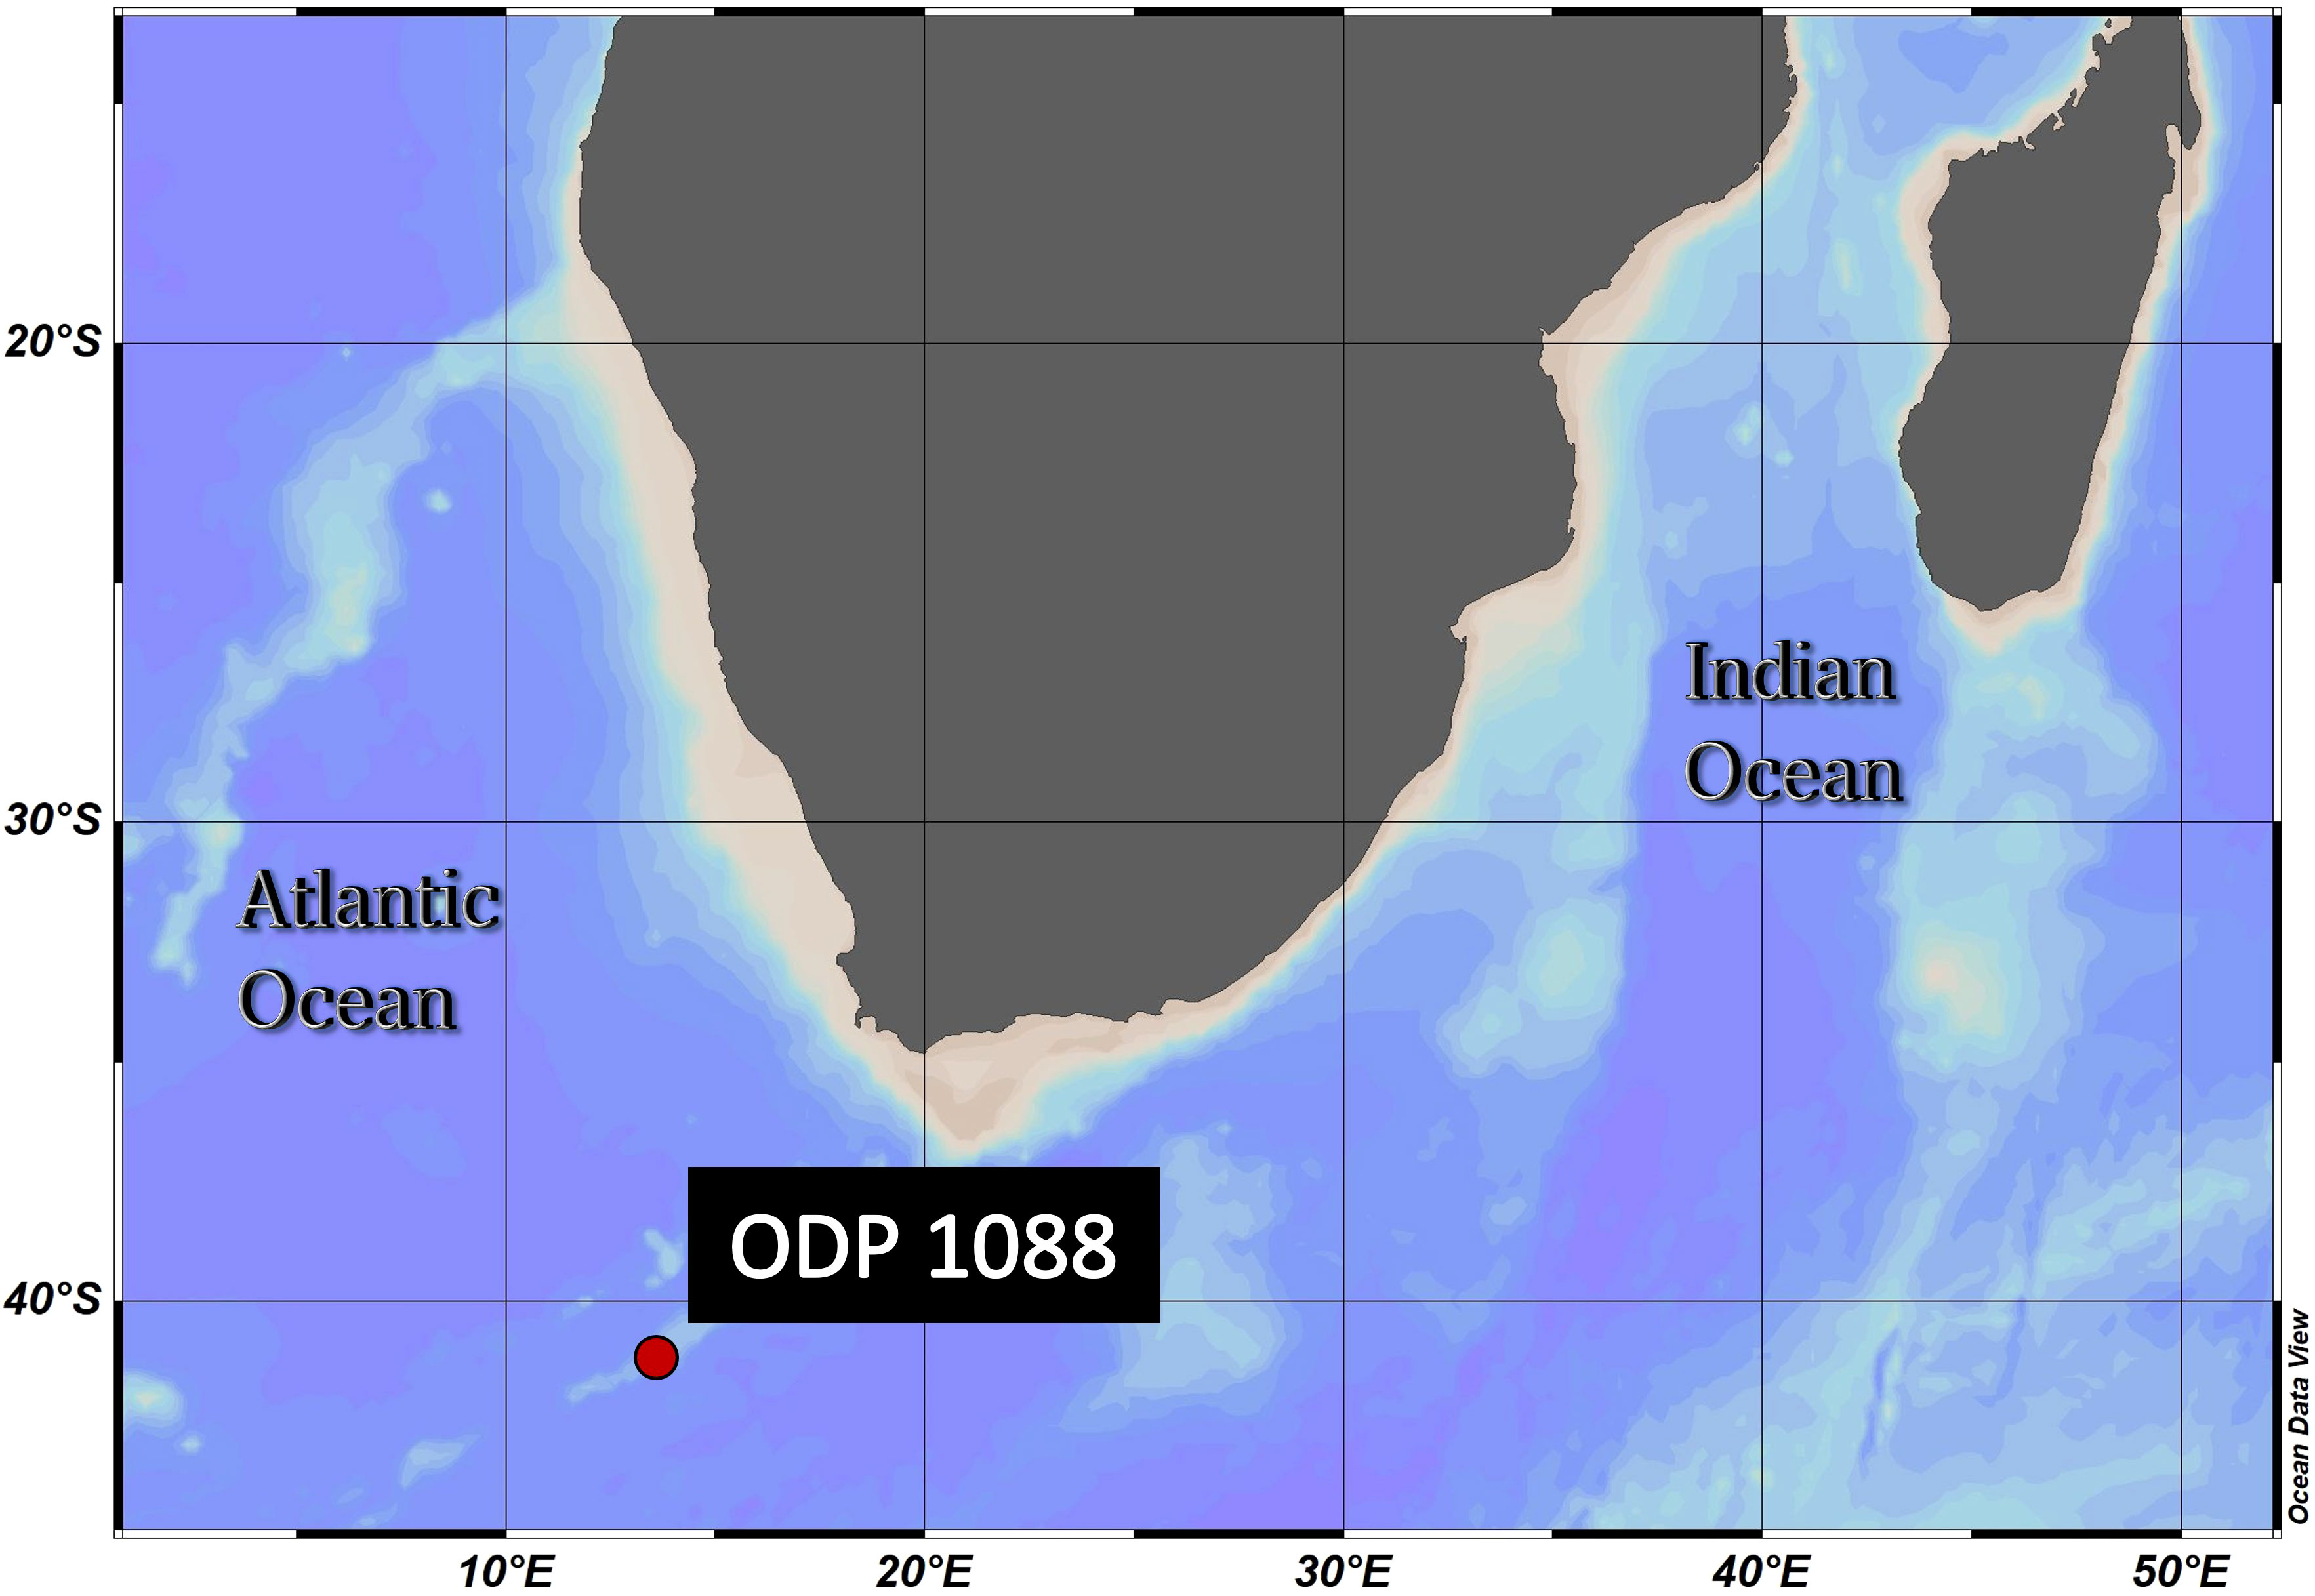
Figure 2 Geographical position of ODP Site 1088C: 41.2°S, 13.6°E, Agulhas Ridge (South-East Atlantic). This ridge extends from the northern tip of the Meteor Rise and terminates abruptly at 40°S, 15°E. The seafloor depth is 2082 meters below the sea surface. ODV (Schlitzer, R., Ocean Data View, https://odv.awi.de, 2018).
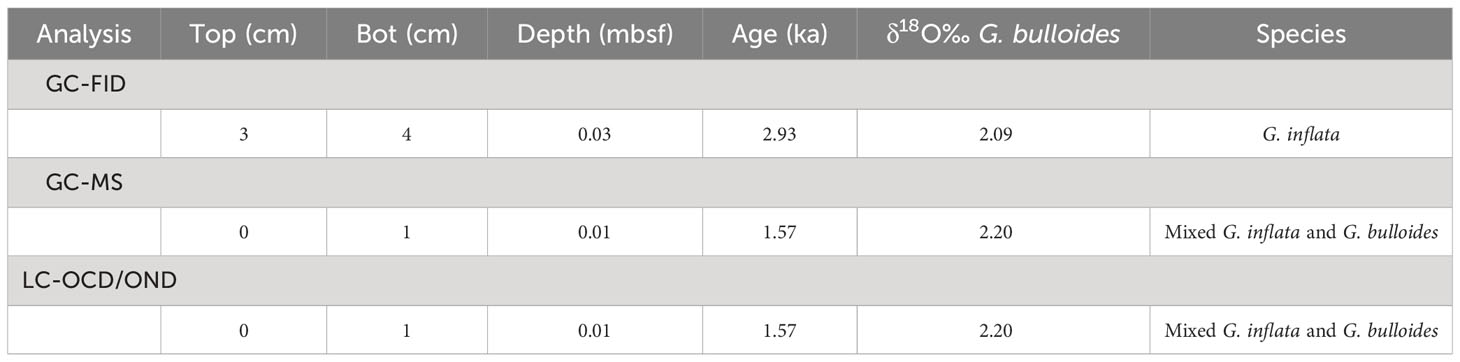
Table 1 Details of sediment sample used from Site 1088, Leg 177, Hole C Section 1, Core 1.
The organic carbon content of fossil foraminifera is very low, with FBOM content ranging between 0.04% and 0.1% (Stott, 1992; Hoogakker et al., 2022). To allow meaningful analyses, we collected a minimum of 50 mg material per sample, following the example of Hoogakker et al. (2022).
2.2 Foraminifera cleaning procedure
Bulk sediment samples were sieved over a 63 μm sieve using distilled water. Sieved samples were dried in an oven at a maximum temperature of 40°C and individual planktonic foraminifera species were picked under a binocular microscope using a picking brush. Foraminifera species picked include Globorotalia inflata and G. bulloides.
For the steps that followed the picking, all glassware used was combusted in an oven at 450°C for at least 4 hours. Before preparing the samples for both GC and LC analyses, samples were cleaned using the following steps:
1) Planktonic foraminifera were gently crushed between two glass plates.
2) Crushed samples were transferred to 33 ml glass test-tubes. 2 ml of 18.2 MΩ•cm deionized water that passed through a UV oxidizer (DI Water), was added, and the tubes were placed in an ultrasonic bath (room temperature) for 30 seconds to disaggregate clays and other small, adhered particles. Then, crushed foraminiferal shells were allowed to settle at the bottom of the test-tube, and the supernatant fraction containing the disaggregated clays and other small particles, was pipetted out. This procedure was repeated until there were no more visible dispersed particles (a minimum of four repetitions were needed) (Ren et al., 2009; Hoogakker et al., 2022).
3) Following the ultrasonication step, a bleach treatment was executed to oxidize the remaining organic material attached to the foraminifera tests and further reduce the chance of potential contamination. Samples were soaked in 20 ml of 12% sodium hypochlorite (NaOCl) for 4 hours and agitated for 30 seconds every half hour using an ultrasonic bath (under a fume hood). The planktonic foraminifera in our analyzed samples contain between 0.02% and 0.03% of organic carbon (C). Ren et al. (2009) show that in 5 to 10 mg of sample material there is 10 μmol/g organic N, which would represent 0.007 to 0.014% of the total sample. Taking into consideration the average Redfield ratio of C:N of 163:22, under the same circumstances, the amount of organic C would be around 0.04 to 0.08%. Our lower values suggest that all adhered organic C was removed (Hazell and Stocker, 1993). Following this treatment NaOCl was removed, and the samples were rinsed with DI Water six times. A final ultrasonic treatment was carried out before the last rinse to ensure all NaOCl was removed. Samples were oven dried at 40°C.
2.3 Gas chromatography
First, we carried out a GC-FID analysis on a monospecific sample of G. inflata to assess the presence of detectable non-halogenated organic carbon. As can be seen from the results section, lipids were not detected. To save time on picking samples, we subsequently used mixed species samples (G. bulloides and G. inflata) for our GC-MS analyses.
2.3.1 Total lipid extraction for GC-MS/FID analysis
Inorganic carbon was removed using a hydrochloric acid vapor treatment (HCl, ~37% [12 M]) executed at room temperature (Lorrain et al., 2003). HCl was added to the lower part of a glass desiccator, and the samples were left to interact with the acid for 48 hours. Thereafter, if there were still bubbles, indicating that the reaction was still in progress, samples were left in the desiccator for an additional 24 hours (i.e., 72 hr total). After each 24-hour interval, the samples were gently dried at 40°C for at least two hours and the acid inside the desiccator was replaced.
Total lipid extraction [TLE] was carried out using a modified Bligh-Dyer approach (Bligh and Dyer, 1959) by adding ~1 ml of 2:1 dichloromethane:methanol (DCM : MeOH) before ultrasonicating the samples for 30 seconds, stirring and transferring into new 2 ml vials. This process was repeated two times. Sparged, solvent-extracted DI Water (1 ml) was added to react with the more polar compounds. The solvent containing the extracted lipids was transferred into high recovery 2 ml vials using glass Pasteur pipettes. Sample extracts were left in a fume hood for 24 hours to air dry completely. Before initial analysis of TLE, the samples were derivatized with 25 μl N, O-Bistrifluoroacetamide (BSTFA) to detect more polar compounds viz. fatty alcohols and acids (Schummer et al., 2009).
2.3.2 GC-MS/FID analysis
10 μl of hexane was added and the samples were analyzed via a standalone Trace 1310 GC (GC-FID) fitted with a programmable temperature vaporizer (PTV) injector and 30 m DB-5SilMS low-bleed column and a Single Quadrupole (ISQ) MS coupled with a Trace 1300 GC (GC/MS). 1 μl injections were used for both the GC-FID and GC-MS analyses (Table 1). Injector temperature was 310°C and GC ovens were ramped from 60°C to 320°C at 6°C/min. The resulting chromatographs of the two experiments were analyzed using Chromeleon™ Chromatography Data System (CDS) Software. In our GC-MS analysis two samples were analyzed for m/z 85, whilst three samples were analyzed for m/z 103, m/z 117 and m/z 207 (Appendix, Figures S3-S6).
Gas chromatographic analyses were carried out to assess the lipid content of FBOM. FID provides maximum sensitivity and linearity for non-halogenated organic carbon detection, suitable for identifying compounds with very low concentrations (detection limit: 10 pg organic carbon on-column). In fact, the detection limit of FID is about 10 times better than the MS (Armbruster and Pry, 2008; Krupčík et al., 2015), this is because FID uses a flame rather than electron impact for ionization. In contrast, MS is ideal for compound identification (assuming the compounds are at high enough concentration to be identified). MS can focus on individual ion fragments (so-called ‘selected ion monitoring’ [SIM] mode), whereas FID turns all the organic carbon into CO2. MS ion fragments allow a strategic way to check the FID results because we can target diagnostic ions (for instance, m/z 85 is representative of the C6H13+ ion that derives from all alkyl lipids with six or more carbons in them). The use of target ions also increases the signal/noise ratio of selected peaks relative to using total ion counts (TIC, that sums all the ion fragments comprising a peak) or FID (because all the carbon is turned into undifferentiable CO2). With our GC-MS analysis we targeted ion m/z 85, m/z 103, m/z 117 and m/z 207 to assess the presence of alkyl lipids, trimethylsilyl (TMS) ethers of fatty alcohols, TMS esters of fatty acids and sterane derivatives, respectively, in the analyzed FBOM (Brocks and Hope, 2014). We targeted ion m/z 207 also to highlight the presence of column degradation derived siloxanes.
2.4 Liquid chromatography
Three new Holocene planktonic foraminifera samples were analyzed in triplicate using liquid chromatography. For the same reason as the GC-MS analyses we chose to use samples that were composed of the two dominant species G. inflata and G. bulloides. To assess whether different sample treatments could impact our liquid chromatography analyses, we split the samples into three:1- an untreated sample, 2 an ultrasonicated sample, and 3- an acidified sample.
2.4.1 Sample preparation for LC analysis
The three sample sets were initially crushed into a powder and 2 ml of DI Water was added before shaking them for 24 h at 160 revolutions per minute (rpm). The first sample did not undergo any further treatment. The second sample was ultrasonicated for 30 minutes. The third sample was dried, and acid vaporized, so that only the organic material remained, and then 2 ml of DI Water was added to the acidified sample. The third sample did not receive an ultrasonication. For the first two samples, the liquid fraction was used, whilst for the third sample both the liquid fraction and the decarbonated sample were used. 1 ml of DI Water was added to all three samples to make up the injection volume.
2.4.2 LC-OCD/OND analysis
Samples were filtered (0.45 µm, polyethersulfone) and analyzed for dissolved organic matter (DOM). This was done using liquid chromatography with an organic carbon detector (OCD), a UV detector (UVD) measuring at 254 nm, and an organic nitrogen detector (OND) (for details see Huber et al., 2011). The detection limit for organic carbon is 0.5-50 μg/L as specified in the operational manual. LC-OCD-UVD-OND, allows ~1 ml of sample volume to be injected onto a size exclusion column (SEC, HW50S, Tosoh, Japan, 2 ml/min) with a phosphate buffer (potassium dihydrogen phosphate 1.2 g/L plus 2 g/L di-sodium hydrogen phosphate x 2 H2O, pH 6.58). This sample is then separated into five “compound-group specific” natural organic matter (NOM) fractions according to molecular size. Larger molecules elute earlier as they are excluded from the column gel and small molecules elute later as they have a longer flow path through the column gel. NOM fractions include: (i) biopolymers (likely hydrophobic, high molecular weight, largely non-UV absorbing extracellular polymers (>20 kDa)), (ii) “humic substances” (HS) (lower molecular weight, UV absorbing (~1000 Da)), (iii) “building blocks” (lower molecular weight, UV absorbing HS (300-500 Da)), (iv) low molecular weight acids (LMW acids) (<350 Da), and (v) low molecular weight “neutrals” (LMW neutrals) (hydro- or amphiphilic, non-UV absorbing (<350Da)) as described by Huber et al. (2011). For the calibration of molecular weights, two Suwannee River standards III (Humic and Fulvic acids) from the International Humic Substance Society (IHSS) were used. Identification of HS in environmental samples is based on retention times and hydrophobicity (UV signal). For the calibration of the detectors and quantification of compounds, potassium hydrogenphthalate and potassium nitrate were used. All peaks were identified and quantified using DOC-Labor ChromCALC.
3 Results
3.1 Gas chromatography
GC-FID results of derivatized TLEs are shown in Figure 3, and GC-MS results are shown in Figure 4 instead. We also analyzed a paleo sample from the last glacial maximum, which we compared with our modern sample (Appendix Figure S2). Both Holocene (Figure 3) and glacial GC-FID chromatograms look similar to the blank indicating that no major lipid-related peaks were identified in the samples analyzed and suggesting that lipids do not tend to make up the FBOM at this location. In the GC-MS chromatograms (Figure 4) the only detectable peaks were the ones related to siloxanes derived from column degradation (diagnosed through m/z 207 traces and NIST library). The influence of siloxanes is also highlighted by the “plateau” shown in the GC-FID analysis after minute 45 and the isolated peak (~minute 9) (Figure 3). No peaks representing alkyl lipids (including alkanes, alcohols and fatty acids) (m/z 85), TMS ethers of hydroxyacids or alcohols (m/z 103), TMS esters of fatty acids (m/z 117) or sterane derivatives (m/z 207) were detected in our GC-MS analysis (Figure 4).
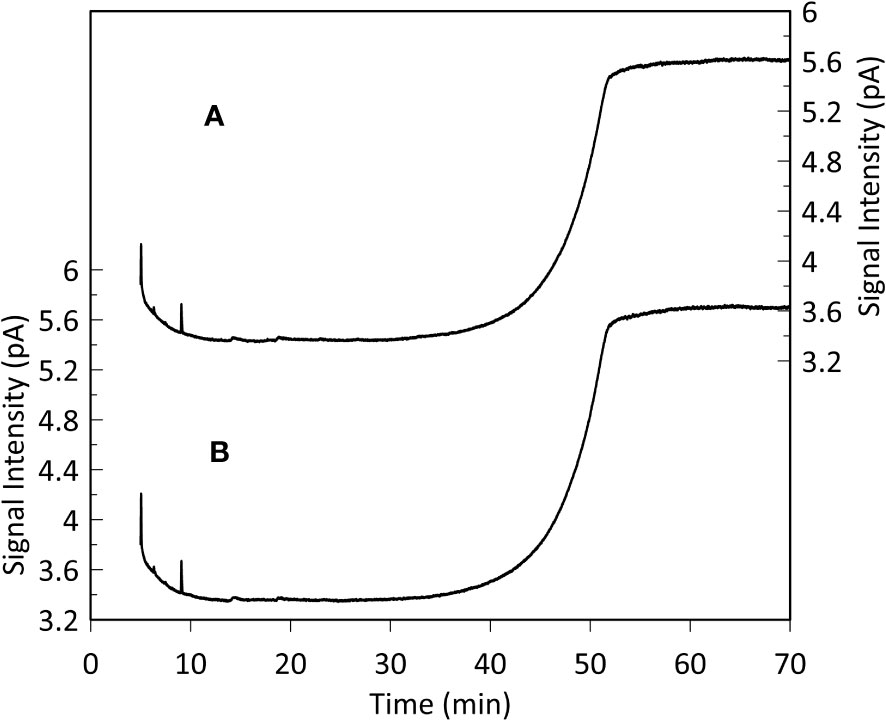
Figure 3 Monospecific sample (G. Inflata) GC-FID analysis (A) and blank (hexane, B). The plateaus after 45 minutes and the peaks after 9 minutes represent siloxanes derived from column degradation. The resemblance between the sample and the blank chromatogram indicates that lipid-related compounds are absent in the analyzed FBOM. This is supported by the high sensitivity of the instrument (detection limit: 10 pg organic carbon on-column).
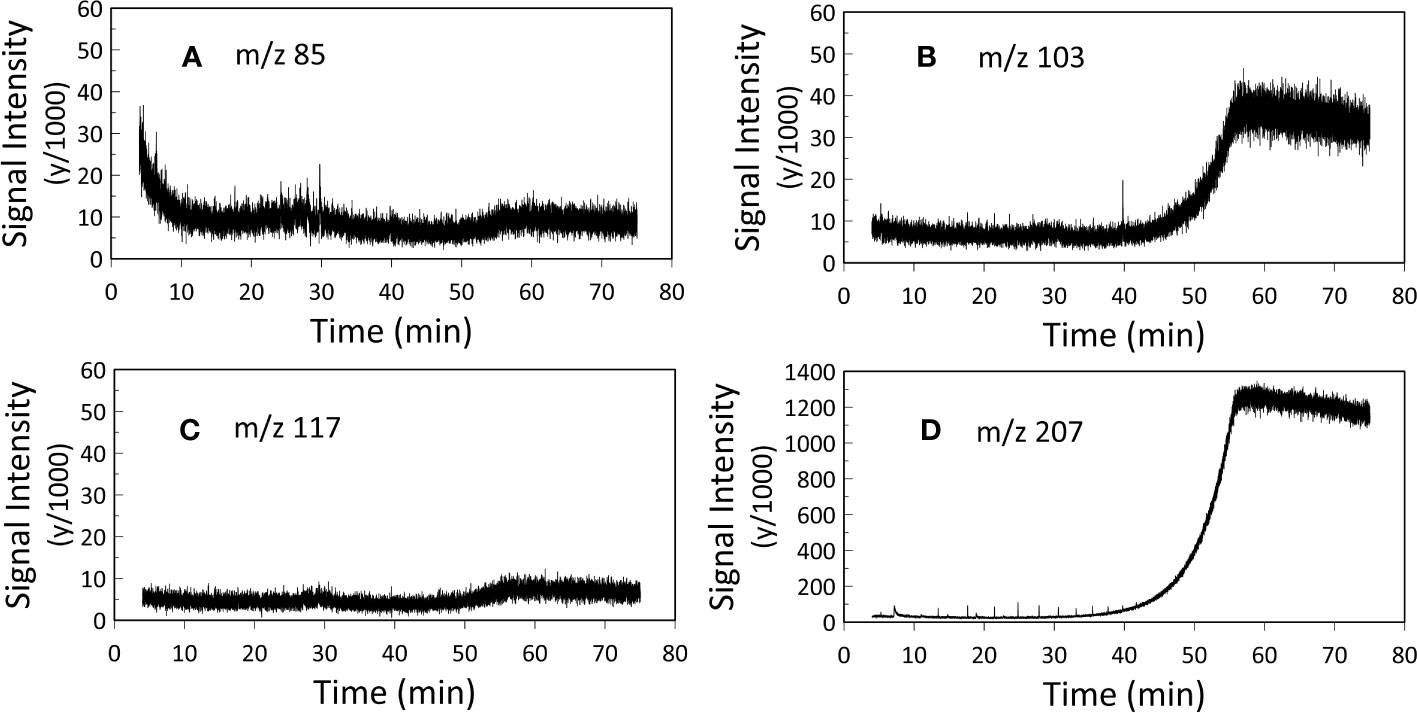
Figure 4 GC-MS analysis. Representation of (A) m/z 85 (alkyl lipids), (B) m/z 103 (TMS ethers of fatty alcohols), (C) m/z 117 (TMS esters of fatty acids) and (D) m/z 207 (steranes and siloxane derivatives). Two samples were analyzed for m/z 85, whilst three samples were analyzed for m/z 103, m/z 117 and m/z 207 (Appendix, Figures S3-S6), here the mean values of the replicates are presented. The two plateaus in figure B and figure D after 45 minutes and the peak at 40 minutes in figure B represent siloxanes derived from column degradation.
3.2 Liquid chromatography
The liquid chromatograms are shown in Figure 5. All three samples show three distinct fractions corresponding to HS, building blocks and LMW neutrals, whilst peaks representing LMW acids and biopolymers were not detected (Huber et al., 2011).
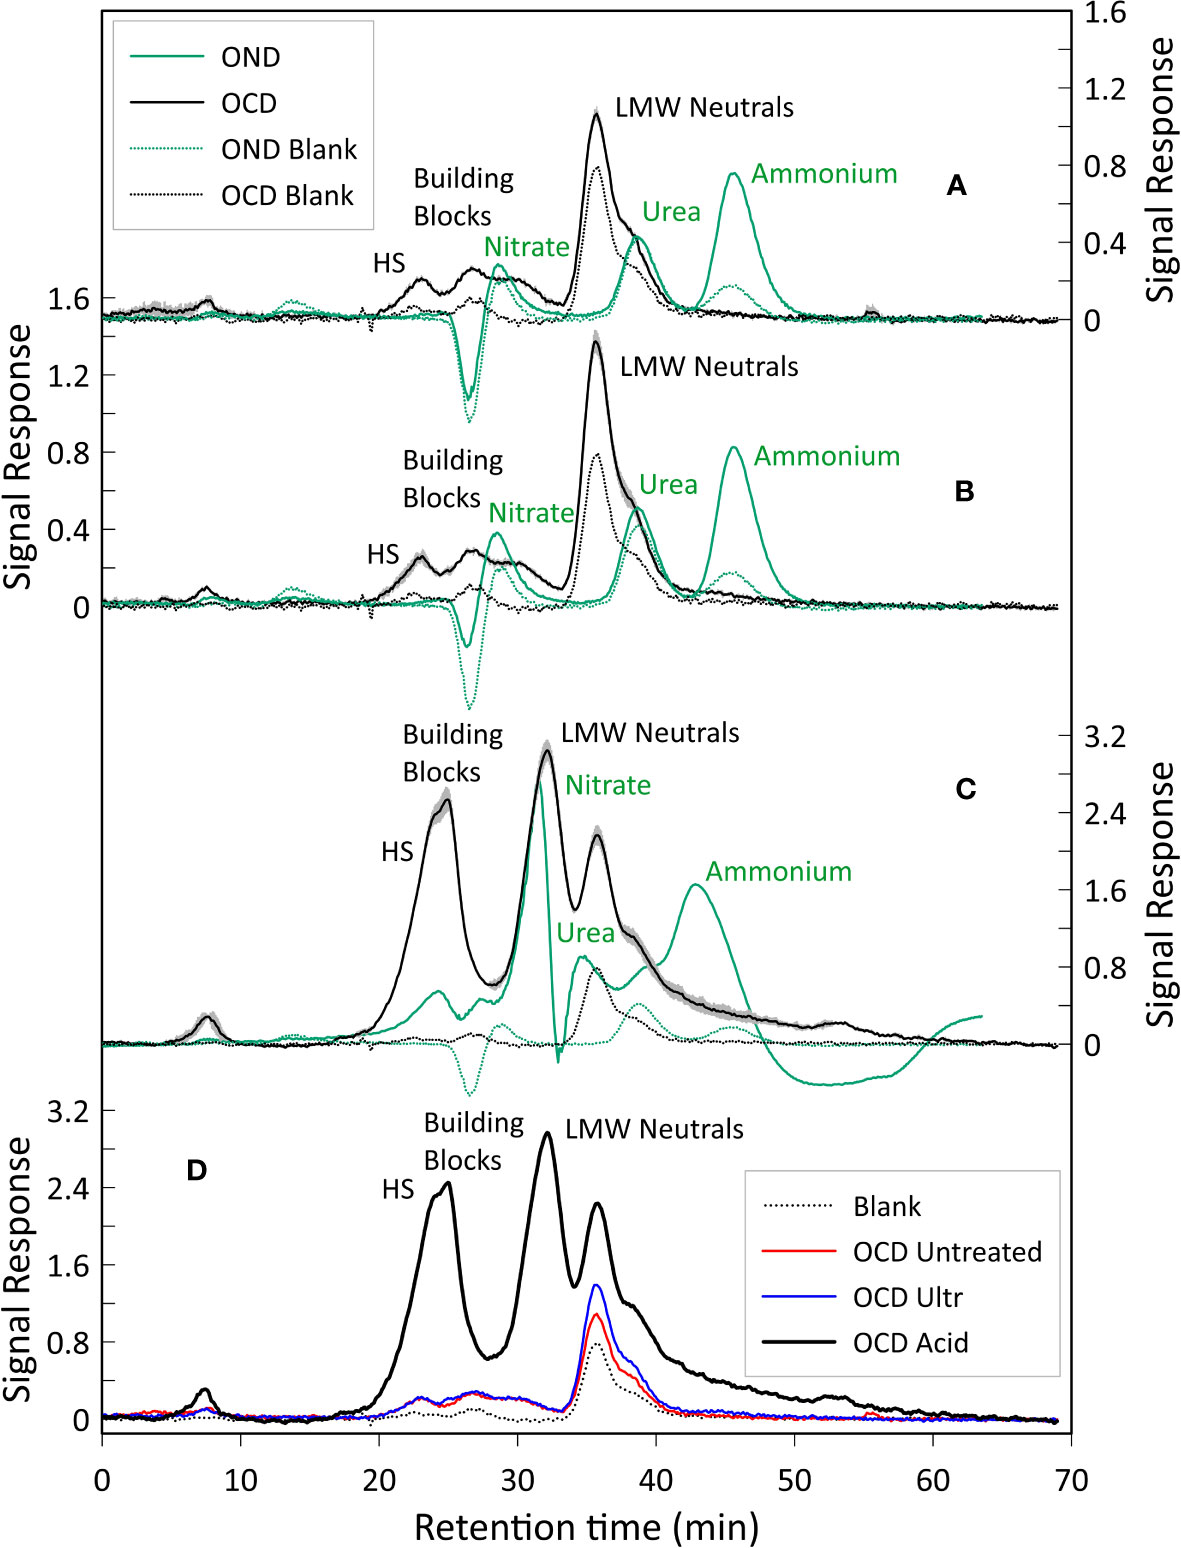
Figure 5 LC-OCD and OND analysis. (A) LC-OCD/OND analysis of the untreated sample. (B) LC-OCD/OND analysis on the ultrasonically treated sample, (C) LC-OCD/OND analysis on the acidified sample, Here averages of the three triplicates are shown. For chromatograms A, B and C, dotted black and green lines represent the OCD and OND blanks (DI water) respectively. Black line represents the mean OCD value. Green line represents the mean OND value. The grey area represents the standard deviation error calculated considering the OCD values of the triplicates analyzed in each different sample (maximum standard deviation error: 0.14 µg/l). Peaks were annotated according to Huber et al. (2011). (D) Dissolved organic carbon of the three samples analyzed. Shown are blank (DI water, dotted black line), untreated sample (red line), ultrasonically treated sample (blue line), and acidified sample (black line). The amount of organic carbon detected in the acidified sample is 8 times higher compared to the untreated and ultrasonically treated samples, we impute this to the dissolution (caused by the acidification) of additional organic substances that would not easily dissolve in water otherwise.
For the chromatograms related to the untreated sample, the average total amount of carbon in the HS fraction was 178 µg/l (20% of the total dissolved organic carbon (DOC)), whilst the DOC related to the building blocks peak was 197 µg/l (22%), and the total amount of DOC represented by the LMW neutrals was 519 µg/l (58%). For the chromatograms of the ultrasonicated sample, the average total amount of DOC in the HS fraction was 136 µg/l (13%), whereas building blocks and LMW neutrals corresponded to 159 µg/l (16%) and 723 µg/l (71%), respectively. Finally, in the chromatograms of the acidified sample, it is noted that the average total amount of DOC in the HS fraction was 1888 µg/l (25%), whilst the building blocks fraction accounted for 1628 µg/l (21%) and LMW neutrals was 4156 µg/l (54%) (Figures 5,6A). LMW neutrals represented the main fraction in all samples. In the acidified sample the total DOC concentration was approximately eight times higher in comparison to the other two samples (Figure 5D). This is likely due to the acid vapour treatment releasing the organic carbon that was previously bound to the calcite test and facilitated the dissolution of labile organic material into the acid but full remineralisation to CO2.
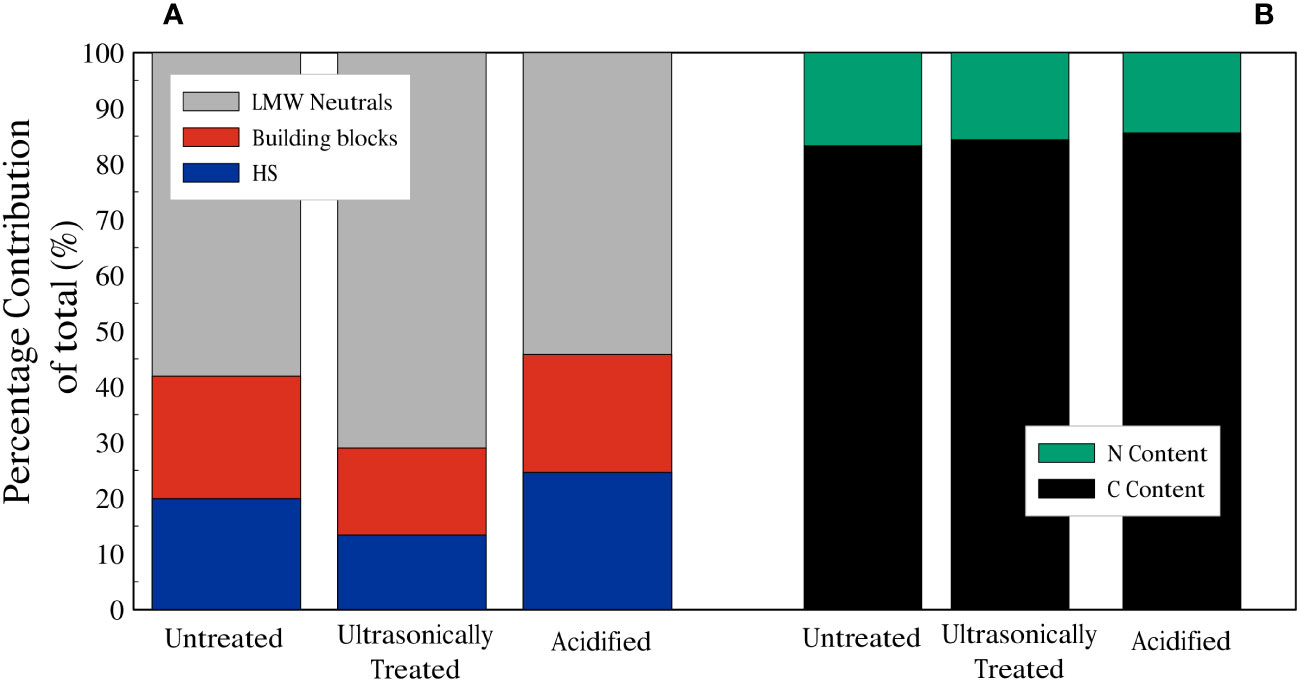
Figure 6 (A) Summary of relative contributions to DOC of planktonic foraminifera. (B) Dissolved Nitrogen (green) and Carbon (black) fractions of planktonic foraminifera dissolved organic matter.
The dissolved organic nitrogen (DON) signal showes three distinct peaks in all the chromatograms, related to nitrate, urea and ammonium (Figures 5A–C) and, similarly to the DOC signal, there was an increase in DON detected in relation to the acidified sample. The mol C: mol N ratio was calculated based on the integrated and quantified areas of both organic carbon and nitrogen individual fractions. C:N ratios of the samples were very similar, ratios of 6.29, 5.81 and 6.92 were obtained for the untreated sample, the ultrasonically treated sample and the acidified sample, respectively (percentages of C and N are shown in Figure 6B).
4 Discussion
4.1 Absence of lipids in FBOM
Typical deep-sea sediment samples contain abundant long-chain n-alkyl lipid homologues that provide evidence for input of organic matter from both marine and terrestrial sources. Compounds such as alkenones, n-alcohols and fatty acids are commonly present in deep-sea sediments’ lipid extracts (Cranwell, 1982; Pearson et al., 2001; Hu et al., 2002). In contrast to typical deep-sea sediment chromatograms (e.g., Brazilian Margin sample, Appendix Figure S7), our GC-FID results do not show any evidence of peaks associated with the presence of lipids in FBOM (Figure 3) and this is further confirmed by our GC-MS analyses, presented in Figure 4. Our GC instruments have detection limits of ~10 pg on-column (FID) and <100 pg per microliter (MS) and this indicates that if any lipids were present, they would have been below our analytical detection limit.
The hypothesis of a substantial lipids’ contribution to FBOM was recently suggested by Swart et al. (2021) to explain significantly depleted δ13C values in FBOM compared to POM δ13C in the eastern equatorial Pacific. The FBOM δ13C results found by Swart et al. (2021) were 7 ‰ depleted compared to the isotopic signal of POM, which is an important food source for foraminifera (Schiebel and Hemleben, 2017). Earlier studies by Stott (1992), and Maslin et al. (1996) also found depleted FBOM δ13C compared to δ13C of POM. However, FBOM carbon has a metabolic origin (Fhlaithearta et al., 2013) and generally only a ~1 ‰ enrichment is expected per trophic level (Sackett et al., 1965; Degens et al., 1968; DeNiro and Epstein, 1978; McCutchan et al., 2003). To justify the higher-than-expected difference in δ13C composition between POM and FBOM, Swart et al. (2021) proposed that the depleted δ13C values were due to FBOM containing a substantial lipid component, as lipids are characterized by relatively low δ13C values (Newsome et al., 2014; Yurkowski et al., 2015).
The presence of symbionts could represent another possible explanation for depleted FBOM δ13C values (compared to POM). Foraminifera can be characterized as symbiont bearing, facultative symbiont bearing and symbiont barren species. Swart et al. (2021) measured FBOM δ13C on symbiont bearing species (e.g., Orbulina universa: -26.55 ‰, Globigerinoides sacculifer: -26.43 ‰) and facultative symbiont bearing species (e.g., Globorotalia menardii: -26.8 ‰, Globigerina dutertrei: -26.59 ‰, Puleniatina obliquiloculata: -26.24 ‰). LeKieffre et al. (2018) explored the carbon assimilation and translocation of the planktonic foraminifera species O. universa, using NanoSIMS-TEM techniques. They showed that symbionts (dinoflagellate algae) accumulate organic carbon into starch nodules during daytime photosynthesis. Then, during the night, the symbionts migrate into vacuoles within the foraminifera endoplasm and the amount of starch decreases considerably. LeKieffre et al. (2020) assessed that, during the night, starch was converted into lipid in the symbiont cells, which was then transferred through the foraminifera cytoplasm, where it is assimilated. Spero (1988) had previously examined chamber formation in O. universa specimens and documented the presence of fibrillar material in the extracellular environment adjacent to a newly forming chamber. This fibrillar material is composed of strands of proteins (Lee et al., 1965; Spero, 1988) and it is thought to be the major source of proteins for the new forming foraminifera chambers (Spero, 1988; LeKieffre et al., 2020). The use of some of these proteins (derived from decomposed lipids with depleted 13C) by the fibrillar material to form the FBOM could explain the depleted FBOM δ13C values obtained by Swart et al. (2021). However, it would also confirm that FBOM is made of polysaccharides and proteins, and not lipids.
In a recent study, Hoogakker et al. (2022) analyzed FBOM δ13C across the Atlantic and found organic carbon isotopes values very similar to that of POM, with an average enrichment of 0.9 ‰. Hoogakker et al. (2022) suggested that the difference with previous results may be related to different preparation techniques. Both Maslin et al. (1996) and Swart et al. (2021) studies introduced steps that could lead to loss of labile organic material through dialysis (Maslin et al., 1996) and autoclaving (Swart et al., 2021). This labile organic material may have a heavier organic carbon isotopic composition, which, when removed, would lead to artificial depletion of the remaining results.
Furthermore, in the study of Hoogakker et al. (2022), facultative symbiont bearing species (G. inflata, N. dutertrei and P. obliquiloculata) and one symbiont bearing species (G. sacculifer) were studied. Their results show enriched FBOM δ13C values (+0.9 ‰) for the facultative symbiont bearing species, with further enrichment for the symbiont-bearing species (Hoogakker et al., 2022). Finally, culturing experiments of Uhle et al. (1997) showed a small enrichment of symbiont bearer O. universa over symbiont barren G. bulloides. These observations would argue against a large-scale symbiont-induced depletion of δ13C of FBOM.
4.2 Composition of labile FBOM
Organic material can be split into labile and recalcitrant components. Labile compounds, such as carbohydrates and proteins, are highly reactive and easily degradable. On the contrary, recalcitrant compounds, such as fats, are more stable and difficult to degrade or dissolve. In this study size-exclusion liquid chromatography was used to assess the composition of the organic compounds associated with FBOM which can be dissolved in water and detected by the LC-OCD.
Our results reveal that the soluble FBOM contains HS, building blocks and LMW neutrals (Figure 5) and the relative proportion of these three groups did not seem to vary significantly between the untreated (sample 1), ultrasonicated (sample 2) and acidified (sample 3) samples (Figure 6). The absence of biopolymers such as polysaccharides and proteins (which have a relatively high molecular weight) (Figure 5) contrasts with previous works that assessed that these are the main constituents of FBOM (Fhlaithearta et al., 2013; Sabbatini et al., 2014; Tyszka et al., 2021). It is likely that the repeated ultrasonication executed during the pre-analysis cleaning procedure may have broken down polysaccharides and proteins into their smaller constituents. These are then represented by HS, building blocks and LMW neutrals (Ishiwatari, 1992; Huber et al., 2011; Stewart et al., 2013), all of which were detected in our LC-OCD chromatograms.
Seawater HS are defined as high molecular weight organic substances. They are major constituents of oceanic sediments, and they are thought to be mostly of phytoplankton origin (Ishiwatari, 1992) which foraminifera feed on (Schiebel and Hemleben, 2017) and some have a symbiont relationship with (Uhle et al., 1997). Different authors suggested different possible formation pathways. Harvey et al. (1983) proposed that seawater HS formed from crosslinking of polyunsaturated fatty acids by auto-oxidation. Ishiwatari (1992) later stated that HS are either partially degraded refractory biopolymers or biopolymers that are first degraded into smaller molecules and then repolymerized. He affirmed that both proteins, carbohydrates and lipids can participate in the formation of HS (Ishiwatari, 1992). Furthermore, Mecozzi and Pietrantonio (2006) analyzed fulvic acids and humic acids of the Tyrrhenian Sea and assessed that, whilst carbohydrates and proteins were always present and play a primary role in the formation of HS, lipids were not always detected. Huber et al. (2011) and Stewart et al. (2013) assessed that building blocks are HS-like material, but of a lower molecular weight, and that LMW neutrals, which is the most representative group in all our chromatograms, are hydrophilic to amphiphilic compounds composed of sugars, ammino acids, alcohols, aldehydes, and ketones.
An important difference between the first two samples (Figures 5A, B) and the acidified sample (Figure 5C) is that the amount of organic carbon detected in the latter is 8 times higher (Figure 5D). However, a second difference between the samples is the fact that the acidified sample displays two LMW neutral peaks, which are absent in the first two samples. This important difference may be attributed to acidification causing the dissolution and potential break-down of organic substances that do not easily dissolve in water. This could be other proteins, polysaccharides, or lipids (less likely), that are acid soluble.
Whilst HS could be composed of smaller lipid components, LMW neutrals, which represent the smaller constituents of lower molecular weight proteins and polysaccharides/monosaccharides, are significantly more abundant (Figure 6). If the dissolved organic matter we analyzed with the LC-OCD were to mainly represent the chemical composition of FBOM, then these results would also suggest that FBOM is mainly composed of lower molecular weight polysaccharides/monosaccharides and proteins, and not lipids.
As shown in Figure 6A, ultrasonication treatment resulted in a slight change in ratio related to FBOM composition compared to the untreated sample. Huber et al. (2011) suggested that ultrasonication reduces the quantity of HS and increases the amount of building blocks. In the ultrasonicated sample both the amount of HS (13%) and building blocks (16%) decrease compared to those related to the untreated sample (HS: 20%, building blocks: 22%). This might be explained by the selective release of organic matter caused by the ultrasonication process. However, the difference between the untreated sample and the ultrasonicated sample carbon-nitrogen ratios does not change consistently (Figure 6B). This result suggests that either the molecular composition of the detected component of FBOM is not significantly changed by the additional ultrasonication step or that this change does not cause a significant variation in the C:N ratio. It must be also considered that our main source of the two groups of compounds is the FBOM and our samples differ from the river water samples analyzed by Huber et al. (2011).
It is thought that samples that contain substantial lipids have a high C:N ratio (Liefer et al., 2019; Swart et al., 2021). In contrast to lipids and carbohydrates, where a small amount or no nitrogen is present (Geider and La Roche, 2002), proteins contain relatively high amounts of nitrogen. Finkel et al. (2016) obtained C:N values of 9.3, 7.9 and 7.5 in their composition analyses on dinoflagellates, green algae and diatoms, respectively. After compiling data from 130 macromolecular composition studies, they found that microalgae are predominantly composed of proteins (32.2%) with smaller percentages of lipids (17.3%) and carbohydrates (15.0%). In our study we measured the amount of carbon and nitrogen in our DOM samples (Figure 6) and our C:N ratios (6.29: untreated sample, 5.81: ultrasonically treated sample, 6.92: acidified sample) are lower than those of the microalgae of Finkel et al. (2016). Thus, if the dissolved organic matter we analyzed with the LC-OCD represented the chemical composition of FBOM, a C:N ratio in the range of ~6-7 would suggest a relative high number of proteins.
4.3 Proxy potential of FBOM δ13C
FBOM δ13C has been proposed as a potential proxy to reconstruct past atmospheric CO2 (Maslin et al., 1996; Swart et al., 2021) and δ13C of POM (Hoogakker et al., 2022). Maslin et al. (1996) and Swart et al. (2021) studied the application of FBOM δ13C in both symbiont barren (G. bulloides), symbiont bearing (O. universa and G. sacculifer) and facultative symbiont bearing (G. menardii, G. dutertrei, and P. obliquiloculata) species. However, not all planktonic foraminifera species might be ideal for past atmospheric CO2 reconstructions. For example, Köhler-Rink and Kühl (2005) demonstrated that the water area surrounding symbiont bearer species (O. universa) is characterized by different CO2 concentrations compared with the ambient seawater. This is highlighted by the difference between the pH values of the area surrounding the foraminifera and the pH values of the ambient seawater (Jørgensen et al., 1985; Rink et al., 1998; Köhler-Rink and Kühl, 2005). Köhler-Rink and Kühl (2005) further suggested that this area is 12C depleted due to the preferential uptake of 12CO2 in photosynthetic carbon fixation by the foraminifera symbionts (Köhler-Rink and Kühl, 2005). Considering that FBOM carbon has metabolic origins (Fhlaithearta et al., 2013) and that the fibrillar material may use symbiont 12C enriched carbon to form FBOM (Spero, 1988; LeKieffre et al., 2020), presumably only symbiont-barren foraminifera FBOM would be able to yield δ13C values that can be used as a proxy for atmospheric CO2 calculations.
Furthermore, the choice of the foraminifera species and the methodology might not be the main factors impacting the potential of FBOM δ13C as a past atmospheric CO2 proxy. Knowing the past sea-surface temperatures (SSTs) and atmospheric CO2 concentrations, the δ13C of POM (δ13Corg-POM) and the δ13C of dissolved inorganic carbon (δ13Cin) of the last 20,000 years, we can assess the uncertainties associated with the reconstruction of atmospheric CO2 concentrations in the past. We obtained the δ13Cin from Hoogakker et al. (2022) (G. bulloides, ODP Site 1088), the CO2 data from the Antarctic ice core records (Flückiger et al., 2002; Pedro et al., 2012) and we calculated our SSTs values from the Mg/Ca analysis carried out on G. bulloides specimens collected from ODP site 1088 (Vázquez Riveiros et al., 2016). Dissolved CO2 data were calculated from CO2 concentrations from ice core records using the formula of Maslin et al., 1996 and its carbon isotopic signal was calculated using the formula of Freeman and Hayes, 1992. Finally, the isotopic fractionation between dissolved CO2 δ13C and δ13Corg-POM was calculated using the formula of Rau et al., 1996.With FBOM δ13C being enriched compared to δ13Corg-POM by 0.9 ± 1.2 ‰ (Hoogakker et al., 2022), we calculate that a ±1.2 ‰ uncertainty in δ13Corg-POM would translate into an atmospheric CO2 uncertainty of ±21 ppm. Whilst past CO2 reconstructions using boron isotopes would lead to a similar error (Henehan et al., 2013), the sample size needed is much smaller. Hence, we suggest that FBOM δ13C could be more suitable for δ13Corg-POM reconstruction, for which there is no current proxy (bulk sediment δ13Corg analyses carry to many uncertainties). Knowledge about past δ13Corg-POM is important to improve our understanding of δ13Cin (Hoogakker et al., 2022). Furthermore, it could improve predictions of bottom water oxygen reconstructions (Hoogakker et al., 2015) and organic matter fluxes (Theodor et al., 2016), that use carbon isotope gradients, resulting from the decomposition of organic material in sediments.
5 Conclusions
Here we use a combination of LC-OCD/OND and GC-MS/FID analyses to determine the FBOM molecular composition. The LC-OCD/OND results presented here indicate that our foraminiferal sample material mainly consists of HS, building blocks and LMW neutrals, which are mainly representative of monosaccharides, lower molecular weight polysaccharides and proteins. This is also supported by the relatively low C:N ratio obtained which indicates that the DOM analyzed contains relative high quantities of proteins. Furthermore, no alkanes, alcohols or fatty acids peaks were detected by our GC-MS/FID analyses, highlighting the absence of lipid compounds inside the analyzed FBOM. Additionally, FBOM δ13C appears to be ideally suited to reconstruct δ13C of particulate organic material from the surface ocean, which would help improving our understanding of carbon cycling.
Data availability statement
The original contributions presented in the study are included in the article/Supplementary Material. Further inquiries can be directed to the corresponding authors.
Author contributions
TP and BH created the concept and design of the study. TP and CM conducted the GC-MS analysis. TP, AN, and RP conducted the LC-OCD/OND analysis. TP prepared the figures and managed the data. TP and BH contributed to the writing of the first draft of the manuscript. AN, RP, EM, LJ, and CM commented on the first draft of the manuscript. BH provided the sample material (foraminifera) for the analyses. LJ provided the Brazilian Margin GC 04 sample material. All authors contributed to the article and approved the submitted version.
Funding
This work was funded by a Philip Leverhulme Prize and a UKRI FLF to BH (Grant Ref: MR/S034293/1). RP acknowledges financial support to the European Research Council BOOGIE project under the European Union’s Horizon 2020 research and innovation program (grant number 949495). LJ is supported by the Fundação de Amparo à Pesquisa do Estado de São Paulo (FAPESP project 16/24946–9). EM acknowledges financial support from the Leverhulme Trust (Grant Ref: RL-2019-023).
Acknowledgments
This work benefitted from discussion with Kate Darling, Clare Bird, Catherine Davis, Jennifer Fehrenbacher and Karen Fung. Figure 1 was made by Emanuela Caponi. This research used samples and/or data provided by the Ocean Drilling Program (ODP). ODP is sponsored by the US National Science Foundation and participating countries (Natural Environment Research Council in the UK) under the management of the Joint Oceanographic Institutions (JOI).
Conflict of interest
The authors declare that the research was conducted in the absence of any commercial or financial relationships that could be construed as a potential conflict of interest.
Publisher’s note
All claims expressed in this article are solely those of the authors and do not necessarily represent those of their affiliated organizations, or those of the publisher, the editors and the reviewers. Any product that may be evaluated in this article, or claim that may be made by its manufacturer, is not guaranteed or endorsed by the publisher.
Supplementary material
The Supplementary Material for this article can be found online at: https://www.frontiersin.org/articles/10.3389/fmars.2023.1237440/full#supplementary-material
References
Armbruster D. A., Pry T. (2008). “Limit of blank, limit of detection and limit of quantitation,” The Clinical Biochemist Reviews, Vol. 29. S49–S52.
Auderset A., Moretti S., Taphorn Björn, Ebner P-R., Kast E., Wang, et al. (2022). Enhanced ocean oxygenation during Cenozoic warm periods. Nature 609 (7925), 77–82. doi: 10.1038/s41586-022-05017-0
Bligh E. G., Dyer W. J. (1959). A rapid method of total lipid extraction and purification. Can. J. Biochem. Physiol. 37 (8), 911–917. doi: 10.1139/o59-099
Brocks J. J., Hope J. M. (2014). Tailing of chromatographic peaks in GC-MS caused by interaction of halogenated solvents with the ion source. J. Chromatograph Sci. 52 (6), 471–475. doi: 10.1093/chromsci/bmt068
Christie W. W. (1998). Gas chromatography-mass spectrometry methods for structural analysis of fatty acids. Lipids 33 (4), 343–353. doi: 10.1007/s11745-998-0214-x
Cranwell P. (1982). Lipids of aquatic sediments and sedimenting particulates. Prog. Lipid Res. 21 (4), 271–308. doi: 10.1016/0163-7827(82)90012-1
Degens E. T., Guillard R. R. L., Sackett W. M., Hellebust J. A. (1968). “Metabolic fractionation of carbon isotopes in marine plankton—I. Temperature and respiration experiments,” Deep Sea Research and Oceanographic Abstracts, Vol. 15 (1), 1–9. doi: 10.1016/0011-7471(68)90024-7
DeNiro M. J., Epstein S. (1978). Influence of diet on the distribution of carbon isotopes in animals. Geochim. Cosmochim. Acta 42 (5), 495–506. doi: 10.1016/0016-7037(78)90199-0
Duplessy J-C., Shackleton N. J., Matthews R. K., Warren P., Ruddiman William F., Caralp Michèle, et al. (1984). 13 C record of benthic foraminifera in the last interglacial ocean: implications for the carbon cycle and the global deep water circulation. Quat. Res. 21 (2), 225–243. doi: 10.1016/0033-5894(84)90099-1
Erez J. (2003). The source of ions for biomineralization in foraminifera and their implications for paleoceanographic proxies. Rev. Mineral Geochemist 54 (1), 115–149. doi: 10.2113/0540115
Fhlaithearta S. N., Ernst S. R., Nierop K. G. J., de Lange G. J., Reichart G.-J. (2013). Molecular and isotopic composition of foraminiferal organic linings. Mar. Micropaleontology 102, 69–78. doi: 10.1016/j.marmicro.2013.06.004
Finkel Z. V., Follows Mick J., Liefer J. D., Brown Chris M., Ina B., Irwin A. J. (2016). Phylogenetic diversity in the macromolecular composition of microalgae. PloS One 11 (5), e0155977. doi: 10.1371/journal.pone.0155977
Flückiger J., Monnin E., Stauffer B., Schwander J., Stocker T. F., Chappellaz Jérôme, et al. (2002). High-resolution Holocene N2O ice core record and its relationship with CH4 and CO2. Global Biogeochem. Cycles 16 (1), 10–1-10-8. doi: 10.1029/2001GB001417
Freeman K. H., Hayes J. M. (1992). Fractionation of carbon isotopes by phytoplankton and estimates of ancient CO2 levels. Global biogeochem. cycles 6 (2), 185–198. doi: 10.1029/92gb00190
Geider R., La Roche J. (2002). Redfield revisited: variability of C:N:P in marine microalgae and its biochemical basis. Eur. J. Phycol. 37 (1), 1–17. doi: 10.1017/S0967026201003456
Gersonde R., Hodell D. A., Blum P. (1999). “Leg 177 summary: Southern Ocean paleoceanography,” in Proceedings of the Ocean Drilling Program. Part A, Initial report Vol. 177 Hodell D. (College Station, Texas: Ocean Drilling Program).
Harvey G. R., Boran D. A., Chesal L. A., Tokar J. M. (1983). The structure of marine fulvic and humic acids. Mar. Chem. 12 (2-3), 119–132. doi: 10.1016/0304-4203(83)90075-0
Hazell L. J., Stocker R. (1993). Oxidation of low-density lipoprotein with hypochlorite causes transformation of the lipoprotein into a high-uptake form for macrophages. Biochem. J. 290, 165–172. doi: 10.1042/bj2900165
Henehan M. J., Rae J. W. B., Foster G. L., Erez J., Prentice K. C., Kucera M., et al. (2013). Calibration of the boron isotope proxy in the planktonic foraminifera Globigerinoides ruber for use in palaeo-CO2 reconstruction. Earth Planetary Sci. Lett. 364, 111–122. doi: 10.1016/j.epsl.2012.12.029
Hoogakker B. A. A., Anderson C., Paoloni T., Stott A., Grant H., Keenan P., et al. (2022). Planktonic foraminifera organic carbon isotopes as archives of upper ocean carbon cycling. Nat. Commun. 13, 4841. doi: 10.1038/s41467-022-32480-0
Hoogakker B. A. A., McCave I. N., Elderfield H., Hillaire-Marcel C., Simstich J. (2015). Holocene climate variability in the Labrador Sea. J. Geological Soc. 172 (2), 272–277. doi: 10.1144/jgs2013-097
Hottinger L., Dreher D. (1974). Differentiation of protoplasm in nummulitidae (Foraminifera) from Elat, Red Sea. Mar. Biol. 25 (1), 41–61. doi: 10.1007/BF00395107
Hu J., Peng Ping’an, Jia G., Fang D., Zhang G., Fu J., et al. (2002). Biological markers and their carbon isotopes as an approach to the paleoenvironmental reconstruction of Nansha area, South China Sea, during the last 30 ka. Organic Geochemist 33 (10), 1197–1204. doi: 10.1016/S0146-6380(02)00082-7
Huber S. A., Balz A., Abert M., Pronk W. (2011). Characterisation of aquatic humic and non-humic matter with size-exclusion chromatography–organic carbon detection–organic nitrogen detection (LC-OCD-OND). Water Res. 45 (2), 879–885. doi: 10.1016/j.watres.2010.09.023
Ishiwatari R. (1992). Macromolecular material (humic substance) in the water column and sediments. Mar. Chem. 39 (1-3), 151–166. doi: 10.1016/0304-4203(92)90099-V
Jørgensen Bo B., Erez J., Revsbech P., Cohen Y. (1985). Symbiotic photosynthesis in a planktonic foraminiferan, Globigerinoides sacculifer (Brady), studied with microelectrodes1. Limnol. Oceanogr 30 (6), 1253–1267. doi: 10.4319/lo.1985.30.6.1253
King K., Hare P. E. (1972). Amino Acid composition of planktonic foraminifera: a paleobiochemical approach to evolution. Sci. (New York N.Y.) 175 (4029), 1461–1463. doi: 10.1126/science.175.4029.1461
Köhler-Rink S., Kühl M. (2005). The chemical microenvironment of the symbiotic planktonic foraminifer Orbulina universa. Mar. Biol. Res. 1 (1), 68–78. doi: 10.1080/17451000510019015
Krupčík J., Májek P., Gorovenko R., Blaško J., Kubinec R., Sandra P. (2015). Considerations on the determination of the limit of detection and the limit of quantification in one-dimensional and comprehensive two-dimensional gas chromatography. J. chromatog. A 1396, 117–130. doi: 10.1016/j.chroma.2015.03.084
Langer M. R. (1992). Biosynthesis of glycosaminoglycans in foraminifera: A review. Mar. Micropaleontology 19 (3), 245–255. doi: 10.1016/0377-8398(92)90031-E
Lee J. J., Freudenthal H. D., Kossoy V., Bé A. (1965). Cytological Observations on Two Planktonic Foraminifera, Globigerina bulloides d’Orbigny 1826 and globigerinoides ruber (d’Orbigny 1839) cushman 1927. J. Protozool 12 (4), 531–542. doi: 10.1111/j.1550-7408.1965.tb03253.x
LeKieffre C., Spero H. J., Fehrenbacher J. S., Russell A. D., Ren H., Geslin E., et al. (2020). : Ammonium is the preferred source of nitrogen for planktonic foraminifer and their dinoflagellate symbionts. Proc. Biol. Sci. 287 (1929), 20200620. doi: 10.1098/rspb.2020.0620
LeKieffre C., Spero H. J., Russell A. D., Fehrenbacher J. S., Geslin E., Meibom A. (2018). Assimilation, translocation, and utilization of carbon between photosynthetic symbiotic dinoflagellates and their planktic foraminifera host. Mar. Biol. 165, (6). doi: 10.1007/s00227-018-3362-7
Liefer J. D., Garg A., Fyfe M. H., Irwin A. J., Benner I., Brown C. M., et al. (2019). The macromolecular basis of phytoplankton C:N:P under nitrogen starvation. Front. Microbiol. 10. doi: 10.3389/fmicb.2019.00763
Lorrain A., Savoye N., Chauvaud L., Paulet Y-M., Naulet N. (2003). : Decarbonation and preservation method for the analysis of organic C and N contents and stable isotope ratios of low-carbonated suspended particulate material. Anal. Chimica Acta 491 (2), 125–133. doi: 10.1016/S0003-2670(03)00815-8
Mackensen A., Bickert T. (1999). “Stable carbon isotopes in benthic foraminifera: proxies for deep and bottom water circulation and new production,” in Use of proxies in paleoceanography. Eds. Fischer G., Wefer G. (Berlin, Heidelberg: Springer). doi: 10.1007/978-3-642-58646-0_9
Marchitto T. M., Broecker W. S. (2006). Deep water mass geometry in the glacial Atlantic Ocean: A review of constraints from the paleonutrient proxy Cd/Ca. Geochem. Geophys. Geosyst 7 (12), 1–16. doi: 10.1029/2006GC001323
Maslin M. A., Hall M. A., Shackleton N. J., Thomas E. (1996). Calculating surface water pCO2 from foraminiferal organic δ13C. In Geochim. Cosmochim. Acta 60 (24), 5089–5100. doi: 10.1016/S0016-7037(96)00283-9
McCutchan J. H., Lewis W. M., Kendall C., McGrath C. C. (2003). Variation in trophic shift for stable isotope ratios of carbon, nitrogen, and sulfur. In Oikos 102 (2), 378–390. doi: 10.1034/j.1600-0706.2003.12098.x
Mecozzi M., Pietrantonio E. (2006). Carbohydrates proteins and lipids in fulvic and humic acids of sediments and its relationships with mucilaginous aggregates in the Italian seas. Mar. Chem. 101 (1-2), 27–39. doi: 10.1016/j.marchem.2006.01.001
Mondello L., Casilli A., Tranchida P. Q., Costa R., Chiofalo B., Dugo P., et al. (2004). Evaluation of fast gas chromatography and gas chromatography-mass spectrometry in the analysis of lipids. In J. chromatog. A 1035 (2), 237–247. doi: 10.1016/j.chroma.2004.02.058
Newsome S. D., Wolf N., Peters J., Fogel M. L. (2014). Amino acid δ13C analysis shows flexibility in the routing of dietary protein and lipids to the tissue of an omnivore. Integr. Comp. Biol. 54 (5), 890–902. doi: 10.1093/icb/icu106
Nooijer L. J., Spero H. J., Erez J., Bijma J., Reichart G. J. (2014). Biomineralization in perforate foraminifera. Earth-Science Rev. 135, 48–58. doi: 10.1016/j.earscirev.2014.03.013
Oliver K. I. C., Hoogakker B. A. A., Crowhurst S., Henderson G. M., Rickaby R. E. M., Edwards N. R., et al. (2010). A synthesis of marine sediment core δ13C data over the last 150 000 years. Clim. Past 6 (5), 645–673. doi: 10.5194/cp-6-645-2010
Pearson A., McNichol A. P., Benitez-Nelson B. C., Hayes J. M., Eglinton T. I. (2001). Origins of lipid biomarkers in Santa Monica Basin surface sediment: a case study using compound-specific Δ14C analysis. Geochim. Cosmochim. Acta 65 (18), 3123–3137. doi: 10.1016/S0016-7037(01)00657-3
Pedro J. B., Rasmussen S. O., van Ommen T. D. (2012). Tightened constraints on the time-lag between Antarctic temperature and CO2 during the last deglaciation. Clim. Past 8 (4), 1213–1221. doi: 10.5194/cp-8-1213-2012
Rau G. H., Riebesell U., Wolf-Gladrow D. (1996). A model of photosynthetic 13C fractionation by marine phytoplankton based on diffusive molecular CO2 uptake. Mar. Ecol. Prog. Ser. 133, 275–285. doi: 10.3354/meps133275
Ren H., Sigman D. M., Martínez-García A., Anderson R. F., Chen M.-T., Ravelo A. C., et al. (2017). Impact of glacial/interglacial sea level change on the ocean nitrogen cycle. Proc. Natl. Acad. Sci. United States America 114 (33), E6759–E6766. doi: 10.1073/pnas.1701315114
Ren H., Sigman D. M., Meckler A. N., Plessen B., Robinson R. S., Rosenthal Y., et al. (2009). Foraminiferal isotope evidence of reduced nitrogen fixation in the ice age Atlantic Ocean. Sci. (New York N.Y.) 323 (5911), 244–248. doi: 10.1126/science.1165787
Ren H., Sigman D. M., Thunell R. C., Prokopenko M. G. (2012). Nitrogen isotopic composition of planktonic foraminifera from the modern ocean and recent sediments. Limnol. Oceanogr 57 (4), 1011–1024. doi: 10.4319/lo.2012.57.4.1011
Rink S., Kühl M., Bijma J., Spero H. J. (1998). Microsensor studies of photosynthesis and respiration in the symbiotic foraminifer Orbulina universa. Mar. Biol. 131 (4), 583–595. doi: 10.1007/s002270050350
Robbins L. L., Brew K. (1990). Proteins from the organic matrix of core-top and fossil planktonic foraminifera. Geochim. Cosmochim. Acta 54 (8), 2285–2292. doi: 10.1016/0016-7037(90)90052-M
Sabbatini A., Bédouet L., Marie A., Bartolini A., Landemarre L., Weber M. X., et al. (2014). Biomineralization of Schlumbergerella floresiana, a significant carbonate-producing benthic foraminifer. Geobiology 12 (4), 289–307. doi: 10.1111/gbi.12085
Sackett W. M., Eckelmann W. R., Bender M. L., Bé A. W. (1965). Temperature dependence of carbon isotope composition in marine plankton and sediments. Sci. (New York N.Y.) 148 (3667), 235–237. doi: 10.1126/science.148.3667.235
Schiebel R., Hemleben C. (2017). Planktonic foraminifers in the modern ocean (Berlin, Heidelberg: Springer Berlin Heidelberg). doi: 10.1007/978-3-662-50297-6
Schummer C., Delhomme O., Appenzeller B. M.R., Wennig R., Millet M. (2009). Comparison of MTBSTFA and BSTFA in derivatization reactions of polar compounds prior to GC/MS analysis. Talanta 77 (4), 1473–1482. doi: 10.1016/j.talanta.2008.09.043
Shuttleworth R., Bostock H. C., Chalk T. B., Calvo E., Jaccard S. L., Pelejero C., et al. (2021). Early deglacial CO2 release from the Sub-Antarctic Atlantic and Pacific oceans. In Earth and Planetary Science Letters 554, p. 116649. doi: 10.1016/j.epsl.2020.116649
Smart S. M., Fawcett S. E., Ren H., Schiebel R., Tompkins E. M., Martínez-García A., et al. (2020). The nitrogen isotopic composition of tissue and shell-bound organic matter of planktonic foraminifera in southern ocean surface waters. Geochem. Geophys. Geosyst 21 (2), 1. doi: 10.1029/2019GC008440
Spero H. J. (1988). Ultrastructural examination of chamber morphogenesis and biomineralization in the foraminifer Orbulina universa. Mar. Biol. 99 (1), 9–20. doi: 10.1007/BF00644972
Stewart T. J., Traber J., Kroll A., Behra R., Sigg L. (2013). Characterization of extracellular polymeric substances (EPS) from periphyton using liquid chromatography-organic carbon detection-organic nitrogen detection (LC-OCD-OND). Environ. Sci. pollut. Res. Int. 20 (5), 3214–3223. doi: 10.1007/s11356-012-1228-y
Stott L. D. (1992). Higher temperatures and lower oceanic pCO2: A climate enigma at the end of the Paleocene Epoch. Paleoceanography 7 (4), 395–404. doi: 10.1029/92PA01183
Swart K. A., Oleynik S., Martínez-García A., Haug G. H., Sigman D. M. (2021). Correlation between the carbon isotopic composition of planktonic foraminifera-bound organic matter and surface water pCO2 across the equatorial Pacific. In Geochim. Cosmochim. Acta 306, 281–303. doi: 10.1016/j.gca.2021.03.007
Theodor M., Schmiedl G., Jorissen F., Mackensen A. (2016). Stable carbon isotope gradients in benthic foraminifera as proxy for organic carbon fluxes in the Mediterranean Sea. Biogeosciences 13 (23), 6385–6404. doi: 10.5194/bg-13-6385-2016
Tvrzická E., Vecka M., Staňková B., Žák A. (2002). Analysis of fatty acids in plasma lipoproteins by gas chromatography–flame ionization detection. Anal. Chimica Acta 465 (1-2), 337–350. doi: 10.1016/S0003-2670(02)00396-3
Tyszka J., Godos K., Goleń J., Radmacher Wiesława., (2021). : Foraminiferal organic linings: Functional and phylogenetic challenges. Earth-Science Rev. 220 (5), 103726. doi: 10.1016/j.earscirev.2021.103726
Uhle M. E., Macko S. A., Spero H. J., Engel M. H., Lea D. W. (1997). Sources of carbon and nitrogen in modern planktonic foraminifera: the role of algal symbionts as determined by bulk and compound specific stable isotopic analyses. Organic Geochemist 27 (3-4), 103–113. doi: 10.1016/S0146-6380(97)00075-2
Uhle M. E., Macko S. A., Spero H. J., Lea D. W., Ruddiman W. F., Engel M. H. (1999). The fate of nitrogen in the Orbulina universa foraminifera-symbiont system determined by nitrogen isotope analyses of shell-bound organic matter. Limnol. Oceanogr 44 (8), 1968–1977. doi: 10.4319/lo.1999.44.8.1968
Vázquez Riveiros N., Govin A., Waelbroeck C., Mackensen A., Michel E., Moreira S., et al. (2016). Mg/Ca thermometry in planktic foraminifera: Improving paleotemperature estimations for G. bulloides and N. pachyderma left. Geochem. Geophys. Geosyst 17 (4), 1249–1264. doi: 10.1002/2015GC006234
Villacorte L. O., Ekowati Y., Neu T. R., Kleijn J. M., Winters H., Amy G., et al. (2015). Characterisation of algal organic matter produced by bloom-forming marine and freshwater algae. Water Res. 73, 216–230. doi: 10.1016/j.watres.2015.01.028
Wang J., Huang Z-H., Gage D. A., Watson J. (1994). Analysis of amino acids by gas chromatography—flame ionization detection and gas chromatography—mass spectrometry: Simultaneous derivatization of functional groups by an aqueous-phase chloroformate-mediated reaction. J. Chromatogr. A 663 (1), 71–78. doi: 10.1016/0021-9673(94)80497-4
Weiner S., Addadi L. (1997). Design strategies in mineralized biological materials. In J. Mater. Chem. 7 (5), 689–702. doi: 10.1039/A604512J
Keywords: organic matter, planktonic foraminfera, gas chromatography, liquid chromatography, lipids, particulate organic matter proxy
Citation: Paoloni T, Hoogakker B, Navarro Rodriguez A, Pereira R, McClymont EL, Jovane L and Magill C (2023) Composition of planktonic foraminifera test-bound organic material and implications for carbon cycle reconstructions. Front. Mar. Sci. 10:1237440. doi: 10.3389/fmars.2023.1237440
Received: 09 June 2023; Accepted: 08 September 2023;
Published: 26 September 2023.
Edited by:
Renato S. Carreira, Pontifical Catholic University of Rio de Janeiro, BrazilReviewed by:
Angela Vogts, Leibniz Institute for Baltic Sea Research (LG), GermanyStergios D. Zarkogiannis, University of Oxford, United Kingdom
Copyright © 2023 Paoloni, Hoogakker, Navarro Rodriguez, Pereira, McClymont, Jovane and Magill. This is an open-access article distributed under the terms of the Creative Commons Attribution License (CC BY). The use, distribution or reproduction in other forums is permitted, provided the original author(s) and the copyright owner(s) are credited and that the original publication in this journal is cited, in accordance with accepted academic practice. No use, distribution or reproduction is permitted which does not comply with these terms.
*Correspondence: Tommaso Paoloni, dG9tbWFzb3Bhb2xvbmkxQGdtYWlsLmNvbQ==; Babette Hoogakker, Yi5ob29nYWtrZXJAaHcuYWMudWs=