Abstract
With the development of the marine economy, video surveillance has become an important technical guarantee in the fields of marine engineering, marine public safety, marine supervision, and maritime traffic safety. In video surveillance, maritime object detection (MOD) is one of the most important core technologies. Affected by the size of maritime objects, distance, day and night weather, and changes in sea conditions, MOD faces challenges such as false detection, missed detection, slow detection speed, and low accuracy. However, the existing object detection algorithms usually adopt predefined anchor boxes to search and locate for objects of interest, making it difficult to adapt to maritime objects’ complex features, including the varying scale and large aspect ratio difference. Therefore, this paper proposes a maritime object detection algorithm based on the improved convolutional neural network (CNN). Firstly, a differential-evolutionary-based K-means (DK-means) anchor box clustering algorithm is proposed to obtain adaptive anchor boxes to satisfy the maritime object characteristics. Secondly, an adaptive spatial feature fusion (ASFF) module is added in the neck network to enhance multi-scale feature fusion. Finally, focal loss and efficient intersection over union (IoU) loss are adopted to replace the original loss function to improve the network convergence speed. The experimental results on the Singapore maritime dataset show that our proposed algorithm improves the average precision by 7.1%, achieving 72.7%, with a detection speed of 113 frames per second, compared with You Only Look Once v5 small (YOLOv5s). Moreover, compared to other counterparts, it can achieve a better speed–accuracy balance, which is superior and feasible for the complex maritime environment.
1 Introduction
With the rapid development of global economy and trade, maritime traffic is becoming heavier and denser, bringing a higher risk of maritime traffic accidents. Accurate and rapid maritime object detection is largely beneficial for maritime surveillance, thus effectively reducing the risk of maritime traffic accidents. Affected by maritime objects’ distance, weather, and sea conditions, traditional maritime video surveillance mainly relies on manual methods. However, the monitors will inevitably experience visual fatigue when the monitoring behavior continues, leading to false or missed detection of maritime objects and even grave consequences. To solve these problems, an intelligent processing algorithm is adopted to detect object instance in maritime images, and it plays an increasingly important role in maritime object detection tasks.
Traditional maritime object detection algorithms generally follow a three-phase detection framework, namely, horizon detection, static-background subtraction, and foreground segmentation (Lyu et al., 2022). In the first phase, Fefilatyev et al. (2012) utilized Hough transform to detect the horizon position and thus reduced the object search space, and used threshold segmentation to obtain the maritime ship object after image registration. In the second phase, Chen et al. (2018) proposed a Gaussian mixture model to judge the pixels in the foreground part of the image, and then utilized background subtraction and adjacent frame continuity to segment the ship object. In the last phase, Chan (2021) proposed a maritime noise prior method to reduce the interference of noise on the sea surface, and thus improved the accuracy of foreground detection in complex maritime scenarios, and this method was based on a dark channel prior and observation of sea surface characteristics. From these works, it can be found that each phase of this traditional detection framework needs to be designed carefully and manually to ensure the detection performance. Furthermore, these algorithms (Fefilatyev et al., 2012; Chen et al., 2018; Chan, 2021; Zhu et al., 2023) could not efficiently extract high-dimensional semantic information; not only do they need to consume more manpower and time resources, but also the algorithms are easy to be disturbed by the complex marine environment, and they find it difficult to achieve stable maritime object detection.
Benefiting from deep learning (DL) technologies, the object detection algorithms based on the convolutional neural network (CNN) have aroused great interest of scholars. Based on the multi-layer topology structure, CNN can realize the automatic extraction of high-dimensional semantic information of images with stronger anti-interference ability (Simonyan and Zisserman, 2014; Girshick, 2015). CNN-based object detection algorithms are divided into two kinds: two-stage and one-stage algorithms. Generally, the former represented by the R-CNN series has a higher accuracy with a lower speed (Girshick, 2015; Ren et al., 2015; Sun et al., 2021). The latter represented by You Only Look Once (YOLO) series runs faster with a lower accuracy (Redmon and Farhadi, 2018; Bochkovskiy et al., 2020; Ultralytics, 2021; Wang et al., 2023). These DL-based object detection algorithms give a new direction for the research of maritime object detection. Bousetouane and Morris (2016) proposed a Fast-R-CNN-based surveillance algorithm for ship classification and detection in maritime scenarios to improve accuracy with faster speed. To improve marine object detection accuracy, Fu et al. (2021) fused a convolutional attention module in the YOLOv4 framework to enhance valid features and suppress invalid ones. Chang et al. (2022) proposed a modified YOLOv3 model with lower computation complexity through adjustment of input image size, number of convolution kernel, and detection scale, and then introduced the spatial pyramid pooling module to further improve the maritime ship detection accuracy. Recently, many useful technologies have emerged, such as multiple access (Chen et al., 2023; Xie et al., 2023), joint/separated source and channel coding (Xu et al., 2019; Xu et al., 2021; Fang et al., 2023; Xu et al., 2023), index modulation (Dai et al., 2023), and multi-receiver synthetic aperture sonar (Zhang et al., 2021; Zhang. et al., 2022; Yang, 2023; Zhang, 2023; Zhang et al., 2023a; Zhang et al., 2023b; Zhang et al., 2023c). The DL-based object detection algorithms combined with different technologies can build a better maritime object detection system to promote ocean observation.
In summary, DL-based maritime object detection algorithms are simpler, more efficient, and more robust against sea surface noise interference, compared with traditional algorithms. However, existing DL-based maritime object detection algorithms mainly focus on the improvement and optimization of CNN structures, neglecting the characteristics of maritime object instances. To solve this problem, an anchor box adaptive object detection algorithm based on the characteristics of maritime object instances is proposed for maritime video surveillance. The main contributions are as follows:
-
(1) A differential-evolutionary-based K-means (DK-means) anchor box clustering algorithm is proposed to generate adaptive anchor boxes to adapt for the characteristics of maritime object instances, improving the detection performance without extra computation.
-
(2) An adaptive spatial feature fusion (ASFF) module is added in the neck network to enhance multi-scale feature fusion to improve the detection performance.
-
(3) A new loss function that adopts focal loss and efficient intersection over union (IoU) loss is defined for the maritime object characteristics to improve network convergence speed.
-
(4) On the Singapore maritime dataset, the proposed method achieves 72.7% AP, outperforming the YOLOv5 small (YOLOv5s) by 7.1% with 113 FPS.
-
(5) The proposed method can perform better than the YOLOv5s in multi-scale maritime objection detection with tighter predicted bounding boxes and fewer number of redundant bounding boxes.
This paper is organized as follows: Section 2 describes the overall research of the proposed methodology in detail. The experimental results including ablation studies, performance comparison, and detection results are shown in Section 3. The paper is concluded in Section 4.
2 Proposed model and optimization
In the maritime surveillance, both real-time and accuracy of object detection need to be considered essentially. Thus, the one-stage object algorithm is chosen as the detection algorithm, which can realize speed–accuracy trade-off efficiently in the maritime object detection. Moreover, compared with other one-stage object algorithms, the YOLOv5s model is lightweight with a higher detection accuracy; thus, we choose it as our baseline model. The purpose of this study is to develop a maritime object detection model considering the characteristics of maritime object instances, and this optimized model can achieve higher accuracy while remaining lightweight.
This section details the main method of the proposed anchor boxes’ adaptive objection detection algorithm. Section 2.1 describes the overall structure of our model. The details of the proposed anchor boxes’ adaptive algorithm is described in Section 2.2. Sections 2.3 and 2.4 introduce the adaptive spatial feature fusion module and the loss function adopted, respectively.
2.1 Overall structure of our model
Figure 1 provides a detailed depiction of our model’s structure, which is composed of three components: the backbone structure, the enhanced neck, and the head. The backbone structure is tasked with extracting features from input images using predefined anchor boxes. Then, the enhanced neck is specifically designed to augment the fusion of these features. Lastly, the head plays the role of predicting maritime objects at three different scales. In the context of object detection algorithms that employ the anchor boxes’ mechanism, it is common practice to predefine nine anchor boxes of varying sizes and scales for feature maps. This strategy is implemented to ensure a high level of accuracy in object detection. To adapt to the characteristics of maritime object instances, we adopt the optimized anchor boxes (OABs) as a predefined substitute for the original ones, and the OABs are generated by the proposed DK-means algorithm.
Figure 1
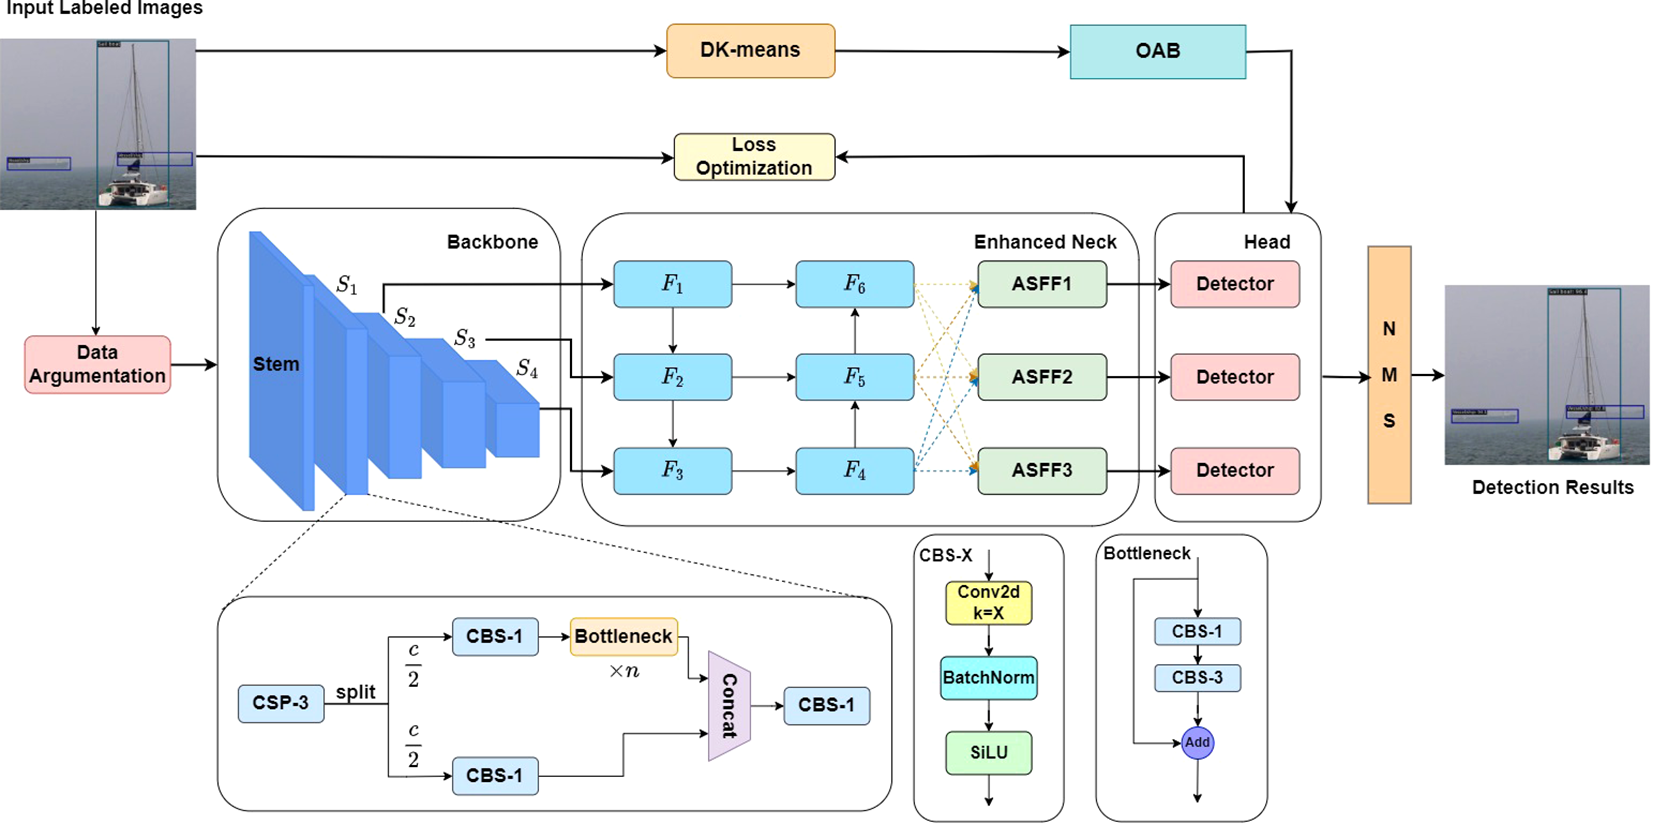
The overall structure of the detection model.
In the training process, the input labeled images are performed by data augmentation operations to increase feature diversity at first. Then, the processed images are performed by feature extraction and subsampling operations in the backbone network part. After three subsampling stages, the backbone generates three different scale feature maps. These feature maps are fed into the enhanced neck network part to reinforce semantic information in shallow feature maps and spatial information in deep feature maps. In the enhanced neck network, the ASFF modules (Liu et al., 2019) are utilized to enhance the multi-scale feature fusion, thus improving the multi-scale detection ability. Finally, the enhanced feature maps are fed into the head network part to obtain the predicted results. The loss values are calculated by comparing them with the label values, and the network parameters are updated through gradient information. Moreover, to make the trained network parameters more consistent with the characteristics of maritime objects, the loss function used in YOLOv5s are also optimized and improved. In the model inference process, the final detection results are obtained after non-maximum suppression (NMS) operation.
2.2 Anchor boxes adaptive algorithm
The predefined anchor boxes in the original detection model are sensitive to object scale: Specifically, smaller anchor boxes are ineffective at detecting larger objects, while larger anchor boxes struggle to accurately capture smaller objects. The mismatch between the aspect ratio of anchor boxes and the objects will result in the decrease in detection accuracy. How to obtain appropriate anchor boxes that can satisfy the characteristics of the maritime object instances is the key to improving the detection accuracy of the maritime object instances.
2.2.1 Characteristic analysis of maritime object instances
In this part, the Singapore marine dataset (SMD) (Prasad et al., 2017) is taken as an example to analyze the characteristics of the maritime object instances. According to the standard of the Common Objects in Context (COCO) dataset, the maritime object instances in the SMD can be classified into three classes: detection objects with an area less than 32×32 pixels are defined as small objects, detection objects with an area greater than 32 × 32 pixels and less than 96 × 96 pixels are defined as medium objects, and detection objects with an area greater than 96 × 96 pixels are defined as large objects. With these definitions, the scale distributions of the maritime object instances are shown in Figure 2A. From this figure, it can be seen that different types of maritime objects nearly have the different scales. Moreover, the scales of the different types of maritime objects are mainly medium and small. In Figure 2B, it can be found that maritime objects generally have a relatively high aspect ratio. Furthermore, the aspect ratio of the detection object can even reach 17.66 in extreme cases.
Figure 2
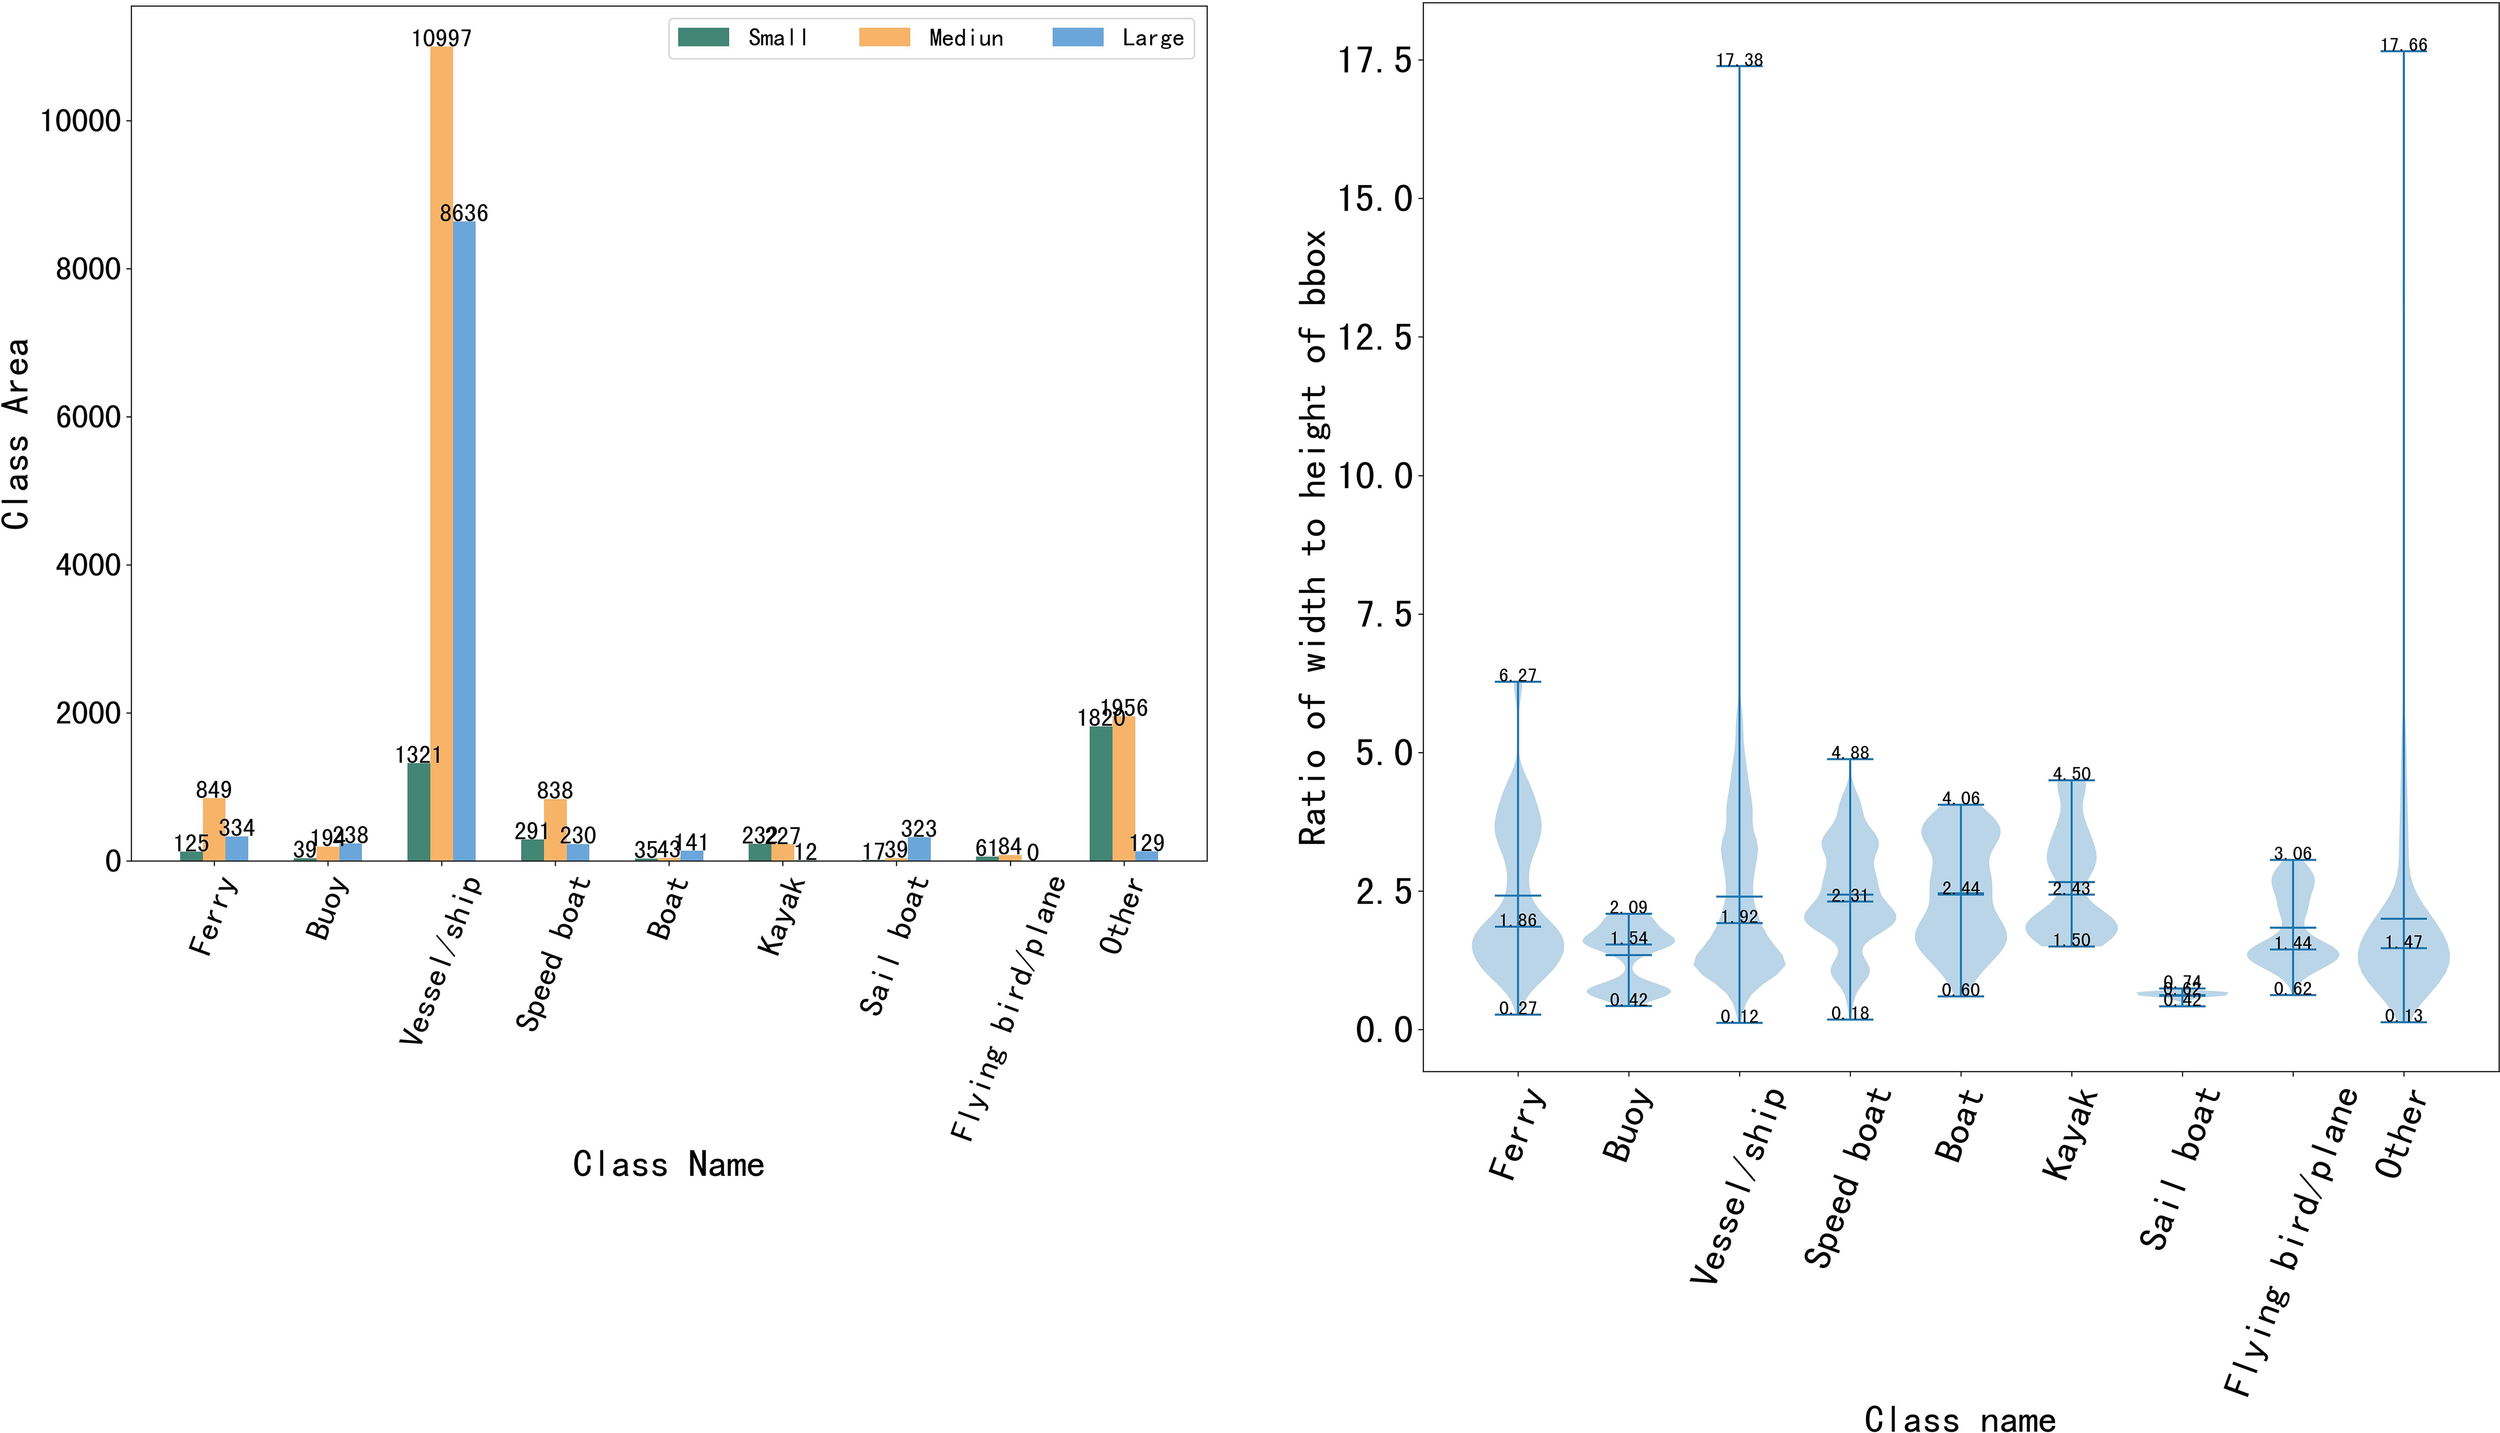
Characteristics of maritime object instances in the SMD dataset. (a) area and number of large, medium and small objects of each class and (b) width to height ratio distribution of class and bbox.
From the above analysis, it can be concluded that maritime object detection usually faces the following problems:
-
(1) The detection object has varying scales.
-
(2) The detection object has large aspect ratio difference.
2.2.2 Details of the proposed algorithm
In the YOLO series frameworks, the K-means clustering algorithm is usually adopted to generate adaptive anchor boxes, which will be used for training the detection model (Redmon and Farhadi, 2018; Bochkovskiy et al., 2020). However, influenced by the initial clustering centers, the results of the K-means clustering algorithm easily fall into the local optimal solution, making it difficult to generate the optimal predefined anchor boxes. The differential evolution (DE) algorithm (Storn and Price, 1997) is a kind of global search optimization algorithm that achieves evolution from the current population to the next generation through operations such as mutation, crossover, and selection, thus possessing the ability to search for global optimal solutions in the solution space. To solve this problem, the DE algorithm is introduced to reduce the dependence on the initial clustering centers and enhance global search ability. Through this method, the dependence of the K-means algorithm on initial values can be reduced and more robust predefined anchors can be obtained. The improved K-means clustering algorithm with the DE method is named DK-means clustering algorithm, which is shown in Algorithm 1. The parameters include the number of iteration Nt, the number of anchor boxes K, the population size Np, and ≜{1,2,…, N p}. The sample dataset is denoted by D. The tth generation of the population is denoted by , and the i-th candidate is denoted by .
The algorithm mainly includes three parts:
-
1) Line 1: The first part generates the initial population χ0 according to the sample dataset.
-
2) Lines 2–8: The second part finds Np candidates for group anchor boxes by the DE process including mutation and crossover operations at Nt generations.
-
3) Lines 9–11: The third part chooses the final optimized results for the output group anchor boxes as the clustering centers. Then, divide real anchors boxes into clusters with corresponding clustering centers according to the closest distance principle.
-
4) Line 12: Return the optimized anchor boxes as the output of this algorithm.
Remark 1: The best group anchors are chosen according to maximizing the IoU values as follows:
where the function f(·) returns the IoU values, and the Kbest-th candidate in the population is the optimized results.
2.3 Adaptive spatial feature fusion optimization
In the object detection, multi-scale features can be utilized to improve the model detection performance. When an image is input into CNN, different resolution feature maps can be obtained to detect objects at different scales, according to the different downsampling rates. Shallow feature maps with high resolution are suitable for detecting small objects due to their rich detailed information and small receptive fields, and deep feature maps with low resolution are suitable for detecting large objects due to their strong semantic information and large receptive fields. Therefore, fully utilizing the semantic and detailed information of features at different scales is of great significance for improving the object detection accuracy. To fully utilize multi-scale features, an adaptive spatial feature fusion (ASFF) module is introduced to the neck module to enhance multi-scale feature fusion. Figure 3 shows details of the ASSF module. The feature maps F4, F5, and F6 are fused adaptively and enhanced by the ASFF module at different spatial scales, and then transferred to head module. The feature fusion process can be represented by
Figure 3
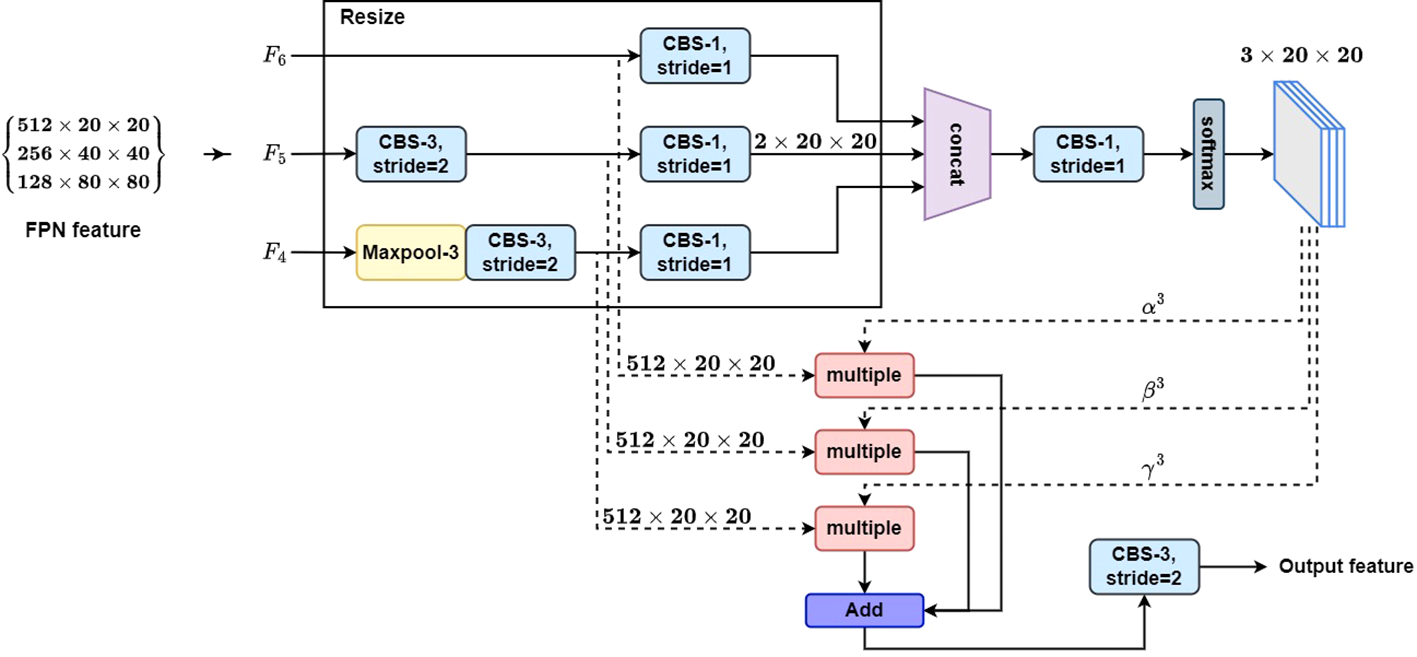
Adaptive spatial feature fusion module.
where represents the (i, j)-th feature vector of the output feature yl, and represents the (i, j) feature vector after adjusting nth level feature map to the same size of the lth level feature map. represent spatial importance weights of three different scale feature maps at the l-th level feature map, respectively, and . They can be defined by the softmax function. For example, can be calculated by
Algorithm 1
DK-means clustering algorithm.
              Input:
              D, Nt, K, Np, real anchor boxes.
Output: Real anchor boxes cluster results.
1: Generate Np candidates Xi0 randomly from D for i ∈ , and every candidate has K anchor boxes.
Here, .
2: fort = 1 → Ntdo
3: fori = 1→ Npdo
4: Mutation operations are performed with random r1,r2,r3 ∈ , and :

where , and j = {1,2,…,d} is the dimension number of the sample in the dataset.
5: Crossover operations are performed:

where , and j = {1,2,…,d}.
6: Fitness function calculation:

7: end for\∗ Np ∗\
8: end for\∗ Nt ∗\
9:
10: Choose the results of  as the clustering centers.
11: Divide real anchors boxes into clusters with corresponding clustering centers  according to closest distance principle.
12: return cluster results.
where , and are the control parameters of the softmax function, which can be trained and learned by 1 × 1 convolution operation.
2.4 Loss function optimization
The loss function ℒ used in our improved network is a combination of three loss functions: the classification loss ℒcls, the localization loss ℒreg, and the confidence loss ℒobj. It is represented by
where λ1, λ2, and λ3 represent balance factors, whose values are 1.0, 0.05, and 0.1, respectively. They are used to control the impact of different loss functions on the network training process. In the YOLOv5 model, cross entropy (CE) loss function ℒce is adopted as classification and confidence loss functions, and the complete IoU (CIoU) loss is adopted as localization loss. The CE loss function is represented by
where y denotes the true value of the label category and y ∈ { ± 1}, and p denotes category prediction probability when y = 1 and p ∈ [0,1].
In the task of bounding box regression, the localization loss function is divided into two categories: n-norm-based and IoU-based loss (Tian et al., 2022). To reduce the sensitivity of the model to the scale changes of object and improve convergence speed of the model, the complete IoU (CIoU) loss is adopted as localization loss in the YOLOv5 model and it is expressed by
where IoU represents the intersection over union between the predicted bounding box and the ground truth bounding box, bpr and bgt represent centers of the predicted bounding box and the ground truth bounding box respectively, and c is the diagonal length of the smallest covering box. represents the Euclidean distance between the center points of two bounding boxes, λ represents the balance factor, and v represents the consistency of the aspect ratio between the predicted bounding box and the ground truth bounding box. IoU can be described as Figure 4 and is expressed by
Figure 4
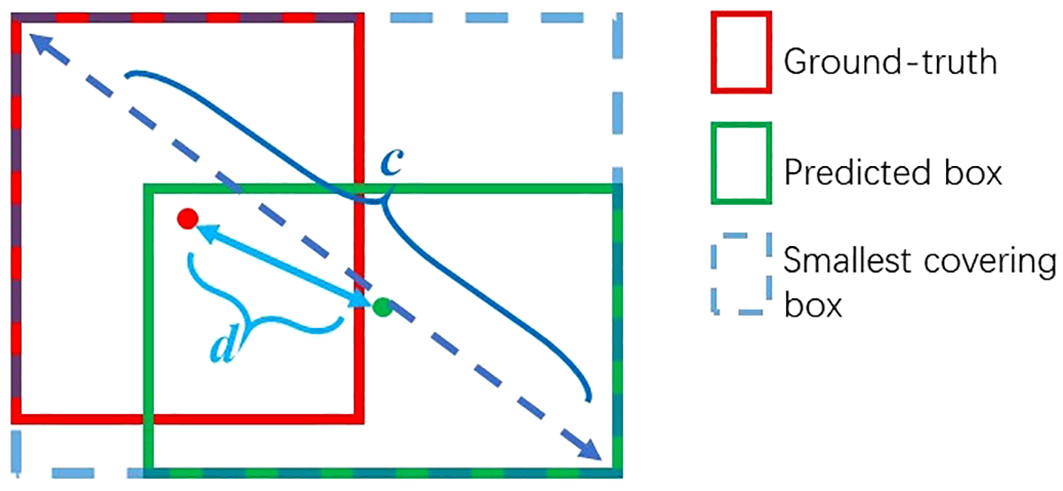
Description of IoU.
and v is expressed by
where wgt and wpr represent the width of the ground truth and the predicted bounding boxes respectively, and hgt and hpr represent the height of the ground truth and the predicted bounding boxes respectively. Thus, Equation 7 becomes
where and represent the cross entropy loss adopted for the classification loss and the confidence loss functions, and represents the CIoU loss adopted for the localization loss function.
2.4.1 Focal loss function
To improve detection accuracy, the anchor box detection mechanism usually requires a dense set of the distribution of anchor boxes in images, which can easily lead to an imbalanced problem between positive and negative samples. To alleviate this imbalanced problem, a focal loss (FL) function (Lin et al., 2017) is introduced. Define pt as
Thus, Equation 8 can be rewritten as
The FL function is expressed by
where (1 − pt)γ represents an adjustment factor, γ represents an adjustable focusing parameter, and αt represents a balanced parameter. Equation 7 can be modified as
where represents the FL function, which is adopted for the classification loss.
2.4.2 Efficient IoU loss function
From Equation 11, it can be found that v just considers the aspect ratio difference between the predicted bounding box and the ground truth bounding box, ignoring the difference between specific values of width and height. In this way, the penalty term v is almost no longer effective, as the width and height cannot be simultaneously enlarged or reduced. To make the detection model more suitable for the maritime objects with varying scales in the marine environment, we adopt the idea of the efficient IoU (EIoU) (Zhang Y.-F.et al., 2022), and the v is modified as
where and are the width and height of the smallest enclosing box covering the ground truth and predicted bounding boxes, and and are the width and height difference between the ground truth bounding box and the predicted bounding box, respectively. According to Equation 17, Equation 16 can be further modified as
where is the EIoU loss function, and the only difference between the EIoU used in this paper and the CIoU is the penalty term. The EIoU loss will bring faster convergence speed and better localization effect.
3 Experimental result and analysis
3.1 Dataset construction
In this section, the experiments adopt SMD (Prasad et al., 2017), which contains large video data with labeled bounding boxes. Detection objects in SMD include nine categories, namely, ferry, buoy, vessel/ship, speed boat, boat, kayak, sail boat, flying bird/plane, and other. In the DL-based object detection algorithms, the construction of a sizable and representative dataset is the first and important step. By sampling images from the SMD at one time per five frames, 6,350 maritime images are obtained, and each image has a resolution of 1,920 × 1,080 pixels. They are split into train, validation, and test sets at a ratio of 6:2:2 with COCO style. The dataset construction process is shown in Figure 5.
Figure 5
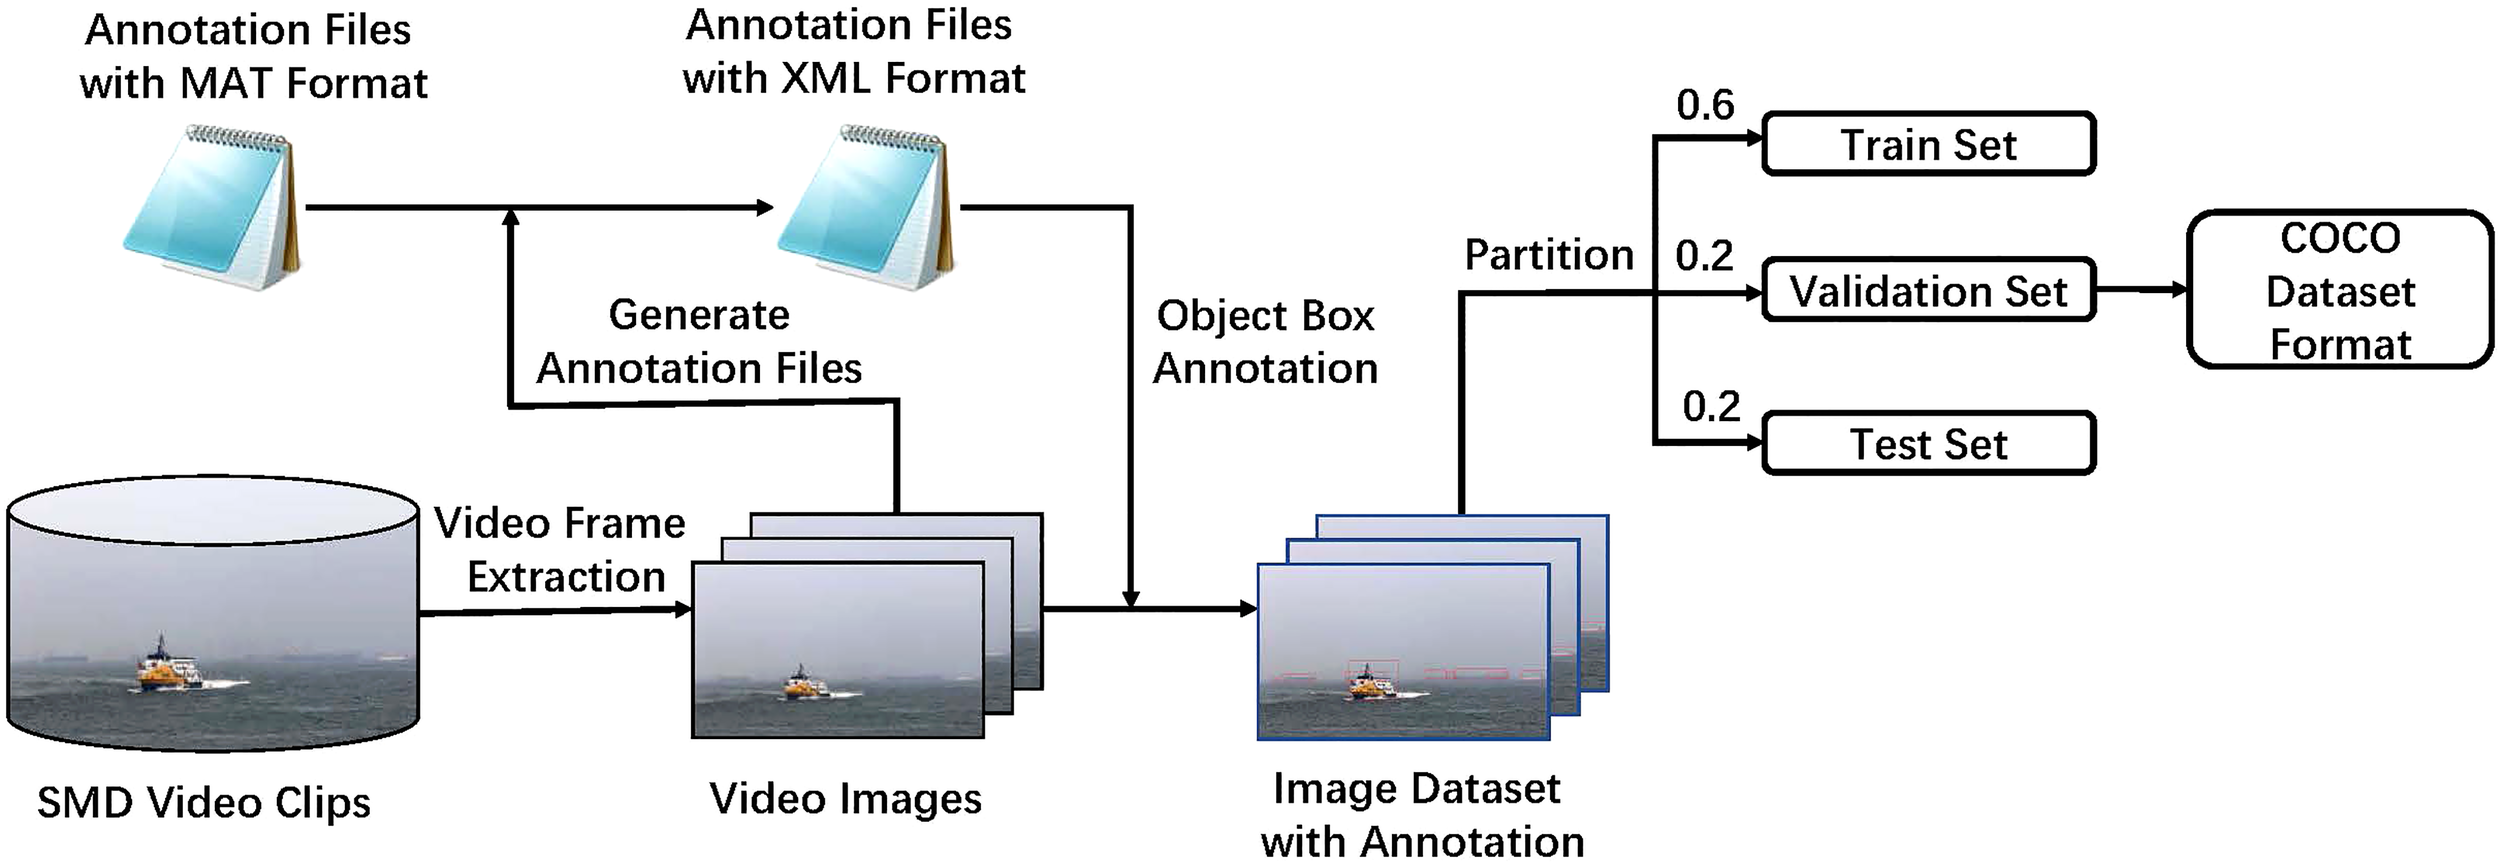
The construction process of the dataset.
3.2 Experimental environment
The experiments are all carried out using PyTorch 1.12.1 and CUDA 11.3 on an NVIDIA RTX 3090 GPU and an Intel Core i9-10920X CPU. The details of the experimental hardware and software environment are shown in Table 1. A momentum gradient descent algorithm with a momentum value of 0.937 is adopted in the train model. In the train process, the input image is fixed at 640 × 640, the batch size is set to 32, and the total number of train epochs is set to 150. The initial learning rate is set to 0.0025 and the linear decline strategy is used as the learning rate attenuation strategy. Moreover, to maintain the stability of the model in the initial train stage, a warm-up training strategy is adopted in the first three epochs to gradually increase the learning rate from 0 to the initial learning rate. Moreover, for each stage in Figure 1 (represented as S1,S2,S3,S4), we respectively configure the number of bottlenecks as [3, 6, 9, 3], and perform downsampling operation within the first convolution layer of each stage. In addition, we adhere to the yolov5s configuration, setting the scaling factors for width and depth to 0.5 and 0.33, respectively.
Table 1
| Configuration | Project Model | Parameter |
|---|---|---|
| Hardware Environment | CPU RAM | Intel Core i9-10920X 64 GB |
| GPU | NVIDIA RTX3090 (24GB) | |
| Software Environment | System Pytorch | Ubuntu 20.04 V1.12.1 |
| Python | V3.8 | |
| CUDA | V11.3 |
Experimental hardware/software environment.
3.3 Evaluation metrics
Average precision (AP) (Padilla et al., 2021) is utilized as an indicator to evaluate the accuracy of the maritime object detection algorithm. AP can be expressed by
where N represents the number of object categories, and P and R represent precision and recall rate respectively, which are expressed by
where TP represents the number of correct predicted positive samples, FP represents the number of negative samples predicted as positive samples, and FN represents the number of positive samples predicted as negative samples. From Equations 19–21, it can be inferred that P and R measure the model’s ability to accurately predict and locate objects respectively, and AP is the comprehensive evaluation of these two indicators. Here, the AP value means that the IoU threshold is set from 0.50 to 0.95 with a 0.05 step. AP50 and AP75 mean that the IoU threshold is set to 0.5 and 0.75, respectively. APS, APM, and APL denote small, medium, and large ground-truth objects, respectively.
Moreover, frames per second (FPS) is used to measure model detection speed. Model size and floating point operations (FLOPs) are used for evaluating the occupied memory of the model and calculation complexity, respectively, and they are as follows:
Where KW and KH represent the width and height of the convolutional kernel, respectively, Cin and Cout represent the number of input and output channels, respectively, and FW and FH represent the width and height of the feature map.
3.4 Detection performance comparison with different anchor box algorithms
In this part, the predefined anchor boxes, which are obtained from different clustering algorithms, are shown in Table 2 and the detection performance on the SMD dataset with different anchor boxes is shown in Table 3. From Table 3, it can be seen that YOLOv5s with predefined anchor boxes generated by the K-means and DK-means algorithm improve AP value by 1.9% and 3.3%, respectively, when compared with the original method, and the DK-means algorithm can perform better than the K-means algorithm by 1.4%. Moreover, when the threshold of IoU increases to 0.75, the DK-means algorithm can achieve 6.0% AP value improvement, compared with the original method. Furthermore, in the DK-means method, the small object detection performance APS is improved by 6.5% and the medium object detection performance APM is improved by 4.3% with a slight large object detection performance loss, when compared with the original method.
Table 2
| Algorithm | 80 × 80 | 40 × 40 | 20 × 20 |
|---|---|---|---|
| (10,13) | (30,61) | (116,90) | |
| Original method | (16,30) | (62,45) | (156,198) |
| (33,23) | (59,119) | (373, 326) | |
| (11,9) | (54,15) | (46,53) | |
| K-means | (22,8) | (34,26) | (149,52) |
| (20,15) | (87,23) | (263,94) | |
| (11,9) | (45,13) | (47, 39) | |
| DK-means | (19, 7) | (31,22) | (135,41) |
| (17,12) | (69,18) | (189,70) |
The results of different anchor box algorithms.
Table 3
| Algorithms | AP | AP50 | AP75 | APS | APM | APL |
|---|---|---|---|---|---|---|
| Original method | 67.9% | 96.1% | 73.3% | 52.2% | 61.8% | 87.3% |
| K-means | 69.8% | 97.2% | 78.1% | 54.3% | 64.4% | 86.8% |
| DK-means | 71.2% | 97.5% | 79.3% | 58.7% | 66.1% | 86.6% |
The experimental results of different anchor box algorithms on the SMD test dataset.
The bold values mean that the best values in the relevant columns of the table.
3.5 Ablation studies
This section presents the ablation studies to illustrate the effects of FL function, ASFF module, and the DK-means algorithm in the detection model. The ablation studies are shown in Table 4, where ✓ and ✗ denote the detection model with or without relevant modules or algorithm, respectively. The first line in this table show the YOLOv5s (baseline model) without any improvement. When single EIoU, FL function, or the ASFF module is adopted, the AP values are increased by approximately 0.4%, 2.2%, or 1.7% with improvement of multi-scale detection ability, respectively. As shown in the last line in this table, when the DK-mean algorithm is further adopted, the AP value is increased by 3.3%. Compared to the standard detection model, the optimized scheme can achieve 4.8% improvement and the small and medium object detection performances are also increased by 10.9% and 4.8% respectively.
Table 4
| EIoU | FL function | ASFF module | DK-means | AP | AP50 | AP75 | APS | APM | APL |
|---|---|---|---|---|---|---|---|---|---|
| ✗ | ✗ | ✗ | ✗ | 67.9% | 96.1% | 73.3% | 52.2% | 61.8% | 87.3% |
| ✓ | ✗ | ✗ | ✗ | 68.3% | 96.2% | 75.7% | 54.8% | 61.1% | 87.4% |
| ✗ | ✓ | ✗ | ✗ | 70.1% | 96.2% | 76.9% | 56.8% | 64.1% | 87.5% |
| ✗ | ✗ | ✓ | ✗ | 69.6% | 97.0% | 74.7% | 55.0% | 62.9% | 87.8% |
| ✗ | ✗ | ✗ | ✓ | 71.2% | 97.5% | 79.3% | 58.7% | 66.1% | 86.6% |
| ✓ | ✓ | ✗ | ✗ | 69.9% | 96.6% | 77.3% | 60.0% | 63.7% | 87.7% |
| ✗ | ✓ | ✓ | ✗ | 71.1% | 97.2% | 77.4% | 58.6% | 64.5% | 88.5% |
| ✓ | ✓ | ✓ | ✓ | 72.7% | 97.7% | 81.1% | 63.1% | 66.6% | 87.0% |
Ablation experiments.
The bold values mean that the best values in the relevant columns of the table.
3.6 Detection performance comparison with other object techniques
In this part, the proposed detection model performance comparison with other object detection techniques is shown in Table 5. The comparison models include YOLOX-s (Ge et al., 2021), YOLOv8-s (Ultralytics, 2023), YOLOv7-tiny (Wang et al., 2023), YOLOv5s (Ultralytics, 2021), YOLOv5m (Ultralytics, 2021), and YOLOv5l (Ultralytics, 2021). From Table 5, it can be seen that the proposed detection model can achieve best results between accuracy and detection speed. The AP value of our model is 0.6%, 1.6%, 1.6%, 3.7%, 4.8%. and 5.7% higher than that of YOLOv5l, YOLOv5m, YOLOv8s, YOLOX-s, YOLOv5s, and YOLOv7-tiny, respectively, which means that our proposed model has the best accuracy among these counterparts. The proposed model’s FPS value is 113 and detects faster than YOLOv51, YOLOX-s, and YOLOv5s. Moreover, the model size of the proposed model is smaller than YOLOv5m and YOLOv5l, and the FLOPs of the proposed model are fewer than YOLOX-s, YOLOv5m, YOLOv51, and YOLOv8s. All these show that the proposed model can achieve satisfactory results among accuracy, detection speed, model size, and calculation complexity.
Table 5
| Methods | AP | Model Size | FLOPs | FPS |
|---|---|---|---|---|
| YOLOX-s (Ge et al., 2021) | 69.0% | 8.97M | 13.40G | 86 |
| YOLOv8s (Ultralytics, 2023) | 71.1% | 11.14M | 14.28G | 182 |
| YOLOv7-tiny (Wang et al., 2023) | 67.0% | 6.23M | 6.89G | 143 |
| YOLOv5s (Ultralytics, 2021) | 67.9% | 7.24M | 8.27G | 131 |
| YOLOv5m (Ultralytics, 2021) | 71.1% | 21.19M | 24.53G | 104 |
| YOLOv5l (Ultralytics, 2021) | 72.1% | 46.56M | 54.65G | 82 |
| Proposed model | 72.7% | 10.14M | 10.81G | 113 |
The experi|mental results with different object detection algorithms on the SMD dataset.
The bold values mean that the best values in the relevant columns of the table.
The detection results on the SeaShips dataset (Shao et al., 2018) are shown in Table 6. The SeaShips is a large dataset dedicated to maritime shipping detection, and it includes 31,455 images with 7,000 open-source images. We also divided the open-source part of the Seaships dataset in a 6:2:2 ratio with a COCO format, which is consistent with the processing method of the SMD dataset. Here, the proposed method is compared with the baseline YOLOv5s. From this table, we can see that our proposed model performs better than the YOLOv5s in many aspects. These means that our model can perform well on other datasets.
Table 6
| Methods | AP | AP50 | AP75 | APS | APM | APL |
|---|---|---|---|---|---|---|
| YOLOv5s (Ultralytics, 2021) | 68.2% | 97.7% | 81.7% | − | 51.2% | 69.3% |
| Proposed model | 80.1% | 98.9% | 92.7% | − | 61.5% | 81.3% |
The experimental results on the Seaships dataset.
3.7 Detection results on the SMD dataset
Figure 6 shows the detection results of the proposed model in different weather and light intensity conditions on the SMD dataset.
Figure 6
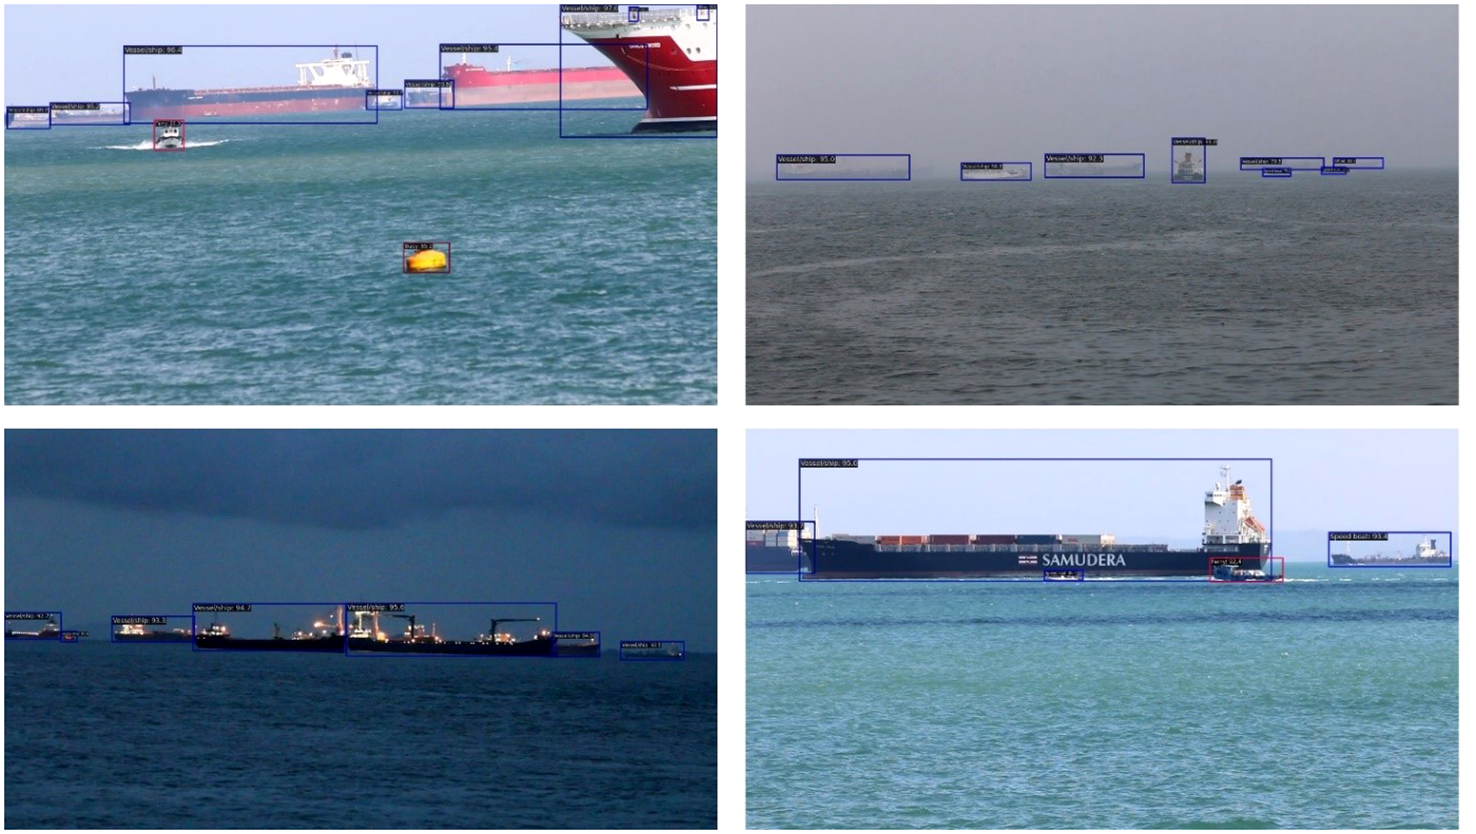
Detection results of the proposed model in various environment conditions.
Figure 7 shows the detection result comparisons between YOLOv5s and the proposed model. The subfigures in the first column are the detection results of YOLOv5s, and those in the second column are the detection results of the proposed model. From this figure, it can be seen that the proposed detection model can achieve more accurate detection of maritime object instances with tighter predicted bounding boxes and fewer number of redundant bounding boxes.
Figure 7
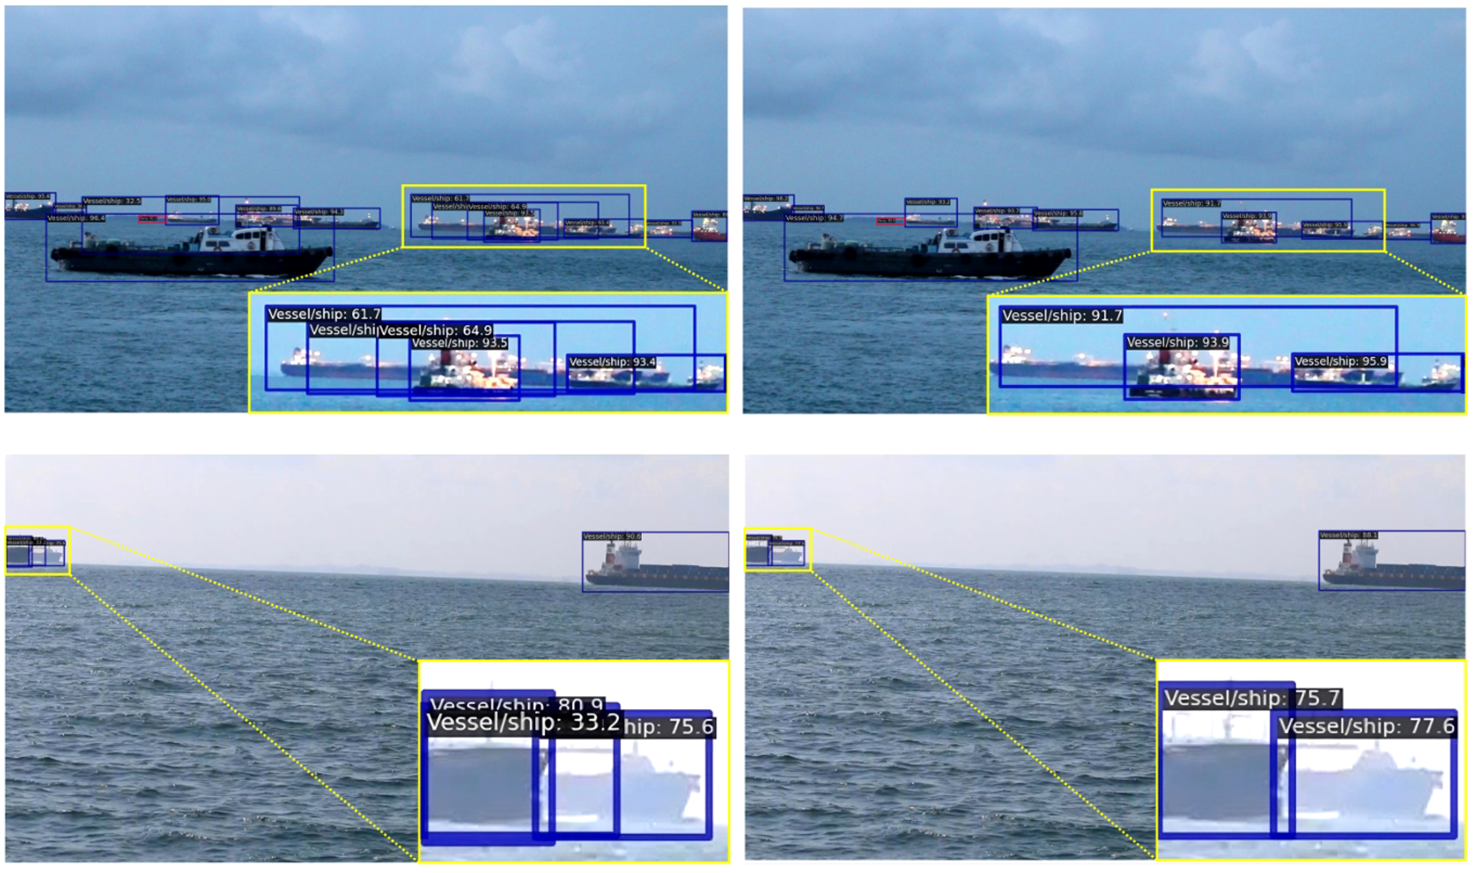
Detection result comparisons of different object detection algorithms.
4 Conclusions
In this paper, we propose a maritime object detection algorithm for maritime video surveillance. At first, a DE-based K-means anchor box clustering algorithm, considering the maritime object characteristics, is proposed to realize the adaptive anchor boxes. Then, to enhance the multi-scale feature fusion, the neck network adopts the ASFF module. Lastly, the loss function integrates the focal loss and efficient IoU loss is defined to alleviate the samples’ imbalanced problem and consider the varying scales of the maritime objects. All consider the complexity characteristic of maritime objects. The ablation studies show that the proposed algorithm meets the multi-scale maritime object detection performance. The experimental results show that AP can reach 72.7%, which is 4.8% higher than YOLOv5s, and better than YOLOv5m and YOLOv5l; this algorithm does not occupy high additional computational resources, and its inference speed can reach 113 FPS, which can achieve better speed–accuracy balance.
How to make the proposed model lightweight for resource-constrained devices with less detection accuracy loss will be a meaningful topic for future research.
Statements
Data availability statement
The raw data supporting the conclusions of this article will be made available by the authors, without undue reservation.
Author contributions
JZ: Writing – original draft, Writing – review & editing, Conceptualization, Formal Analysis, Funding acquisition, Investigation, Methodology, Resources, Supervision, Visualization. SZ: Writing – original draft, Writing – review & editing, Conceptualization, Data curation, Formal Analysis, Investigation, Methodology, Validation, Visualization. ZX: Writing – original draft, Writing – review & editing, Conceptualization, Formal Analysis, Funding acquisition, Investigation, Methodology, Resources, Software, Supervision, Validation, Visualization. LZ: Data curation, Visualization, Writing – review & editing. JL: Supervision, Writing – review & editing.
Funding
The author(s) declare financial support was received for the research, authorship, and/or publication of this article. This work was supported by the Xiamen Ocean and Fishery Development Special Fund Project (No. 21CZB013HJ15), the Xiamen Key Laboratory of Marine Intelligent Terminal R&D and Application (No. B18208), the Fund Project of Jimei University (No. ZP2020042), the Fujian Province Young and Middle-aged Teacher Education Research Project (No. JAT220182), Jimei University Startup Research Project (No. ZQ2022039) and the Scientific Research Foundation of Jimei University (No. XJ2022000201).
Conflict of interest
Author JL is employed by Fujian Electronic Port Co., Ltd, Xiamen, China.
The remaining authors declare that the research was conducted in the absence of any commercial or financial relationships that could be construed as a potential conflict of interest.
Publisher’s note
All claims expressed in this article are solely those of the authors and do not necessarily represent those of their affiliated organizations, or those of the publisher, the editors and the reviewers. Any product that may be evaluated in this article, or claim that may be made by its manufacturer, is not guaranteed or endorsed by the publisher.
References
1
Bochkovskiy A. Wang C.-Y. Liao H.-Y. M. (2020). Yolov4: Optimal speed and accuracy of object detection. arXiv preprint arXiv:2004.10934.
2
Bousetouane F. Morris B. (2016). “Fast cnn surveillance pipeline for fine-grained vessel classification and detection in maritime scenarios,” in 2016 13th IEEE International Conference on Advanced Video and Signal Based Surveillance (AVSS). 242–248 (IEEE).
3
Chan Y.-T. (2021). Maritime filtering for images and videos. Signal Processing: Image Communication99, 116477.
4
Chang L. Chen Y.-T. Wang J.-H. Chang Y.-L. (2022). Modified yolov3 for ship detection with visible and infrared images. Electronics11, 739. doi: 10.3390/electronics11050739
5
Chen P. Shi L. Fang Y. Lau F. C. Cheng J. (2023). Rate-diverse multiple access over Gaussian channels. IEEE Trans. Wireless Commun. doi: 10.1109/TWC.2022.3233798
6
Chen Z. Yang J. Chen Z. Kang Z. (2018). Ship target detection algorithm for maritime surveillance video based on gaussian mixture model. J. Physics: Conf. Ser.1098, 012021.
7
Dai L. Fang Y. Guan Y. L. Guizani M. (2023). Design of protograph LDPC-coded MIMO-VLC systems with generalized spatial modulation. China Communication.
8
Fang Y. Zhuo J. Ma H. Mumtaz S. Li Y. (2023). Design and analysis of a new indexmodulation-aided DCSK system with frequency-and-time resources. IEEE Trans. Vehicular Technol.
9
Fefilatyev S. Goldgof D. Shreve M. Lembke C. (2012). Detection and tracking of ships in open sea with rapidly moving buoy-mounted camera system. Ocean Eng.54, 1–12. doi: 10.1016/j.oceaneng.2012.06.028
10
Fu H. Song G. Wang Y. (2021). Improved yolov4 marine target detection combined with cbam. Symmetry13, 623. doi: 10.3390/sym13040623
11
Ge Z. Liu S. Wang F. Li Z. Sun J. (2021). Yolox: Exceeding yolo series in 2021. arXiv preprint.
12
Girshick R. (2015). “Fast r-cnn,” in Proceedings of the IEEE international conference on computer vision. 1440–1448.
13
Lin T.-Y. Goyal P. Girshick R. He K. Dollár P. (2017). “Focal loss for dense object detection,” in Proceedings of the IEEE international conference on computer vision. 2980–2988.
14
Liu S. Huang D. Wang Y. (2019). Learning spatial fusion for single-shot object detection. arXiv preprint arXiv:1911.09516.
15
Lyu H. Shao Z. Cheng T. Yin Y. Gao X. (2022). “Sea-surface object detection based on electro-optical sensors: A review,” in IEEE Intelligent Transportation Systems Magazine. 2–27.
16
Padilla R. Passos W. L. Dias T. L. Netto S. L. Da Silva E. A. (2021). A comparative analysis of object detection metrics with a companion open-source toolkit. Electronics10, 279. doi: 10.3390/electronics10030279
17
Prasad D. K. Rajan D. Rachmawati L. Rajabally E. Quek C. (2017). Video processing from electro-optical sensors for object detection and tracking in a maritime environment: A survey. IEEE Trans. Intelligent Transportation Syst.18, 1993–2016. doi: 10.1109/TITS.2016.2634580
18
Redmon J. Farhadi A. (2018). Yolov3: An incremental improvement. arXiv preprint arXiv:1804.02767.
19
Ren S. He K. Girshick R. Sun J. (2015). Faster r-cnn: Towards real-time object detection with region proposal networks. Adv. Neural Inf. Process. Syst.28.
20
Shao Z. Wu W. Wang Z. Du W. Li C. (2018). Seaships: A large-scale precisely annotated dataset for ship detection. IEEE Trans. multimedia20, 2593–2604. doi: 10.1109/TMM.2018.2865686
21
Simonyan K. Zisserman A. (2014). Very deep convolutional networks for large-scale image recognition. arXiv preprint arXiv:1409.1556.
22
Storn R. Price K. (1997). Differential evolution–a simple and efficient heuristic for global optimization over continuous spaces. J. Global optimization11, 341–359. doi: 10.1023/A:1008202821328
23
Sun P. Zhang R. Jiang Y. Kong T. Xu C. Zhan W. et al . (2021). “Sparse r-cnn: End-to-end object detection with learnable proposals,” in Proceedings of the IEEE/CVF conference on computer vision and pattern recognition. 14454–14463.
24
Tian Y. Su D. Lauria S. Liu X. (2022). Recent advances on loss functions in deep learning for computer vision. Neurocomputing497, 129–158. doi: 10.1016/j.neucom.2022.04.127
25
Ultralytics . (2021). YOLOv5. Available at: https://github.com/ultralytics/yolov5.
26
Ultralytics . (2023). YOLOv8. Available at: https://github.com/ultralytics/ultralytics.
27
Wang C.-Y. Bochkovskiy A. Liao H.-Y. M. (2023). “Yolov7: Trainable bag-of-freebies sets new state-of-the-art for real-time object detectors,” in Proceedings of the IEEE/CVF Conference on Computer Vision and Pattern Recognition. 7464–7475.
28
Xie K. Cai G. Kaddoum G. He J. (2023). Performance analysis and resource allocation of STAR-RIS aided wireless-powered NOMA system. IEEE Trans. Commun. doi: 10.1109/TCOMM.2023.3292471
29
Xu Z. Song D. Zheng J. Wang L. (2023). Joint-decoding-complexity-oriented collaborative design for joint source-channel coding system based on double protograph-LDPC codes. Sci. China Inf. Sci.66, 189301. doi: 10.1007/s11432-022-3765-2
30
Xu Z. Wang L. Chen G. (2021). Joint coding/decoding optimization for DC-BICM system: Collaborative design. IEEE Commun. Lett.25, 2487–2491. doi: 10.1109/LCOMM.2021.3081678
31
Xu Z. Wang L. Hong S. Lau F. C. Sham C.-W. (2019). Joint shuffled scheduling decoding algorithm for DP-LDPC codes-based JSCC systems. IEEE Wireless Commun. Lett.8, 1696–1699. doi: 10.1109/LWC.2019.2937766
32
Yang P. (2023). An imaging algorithm for high-resolution imaging sonar system. Multimedia Tools Appl., 1–17. doi: 10.1007/s11042-023-16757-0
33
Zhang M. Cai G. He J. (2023a). Performance analysis of MAC protocols for single-cell LoRa network with power control. IEEE Commun. Lett. doi: 10.1109/LCOMM.2023.3314030
34
Zhang X. (2023). An efficient method for the simulation of multireceiver SAS raw signal. Multimedia Tools Appl. doi: 10.1007/s11042-023-16992-5
35
Zhang X. Wu H. Sun H. Ying W. (2021). Multireceiver sas imagery based on monostatic conversion. IEEE J. Selected Topics Appl. Earth Observations Remote Sens.14, 10835–10853. doi: 10.1109/JSTARS.2021.3121405
36
Zhang X. Yang P. Huang P. Sun H. Ying W. (2022). Wide-bandwidth signal-based multireceiver sas imagery using extended chirp scaling algorithm. IET Radar Sonar Navigation16, 531–541. doi: 10.1049/rsn2.12200
37
Zhang X. Yang P. Sun H. (2023b). An omega-k algorithm for multireceiver synthetic aperture sonar. Electron. Lett.59, e12859. doi: 10.1049/ell2.12859
38
Zhang X. Yang P. Zhou M. (2023c). Multireceiver SAS imagery with generalized PCA. IEEE Geosci. Remote Sens. Lett. doi: 10.1109/LGRS.2023.3286180
39
Zhang Y.-F. Ren W. Zhang Z. Jia Z. Wang L. Tan T. (2022). Focal and efficient iou loss for accurate bounding box regression. Neurocomputing506, 146–157. doi: 10.1016/j.neucom.2022.07.042
40
Zhu J. Song Y. Jiang N. Xie Z. Fan C. Huang X. (2023). Enhanced doppler resolution and sidelobe suppression performance for golay complementary waveforms. Remote Sens.15. doi: 10.3390/rs15092452
Summary
Keywords
maritime video surveillance, object detection, anchor box, You Only Look Once, adaptive spatial feature fusion
Citation
Zheng J, Zhao S, Xu Z, Zhang L and Liu J (2023) Anchor boxes adaptive optimization algorithm for maritime object detection in video surveillance. Front. Mar. Sci. 10:1290931. doi: 10.3389/fmars.2023.1290931
Received
08 September 2023
Accepted
20 November 2023
Published
08 December 2023
Volume
10 - 2023
Edited by
Xuebo Zhang, Northwest Normal University, China
Reviewed by
Jia Liu, Chinese Academy of Sciences (CAS), China
Rongxin Zhang, Xiamen University, China
Chong Xiao Wang, Agency for Science, Technology and Research (A*STAR), Singapore
Updates
Copyright
© 2023 Zheng, Zhao, Xu, Zhang and Liu.
This is an open-access article distributed under the terms of the Creative Commons Attribution License (CC BY). The use, distribution or reproduction in other forums is permitted, provided the original author(s) and the copyright owner(s) are credited and that the original publication in this journal is cited, in accordance with accepted academic practice. No use, distribution or reproduction is permitted which does not comply with these terms.
*Correspondence: Zhiping Xu, zhipingxu@jmu.edu.cn
Disclaimer
All claims expressed in this article are solely those of the authors and do not necessarily represent those of their affiliated organizations, or those of the publisher, the editors and the reviewers. Any product that may be evaluated in this article or claim that may be made by its manufacturer is not guaranteed or endorsed by the publisher.