Abstract
Introduction:
Many coral reefs witness an ongoing coral-to-algae phase shift. Corals and algae release large quantities of (in)organic nutrients daily, of which a large part is utilized by sponges. In turn, sponges are important cyclers of precious resources to other inhabitants on reefs residing in oligotrophic waters. Here, we investigated whether sponge holobionts (i.e., host and prokaryotic symbionts) adapt their physiology to food released by coral- versus macroalgae.
Methods:
Thereto, two sponge species, Plakortis angulospiculatus and Halisarca caerulea (high and low microbial abundance, respectively), were continuously exposed for 12 days to coral and macroalgal exudates in running seawater aquaria. Transcript expression of host and prokaryotic symbionts, changes in prokaryotic community composition, and holobiont physiological responses (i.e., respiratory demand, fluxes of carbon and nitrogen) were investigated after coral- versus macroalgae dominated treatments and compared to a seawater only control treatment.
Results:
In both sponge holobionts differential transcript expression between the coral and macroalgae treatments was very low (<0.01% of total transcripts). Differential expression was found in genes targeting cellular signaling pathways, e.g., cell proliferation (upregulated in coral treatment), and immune response (upregulated in macroalgal treatment). The sponge-associated prokaryotic community composition and sponge physiological responses were similar in all treatments, yet differed significantly between the two species.
Discussion:
After 12 days of exposure sponges appear to opportunistically feed on different food sources without having to adjust their metabolic pathways or associated prokaryotic communities. This suggests that sponges could be well-adapted to predicted changes in food source availability due to coral-to-algal phase shifts on many coral reefs.
Introduction
Coral reefs are biological hotspots of life in the ocean. The efficiency and productivity of reef ecosystems is influenced by interactions between species that can enhance resource use, biogeochemical cycling, and ecosystem structure and functioning (Bruno and Bertness, 2001; Stachowicz, 2001; Hooper et al., 2005). Over the past decades, coral reefs have been under threat by climate change and anthropogenic disturbances that are altering coral reef benthic community structure worldwide, including a shift from coral to algal dominance (Hughes, 1994; McManus and Polsenberg, 2004; Mumby and Steneck, 2008), most apparent in the Caribbean, South-West Atlantic, and Central Pacific (Reverter et al., 2021). In the Caribbean Sea, the average benthic cover of algae is now higher than of hard corals (Reverter et al., 2021).
While corals and algae are the main producers of organic matter on coral reefs (Wild et al., 2010; Haas et al., 2011; Mueller et al., 2014a), sponges perform important functions within these ecosystems through the uptake, processing, and release of organic and inorganic nutrients (Maldonado et al., 2012; de Goeij et al., 2013; de Goeij et al., 2017). Coral- and algae-produced exudates contain inorganic nutrients, but mainly consists of suspended organic matter (e.g., coral mucus) and, to largest part, dissolved organic matter (DOM), which is retained within reef communities through both bacterioplankton and sponges through the so-called microbial loop (Azam et al., 1983) and sponge loop (de Goeij et al., 2013). Sponge holobionts efficiently process a wide variety of organic and inorganic substances through symbiosis between the actively filter-feeding sponge host and its abundant and diverse microbial symbionts (Taylor et al., 2007; Webster and Taylor, 2012; Pita et al., 2018a). Depending on the abundance of their symbiotic microorganisms, sponges can be divided between those with a low microbial abundance (LMA; 105-106 per mL sponge) and high microbial abundances (HMA; 107-1010 per mL sponge) (Hentschel et al., 2003; Hentschel et al., 2006).
When coral reefs shift from coral to algal dominance, the type of available resources, such as organic matter and inorganic nutrients, also changes (Mueller et al., 2022). Fleshy algae and macroalgae are found to release higher quantities of different bioavailable DOM than corals (Nelson et al., 2013; Wegley Kelly et al., 2022). This, in turn, affects the ecological processes shaping the reefs. For example, a higher ambient bacterioplankton production and the growth of potential pathogens are found on algal-dominated reefs (Haas et al., 2016; Cárdenas et al., 2018; Silva et al., 2021). Because sponges also have a significant effect on the reef biogeochemistry, it is essential to understand if and how the processing of resources by different sponge types (i.e., HMA and LMA) is affected by shifts in benthic community structure and resulting food availability.
In recent isotope-tracer studies, sponges showed similar uptake rates of 13carbon derived from coral- versus algal-produced DOM, but higher rates of 15nitrogen from algal-DOM (Rix et al., 2017; Campana et al., 2021a). In addition, slight changes in differentially expressed transcripts were found between the two sources, specifically in the regulation of signaling pathways, immune response, and carbohydrate metabolism (Campana et al., 2022). However, these studies were based on very short (3-6 h) pulses of concentrated, isotope-enriched DOM and focussed on only part of the exudates (i.e., DOM) that corals and macroalgae provide to sponges, which makes extrapolation to ecological processes at the community or the ecosystem level difficult. To assess the physiological adaptation of sponges to changes in food availability provided under coral- and macroalgae-dominance on contemporary reefs, a more holistic approach is needed.
Here, we investigated whether the sponge host and/or its prokaryotic symbionts change and adapt their physiology, and prokaryotic community composition after 12 days of continuous exposure to exudates (i.e., naturally released organic and inorganic substances) under coral- versus macroalgal-dominated treatments as compared to a seawater only control treatment. We therefore analyzed differential transcriptomic and physiological (e.g., respiratory demand, net uptake rates of bacterio- and phytoplankton, and fluxes of dissolved organic and inorganic nutrients) responses of an HMA and an LMA sponge and their associated prokaryotes, including shifts in prokaryotic community composition, after exposure to the three treatments.
Materials and methods
Organism collection and maintenance
Sampling was conducted on the fringing reef close to Piscadera Bay in Curaçao (12°12’ N, 68°96’ W) between October and December 2019. Experimental organisms were collected from 5–30 m water depth by SCUBA. Macroalgae (Order: Dictyotales) of the genus Dictyota, predominant on Caribbean reefs (Kornder et al., 2021), and corals (Order: Scleractinia) of the genera Colpophyllia, Madracis, Siderastrea, Porites, and Favia, were collected at CARMABI house reef. After collection, macroalgae were allowed to recover in an aquarium tank, whereas corals recovered on the reef on a pre-existent artificial structure at 10 m depth, for at least 3 d. Different individuals of two common coral reef sponges, the high microbial abundance (HMA) species Plakortis angulospiculatus and the low microbial abundance (LMA) species Halisarca caerulea (Campana et al., 2021a; Hudspith et al., 2021) were collected and trimmed to 10–30 cm2 projected surface and cleared of epibionts. Sponges were allowed to recover on the CARMABI house reef for up to 4 weeks before the beginning of the experiments to ensure full recovery from collection (Alexander et al., 2015). Only visually healthy specimens (no tissue damage, open oscula) were used in the experiments. Tissue samples of the two sponge species were also collected in situ, directly from the reef, for DNA extraction (referred to as BCK_REEF; n=4 per species).
Experimental procedures
The aquaria set-up in the wet-lab facilities of the CARMABI Research Station consisted of three 2-tiered flow-through aquaria (Figure 1; Supplementary Figure S1). The three upper aquaria (feeding tanks) were supplied with seawater (100-L; flow rate of 3 L min−1) pumped directly from the CARMABI house reef at 10 m water depth and contained the three source treatments: corals, macroalgae, and seawater only (from here on defined as seawater). The light regime was kept uniform among all feeding tanks using one 190-W LED fixture (CoralCare, Philips Lighting, The Netherlands) per feeding tank. Lights were programmed with a daily cycle (Supplementary Figure S2) to mimic an open reef natural lighting at 10 m depth (Hudspith et al., 2022), reaching maximum light intensity (~250 photosynthetically active radiation (PAR); 400–700 nm wavelength; Supplementary Figure S2) at 13:00 in the treatment tanks. Light intensity was measured using an Odyssey PAR logger (Dataflow Systems Ltd, Christchurch, New Zealand), calibrated using a LI-192 underwater quantum sensor (LI-COR Biosciences, USA). Every other day, temperature (29-30°C) and pH (8.5–8.8) were regularly monitored in the feeding tanks (Hanna instruments, USA) and the maximum potential quantum yield of photosystem II (dark-adapted Fv/Fm) of the corals placed in the feeding tanks was measured with a Diving-PAM (Walz, Germany) as a proxy for coral/macroalgae health (Bhagooli et al., 2021). Dark-adapted Fv/Fm did not decrease over time and ranged between 0.6–0.9, matching reported values for corals under normal control conditions, i.e., not stressed (Jones et al., 1999; Philipp and Fabricius, 2003).
Figure 1
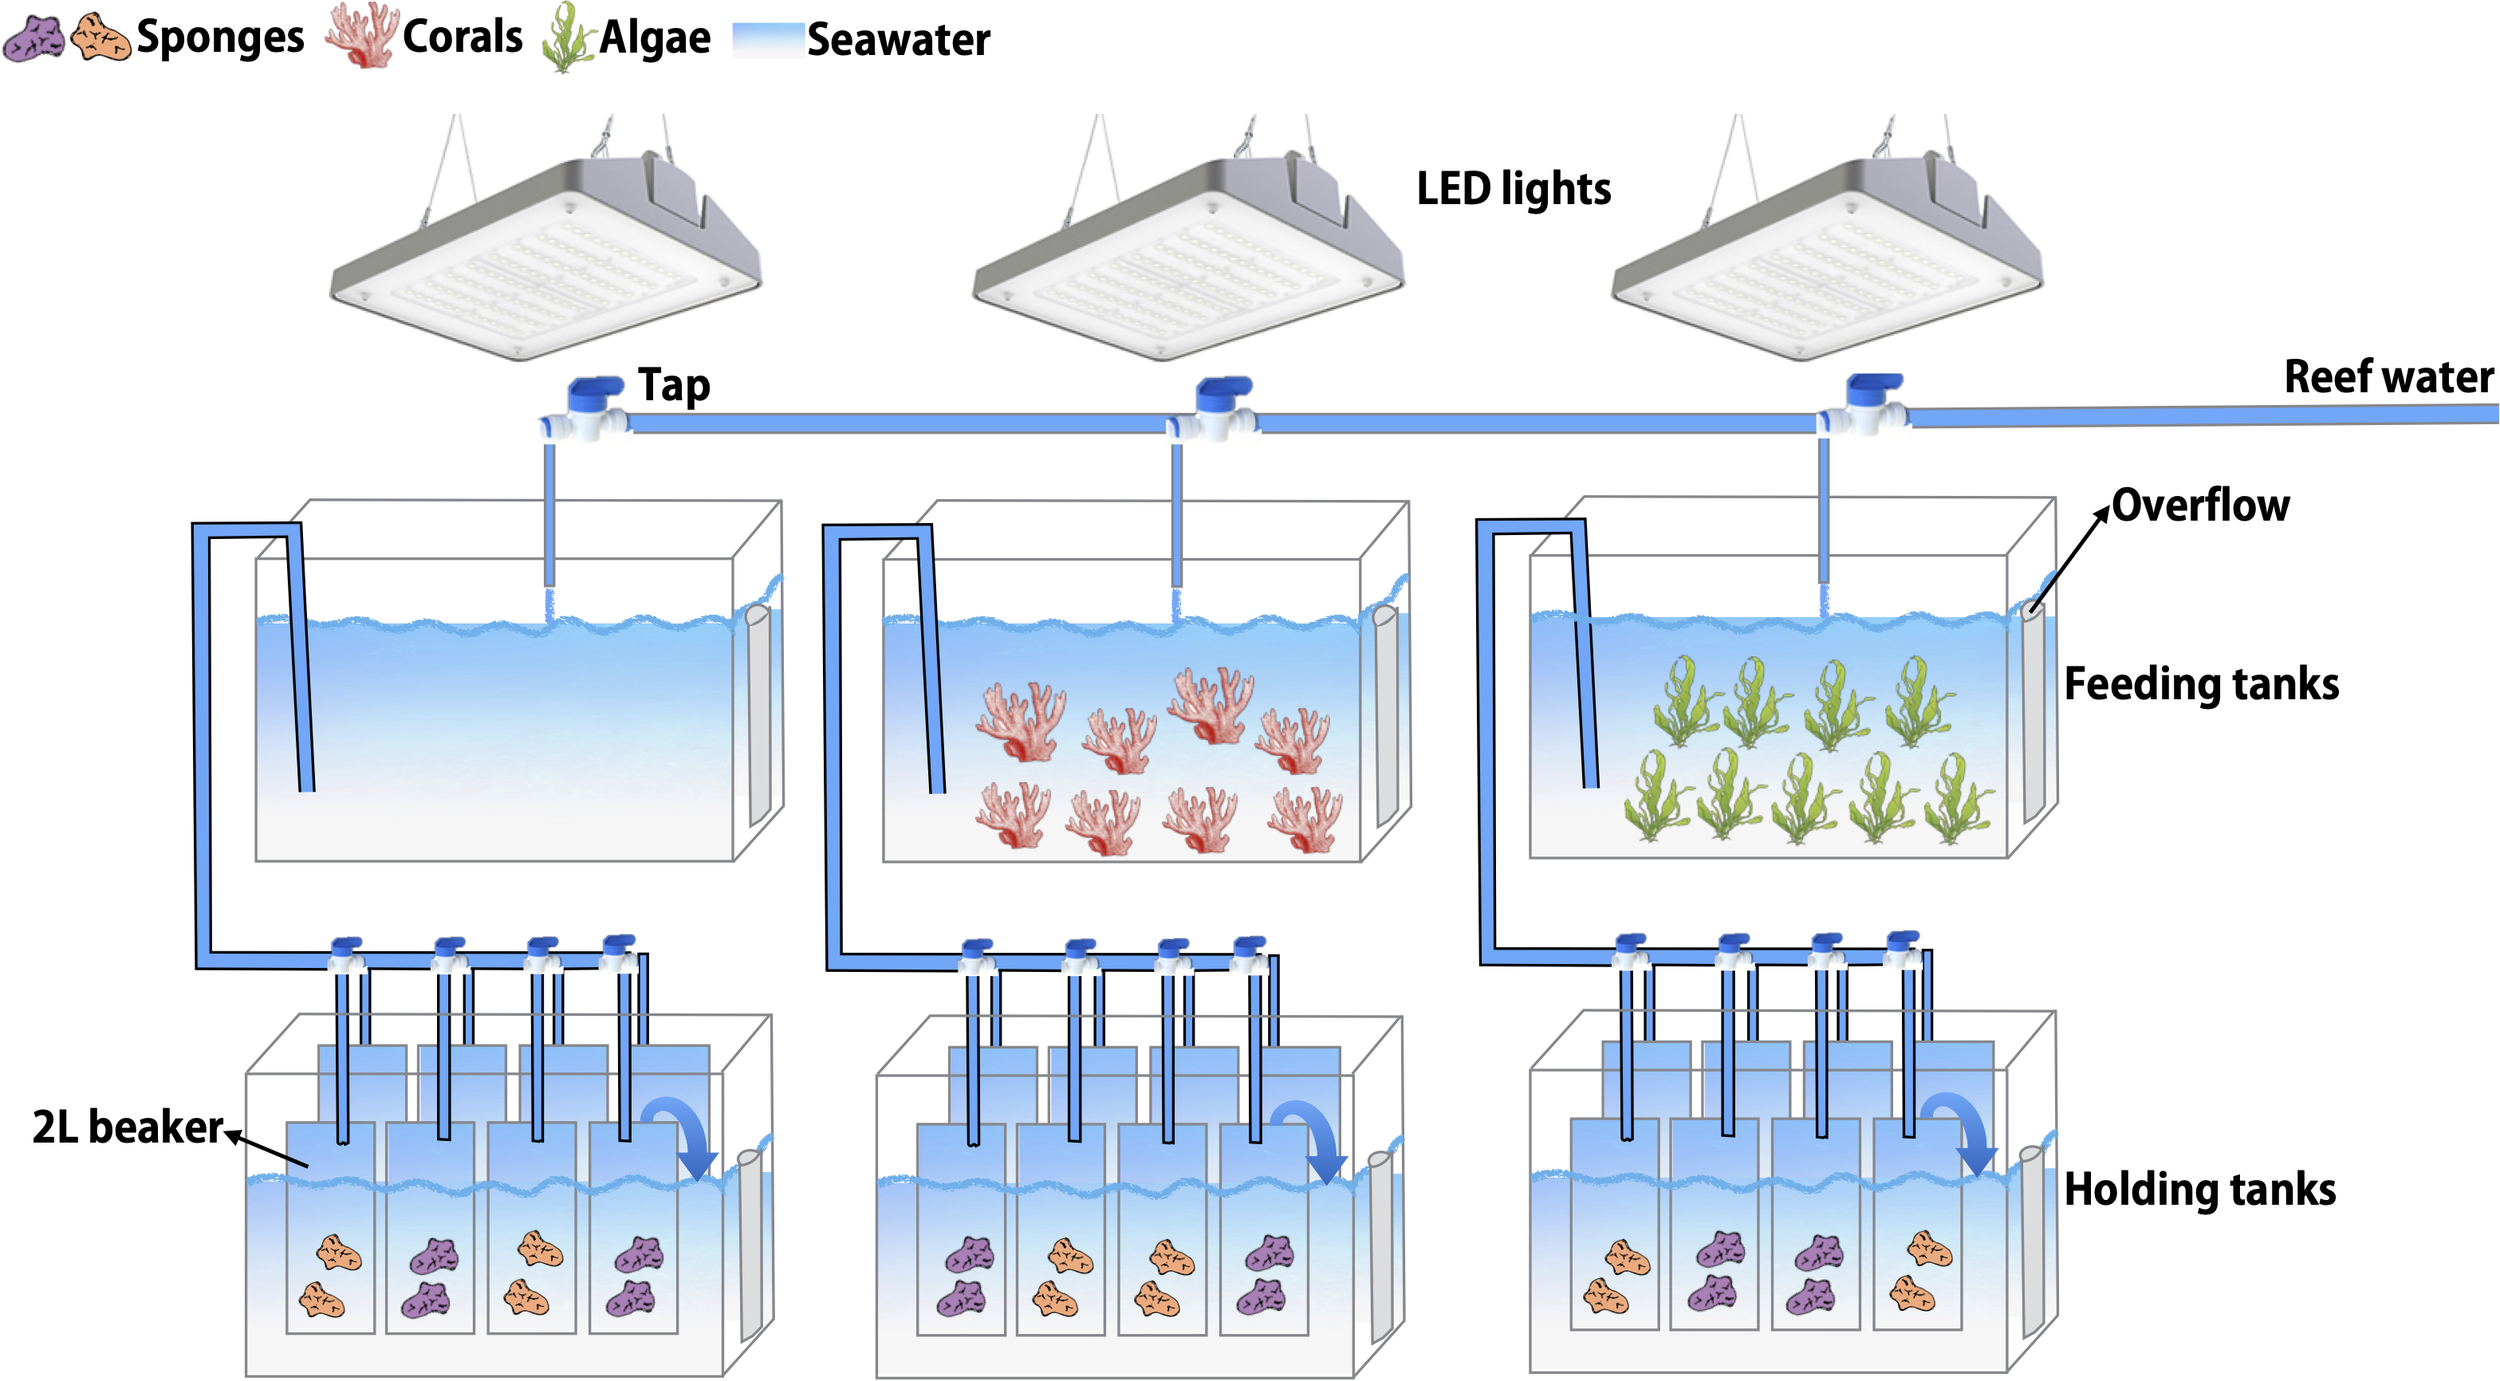
Schematic representation of the aquaria set-up. The three upper aquaria (feeding tanks) were supplied with seawater pumped from the reef at 10 m water depth and contained the three source treatments: corals, macroalgae, and seawater. The three lower aquaria (holding tanks) contained the sponges, which were placed in individual beakers supplied with treatment water from the feeding tanks. The treatment water overflowed from the beakers into the aquaria, up to 3 cm below the rim of the beakers and acted as a water bath to maintain ambient temperature.
After 3 days of acclimatization to the aquaria set-up, sponges were exposed to the treatment water in the lower aquaria (holding tanks). Per treatment, two different individuals of the same sponge species (technical replicates) were placed in eight individual glass beakers (1.7L; 4 beakers per species), which were constantly supplied (0.3 L min−1) with treatment water from the feeding tanks. The treatment water overflowed from the beakers into 50-L aquaria to maintain ambient temperature in the beakers. Sponges were exposed to their respective treatment (i.e., macroalgae, coral, or seawater) for 12 days. One of the sponge technical replicates was sampled for DNA and RNA extraction from the experimental set-up at day 0, before treatment addition, (referred to as BCK; n = 6 per species), and the other individual at day 12, at the end of the experiment, (in total n = 8 per species and treatment) (Table 1). After sampling, sponges were dipped in Milli-Q water to remove excess salts. Half of the tissue was immediately snap frozen and stored at -80°C for DNA preservation, whereas TRIzol® Reagent was added to the other half prior to snap freezing and storage at -80°C for RNA preservation. The treatment water present in the feeding tanks was also sampled for DNA extraction (snap frozen and stored at -80°C), for bacterioplankton community composition analysis at day -3 (BCK -3), 0 (BCK) and 12 using a Sterivex filter (GP 0.22 μm; approximately 2 L per Sterivex) and for organic and inorganic nutrients analysis (Supplementary Table S1; n = 8 samples per treatment, taken at regular intervals during the 12-d exposure). On day 13 or 14, the physiological performance of the remaining sponge individuals was tested in incubations (for details on sponge incubations see below). The entire experiment (Table 1), with exception of background reef sampling (BCK_REEF), was performed twice in sequence to obtain a replication of n = 8 for DNA/RNA sampling and n = 6 for physiological incubations, per sponge species and per treatment.
Table 1
| Day | Sample name | Procedures and sampling |
|---|---|---|
| -5 | PA_BCK_REEF HC_BCK_REEF |
Sponge DNA sampling of background reef specimens |
| -3 | AQ_BCK -3 | Aquaria bacterioplankton sampling from feeding tanks Sponges moved into beakers for acclimatization to set up |
| 0 | AQ_BCK PA_BCK HC_BCK |
Aquaria bacterioplankton sampling from feeding tanks Sponge DNA & RNA sampling t = 0 backgrounds Corals and macroalgae transported without air exposure to feeding tanks |
| 1-11 | Sponge exposure to source treatments: corals, macroalgae and seawater | |
| 12 | AQ_C, AQ_MA, AQ_SW PA_C, PA_MA, PA_SW HC_C, HC_MA, HC_SW |
Aquaria bacterioplankton sampling from feeding tanks t = 12 Sponge DNA & RNA sampling t = 12 |
| 13-14 | Sponge metabolic rate incubations |
Experimental schedule.
PA, Plakortis angulospiculatus; HC, Halisarca caerulea; BCK, background; C, coral; MA, macroalgae; SW, seawater.
RNA and DNA extraction
Total RNA was extracted from sponge tissue samples using TRIzol® Reagent and the PureLink® RNA Mini Kit (Invitrogen) with on-column PureLink® DNase treatment, following manufacturer’s protocol. Extracted total RNA was cleaned-up with the RNeasy MinElute cleanup kit (Qiagen), according to the manufacturer’s protocol. The final RNA concentration was determined with the Qubit™ RNA BR Assay Kit and the Qubit® 2.0 Fluorometer (Invitrogen, CA, USA). RNA quality was checked with 1% (w/v) agarose gel electrophoresis. RNA was stored at -80˚C until further RNA-seq analysis. An aliquot of the total RNA was reverse transcribed using the SuperScript III First-Strand Synthesis SuperMix kit (Invitrogen, Carlsbad, CA, USA), and the synthesized cDNA was stored at -20°C for further 16S amplicon sequencing.
Total genomic DNA was extracted from sponge tissue samples using the DNeasy® Blood & Tissue Kit (Qiagen). Tissue was homogenized in 180 μL Buffer ATL and 20 μL proteinase K using a small sterile pestle in a 1.5-mL microcentrifuge tube. Samples were incubated for 3 h at 56°C, and centrifuged at 6,000x g for 2 min or until all unlysed tissue was precipitated in the pellet. Supernatant was then transferred onto a DNeasy mini spin column, and the protocol was further followed as described by Qiagen. Aquaria bacterioplankton genomic DNA was extracted from the Sterivex filters also using the DNeasy® Blood & Tissue Kit (Qiagen). The volumes of Buffer ATL and proteinase K were doubled as deviation from the original manufactory protocol and pipetted into the filter after which it was incubated overnight in an incubator (Incubator 1000, Heidolph, Schwabach, Germany) at 55°C with a vibrating platform shaker. Then, 400 μL Buffer AL was pipetted into the filter cartridge through the luer-lock side and the filter was incubated for another 20 min at 70°C to deactivate the proteinase K. The entire volume was extracted from the filter using a sterile 5 mL syringe. 400 μL of 100% (v/v) ethanol was added and the sample was loaded onto the spin column. The protocol was further followed as described by Qiagen. The DNA concentration was measured with Qubit® dsDNA BR Assay Kit and Qubit® 2.0 Fluorometer (Invitrogen, CA, USA). DNA was stored at -20˚C until further 16S amplicon sequencing analysis.
RNA-seq, quality control, de novo assembly, and annotation
RNA quality was assessed on a Qubit® 3.0 Fluorometer (Invitrogen, CA, USA) with the RNA BR Assay Kit and the TapeStation RNA ScreenTape at Competence Centre for Genomic Analysis (CCGA) in Kiel where the library preparation and sequencing also took place. Six out of the eight replicate RNA samples were sequenced, for a total of 48 cDNA libraries [two species x six replicates x (three treatments + t=0 backgrounds)]. Libraries were prepared using the Illumina Ribo-Zero Plus rRNA depletion kit together with the TruSeq stranded totalRNA and sequenced on the Illumina NovaSeq6000 S1 FlowCell, one lane, 300 cycles, using a pair-end (150 bp length) sequencing strategy.
Removal of adapter sequences and sequence quality was confirmed using the FastQC programme (Andrews, 2010). Low-quality regions of reads were trimmed using Trimmomatic v 0.39 (Bolger et al., 2014) with the following settings: ILLUMINACLIP:./Adaptors.fa:2:30:10 LEADING:3 TRAILING:3 SLIDINGWINDOW: 4:28 MINLEN:36 where the Adaptors.fa file consisted of the appropriate indexes for the prepared libraries. Then, SortMeRNA v 4.2.0 (Kopylova et al., 2012) was used to remove ribosomal contamination. Cleaned, trimmed reads were then re-analyzed with FastQC. For each species separately, trimmed and cleaned reads were assembled into a reference transcriptome using Trinity v 2.9.0 (Grabherr et al., 2011), with two non-standard settings: a minimum contig length of 200 bp and in silico read normalization. For H. caerulea, reads from 24 samples were used to construct the reference assembly, while for P. angulospiculatus reads from 32 samples [23 generated in the current study (one replicate was excluded because the library preparation failed) and nine sequences generated in Campana et al. (2022)] were used to construct the reference assembly.
The quality and completeness of the two reference transcriptomes were assessed on gVolante web server (Nishimura et al., 2017) using the Basic Universal Single Copy Orthologue (BUSCO) v5 (Simao et al., 2015) pipeline, selecting the eukaryotic, metazoan, and bacteria BUSCO gene lists. Annotation of transcripts was performed using DIAMOND v 2.0.6 (Buchfink et al., 2015) to search against the Swiss-Prot metazoan and prokaryotic databases (cutoff e-value: 0.001). These searches were used to retrieve the gene ontology (GO) terms using Blast2GOPRO (Conesa et al., 2005). The reference transcriptomes were uploaded to the Joint Genome Institute (JGI) Integrated Microbial Genomes & Microbiomes (IMG/M) comparative data analysis system for gene prediction and KEGG annotation using the genome annotation pipeline v 6.0 (Chen et al., 2021). KEGG annotations were divided between metazoan (Supplementary File 1) and prokaryotic (Supplementary File 2) origin based on taxonomical assignment obtained in the IMG pipeline. KEGG pathways were reconstructed with KEGG Mapper Reconstruct tool (Kanehisa and Sato, 2020) based on K numbers identified from the KEGG annotation. Transcripts mapping to KEGG pathways within the category “carbon metabolism”, “nitrogen metabolism” and “ATP-binding cassette (ABC) transporters” were compared in both sponge species.
Differential expression analysis
We assessed the differential transcript expression between three treatments (coral, macroalgae, seawater) and t=0 backgrounds (“backgrounds” for simplicity) in our two target sponges. Comparison of transcript expression between sponges exposed to the seawater treatment for 12 days and the background conditions serve to assess possible “tank effects”, i.e., molecular responses induced by other abiotic stressors (e.g., lack of nutrients, bacterial, or viral contamination) during the experiment. First, reads alignment to the reference transcriptome and estimation of transcripts expression values were performed using RSEM (Li and Dewey, 2011) as packaged within the Trinity (Grabherr et al., 2011) module and Bowtie2 (Langmead and Salzberg, 2012). Then, differential expression of transcripts between the three treatments and backgrounds was analyzed using the Bioconductor package edgeR (Robinson et al., 2010) within the Trinity (Grabherr et al., 2011) perl wrapper script, using the pairwise model with FDR ≤ 0.01 and a minimum absolute (log2(a/b)) change of 1 (i.e., twofold change). Differentially expressed transcripts only detected in a single sample were excluded prior to clustering and downstream analysis, to avoid spurious results caused by transient expression or contamination of single samples. Finally, the remaining differentially expressed transcript sets were aligned with the GO terms and KEGG annotations tables.
16S amplicon sequencing and data analysis
16S amplicon sequencing analyses were carried out on the aquaria bacterioplankton genomic DNA samples and on the sponge genomic DNA and cDNA samples. Sequencing of both genomic DNA and cDNA allows to correlate the abundance of the associated prokaryotes with their transcriptional activity since differences between taxon abundances in genomic DNA and cDNA are generally regarded as a proxy for differences in metabolic rates between the taxa (Kamke et al., 2010; Moitinho-Silva et al., 2014). The V3-V4 region of the 16S rRNA gene sequences was amplified from all samples using the primer pair 341f/806r. PCR conditions were as follows: initial denaturation step for 30 s at 98°C, 30 cycles of denaturation for 9 s at 98°C, annealing for 30 s at 55°C and extension for 30 s at 72°C, followed by a final extension step of 10 min at 72°C. The product quality and quantity were checked using gel electrophoresis. PCR products were normalized (SequalPrep) and pooled. Amplicon libraries were sequenced using a MiSeq v3 (2×300 bp) sequencing kit on an Illumina MiSeq platform at the Centre for Genomic Analysis (CCGA) in Kiel, Germany. Because the sequencing of the genomic DNA failed at the CCGA, the genomic DNA samples of P. angulospiculatus were further sequenced at a commercial sequencing facility (Molecular Research MRDNA Lab, Shallowater, TX) using the same primer and sequencing conditions specified above. The genomic DNA samples of H. caerulea could not be amplified under those conditions, likely due to the presence of PCR inhibitors in the extracted DNA, which could not be removed even with different purification methods.
Raw DNA sequences were quality-filtered and trimmed based on quality scores. Amplicon Sequence Variants (ASVs) were computed with the DADA2 algorithm within QIIME2 (version 2018.8). To train the error model, one million reads were used. Chloroplasts and mitochondrial sequences were removed from further analyses. Phylogenetic ASV trees were generated with the FastTree2 plugin. A primer-specific trained Naive Bayes taxonomic classifier was used to classify representative ASVs based on the Silva 132 small subunit rRNA database with a 99% identity criterion. Alpha and beta diversity indices (i.e., Shannon diversity and weighted UniFrac distances, respectively) were calculated within QIIME2 and sample separation in ordination space was visualized by non-metric multidimensional scaling (nMDS). Statistical tests (Kruskal-Wallis and PERMANOVAs with pairwise comparisons) were run in QIIME2 to assess if the alpha and beta diversity of the seawater bacterioplankton or the sponge-associated prokaryotic communities differed significantly between them and among the three treatments.
All raw sequences generated in this study can be downloaded from the NCBI database under BioProject ID https://dataview.ncbi.nlm.nih.gov/object/PRJNA839199.
Sponge physiological fluxes incubations
Sponge and seawater only (control) incubations were carried out in seawater pumped directly from the reef (NB: not the treatment water) in 2-L air-tight incubation chambers equipped with a magnetic stirrer. Incubations were conducted in the dark to ensure that potential photosynthetic activity by the sponge or by the seawater would not affect dissolved oxygen (O2) concentrations, which were monitored continuously (every 15 s) with an optical probe (OXY-4, PreSens, Regensburg, Germany). O2 saturation was never below 75% and sponges were metabolically active throughout the incubations, indicated by continuous respiration (i.e., linear decrease in dissolved oxygen concentration). Incubation chambers were placed in 70-L flow-through aquaria to ensure ambient in situ temperature (29°C). O2, dissolved organic carbon (DOC), total dissolved nitrogen (TDN), inorganic nutrients, bacterio- and phytoplankton concentrations were measured at the beginning (t=0) and end (t=30 min) of each incubation, after which sponges were sampled for wet and dry weight.
Water sample processing and analysis
Duplicate 1 mL water samples for heterotrophic bacterioplankton counts were fixed immediately with 20 µL 25% (v/v) glutaraldehyde. For phytoplankton counts, duplicate 3.5 mL water samples were fixed immediately with 100 µL formaldehyde (18% v/v)/hexamine (10% w/v) solution. Plankton samples were incubated at 4˚C for 20-40 min, snap frozen in liquid nitrogen and stored (-80°C) until analysis. Plankton abundances were enumerated using a CytoFLEX flow cytometer (Beckman Coulter, USA). Heterotrophic bacterial samples (50 µL) were stained with SYBR Green I nucleic acid gel stain (Molecular Probes, Inc) and identified by green (DNA) fluorescence, forward and side scatter at medium flow rate (30 µL min-1) (Marie et al., 1997). Phytoplankton samples (50 µL, medium flow rate) were identified by orange (phycoerythrin), red (chlorophyll) fluorescence, forward and side scatter. Flow cytometry data were analyzed using the software CytExpert v. 2 (Beckman Coulter, CA, USA). Carbon and nitrogen contents of different cell populations were estimated according to Hudspith et al. (2022), using conversion factors of 20 fg C and 5.4 fg N cell-1 for heterotrophic bacteria (Lee and Fuhrman, 1987), 53 fg C and 9.4 fg N cell-1 for Prochlorococcus (Campbell et al., 1994; Bertilsson et al., 2003), and 250 fg C and 50 fg N cell-1 for Synechococcus (Verity et al., 1992; Bertilsson et al., 2003).
Duplicate 8 mL inorganic nutrient samples were filtered through a 0.2 µm Fisherbrand Sterile PES Syringe Filter, collected in HDPE vials (Midi-Vial, PerkinElmer; Waltham, MA, USA) and stored frozen at -20°C until analysis. The concentrations of dissolved inorganic nutrients: nitrite (NO2−), NOx− (sum of nitrate (NO3-) and NO2-), ammonium (NH4+), and orthophosphate (PO43−) were measured with an automated Wet Chemistry Analyzer (SAN++, Skalar Analytical, Breda, NL). Nitrate concentrations were derived as: [NO3-]=[NOx−]–[NO2−].
Duplicate 20 mL samples for DOC and TDN were gently (max 10 kPa pressure) filtered through a pre-combusted (4 h at 450˚C) 0.3 µm GF75 glass microfiber filter (pore size nominal 0.3 µm, 25 mm, Advantec, CA, USA), collected in pre-combusted amber glass vials (22 mL, Agilent Technologies, CA, USA) and acidified by adding 7 drops of fuming 37% (v/v) HCl with a pre-combusted glass pipette. Prior to filtration, the filter was washed consecutively with 20 mL 0.4 mol L-1 HCl, 20 mL Milli-Q water and 20 mL sample water. Clean vials caps were rinsed in filtered sample water two times before closing the vials, which were stored in the dark at 4°C for 8 months until analysis. DOC and TDN concentrations were measured using a high-temperature combustion autoanalyzer (TOC-V CPN; Shimadzu, Japan). The instrument was calibrated with a standard addition curve of potassium hydrogen phthalate (0, 25, 50, 100, 200 µmol C L-1) and potassium nitrate (0, 2.5, 5, 10, 20 µmol N L-1). Consensus Reference Materials (CRMs): Low Carbon Water (LCW), Deep Seawater (DSR) and Surface Seawater (SSR) provided by Hansell Laboratory of the University of Miami were used as positive controls. Analytical variation of the instrument was < 3% coefficient of variation (CV) (5-8 injections per sample). Dissolved organic nitrogen (DON) concentrations were calculated as: [DON]=[TDN]–[DIN], with dissolved inorganic nitrogen (DIN) as: [DIN]=[NOx−]+[NH4+].
Respiration rates were calculated using a linear regression analysis based on all O2 concentration measurements (every 15 s). All measured fluxes were corrected for seawater only controls and normalized to sponge biomass per g dry weight (DW) and were calculated as the difference between the concentrations measured at the beginning and the end of the incubation. To examine the effects of the sponge species and of the different treatments, all fluxes were statistically analyzed with two-factor permutational multivariate analyses of variance (PERMANOVAs) in R (version 3.6.1) with 999 permutations and additional pairwise comparisons with Bonferroni p value correction method.
Results
Transcriptome assembly and annotation
The sequencing of 47 cDNA libraries (one replicate was excluded because the library preparation failed) yielded a total of 1,642,257,090 reads, which resulted in ~22 million reads per sample after trimming. Basic sequencing metrics, including raw and trimmed reads, can be seen in Supplementary Table S2. The percentage of GC was 51% for P. angulospiculatus and 44% for H. caerulea, including reads of both prokaryotic and eukaryotic origin. Statistics related to our cleaned reference assembly can be seen in Table 2. A total of 810,763 transcripts and 446,838 predicted “genes” (i.e., Trinity components or “assembled genes” as identified in the Trinity pipeline) were present in P. angulospiculatus and 600,037 transcripts and 274,354 predicted genes in H. caerulea. Our reference assemblies had a high N50, with 4,038 and 1,023 bp, respectively. In P. angulospiculatus 68,689 transcripts were longer than this N50 value, and 235,509 longer than 1 kb in length, and in H. caerulea these numbers were 91,353 and 93,971, respectively (Table 2). To test the completeness of our transcriptomic dataset we used the BUSCO approach, which revealed our dataset to be more complete in P. angulospiculatus (66%) than in H. caerulea (27%) for the prokaryotic set of genes, while both species had similar outputs for the metazoan (93% and 90%, respectively) and eukaryotic set (96% and 97%, respectively) as shown in Supplementary Table S3.
Table 2
| Species | P. angulospiculatus | H. caerulea |
|---|---|---|
| Number of transcripts | 810,763 | 600,037 |
| Number of trinity ‘genes’ | 446,838 | 274,354 |
| Total bp in assembly | 1,156,783,867 | 428,922,874 |
| Max contig length | 141,978 | 81,970 |
| Mean contig length (bp) | 1427 | 715 |
| Median contig length (bp) | 499 | 409 |
| % GC | 51 | 44 |
| N20 contig length | 10,727 | 3,277 |
| N50 contig length | 4,038 | 1,023 |
| Number of contig in N50 | 68,689 | 91,353 |
| Number of transcripts over 1,000 bp | 235,509 | 93,971 |
| Transcripts w/blast hit (Metazoa) | 242,587 | 100,286 |
| Transcripts w/blast hit (Prokaryota) | 329,644 | 44,292 |
| Transcripts w/GO term (Metazoa) | 241,843 | 99,251 |
| Transcripts w/GO term (Prokaryota) | 322,254 | 43,607 |
| Transcripts w/KEGG term (Metazoa) | 44,351 | 35,609 |
| Transcripts w/KEGG term (Prokaryota) | 48,309 | 4,589 |
Statistics of the reference transcriptome assemblies.
Using the Swiss-Prot databases, approximately 30% and 16% of the transcripts in P. angulospiculatus and H. caerulea (242,587 and 100,286, respectively) were given an annotation for metazoan hits, whereas 30% and 7% of the total transcripts (329,644 and 44,292, respectively) obtained a hit against the prokaryotic database. In P. angulospiculatus, GO term annotations were assigned to most transcripts with a blast hit: a total of 241,843 (99%) transcripts for the metazoan genes and 322,254 (98%) transcripts for the prokaryotic genes. In H. caerulea, relative GO term annotations assignment was similar: 99,251 (99%) transcripts for the metazoan genes and 43,607 (98%) for the prokaryotic genes.
We also performed KEGG annotation on our de novo transcriptomes using the IMG/M pipeline, and the results of these annotations are provided in full as Supplementary Files 1 and 2. KEGG pathway recovery was good in both P. angulospiculatus and H. caerulea, with 44,351 and 35,609 transcripts annotated to existing KEGG metazoan terms and 48,309 and 4,589 to prokaryotic KEGG terms, respectively. The higher number of KEGG annotations in P. angulospiculatus, especially of prokaryotic terms, was reflected in the metabolic pathways repertoire, but also in the completeness of the modules for carbon metabolism, nitrogen metabolism and ATP-binding cassette (ABC) transporters (Supplementary Table S4). For example, pathways for glycolysis, pentose phosphate pathway, and citrate cycle were transcribed by both sponge hosts, but complete only in the microbiome of P. angulospiculatus. All pathways of the core nitrogen cycle: nitrification, denitrification, dissimilatory nitrate reduction, assimilatory nitrate reduction, and complete nitrification were fully expressed only in the microbiome of P. angulospiculatus, while nitrogen fixation was missing in both species. Transporters of extracellular nitrate/nitrite (NRT) were also expressed in P. angulospiculatus. Among the eukaryotic-type ABC transporters, 11 were present in both sponge species, with an additional eight expressed only in P. angulospiculatus and two only in H. caerulea. Among the prokaryotic-type ABC transporters, the following were completely annotated in both species: transporters of iron, taurine, glucose/mannose, ribose, glycine betaine/proline, galactose/maltooligosaccharide, raffinose/stachyose/melibiose, sorbitol/mannitol, α-glucoside, phospholipids, L-amino acids, branched-chain amino acids, and oligopeptides. In P. angulospiculatus, additional complete annotation was retrieved for more prokaryotic-type ABC transporters, including ions, monosaccharides, oligosaccharides, phosphate, arginine, urea, and other substrates. In H. caerulea, no additional prokaryotic-type ABC transporters were completely annotated.
Differential expression analyses
To compare the response of the two sponge species after 12 days of exposure to the three treatments (coral, macroalgae, seawater) we evaluated the differential expression of transcripts relative to their backgrounds (t=0) and between the treatments (t=12 days). The sample correlation matrix and heatmap of relative expression of the differentially expressed transcripts can be seen in Supplementary Figure S3. In both sponge species samples did not cluster per treatment, in fact, there was a high within-treatment variation, visible in both the sample correlation matrices and heatmaps. The number of differentially expressed (DE) transcripts was low in both sponge species, but higher in P. angulospiculatus compared to H. caerulea (Figure 2; Supplementary Figure S3).
Figure 2
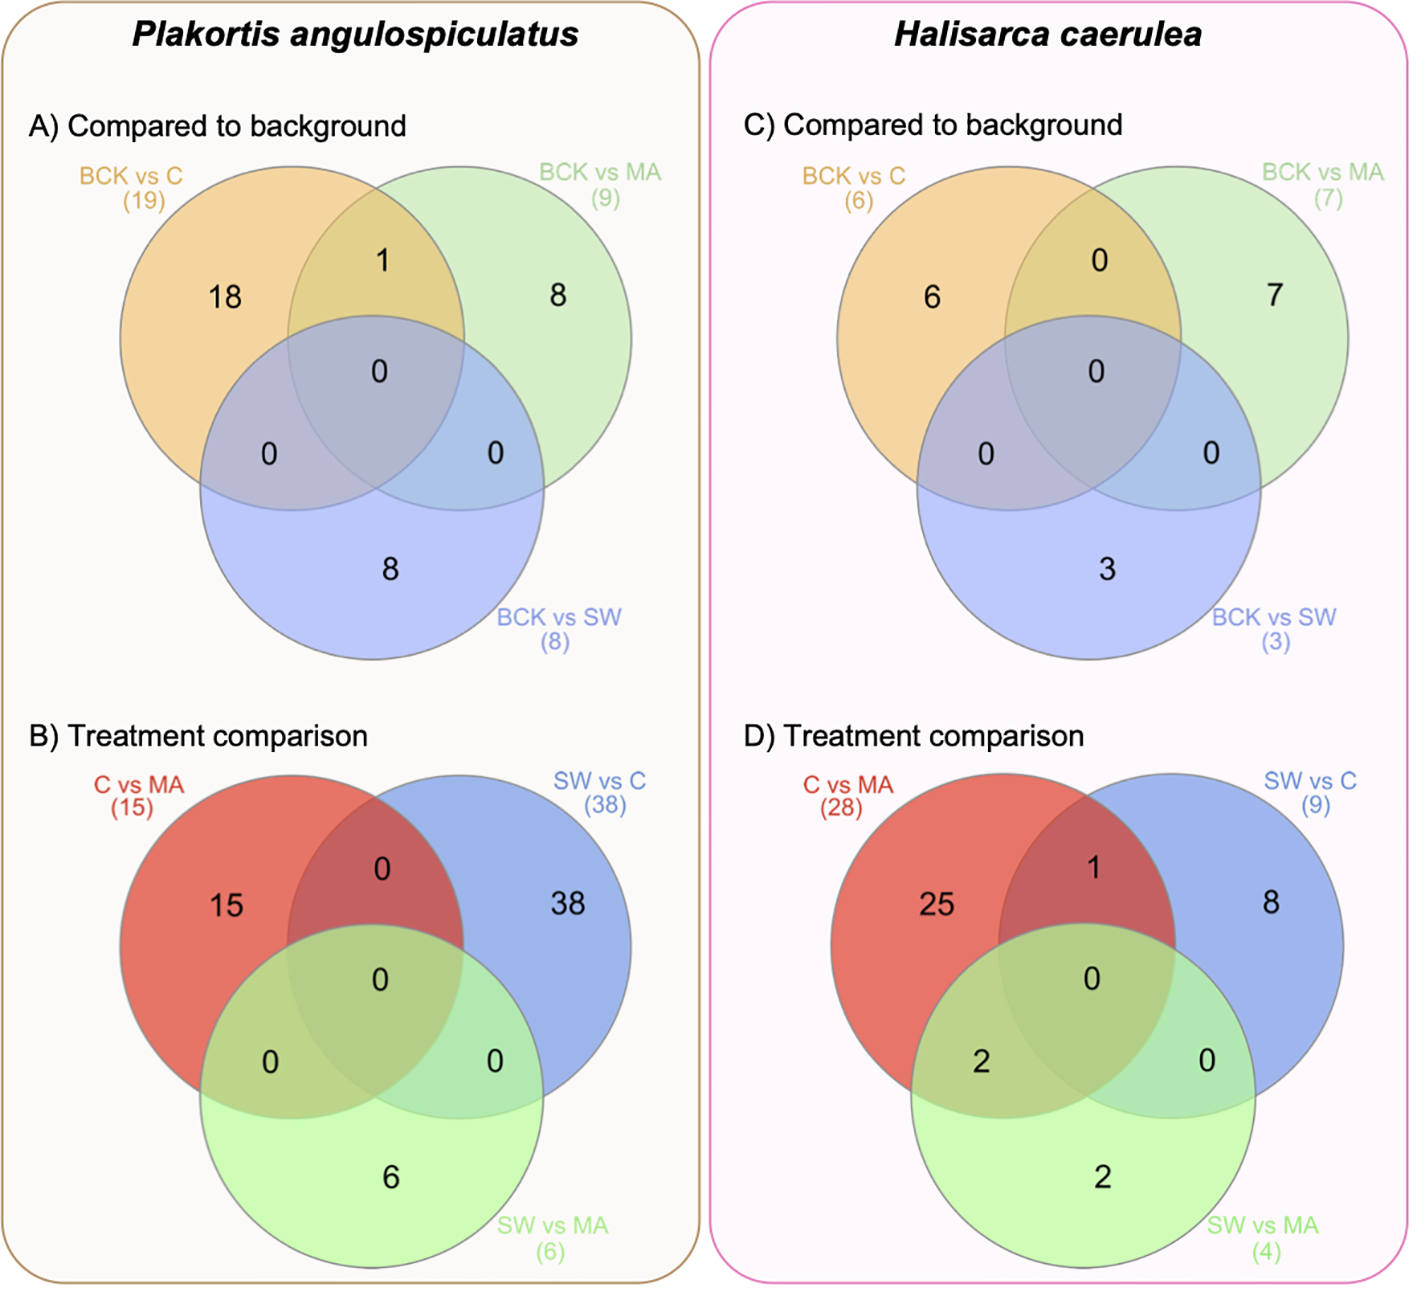
Venn diagrams of the number of the differentially expressed transcripts in Plakortis angulospiculatus (left) and Halisarca caerulea (right). (A, C) number of the differentially expressed transcripts in the treatments (C, coral; MA, macroalgae; SW, seawater), after 12 days of exposure, compared to the background conditions at t = 0 (BCK). (B, D) number of the differentially expressed transcripts between the treatments. Created with InteractiVenn.net.
In P. angulospiculatus, the highest number of DE transcripts between the treatment at t=12 d samples and the t=0 background was found in the coral treatment, with 19 DE transcripts in total, of which 8 were upregulated and 11 downregulated (Figure 2A, Table 3). The macroalgal treatment showed 3 up- and 6 down-regulated DE transcripts compared to the background. In H. caerulea, we found 6 DE transcripts (5 up, 1 down) in the coral treatment and 7 (4 up, 3 down) in the macroalgae treatment (Figure 2C, Table 4). In both sponge species, the seawater treatment was the one showing the least differential expression in the comparison to the background condition, with 1 up- and 7 down-regulated transcripts in P. angulospiculatus and 3 upregulated transcripts in H. caerulea. When comparing the differential expression between the 12-d treatments, we found that in P. angulospiculatus the highest number of DE transcripts (38) was retrieved between the coral and seawater treatments, of which 24 were differentially upregulated in the coral treatment and 14 in the seawater treatment. Between the macroalgae and seawater treatment, only 6 DE transcripts were identified (3 up in macroalgae and 3 in seawater). More differential expression (15 transcripts) was found between the coral and macroalgae treatment in P. angulospiculatus (9 up in coral, 6 in macroalgae) (Figure 2B, Table 3). In H. caerulea, the highest differential expression was found between the coral and macroalgae treatment (28, of which 17 up in coral and 11 in macroalgae), then between coral and seawater treatment (9; 7 up in coral, 2 in seawater treatment) and the least differential expression between the macroalgae and seawater treatment (4; 2 up in macroalgae, 2 in seawater treatment) (Figure 2D, Table 4).
Table 3
| Comparison | Regulation | Transcript_ID | Blast ID_Metazoa | Blast ID_prokaryota |
|---|---|---|---|---|
| Coral vs Background | UP | TRINITY_DN1483_c0_g1_i114 | ABR_Active breakpoint cluster region-related protein | —NA— |
| TRINITY_DN1597_c0_g1_i399 | INT11_Integrator complex subunit 11 | Y1236_Uncharacterized protein MJ1236 | ||
| TRINITY_DN297_c0_g1_i34 | CSTF1_Cleavage stimulation factor subunit 1 | —NA— | ||
| TRINITY_DN81808_c0_g2_i6 | —NA— | —NA— | ||
| TRINITY_DN3188_c0_g1_i346 | —NA— | —NA— | ||
| TRINITY_DN2690_c0_g1_i3 | ACSA_Acetyl-coenzyme A synthetase, cytoplasmic | ACSA_Acetyl-coenzyme A synthetase | ||
| TRINITY_DN586_c0_g1_i127 | UNC79_Protein unc-79 homolog | —NA— | ||
| TRINITY_DN18482_c0_g1_i9 | —NA— | —NA— | ||
| DOWN | TRINITY_DN1424_c7_g1_i54 | XDH_Xanthine dehydrogenase/oxidase | HXNS_Nicotinate hydroxylase hnxS | |
| TRINITY_DN3325_c0_g1_i45 | PTEN_Phosphatidylinositol 3,4,5-trisphosphate 3-phosphatase and dual-specificity protein phosphatase PTEN | —NA— | ||
| TRINITY_DN1532_c0_g1_i65 | AGRV1_Adhesion G-protein coupled receptor V1 | —NA— | ||
| TRINITY_DN5894_c0_g1_i115 | —NA— | —NA— | ||
| TRINITY_DN661_c3_g1_i1 | CBPA4_Carboxypeptidase A4 | CBPT_Carboxypeptidase T | ||
| TRINITY_DN20361_c0_g1_i52 | JAM2_Junctional adhesion molecule B | —NA— | ||
| TRINITY_DN644_c1_g1_i394 | AP3M1_P-3 complex subunit mu-1 | —NA— | ||
| TRINITY_DN3783_c0_g3_i1 | DPH6_Diphthine-ammonia ligase | Y570_Uncharacterized protein MJ0570 | ||
| TRINITY_DN1169_c0_g1_i11 | SF3B2_Splicing factor 3B subunit 2 | —NA— | ||
| TRINITY_DN3631_c0_g1_i24 | MX_Interferon-induced GTP-binding protein Mx | —NA— | ||
| TRINITY_DN3144_c0_g2_i2 | BIR_Inhibitor of apoptosis protein | —NA— | ||
| Macroalgae vs Background | UP | TRINITY_DN45237_c0_g1_i137 | —NA— | —NA— |
| TRINITY_DN2690_c0_g1_i3 | ACSA_Acetyl-coenzyme A synthetase, cytoplasmic | ACSA_Acetyl-coenzyme A synthetase | ||
| TRINITY_DN26122_c0_g1_i19 | B4GA1_Beta-1,4-glucuronyltransferase 1 | —NA— | ||
| DOWN | TRINITY_DN1833_c0_g1_i188 | ITPR1_Inositol 1,4,5-trisphosphate receptor type 1 | —NA— | |
| TRINITY_DN2408_c0_g1_i181 | DC2I1_Cytoplasmic dynein 2 intermediate chain 1 | —NA— | ||
| TRINITY_DN6512_c0_g1_i23 | TADBP_TAR DNA-binding protein 43 | —NA— | ||
| TRINITY_DN834_c0_g1_i3 | RBBP6_E3 ubiquitin-protein ligase RBBP6 | —NA— | ||
| TRINITY_DN4219_c0_g1_i2 | TSN3_Tetraspanin-3 | —NA— | ||
| TRINITY_DN817_c1_g1_i3 | —NA— | —NA— | ||
| Seawater vs Background | UP | TRINITY_DN2431_c0_g1_i64 | AREL1_Apoptosis-resistant E3 ubiquitin protein ligase 1 | —NA— |
| DOWN | TRINITY_DN2430_c0_g1_i338 | GTPBA_GTP-binding protein 10 | —NA— | |
| TRINITY_DN8289_c0_g1_i2 | —NA— | —NA— | ||
| TRINITY_DN300_c0_g1_i19 | XPO1_Exportin-1 | —NA— | ||
| TRINITY_DN4907_c0_g1_i69 | IRAK2_Interleukin-1 receptor-associated kinase-like 2 | PKN1_Probable serine/threonine-protein kinase Sps1 | ||
| TRINITY_DN9686_c0_g1_i19 | —NA— | —NA— | ||
| TRINITY_DN146_c0_g1_i44 | MA1B1_Endoplasmic reticulum mannosyl-oligosaccharide 1,2-alpha-mannosidase | GRPE_Protein GrpE | ||
| TRINITY_DN7985_c0_g1_i39 | SEC62_Translocation protein SEC62 | —NA— | ||
| Macroalgae vs Coral | UP Macroalgae | TRINITY_DN12207_c0_g1_i3 | COX1_Cytochrome c oxidase subunit 1 | COXN_Alternative cytochrome c oxidase subunit 1 |
| TRINITY_DN3325_c0_g1_i460 | PTEN_Phosphatidylinositol 3,4,5-trisphosphate 3-phosphatase and dual-specificity protein phosphatase PTEN | —NA— | ||
| TRINITY_DN4259_c0_g1_i22 | CNDG2_Condensin-2 complex subunit G2 | —NA— | ||
| TRINITY_DN48909_c0_g1_i14 | —NA— | —NA— | ||
| TRINITY_DN4853_c0_g1_i3 | OPA3_Optic atrophy 3 protein homolog | —NA— | ||
| TRINITY_DN4868_c0_g1_i2 | —NA— | —NA— | ||
| UP Corals | TRINITY_DN4570_c0_g1_i258 | BAIP3_BAI1-associated protein 3 | —NA— | |
| TRINITY_DN4347_c0_g1_i377 | ITFG2_KICSTOR complex protein ITFG2 | —NA— | ||
| TRINITY_DN3449_c0_g1_i82 | NCPR_NADPH-cytochrome P450 reductase | CYSJ_Sulfite reductase | ||
| TRINITY_DN1601_c2_g1_i174 | —NA— | —NA— | ||
| TRINITY_DN3053_c0_g2_i4 | NFS1_Cysteine desulfurase, mitochondrial | UVRA_UvrABC system protein A | ||
| TRINITY_DN17082_c2_g1_i11 | —NA— | —NA— | ||
| TRINITY_DN15576_c0_g1_i21 | SNR27_U4/U6.U5 small nuclear ribonucleoprotein 27 kDa protein | —NA— | ||
| TRINITY_DN5877_c1_g1_i381 | CEGT_Ceramide glucosyltransferase | —NA— | ||
| TRINITY_DN5595_c0_g1_i29 | —NA— | —NA— | ||
| Coral vs Seawater | UP Corals | TRINITY_DN3186_c0_g2_i1 | TKT_Transketolase | THIG_Thiazole synthase |
| TRINITY_DN392_c0_g1_i25 | CTNB_Catenin beta | —NA— | ||
| TRINITY_DN392_c0_g1_i244 | CASD1_DANREN-acetylneuraminate 9-O-acetyltransferase | —NA— | ||
| TRINITY_DN194_c0_g1_i55 | UBP40_HUMANUbiquitin carboxyl-terminal hydrolase 40 | —NA— | ||
| TRINITY_DN3363_c2_g1_i130 | —NA— | —NA— | ||
| TRINITY_DN3188_c0_g1_i346 | —NA— | —NA— | ||
| TRINITY_DN1365_c3_g1_i59 | INP4A_HUMANInositol polyphosphate-4-phosphatase type I A | —NA— | ||
| TRINITY_DN3854_c0_g1_i44 | RAB3I_Rab-3A-interacting protein | —NA— | ||
| TRINITY_DN2955_c0_g2_i15 | STX16_Syntaxin-16 | —NA— | ||
| TRINITY_DN1361_c0_g1_i24 | ARHGI_Rho guanine nucleotide exchange factor 18 | —NA— | ||
| TRINITY_DN9424_c0_g1_i26 | JERKY_Jerky protein | —NA— | ||
| TRINITY_DN9508_c0_g1_i222 | DYH1_Dynein heavy chain 1, axonemal | —NA— | ||
| TRINITY_DN1377_c0_g1_i18 | NDOR1_NADPH-dependent diflavin oxidoreductase 1 | CYSJ_Sulfite reductase | ||
| TRINITY_DN22261_c0_g1_i3 | SAM50_SAM50-like protein CG7639 | BAMA_Outer membrane protein assembly factor BamA | ||
| TRINITY_DN7220_c0_g1_i168 | MERL_Merlin | —NA— | ||
| TRINITY_DN4134_c0_g1_i14 | —NA— | —NA— | ||
| TRINITY_DN4968_c0_g1_i120 | —NA— | —NA— | ||
| TRINITY_DN1580_c0_g1_i46 | —NA— | —NA— | ||
| TRINITY_DN1829_c0_g1_i121 | HMCN1_Hemicentin-1 | —NA— | ||
| TRINITY_DN1957_c0_g1_i143 | ANM8_Protein arginine N-methyltransferase 8 | PRMA_Ribosomal protein L11 methyltransferase | ||
| TRINITY_DN7343_c0_g1_i268 | ZC3HF_Zinc finger CCCH domain-containing protein 15 | —NA— | ||
| TRINITY_DN2234_c0_g1_i364 | SPTC2_Serine palmitoyltransferase 2 | BIOF_B8-amino-7-oxononanoate synthase | ||
| TRINITY_DN715_c0_g1_i30 | KCP_Kielin/chordin-like protein | —NA— | ||
| TRINITY_DN7704_c0_g2_i86 | GRB14_Growth factor receptor-bound protein 14 | —NA— | ||
| UP Seawater | TRINITY_DN70670_c0_g1_i4 | PALLD_Palladin (Fragment) | —NA— | |
| TRINITY_DN17473_c0_g1_i1 | —NA— | —NA— | ||
| TRINITY_DN12692_c0_g1_i5 | SDK1_Protein sidekick-1 | —NA— | ||
| TRINITY_DN28984_c0_g1_i10 | SDK2_Protein sidekick-2 | —NA— | ||
| TRINITY_DN27427_c0_g1_i8 | LAR_Tyrosine-protein phosphatase Lar | —NA— | ||
| TRINITY_DN48053_c0_g1_i4 | PTPRQ_Phosphatidylinositol phosphatase PTPRQ | —NA— | ||
| TRINITY_DN128587_c0_g1_i8 | ROBO3_Roundabout homolog 3 | —NA— | ||
| TRINITY_DN16261_c0_g1_i13 | SDK1_Protein sidekick-1 | —NA— | ||
| TRINITY_DN9894_c0_g1_i10 | —NA— | —NA— | ||
| TRINITY_DN626_c0_g1_i71 | REXO4_RNA exonuclease 4 | —NA— | ||
| TRINITY_DN7109_c0_g1_i82 | NBN_Nibrin | —NA— | ||
| TRINITY_DN8799_c0_g1_i3 | —NA— | —NA— | ||
| TRINITY_DN6898_c0_g1_i148 | ACBG2_Long-chain-fatty-acid—CoA ligase ACSBG2 | FAD11_Putative fatty-acid—CoA ligase fadD11 | ||
| TRINITY_DN47501_c0_g1_i15 | HMCN1_Hemicentin-1 | —NA— | ||
| Macroalage vs Seawater | UP Macroalgae | TRINITY_DN27749_c0_g1_i2 | METK1_Probable S-adenosylmethionine synthase 1 | METK_2S-adenosylmethionine synthase |
| TRINITY_DN6228_c0_g1_i12 | —NA— | —NA— | ||
| TRINITY_DN1565_c0_g1_i128 | CGL_Cystathionine gamma-lyase | METC_Cystathionine beta-lyase | ||
| UP Seawater | TRINITY_DN315_c0_g1_i78 | CE051_UPF0600 protein C5orf51 homolog | THIO1_Thioredoxin 1 | |
| TRINITY_DN7343_c1_g1_i44 | MED4_Mediator of RNA polymerase II transcription subunit 4 | —NA— | ||
| TRINITY_DN26783_c1_g1_i5 | GEPH_Gephyrin | LUTB_Lactate utilization protein B |
Up- and down-regulated transcripts for each treatment comparison in Plakortis angulospiculatus.
NA, not annotated.
Table 4
| Comparison | Regulation | Transcript_ID | Blast ID_Metazoa | Blast ID_prokaryota |
|---|---|---|---|---|
| Coral vs Background | UP | TRINITY_DN2196_c1_g2_i1 | —NA— | —NA— |
| TRINITY_DN616_c1_g1_i3 | EP300_Histone acetyltransferase p300 | —NA— | ||
| TRINITY_DN6713_c0_g1_i33 | LMLN_Leishmanolysin-like peptidase | —NA— | ||
| TRINITY_DN178567_c0_g1_i1 | —NA— | —NA— | ||
| TRINITY_DN5321_c1_g1_i2 | PKHL1_Fibrocystin-L | —NA— | ||
| DOWN | TRINITY_DN12078_c1_g1_i4 | —NA— | —NA— | |
| Macroalgae vs Background | UP | TRINITY_DN643_c1_g1_i7 | —NA— | —NA— |
| TRINITY_DN115039_c0_g1_i1 | —NA— | —NA— | ||
| TRINITY_DN2061_c3_g1_i4 | —NA— | —NA— | ||
| TRINITY_DN3071_c1_g1_i7 | NBEL2_Neurobeachin-like protein 2 | —NA— | ||
| DOWN | TRINITY_DN3316_c3_g1_i11 | —NA— | —NA— | |
| TRINITY_DN1487_c0_g1_i19 | LMLN_Leishmanolysin-like peptidase | —NA— | ||
| TRINITY_DN3110_c0_g1_i89 | MP2K2_Dual specificity mitogen-activated protein kinase kinase 2 | —NA— | ||
| Seawater vs Background | UP | TRINITY_DN42465_c0_g2_i1 | —NA— | —NA— |
| TRINITY_DN54357_c0_g1_i6 | —NA— | —NA— | ||
| TRINITY_DN1794_c0_g2_i7 | PTPRH_Receptor-type tyrosine-protein phosphatase H | —NA— | ||
| Macroalgae vs Coral | UP Macroalgae | TRINITY_DN563_c0_g1_i232 | PDZD8_PDZ domain-containing protein 8 | —NA— |
| TRINITY_DN115039_c0_g1_i1 | —NA— | —NA— | ||
| TRINITY_DN89349_c0_g1_i1 | —NA— | —NA— | ||
| TRINITY_DN1628_c0_g1_i3 | HELZ2_Helicase with zinc finger domain 2 | Y104_Uncharacterized ATP-dependent helicase MJ0104 | ||
| TRINITY_DN4405_c0_g1_i24 | DSRAD_Double-stranded RNA-specific adenosine deaminase | —NA— | ||
| TRINITY_DN751_c0_g1_i8 | —NA— | —NA— | ||
| TRINITY_DN6534_c0_g1_i8 | —NA— | —NA— | ||
| TRINITY_DN4250_c0_g1_i4 | MUSK_Muscle, skeletal receptor tyrosine protein kinase | —NA— | ||
| TRINITY_DN9663_c0_g1_i3 | —NA— | —NA— | ||
| TRINITY_DN7136_c0_g1_i12 | POLR_Retrovirus-related Pol polyprotein from type-2 retrotransposable element R2DM | —NA— | ||
| TRINITY_DN2275_c0_g1_i66 | PK3CA_Phosphatidylinositol 4,5-bisphosphate 3-kinase catalytic subunit alpha isoform | —NA— | ||
| UP Corals | TRINITY_DN572_c0_g1_i8 | BRPF1_Peregrin | HEM1_5-aminolevulinate synthase | |
| TRINITY_DN2851_c0_g1_i15 | —NA— | —NA— | ||
| TRINITY_DN178567_c0_g1_i1 | —NA— | —NA— | ||
| TRINITY_DN882_c0_g2_i7 | —NA— | —NA— | ||
| TRINITY_DN94324_c0_g1_i1 | —NA— | —NA— | ||
| TRINITY_DN1121_c0_g1_i25 | SC24C_Protein transport protein Sec24C | —NA— | ||
| TRINITY_DN4814_c0_g1_i16 | HMCN1_Hemicentin-1 | —NA— | ||
| TRINITY_DN3500_c0_g1_i8 | PTPRQ_Phosphatidylinositol phosphatase PTPRQ | —NA— | ||
| TRINITY_DN3364_c0_g1_i15 | S15A2_Solute carrier family 15 member 2 | YCLF_UUncharacterized transporter | ||
| TRINITY_DN200_c2_g1_i2 | —NA— | —NA— | ||
| TRINITY_DN2434_c0_g1_i51 | BTBDA_BTB/POZ domain-containing protein 10 | —NA— | ||
| TRINITY_DN4586_c0_g1_i8 | EPHB3_Ephrin type-B receptor 3 | —NA— | ||
| TRINITY_DN11963_c0_g1_i32 | ZDH17_Palmitoyltransferase ZDHHC17 | —NA— | ||
| TRINITY_DN4436_c0_g1_i13 | —NA— | —NA— | ||
| TRINITY_DN194_c0_g1_i36 | IPO9_Importin-9 | —NA— | ||
| TRINITY_DN2661_c1_g1_i29 | RIOK3_Serine/threonine-protein kinase RIO3 | RIO1_RIO-type serine/threonine-protein kinase Rio1 | ||
| TRINITY_DN1406_c1_g1_i19 | BRCA2_Breast cancer type 2 susceptibility protein homolog | —NA— | ||
| Coral vs Seawater | UP Corals | TRINITY_DN616_c1_g1_i3 | EP300_Histone acetyltransferase p300 | —NA— |
| TRINITY_DN178567_c0_g1_i1 | —NA— | —NA— | ||
| TRINITY_DN778_c0_g1_i24 | SL9C1_Sodium/hydrogen exchanger 10 | NHAP_Na(+)/H(+) antiporter ApNhaP | ||
| TRINITY_DN53493_c0_g1_i4 | CR3L4_Cyclic AMP-responsive element-binding protein 3-like protein 4 | —NA— | ||
| TRINITY_DN4015_c0_g2_i11 | —NA— | —NA— | ||
| TRINITY_DN2379_c3_g1_i1 | —NA— | —NA— | ||
| UP Seawater | TRINITY_DN46_c0_g1_i43 | NEK9_Serine/threonine-protein kinase Nek9 | —NA— | |
| TRINITY_DN3366_c1_g1_i21 | —NA— | —NA— | ||
| TRINITY_DN42465_c0_g2_i1 | —NA— | —NA— | ||
| Macroalage vs Seawater | UP Macroalgae | TRINITY_DN115039_c0_g1_i1 | —NA— | —NA— |
| TRINITY_DN89349_c0_g1_i1 | —NA— | —NA— | ||
| UP Seawater | TRINITY_DN54357_c0_g1_i6 | —NA— | —NA— | |
| TRINITY_DN1756_c0_g1_i5 | —NA— | —NA— |
Up- and down-regulated transcripts for each treatment comparison in Halisarca caerulea.
NA, not annotated.
In both sponge species, most of the DE transcripts belonged to metazoan genes and only a few were prokaryotic genes. The full list and annotation of the DE transcripts are presented in Tables 3 and 4. Among the annotated DE transcripts, two of them, Hemicentin-1 (HMCN1) and Phosphatidylinositol phosphatase (PTPRQ), were differentially upregulated in both sponge species, but in different treatments (Tables 3, 4). While HMCN1 was upregulated and PTPRQ downregulated in the coral compared to the seawater treatment in P. angulospiculatus, both HMCN1 and PTPRQ were upregulated in the coral compared to the macroalgal treatment in H. caerulea. In P. angulospiculatus, a few of the annotated DE transcripts recurred in the different treatment comparisons. For example, Acetyl-coenzyme A synthetase (ACSA) was upregulated compared to the background conditions in both the coral and macroalgal treatments. The metazoan transcript Phosphatidylinositol 3,4,5-trisphosphate 3-phosphatase and dual-specificity protein phosphatase (PTEN) was downregulated in the coral treatment compared to the background and macroalgal treatment. In contrast, the prokaryotic transcript Sulfite reductase (CYSJ) was upregulated in the coral treatment compared to both the macroalgal and seawater treatment (Table 3). In H. caerulea, the transcript histone acetyltransferase p300 (EP300) was upregulated in the coral treatment compared to the background and seawater treatment. The transcript Leishmanolysin-like peptidase (LMLN), instead, was upregulated in the coral treatment and downregulated in the macroalgal treatment compared to the background.
16S Amplicon sequencing
After filtering and quality control, 1,623,900 prokaryotic sequences were obtained from 83 samples (genomic DNA of the aquaria bacterioplankton samples and cDNA of the sponge samples), resulting in an average frequency of 19,565 sequence reads per sample. We identified 5,470 prokaryotic amplicon single nucleotide variants (ASVs) affiliated with 44 prokaryotic phyla. Taxonomic assignment revealed distinct prokaryotic community compositions among the two sponge species and the aquaria bacterioplankton (Figure 3A). The prokaryotic community composition of the HMA species P. angulospiculatus was dominated by Chloroflexi, Proteobacteria, Poribacteria, Acidobacteria, Spirochetes, Entotheonellaeota, PAUC34f, Actinobacteria, Gemmatimonadetes, and Nitrospirae. The prokaryotic community composition of the LMA species H. caerulea was dominated by Proteobacteria, Cyanobacteria, Bacteroidetes, and Spirochetes, and was more similar to that of the aquaria bacterioplankton, where Proteobacteria, Cyanobacteria, Bacteroidetes, and Marinimicrobia (instead of Spirochetes) were prevalent.
Figure 3
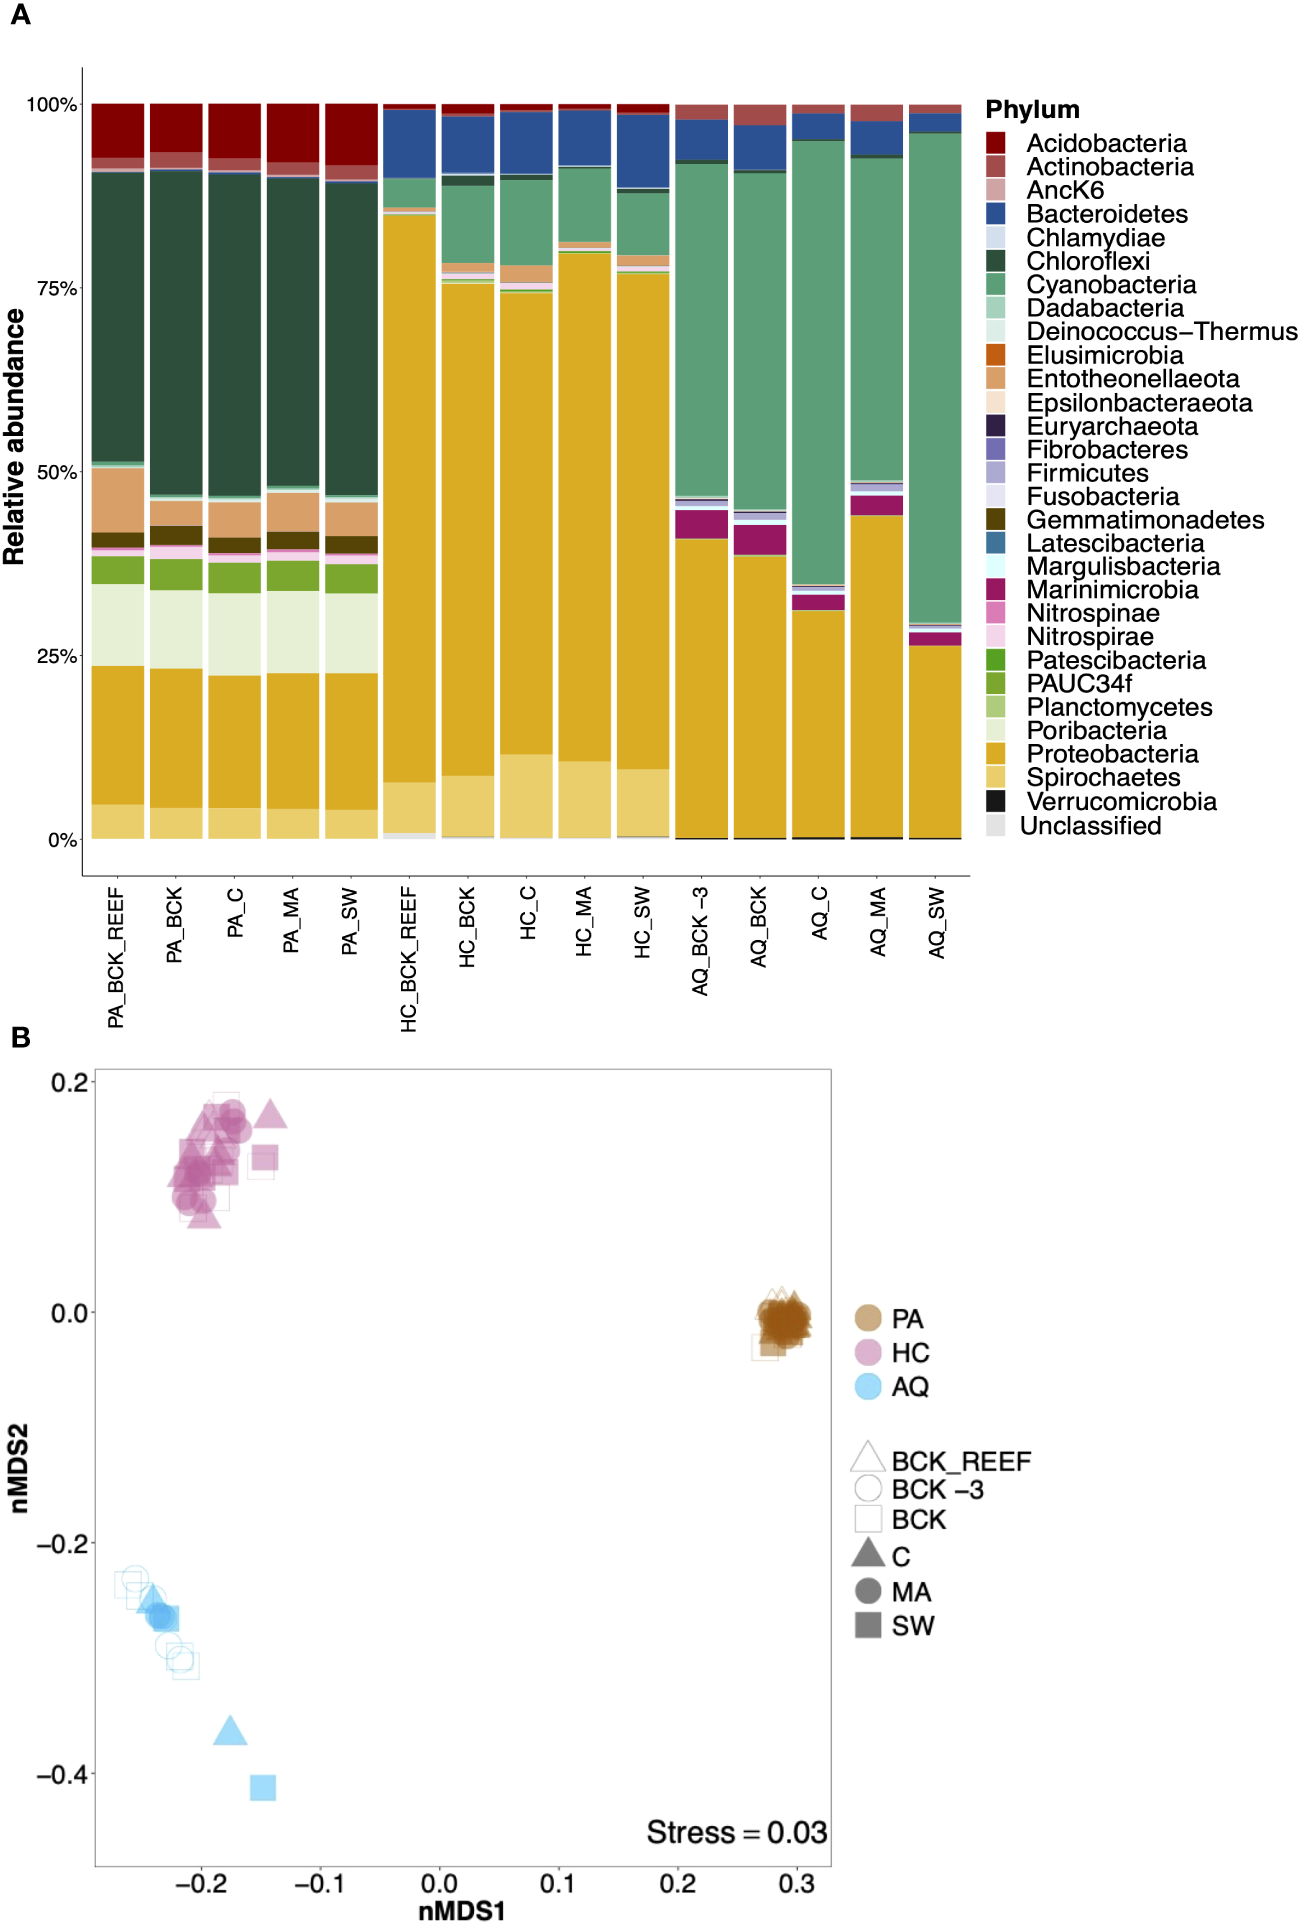
Community composition and beta diversity visualization of the sponge-associated prokaryotic communities of Plakortis angulospiculatus (PS), Halisarca caerulea (HC), and the aquaria bacterioplankton (AQ) at the background conditions (BCK_REEF, background reef; BCK -3, background at t = -3 d; BCK, background at t = 0) and after 12 days of exposure to the treatment (C, coral; MA, macroalgae; SW, seawater). (A) Relative abundance of prokaryotic community composition at the phylum level and (B) non-metric multidimensional scaling (nMDS) on weighted UniFrac distances at the ASV level. In the nMDS each marker corresponds to the prokaryotic community of a sample.
While the prokaryotic community richness at the ASV level was similar between the two sponge species and the aquaria bacterioplankton (Kruskal-Wallis, H=0.73, p=0.69), and across different treatments within the same species (P. angulospiculatus: H=0.31, p=0.98; H. caerulea: H=6.92, p=0.14; aquaria bacterioplankton: H=1.51, p=0.82; and Supplementary Figure S4), the prokaryotic community composition was significantly different between H. caerulea, P. angulospiculatus, and the aquaria bacterioplankton (PERMANOVA, Pseudo-F=339, p=0.001). These differences were visualized by non-metric multidimensional scaling (nMDS) based on weighted UniFrac distances (Figure 3B). All prokaryotic communities clustered per sponge species or as aquaria bacterioplankton, with lowest dispersion for P. angulospiculatus samples and highest dispersion among the aquaria bacterioplankton samples. Sample ordination did not show a distinctive separation between the treatments in neither sponge species nor in the aquaria bacterioplankton, this was confirmed by the PERMANOVAs comparisons which did not show significant differences between the treatments (P. angulospiculatus: Pseudo-F=1.24, p=0.15; H. caerulea: Pseudo-F=1.47, p=0.07; aquaria bacterioplankton: Pseudo-F=0.87, p=0.50). The experimental aquaria set-up did not affect the prokaryotic community composition of the sponges, as shown by the similar prokaryotic communities of the sponges sampled on the reef (BCK_REEF) and those sampled at day 0 (BCK; after 3 days of acclimatization to the aquaria set-up). Sequencing data obtained from the genomic DNA of P. angulospiculatus gave similar results to the cDNA data presented above (Supplementary Figure S5). The prokaryotic community composition of P. angulospiculatus was the same in both datasets, although the relative abundance of the different phyla slightly differed between the two. Chloroflexi, Poribacteria, Entotheonellaeota and PAUC34f, showed higher relative abundances in the cDNA samples, while Proteobacteria, Actinobacteria, and Gemmatimonadetes, showed higher relative abundances in the genomic DNA samples. According to the above-mentioned results, there was no significant difference between the treatments also in the genomic DNA dataset (PERMANOVA, Pseudo-F=1.44, p=0.10).
Sponge physiological fluxes incubations
Overall, both sponge species showed net uptake of O2, organic carbon and organic nitrogen along with a net release of dissolved inorganic nitrogen and phosphate (Figure 4; see Supplementary Table S5; Supplementary Figure S6 for all rates). Seawater only control incubation did not show any significant change for all parameters (see Supplementary Figure S7; note that this figure only shows concentrations, not fluxes). All the fluxes, except for nitrite and nitrate, were significantly different between the two sponge species (see Supplementary Table S6 for statistical information). Halisarca caerulea displayed higher fluxes than P. angulospiculatus across all the treatments, with the greatest differences in the net uptake rates of dissolved organic carbon (DOC; 14-55 times) and nitrogen (DON; 5-66 times) (Supplementary Table S5; Supplementary Figure S6). However, per sponge species, no significant differences were observed between the coral, macroalgae or seawater treatments in any of the measured fluxes (Supplementary Table S6).
Figure 4
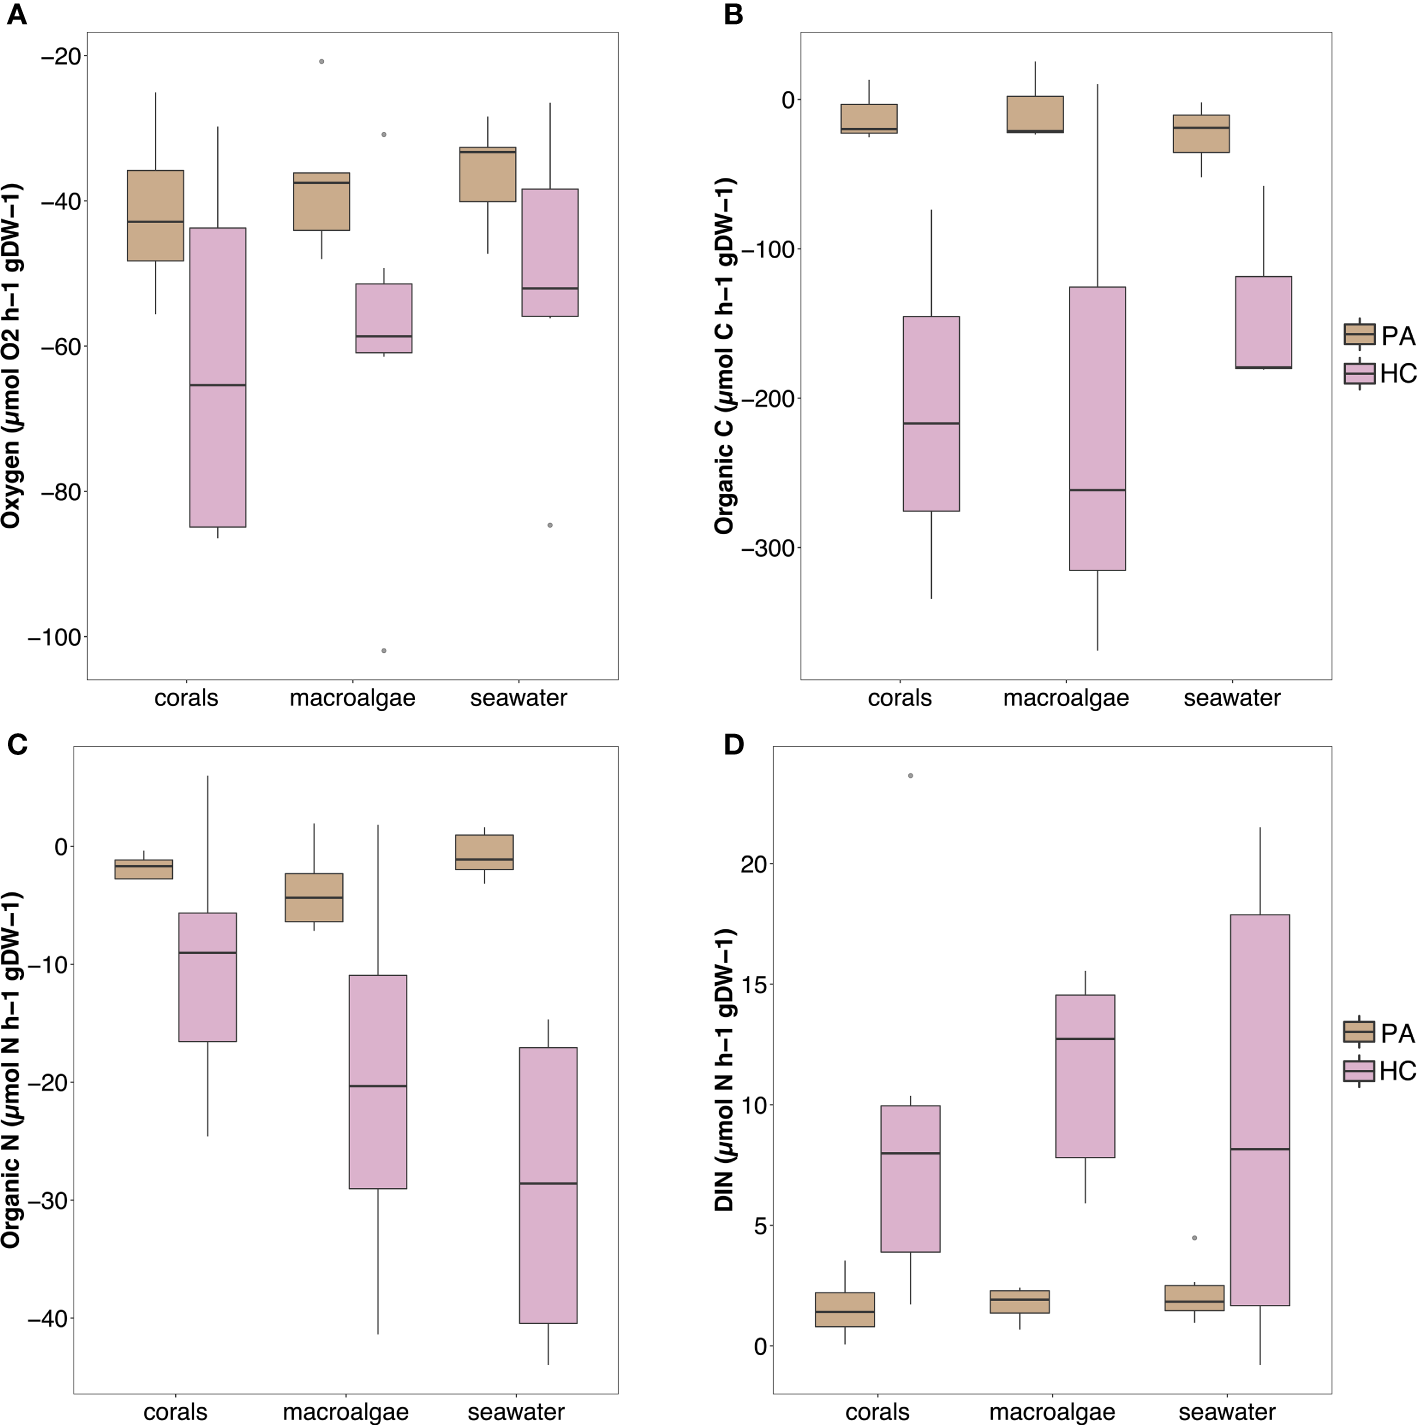
Fluxes of (A) oxygen, (B) organic carbon, (C) organic nitrogen, and (D) inorganic nitrogen measured in the sponge incubations, shown per treatment and sponge species (PA, Plakortis angulospiculatus; HC, Halisarca caerulea). Positive values indicate net release and negative values indicate net uptake. Organic carbon and nitrogen values obtained as the sum of dissolved organic carbon/nitrogen and live particulate organic carbon/nitrogen (i.e., Bacteria, Synechococcus sp. and Prochlorococcus sp.).
Discussion
Over the past decades, many coral reefs, especially within the Caribbean, South-West Atlantic and Central Pacific, have shown strong community shifts leading from coral- to macroalgae- dominated reef surfaces (Reverter et al., 2021). At present, it is largely unknown to what extent this benthic community transition results in altered nutrient fluxes on reefs and accompanying changes in food web structures. Both corals and macroalgae as primary producers provide pivotal resources to the reef. As sponges are key reef (re)cyclers of (in)organic nutrients, we assessed whether sponges shift their metabolism when exposed to exudates from either coral- or macroalgae-dominated treatments for a prolonged time (12 days) compared to an ambient seawater only control treatment. The absence of differences in prokaryotic composition and physiological rates, and low differential expression between coral, macroalgae, and seawater treatments compared to other transcriptomic studies in sponges (Pita et al., 2018b; González-Aravena et al., 2019; Koutsouveli et al., 2020; Wu et al., 2022) indicate that the experimental conditions had a relatively modest effect on the overall metabolism of our two model sponges: the high microbial abundance (HMA) sponge Plakortis angulospiculatus and the low microbial abundance (LMA) sponge Halisarca caerulea. However, a few interesting differentially expressed metabolic pathways and processes were identified between the different treatments.
Host transcriptional response after 12-day exposure to coral or macroalgal exudates
In both sponge species, the exposure to coral or macroalgal exudates triggered the differential expression of a set of metazoan transcripts which could be involved in cell signaling pathways and immune defense (Figure 5). Overall, in the HMA species P. angulospiculatus, cell signaling pathways downregulating apoptosis and promoting cell proliferation were induced in the coral treatment compared to the macroalgal and seawater treatments. For example, in the pairwise comparisons between the coral and macroalgae treatments the transcript PTEN, a well-known tumor suppressor with pro-apoptotic properties (Jing et al., 1997; Tamura et al., 1998), was downregulated in the coral treatment. In the comparison between the coral and seawater treatments several pro-proliferation signaling genes were upregulated in the coral treatment, such as INP4A (which has the opposite effect of PTEN), CTNB (i.e., β-catenin), CASD1, KCP, RAB3I, and ARHGI (Shapiro and Weis, 2009; Herder et al., 2013; Guo et al., 2018; Cavdarli et al., 2021), while transcripts that inhibit cell proliferation, including LAR, PTPRQ, and ROBO3 (Kulas et al., 1995; Frolov and Dyson, 2004; Jung et al., 2009) were downregulated. However, the transcript MERL was also upregulated in the coral versus seawater treatment, and this might have a counteracting effect as it is known to suppress cell proliferation, probably through activation of the Hippo signaling pathway (Cooper and Giancotti, 2014). Furthermore, in the comparison with the background conditions the transcript PTEN, was also downregulated in the coral treatment, while the transcript INT11, which is essential for cell-cycle progression (Huang et al., 2020), was upregulated. In sponges exposed to the macroalgal treatment instead, the downregulation of the transcript RBBP6 (also known as PACT), compared to the background condition, is likely to reduce p53 signaling, leading to both apoptosis and cell growth retardation (Li et al., 2007).
Figure 5
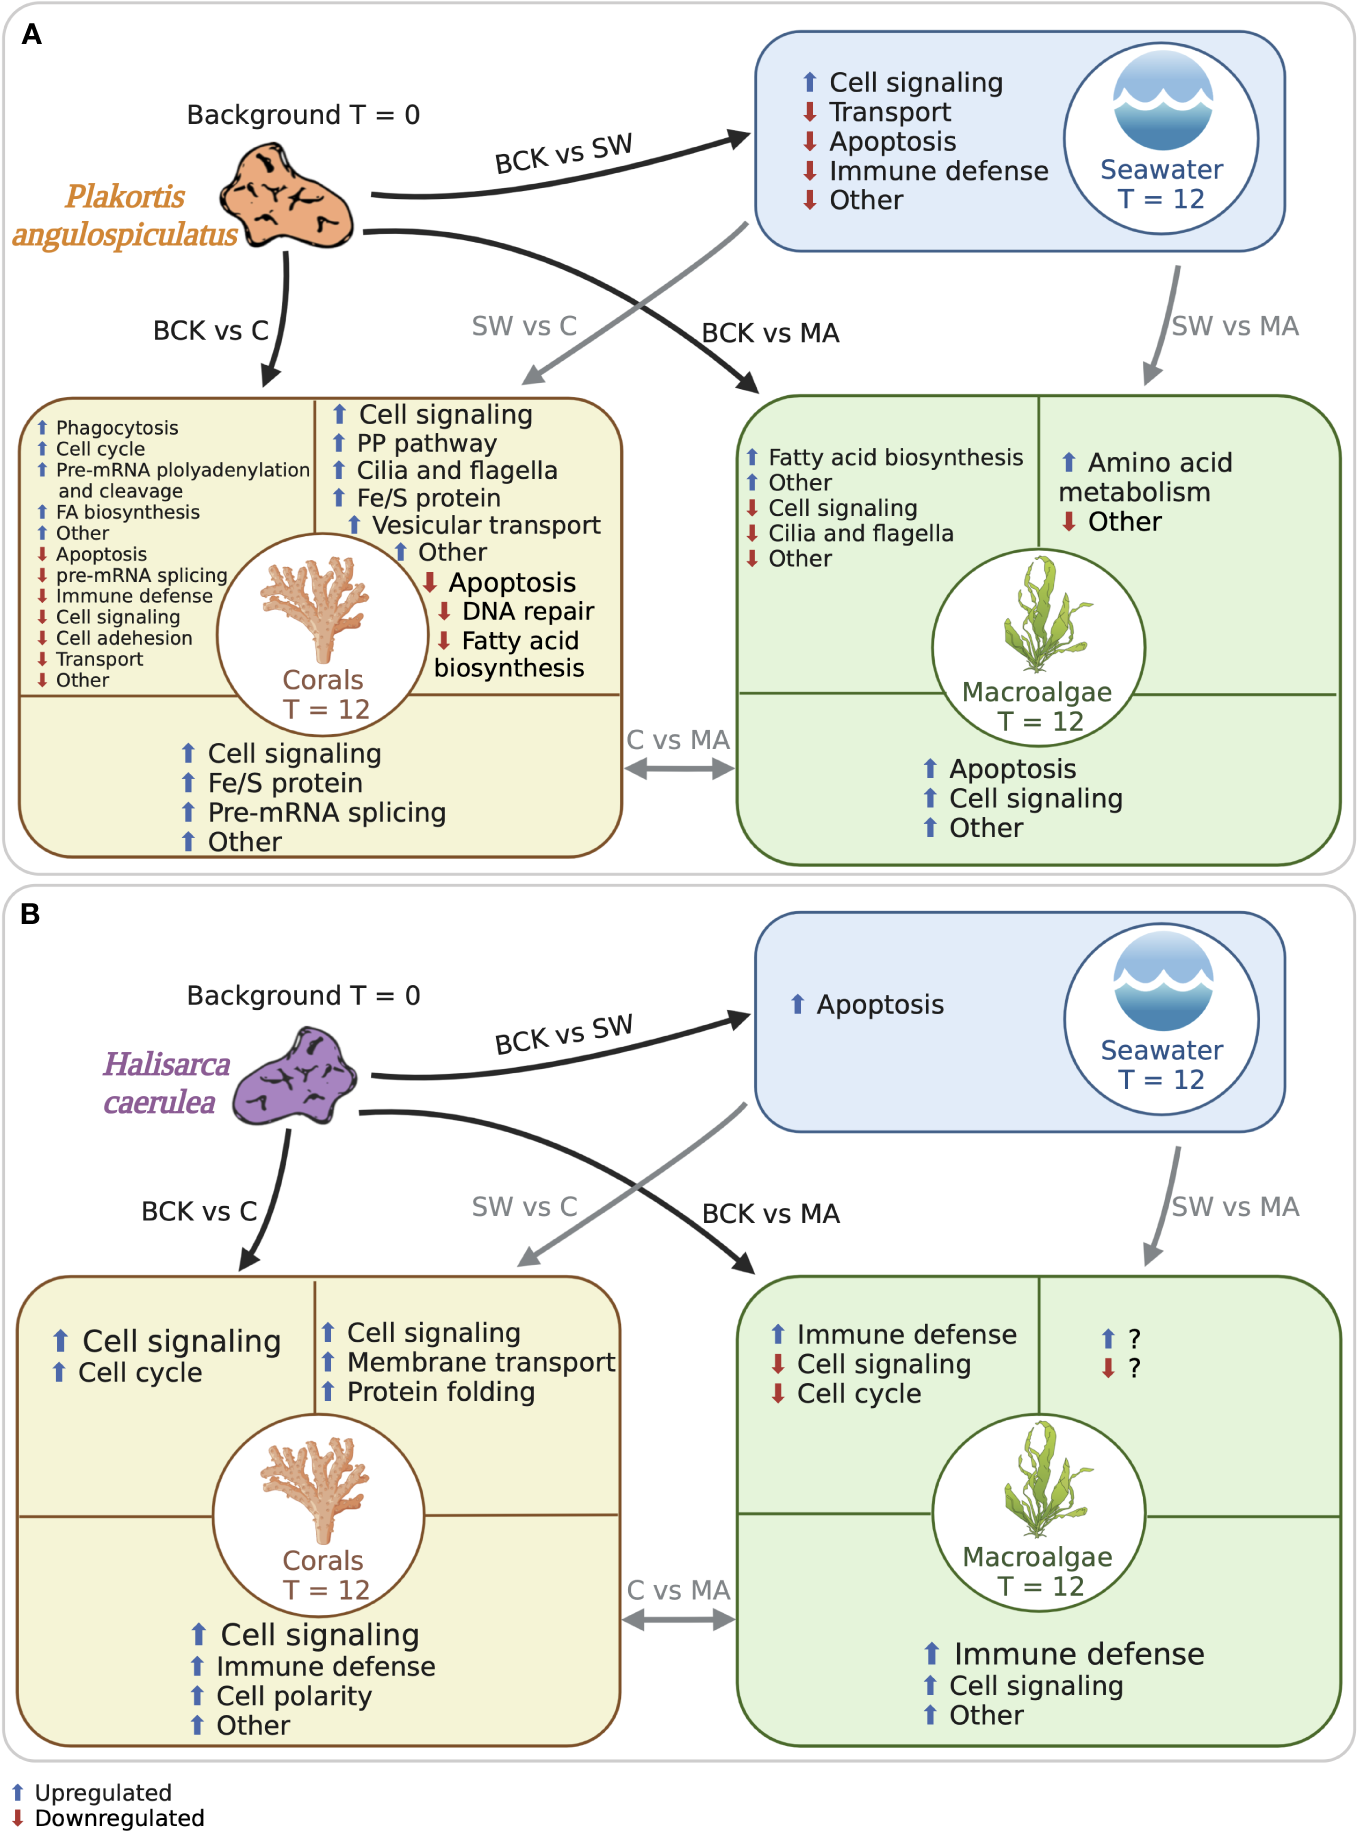
Schematic representation of the functional categories of the metazoan annotated differentially expressed transcripts in (A)Plakortis angulospiculatus and (B)Halisarca caerulea. Black arrows indicate the comparisons to the background conditions at t = 0 (BCK), and grey arrows indicate the comparisons between the treatments at t = 12 (C, coral; MA, macroalgae; SW, seawater). Functional categories are based on the metazoan annotation of the transcripts. Blue arrows indicate upregulated transcripts and red arrows downregulated transcripts. Created with BioRender.com.
In the LMA species H. caerulea, the exposure to coral exudates also induced higher expression of transcripts involved in cell signaling pathways, such as PKHL1, NEK9 and EP300, which were upregulated compared to the background and the seawater treatment. Furthermore, in the pairwise comparison between the coral and the macroalgal treatments several other transcripts involved in cellular signaling pathways were upregulated in the coral treatment, including BRPF1, PTPRQ, BTBDA, EPHB3, ZDH17, IPO9, RIOK3 and BRCA2. These genes transcribe for factors that alone or depending on the presence of other ligands can activate or inhibit signaling pathways, such as serine/threonine-protein kinase (PI3K-Akt), mitogen-activated protein kinases (MAPK), p53, and others, that control cell growth, development, survival, proliferation, and apoptosis in metazoans (Nawa et al., 2008; Shi et al., 2015; Zheng et al., 2019). One transcript involved in cell signaling was also upregulated in the macroalgal treatment, i.e., the transcript PK3CA that is one of the major activators of the PI3K-Akt signaling cascade (Hemmings and Restuccia, 2012), suggesting that this is an important pathway in H. caerulea regardless of the treatment. Furthermore, the transcripts HMCN1, which is involved in the maintenance of cell polarity (Vogel et al., 2006), and PTPRQ, an important regulator of PI3K-Akt phosphorylation (Jung et al., 2009), were differentially upregulated in both H. caerulea and P. angulospiculatus, suggesting that they could be conserved genes in sponges for cell polarity and signaling regulation.
In H. caerulea, the strongest transcriptional response to the macroalgae treatment as compared with the coral and, to a lesser extent, the background treatment, was the stimulation of pathways involved in immune responses against pathogenic infections. In fact, we found upregulation of the transcripts PDZD8, HELZ2, DSRAD, and NBEL2, which are involved in antiviral response and pathogen defense (Henning et al., 2010; Nishikura, 2010; Fusco et al., 2017; Sowerby et al., 2017). In P. angulospiculatus, transcripts known to induce immune responses, including MX and IRAK2 were found to be downregulated in the coral and seawater treatments compared to the background condition. These results suggest that macroalgal exudates likely contain more pathogens and virulence factors compared to the coral ones, which is supported by the observation of higher relative abundances of copiotrophic and potentially pathogenic microbes in bacterioplankton feeding on algae-produced organic matter (Nelson et al., 2013; Haas et al., 2016; Cárdenas et al., 2018). Furthermore, higher immune response was identified also in P. angulospiculatus after shorter (6 h) exposure to macroalgal- vs coral-DOM (Campana et al., 2022).
In our previous study, we also found that a short 6-h pulse to isotope-enriched coral-DOM led to a metabolic reprogramming towards the pentose phosphate (PP) pathway in P. angulospiculatus (Campana et al., 2022). Likewise, the upregulation of the transcript TKT found in our longer-term study here, suggests that the PP pathway metabolism may play a key role in providing nutrients to support cell proliferation (Zhao and Zhong, 2009) in P. angulospiculatus exposed to coral exudates. Another coral-specific response observed here in comparison to the macroalgal and seawater treatments, was the upregulation of the transcripts NFS1 and NDOR1, which are involved in iron-sulfur (Fe-S) protein metabolism. Acetyl CoA synthesis, instead, was upregulated in both the coral and macroalgal treatments compared to the background conditions by the same transcript ACSA that activates acetate so that it can be used for lipid synthesis or energy generation (Luong et al., 2000).
A further analogy between the short isotope-DOM pulse and this study was the upregulation of transcripts involved in cilia and flagella development and movement in P. angulospiculatus, which could induce the movement of flagella in choanocyte cells (i.e., sponge filtering cells) when exposed to coral organic matter. In fact, a dynein heavy chain (DYH10) was found upregulated in P. angulospiculatus (Campana et al., 2022), and here, another dynein heavy chain (DYH1) was found upregulated in the coral compared to the seawater treatment. The transcript DC2I1, also involved in cilia and flagella formation and functioning, was instead downregulated in the macroalgal treatment compared to the background.
Limited interpretation of the transcriptional response of the sponge microbiomes
A major limiting factor in the functional interpretation of the response of the two sponge microbiomes was the annotation of the prokaryotic transcripts. In H. caerulea, only 5 out of 57 (9%) DE transcripts received prokaryotic annotation and in P. angulospiculatus 21 out of 95 (22%). It could be possible that the host drives most of the differential expression in the LMA sponge, but a greater response in the microbiome of the HMA sponge would be expected. When looking at the prokaryotic annotated DE transcripts in P. angulospiculatus, the coral treatment seemed to stimulate sulphur metabolism through the upregulation of the transcript CYSJ, which catalyses the 6-electron reduction of sulphite to sulphide, when compared to the macroalgae and seawater treatments. Furthermore, when exposed to coral exudates the microbiome of P. angulospiculatus appeared to elicit transcripts involved in vitamin B1 (thiamine; THIG) and B7 (biotin; BIOF) biosynthesis. B vitamins are important cofactors in several metabolic pathways, and it has been shown that they also play important roles in the maintenance of host immune functions (Yoshii et al., 2019). Although sponges can obtain B-vitamins through feeding, symbionts likely provide an alternative pathway for vitamin provision (Siegl et al., 2011; Fiore et al., 2015; Engelberts et al., 2020) supplementing the diet and immune response of their sponge hosts.
Stable sponge-associated prokaryotic communities
The sponge-associated prokaryotic communities of both sponge species remained stable during the whole experiment. The exposure to the coral or macroalgal exudates for 12 days did not affect the composition of the associated prokaryotic communities, suggesting that the experimental conditions did not perturb them, and that host identity was still a major factor shaping the composition of the associated microbiota. Stable host-specific partnerships are common between sponge hosts and their microbial symbionts and have been observed in several studies along different environmental gradients (Lee et al., 2010; Reveillaud et al., 2014; Erwin et al., 2015; Souza et al., 2017; Campana et al., 2021c).
Consistent with previous work, the LMA species H. caerulea was dominated by four phyla, namely Proteobacteria, Spirochaetes, Cyanobacteria, and Bacteroidetes (Lesser et al., 2019), while the HMA species P. angulospiculatus was instead dominated by a more diverse community, including Chloroflexi, Proteobacteria, Poribacteria, Acidobacteria, Entotheonellaeota, Spirochetes, PAUC34f, and others (Olson and Gao, 2013; Campana et al., 2021b; Campana et al., 2021c). We found substantial overlap between the genomic DNA and cDNA community profiles of the HMA species P. angulospiculatus. The increase in the relative abundance of some phyla, such as Chloroflexi, Poribacteria, Entotheonellaeota, and PAUC34f, in the cDNA samples indicates that these bacteria likely have higher metabolic activity than the other phyla, such as Proteobacteria, Actinobacteria, and Gemmatimonadetes, which instead showed higher relative abundances in the genomic DNA samples.
Sponge physiological response after prolonged exposure to coral or macroalgal dominance
The physiological response of both sponge species did not significantly change as a result of the three treatments, indicating no effect on (in)organic nutrient cycling induced by the exposure to coral or macroalgae exudates for 12 days. Overall, most carbon/nitrogen fluxes were found to be higher (and showing the highest differences in average fluxes between treatments) in the LMA species H. caerulea compared to the HMA species P. angulospiculatus, with the greatest differences in the uptake of DOC/DON. These findings corroborate growing evidence that tropical and deep-sea sponges with low microbial abundances generally take up DOM at higher rates than sponges with higher microbial abundances (de Goeij et al., 2017; Mueller et al., 2014b; Bart et al., 2020; Rix et al., 2020; Campana et al., 2021a). The inorganic nutrient fluxes, with the exception of nitrite and nitrate, were also significantly higher in H. caerulea than in P. angulospiculatus, as observed in Campana et al. (2021a). This further indicates higher internal recycling of inorganic nutrients in the HMA sponge as compared to the LMA species, especially of ammonium and phosphate, likely carried out by the more varied symbiotic microbial community, as supported by several “omics” studies (Sabarathnam et al., 2010; Thomas et al., 2010; Fiore et al., 2015; Moeller et al., 2019; Engelberts et al., 2020).
Conclusions
In this study, we explored the transcriptional and physiological response of two sponge holobionts after exposure to coral- and macroalgae dominated treatments and seawater only control for 12 days. The transcript expression changed significantly, but moderately, among the treatments, with highest differential expression found in relation to cellular signaling pathways, likely targeting cell proliferation and immune response. The physiological response and microbial community composition, instead, did not change between treatments, but were significantly different between the two sponge holobionts, with Halisarca caerulea showing greater (in)organic fluxes than Plakortis angulospiculatus. Given these modest differences we conclude that sponge holobionts are not substantially affected by the differences in the composition of coral and macroalgal exudates. An untargeted metabolomic approach would be the next step to better understand which metabolites sponge holobionts preferentially take up from food sources (e.g., DOM) with different stoichiometric and structural composition (Fiore et al., 2015; Letourneau et al., 2020; Olinger et al., 2021; Zhang et al., 2022). Sponges are opportunistic feeders that can rapidly take advantage of different available food sources without having to adjust their metabolic pathways or microbiomes to do so. Thus, they are likely able to adapt to the change in types of food available on coral reefs shifting from coral to algal dominance. Being key ecosystem engineers that drive cycling of nutrients in marine benthic food webs (Maldonado et al., 2012; de Goeij et al., 2013; de Goeij et al., 2017), it is more important for future studies to predict which sponge types, e.g., LMA or HMA, thrive best under changing environmental conditions, as there is a major difference in uptake and release rates of (in)organic resources between species. However, the resistance of sponges to different types of food available on reefs, unfortunately, does not imply that sponges survive other ongoing changes in environmental conditions, e.g., rising seawater temperatures causing severe heatwaves, on contemporary and future reefs.
Data accessibility
The sequence data have been deposited in the NCBI database under BioProject ID PRJNA839199.
Statements
Data availability statement
The datasets presented in this study can be found in online repositories. The names of the repository/repositories and accession number(s) can be found in the article/Supplementary Material.
Ethics statement
The manuscript presents research on animals that do not require ethical approval for their study.
Author contributions
SC: Conceptualization, Formal analysis, Investigation, Methodology, Software, Validation, Visualization, Writing – original draft, Writing – review & editing. JG: Conceptualization, Data curation, Funding acquisition, Methodology, Project administration, Resources, Supervision, Validation, Writing – original draft, Writing – review & editing. MA: Investigation, Methodology, Writing – review & editing. CD-V: Formal analysis, Methodology, Software, Writing – review & editing. BM: Conceptualization, Funding acquisition, Methodology, Supervision, Validation, Writing – review & editing. CB: Writing – review & editing, Methodology, Resources. AR: Formal analysis, Methodology, Software, Supervision, Validation, Visualization, Writing – review & editing. AH: Writing – review & editing. GM: Project administration, Supervision, Validation, Writing – review & editing.
Funding
The author(s) declare financial support was received for the research, authorship, and/or publication of this article. This work has received funding from the European Research Council (ERC) under the European Union’s Horizon 2020 research and innovation program (grant number 715513; personal grant to JG) and the Marie Skłodowska- Curie Actions (grant number 894645; personal grant to BM).
Acknowledgments
We are thankful to Meggie Hudspith, Niklas Kornder, Mark Vermeij, and the staff of CARMABI for fieldwork and logistical support. Thanks to Janina Fuss for next-generation sequencing analyses. A special thanks to Berend Wijers and Evelien Jongepier for help with bioinformatic analysis. Thanks to Eva de Rijke, Rutger van Hall, Pieter Slot, and the analytical laboratory of IBED for help with sample analysis at the University of Amsterdam.
Conflict of interest
The authors declare that the research was conducted in the absence of any commercial or financial relationships that could be construed as a potential conflict of interest.
Publisher’s note
All claims expressed in this article are solely those of the authors and do not necessarily represent those of their affiliated organizations, or those of the publisher, the editors and the reviewers. Any product that may be evaluated in this article, or claim that may be made by its manufacturer, is not guaranteed or endorsed by the publisher.
Supplementary material
The Supplementary Material for this article can be found online at: https://www.frontiersin.org/articles/10.3389/fmars.2024.1298922/full#supplementary-material
References
1
Alexander B. E. Achlatis M. Osinga R. d. G. Cleutjens J. P. M. Schutte B. et al . (2015). Cell kinetics during regeneration in the sponge Halisarca caerulea: how local is the response to tissue damage? PeerJ3, e820. doi: 10.7717/peerj.820
2
Andrews S. (2010). FastQC: a quality control tool for high throughput sequence data. Available at: http://www.bioinformatics.babraham.ac.uk/projects/fastqc
3
Azam F. Fenchel T. Field J. G. Gray J. S. Meyer-Reil L. A. Thingstad F. (1983). The ecological role of water-column microbes in the sea. Mar. Ecol. Prog. Ser.10, 257–263. doi: 10.3354/meps010257
4
Bart M. C. de Kluijver A. Hoetjes S. Absalah S. Mueller B. Kenchington E. et al . (2020). Differential processing of dissolved and particulate organic matter by deep-sea sponges and their microbial symbionts. Sci. Rep.10, 17515. doi: 10.1038/s41598-020-74670-0
5
Bertilsson S. Berglund O. Karl D. M. Chisholm S. W. (2003). Elemental composition of marine Prochlorococcus and Synechococcus: Implications for the ecological stoichiometry of the sea. Limnol Oceanogr48, 1721–1731. doi: 10.4319/lo.2003.48.5.1721
6
Bhagooli R. Mattan-Moorgawa S. Kaullysing D. Louis Y. D. Gopeechund A. Ramah S. et al . (2021). Chlorophyll fluorescence – A tool to assess photosynthetic performance and stress photophysiology in symbiotic marine invertebrates and seaplants. Mar. pollut. Bull.165, 112059. doi: 10.1016/j.marpolbul.2021.112059
7
Bolger A. M. Lohse M. Usadel B. (2014). Trimmomatic: a flexible trimmer for Illumina sequence data. Bioinformatics30, 2114–2120. doi: 10.1093/bioinformatics/btu170
8
Bruno J. F. Bertness M. D. (2001). “Habitat modification and facilitation in benthic marine communities,” in Marine community ecology. Eds. BertnessM. D.HayM. E.GainesS. D. (Sunderland, MA: Sinauer), 201–218.
9
Buchfink B. Xie C. Huson D. H. (2015). Fast and sensitive protein alignment using DIAMOND. Nat. Methods12, 59–60. doi: 10.1038/nmeth.3176
10
Campana S. Busch K. Hentschel U. Muyzer G. de Goeij J. M. (2021b). DNA-stable isotope probing (DNA-SIP) identifies marine sponge-associated bacteria actively utilizing dissolved organic matter (DOM). Environ. Microbiol.23, 4489–4504. doi: 10.1111/1462-2920.15642
11
Campana S. Demey C. Busch K. Hentschel U. Muyzer G. de Goeij J. M. (2021c). Marine sponges maintain stable bacterial communities between reef sites with different coral to algae cover ratios. FEMS Microbiol. Ecol.97, fiab115. doi: 10.1093/femsec/fiab115
12
Campana S. Hudspith M. Lankes D. de Kluijver A. Demey C. Schoorl J. et al . (2021a). Processing of naturally sourced macroalgal- and coral-dissolved organic matter (DOM) by high and low microbial abundance encrusting sponges. Front. Mar. Sci.8, 452. doi: 10.3389/fmars.2021.640583
13
Campana S. Riesgo A. Jongepier E. Fuss J. Muyzer G. de Goeij J. M. (2022). Meta-transcriptomic comparison of two sponge holobionts feeding on coral- and macroalgal-dissolved organic matter. BMC Genomics23, 674. doi: 10.1186/s12864-022-08893-y
14
Campbell L. Nolla H. A. Vaulot D. (1994). The importance of Prochlorococcus to community structure in the central North Pacific Ocean. Limnol Oceanogr39, 954–961. doi: 10.4319/lo.1994.39.4.0954
15
Cárdenas A. Neave M. J. Haroon M. F. Pogoreutz C. Rädecker N. Wild C. et al . (2018). Excess labile carbon promotes the expression of virulence factors in coral reef bacterioplankton. ISME J.12, 59–76. doi: 10.1038/ismej.2017.142
16
Cavdarli S. Schroter L. Albers M. Baumann A. M. Vicogne D. Le Doussal J. M. et al . (2021). Role of sialyl-O-Acetyltransferase CASD1 on GD2 ganglioside O-Acetylation in breast cancer cells. Cells10. doi: 10.3390/cells10061468
17
Chen I. A. Chu K. Palaniappan K. Ratner A. Huang J. Huntemann M. et al . (2021). The IMG/M data management and analysis system v.6.0: new tools and advanced capabilities. Nucleic Acids Res.49, D751–D763. doi: 10.1093/nar/gkaa939
18
Conesa A. Götz S. Garcia-Gomez J. Terol J. Talon M. Robles M. (2005). Blast2GO: a universal tool for annotation, visualization and analysis in functional genomics research. Bioinformatics21, 3674–3676. doi: 10.1093/bioinformatics/bti610
19
Cooper J. Giancotti F. G. (2014). Molecular insights into NF2/Merlin tumor suppressor function. FEBS Lett.588, 2743–2752. doi: 10.1016/j.febslet.2014.04.001
20
de Goeij J. M. Lesser M. P. Pawlik J. R. (2017). “Nutrient fluxes and ecological functions of coral reef sponges in a changing ocean,” in Climate Change, Ocean Acidification and Sponges. Eds. CarballoJ.BellJ. (Cham: Springer).
21
de Goeij J. M. van Oevelen D. Vermeij M. J. A. Osinga R. Middelburg J. J. de Goeij A. F. P. M. et al . (2013). Surviving in a marine desert: the sponge loop retains resources within coral reefs. Science342, 108–110. doi: 10.1126/science.1241981
22
Engelberts J. P. Robbins S. J. de Goeij J. M. Aranda M. Bell S. C. Webster N. S. (2020). Characterization of a sponge microbiome using an integrative genome-centric approach. ISME J.14, 1100–1110. doi: 10.1038/s41396-020-0591-9
23
Erwin P. M. Coma R. López-Sendino P. Serrano E. Ribes M. (2015). Stable symbionts across the HMA-LMA dichotomy: low seasonal and interannual variation in sponge-associated bacteria from taxonomically diverse hosts. FEMS Microbiol. Ecol.91, fiv115. doi: 10.1093/femsec/fiv115
24
Fiore C. L. Labrie M. Jarett J. K. Lesser M. P. (2015). Transcriptional activity of the giant barrel sponge, Xestospongia muta Holobiont: molecular evidence for metabolic interchange. Front. Microbiol.6, 364. doi: 10.3389/fmicb.2015.00364
25
Frolov M. V. Dyson N. J. (2004). Molecular mechanisms of E2F-dependent activation and pRB-mediated repression. J. Cell Sci.117, 2173–2181. doi: 10.1242/jcs.01227
26
Fusco D. N. Pratt H. Kandilas S. Cheon S. S. Lin W. Cronkite D. A. et al . (2017). HELZ2 is an IFN effector mediating suppression of dengue virus. Front. Microbiol.8, 240. doi: 10.3389/fmicb.2017.00240
27
González-Aravena M. Kenny N. J. Osorio M. Font A. Riesgo A. Cárdenas C. (2019). Warm temperatures, cool sponges: the effect of increased temperatures on the Antarctic sponge Isodictya sp. PeerJ7, e8088. doi: 10.7717/peerj.8088
28
Grabherr M. G. Yassour M. Haas B. J. Levin J. Z. Thompson D. A. Amit I. et al . (2011). Full-length transcriptome assembly from RNA-Seq data without a reference genome. Nat. Biotechnol.29, 644. doi: 10.1038/nbt.1883
29
Guo W. Chen Z. Chen Z. Yu J. Liu H. Li T. et al . (2018). Promotion of cell proliferation through inhibition of cell autophagy signalling pathway by rab3IP is restrained by microRNA-532-3p in gastric cancer. J. Cancer9, 4363–4373. doi: 10.7150/jca.27533
30
Haas A. F. Fairoz M. F. M. Kelly L. W. Nelson C. E. Dinsdale E. A. Edwards R. A. et al . (2016). Global microbialization of coral reefs. Nat. Microbiol.1, 16042. doi: 10.1038/nmicrobiol.2016.42
31
Haas A. F. Nelson C. E. Wegley Kelly L. Carlson C. A. Rohwer F. Leichter J. J. et al . (2011). Effects of coral reef benthic primary producers on dissolved organic carbon and microbial activity. PloS One6, e27973. doi: 10.1371/journal.pone.0027973
32
Hemmings B. A. Restuccia D. F. (2012). PI3K-PKB/akt pathway. Cold Spring Harb. Perpect Biol.4, a011189. doi: 10.1101/cshperspect.a011189
33
Henning M. S. Morham S. G. Goff S. P. Naghavi M. H. (2010). PDZD8 is a novel Gag-interacting factor that promotes retroviral infection. J. Virol.84, 8990–8995. doi: 10.1128/JVI.00843-10
34
Hentschel U. Fieseler L. Wehrl M. Gernert C. Steinert M. Hacker J. et al . (2003). “Microbial diversity of marine sponges,” in Sponges (porifera). Ed. MüllerW. E. G. (Berlin, Heidelberg: Springer Berlin Heidelberg), 59–88.
35
Hentschel U. Usher K. M. Taylor M. W. (2006). Marine sponges as microbial fermenters. FEMS Microbiol. Ecol.55, 167–177. doi: 10.1111/j.1574-6941.2005.00046.x
36
Herder C. Swiercz J. M. Muller C. Peravali R. Quiring R. Offermanns S. et al . (2013). ArhGEF18 regulates RhoA-Rock2 signaling to maintain neuro-epithelial apico-basal polarity and proliferation. Development140, 2787–2797. doi: 10.1242/dev.096487
37
Hooper D. U. Chapin F. S. Ewel J. J. Hector A. Inchausti P. Lavorel S. et al . (2005). Effects of biodiversity on ecosystem functioning: A consensus of current knowledge. Ecol. Monogr.75, 3–35. doi: 10.1890/04-0922
38
Huang H. Liu J. Yao F. Li X. Wang Y. Shao Y. et al . (2020). The integrator complex subunit 11 is involved in the post-diapaused embryonic development and stress response of Artemia sinica. Gene741, 144548. doi: 10.1016/j.gene.2020.144548
39
Hudspith M. de Goeij J. M. Streekstra M. Kornder N. A. Bougoure J. Guagliardo P. et al . (2022). Harnessing solar power: photoautotrophy supplements the diet of a low-light dwelling sponge. ISME J16, 2076–2086. doi: 10.1038/s41396-022-01254-3
40
Hudspith M. Rix L. Achlatis M. Bougoure J. Guagliardo P. Clode P. L. et al . (2021). Subcellular view of host–microbiome nutrient exchange in sponges: insights into the ecological success of an early metazoan–microbe symbiosis. Microbiome9, 44. doi: 10.1186/s40168-020-00984-w
41
Hughes T. P. (1994). Catastrophes, phase shifts, and large-scale degradation of a caribbean coral reef. Science265, 1547–1551. doi: 10.1126/science.265.5178.1547
42
Jing L. Clifford Y. Danny L. Katrina P. Shikha B. Wang Steven I. et al . (1997). PTEN, a putative protein tyrosine phosphatase gene mutated in human brain, breast, and prostate cancer. Science275, 1943–1947. doi: 10.1126/science.275.5308.1943
43
Jones R. J. Kildea T. Hoegh-guldberg O. (1999). PAM chlorophyll fluorometry: a new in situ technique for stress assessment in scleractinian corals, used to examine the effects of cyanide from cyanide fishing. Mar. pollut. Bull.38, 864–874. doi: 10.1016/S0025-326X(98)90160-6
44
Jung H. Kim W. K. Kim D. H. Cho Y. S. Kim S. J. Park S. G. et al . (2009). Involvement of PTP-RQ in differentiation during adipogenesis of human mesenchymal stem cells. Biochem. Biophys. Res. Commun.383, 252–257. doi: 10.1016/j.bbrc.2009.04.001
45
Kamke J. Taylor M. W. Schmitt S. (2010). Activity profiles for marine sponge-associated bacteria obtained by 16S rRNA vs 16S rRNA gene comparisons. ISME J.4, 498. doi: 10.1038/ismej.2009.143
46
Kanehisa M. Sato Y. (2020). KEGG Mapper for inferring cellular functions from protein sequences. Protein Sci.29, 28–35. doi: 10.1002/pro.3711
47
Kopylova E. Noe L. Touzet H. (2012). SortMeRNA: fast and accurate filtering of ribosomal RNAs in metatranscriptomic data. Bioinformatics28, 3211–3217. doi: 10.1093/bioinformatics/bts611
48
Kornder N. A. Cappelletto J. Mueller B. Zalm M. J. L. Martinez S. J. Vermeij M. J. A. et al . (2021). Implications of 2D vs 3D surveys to measure the abundance and composition of benthic coral reef communities. Coral Reefs40, 1137–1153. doi: 10.1007/s00338-021-02118-6
49
Koutsouveli V. Manousaki T. Riesgo A. Lagnel J. Kollias S. Tsigenopoulos C. S. et al . (2020). Gearing up for warmer times: Transcriptomic response of Spongia officinalis to elevated temperatures reveals recruited mechanisms and potential for resilience. Front. Mar. Sci.6, 786. doi: 10.3389/fmars.2019.00786
50
Kulas D. T. Zhang W. R. Goldstein B. J. Furlanetto R. W. Mooney R. A. (1995). Insulin receptor signaling is augmented by antisense inhibition of the protein tyrosine phosphatase LAR. J. Biol. Chem.270, 2435–2438. doi: 10.1074/jbc.270.6.2435
51
Langmead B. Salzberg S. L. (2012). Fast gapped-read alignment with Bowtie 2. Nat. Methods9, 357–359. doi: 10.1038/nmeth.1923
52
Lee S. Fuhrman J. A. (1987). Relationships between biovolume and biomass of naturally derived marine bacterioplankton. Appl. Environ. Microbiol.53, 1298–1303. doi: 10.1128/aem.53.6.1298-1303.1987
53
Lee O. O. Wang Y. Yang J. Lafi F. F. Al-Suwailem A. Qian P. (2010). Pyrosequencing reveals highly diverse and species-specific microbial communities in sponges from the Red Sea. ISME J.5, 650–664. doi: 10.1038/ismej.2010.165
54
Lesser M. P. Mueller B. Pankey M. S. Macartney K. J. Slattery M. Goeij J. M. (2019). Depth-dependent detritus production in the sponge, Halisarca caerulea. Limnol Oceanogr65, 1200–1216. doi: 10.1002/lno.11384
55
Letourneau M. L. Hopkinson B. M. Fitt W. K. Medeiros P. M. (2020). Molecular composition and biodegradation of loggerhead sponge Spheciospongia vesparium exhalent dissolved organic matter. Mar. Environ. Res.162, 105130. doi: 10.1016/j.marenvres.2020.105130
56
Li L. Deng B. Xing G. Teng Y. Tian C. Cheng X. et al . (2007). PACT is a negative regulator of p53 and essential for cell growth and embryonic development. Proc. Natl. Acad. Sci. U.S.A.104, 7951–7956. doi: 10.1073/pnas.0701916104
57
Li B. Dewey C. N. (2011). RSEM: accurate transcript quantification from RNA-Seq data with or without a reference genome. BMC Bioinf.12, 323. doi: 10.1186/1471-2105-12-323
58
Luong A. Hannah V. C. Brown M. S. Goldstein J. L. (2000). Molecular characterization of human acetyl-coA synthetase, an enzyme regulated by sterol regulatory element-binding proteins*. J. Biol. Chem.275, 26458–26466. doi: 10.1074/jbc.M004160200
59
Maldonado M. Ribes M. van Duyl F. C. (2012). “Nutrient fluxes through sponges: Biology, budgets, and ecological implications,” in Advances in sponge science: Physiology, chemical and microbial diversity, biotechnology. Eds. BecerroM. A.UrizM. J.MaldonadoM.TuronX. (London, UK: Academic Press), 113–182.
60
Marie D. Partensky F. Jacquet S. Vaulot D. (1997). Enumeration and cell cycle analysis of natural populations of marine picoplankton by flow cytometry using the nucleic acid stain SYBR Green I. Appl. Environ. Microbiol.63, 186–193. doi: 10.1128/aem.63.1.186-193.1997
61
McManus J. W. Polsenberg J. F. (2004). Coral–algal phase shifts on coral reefs: Ecological and environmental aspects. Prog. Oceanogr60, 263–279. doi: 10.1016/j.pocean.2004.02.014
62
Moeller F. U. Webster N. S. Herbold C. W. Behnam F. Domman D. Albertsen M. et al . (2019). Characterization of a thaumarchaeal symbiont that drives incomplete nitrification in the tropical sponge Ianthella basta. Environ. Microbiol.21, 3831–3854. doi: 10.1111/1462-2920.14732
63
Moitinho-Silva L. Bayer K. Cannistraci C. V. Giles E. C. Ryu T. Seridi L. et al . (2014). Specificity and transcriptional activity of microbiota associated with low and high microbial abundance sponges from the Red Sea. Mol. Ecol.23, 1348–1363. doi: 10.1111/mec.12365
64
Mueller B. Brocke H. J. Rohwer F. L. Dittmar T. Huisman J. Vermeij M. J. A. et al . (2022). Nocturnal dissolved organic matter release by turf algae and its role in the microbialization of reefs. Funct. Ecol.36, 2104–2118. doi: 10.1111/1365-2435.14101
65
Mueller B. de Goeij J. M. Vermeij M. J. A. Mulders Y. van der Ent E. Ribes M. et al . (2014b). Natural diet of coral-excavating sponges consists mainly of dissolved organic carbon (DOC). PloS One9, e90152. doi: 10.1371/journal.pone.0090152
66
Mueller B. van der Zande R. M. van Leent P. J. M. Meesters E. H. Vermeij M. van Duyl F. C. (2014a). Effect of light availability on dissolved organic carbon release by Caribbean reef algae and corals. Bull. Mar. Sci.90, 875–893. doi: 10.5343/bms.2013.1062
67
Mumby P. Steneck R. (2008). Coral reef management and conservation in light of rapidly evolving ecological paradigms. Trends Ecol. Evol.23, 555–563. doi: 10.1016/j.tree.2008.06.011
68
Nawa M. Kanekura K. Hashimoto Y. Aiso S. Matsuoka M. (2008). A novel Akt/PKB-interacting protein promotes cell adhesion and inhibits familial amyotrophic lateral sclerosis-linked mutant SOD1-induced neuronal death via inhibition of PP2A-mediated dephosphorylation of Akt/PKB. Cell Signal20, 493–505. doi: 10.1016/j.cellsig.2007.11.004
69
Nelson C. E. Goldberg S. J. Wegley Kelly L. Haas A. F. Smith J. E. Rohwer F. et al . (2013). Coral and macroalgal exudates vary in neutral sugar composition and differentially enrich reef bacterioplankton lineages. ISME J.7, 962. doi: 10.1038/ismej.2012.161
70
Nishikura K. (2010). Functions and regulation of RNA editing by ADAR deaminases. Annu. Rev. Biochem.79, 321–349. doi: 10.1146/annurev-biochem-060208-105251
71
Nishimura O. Hara Y. Kuraku S. (2017). gVolante for standardizing completeness assessment of genome and transcriptome assemblies. Bioinformatics33, 3635–3637. doi: 10.1093/bioinformatics/btx445
72
Olinger L. K. Strangman W. K. McMurray S. E. Pawlik J. R. (2021). Sponges with microbial symbionts transform dissolved organic matter and take up organohalides. Front. Mar. Sci.8, 548. doi: 10.3389/fmars.2021.665789
73
Olson J. B. Gao X. (2013). Characterizing the bacterial associates of three Caribbean sponges along a gradient from shallow to mesophotic depths. FEMS Microbiol. Ecol.85, 74–84. doi: 10.1111/1574-6941.12099
74
Philipp E. Fabricius K. (2003). Photophysiological stress in scleractinian corals in response to short-term sedimentation. J. Exp. Mar. Biol. Ecol.287, 57–78. doi: 10.1016/S0022-0981(02)00495-1
75
Pita L. Hoeppner M. P. Ribes M. Hentschel U. (2018b). Differential expression of immune receptors in two marine sponges upon exposure to microbial-associated molecular patterns. Sci. Rep.8, 16081. doi: 10.1038/s41598-018-34330-w
76
Pita L. Rix L. Slaby B. M. Franke A. Hentschel U. (2018a). The sponge holobiont in a changing ocean: from microbes to ecosystems. Microbiome6, 46. doi: 10.1186/s40168-018-0428-1
77
Reveillaud J. Maignien L. Eren A. M. Huber J. A. Apprill A. Sogin M. L. et al . (2014). Host-specificity among abundant and rare taxa in the sponge microbiome. ISME J.8, 1198–1209. doi: 10.1038/ismej.2013.227
78
Reverter M. Helber S. B. Rohde S. de Goeij J. M. Schupp P. J. (2021). Coral reef benthic community changes in the Anthropocene: Biogeographic heterogeneity, overlooked configurations, and methodology. Glob Change Biol.00, 1–16. doi: 10.1111/gcb.16034
79
Rix L. de Goeij J. M. van Oevelen D. Struck U. Al-Horani F. A. Wild C. et al . (2017). Differential recycling of coral and algal dissolved organic matter via the sponge loop. Funct. Ecol.31, 778–789. doi: 10.1111/1365-2435.12758
80
Rix L. Ribes M. Coma R. Jahn M. T. de Goeij J. M. van Oevelen D. et al (2020). Heterotrophy in the earliest gut: a single-cell view of heterotrophic carbon and nitrogen assimilation in sponge-microbe symbioses. ISME J.14, 2554–2567. doi: 10.1038/s41396-020-0706-3
81
Robinson M. D. McCarthy D. J. Smyth G. K. (2010). edgeR: a Bioconductor package for differential expression analysis of digital gene expression data. Bioinformatics26, 139–140. doi: 10.1093/bioinformatics/btp616
82
Sabarathnam B. Manilal A. Sujith S. Kiran G. S. Selvin J. Thomas A. et al . (2010). Role of sponge associated actinomycetes in the marine phosphorous biogeochemical cycles. Am. Eurasian J. Agri Environ. Sci.8, 253–256.
83
Shapiro L. Weis W. I. (2009). Structure and biochemistry of cadherins and catenins. Cold Spring Harb. Perspect. Biol.1, a003053. doi: 10.1101/cshperspect.a003053
84
Shi W. Wang F. Gao M. Yang Y. Du Z. Wang C. et al . (2015). ZDHHC17 promotes axon outgrowth by regulating TrkA–tubulin complex formation. Mol. Cell Neurosci.68, 194–202. doi: 10.1016/j.mcn.2015.07.005
85
Siegl A. Kamke J. Hochmuth T. Piel J. Richter M. Liang C. et al . (2011). Single-cell genomics reveals the lifestyle of Poribacteria, a candidate phylum symbiotically associated with marine sponges. ISME J.5, 61–70. doi: 10.1038/ismej.2010.95
86
Silva L. Calleja M. L. Ivetic S. Huete-Stauffer T. Roth F. Carvalho S. et al . (2021). Heterotrophic bacterioplankton responses in coral- and algae-dominated Red Sea reefs show they might benefit from future regime shift. Sci. Total Environ.751, 141628. doi: 10.1016/j.scitotenv.2020.141628
87
Simao F. A. Waterhouse R. M. Ioannidis P. Kriventseva E. V. Zdobnov E. M. (2015). BUSCO: assessing genome assembly and annotation completeness with single-copy orthologs. Bioinformatics31, 3210–3212. doi: 10.1093/bioinformatics/btv351
88
Souza D. T. Genuário D. Silva F. S. P. Pansa C. C. Kavamura V. N. Moraes F. C. et al . (2017). Analysis of bacterial composition in marine sponges reveals the influence of host phylogeny and environment. FEMS Microbiol. Ecol.93, fiw204. doi: 10.1093/femsec/fiw204
89
Sowerby J. M. Thomas D. C. Clare S. Espeli M. Guerrero J. A. Hoenderdos K. et al . (2017). NBEAL2 is required for neutrophil and NK cell function and pathogen defense. J. Clin. Invest.127, 3521–3526. doi: 10.1172/JCI91684
90
Stachowicz J. J. (2001). Mutualism, facilitation, and the structure of ecological communities. Bioscience51, 235–246. doi: 10.1641/0006-3568(2001)051[0235:MFATSO]2.0.CO;2
91
Tamura M. Gu J. Matsumoto K. Aota S. Parsons R. Yamada K. M. (1998). Inhibition of cell migration, spreading, and focal adhesions by tumor suppressor PTEN. Science280, 1614–1617. doi: 10.1126/science.280.5369.1614
92
Taylor M. W. Radax R. Steger D. Wagner M. (2007). Sponge-associated microorganisms: evolution, ecology, and biotechnological potential. Microbiol. Mol. Biol. Rev.71, 295–347. doi: 10.1128/MMBR.00040-06
93
Thomas T. Rusch D. DeMaere M. Z. Yung P. Y. Lewis M. Halpern A. et al . (2010). Functional genomic signatures of sponge bacteria reveal unique and shared features of symbiosis. ISME J.4, 1557–1567. doi: 10.1038/ismej.2010.74
94
Verity P. G. Robertson C. Y. Tronzo C. R. Andrews M. G. Nelson J. R. Sieracki M. E. (1992). Relationships between cell volume and the carbon and nitrogen content of marine photosynthetic nanoplankton. Limnol Oceanogr37, 1434–1446. doi: 10.4319/lo.1992.37.7.1434
95
Vogel B. E. Muriel J. M. Dong C. Xu X. (2006). Hemicentins: what have we learned from worms? Cell Res.16, 872–878. doi: 10.1038/sj.cr.7310100
96
Webster N. S. Taylor M. W. (2012). Marine sponges and their microbial symbionts: love and other relationships. Environ. Microbiol.14, 335–346. doi: 10.1111/j.1462-2920.2011.02460.x
97
Wegley Kelly L. Nelson C. E. Petras D. Koester I. Quinlan Z. A. Arts M. G. I. et al . (2022). Distinguishing the molecular diversity, nutrient content, and energetic potential of exometabolomes produced by macroalgae and reef-building corals. Proc. Natl. Acad. Sci. U.S.A.119, e2110283119. doi: 10.1073/pnas.2110283119
98
Wild C. Niggl W. Naumann M. S. Haas A. F. (2010). Organic matter release by Red Sea coral reef organisms–potential effects on microbial activity and in situ O2 availability. Mar. Ecol. Prog. Ser.411, 61–71. doi: 10.3354/meps08653
99
Wu Y. Franzenburg S. Ribes M. Pita L. (2022). Wounding response in Porifera (sponges) activates ancestral signaling cascades involved in animal healing, regeneration, and cancer. Sci. Rep.12, 1307. doi: 10.1038/s41598-022-05230-x
100
Yoshii K. Hosomi K. Sawane K. Kunisawa J. (2019). Metabolism of dietary and microbial vitamin B family in the regulation of host immunity. Front. Nutr.6, 48. doi: 10.3389/fnut.2019.00048
101
Zhang S. Song W. Nothias L. F. Couvillion S. P. Webster N. Thomas T. (2022). Comparative metabolomic analysis reveals shared and unique chemical interactions in sponge holobionts. Microbiome10, 22–021. doi: 10.1186/s40168-021-01220-9
102
Zhao J. Zhong C. J. (2009). A review on research progress of transketolase. Neurosci. Bull.25, 94–99. doi: 10.1007/s12264-009-1113-y
103
Zheng C. Quan R. Xia E. Bhandari A. Zhang X. (2019). Original tumour suppressor gene polycystic kidney and hepatic disease 1-like 1 is associated with thyroid cancer cell progression. Oncol. Lett.18, 3227–3235. doi: 10.3892/ol.2019.10632
Summary
Keywords
sponge holobionts, coral reefs, coral-to-macroalgae shift, transcriptomics, prokaryotic symbiont community composition, physiology
Citation
Campana S, Arts MGI, Díez-Vives C, Mueller B, Bang C, Riesgo A, Haas AF, Muyzer G and de Goeij JM (2024) Sponges on shifting reefs: holobionts show similar molecular and physiological responses to coral versus macroalgal food. Front. Mar. Sci. 11:1298922. doi: 10.3389/fmars.2024.1298922
Received
22 September 2023
Accepted
22 January 2024
Published
15 February 2024
Volume
11 - 2024
Edited by
Zhiyong Li, Shanghai Jiao Tong University, China
Reviewed by
Isabelle Domart-Coulon, Muséum National d’Histoire Naturelle, France
Marta Ribes, Spanish National Research Council (CSIC), Spain
Updates
Copyright
© 2024 Campana, Arts, Díez-Vives, Mueller, Bang, Riesgo, Haas, Muyzer and de Goeij.
This is an open-access article distributed under the terms of the Creative Commons Attribution License (CC BY). The use, distribution or reproduction in other forums is permitted, provided the original author(s) and the copyright owner(s) are credited and that the original publication in this journal is cited, in accordance with accepted academic practice. No use, distribution or reproduction is permitted which does not comply with these terms.
*Correspondence: Jasper M. de Goeij, j.m.degoeij@uva.nl
†ORCID: Jasper M. de Goeij, orcid.org/0000-0002-3411-3084
Disclaimer
All claims expressed in this article are solely those of the authors and do not necessarily represent those of their affiliated organizations, or those of the publisher, the editors and the reviewers. Any product that may be evaluated in this article or claim that may be made by its manufacturer is not guaranteed or endorsed by the publisher.