 Zhiyi Chen
 Hongyuan Zheng
 Yuan Gao2
 Guangfu Luo
- 1College of Civil Engineering and Architecture, Zhejiang University of Water Resources and Electric Power, Zhejiang, Hangzhou, China
- 2Ministry of Natural Resources Key Laboratory for Polar Science, Polar Research Institute of China, Shanghai, China
- 3Ocean Institute, Northwestern Polytechnical University, Jiangsu, Taicang, China
- 4College of Environmental Science and Engineering, Tongji University, Shanghai, China
As predators of bacteria and viruses and as food sources for microzooplankton, heterotrophic flagellates (HFs) play an important role in the marine micro-food web. Based on the global climate change’s impact on marine ecosystems, particularly sea ice melting, we analyzed the community composition and diversity of heterotrophic flagellates, focusing on the Antarctic Cosmonaut Sea. During the 36th China Antarctic research expedition (2019-2020), we collected seawater samples, subsequently analyzing HFs through IlluminaMiSeq2000 sequencing to assess community composition and diversity. Notable variations in HFs abundance were observed between the western and eastern sectors of the Cosmonaut Sea, with a distinct concentration at a 100-meter water depth. Different zones exhibited diverse indicators and dominants taxa influenced by local ocean currents. Both the northern Antarctic Peninsula and the western Cosmonaut Sea, where the Weddell Eddy and Antarctic Land Slope Current intersect, showcased marine stramenopiles as dominant HFs species. Our findings offer insights into dominant taxa, spatial distribution patterns among heterotrophic flagellates, correlations between taxa distribution and environmental factors, and the exploration of potential indicator taxa.
1 Introduction
Global warming and sea ice melt alter polar habitats and marine protozoan communities. It is predicted that 79% of endemic species in Antarctic waters will face a reduction in suitable temperature habitat in this century because of global climate change (Griffiths et al., 2017), including Heterotrophic flagellates (HFs). HFs are widely distributed in the global oceans, occurring in all the world’s major seas, including the Arctic Ocean and the Southern Ocean. They have different taxonomic compositions and characteristics in different geographic regions (Sohrin et al., 2010). They are central in marine food webs, controlling phytoplankton biomass and consuming most bacterial biomass (del Campo and Ruiz-Trillo, 2013). Moreover, their feeding rate directly impacts the ecosystem’s material cycling and nutrient regeneration, which can significantly affect the plankton community structure (Seenivasan et al., 2013).
Although all levels of the marine microbial food web may be affected by climate change (Fortier et al., 2006; Falk-Petersen et al., 2007; Laidre et al., 2008), microphytoplankton are particularly sensitive to environmental change (Li et al., 2009). The biomass of HFs is concentrated in this particle size range (Rodriguez-Martinez et al., 2013). Heterotrophic flagellates can control the phytoplankton biomass (Verity et al., 2002) and target bacteria (Christaki et al., 2021), viruses, and colloids for feeding (Arndt et al., 2000; Sherr and Sherr, 2002). However, the complexity and importance of HFs taxa have not received sufficient attention in the literature (Monier et al., 2013; Lovejoy, 2014). Phytoplankton are important food sources for some HF taxa. The miniaturization of phytoplankton has, in some cases, been found to have a more significant impact on microscopic unicellular predators (like flagellates) than other large predators in the micro food web (Li et al., 2009; Worden et al., 2015). This implies that the miniaturization shift of phytoplankton taxa could directly affect the community structure and biodiversity of HFs in the context of climate change. Numerous studies have reported that the global distribution of HFs is environmentally driven and is not subject to any dispersal constraints (neither distance nor isolation) (Azovsky et al., 2020), with different community structures in different geographic regions (Sohrin et al., 2010). Although there is high regional diversity, the low global diversity and regional endemism need further investigation.
There has been limited research on the spatial distribution and diversity of HFs in polar seas and ice zones. Nevertheless, in recent years, the Cosmonaut Sea has received much attention. It is in the western part of the Antarctic Entebbe Land (Hunt et al., 2007), with a longitude range of 30°E to 60°E. It represents an area of significant variability in the annual sea ice extent (Comiso and Gordon, 1987). There are relatively substantial regional differences in the Antarctic Sea variability between sectors under the influence of climate change (Convey and Peck, 2019), with regional ablation and sea ice in the different seas. Large fluctuations in the sea ice distribution in the Cosmonaut Sea are also present in winter and summer. As a region in the Southern Ocean with less research information, the current state and future ecosystem trends in the Cosmonaut Sea also deserve further investigation. Previous studies have not focused on HFs or microscopic protists that exist as predators in micro food webs, so we attempted to explore this.
In this study, we surveyed the abundance and biodiversity of HFs taxa in the Antarctic Cosmonaut Sea using samples from China’s 36th Antarctic Scientific Expedition. After sequencing the community diversity of the microplankton using Illumina, ten taxa were selected for analysis. This study will address the dominant taxa and differences in the spatial distribution of heterotrophic flagellates in the Antarctic Cosmonaut Sea seawater. In contrast, the correlation between taxa distribution and environmental factors will be explored, and the possibility of some taxa as indicators will be further explored. The differences in the distribution of the dominant HFs taxa in the sea were also investigated to provide a basis for further exploration of the possible trends in the community structure of the HFs under the influence of climate change.
2 Materials and methods
2.1 Sample collection
During China’s 36th Antarctic Scientific Expedition (CHINARE), from December 6, 2019, to January 6, 2020, there were a total of 56 stations in nine sections of the Cosmonaut Sea (62–70°S, 35–78°E; Figure 1), and 24 Niskin bottles Sea-Bird Electronics 911 plus CTD (Bellevue, USA) was used to collect the seawater samples. Each station collected the samples at different water depths, from the surface to the seabed, and simultaneously observed various physical and chemical parameters, such as the seawater temperature, salinity, and nutrient salts. Samples of the biological community composition and biodiversity were also obtained.
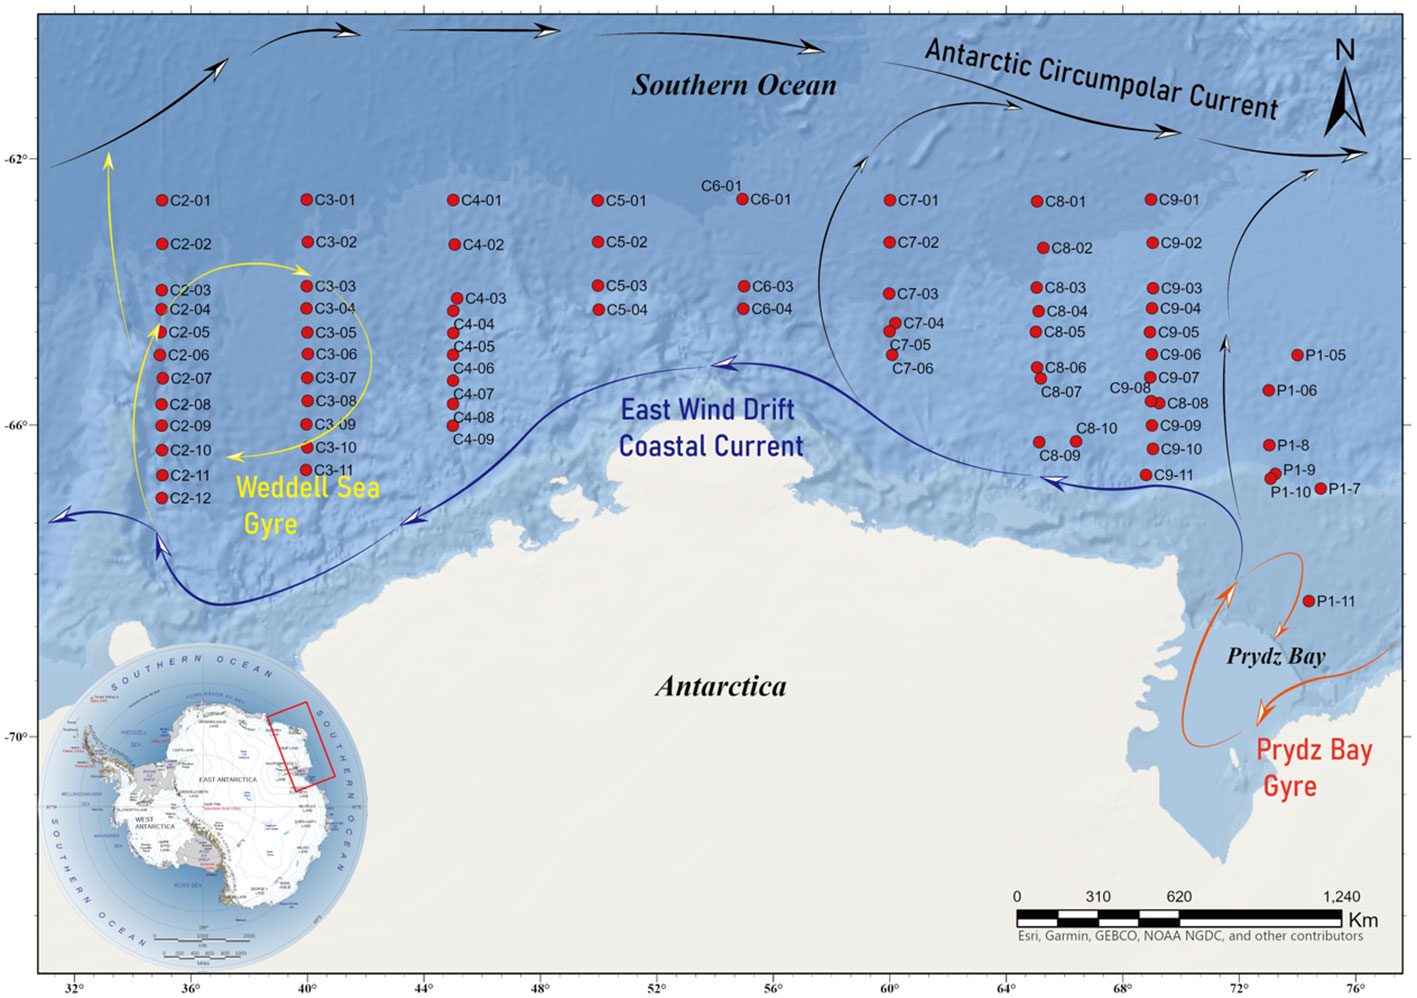
Figure 1 Location of the sampling stations and currents.
The biodiversity samples were taken back to the laboratory to filter out the microbial film samples using 0.2 μm polycarbonate membranes (all membranes are from Whatman, UK, 47 mm in diameter), stored at -80 °C, and transported to the laboratory to determine the microbial diversity. For the property analysis, after the second filtration, the water sample was retained for nutrient analysis. During the sampling process, a total of 11 variables were measured to explain the variation in the abundance of the HFs, including the water depth, temperature, salinity, total Chlorophyll a (Chl a), dissolved oxygen (DO), ammonium, phosphate, silicate, nitrate, nitrite, and total nitrogen. The DO, ammonium, phosphate, silicate, nitrate, nitrite, and total nitrogen were analyzed using a four-channel continuous flow Technicon AA3 Auto-Analyzer (Luebbe, 1997). The Chl a was measured with a 10AU field fluorometer (Turner Designs, Sunnyvale, CA, USA) after filtering part of the water samples with a GF/F glass fiber filter membrane. The abundance of the bacteria and eukaryotic plankton was determined by flow cytometry using a BD FACSCalibur™ flow cytometer for detection.
2.2 PCR and Illumina MiSeq sequencing
The seawater samples from the Cosmonaut Sea were sequenced based on the eukaryotic plankton diversity lineage using the Illumina MiSeq ultra-high-throughput sequencing platform. The total genomic DNA samples were extracted using the OMEGA Soil DNA Kit (M5635-02; Omega Bio-Tek, Norcross, GA, USA). The quantity and quality of the extracted DNA were measured using a NanoDrop NC2000 spectrophotometer (Thermo Fisher Scientific, Waltham, MA, USA) and agarose gel electrophoresis, respectively. Then, polymerase chain reaction amplification of the eukaryotic 18S ribosomal RNA (rRNA) gene V3–V4 region was performed using the forward primer 547F (5′-CCAGCASCYGCGGTAATTCC-3′) and the reverse primer V4R (5′-ACTTTCGTTCTTGATYRA-3′). After the quantification step, the amplicons were pooled in equal amounts, and pair-end 2 × 250 bp sequencing was performed using the Illumina MiSeq platform with the MiSeq Reagent Kit v3 at Shanghai Personal Biotechnology Co. Ltd (Shanghai, China). The detailed conditions and laboratory analysis are specified in a previous study (Chen et al., 2021). The classify-sklearn naïve Bayes taxonomy classification probe (Bokulich et al., 2018) was used to classify and assign the non-single amplicon sequence variants (ASVs) and label the original data according to the UNITE Release 8.0 (fungal) database (Koljalg et al., 2013). Specific taxonomic groups were screened out, with 10 main target analysis taxa.
2.3 Diversity and community structure analysis
The samples were subjected to ultra-high throughput sequencing and database matching for classification and name annotation, the HFs taxa were screened based on existing studies, and the screened data were used for biodiversity calculations. The samples from nine sections of the Cosmonaut Sea with a total of 56 stations were divided into zones according to the reported current distribution. Sections C2 and C3 were divided into zone A, section C4 into zone B, sections C5, C6, and C7 into zone C, section C8 into zone D, and sections C9 and P1 and station C8–08 into zone E. The analysis of the samples was conducted according to these five zones (Figure 1).
An alpha biodiversity analysis was performed using R (v4.1.3) (http://www.R-project.org/), and alpha diversity indices based on the ASV levels were calculated, including the Chao1 richness estimates, observed species, Shannon diversity index, Simpson index, and goods coverage (Table 1). The results of a Principal Coordinate Analysis (PCoA) of the HFs communities were generated using the vegan package and ggplot2 package. Then, ArcGIS pro 3.0 (Zheng et al., 2023) was used to generate the sampling station maps and bubble sector maps of the HFs community distribution at different water depths. The Ocean Data View software (Schlitzer, 2021) was used to generate the overall abundance and α-diversity index of the HFs for different water depths, the difference maps of each environmental factor in the different sections, and the bubble maps of the difference in abundance for each clade of MASTs at different water depths.
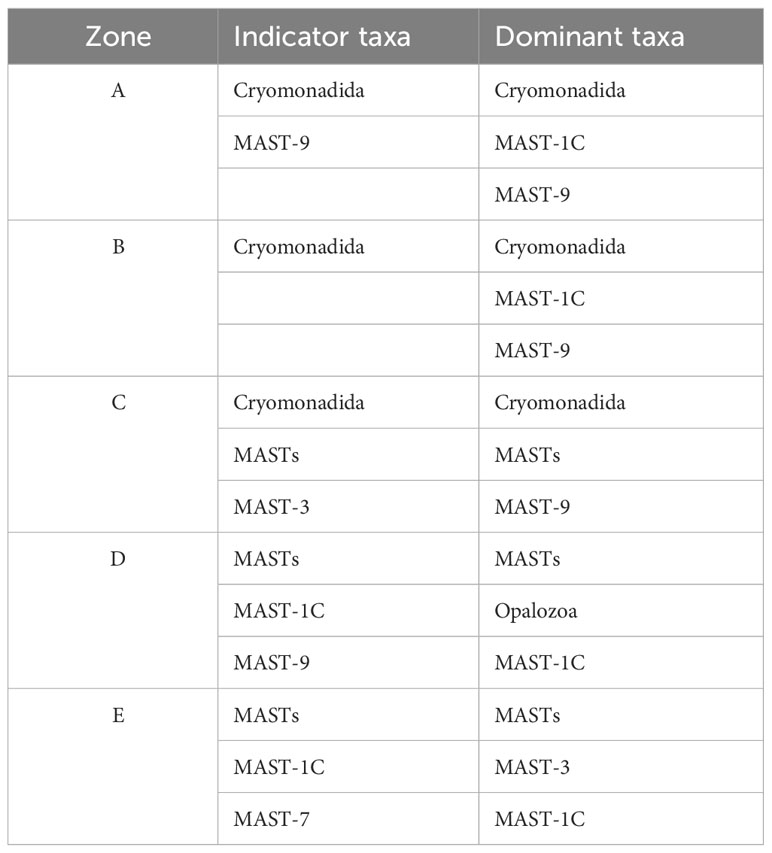
Table 1 Comparison of the main dominant and indicator taxa differences in the heterotrophic flagellates in the Cosmonaut Sea, Antarctic.
To explore the correlation between the environmental factors and HFs taxa, a redundancy analysis (RDA) was performed using CANOCO 5.2 software (Microcomputer Power, Ithaca, USA) to investigate the relationship between the differences in the HFs community structure and environmental variables across the samples and assess community variation (based on the relative abundance of all the operational taxonomic units/ASVs) and the environmental variables (temperature, salinity, nutrients, Chl a, eukaryotic plankton, and bacteria) at the sampling sites. A linear regression analysis was used to determine the relationship between the two variables. Pearson and Spearman correlations between the HFs taxa and environmental factors were visualized using the psych package in R (v4.1.3) and vegan. An indicator species analysis (Ind Val) was performed using the indicspecies package in the R (v4.1.3) software to identify indicator species in each study area (Dufrene and Legendre, 1997).
3 Results
3.1 Geographical distribution characteristics
Data on the temperature, salinity, Chl a, and various nutrients were obtained during the sampling process for the samples at different water depths. A total of 11 variables were examined to explain the differences in the HFs community structure and abundance. The longitudinal differences in the environmental factors were plotted for each section (Supplementary Figure S1).
The seawater temperature in the Cosmonaut Sea decreased and then increased with depth in the range of 0 to 200 m. At the same time, the water temperature below 200 m was relatively constant. The seawater salinity appeared to rise significantly with increasing depth, and the surface ocean salinity was lower when compared with the deeper water layer. The horizontal distribution trends of the DO and Chl a were similar, with relatively higher concentrations of DO and Chl a at the stations with higher latitudes. The concentration of DO was relatively high at the surface ocean, and at some stations, the DO peaked at a water depth of 25 m and gradually decreased with increasing water depth. However, there was a slight increase in DO concentration in the deep seawater samples at more than 300 m depth. The Chl a was basically concentrated within the upper 100 m, and the peak was concentrated at a depth of 25 m to 75 m. Comparatively, the Chl a concentration was higher in the mid-sea of the Cosmonaut Sea than in the other regions.
Most of the stations showed a trend of an increasing phosphate concentration with increasing water depth, and some of the stations reached a peak at around 200 m in depth. The silicate and phosphate concentrations were similar, with a clear trend of increasing concentration with increasing water depth, and the peak occurred in the deep layer below 1500 m. Nitrate concentrations were notably higher than those of nitrite and ammonium salts. At the majority of stations, nitrate levels exhibited a slight increase within the 100–200 m depth range, followed by a decrease as water depth increased. The highest concentrations of nitrite and ammonium were primarily found in the 0–100 m range. Specifically, the nitrite peak occurred at depths between 0–50 m, while the ammonium peak was more concentrated in the 50–100 m range. Both nitrite and ammonium demonstrated a gradual decline and eventually leveled off.
3.2 Alpha-biodiversity analysis of heterotrophic flagellates
A total of 642 species were screened from all the samples, with 95.6% of the samples with a good coverage of above 90% and 87.7% of the samples with a coverage above 97%. In terms of the overall abundance at each station (Figure 2), the abundance in areas A and B was significantly higher than that in the other seas, while the abundance of the HFs showed a trend of increasing and then decreasing from the surface ocean with the increase in the water depth. The HFs were mainly distributed within the top 100 m, and the peak abundance at most stations appeared at 25-75 m in depth. With the increase in the water depth, the abundance of the HFs in the near-bottom samples in zone E showed a significant increase. The high values of Shannon’s index and Simpson’s diversity index were concentrated in zone E. Most occurred in the water depth range of 200–2000 m, and the number of species observed in this area was also more than that in the other areas. Furthermore, the biodiversity indices in zones A and B were relatively low. However, the diversity of the HFs in the near-land stations in zone A was similar to that in zone E. Meanwhile, most of the high values of the ACE index and Chao1 index were found at stations in the P1 section, which is relatively close to the Antarctic continental region. This indicates that the HFs diversity and species distribution uniformity were higher in the eastern Cosmonaut Sea than in the western sea. The diversity of the HFs was higher in the near-land waters than in the distant waters. Overall, the overall abundance of the HFs was higher in the western Cosmonaut Sea, in the shallow layer starting from the surface ocean to 100 m in depth, than in the eastern sea, and they were rarer in the mid-sea.
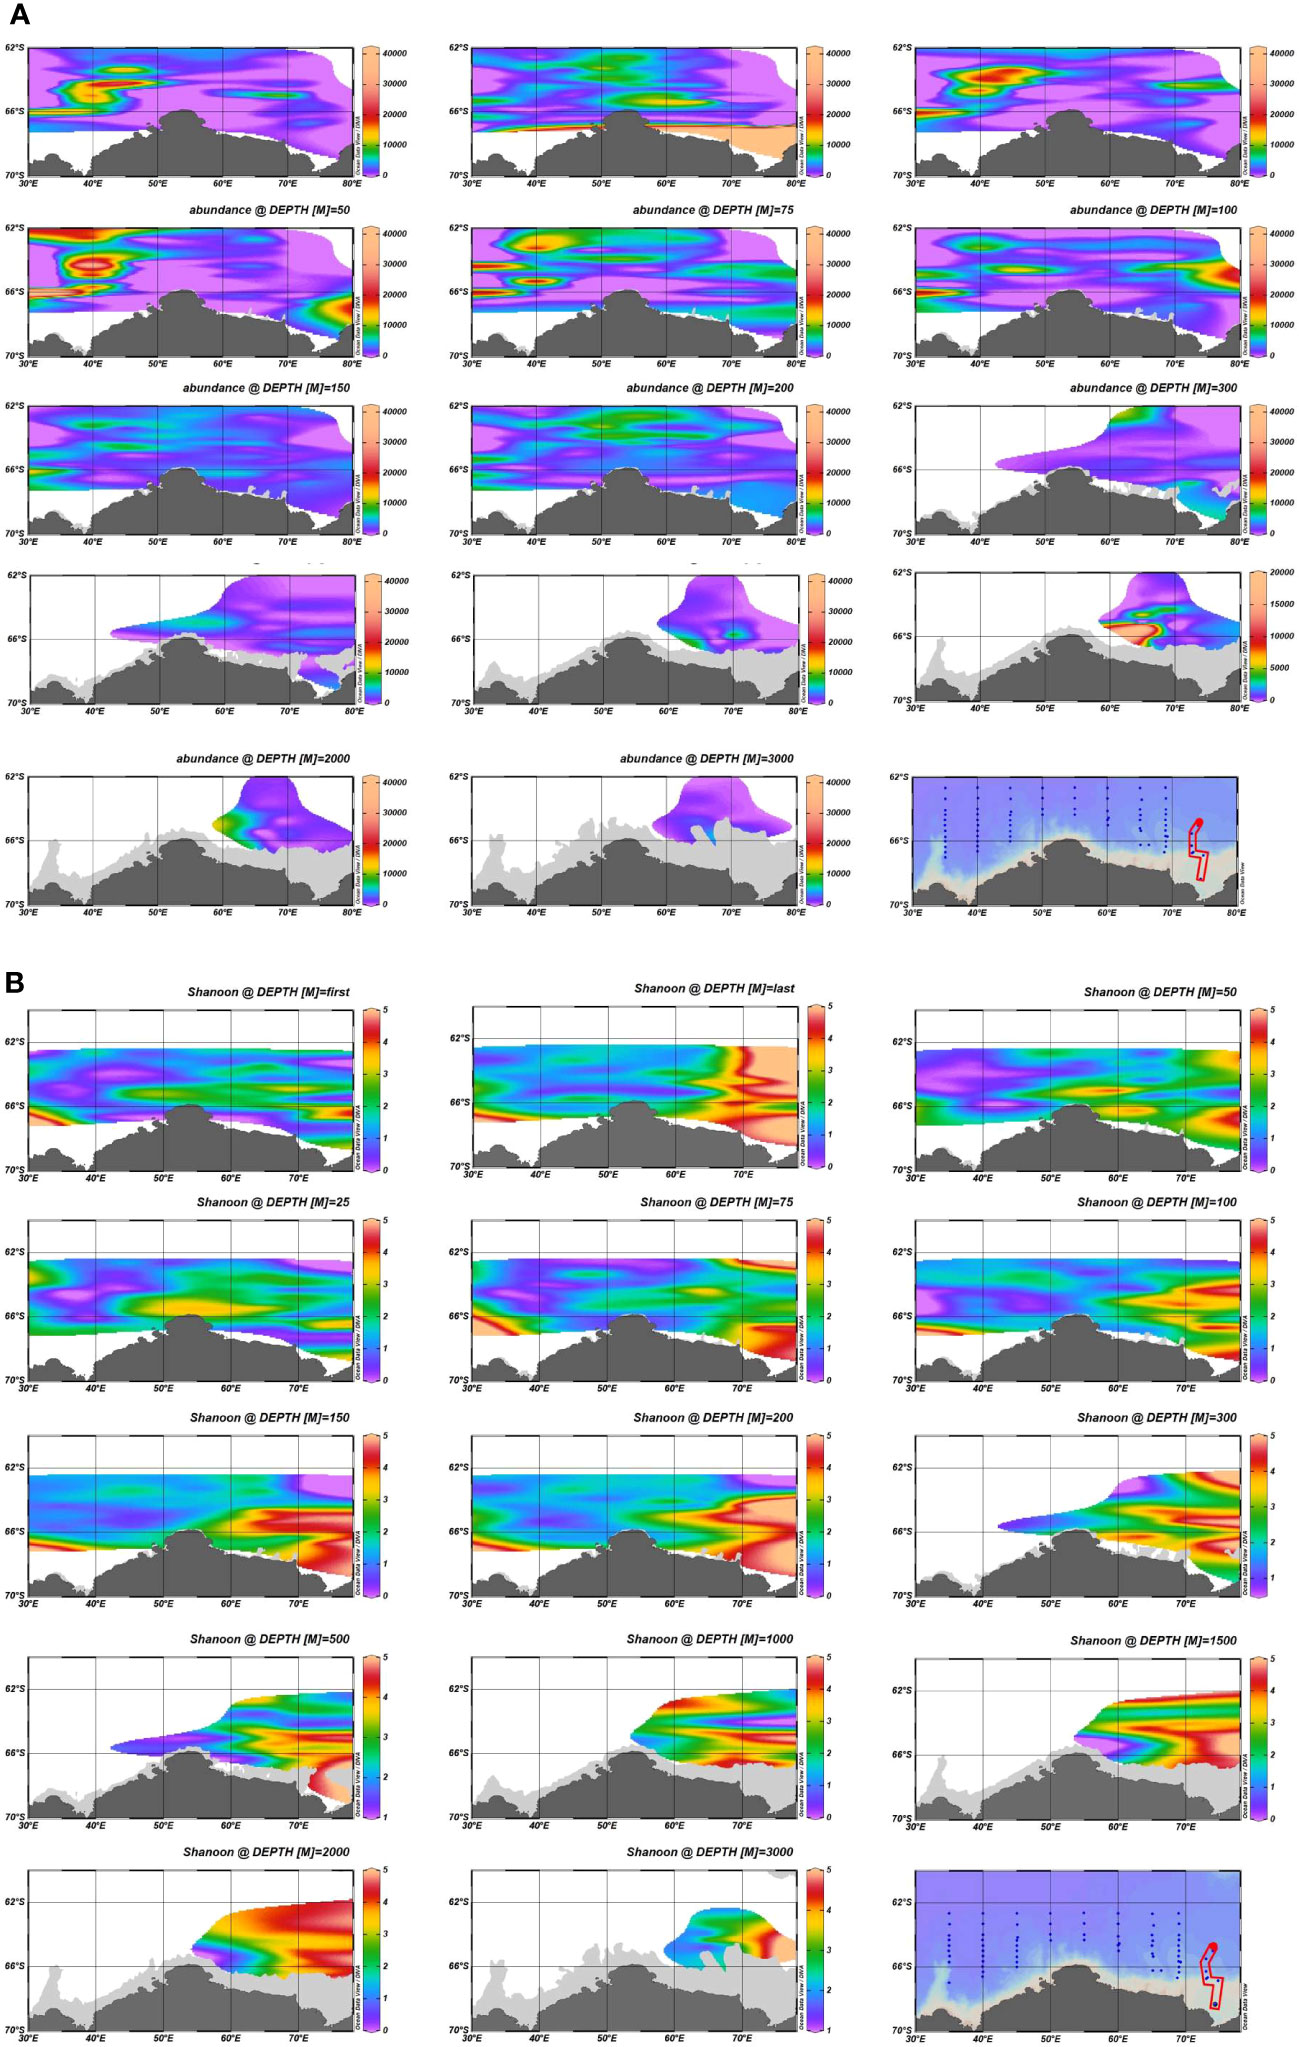
Figure 2 Comparison of the abundance and diversity indices of the ASVs based on the 18S ribosomal RNA (rRNA) gene library at different water depths: (A) difference plots of the overall abundance at different water depths; (B) difference plots of the α diversity-Shannon index at the different water depths.
The overall abundance, community structure composition, and dominant taxa of the HFs differed with depth. A principal coordinate analysis of all the samples (Figure 3) showed that the HFs community confidence ellipses at water depths of 0 to 50 m deviated significantly (p < 0.05) from the depths of 75 m and 100 m. The community confidence ellipses of the samples at water depths greater than 100 m had a large overlap. This indicates a significant similarity between the HFs communities in the water column at depths of 0–50 m, with depths of 75–100 m being the overlap region, and a large difference in the samples at depths greater than 100 m. There was also a significant similarity between the HFs communities at depths greater than 100 m.
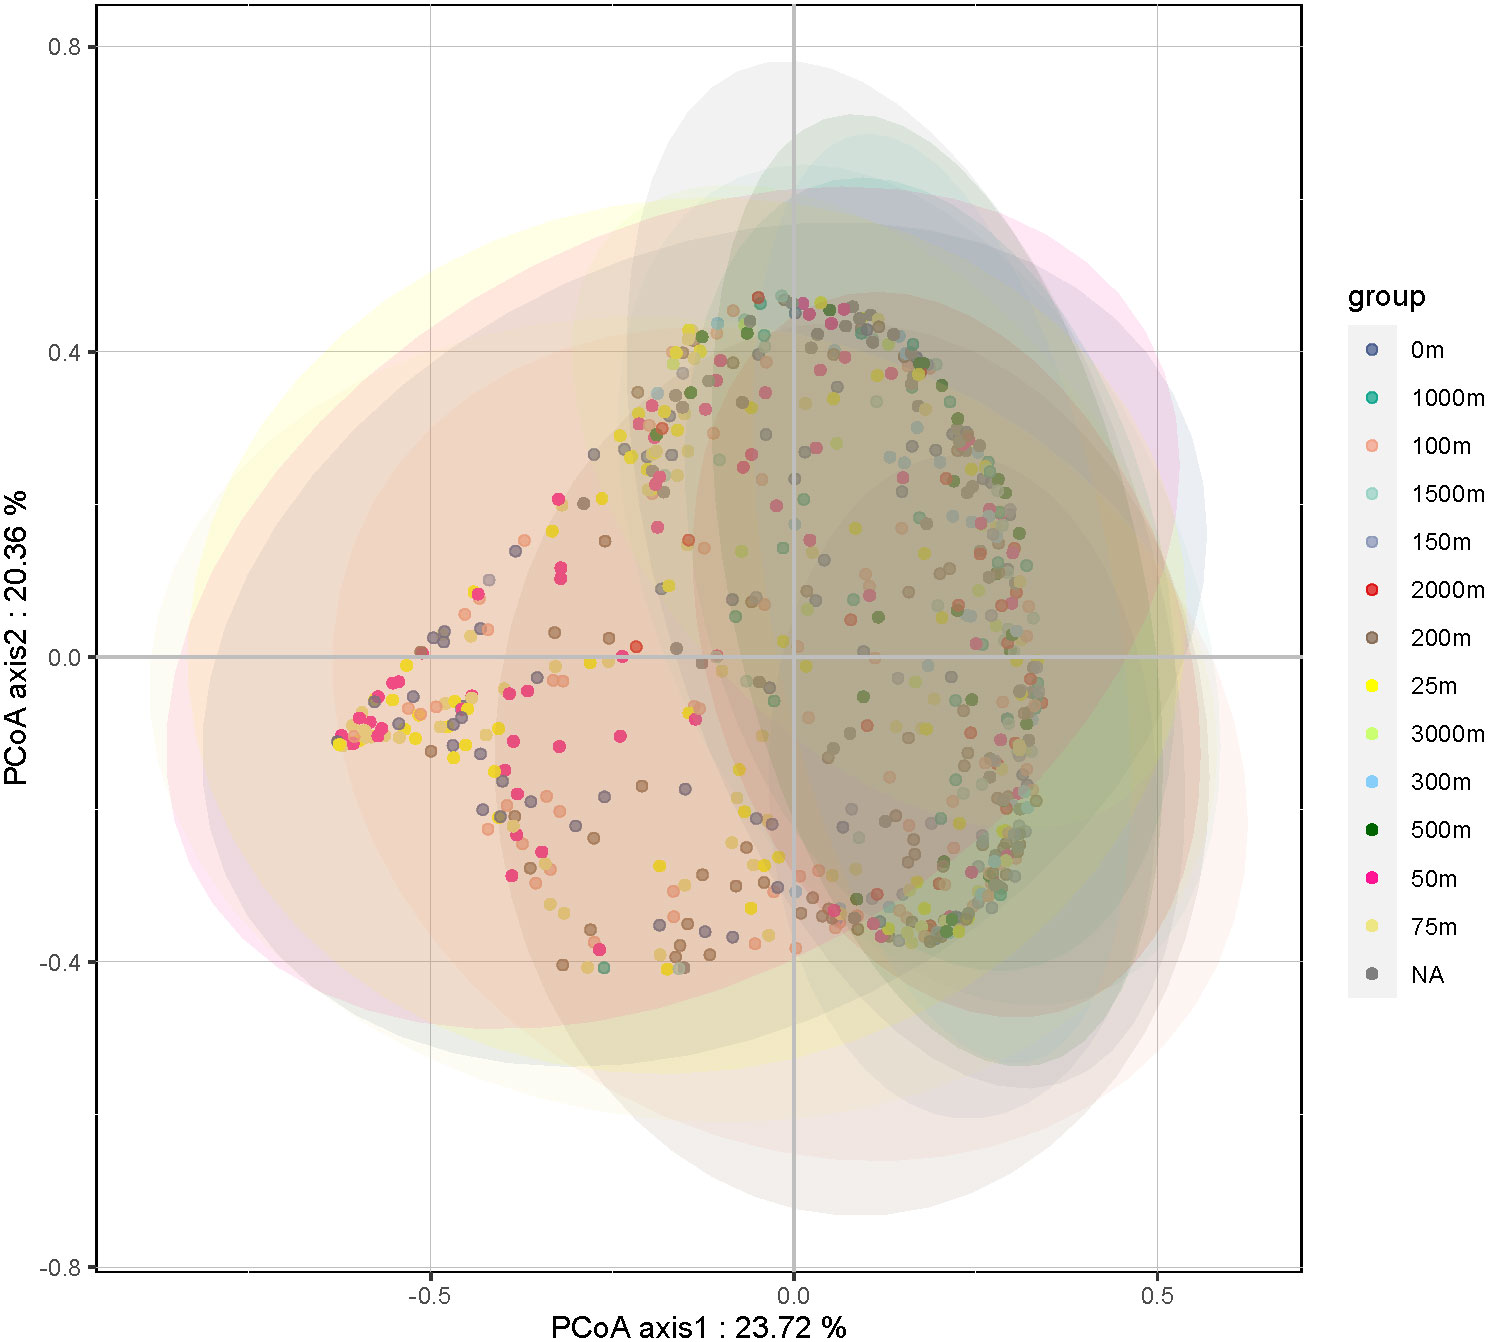
Figure 3 Results of the Principal Coordinate Analysis (PCoA) analysis of the heterotrophic flagellate communities in the samples at different water depths.
3.3 Taxonomy composition of heterotrophic flagellates
A total of 10 HFs taxa were screened in this study. The more common taxa, such as Cryomonadida, MASTs, and Picozoa, were distributed in all the sections and depths (Figure 4). Cryomonadida, Marine stramenopiles (MASTs), and Opalozoa were relatively more abundant overall, and Cryomonadida was detected in all the samples. The abundance of Cryonmonadida and the MASTs tended to decrease with increasing depth, while a slight increase was observed in the near-shelf samples. However, the abundance of Opalozoa was relatively low in the shallow layer (25–100 m). It was not even detected at some of the stations. At the same time, it was abundantly distributed in the deep layer and near the seafloor, with an overall trend of increasing with depth.
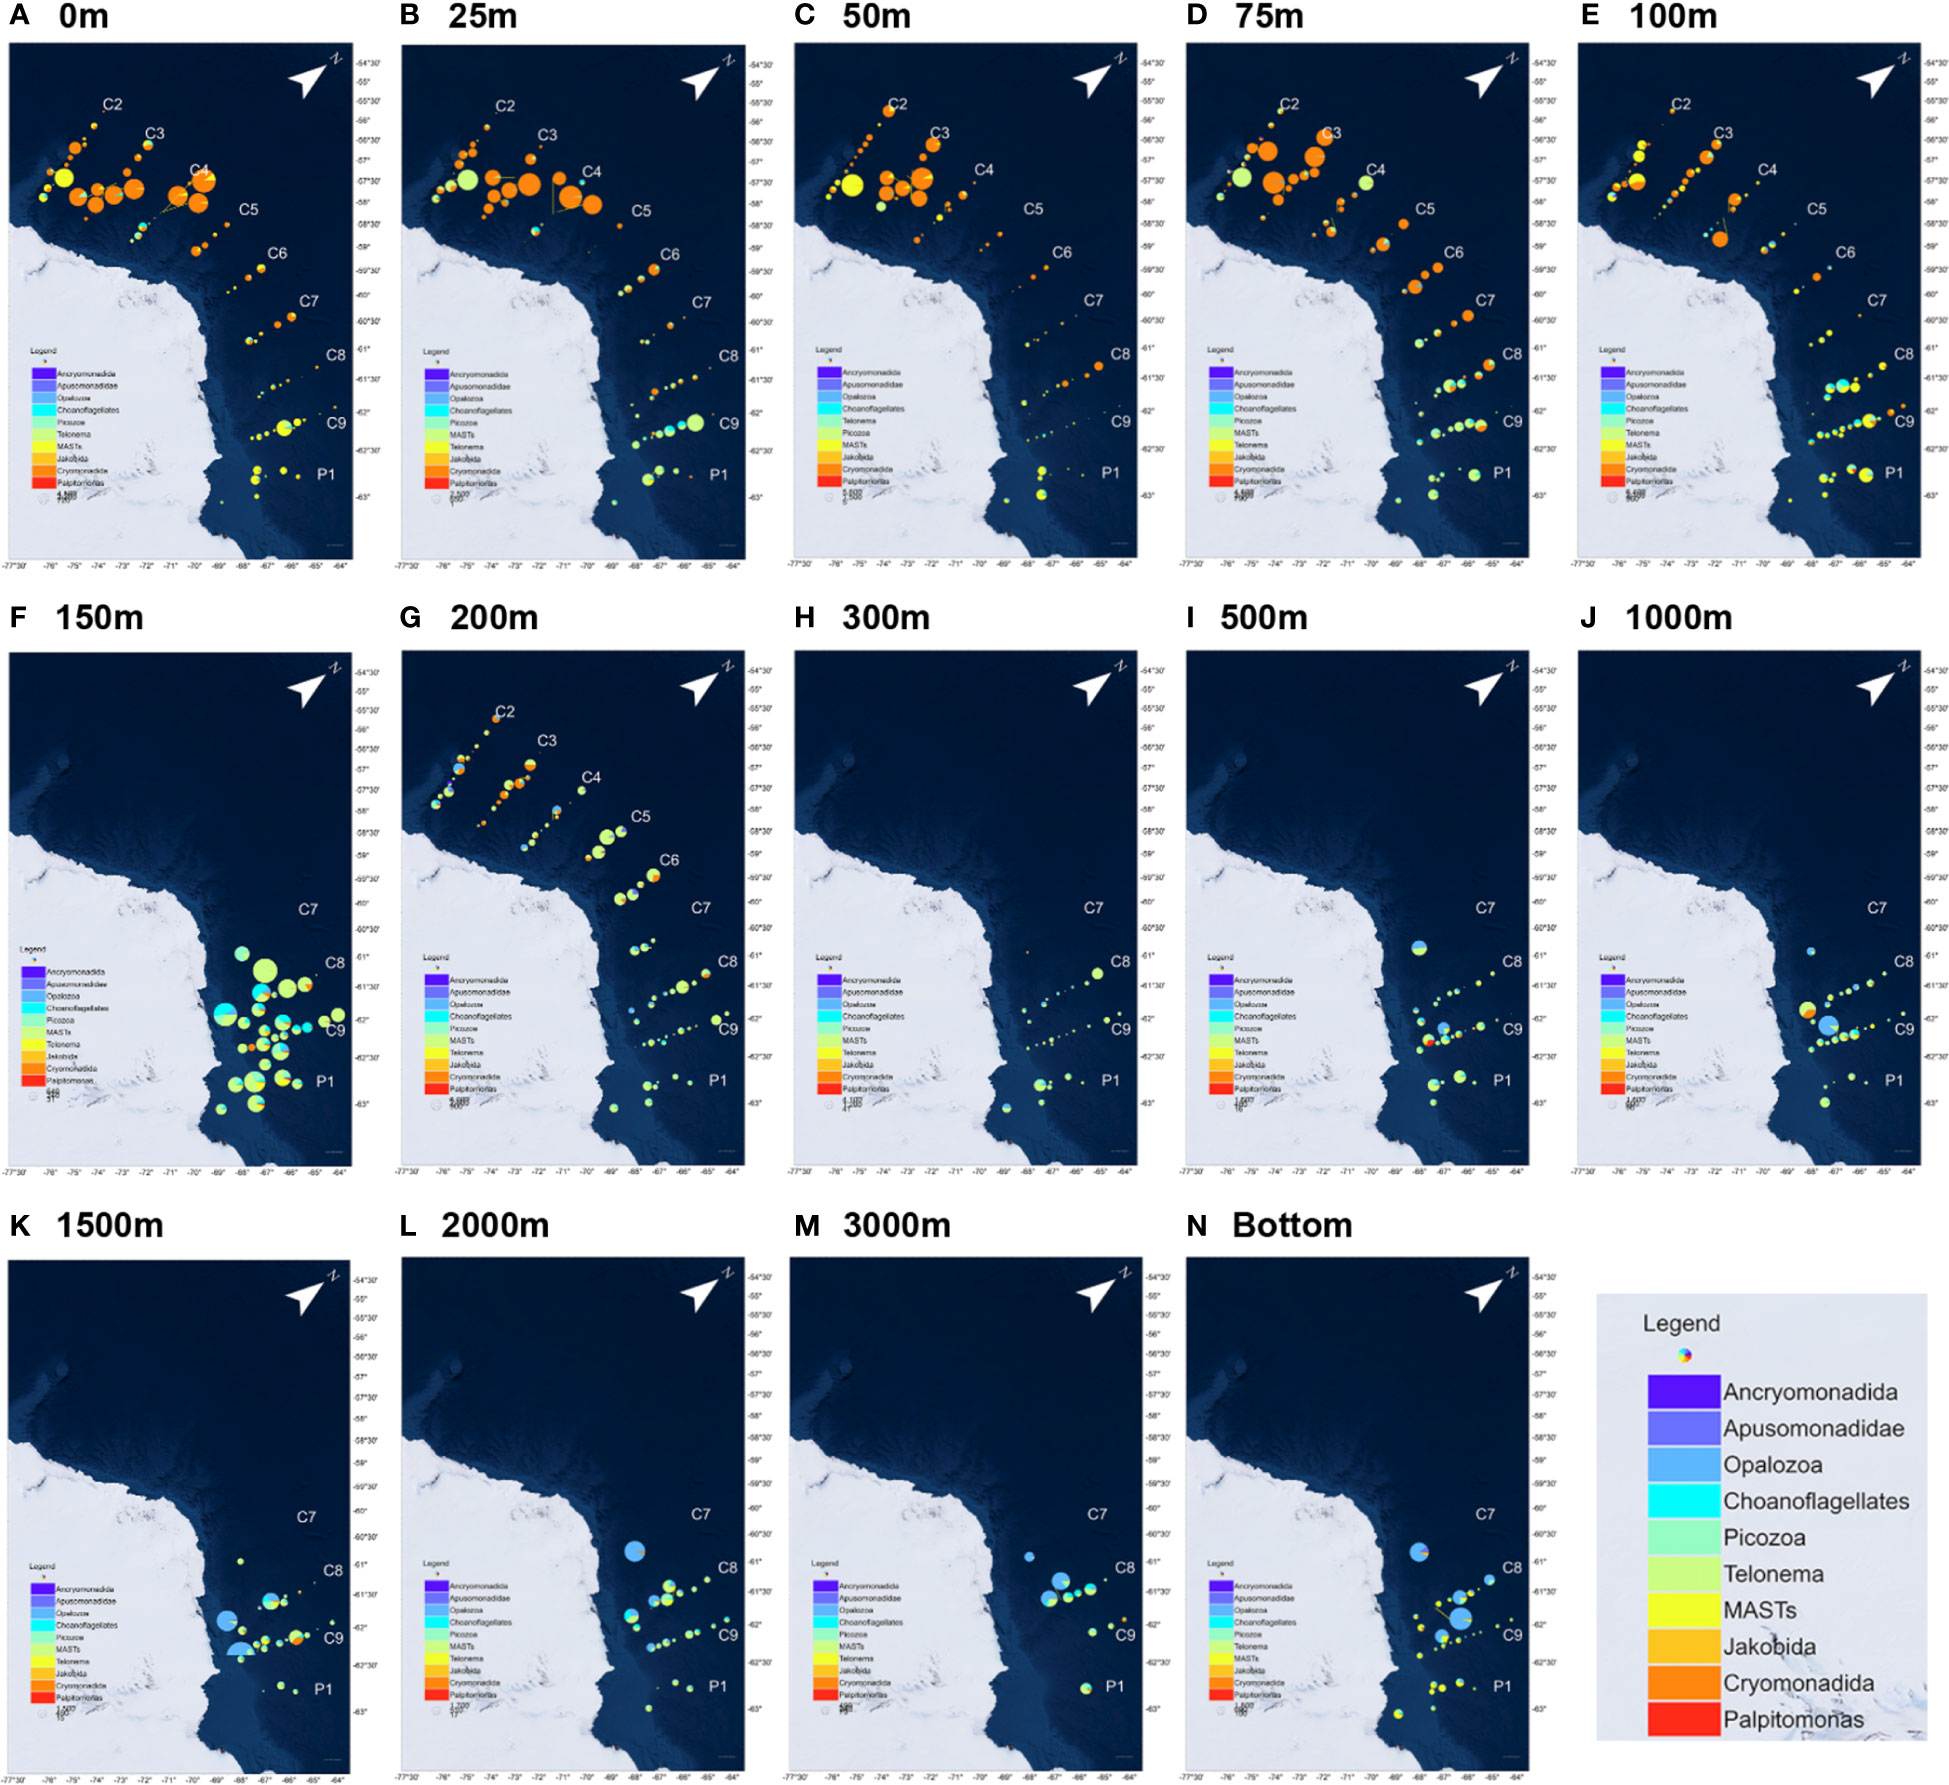
Figure 4 Community structure of the heterotrophic flagellates at different water depths in the nine sections of the Antarctic Astronaut Sea. The bubble size represents the relative abundance of the heterotrophic flagellates at the station, and the sector area represents the proportion of the taxon in the heterotrophic flagellate community at the station. as represents the maximum water depth (bottom) of the sample that was collected at the station. (A–N) corresponds to the HFs distribution at different seawater depths.
The other relatively common HFs taxa were Picozoa, choanoflagellates, Apusomonadidae, and Telonemia, which were relatively less abundant. Except for Apusomonadidae, which was detected only at some stations and depths, the other three HFs were distributed in all the sections and depths. Picozoa was observed in 78.5% of the samples, mainly in the east-west area, and concentrated in the water layer between 75 m and 300 m. The choanoflagellates were observed in 71.6% of the samples, mainly in the east-west area of the Cosmonaut Sea, with peaks at 100 m and 150 m. Then, Telonemia was mainly found on the east side of the Cosmonaut Sea, with a relatively high abundance in the shallow layer. Telonemia was observed in 57.0% of the samples.
Apusomonadidae was concentrated in the western part of the Cosmonaut Sea, mainly at 150 to 200 m in depth and near the seafloor. The overall abundance was relatively low for Palpitomonas, Ancryomonadida, and Jakobida. Additionally, Palpitomonas was mainly distributed in the eastern Cosmonaut Sea, mostly in the surface ocean samples. Ancryomonadida was concentrated at the stations on the western side of the Cosmonaut Sea near the Antarctic continental region. The occurrence in the samples from 0 to 200 m in depth was rare, except for a small number of detections in the individual seafloor samples, and they were not found in all the samples over 300 m. Jakobida was found in the samples at all water depths, mainly in the near Antarctic continental waters.
The dominant taxon on the west and mid-sea was Cryomonadida, with some stations being dominated by MASTs. On the east side, the dominant taxon was MASTs. At depths greater than 100 m, Cryomonadida decreased substantially, and from 200 m in depth, the dominant position of Cryomonadida was occupied by MASTs and Opalozoa. Beyond 200 m, deep-sea samples were only collected in sections C8, C9, and P1 and station C7-06 on the eastern side, and the results showed that MASTs still dominated in the deep-sea layer. While Opalozoa also occurred in a high proportion at several stations, and the proportion of Picozoa and choanoflagellates also increased.
To compare the differences in the distribution of the HFs in the study area and whether each taxon could serve as an indicator species for the area, the indicator value (Ind Val) was used to determine the indicator taxa for each sea area. Based on the indicator value (Table 1), the indicator taxon/taxa in zone A were Cryomonadida and MAST-9, in zone B was Cryomonadida, in zone C were Cryomonadida, MASTs, and MAST-3, in zone D were MASTs, MAST-1C, and MAST-9, and in zone E were MASTs, MAST-1C, MAST-7, MAST-8, MAST-3, MAST-2, Palpitomonas, Telonema, and Cryomonadida.
3.4 Taxonomy composition of marine stramenopiles
Marine stramenopiles, as an important taxon of HFs, were targeted using 13 clades in this study. MAST-1, a common clade of MASTs, was detected in most samples and accounted for more than 50% of the total MASTs in nearly half of the samples. The distribution of MAST-1 in the global waters also varied greatly, with a significantly higher density in the Antarctic Peninsula than that in the other global oceans (Massana et al., 2006; Massana, 2011). MAST-1C had a relatively high overall abundance, accounting for more than 50% of that of MAST-1 in 72% of the samples. The abundance of MAST-1C was higher in the east and west areas of the Cosmonaut Sea than that in the mid-sea, and its distribution directly affected the overall distribution of the MASTs (Figure 5). Moreover, the distribution of MAST-1A was concentrated in the east side of the Cosmonaut Sea, and high values were also observed at individual stations in the west side of the near-continental sea, being concentrated in the samples from 0 to 100 m in depth. The abundance of MAST-1A decreased in the samples at a water depth of over 100 m, but it was also distributed in large numbers in the near-shelf samples. MAST-1B was concentrated in the water layer from 100 m to 300 m, with only a few or no detections in the samples from the other depths. Then, MAST-1D was the least abundant clade of MAST-1 and was mainly distributed in deeper waters below 1000 m.
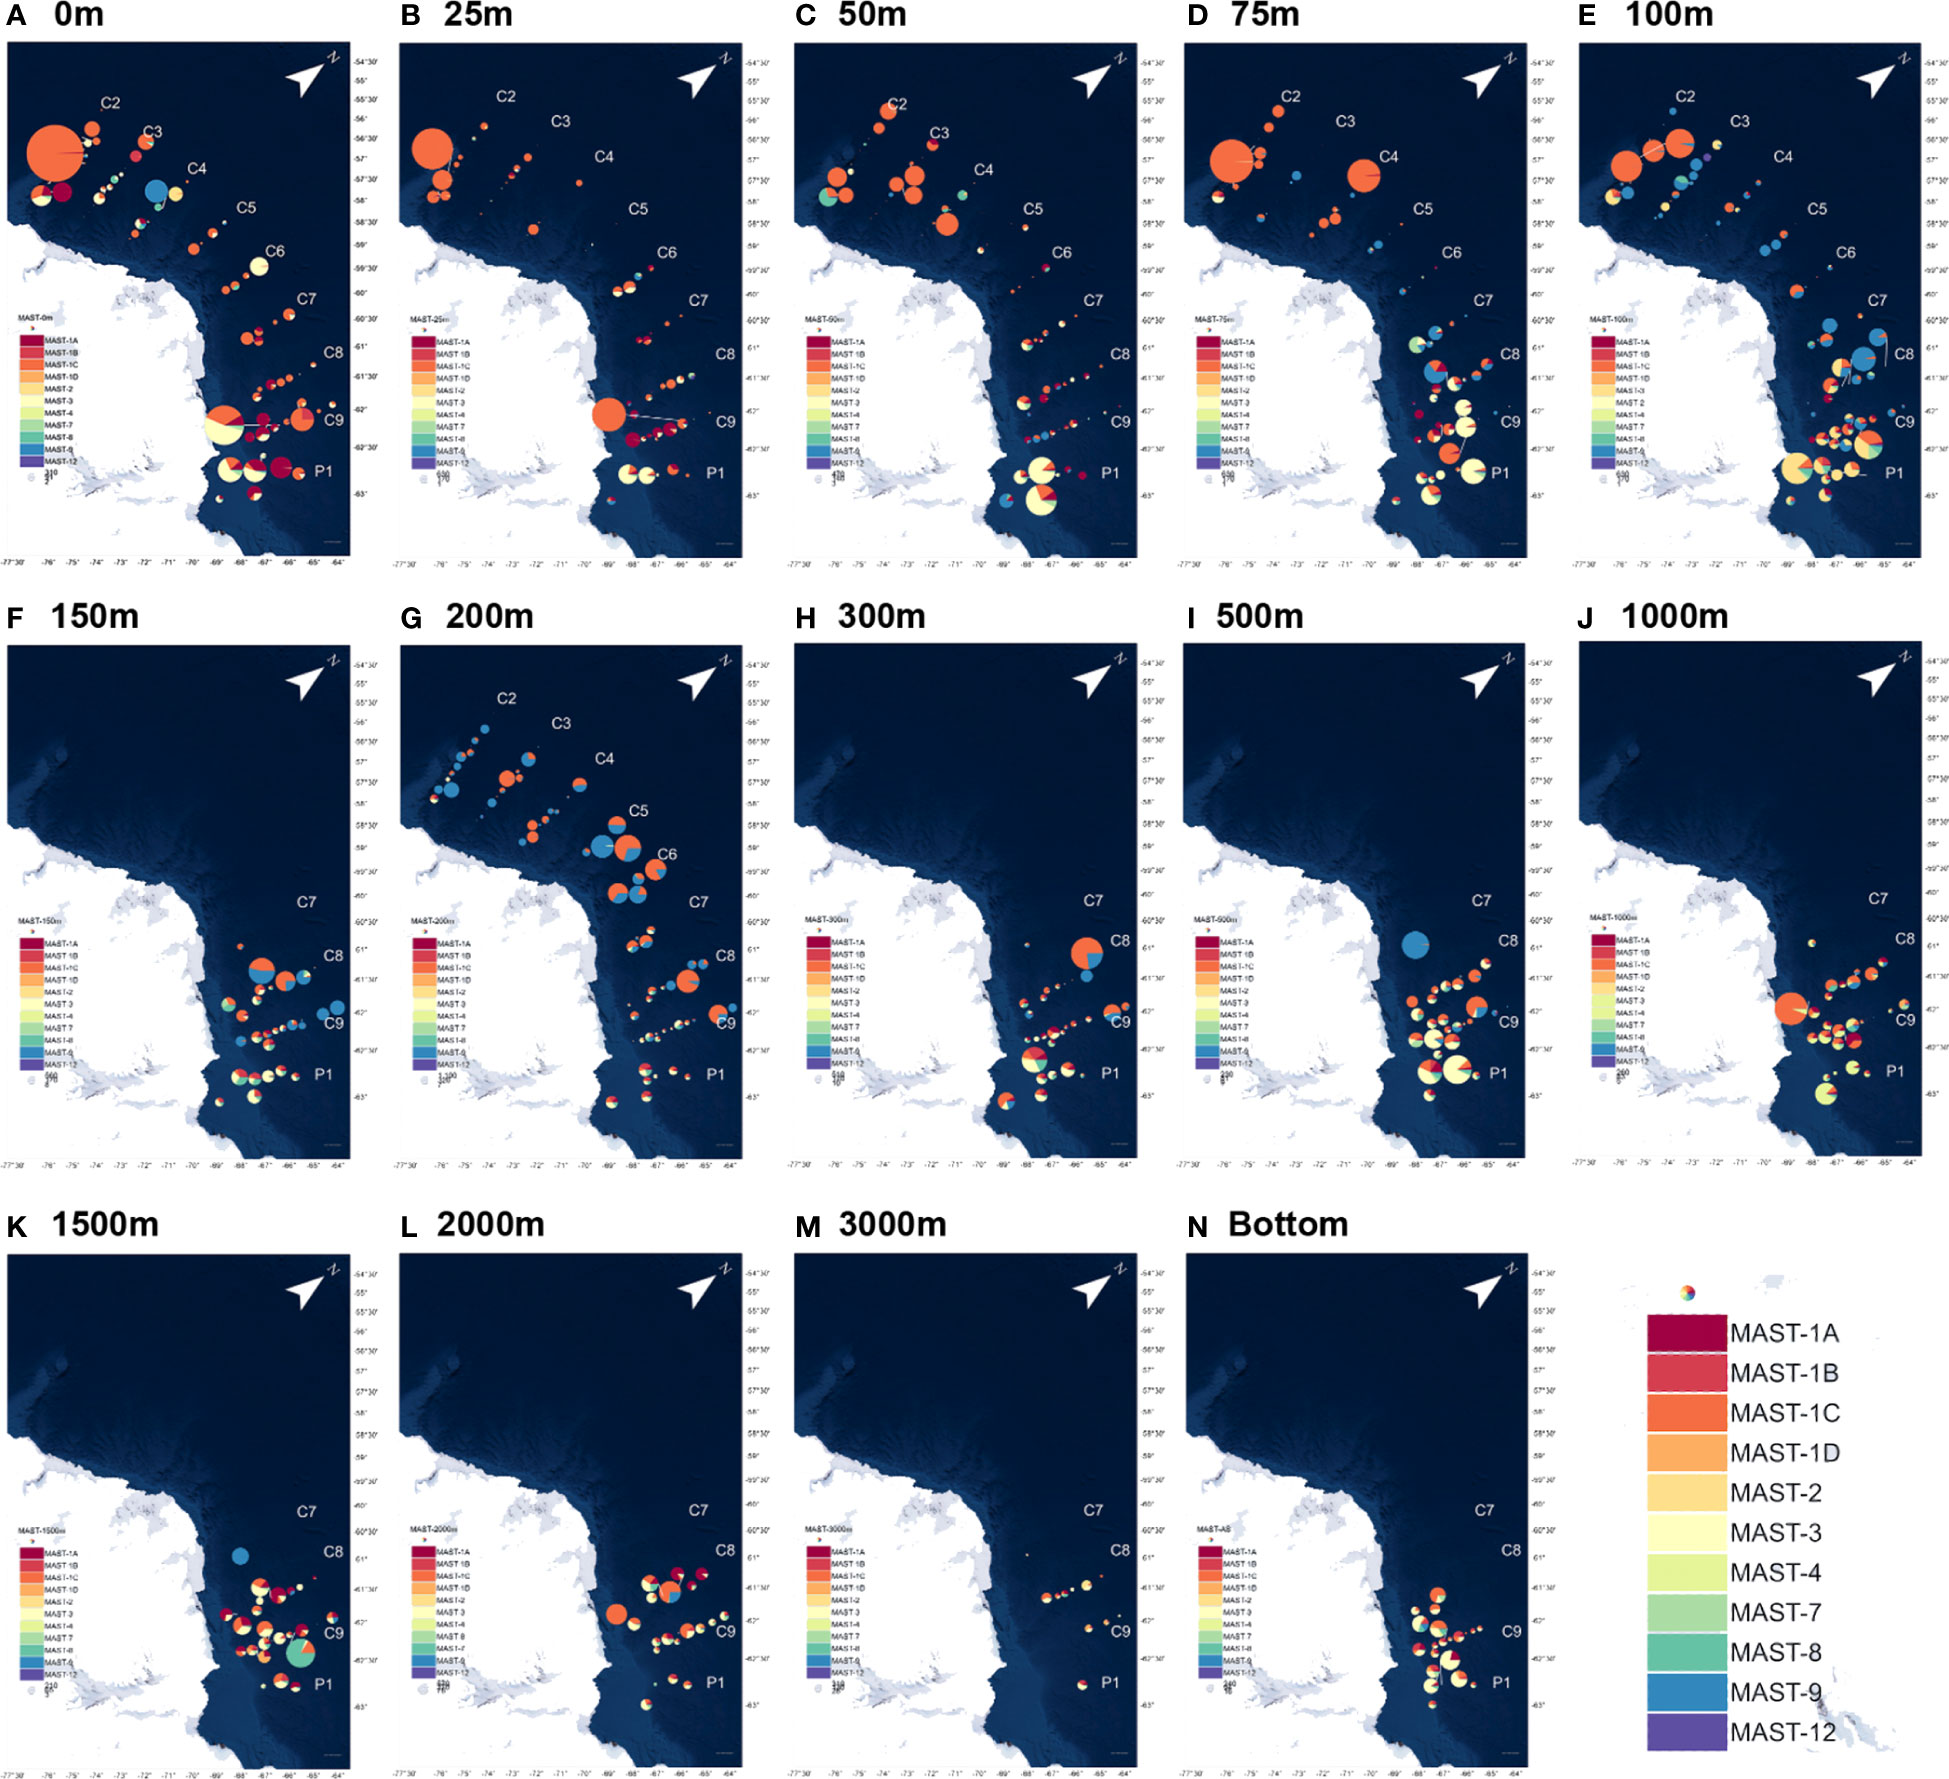
Figure 5 Community structure differences in the heterotrophic flagellate marine stramenopile (MAS) taxa at the different water depths in the nine sections of the Antarctic Astronaut Sea. The bubble size represents the relative abundance of the MASTs at the station site, and the sector area represents the proportion of the taxa among the various clades of MASTs at the site. as represents the maximum water depth (bottom) of the samples that were collected at the station site. (A–N) corresponds to the HFs distribution at different seawater depths.
MAST-3 and MAST-9 were the second most abundant clades after MAST-1. MAST-3 was concentrated in the 50 m to 100 m deep water layer, with a high relative abundance in the near-shelf samples. MAST-9 was concentrated in the 75 m to 200 m deep water layer and near-shelf samples, with a relatively higher abundance in the mid-sea. MAST-7 was more abundant in the samples from 50 m to 150 m. Additionally, MAST-8 was more evenly distributed, with high values occurring at the stations in both the shallow and deep ocean layers. MAST-2 was relatively rare and was mainly distributed in the surface and near-shelf samples. In previous studies, MAST-4 was hardly found in the polar ocean, most of which was distributed in tropical, subtropical, and temperate waters (Massana et al., 2006; Massana, 2011; Massana et al., 2015). In this study, MAST-4 was detected in the deep-sea samples from the eastern side of the Cosmonaut Sea at about 2000 m and occurred sporadically in the surface ocean samples. MAST-12 was mostly found in samples from 25 to 100 m in depth, and MAST-11 and MAST-23 were only detected in a few samples.
3.5 Effects of environmental factors and biological interactions on community structure
A Spearman correlation matrix analysis (Figure 6) revealed significant correlations between most HFs taxa in the Cosmonaut Sea and 11 environmental factors at the p < 0.01 level. However, some correlations were weak, indicating that environmental factors influenced different taxa to varying extents. Notably, salinity exhibited a significant negative correlation with Cryomonadida and a significant positive correlation with MAST-9. Conversely, DO had a significant positive correlation with Cryomonadida and a significant negative correlation with MAST-9. MAST-9 was the taxon most responsive to temperature variations, displaying an opposing trend to the generally negative correlation observed with other HFs taxa. Water depth correlated significantly and negatively with Cryomonadida, while Chl a and silicates across all grain sizes were significantly and positively correlated with this taxon. Among the 11 environmental factors, nitrite showed significant correlations with several HFs taxa. It was negatively correlated with MAST-1A, MAST-1B, MAST-2, MAST-7, and MAST-8, but positively correlated with Cryomonadida. Overall, Cryomonadida emerged as a distinct taxon, exhibiting correlations with environmental factors that were generally opposite to those of other taxa.
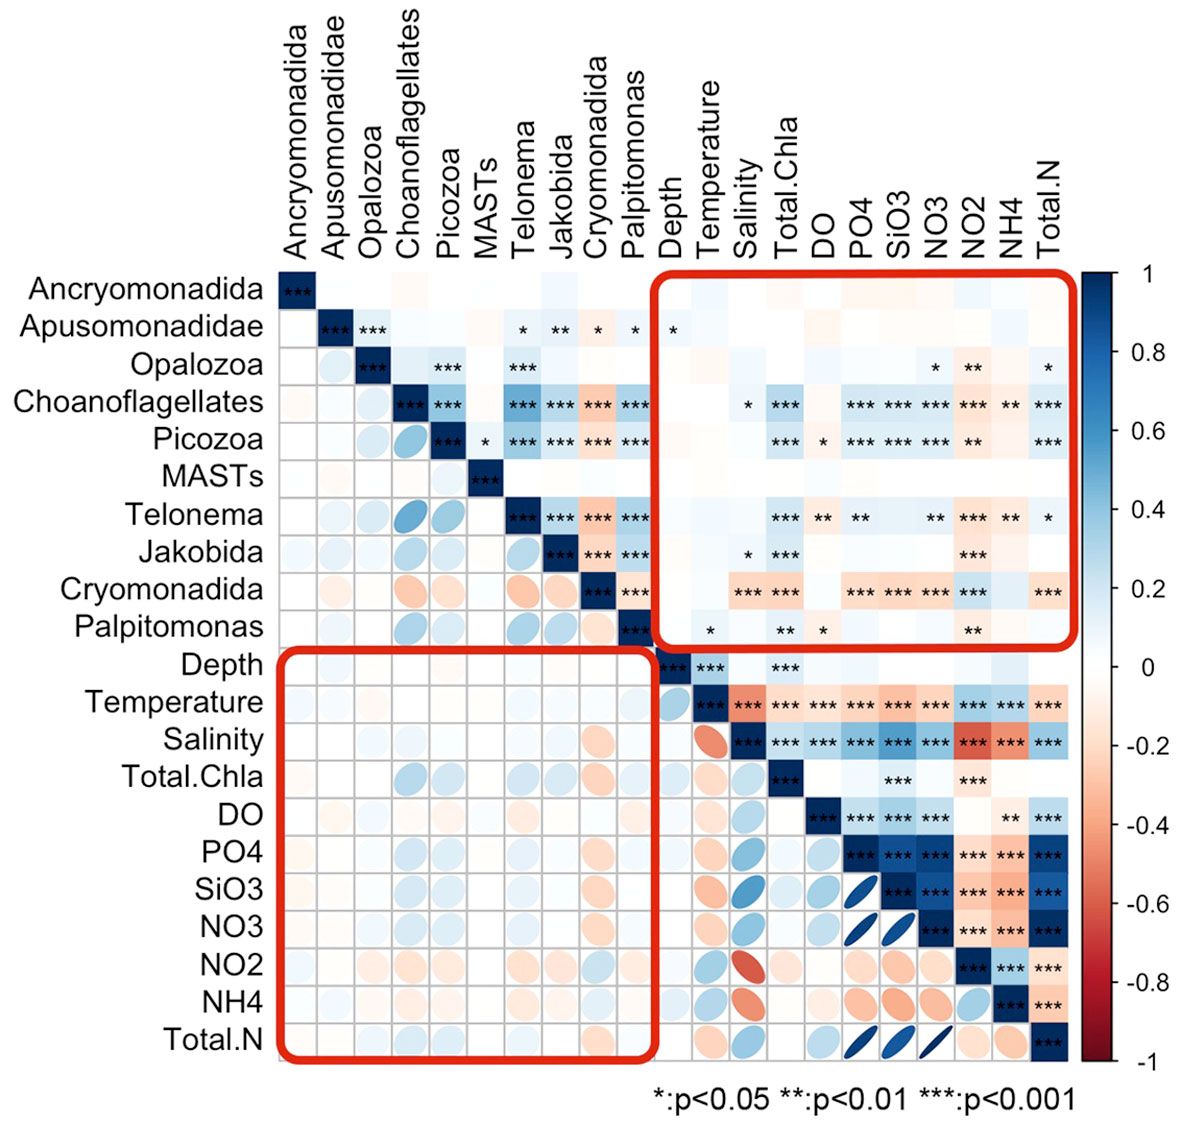
Figure 6 Clustering matrix of the correlations between the environmental factors and various groups of heterotrophic flagellates; the color, size, and gradient of the symbols indicate the Spearman’s correlation coefficients.
Six of the HFs taxa were moderately significantly correlated with at least two of the other taxa. Cryomonadida was more specific when compared to the other taxa, as it was negatively correlated with the taxa with which it was correlated. Specifically, it was weakly negatively correlated with nine taxa (including five clades of MAST), with the strongest correlations with MAST-1A and Telonema. Compared with the other taxa, stronger correlations were observed between choanoflagellates, Picozoa, and Telonemia, which were also moderately positively correlated with Palpitomonas and MAST-1A and weakly negatively correlated with Cryomonadida.
4 Discussion
4.1 Dominant group differences and potential indications
Taxa with a higher relative abundance are not necessarily indicative taxa, but rather indicator taxa that can show the specificity of some of the HFs taxa in the region. In the study area, the main dominant and indicator taxa overlapped well, but there were some differences (Supplementary Table S1). For example, in zones A and B of the Cosmonaut Sea, where MAST-1C was the clade of MASTs with the highest relative abundance, the distribution of the MASTs in the zone was more balanced when compared with that of the other taxa. The dominant and indicator taxa overlapped in most areas, and the east and west sides of the Cosmonaut Sea had obvious differences in the dominant and indicator taxa, with Cryomonadida as the dominant and indicator taxa in Zones A and B, and MASTs and their clades in Zones D and E. Zone C, which is in the middle of the sea, served as an intermediate zone for the shift in dominance between Cryomonadida and MASTs. Some taxa were present in most regions as indicator taxa, such as Cryomonadida, Telonemia, and some clades of the MASTs.
In the tropical and subtropical oceans, most of the dominant HFs taxa in the surface layer belonged to MASTs, Picozoa, and Opalozoa, and in the deep sea, Opalozoa and Diplonemea comprised most of the HFs signal (Obiol et al., 2021). This agrees with the results of this study on the differences in the distribution of the HFs dominant taxa at the different water depths, except that Diplonemea was detected in only a few samples from the Cosmonaut Sea so that they may be more adapted to a higher temperature environment. This is also similar to the global distribution of the MAST subgroup MAST-4, which is rarely found in polar oceans (Massana et al., 2006; Lovejoy and Potvin, 2011; Lovejoy, 2014; Thaler and Lovejoy, 2015). Comparatively, MAST-1 has shown greater adaptability in polar oceans. Although it is the main dominant subgroup of MASTs in temperate and subtropical waters, it also co-occurs with other subgroups to a certain extent (Massana et al., 2006). The choanoflagellates also revealed a clear separation into warm and cold-water clusters, which was attributed to temperature and ocean currents (Rodriguez-Martinez et al., 2013; Nitsche and Arndt, 2015; Thomsen and Østergaard, 2017). Large taxa with global distributions may obscure most HFs-specific taxa with climatic preferences due to their low numbers (Azovsky et al., 2020). Subsequent studies on the regional specificity of HFs may therefore need to focus more on the less abundant taxa.
4.2 Influence of ocean currents on heterotrophic flagellates’ regional distribution
Geographically, the Antarctic Cosmonaut Sea is bordered by the Weddell Sea Gyre Eastern Branch (WSG) to the west, it intersects with the Weddell Sea Deep Water (Aoki et al., 2020), the Antarctic Slope Current (ASC) is to the south, the Prydz Bay Gyre (PBG) is to the east, and the southern boundary of the Antarctic Circumpolar Current (ACC) is to the north (Orsi et al., 1995; Williams et al., 2010; Anderson and Hansen, 2020; Yang et al., 2024). Among them, sections C2 and C3 are in the inner rotation of WSG; C4 is on the outer side of WSG; the C5, C6, and C7 northern stations are in the ACC, and C9, P1, and C8-08 are in the inner rotation of the PBG (Figure 1). Based on the differences in the abundance and community structure of the HFs in each section, the areas that were delineated with the currents were more consistent, and sections C2, C3, and C4 are all distributed in the WSG. This may be because the area is at the intersection between the ASC and the PBG, and the direction of the ASC runs from east to west along the Antarctic continental margin. This may bring microorganisms from the eastern waters of the Cosmonaut Sea to the west. They may mix with the shelf water near the shelf front (Bibik et al., 1988; Klyausov and Lanin, 1988; Comiso et al., 2017; Li et al., 2022), which could be why the distribution and abundance of the dominant species of the HFs communities in this part of the region and at depth differed significantly from other stations in the region.
By comparing the structure and dominant species of the HFs communities in the northern Antarctic Peninsula (Chen et al., 2021) and the Cosmonaut Sea, it was found that the distribution of the HFs in these two regions is likely closely related to ocean currents, and both the northern Antarctic Peninsula and the southwestern Cosmonaut Sea are areas where the WSG and the ASC act together, and their dominant species was MASTs. Some stations in sections C5, C6, and C7 are within the ACC, the most extensive ocean current in the world, circumnavigating the Southern Ocean and being composed of an eastward flowing mean current and a small transient eddy. If the average position of the ACC shifts southward, it will alter the habitat range of the different species with profound effects on marine ecosystems (Cristofari et al., 2018; Meijers et al., 2019).
There are some differences in the drivers of microbial distribution in the surface and deep seas. In the surface ocean, spatial environmental differences significantly influence microbial distribution (Villarino et al., 2022). In the deep sea, the influence of the ocean distance (the shortest path between two sites while avoiding land) (Villarino et al., 2022), ocean circulation, and water mass interactions (Ghiglione et al., 2012; Wilkins et al., 2013) is more significant. It has also been proposed that bacterioplankton are water-mass specific, and interactive mixing of the water masses creates either convergence or divergence in the regional distributions of the marine microbial communities (Hernando-Morales et al., 2017). As predators, HFs in the marine micro-food web are selective for bacterial predation, potentially selectively targeting actively growing bacteria (Anderson and Hansen, 2020). The differences in the bacterial biomes may further affect the community structure of the HFs. In addition, there was a certain gradient change in the environmental factors at different ocean depths in the region [(Han et al., 2022), Supplementary Figure S1]. Therefore, the existence of a bathymetric gradient in the distribution of HFs communities supports, to some extent, the differences in the microbial community impact mechanisms between the surface ocean and deep ocean.
4.3 Prospects with climate change
The eastern waters of the Cosmonaut Sea are influenced by the PBG, which intersects the ASC and converges northward in a clockwise direction northward toward the southern boundary of the ACC. The shelf water along the Antarctic continent sinks to form the low-temperature and high-density Antarctic bottom water mass (AABW), which forms the Southern Ocean through overturning circulation with the upper relatively warm water mass (Armour et al., 2016; Stuecker et al., 2018). The bottom water mass also flows into the deep ocean layers of most oceans (Patara and Boning, 2014; Patara et al., 2016), and Weddell Sea- and Prydz Bay-sourced AABW are blended and exported mainly to the Atlantic and Indian oceans (Solodoch et al., 2022). The upwelling of the Southern Ocean’s overturning circulation carries deep-sea plankton and nutrients, to shallower depths (Thomson et al., 2010; Han et al., 2022), and the surface plankton communities and nutrients can also be transported to the deep sea (Jiao et al., 2018). Therefore, the community ecology of the HFs in the deeper layers of the Cosmonaut Sea is also affected by overturning circulation. Some of the pelagic HFs will be transported to the bottom layer. There will be HFs carried with the Southern Ocean’s bottom water mass to other Antarctic waters and even the deeper layers of the Atlantic Ocean and Indian Ocean.
At the circumpolar scale, the overall variability in the plankton biomass per unit area in the Southern Ocean waters is small (Behrenfeld et al., 2017), with local factors, such as sea ice, glaciers, and changes in the seawater stratification under the influence of circulation affecting the plankton community in the Southern Ocean waters to a greater extent (Schofield et al., 2018; Kim et al., 2020). Freshwater fluxes in the circumpolar zone of the ACC will gradually increase under the influence of sea ice melt, increased net precipitation, and glacier breakup (Downes and Hogg, 2013). Moreover, Antarctic Circumpolar Deep-Water formation and export will continue to decrease due to warming and the renewal of the surface ocean waters near the Antarctic continent (Azaneu et al., 2013; Desbruyeres et al., 2017). The overall transport of the Southern Ocean overturning currents will increase, with implications for the stability of the ice shelves, glaciers, and the Antarctic ice cap. The effect on the nature and circulation of the Southern Ocean water masses (Abernathey et al., 2016; Pellichero et al., 2018; Swart et al., 2018) could directly affect pelagic plankton in the middle and upper ocean (Doney et al., 2012).
Furthermore, it could directly affect the transportation of DO and nutrients in the deep Antarctic seawater. It has been found that the Surface waters that are south of the ACC have stronger freshening rates than those of the intermediate or bottom waters (Menezes et al., 2017; Morley et al., 2020). This means that impacts on the micro-plankton in the surface ocean will occur more quickly (Doney et al., 2012). Therefore, species that are more resilient to disturbances, such as freshening due to climate warming in Antarctica, will be more likely to be less affected (Alcaman-Arias et al., 2021). This implies that as the climate gradually warms, the overall community structure and distribution of the HFs is likely to shift from the original seawater habitat structure to a freshwater habitat structure. The dominance of the taxa that are more adapted to higher temperature and lower salinity water bodies may gradually increase.
This study only discusses heterotrophic flagellate data from a single summer year, with temporal and spatial limitations, which require the subsequent establishment of a long-term dynamic monitoring database to materialize the evaluation of the response and feedback of marine ecosystems to global climate change. Moreover, regionally representative and environmentally indicative taxa could be selected. In addition to focusing on the dominant taxa, further attention should be paid to some taxa (e.g., MAST-4) that are less abundant but have obvious regional distribution characteristics.
5 Conclusion
Investigating the spatial distribution and diversity of heterotrophic flagellates (HFs) in polar seas and ice zones is essential. Our study revealed that the western Cosmonaut Sea had a significantly higher HFs abundance than its eastern counterpart, primarily within the top 100 m. Dominant HFs taxa, such as Cryomonadida in the western and MASTs and Opalozoa in the eastern regions, were influenced by local ocean currents. Specifically, the western Cosmonaut Sea’s HFs diversity was shaped by a combination of the Antarctic Circumpolar Current (ACC) and the Weddell Eddy, similar to the northern Antarctic Peninsula. Long-term monitoring of HF and the construction of an ecological database are recommended for assessing climate change impacts on HFs and the marine food web.
Data availability statement
The datasets presented in this study can be found in online repositories. The names of the repository/repositories and accession number(s) can be found below: https://zenodo.org/records/10156730.
Author contributions
ZC: Conceptualization, Data curation, Methodology, Supervision, Visualization, Writing – original draft, Writing – review & editing, Formal analysis, Software, Validation. HZ: Visualization, Writing – review & editing, Funding acquisition, Validation. YG: Investigation, Methodology, Writing – review & editing. ML: Investigation, Writing – review & editing. GL: Writing – review & editing, Investigation. ZL: Writing – review & editing, Project administration, Validation, Supervision. JH: Funding acquisition, Writing – review & editing, Project administration, Supervision, Resources, Validation.
Funding
The author(s) declare financial support was received for the research, authorship, and/or publication of this article. This study was generously supported by the China Central University Foundation (Grant No. 23GH02026, achieved by HZ), the Taicang Basic Research Program (Grant No. TC2023JC34, achieved by HZ), and the National Natural Science Foundation of China (Grant No. 41976230).
Acknowledgments
We express our deepest gratitude to the crew of R/V Xuelong for their exceptional support during on-site sampling.
Conflict of interest
The authors declare that the research was conducted in the absence of any commercial or financial relationships that could be construed as a potential conflict of interest.
Publisher’s note
All claims expressed in this article are solely those of the authors and do not necessarily represent those of their affiliated organizations, or those of the publisher, the editors and the reviewers. Any product that may be evaluated in this article, or claim that may be made by its manufacturer, is not guaranteed or endorsed by the publisher.
Supplementary material
The Supplementary Material for this article can be found online at: https://www.frontiersin.org/articles/10.3389/fmars.2024.1339413/full#supplementary-material
References
Abernathey R. P., Cerovecki I., Holland P. R., Newsom E., Mazlo M., Talley L. D. (2016). Water-mass transformation by sea ice in the upper branch of the Southern Ocean overturning. Nat. Geosci. 9, 596. doi: 10.1038/ngeo2749
Alcaman-Arias M. E., Fuentes-Alburquenque S., Vergara-Barros P., Cifuentes-Anticevic J., Verdugo J., Polz M., et al. (2021). Coastal bacterial community response to glacier melting in the western antarctic peninsula. Microorganisms 9. doi: 10.3390/microorganisms9010088
Anderson R., Hansen P. J. (2020). Meteorological conditions induce strong shifts in mixotrophic and heterotrophic flagellate bacterivory over small spatio-temporal scales. Limnol. Oceanogr. 65, 1189–1199. doi: 10.1002/lno.11381
Aoki S., Katsumata K., Hamaguchi M., Noda A., Kitade Y., Shimada K., et al. (2020). Freshening of antarctic bottom water off cape darnley, east Antarctica. J. Geophysical Research-Oceans 125. doi: 10.1029/2020JC016374
Armour K. C., Marshall J., Scott J. R., Donohoe A., Newsom E. R. (2016). Southern Ocean warming delayed by circumpolar upwelling and equatorward transport. Nat. Geosci. 9, 549. doi: 10.1038/ngeo2731
Arndt H., Dietrich D., Auer B., Cleven E.-J., Grafenhan T., Weitere M., et al. (2000). Functional diversity of heterotrophic flagellates in aquatic ecosystems. Systematics Assoc. Special volume 59, 240–268.
Azaneu M., Kerr R., Mata M. M., Garcia C. (2013). Trends in the deep Southern Ocean, (1958-2010): Implications for Antarctic Bottom Water properties and volume export. J. Geophysical Research-Oceans 118, 4213–4227. doi: 10.1002/jgrc.20303
Azovsky A. I., Chertoprud E. S., Garlitska L. A., Mazei Y. A., Tikhonenkov D. V. (2020). Does size really matter in biogeography? Patterns and drivers of global distribution of marine micro- and meiofauna. J. Biogeogr. 47, 1180–1192. doi: 10.1111/jbi.13771
Behrenfeld M. J., Hu Y. X., O'malley R. T., Boss E. S., Hostetler C. A., Siegel D. A., et al. (2017). Annual boom-bust cycles of polar phytoplankton biomass revealed by space-based lidar. Nat. Geosci. 10, 118–11+. doi: 10.1038/ngeo2861
Bibik V., Maslennikov V., Pelevin A., Polonsky V., Solyankin E. (1988). “The current system and the distribution of waters of different modifications in the Cooperation and Cosmonaut Seas,” in Interdisciplinary investigations of pelagic ecosystem in the Cooperation and Cosmonaut Seas (VNIRO Publishers, Moscow), 16–43.
Bokulich N. A., Kaehler B. D., Rideout J. R., Dillon M., Bolyen E., Knight R., et al. (2018). Optimizing taxonomic classification of marker-gene amplicon sequences with QIIME 2’s q2-feature-classifier plugin. Microbiome 6, 1–17. doi: 10.1186/s40168-018-0470-z
Chen Z. Y., He J. F., Cao S. N., Lu Z. B., Lan M. S., Zheng H. Y., et al. (2021). Diversity and distribution of heterotrophic flagellates in seawater of the Powell Basin, Antarctic Peninsula. Polar Res. 40. doi: 10.33265/polar.v40.5389
Christaki U., Gueneugues A., Liu Y., Blain S., Catala P., Colombet J., et al. (2021). Seasonal microbial food web dynamics in contrasting Southern Ocean productivity regimes. Limnol. Oceanogr. 66, 108–122. doi: 10.1002/lno.11591
Comiso J. C., Gersten R. A., Stock L. V., Turner J., Perez G. J., Cho K. (2017). Positive trend in the antarctic sea ice cover and associated changes in surface temperature. J. Climate 30, 2251–2267. doi: 10.1175/JCLI-D-16-0408.1
Comiso J. C., Gordon A. L. (1987). Recurring polynyas over the cosmonaut sea and the maud rise. J. Geophysical Research-Oceans 92, 2819–2833. doi: 10.1029/JC092iC03p02819
Convey P., Peck L. S. (2019). Antarctic environmental change and biological responses. Sci. Adv. 5. doi: 10.1126/sciadv.aaz0888
Cristofari R., Liu X., Bonadonna F., Cherel Y., Pistorius P., Le Maho Y., et al. (2018). Climate-driven range shifts of the king penguin in a fragmented ecosystem. Nat. Climate Change 8, 245–24+. doi: 10.1038/s41558-018-0084-2
del Campo J., Ruiz-Trillo I. (2013). Environmental survey meta-analysis reveals hidden diversity among unicellular opisthokonts. Mol. Biol. Evol. 30, 802–805. doi: 10.1093/molbev/mst006
Desbruyeres D., Mcdonagh E. L., King B. A., Thierry V. (2017). Global and full-depth ocean temperature trends during the early twenty-first century from Argo and repeat hydrography (vol 30, pg 1985, 2017). J. Climate 30, 7577–7577. doi: 10.1175/JCLI-D-16-0396.1
Doney S. C., Ruckelshaus M., Duffy J. E., Barry J. P., Chan F., English C. A., et al. (2012). Climate Change Impacts on Marine Ecosystems, Annual Review of Marine Science, Vol. 4, 11–37. doi: 10.1146/annurev-marine-041911-111611
Downes S. M., Hogg A. M. (2013). Southern ocean circulation and eddy compensation in CMIP5 models. J. Climate 26, 7198–7220. doi: 10.1175/JCLI-D-12-00504.1
Dufrene M., Legendre P. (1997). Species assemblages and indicator species: The need for a flexible asymmetrical approach. Ecol. Monogr. 67, 345–366. doi: 10.2307/2963459
Falk-Petersen S., Pavlov V., Timofeev S., Sargent J. R. (2007). Climate variability and possible effects on arctic food chains: The role of Calanu. Arctic Alpine Ecosystems and People in a Changing Environmentt (Springer, Berlin, Heidelberg). doi: 10.1007/978-3-540-48514-8_9
Fortier L., Sirois P., Michaud J., Barber D. (2006). Survival of Arctic cod larvae (Boreogadus saida) in relation to sea ice and temperature in the Northeast Water Polynya (Greenland Sea). Can. J. Fisheries Aquat. Sci. 63, 1608–1616. doi: 10.1139/f06-064
Ghiglione J. F., Galand P. E., Pommier T., Pedros-Alio C., Maas E. W., Bakker K., et al. (2012). Pole-to-pole biogeography of surface and deep marine bacterial communities. Proc. Natl. Acad. Sci. United States America 109, 17633–17638. doi: 10.1073/pnas.1208160109
Griffiths H. J., Meijers A. J. S., Bracegirdle T. J. (2017). More losers than winners in a century of future Southern Ocean seafloor warming. Nat. Climate Change 7, 749–74+. doi: 10.1038/nclimate3377
Han M., Cao S. N., Luo G. F., He J. F., Liang Y. T., Chen X. C., et al. (2022). Distributions of virio- and picoplankton and their relationships with ice-melting and upwelling in the Indian Ocean sector of East Antarctica. Deep-Sea Res. Part Ii-Topical Stud. Oceanogr. 197. doi: 10.1016/j.dsr2.2022.105044
Hernando-Morales V., Ameneiro J., Teira E. (2017). Water mass mixing shapes bacterial biogeography in a highly hydrodynamic region of the Southern Ocean. Environ. Microbiol. 19, 1017–1029. doi: 10.1111/1462-2920.13538
Hunt B., Pakhomov E., Trotsenko B. (2007). The macrozooplankton of the Cosmonaut Sea, east Antarctica (30 E–60 E), 1987–1990. Deep Sea Res. Part I: Oceanographic Res. Papers 54, 1042–1069. doi: 10.1016/j.dsr.2007.04.002
Jiao N., Wang H., Xu G., Aricò S. (2018). Blue carbon on the rise: challenges and opportunities. Natl. Sci. Rev. 5, 464–468. doi: 10.1093/nsr/nwy030
Kim S., Kim J. H., Lim J. H., Jeong J. H., Heo J. M., Kim I. N. (2020). Distribution and control of bacterial community composition in marian cove surface waters, King George Island, Antarctica during the summer of 2018. Microorganisms 8. doi: 10.3390/microorganisms8081115
Klyausov A., Lanin V. (1988). On the near-shelf frontal zone in the Commonwealth and Cosmonaut Sea. Interdisciplinary investigations of pelagic ecosystem in the commonwealth and cosmonaut seas (Moscow: VNIRO Publishers), 56–62.
Koljalg U., Nilsson R. H., Abarenkov K., Tedersoo L., Taylor A. F. S., Bahram M., et al. (2013). Towards a unified paradigm for sequence-based identification of fungi. Mol. Ecol. 22, 5271–5277. doi: 10.1111/mec.12481
Laidre K. L., Stirling I., Lowry L. F., Wiig O., Heide-Jorgensen M. P., Ferguson S. H. (2008). Quantifying the sensitivity of Arctic marine mammals to climate-induced habitat change. Ecol. Appl. 18, S97–125. doi: 10.1890/06-0546.1
Li W. K. W., Mclaughlin F. A., Lovejoy C., Carmack E. C. (2009). Smallest algae thrive as the arctic ocean freshens. Science 326, 539–539. doi: 10.1126/science.1179798
Li H. B., Xu Z. Q., Mou W. X., Gao L. B., Zu Y. C., Wang C. F., et al. (2022). Planktonic ciliates in different water masses of Cosmonaut and Cooperation Seas (Indian sector of the Southern Ocean) during austral summer. Polar Biol. 45, 1059–1076. doi: 10.1007/s00300-022-03057-w
Lovejoy C. (2014). Changing views of arctic protists (Marine microbial eukaryotes) in a changing arctic. Acta Protozoologica 53, 91–100. doi: 10.4467/16890027AP.14.009.1446
Lovejoy C., Potvin M. (2011). Microbial eukaryotic distribution in a dynamic Beaufort Sea and the Arctic Ocean. J. Plankton Res. 33, 431–444. doi: 10.1093/plankt/fbq124
Luebbe B. (1997). Inc. Bran luebbe autoAnalyzer applications: autoAnalyzer method no: G-172-96 nitrate and nitrite in water and seawater.
Massana R. (2011). Eukaryotic picoplankton in surface oceans. Annu. Rev. Microbiol. 65, 91–110. doi: 10.1146/annurev-micro-090110-102903
Massana R., Gobet A., Audic S., Bass D., Bittner L., Boutte C., et al. (2015). Marine protist diversity in European coastal waters and sediments as revealed by high-throughput sequencing. Environ. Microbiol. 17, 4035–4049. doi: 10.1111/1462-2920.12955
Massana R., Terrado R., Forn I., Lovejoy C., Pedros-Alio C. (2006). Distribution and abundance of uncultured heterotrophic flagellates in the world oceans. Environ. Microbiol. 8, 1515–1522. doi: 10.1111/j.1462-2920.2006.01042.x
Meijers A. J. S., Meredith M. P., Murphy E. J., Chambers D. P., Belchier M., Young E. F. (2019). The role of ocean dynamics in king penguin range estimation. Nat. Climate Change 9, 120–121. doi: 10.1038/s41558-018-0388-2
Menezes V. V., Macdonald A. M., Schatzman C. (2017). Accelerated freshening of Antarctic Bottom Water over the last decade in the Southern Indian Ocean. Sci. Adv. 3. doi: 10.1126/sciadv.1601426
Monier A., Terrado R., Thaler M., Comeau A., Medrinal E., Lovejoy C. (2013). Upper Arctic Ocean water masses harbor distinct communities of heterotrophic flagellates. Biogeosciences 10, 4273–4286. doi: 10.5194/bg-10-4273-2013
Morley S. A., Abele D., Barnes D. K. A., Cardenas C. A., Cotte C., Gutt J., et al. (2020). Global drivers on southern ocean ecosystems: changing physical environments and anthropogenic pressures in an earth system. Front. Mar. Sci. 7. doi: 10.3389/fmars.2020.547188
Nitsche F., Arndt H. (2015). Comparison of similar arctic and antarctic morphotypes of heterotrophic protists regarding their genotypes and ecotypes. Protist 166, 42–57. doi: 10.1016/j.protis.2014.11.002
Obiol A., Muhovic I., Massana R. (2021). Oceanic heterotrophic flagellates are dominated by a few widespread taxa. Limnol. Oceanogr. 66, 4240–4253. doi: 10.1002/lno.11956
Orsi A. H., Whitworth T., Nowlin W. D. (1995). On the meridional extent and fronts of the antarctic circumpolar current. Deep-Sea Res. Part I-Oceanographic Res. Papers 42, 641–673. doi: 10.1016/0967-0637(95)00021-W
Patara L., Boning C. W. (2014). Abyssal ocean warming around Antarctica strengthens the Atlantic overturning circulation. Geophysical Res. Lett. 41, 3972–3978. doi: 10.1002/2014GL059923
Patara L., Boning C. W., Biastoch A. (2016). Variability and trends in Southern Ocean eddy activity in 1/12 degrees ocean model simulations. Geophysical Res. Lett. 43, 4517–4523. doi: 10.1002/2016GL069026
Pellichero V., Sallee J. B., Chapman C. C., Downes S. M. (2018). The southern ocean meridional overturning in the sea-ice sector is driven by freshwater fluxes. Nat. Commun. 9. doi: 10.1038/s41467-018-04101-2
Rodriguez-Martinez R., Rocap G., Salazar G., Massana R. (2013). Biogeography of the uncultured marine picoeukaryote MAST-4: temperature-driven distribution patterns. ISME J. 7, 1531–1543. doi: 10.1038/ismej.2013.53
Schlitzer R. (2021) Ocean Data View. Available online at: https://odv.awi.de.
Schofield O., Brown M., Kohut J., Nardelli S., Saba G., Waite N., et al. (2018). Changes in the upper ocean mixed layer and phytoplankton productivity along the West Antarctic Peninsula. Philos. Trans. R. Soc. a-Mathematical Phys. Eng. Sci. 376. doi: 10.1098/rsta.2017.0173
Seenivasan R., Sausen N., Medlin L. K., Melkonian M. (2013). Picomonas judraskeda gen. Et sp nov.: the first identified member of the picozoa phylum nov., a widespread group of picoeukaryotes, formerly known as 'Picobiliphytes'. PloS One 8. doi: 10.1371/journal.pone.0059565
Sherr E. B., Sherr B. F. (2002). Significance of predation by protists in aquatic microbial food webs. Antonie Van Leeuwenhoek 81, 293–308. doi: 10.1023/A:1020591307260
Sohrin R., Imazawa M., Fukuda H., Suzuki Y. (2010). Full-depth profiles of prokaryotes, heterotrophic nanoflagellates, and ciliates along a transect from the equatorial to the subarctic central Pacific Ocean. Deep-Sea Res. Part Ii-Topical Stud. Oceanogr. 57, 1537–1550. doi: 10.1016/j.dsr2.2010.02.020
Solodoch A., Stewart A. L., Hogg A. M., Morrison A. K., Kiss A. E., Thompson A. F., et al. (2022). How does antarctic bottom water cross the Southern Ocean? Geophysical Res. Lett. 49. doi: 10.1029/2021GL097211
Stuecker M. F., Bitz C. M., Armour K. C., Proistosescu C., Kang S. M., Xie S. P., et al. (2018). Polar amplification dominated by local forcing and feedbacks. Nat. Climate Change 8, 1076–107+. doi: 10.1038/s41558-018-0339-y
Swart N. C., Gille S. T., Fyfe J. C., Gillett N. P. (2018). Recent Southern Ocean warming and freshening driven by greenhouse gas emissions and ozone depletion. Nat. Geosci. 11, 836–83+. doi: 10.1038/s41561-018-0226-1
Thaler M., Lovejoy C. (2015). Biogeography of heterotrophic flagellate populations indicates the presence of generalist and specialist taxa in the Arctic Ocean. Appl. Environ. Microbiol. 81, 2137–2148. doi: 10.1128/AEM.02737-14
Thomsen H. A., Østergaard J. B. (2017). Acanthoecid choanoflagellates from the Atlantic Arctic Region – a baseline study. Heliyon 3, e00345. doi: 10.1016/j.heliyon.2017.e00345
Thomson P. G., Davidson A. T., Van Den Enden R., Pearce I., Seuront L., Paterson J. S., et al. (2010). Distribution and abundance of marine microbes in the Southern Ocean between 30 and 80°E. Deep Sea Res. Part II: Topical Stud. Oceanogr. 57, 815–827. doi: 10.1016/j.dsr2.2008.10.040
Verity P. G., Wassmann P., Frischer M. E., Howard-Jones M. H., Allen A. E. (2002). Grazing of phytoplankton by microzooplankton in the Barents Sea during early summer. J. Mar. Syst. 38, 109–123. doi: 10.1016/S0924-7963(02)00172-0
Villarino E., Watson J. R., Chust G., Woodill A. J., Klempay B., Jonsson B., et al. (2022). Global beta diversity patterns of microbial communities in the surface and deep ocean. Global Ecol. Biogeogr. 31, 2323–2336. doi: 10.1111/geb.13572
Wilkins D., Van Sebille E., Rintoul S. R., Lauro F. M., Cavicchioli R. (2013). Advection shapes Southern Ocean microbial assemblages independent of distance and environment effects. Nat. Commun. 4. doi: 10.1038/ncomms3457
Williams G. D., Nicol S., Aoki S., Meijers A. J. S., Bindoff N. L., Iijima Y., et al. (2010). Surface oceanography of BROKE-West, along the Antarctic margin of the south-west Indian Ocean (30-80 degrees E). Deep-Sea Res. Part Ii-Topical Stud. Oceanogr. 57, 738–757. doi: 10.1016/j.dsr2.2009.04.020
Worden A. Z., Follows M. J., Giovannoni S. J., Wilken S., Zimmerman A. E., Keeling P. J. (2015). Rethinking the marine carbon cycle: factoring in the multifarious lifestyles of microbes. Science 347, 1257594. doi: 10.1126/science.1257594
Yang S., Zhou M., Cheng X. (2024). Seasonal and interannual variability between upper ocean processes and the slope current in the region around the Cosmonauts Sea off East Antarctic. Journal of Geophysical Research: Oceans 129, e2023JC019636. doi: 1029/2023JC019636
Keywords: heterotrophic flagellates, biodiversity, Cosmonaut Sea, Antarctic, climate change community ecology
Citation: Chen Z, Zheng H, Gao Y, Lan M, Luo G, Lu Z and He J (2024) Spatial distribution and diversity of the heterotrophic flagellates in the Cosmonaut Sea, Antarctic. Front. Mar. Sci. 11:1339413. doi: 10.3389/fmars.2024.1339413
Received: 11 December 2023; Accepted: 07 February 2024;
Published: 22 February 2024.
Edited by:
Letterio Guglielmo, Anton Dohrn Zoological Station Naples, ItalyReviewed by:
Ajit Kumar Mohanty, Indira Gandhi Centre for Atomic Research (IGCAR), IndiaRuifeng Zhang, Shanghai Jiao Tong University, China
Copyright © 2024 Chen, Zheng, Gao, Lan, Luo, Lu and He. This is an open-access article distributed under the terms of the Creative Commons Attribution License (CC BY). The use, distribution or reproduction in other forums is permitted, provided the original author(s) and the copyright owner(s) are credited and that the original publication in this journal is cited, in accordance with accepted academic practice. No use, distribution or reproduction is permitted which does not comply with these terms.
*Correspondence: Zhibo Lu, bHV6aGlib0B0b25namkuZWR1LmNu; Jianfeng He, aGVqaWFuZmVuZ0BwcmljLm9yZy5jbg==