Abstract
In this work, we present, for the first time, the seawater carbonate system measurements of two coastal time-series in the NW Mediterranean Sea, L’Estartit Oceanographic Station (EOS; 42.05°N 3.2542°E) and the Blanes Bay Microbial Observatory (BBMO; 41.665°N 2.805°E). At these two time-series, measurements of total alkalinity (TA), pH, and associated variables, such as dissolved inorganic nutrients, temperature, and salinity, have been performed monthly since 2010 in surface seawater. Seasonality and seasonal amplitude are analogous in both time-series, with seasonality in pHTin situ(pH at in situ seawater conditions on the total hydrogen ion scale) primarily determined by seasonality in sea surface temperature. The evaluated pHTin situtrends at BBMO (-0.0021 ± 0.0003 yr-1) and EOS (-0.0028 ± 0.0005 yr-1) agree with those reported for coastal and open ocean surface waters in the Mediterranean Sea and open ocean surface waters of the global ocean, therefore indicating that these time-series are representative of global ocean acidification signals despite being coastal. The decreases in pHTin situcan be attributed to increases in total dissolved inorganic carbon (DIC; 1.5 ± 0.4 µmol kg-1 yr-1 at BBMO and 1.6 ± 0.6 µmolESkg-1 yr-1 at EOS) and sea surface temperature (0.08 ± 0.02 °C yr-1 at BBMO and 0.08 ± 0.04 °C yr-1 at EOS). The increases in carbon dioxide fugacity (fCO2; 2.4 ± 0.3 µmol kg-1 yr-1 at BBMO and 2.9 ± 0.6 µmol kg-1 yr-1 at EOS) follow the atmospheric CO2 forcing, thus indicating the observed DIC increase is related to anthropogenic CO2 uptake. The increasing trends in TA (1.2 ± 0.3 µmol kg-1 yr-1 at BBMO and 1.0 ± 0.5 µmol kg-1 yr-1 at EOS) buffered the acidification rates, counteracting 60% and 72% of the pHTin situdecrease caused by increasing DIC at EOS and BBMO, respectively. Once accounted for the neutralizing effect of TA increase, the rapid sea surface warming plays a larger role in the observed pH decreases (43% at EOS and 62% at BBMO) than the DIC increase (36% at EOS and 33% at BBMO).
1 Introduction
Human activities have exponentially increased the atmospheric concentration of carbon dioxide (CO2) since the Industrial Revolution. As a consequence of the oceanic uptake of about 20–30% of those CO2 emissions (Gruber et al., 2019; Friedlingstein et al., 2022), ocean surface pH has decreased by 0.1 to 0.2 units (Doney et al., 2009; Rhein et al., 2013; Bates et al., 2014; Ríos et al., 2015), a phenomenon known as ocean acidification. In addition to the pH decrease, the dissolution of anthropogenic CO2 in seawater leads to an increase in the partial pressure of CO2 (pCO2) and total dissolved inorganic carbon (DIC), and a reduction in the carbonate ion levels (Doney et al., 2009), thus reducing the saturation states of calcium carbonate minerals, such as aragonite (ΩAr) and calcite. Such changes in ocean chemistry may have direct and indirect consequences for marine life (particularly calcifying organisms), ecosystems, and reliant human communities (Riebesell et al., 2000; Kroeker et al., 2013; Mostofa et al., 2016; Doney et al., 2020).
Although ocean acidification is a global problem, it does not occur uniformly worldwide (Gattuso et al., 2015), presenting a wide range of rates, especially in coastal zones (Hofmann et al., 2011; Duarte et al., 2013a), where natural spatiotemporal variability is an important source of uncertainty when detecting anthropogenic acidification (Duarte et al., 2013a; Carstensen and Duarte, 2019). While the phenomenon of ocean acidification has garnered considerable scientific attention (Doney et al., 2009; Gattuso et al., 2015), the processes and consequences associated with coastal acidification have been less explored.
The ocean carbon cycle community is increasingly recognizing coastal and nearshore areas as hotspots for carbon and biogeochemical variability (Cai et al., 1998; Cai et al., 2020; Cai et al., 2021; Dai et al., 2022), especially vulnerable to global change, likely sites for marine CO2 removal interventions, and regions of great importance, as coastal ecosystems provide invaluable resources and services, including various for climate change mitigation (Duarte et al., 2013b). The increased CO2 uptake of coastal waters is not only contributing to their acidification but also exacerbating existing global challenges such as eutrophication, pollution, and habitat degradation (Andersson and Gledhill, 2013; Cai et al., 2023). Therefore, a robust understanding of carbonate chemistry is key to properly assessing habitat vulnerability to ocean acidification.
The dynamics of the seawater carbonate system are intricately shaped by the interplay between physicochemical (such as ocean circulation and mixing, and heat, carbon, and freshwater exchanges with the atmosphere) and biological (such as photosynthesis and calcification) factors. The temporal and spatial dimensions of these interactions add further complexity, emphasizing the need for continuous time-series to disentangle these complex interactions, providing a detailed understanding of how the seawater carbonate system responds to evolving environmental conditions (e.g., Doney et al., 2009; Benway et al., 2019). Long-term observations allow for the identification of trends, patterns, and potential tipping points, enabling to distinguish between natural variability and anthropogenic influences. Continuous datasets are, therefore, essential for advancing our knowledge and facilitating informed management strategies in the context of ongoing global environmental changes.
The Mediterranean Sea has been recognized as one of the most prominent climate-change hotspots (Giorgi, 2006) and is considered a “miniature ocean” (Bethoux et al., 1999), serving as a model to anticipate the responses of the global ocean to diverse pressures (Lejeusne et al., 2010). The relatively rapid overturning circulation of the Mediterranean Sea and the high total alkalinity (TA) of its waters lead to a naturally high capacity of the Mediterranean Sea to absorb and buffer anthropogenic CO2 (Schneider et al., 2010; Lee et al., 2011; Álvarez et al., 2014; Palmiéri et al., 2015). Despite its importance, the seawater carbonate system of the Mediterranean Sea is still poorly quantified, especially in coastal zones (understood here as those within the continental shelf), and long-term time-series are still sparse (Hassoun et al., 2022).
In this context, we present here the seawater carbonate system measurements of two coastal time-series in the NW Mediterranean Sea: L’Estartit Oceanographic Station (EOS; 42.05°N 3.2542°E) and Blanes Bay Microbial Observatory (BBMO; 41.665°N 2.805°E) (Figure 1). At these two coastal time-series, surface sampling for TA, pH, and associated variables, such as dissolved inorganic nutrients (nitrate, NO3-, silicate, SiO2, and phosphate, PO43-), temperature, and salinity, have been performed monthly since 2010. Using these newly released datasets, we evaluate the seasonality and assess the long-term pH changes in surface waters and explore the physical and chemical drivers causing them. Variations in these drivers are the result of changes in ocean circulation and mixing, biological processes, as well as exchanges of heat, freshwater, and carbon with the atmosphere.
Figure 1
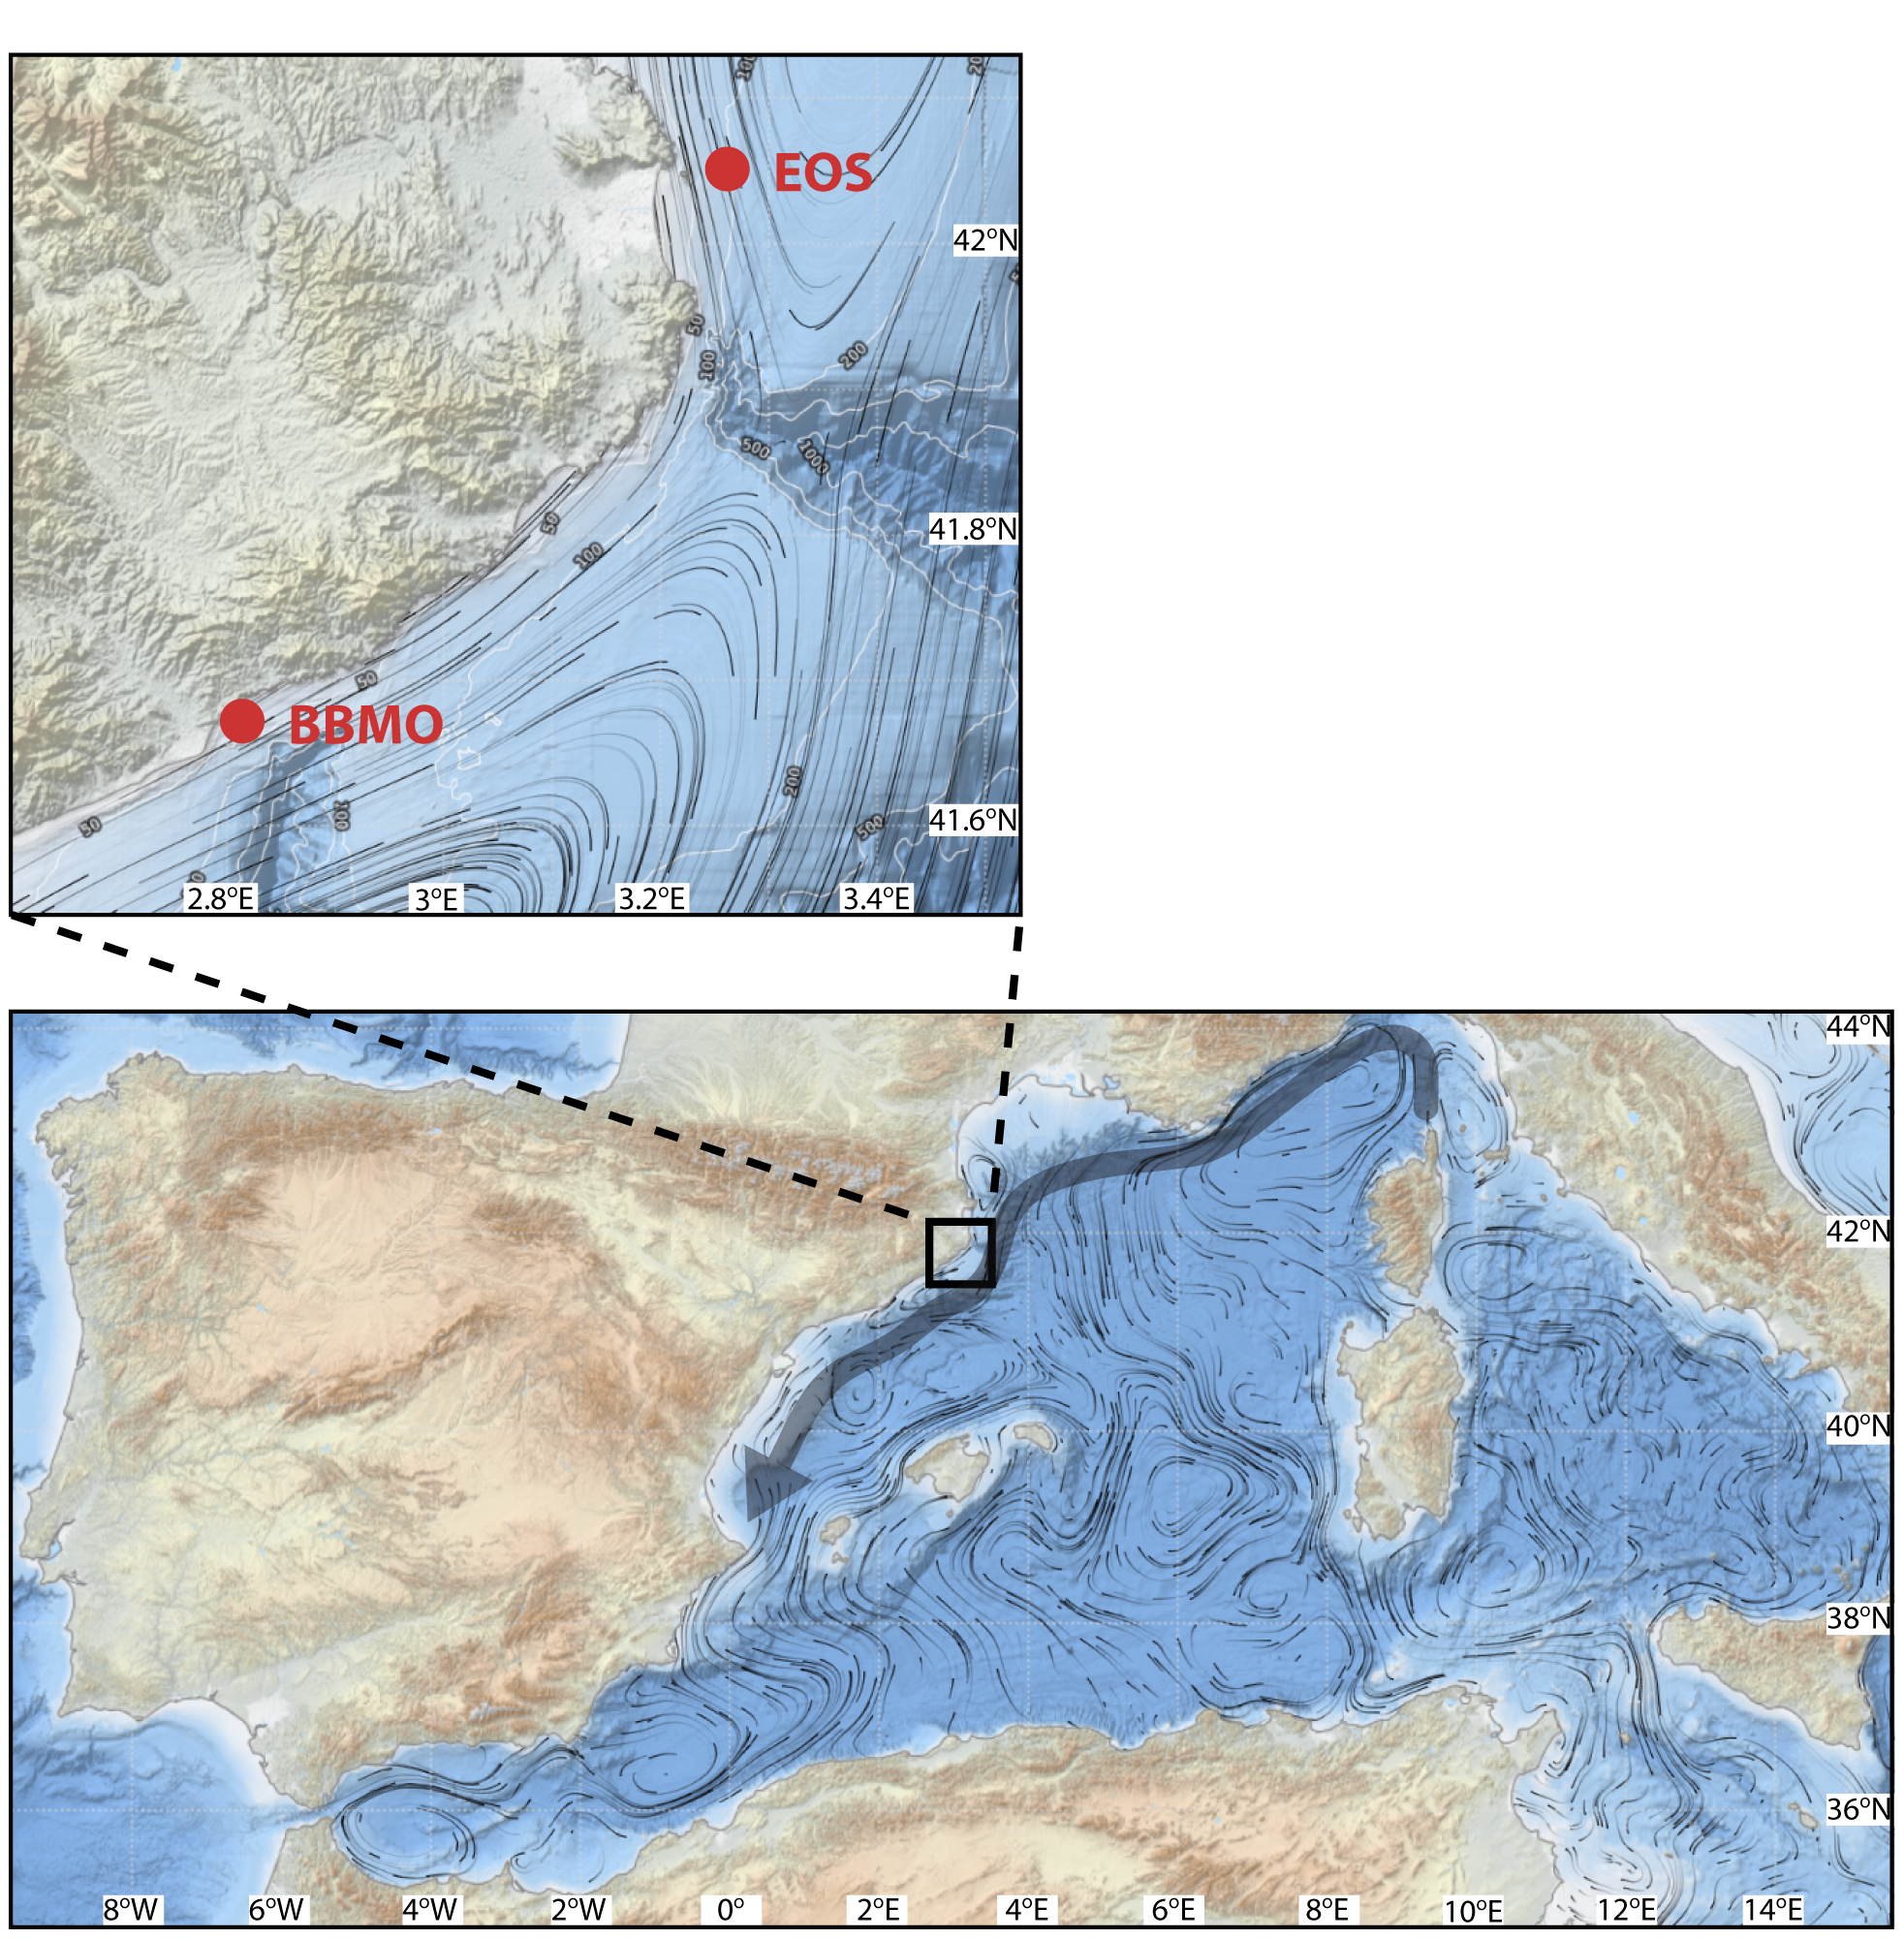
Locations of the studied coastal time-series, EOS and BBMO, on a map of climatological surface currents in the month of July (Martínez et al. (2022)), also including an schematic of the Northern Current.
2 Materials and methods
2.1 EOS and BBMO: site description, sampling, and measurements
The studied coastal time-series are located off the coast of Girona (Catalonia, Spain), ~60 km apart, being EOS in deeper waters and further from the coast than BBMO (92 m deep and ~3.5 km off the main coast and ~2 km off the Medes Islands, and 20 m deep and ~800 m offshore, respectively; Figure 1). Both stations are influenced by the southwest-flowing Northern Current (Figure 1), which originates before the Ligurian Sea and continues south of the Ibiza Channel (Millot, 1999). Both time-series locations present strong stratification in summer and a deep mixed layer depth during the rest of the year (Guadayol et al., 2009; Aparicio et al., 2017; Zamanillo et al., 2021). The most offshore site, EOS, lays close to a natural reserve (Marine Protected Area of the Medes Islands), while BBMO is close to the Blanes harbor area so, a priori, we would expect land-ocean interactions and anthropogenic activities to lead to higher variability at BBMO than at EOS.
Weekly monitoring of sea surface temperature at EOS began in 1973, led by Josep Pascual, being the longest uninterrupted time-series of oceanographic data in the Mediterranean Sea (Salat et al., 2019). Monthly sampling for pH and TA started in 2010, jointly with Josep Pascual’s measurements of sea surface temperature and salinity. Plankton ecology around the BBMO site has been extensively studied since the mid-XX century (e.g., Margalef, 1945), but it was in 1998 when a more continuous sampling effort began, with a focus on microbial biodiversity and biogeochemical function. Since then, monthly water sampling has been carried out for a very broad range of biotic and abiotic variables (Gasol et al., 2012) for which pH and TA also began to be measured at the end of 2009. For this work, we focus our study period at EOS from 22/01/2010 to 23/08/2019, since measurements had to be interrupted at that date, and from 22/12/2009 to 02/08/2022 at BBMO.
BBMO temperature and salinity were measured with a SAIV-A/S-SD204 CTD (Environmental Sensors & Systems, Norway), with an accuracy of ± 0.02 in salinity and ± 0.01 °C in temperature. EOS temperature was measured with reversible thermometers with an accuracy of ± 0.02 °C, while EOS salinity was measured with two CTDs, a SAIV-A/S-SD204 CTD (Environmental Sensors & Systems, Norway) with an accuracy of ± 0.02 in salinity, and a CTD75M (Sea & Sun Technology, Germany) with an accuracy of ± 0.01 in salinity. For consistency between BBMO and EOS datasets, the salinity record obtained with the SAIV-A/S-SD204 CTD is considered in this study. When salinity values from the SAIV-A/S-SD204 CTD were missing, salinity values from CTD75M were used. The salinity records obtained with the two CTDs were quality controlled and calibrated to obtain a consistent dataset.
Discrete seawater samples for pH, TA, and dissolved inorganic nutrients were taken monthly from a depth of 0.5 m at both stations (with a Niskin bottle at EOS and in 10 L polyethylene carboys at BBMO). For pH measurements, at EOS, two cylindrical optical glass cells with a 10 cm path-length were filled directly from the Niskin bottle right after reaching land, ready to be analyzed in the next 3–4 hrs. At BBMO, a 150 mL glass bottle was filled leaving no headspace, and three 10 cm path-length cylindrical optical glass cells were filled from it once at the ICM laboratory (< 2 hrs after sampling). For TA measurements, one sample per site was taken in 500 mL borosilicate glass bottles, rinsed three times, and carefully filled from the bottom with a tube. Samples for TA were poisoned with 300 µL mercuric chloride (HgCl2) saturated solution to halt biological activity (Dickson et al., 2007), right after reaching land for EOS and at the ICM laboratory for BBMO. Bottles were then stored in the dark at room temperature until they were analyzed in the laboratory, within days up to one month. Each TA sample was measured by duplicate. Samples for dissolved inorganic nutrients were stored frozen at -20°C in sterile falcon tubes until analysis. These tubes were filled directly from the Niskin bottle upon reaching land in EOS and from a bottle at the ICM laboratory in the case of BBMO samples.
TA was analyzed by potentiometric titration, determined by double endpoint titration (Pérez and Fraga, 1987; Mintrop et al., 2000), and calibrated with reference materials (Prof. A. Dickson, Scripps Institution of Oceanography (USA); Batches #93, #104, #136, and #179). TA measurement precision was ± 4 µmol kg-1.
pH was determined at 25 °C and 1 atm in a Cary 100 UV-vis spectrophotometer containing a 25°C-thermostated cell holder following Clayton and Byrne (1993), using unpurified m-cresol purple as indicator dye, and reported on the total hydrogen ion scale (pHT25). The indicator dye used was from Sigma-Aldrich, lots 211761-1G (from 2009 to 16/04/2018) and 211761-10G (from 16/04/2018 onward). pH measurement precision was ± 0.006 pH units.
Dissolved inorganic nutrients were determined by standard continuous flow analysis with colorimetric detection (Hansen and Grassof, 1983) using a Bran + Luebbe autoanalyser. Precisions were ± 0.01 µmol kg-1 NO3-, ± 0.02 µmol kg-1 PO43-, and ± 0.01 µmol kg-1 SiO2.
Seawater carbonate system parameters, ΩAr, DIC, CO2 fugacity at in situ seawater conditions (fCO2), and pH at in situ seawater conditions on the total hydrogen ion scale (pHT in situ) were calculated from pHT25 and TA measurements using the MATLAB® version of CO2SYSv3 (Sharp et al., 2021), with the carbonic acid dissociation constants of Mehrbach et al. (1973) reformulated on the total hydrogen scale by Lueker et al. (2000), the bisulfate dissociation constant of Dickson (1990), and the total boron to salinity ratio of Lee et al. (2010). We used the CO2SYSv3 uncertainty propagation code (Sharp et al., 2021; adapted from Orr et al., 2018) to estimate the uncertainties in calculated parameters, taking into account the uncertainties in thermodynamic constants suggested by Orr et al. (2018), resulting in an uncertainty of ± 4 µmol kg-1 in DIC, ± 0.02 in ΩAr, and ± 10 µatm in fCO2. When dissolved inorganic nutrient measurements were unavailable (12% of the EOS dataset and 6% of the BBMO dataset), those values were assumed to be equal to the monthly average values for each time-series.
2.2 Trend assessment
To quantify interannual changes, all datasets were detrended for seasonality using the recently developed Trends of Ocean Acidification Time Series (TOATS, https://github.com/NOAA-PMEL/TOATS) software, which is a supplement to the recently published best practices for assessing trends of ocean acidification time-series with monthly or higher periodicity sampling (Sutton et al., 2022). Briefly, the procedure first removes the overall linear trend by applying a simple linear regression and removing the slope from the original dataset. Then, climatological monthly means are calculated using this detrended time-series, and the climatological annual means are determined. Monthly adjustments are then determined by subtracting the climatological annual mean from the climatological monthly means. Finally, the de-seasoned dataset is obtained by subtracting the adjustment value for each month from the time-series of monthly means, which was not detrended [for more details, see Sutton et al. (2022)]. The TOATS software also provides the trend detection time, i.e., the minimum observational period needed to statistically distinguish between natural variability (noise) and anthropogenic forcing.
Long-term trends were computed with the de-seasoned dataset, using ordinary least squares regression, and 95% confidence intervals were calculated for the slopes of the regressions. The reported trends were calculated excluding data points identified as outliers in pH after the dataset was de-seasoned (data from 16/05/2017, 22/06/2017, and 24/07/2019 for EOS, and 13/12/2016 and 13/10/2021 for BBMO, data outside 2SD –standard deviation– boundaries).
We tested if the trends were different using the TOATS de-seasonalizing software (Sutton et al., 2022) and the widely-applied approach of Bates et al. (2014), where de-seasoned data is computed by subtracting the respective climatological monthly means computed from the time-series and calculating the trends with those anomalies. The two approaches produced statistically indistinguishable trends (Table 1, Supplementary Table 1).
Table 1
| Site (time period) | Variable | Slope ± SE | p-value | r2 |
|---|---|---|---|---|
| BBMO (22/12/2009–02/08/2022) |
pHT in situ | -0.0021 ± 0.0003 | < 0.01 | 0.30 |
| T (°C) | 0.08 ± 0.02 | < 0.01 | 0.09 | |
| S | 0.013 ± 0.006 | 0.04 | 0.04 | |
| TA (µmol kg-1) | 1.2 ± 0.3 | < 0.01 | 0.11 | |
| DIC (µmol kg-1) | 1.5 ± 0. 4 | < 0.01 | 0.12 | |
| ΩAr | -0.0014 ± 0.0026 | 0.59 | <0.01 | |
| fCO2 in situ (µatm) | 2.4 ± 0.3 | < 0.01 | 0.31 | |
| EOS (22/01/2010–23/08/2019) |
pHT in situ | -0.0028 ± 0.0005 | < 0.01 | 0.27 |
| T (°C) | 0.08 ± 0.04 | 0.04 | 0.06 | |
| S | 0.040 ± 0.012 | < 0.01 | 0.14 | |
| TA (µmol kg-1) | 1.0 ± 0.5 | 0.03 | 0.06 | |
| DIC (µmol kg-1) | 1.6 ± 0.6 | 0.01 | 0.09 | |
| ΩAr | -0.0051 ± 0.0041 | 0.22 | 0.02 | |
| fCO2 in situ (µatm) | 2.9 ± 0.6 | < 0.01 | 0.28 |
De-seasoned time-series {using the Trends of Ocean Acidification Time Series [TOATS, https://github.com/NOAA-PMEL/TOATS; Sutton et al. (2022)] software} regression analyses at EOS and BBMO for pH at in situ seawater conditions on the total hydrogen ion scale (pHT in situ), temperature (T), salinity (S), total alkalinity (TA), total dissolved inorganic carbon (DIC), and fugacity of carbon dioxide at in situ seawater conditions (fCO2 in situ).
Slopes represent the change in the variable unit per year. SE stands for standard error.
For comparison with atmospheric CO2 values, we used atmospheric CO2 data from Plateau Rosa, Italy (courtesy of the World Data Center for Greenhouse Gases; https://gaw.kishou.go.jp/).
2.3 Carbonate system driver determination
Observed temporal changes in pHTin situwere decomposed into those associated with each of the potential drivers, assuming linearity and using a first-order Taylor-series deconvolution approach (Equation 1) (García-Ibáñez et al., 2016; Kwiatkowski and Orr, 2018):
where represents the slope contribution of changing “Driver” to the observed temporal change in pHTin situ(ΔpH). The sensitivity of pH to each driver (; Table 2) was estimated by calculating pHTin situusing the true observations of each driver and holding the other three drivers constant (mean value of the time-series) and regressing it to each driver. Sensitivity was then multiplied by the corresponding observed temporal changes in in situ temperature (ΔTemp), salinity (ΔS), TA (ΔTA), and DIC (ΔDIC) (Table 1). We did not use salinity-normalized TA and DIC as drivers because there was no clear relationship between TA and salinity or between DIC and salinity (not shown). This was also the approach used in another coastal time-series in the NW Mediterranean Sea (Point B; Kapsenberg et al., 2017), where salinity was found to be a poor TA predictor.
Table 2
| Site | Driver | ± SE | ± RMSE | Contribution (%) | ± RMSE |
|---|---|---|---|---|---|
| BBMO | T (°C) | -0.0153 ± < 0.0001 | -0.0013 ± 0.0004 | 61 | -0.0021 ± 0.0009 |
| S | -0.0117 ± < 0.0001 | -0.0002 ± 0.0001 | 7 | ||
| TA (µmol kg-1) | 0.0015 ± < 0.0001 | 0.0018 ± 0.0005 | -85 | ||
| DIC (µmol kg-1) | -0.0016 ± < 0.0001 | -0.0025 ± 0.0006 | 116 | ||
| EOS | T (°C) | -0.0153 ± < 0.0001 | -0.0012 ± 0.0006 | 43 | -0.0027 ± 0.0013 |
| S | -0.0117 ± < 0.0001 | -0.0005 ± 0.0003 | 16 | ||
| TA (µmol kg-1) | 0.0015 ± < 0.0001 | 0.0015 ± 0.0007 | -53 | ||
| DIC (µmol kg-1) | -0.0016 ± < 0.0001 | -0.0025 ± 0.0010 | 88 |
Decomposition of de-seasoned pHTin situtrends at EOS and BBMO.
Sensitivity of pH with respect to each driver () was multiplied by the de-seasoned regression analyses of each driver (; Table 1), where the drivers are changes in sea surface temperature (T), salinity (S), total alkalinity (TA), and total dissolved inorganic carbon (DIC). The addition of the pHT in situ changes from each driver is also given (), as well as the percentage of the contribution of each driver to the observed pHT in situ trends (Table 1). SE is standard error and RMSE is root mean square error.
The driver decomposition results using the de-seasonalizing TOATS software (Table 2) were statistically indistinguishable from those resulting from applying the de-seasonalizing technique of Bates et al. (2014) (Supplementary Table 2).
3 Results
3.1 Seasonality in biogeochemical variables
The two time-series present a relatively similar seasonality in all the studied variables (Figures 2, 3). Surface waters are warm in summer and temperate in winter (Figure 2A), with maximum temperatures above 23 °C between June and September and minimum temperatures around 13 °C from December to March.
Figure 2
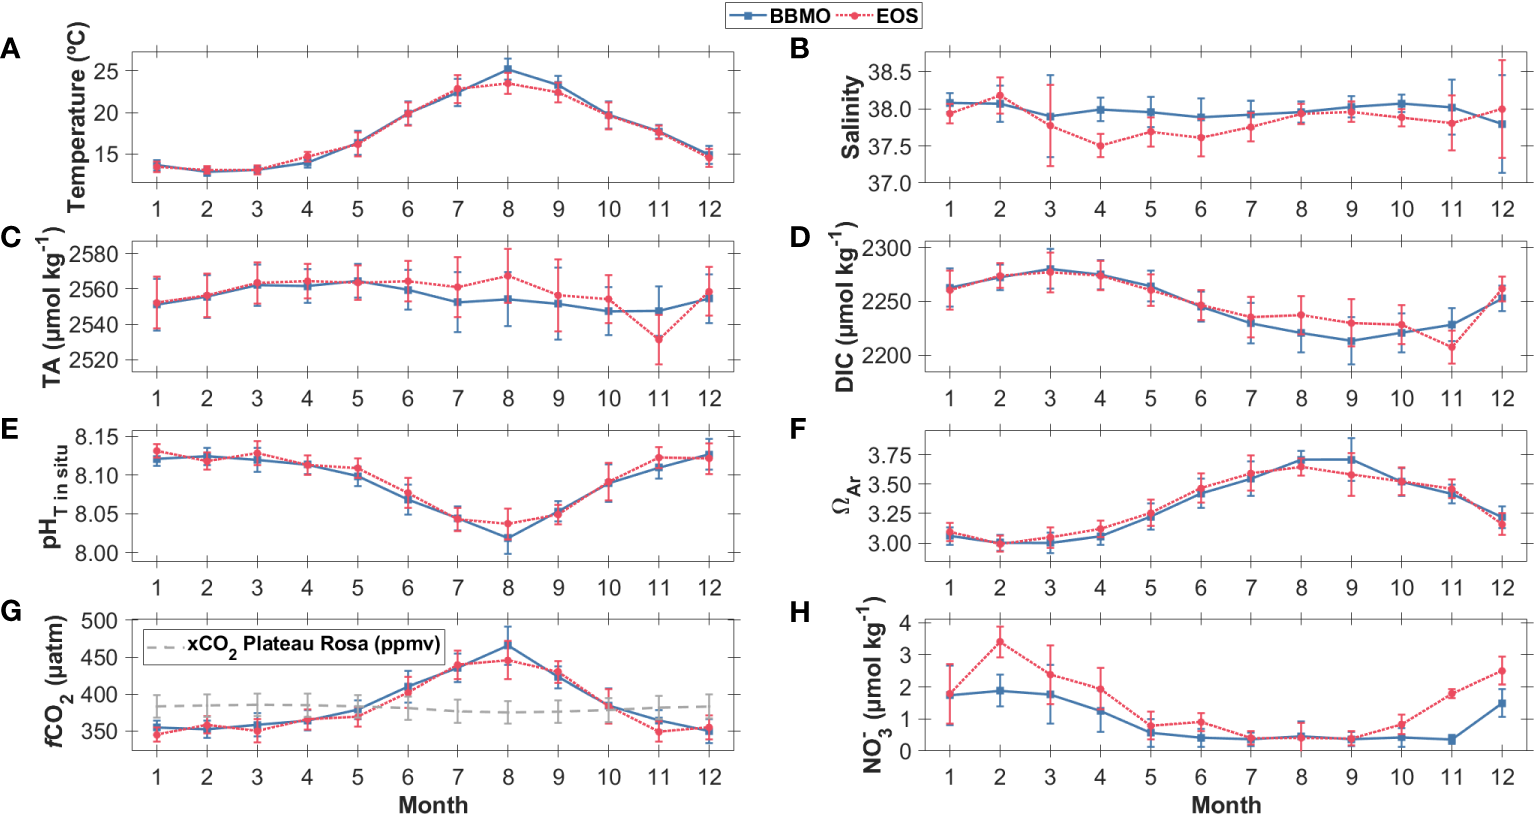
Monthly means (with standard deviation as error bars) of observations of (A) sea surface temperature (T; °C), (B) salinity, (C) total alkalinity (TA; µmol kg-1), (D) total dissolved inorganic carbon (DIC; µmol kg-1), (E) pH at in situ seawater conditions on the total hydrogen ion scale (pHT in situ), (F) aragonite saturation state (ΩAr), (G) carbon dioxide fugacity at in situ seawater conditions (fCO2; µatm) and atmospheric mole fraction of CO2 (xCO2; ppmv; grey; data from Plateau Rosa, Italy for 15/04/1993–15/12/2018; courtesy of the World Data Center for Greenhouse Gases; https://gaw.kishou.go.jp/), and (H) nitrate (NO3-; µmol kg-1) from the two coastal time-series, BBMO (blue squares; 2009-2022) and EOS (magenta circles; 2010-2019).
Surface salinity and TA present no clear seasonal cycle (Figures 2B, C), with values quite constant all year round, with annual average salinity values of 37.9 ± 0.3 and annual average TA values of 2557 ± 14 µmol kg-1. Salinity values have higher variability in March and December (Figure 3B).
Figure 3
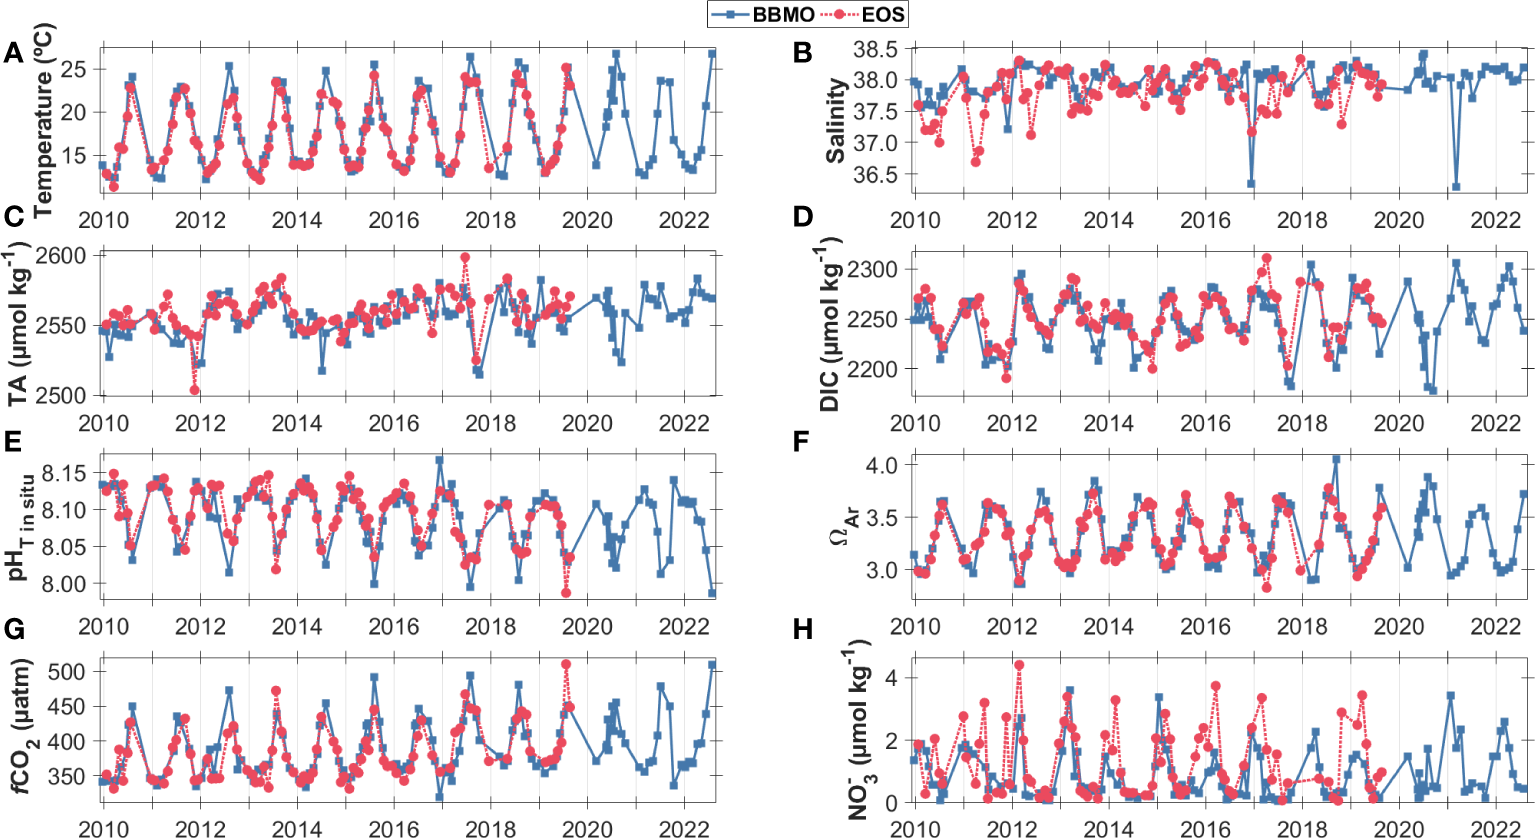
Observations of sea surface (A) temperature (T; °C), (B) salinity, (C) total alkalinity (TA; µmol kg-1), (D) total dissolved inorganic carbon (DIC; µmol kg-1), (E) pH at in situ seawater conditions on the total hydrogen ion scale (pHT in situ), (F) aragonite saturation state (ΩAr), (G) carbon dioxide fugacity at in situ seawater conditions (fCO2; µatm), and (H) nitrate (NO3-; µmol kg-1) from the two coastal time-series, BBMO (blue squares) and EOS (magenta asterisks).
Surface DIC presents maximum values of around 2280 µmol kg-1 in March in both time-series (Figure 2D). From that maximum, DIC decreases in spring-summer to minimum values of 2213 ± 22 µmol kg-1 (monthly mean ± standard deviation) reached in September at BBMO and of 2207 ± 21 µmol kg-1 reached in November at EOS.
Seasonal changes in surface pHT in situ, ΩAr, and fCO2 are mainly determined by temperature seasonality because the seasonality in the other variables controlling them (i.e., salinity, DIC, and TA) is relatively small compared to that in temperature (Figure 2). The temperature control on pHT in situ, ΩAr, and fCO2 seasonality leads to relatively low pHTin situand high ΩAr and fCO2 in summer, and relatively high pHTin situand low ΩAr and fCO2 in winter (Figures 2E–G). The two time-series sites behave as CO2 sinks during autumn, winter, and spring, and as CO2 sources during summer, when fCO2 surpasses atmospheric CO2 levels (Figure 2G).
In terms of dissolved inorganic nutrients, we show nitrate as the most representative dissolved inorganic nutrient (Figures 2H, 3H). Seasonality in nitrate content in surface waters is higher at EOS than BBMO but, at both sites, there is a maximum around February, with values decreasing into summer, where minimum concentrations are reached, and increasing during autumn.
3.2 Trends in the biogeochemical variables
We observed significant increases in sea surface temperature at both sites, with similar trends at BBMO (0.08 ± 0.02 °C yr-1) and at EOS (0.08 ± 0.04 °C yr-1) (Table 1). Sea surface salinity also increases significantly over time, with a three-times faster increase observed at EOS (0.040 ± 0.012 yr-1) than at BBMO (0.013 ± 0.006 yr-1) (Table 1). The TOATS-derived temperature trend detection time is 15.5 ± 2.5 years for BBMO and 9.3 ± 1.5 years for EOS, being EOS long enough (9.6 years) to detect statistically-significant trends in sea surface temperature, while BBMO may not be long enough (12.7 years) to detect the reported trend. The TOATS-derived salinity trend detection time is 19.3 ± 2.8 years for BBMO and 9.9 ± 2.1 years for EOS, indicating, therefore, that both time-series may not be long enough to detect those statistically significant trends. Although the trend detection times are sometimes longer than the length of our time-series, the sea surface temperature and salinity trends found in this study are statistically significant for both time-series (Table 1).
In terms of seawater carbonate system parameters, we observe that sea surface pHTin situdecreased significantly and at similar rates at BBMO, -0.0021 ± 0.0003 yr-1, and at EOS, -0.0028 ± 0.0005 yr-1 (Figure 4; Table 1). The TOATS-derived pHTin situtrend detection time is 9.7 ± 1.5 years for BBMO and 7.6 ± 1.8 years for EOS, being, therefore, both time-series long enough to detect those statistically significant trends.
Figure 4
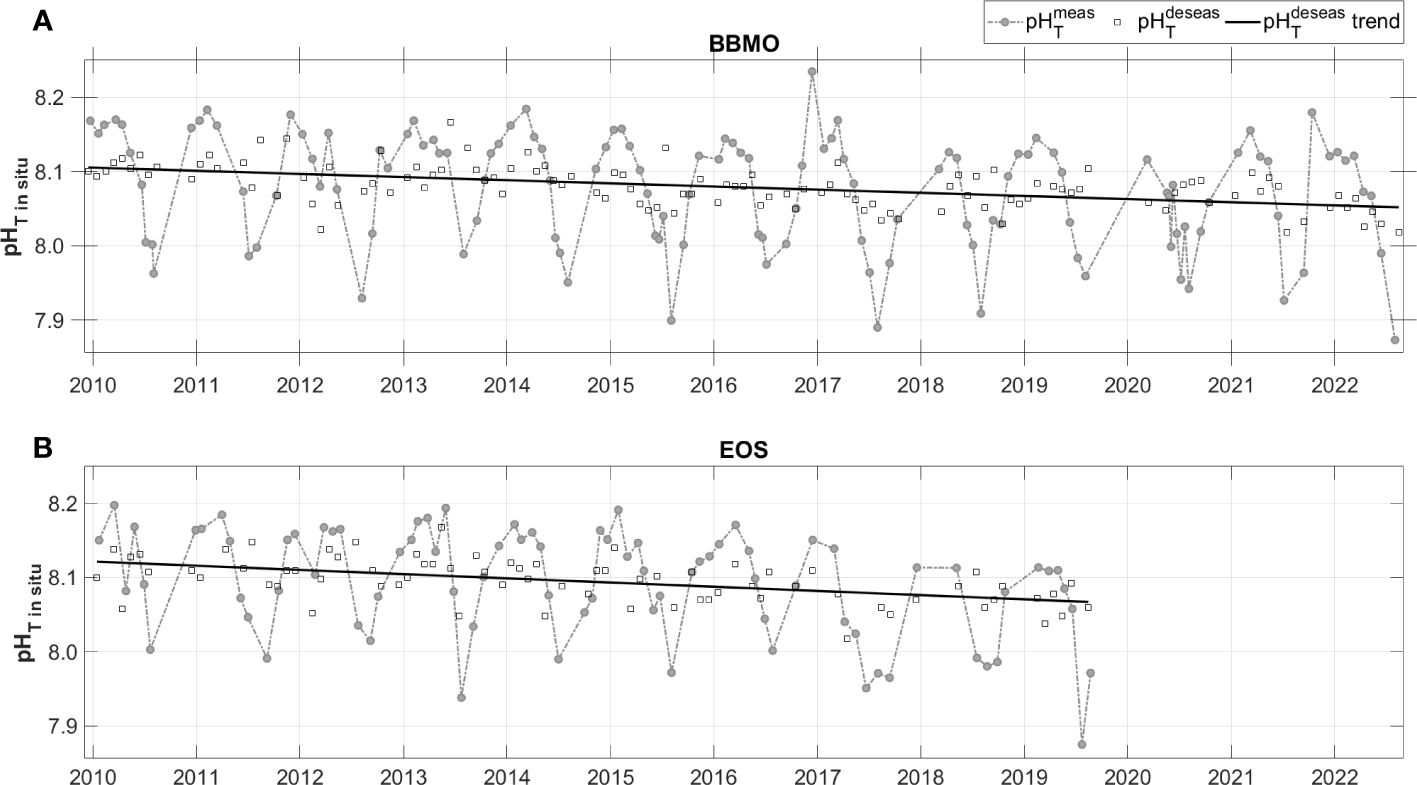
Sea surface pHTin situobservations (grey circles), de-seasoned monthly means of pHTin situ(black squares; using the using the Trends of Ocean Acidification Time Series (TOATS, https://github.com/NOAA-PMEL/TOATS; Sutton et al. (2022)) software), and pHTin situtrends from the de-seasoned dataset (values in Table 1) from the two coastal time-series, (A) BBMO and (B) EOS.
Significant increasing trends in sea surface TA, DIC, and fCO2 are observed with similar rates in both sites (Table 1). The TOATS-derived trend detection times for BBMO are 14 ± 3 years for DIC and TA and 9.4 ± 1.5 for fCO2, while for EOS they are 12 ± 3 years for DIC, 13 ± 3 years for TA, and 7.5 ± 1.7 for fCO2. Therefore, both time-series are long enough to detect statistically-significant trends in fCO2 but may not be long enough for detecting statistically-significant trends in DIC and TA. Despite the trend detection times, the reported trends in DIC and TA for both sites are statistically significant (Table 1). Sea surface ΩAr decreased at both sites, with the observed trend at EOS (-0.0051 ± 0.0041 yr-1) being more than three-times greater than that at BBMO (-0.0014 ± 0.0026 yr-1), although the trends are non-significant (Table 1). This is corroborated by the relatively long detection times for ΩAr, being 44.7 ± 6.6 years for BBMO and 16.6 ± 2.7 years for EOS.
In terms of dissolved inorganic nutrients, non-significant trends were detected for the studied time period, mainly because of the small long-term changes (not shown) compared to the natural variability (long-term changes were three orders of magnitude smaller than the seasonal amplitude), needing between 10–50 years of data to detect statistically-significant trends.
3.3 Drivers of ocean acidification trends
To investigate the drivers of the observed long-term changes in sea surface pHTin situat BBMO and EOS, we decomposed them into their principal underlying drivers: changes in temperature, salinity, DIC, and TA (Figure 5; Table 2). Variations in these drivers are the result of changes in ocean circulation and mixing, biological processes, as well as exchanges of heat, freshwater, and carbon with the atmosphere.
The estimated trends from the decomposition () agree with the observed pHTin situtrends (Figure 5; Table 2), thus indicating that the decomposition analyses accurately represent the observed trends. The predominant driver of the observed pHTin situdecreases was the increase in DIC, followed by sea surface warming. The observed fCO2 trends (2.4 ± 0.3 µmol kg-1 yr-1 at BBMO and 2.9 ± 0.6 µmol kg-1 yr-1 at EOS) agree with those exhibited by atmospheric CO2 (data from Plateau Rosa, Italy, for 2010–2018), which increased at 2.36 ± 0.03 ppmv yr-1 (r2 = 0.98; p-value < 0.01), therefore suggesting that the main driver of the changes in the inorganic carbon content at BBMO and EOS is the uptake of atmospheric CO2. Increases in TA played a major role in counteracting the pH decline. Assuming that the increase in TA was due to increases in carbonate alkalinity (bicarbonate and carbonate ions), then increases in bicarbonate and carbonate ions would contribute to both increases in TA and DIC, and we can sum their contributions to changes in pHT in situ. TA changes then counteracted 60% and 72% of the pHTin situdecrease linked to increasing DIC at EOS and BBMO, respectively. Once accounted for the neutralizing effect of the increase in TA, the observed rapid increase in sea surface temperature plays a larger role in the observed pHTin situdecreases (43% at EOS and 62% at BBMO) than the DIC increase related to anthropogenic CO2 (36% at EOS and 33% at BBMO, when the TA effect is removed).
Figure 5
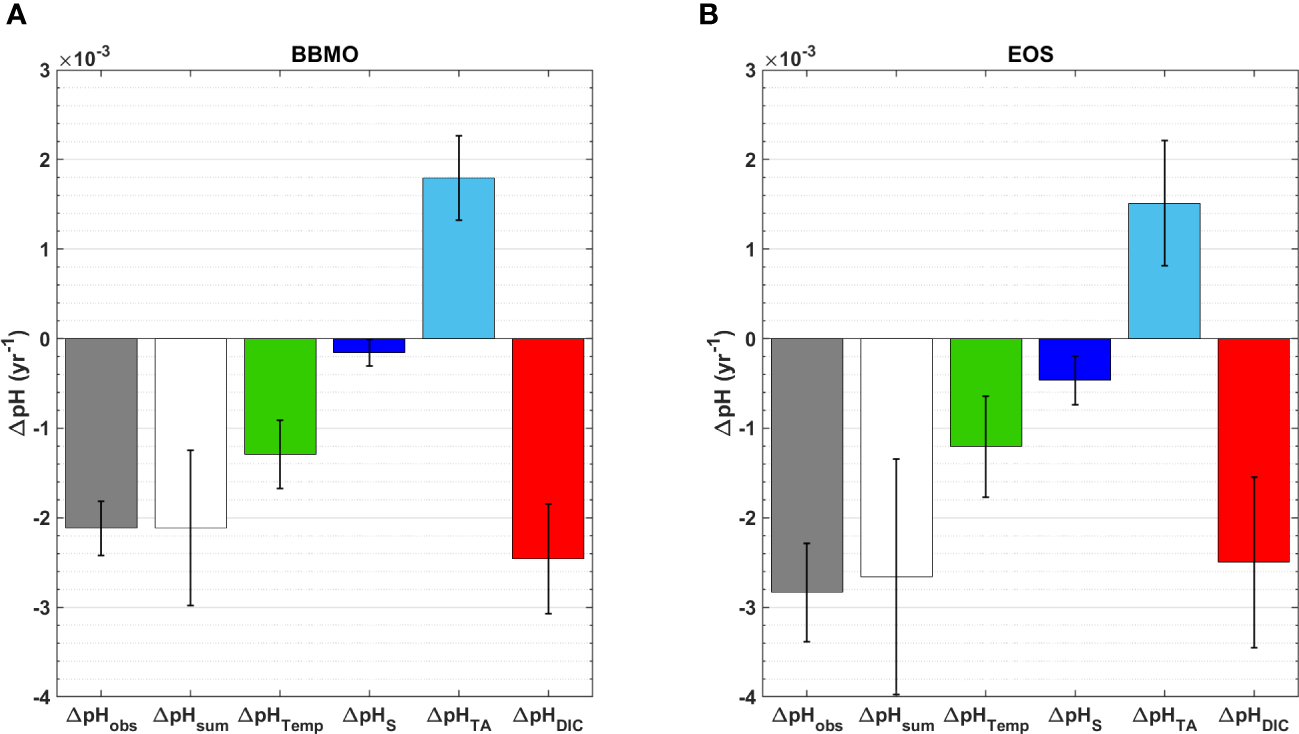
Decomposition of the observed long-term trends in sea surface pHTin situ(, grey; Table 1) into the contributions of their main drivers (values in Table 2) following García-Ibáñez et al. (2016): changes in sea surface temperature (, green), salinity (, navy), TA (, light blue), and DIC (, red) from the two coastal time-series, (A) BBMO and (B) EOS. The addition of the pHTin situchanges from each driver are also given (, white; Table 2). Trends reported in (x 10-3) yr-1 and error bars represent the standard error of the estimate.
4 Discussion
The two presented coastal time-series in the NW Mediterranean Sea, with continuous monthly data, allowed us to unravel the intricate feedbacks inherent to the carbon cycle, despite the considerable fluctuations often exhibited in coastal regions. This study, therefore, highlights the importance of sustaining continuous time-series observations to help us distinguish natural from human-induced changes, such as rising ocean temperatures or deoxygenation (e.g., Benway et al., 2019).
The two studied time-series exhibit similar seasonal dynamics and ocean acidification trends and drivers. Summer stratification (May to October; Guadayol et al., 2009; Aparicio et al., 2017; Zamanillo et al., 2021) leads to decreases in dissolved inorganic nutrients (Figure 2H) and DIC (Figure 2D), the latter exacerbated by CO2 outgassing associated with summer warming. Notably, BBMO experiences a more pronounced decrease in DIC and dissolved inorganic nutrients compared to EOS, likely attributable to wind patterns. The occurrence of “Garbins” (south-westerlies) triggers episodic upwelling events that transport deep waters from outside the platform (enriched in DIC and dissolved inorganic nutrients) to the time-series locations (Aparicio et al., 2017). Guadayol and Peters (2006) found that Garbins are more frequent and intense at Roses (nearby EOS) than at Malgrat (nearby BBMO), propitiating a greater impact of upwelling events replenishing the DIC and dissolved inorganic nutrient pools at EOS compared to BBMO. This would explain the more pronounced decrease in DIC and dissolved inorganic nutrients during summer at BBMO compared to EOS. The decrease in DIC observed during summer months would lead to an increase in pHTin situand a decrease in fCO2, but the increase in temperature during the stratification season leads to a net decrease in pHTin situ(Figure 2E) and a net increase in fCO2 (Figure 2G). Once the summer stratification is over, surface waters are replenished in DIC (Figure 2D) and dissolved inorganic nutrients (Figure 2H) from deeper layers.
Both time-series present quite homogeneous values of salinity and TA all year round (Figures 2B, C, 3B, C), with higher variability in March and December, where extreme precipitation events can sporadically lower salinity to values below 36.5 (Figure 3B). These extremes in salinity are not accompanied by extremes in TA (Figures 3B, C), most likely because the freshwater endmember in this region may have a relatively high TA content due to the limestone draining in part of the courses of the rivers and groundwaters in the area (Hartmann et al., 2015). This precludes the detection of relationships between TA and salinity, at least with the frequency of sampling of our dataset.
The decreasing trends in sea surface pHTin situfound at BBMO and EOS (Table 1) agree with other published time-series in the Mediterranean Sea. Specifically, the observed pHTin situtrends at EOS are very similar to those reported for the coastal time-series Point B (-0.0028 ± 0.0003 yr-1 for 2007–2015; Kapsenberg et al., 2017) and the open-ocean time-series DYFAMED (-0.003 ± 0.001 yr-1 for 1995–2001; Marcellin Yao et al., 2016), both in the NW Mediterranean Sea. Our sea surface pHTin situtrends also agree with trends computed for pHT at 25 °C in the Mediterranean Sea, such as those reported for the northern Adriatic Sea (-0.0025 yr-1 for 1983–2008; Luchetta et al., 2010) and the Strait of Gibraltar (-0.0030 ± 0.0003 yr-1 for 2005–2021; Amaya-Vías et al., 2023). These pH trends reported at a constant temperature would most likely be larger if the trends were assessed at in situ conditions, due to the warming trends observed in the Mediterranean Sea (e.g., Salat et al., 2019) that contribute to ocean acidification (as shown in Kapsenberg et al. (2017)). The sea surface pHTin situtrends reported here also agree with other sea surface pH trends reported in open ocean waters elsewhere (Bates et al., 2014; Lauvset et al., 2015; González-Dávila and Santana-Casiano, 2023), thus indicating that EOS and BBMO time-series may reflect regional as well as global ocean acidification signals despite being coastal sites.
The rapid warming of the Mediterranean Sea contributes to the acidification of its waters, increasing the ocean acidification signal derived from the CO2 uptake. This is corroborated by our results (Figure 5; Table 2), which go in line with those reported for the coastal time-series Point B (Kapsenberg et al., 2017), being changes in DIC and temperature the main drivers of the observed sea surface pH changes at these three coastal time-series in the NW Mediterranean Sea (EOS, BBMO, and Point B). However, the trends in each of the drivers do not completely coincide. While the sea surface temperature trends observed at EOS and BBMO (Figure 5; Table 1) agree with those observed at Point B (0.072 ± 0.022 °C yr-1), the trends in DIC and TA at Point B are twice as high as those observed at our coastal time-series sites. Additionally, there are contrasting trends in sea surface salinity, where Point B shows a non-statistically significant decrease while BBMO and EOS exhibit a statistically-significant increase. Regarding TA, Kapsenberg et al. (2017) remarked that their changes were faster than those attributable to direct effects of seawater CO2 uptake, and they suggested that this could be related to increasing limestone weathering. Within our dataset, some TA rises could potentially link to increases in salinity (as shown in Table 1). This suggests that the observed TA increases at EOS and BBMO might relate to increased evaporation and/or reduced river and precipitation.
The ability to remove seasonal patterns from the datasets depends on how comprehensively the dataset covers the entire seasonal cycle. Essentially, the duration of the time-series needed to identify a human-induced trend depends on the level of natural variability present within the signal. In the case of pH in coastal systems, this requires nearly a decade or longer of data before a trend emerges from the noise (Sutton et al., 2019; Turk et al., 2019). To investigate how representative our observed trends in sea surface pH are at EOS and BBMO, we compared trends with those derived from the OceanSODA-ETHZ product (Gregor and Gruber, 2021), which is an observation-based, global gridded product with monthly surface data for all parameters of the seawater carbonate system at a resolution of 1° × 1° derived from the pCO2 observations from the Surface Ocean CO2 ATlas (SOCAT; Bakker et al., 2016) and the TA observations from the Global Ocean Data Analysis Product (GLODAP; Olsen et al., 2016). This product produced rates of pH change in agreement with those reported in time-series around the globe (Ma et al., 2023). The version used here was v2023, which expands from 1982 to 2022. The grids selected for our study were those centered at 42.50°N 3.50°E (for EOS) and 41.50°N 2.50°E (for BBMO). The OceanSODA-ETHZ product reproduces the observed seasonal cycle at our sites, but does not reproduce the seasonal amplitude of our observations (Supplementary Figure 1). The pHTin situtrends from the de-seasoned OceanSODA-ETHZ product are similar for both sites (-0.0020 ± 0.0001 yr-1 for BBMO and -0.0021 ± 0.0001 yr-1 for EOS; Supplementary Figures 2A, B black symbols). These pHTin situtrends do not change if we shorten the time period to match the length of our time-series (Supplementary Figures 2A, B red symbols). The pHTin situtrend from the de-seasoned OceanSODA-ETHZ product agrees with that obtained with the BBMO dataset, while for EOS it is slightly lower. Ma et al. (2023) previously noted that pH trends from OceanSODA-ETHZ cannot reproduce those obtained in short (< 30 years) time-series. However, it was already reported that the stronger ocean acidification trends observed toward the coast are not captured by the synthesis and modeling products (McGovern et al., 2022).
To test the capacity of our EOS dataset to resolve long-term trends, we compared our sea surface temperature trends for 2010–2019 at EOS with those resulting from the EOS sea surface temperature dataset for 1974–2018 (Pascual and Salat, 2019). For 1974–2018, sea surface temperature at EOS increased at a rate of 0.032°C yr-1 (Supplementary Figure 2C black symbols), which is the same trend that Salat et al. (2019) reported after de-seasoning the dataset using the Bates et al. (2014) approach. When we use the information from the entire dataset (1974–2018) to de-season the dataset and then compute the sea surface temperature trend for 2010–2018, there is no difference from the trend for 1974–2018 (details not shown). However, if we reduce the period to de-season the dataset to 2010–2018, the trend changes to 0.13 ± 0.03°C yr-1 (Supplementary Figure 2C red symbols), which agrees with the trend in sea surface temperature found in this study. This therefore indicates that our studied time period for EOS may be too short to produce robust long-term trends.
5 Conclusions
We characterized the seasonality and long-term changes of the seawater carbonate system in the surface waters of two coastal time-series in the NW Mediterranean Sea, EOS and BBMO. Despite EOS being more offshore and near a natural reserve and BBMO being close to a harbor area, the two sites present similar seasonal dynamics and ocean acidification trends and drivers, suggesting that these changes are mainly determined by changes in temperature and the interplay between seasonal stratification/mixing that are common to both sites, and not by more local processes that could have differing effects at the two locations.
The observed sea surface pHTin situtrends at BBMO (-0.0021 ± 0.0003 yr-1; 22/12/2009–02/08/2022) and EOS (-0.0028 ± 0.0005 yr-1; 22/01/2010–23/08/2019) agree with other ocean acidification trends reported for coastal and open ocean time-series in the Mediterranean Sea and open ocean waters of the global ocean, therefore indicating that these coastal time-series are representative of global ocean acidification signals.
The observed decreases in sea surface pHTin situare caused by increases in DIC (related to anthropogenic CO2 uptake) and sea surface temperature. Once accounted for the neutralizing effect of the observed increase in TA (counteracting 60% and 72% of the influence of increasing DIC at EOS and BBMO, respectively), the rapid sea surface warming plays a larger role in the observed pHTin situdecreases (43% at EOS and 62% at BBMO) than the DIC increase (36% at EOS and 33% at BBMO, when the TA effect is removed).
Future climate-related changes, such as rising temperatures or deoxygenation (Gruber, 2011), are expected to complicate the detection of future changes in seawater carbonate chemistry attributable to the atmospheric CO2 increase. Maintaining time-series of ocean carbon data is therefore crucial for assessing seasonal dynamics, annual budgets, and interannual and climatic variability (Tanhua et al., 2013; Vance et al., 2022), as they provide essential information to disentangle the complex interplay of climate-related physical, chemical, and biological feedbacks within the carbon cycle. Emergent climate trends can generally be identified earlier with more frequent measurements, particularly for systems that are highly variable on shorter timescales, like coastal regions. Despite the considerable spatiotemporal fluctuations in coastal regions, our dataset derived from the two presented coastal time-series, covering monthly data collected over 9.6–12.7 years, already reveals robust trends in ocean acidification comparable to those reported in open ocean time-series, offering valuable insights that allow unravelling the complex interplay of climate-induced physical and chemical feedbacks inherent to the carbon cycle. Although our dataset may not provide a complete overview due to the influence of short-term variability on long-term signals, our study nevertheless emphasizes the importance of long-term time-series for evaluating anthropogenic changes.
Statements
Data availability statement
The datasets presented in this study can be found in online repositories. The names of the repository/repositories and accession number(s) can be found below: https://doi.org/10.20350/digitalCSIC/16070.
Author contributions
MIG-I: Conceptualization, Data curation, Formal analysis, Investigation, Methodology, Visualization, Writing – original draft, Writing – review & editing. EG: Data curation, Formal analysis, Writing – review & editing. AL: Data curation, Formal analysis, Writing – review & editing. JP: Project administration, Resources, Writing – review & editing. JG: Funding acquisition, Project administration, Resources, Writing – review & editing. CM: Funding acquisition, Project administration, Resources, Writing – review & editing. EC: Funding acquisition, Project administration, Resources, Writing – review & editing. CP: Funding acquisition, Project administration, Resources, Writing – review & editing.
Funding
The author(s) declare financial support was received for the research, authorship, and/or publication of this article. This research was funded by the European Union – NextGeneration EU – as part of the MITECO program for the Spanish Recovery, Transformation and Resilience Plan (Recovery and Resilience Facility of the European Union established by the Regulation (EU) 2020/2094), entrusted to CSIC, AZTI, SOCIB, and the universities of Vigo and Cadiz. Sampling has been funded by multiple projects of the Spanish Ministry of Science, Innovation and Universities throughout the studied period, including the active project ESCACS (PID2021-122451OB-I00). Financial and institutional support was also received from the Catalan Government (Research Group on Marine Biogeochemistry and Global Change, 2021SGR00430) and from the ‘Severo Ochoa Centre of Excellence’ (CEX2019-000928-S) funded by AEI 10.13039/501100011033, which included a postdoctoral contract to MG-I.
Acknowledgments
Thanks are due to Juancho Movilla, Pilar Fernández-Vallejo, and Àngel López-Sanz for technical support during the earlier measurements of the two time-series. Atmospheric CO2 data from Plateau Rosa were collected by Ricerca sul Sistema Energetico (RSE S.p.A.); we are grateful for their contribution.
Conflict of interest
The authors declare that the research was conducted in the absence of any commercial or financial relationships that could be construed as a potential conflict of interest.
Publisher’s note
All claims expressed in this article are solely those of the authors and do not necessarily represent those of their affiliated organizations, or those of the publisher, the editors and the reviewers. Any product that may be evaluated in this article, or claim that may be made by its manufacturer, is not guaranteed or endorsed by the publisher.
Supplementary material
The Supplementary Material for this article can be found online at: https://www.frontiersin.org/articles/10.3389/fmars.2024.1348133/full#supplementary-material
References
1
Álvarez M. Sanleón-Bartolomé H. Tanhua T. Mintrop L. Luchetta A. Cantoni C. et al . (2014). The CO2 system in the Mediterranean Sea: a basin wide perspective. Ocean Sci.10, 69–92. doi: 10.5194/os-10-69-2014
2
Amaya-Vías S. Flecha S. Pérez F. F. Navarro G. García-Lafuente J. Makaoui A. et al . (2023). The time series at the Strait of Gibraltar as a baseline for long-term assessment of vulnerability of calcifiers to ocean acidification. Front. Mar. Sci.10. doi: 10.3389/fmars.2023.1196938
3
Andersson A. J. Gledhill D. (2013). Ocean acidification and coral reefs: effects on breakdown, dissolution, and net ecosystem calcification. Annu. Rev. Mar. Sci.5, 321–348. doi: 10.1146/annurev-marine-121211-172241
4
Aparicio F. L. Nieto-Cid M. Calvo E. Pelejero C. López-Sanz À. Pascual J. et al . (2017). Wind-induced changes in the dynamics of fluorescent organic matter in the coastal NW Mediterranean. Sci. Total Environ.609, 1001–1012. doi: 10.1016/j.scitotenv.2017.07.170
5
Bakker D. C. E. Pfeil B. Landa C. S. Metzl N. O’Brien K. M. Olsen A. et al . (2016). A multi-decade record of high-quality fCO2 data in version 3 of the Surface Ocean CO2 Atlas (SOCAT). Earth Syst. Sci. Data8, 383–413. doi: 10.5194/essd-8-383-2016
6
Bates N. Astor Y. Church M. Currie K. Dore J. González-Dávila M. et al . (2014). A time-series view of changing ocean chemistry due to ocean uptake of anthropogenic CO2 and ocean acidification. Oceanography27, 126–141. doi: 10.5670/oceanog.2014.16
7
Benway H. M. Lorenzoni L. White A. E. Fiedler B. Levine N. M. Nicholson D. P. et al . (2019). Ocean time series observations of changing marine ecosystems: an era of integration, synthesis, and societal applications. Front. Mar. Sci.6. doi: 10.3389/fmars.2019.00393
8
Bethoux J. P. Gentili B. Morin P. Nicolas E. Pierre C. Ruiz-Pino D. (1999). The Mediterranean Sea: a miniature ocean for climatic and environmental studies and a key for the climatic functioning of the North Atlantic. Prog. Oceanogr.44, 131–146. doi: 10.1016/S0079-6611(99)00023-3
9
Cai W. J. Feely R. A. Testa J. M. Li M. Evans W. Alin S. R. et al . (2021). Natural and anthropogenic drivers of acidification in large estuaries. Annu. Rev. Mar. Sci.13, 23–55. doi: 10.1146/annurev-marine-010419-011004
10
Cai J. Ni J. Chen Z. Wu S. Wu R. He C. et al . (2023). Effects of ocean acidification and eutrophication on the growth and photosynthetic performances of a green tide alga Ulva prolifera. Front. Mar. Sci.10. doi: 10.3389/fmars.2023.1145048
11
Cai W.-J. Wang Y. Hodson R. E. (1998). Acid-base properties of dissolved organic matter in the estuarine waters of Georgia, USA. Geochim. Cosmochim. Acta62, 473–483. doi: 10.1016/S0016-7037(97)00363-3
12
Cai W.-J. Xu Y.-Y. Feely R. A. Wanninkhof R. Jönsson B. Alin S. R. et al . (2020). Controls on surface water carbonate chemistry along North American ocean margins. Nat. Commun.11, 2691. doi: 10.1038/s41467-020-16530-z
13
Carstensen J. Duarte C. M. (2019). Drivers of pH variability in coastal ecosystems. Environ. Sci. Technol.53, 4020–4029. doi: 10.1021/acs.est.8b03655
14
Clayton T. D. Byrne R. H. (1993). Spectrophotometric seawater pH measurements: total hydrogen ion concentration scale calibration of m-cresol purple and at-sea results. Deep Sea Res. Part Oceanogr. Res. Pap.40, 2115–2129. doi: 10.1016/0967-0637(93)90048-8
15
Dai M. Su J. Zhao Y. Hofmann E. E. Cao Z. Cai W.-J. et al . (2022). Carbon fluxes in the coastal ocean: synthesis, boundary processes, and future trends. Annu. Rev. Earth Planet. Sci.50, 593–626. doi: 10.1146/annurev-earth-032320-090746
16
Dickson A. G. (1990). Thermodynamics of the dissociation of boric acid in synthetic seawater from 273.15 to 318.15 K. Deep Sea Res. Part Oceanogr. Res. Pap.37, 755–766. doi: 10.1016/0198-0149(90)90004-F
17
Dickson A. G. Sabine C. L. Christian J. R. (2007). Guide to best practices for ocean CO2 measurements (Canada: PICES Special Publication).
18
Doney S. C. Busch D. S. Cooley S. R. Kroeker K. J. (2020). The impacts of ocean acidification on marine ecosystems and reliant human communities. Annu. Rev. Environ. Resour.45, 83–112. doi: 10.1146/annurev-environ-012320-083019
19
Doney S. C. Fabry V. J. Feely R. A. Kleypas J. A. (2009). Ocean acidification: the other CO2 problem. Annu. Rev. Mar. Sci.1, 169–192. doi: 10.1146/annurev.marine.010908.163834
20
Duarte C. M. Hendriks I. E. Moore T. S. Olsen Y. S. Steckbauer A. Ramajo L. et al . (2013a). Is ocean acidification an open-ocean syndrome? Understanding anthropogenic impacts on seawater pH. Estuaries Coasts36, 221–236. doi: 10.1007/s12237-013-9594-3
21
Duarte C. M. Losada I. J. Hendriks I. E. Mazarrasa I. Marbà N. (2013b). The role of coastal plant communities for climate change mitigation and adaptation. Nat. Clim. Change3, 961–968. doi: 10.1038/nclimate1970
22
Friedlingstein P. Jones M. W. O’Sullivan M. Andrew R. M. Bakker D. C. E. Hauck J. et al . (2022). Global carbon budget 2021. Earth Syst. Sci. Data14, 1917–2005. doi: 10.5194/essd-14-1917-2022
23
García-Ibáñez M. I. Zunino P. Fröb F. Carracedo L. I. Ríos A. F. Mercier H. et al . (2016). Ocean acidification in the subpolar North Atlantic: rates and mechanisms controlling pH changes. Biogeosciences13, 3701–3715. doi: 10.5194/bg-13-3701-2016
24
Gasol J. M. Massana R. Simó R. Marrasé C. Acinas S. G. Pedrós-Alió C. (2012). “Blanes bay (site 55),” in 2012. ICES phytoplankton and microbial plankton status report 2009/2010. ICES cooperative research report no. 313. Eds. O’BrienT. D.LiW. K. W.MoránX. A. G. (Denmark: International Council for the Exploration of the Sea), 131–141.
25
Gattuso J.-P. Magnan A. Billé R. Cheung W. W. L. Howes E. L. Joos F. et al . (2015). Contrasting futures for ocean and society from different anthropogenic CO2 emissions scenarios. Science349, aac4722. doi: 10.1126/science.aac4722
26
Giorgi F. (2006). Climate change hot-spots. Geophys. Res. Lett.33, L08707. doi: 10.1029/2006GL025734
27
González-Dávila M. Santana-Casiano J. M. (2023). Long-term trends of pH and inorganic carbon in the Eastern North Atlantic: the ESTOC site. Front. Mar. Sci.10. doi: 10.3389/fmars.2023.1236214
28
Gregor L. Gruber N. (2021). OceanSODA-ETHZ: a global gridded data set of the surface ocean carbonate system for seasonal to decadal studies of ocean acidification. Earth Syst. Sci. Data13, 777–808. doi: 10.5194/essd-13-777-2021
29
Gruber N. (2011). Warming up, turning sour, losing breath: ocean biogeochemistry under global change. Philos. Trans. R. Soc Math. Phys. Eng. Sci.369, 1980–1996. doi: 10.1098/rsta.2011.0003
30
Gruber N. Clement D. Carter B. R. Feely R. A. van Heuven S. Hoppema M. et al . (2019). The oceanic sink for anthropogenic CO2 from 1994 to 2007. Science363, 1193–1199. doi: 10.1126/science.aau5153
31
Guadayol O. Peters F. (2006). Analysis of wind events in a coastal area: a tool for assessing turbulence variability for studies on plankton. Sci. Mar.70, 9–20. doi: 10.3989/scimar.2006.70n19
32
Guadayol Ò. Peters F. Marrasé C. Gasol J. M. Roldán C. Berdalet E. et al . (2009). Episodic meteorological and nutrient-load events as drivers of coastal planktonic ecosystem dynamics: a time-series analysis. Mar. Ecol. Prog. Ser.381, 139–155. doi: 10.3354/meps07939
33
Hansen H. P. Grassof K. (1983). Automated chemical analysis, in: Methods of Seawater Analysis. 2nd Edition. Eds. GrassofK.EhrhardtM.KremlingK. (Wheinheim: Verlag Chemie), 347–395.
34
Hartmann A. Gleeson T. Rosolem R. Pianosi F. Wada Y. Wagener T. (2015). A large-scale simulation model to assess karstic groundwater recharge over Europe and the Mediterranean. Geosci. Model. Dev.8, 1729–1746. doi: 10.5194/gmd-8-1729-2015
35
Hassoun A. E. R. Bantelman A. Canu D. Comeau S. Galdies C. Gattuso J.-P. et al . (2022). Ocean acidification research in the Mediterranean Sea: Status, trends and next steps. Front. Mar. Sci.9. doi: 10.3389/fmars.2022.892670
36
Hofmann G. E. Smith J. E. Johnson K. S. Send U. Levin L. A. Micheli F. et al . (2011). High-frequency dynamics of ocean pH: A multi-ecosystem comparison. PloS One6, e28983. doi: 10.1371/journal.pone.0028983
37
Kapsenberg L. Alliouane S. Gazeau F. Mousseau L. Gattuso J.-P. (2017). Coastal ocean acidification and increasing total alkalinity in the northwestern Mediterranean Sea. Ocean Sci.13, 411–426. doi: 10.5194/os-13-411-2017
38
Kroeker K. J. Kordas R. L. Crim R. Hendriks I. E. Ramajo L. Singh G. S. et al . (2013). Impacts of ocean acidification on marine organisms: quantifying sensitivities and interaction with warming. Glob. Change Biol.19, 1884–1896. doi: 10.1111/gcb.12179
39
Kwiatkowski L. Orr J. C. (2018). Diverging seasonal extremes for ocean acidification during the twenty-first century. Nat. Clim. Change8, 141–145. doi: 10.1038/s41558-017-0054-0
40
Lauvset S. K. Gruber N. Landschützer P. Olsen A. Tjiputra J. (2015). Trends and drivers in global surface ocean pH over the past 3 decades. Biogeosciences12, 1285–1298. doi: 10.5194/bg-12-1285-2015
41
Lee K. Kim T.-W. Byrne R. H. Millero F. J. Feely R. A. Liu Y.-M. (2010). The universal ratio of boron to chlorinity for the North Pacific and North Atlantic oceans. Geochim. Cosmochim. Acta74, 1801–1811. doi: 10.1016/j.gca.2009.12.027
42
Lee K. Sabine C. L. Tanhua T. Kim T.-W. Feely R. A. Kim H.-C. (2011). Roles of marginal seas in absorbing and storing fossil fuel CO2. Energy Environ. Sci.4, 1133–1146. doi: 10.1039/C0EE00663G
43
Lejeusne C. Chevaldonné P. Pergent-Martini C. Boudouresque C. F. Pérez T. (2010). Climate change effects on a miniature ocean: the highly diverse, highly impacted Mediterranean Sea. Trends Ecol. Evol.25, 250–260. doi: 10.1016/j.tree.2009.10.009
44
Luchetta A. Cantoni C. Catalano G. (2010). New observations of CO2-induced acidification in the northern Adriatic Sea over the last quarter century. Chem. Ecol.26, 1–17. doi: 10.1080/02757541003627688
45
Lueker T. J. Dickson A. G. Keeling C. D. (2000). Ocean pCO2 calculated from dissolved inorganic carbon, alkalinity, and equations for K1 and K2: validation based on laboratory measurements of CO2 in gas and seawater at equilibrium. Mar. Chem.70, 105–119. doi: 10.1016/S0304-4203(00)00022-0
46
Ma D. Gregor L. Gruber N. (2023). Four decades of trends and drivers of global surface ocean acidification. Glob. Biogeochem. Cycles37, e2023GB007765. doi: 10.1029/2023GB007765
47
Marcellin Yao K. Marcou O. Goyet C. Guglielmi V. Touratier F. Savy J.-P. (2016). Time variability of the north-western Mediterranean Sea pH over 1995–2011. Mar. Environ. Res.116, 51–60. doi: 10.1016/j.marenvres.2016.02.016
48
Margalef R. (1945). Fitoplancton nerítico de la Costa Brava catalana (Sector de Blanes) (Barcelona: Instituto Español de Estudios Mediterráneos).
49
Martínez J. García-Ladona E. Ballabrera-Poy J. Isern-Fontanet J. González-Motos S. Allegue J. M. et al . (2022). Atlas of surface currents in the Mediterranean and Canary–Iberian–Biscay waters. J. Oper. Oceanogr.0, 1–23. doi: 10.1080/1755876X.2022.2102357
50
McGovern E. Schilder J. Artioli Y. Birchenough S. Dupont S. Findlay H. et al . (2022). “Ocean acidification,” in OSPAR 2023: the 2023 quality status report for the north-east atlantic (London: OSPAR Commission). Available at: https://Oap.Ospar.Org/En/Ospar-Assessments/Quality-Status-Reports/Qsr-2023/Other-Assessments/Ocean-Acidification.
51
Mehrbach C. Culberson C. H. Hawley J. E. Pytkowicz R. M. (1973). Measurement of the apparent dissociation constants of carbonic acid in seawater at atmospheric pressure. Limnol. Oceanogr.18, 897–907. doi: 10.4319/lo.1973.18.6.0897
52
Millot C. (1999). Circulation in the western mediterranean sea. J. Mar. Syst.20, 423–442. doi: 10.1016/S0924-7963(98)00078-5
53
Mintrop L. Pérez F. F. González-Dávila M. Santana-Casiano J. M. Körtzinger A. (2000). Alkalinity determination by potentiometry: Intercalibration using three different methods. Cienc. Mar.26, 23–37. doi: 10.7773/cm.v26i1.573
54
Mostofa K. M. G. Liu C.-Q. Zhai W. Minella M. Vione D. Gao K. et al . (2016). Reviews and Syntheses: Ocean acidification and its potential impacts on marine ecosystems. Biogeosciences13, 1767–1786. doi: 10.5194/bg-13-1767-2016
55
Olsen A. Key R. M. van Heuven S. Lauvset S. K. Velo A. Lin X. et al . (2016). The Global Ocean Data Analysis Project version 2 (GLODAPv2) – an internally consistent data product for the world ocean. Earth Syst. Sci. Data8, 297–323. doi: 10.5194/essd-8-297-2016
56
Orr J. C. Epitalon J.-M. Dickson A. G. Gattuso J.-P. (2018). Routine uncertainty propagation for the marine carbon dioxide system. Mar. Chem.207, 84–107. doi: 10.1016/j.marchem.2018.10.006
57
Palmiéri J. Orr J. C. Dutay J.-C. Béranger K. Schneider A. Beuvier J. et al . (2015). Simulated anthropogenic CO2 storage and acidification of the Mediterranean Sea. Biogeosciences12, 781–802. doi: 10.5194/bg-12-781-2015
58
Pascual J. Salat J. (2019). Oceanographic and meteorological observations from L’Estartit meteorological and oceanographical station in the NW Mediterranean. doi: 10.1594/PANGAEA.902591
59
Pérez F. F. Fraga F. (1987). A precise and rapid analytical procedure for alkalinity determination. Mar. Chem.21, 169–182. doi: 10.1016/0304-4203(87)90037-5
60
Rhein M. Rintoul S. R. Aoki S. Campos E. Chambers D. Feely R. A. et al . (2013). “Observations: ocean,” in Climate change 2013: the physical science basis. Contribution of working group I to the fifth assessment report of the intergovernmental panel on climate change. Eds. StockerT. F.QinD.PlattnerG.-K.TignorM.AllenS. K.BoschungJ.NauelsA.XiaY.BexV.MidgleyP. M. (Cambridge, United Kingdom and New York, NY, USA: Cambridge University Press), 255–316. Cambridge University Press, Cambridge, United Kingdom and New York, NY, USA.
61
Riebesell U. Zondervan I. Rost B. Tortell P. D. Zeebe R. E. Morel F. M. M. (2000). Reduced calcification of marine plankton in response to increased atmospheric CO2. Nature407, 364. doi: 10.1038/35030078
62
Ríos A. F. Resplandy L. García-Ibáñez M. I. Fajar N. M. Velo A. Padin X. A. et al . (2015). Decadal acidification in the water masses of the Atlantic Ocean. Proc. Natl. Acad. Sci. U.S.A.112, 9950–9955. doi: 10.1073/pnas.1504613112
63
Salat J. Pascual J. Flexas M. Chin T. M. Vazquez-Cuervo J. (2019). Forty-five years of oceanographic and meteorological observations at a coastal station in the NW Mediterranean: a ground truth for satellite observations. Ocean Dyn.69, 1067–1084. doi: 10.1007/s10236-019-01285-z
64
Schneider A. Tanhua T. Körtzinger A. Wallace D. W. R. (2010). High anthropogenic carbon content in the eastern Mediterranean. J. Geophys. Res. Oceans115, C12050. doi: 10.1029/2010JC006171
65
Sharp J. D. Pierrot D. Humphreys M. P. Epitalon J.-M. Orr J. C. Lewis E. R. et al . (2021). CO2SYSv3 for MATLAB. Zenodo (v3.2.0). doi: 10.5281/ZENODO.4774718
66
Sutton A. J. Battisti R. Carter B. Evans W. Newton J. Alin S. et al . (2022). Advancing best practices for assessing trends of ocean acidification time series. Front. Mar. Sci.9. doi: 10.3389/fmars.2022.1045667
67
Sutton A. J. Feely R. A. Maenner-Jones S. Musielwicz S. Osborne J. Dietrich C. et al . (2019). Autonomous seawater pCO2 and pH time series from 40 surface buoys and the emergence of anthropogenic trends. Earth Syst. Sci. Data11, 421–439. doi: 10.5194/essd-11-421-2019
68
Tanhua T. Bates N. R. Körtzinger A. (2013). “The marine carbon cycle and ocean carbon inventories,” in Ocean circulation and climate — A 21st century perspective, international geophysics (London: Elsevier), 787–815.
69
Turk D. Wang H. Hu X. Gledhill D. K. Wang Z. A. Jiang L. et al . (2019). Time of emergence of surface ocean carbon dioxide trends in the North American Coastal Margins in support of Ocean acidification observing system design. Front. Mar. Sci.6. doi: 10.3389/fmars.2019.00091
70
Vance J. M. Currie K. Zeldis J. Dillingham P. W. Law C. S. (2022). An empirical MLR for estimating surface layer DIC and a comparative assessment to other gap-filling techniques for ocean carbon time series. Biogeosciences19, 241–269. doi: 10.5194/bg-19-241-2022
71
Zamanillo M. Ortega-Retuerta E. Cisternas-Novoa C. Marrasé C. Pelejero C. Pascual J. et al . (2021). Uncoupled seasonal variability of transparent exopolymer and Coomassie stainable particles in coastal Mediterranean waters: insights into sources and driving mechanisms. Elem. Sci. Anthr.9, 165. doi: 10.1525/elementa.2020.00165
Summary
Keywords
ocean acidification, Mediterranean Sea, time series, seawater pH, ocean warming
Citation
García-Ibáñez MI, Guallart EF, Lucas A, Pascual J, Gasol JM, Marrasé C, Calvo E and Pelejero C (2024) Two new coastal time-series of seawater carbonate system variables in the NW Mediterranean Sea: rates and mechanisms controlling pH changes. Front. Mar. Sci. 11:1348133. doi: 10.3389/fmars.2024.1348133
Received
01 December 2023
Accepted
22 January 2024
Published
09 February 2024
Volume
11 - 2024
Edited by
Abed El Rahman Hassoun, Helmholtz Association of German Research Centres (HZ), Germany
Reviewed by
Carla F. Berghoff, Ministerio de Agricultura, Ganadería y Pesca, Argentina
Wiley Evans, Hakai Institute, Canada
Updates
Copyright
© 2024 García-Ibáñez, Guallart, Lucas, Pascual, Gasol, Marrasé, Calvo and Pelejero.
This is an open-access article distributed under the terms of the Creative Commons Attribution License (CC BY). The use, distribution or reproduction in other forums is permitted, provided the original author(s) and the copyright owner(s) are credited and that the original publication in this journal is cited, in accordance with accepted academic practice. No use, distribution or reproduction is permitted which does not comply with these terms.
*Correspondence: Maribel I. García-Ibáñez, maribel.garcia@ieo.csic.es
†Present addresses: Maribel I. García-Ibáñez, Instituto Español de Oceanografía, IEO-CSIC, Palma, Spain; Arturo Lucas, Institut de Ciència i Tecnologia Ambientals, Universitat Autònoma de Barcelona, Cerdanyola del Vallès, Spain
Disclaimer
All claims expressed in this article are solely those of the authors and do not necessarily represent those of their affiliated organizations, or those of the publisher, the editors and the reviewers. Any product that may be evaluated in this article or claim that may be made by its manufacturer is not guaranteed or endorsed by the publisher.