Abstract
The presence of stressors, particularly disease, on corals necessitates assessments of their severity in order to compare threat levels and to plan for impacts. Diseases in particular are often measured via the rate at which a lesion moves across a coral (lesion progression rate) to determine the impact of those lesions and also to compare virulence across species, regions, and disease types. Lesion progression can even be used as a field indicator for disease identification. Many different methodologies have been used to measure lesion progression rates. These may be field-based or photographic measurements, and they include linear progression rates as well as areal progression rates. All methods have pros and cons, including varying levels of accuracy and repeatability, variability with respect to colony and lesion sizes, and time and computational requirements. Additionally, not all metrics can be directly compared, and so experiments done with the intent to compare with previous work must consider methodologies used in former studies. Areal progression rates have high variability, but can provide impressive information on overall tissue loss. Overall, linear lesion progression rates provide more accurate and less variable assessments of loss, and are better used for comparisons. Using the average of multiple linear measurements may further increase precision. Measuring from photographs rather than direct field measurements provides a more permanent and repeatable record, but outside of directly planar surfaces is likely to yield inaccuracies. The emerging use of 3-D photogrammetry can overcome many of these limitations, but the methods require considerable time and computational power. The pros and cons of each methodology should be assessed during experimental design to best answer the hypotheses in question as well as consider whether comparisons to other studies are valid.
1 Introduction
Disease is one of the primary stressors impacting tropical stony corals. Since first identified in the 1960s (Squires, 1965), the number of described coral diseases has continued to grow. Additionally, their impact on reef ecosystems has accelerated (Goreau et al., 1998; Richardson, 1998), a trend expected to continue (Maynard et al., 2015). Spatially and temporally constrained outbreaks of diseases such as black band disease and white plague can cause significant declines in local coral cover (Richardson et al., 1998; Sato et al., 2009). Larger Caribbean-wide outbreaks of diseases like white band disease and stony coral tissue loss disease (SCTLD) have resulted in catastrophic loss of susceptible species (Aronson and Precht, 2001; Neely et al., 2021), region-wide declines in coral cover, density, and diversity (Estrada-Saldívar et al., 2021; Heres et al., 2021; Hayes et al., 2022), and changes to reef ecosystem function (Estrada-Saldívar et al., 2020; Alvarez-Filip et al., 2022). Not surprisingly, the study of these diseases continues to increase in order to better understand and potentially manage or mitigate them.
Technological innovation since the early days of disease assessment provides novel insights into histology, microbiome components, and the “‘omics”. But basic field observations on how fast disease lesions move across coral colonies are still important as a primary way of distinguishing among different diseases, assessing the severity of their impacts on coral colonies, and identifying seasonal or other patterns in virulence.
The two primary metrics for assessing lesion progression rates are:
-
1. Linear progression rate, defined as the linear distance that a lesion moves across a colony over time, generally reported as cm/day, cm/week, or cm/month. Methods for measuring this include in-water measurements using natural or installed fixed points on the coral, or using photographs to measure from natural or fixed points.
-
2. Areal progression rate, defined as the amount of tissue killed by a progressing lesion over time, generally reported as cm2/day, cm2/week, or cm2/month. Methods for measuring this include direct measurements of lesions in the field as well as more general field estimations of percent recent mortality, which can be converted to estimates of lost tissue if colony size is known. More precise methods include using photographs to a) measure maximum length and width of lesions, b) draw digital polygons around lesions, or, more recently, c) use three-dimensional photogrammetry to measure lost tissue area.
These measurements of lesion progression form a baseline for understanding and comparing past, present, and future diseases. They are also increasingly used to measure how intervention actions, such as in-water medicines, may slow or halt lesion progression (Shilling et al., 2021; Eaton et al., 2022) or used to assess lesion recovery rates (Townsend et al., 2023). Each method for measuring lesion progression provides different information, which is not always comparable among methods or studies. Each method can answer different questions, provide differing levels of accuracy, require different levels of technology, and necessitate varying amounts of underwater and topside time. As such, understanding how the metrics for measurement compare, as well as their relative strengths and weaknesses, can help guide decisions when choosing the best metric for any particular investigation.
2 Methods
To assess current and historical methodologies for lesion measurement, literature searches in Google Scholar were conducted using the word combinations of “coral” + “lesion progression”, “disease progression”, or “progression rate”. Within those resulting papers, additional references that suggested lesion measurement efforts were also examined. Studies in which the methods were not clearly outlined were discarded. A total of 25 studies measuring coral lesions were assessed to determine the methods used to measure progression or healing. Each study was assessed for disease type, whether linear or areal progression was measured, and what methods were used to determine the measurements.
3 Results/discussion
Of the 25 assessed studies, 14 measured linear progression of lesions while 14 calculated areal progression. Three of these studies assessed both metrics (Table 1).
Table 1
| Accuracy | Underwater Time | Topside Time | Cons | Pros | Studies and Diseases | |
|---|---|---|---|---|---|---|
| LINEAR PROGRESSION | Does not provide information on total impact to coral. | Good for comparing lesion progression across corals, diseases, studies. | ||||
| Single nail/cable tie, single measurement | Moderate | Low | Low | Requires installation of manmade objects. May be unclear which direction to measure from for repeated time points. | Rapid. Precise in a single direction, even in high rugosity. |
Borger and Steiner (2005): WP, BBD, DSD Haapkylä et al. (2009): SEB, BrB Howells et al. (2020): WS |
| Single nail/cable tie, multiple measurements | High | Moderate | Low | Requires installation of manmade objects. May be unclear which directions to measure from for repeated time points. | Accounts for variation in progression within a single lesion. Precise, even when highly rugose. | Eaton et al. (2022): BBD |
| Photo assessment from nail/cable tie | Moderate | Low | Moderate | Camera angles or rugose surfaces may impact accuracy. Requires installation of manmade objects. | Provides permanent record of lesion and measurement. | Roff et al. (2011): AWS |
| Photo assessment from natural feature or previous lesion line | Moderate | Low | Moderate | Camera angles or rugose surfaces may impact accuracy. May be hard to repeatedly identify the natural feature. | Provides permanent record of lesion and measurement. |
Brandt et al. (2013): WP Eaton et al. (2021): SCTLD Haapkylä et al. (2009): BBD Meiling et al. (2021): SCTLD Pollock et al. (2013): WS Randall et al. (2018): YBD Sato et al. (2011): BBD Sato et al. (2009): BBD Thinesh et al. (2014): BBD Wada et al. (2017): BBD, SEB, GA, WS |
| 3-D photogrammetry | High | High | High | Requires time and computational power. | Provides permanent 3-D record of lesion and measurement. | |
| AREAL PROGRESSION | Will vary with size, number, and location of edge of lesions and thus not good for comparisons | Can provide information on overall loss to coral at a specific timepoint. | ||||
| Field measurement of lesion length x width | Low | Moderate | Low | Low accuracy | Relatively rapid field measurement | Borger and Steiner (2005): WP, BBD, DSD |
| Field assessment of percent loss | Low | Low | Low | Depends on timepoint visited, generally only accurate between observers to ~10%. | Commonly used in monitoring programs. Rapid. Accounts for size of coral in assessing impact. |
Williams and Miller (2012): WPX, other Neely et al. (2022): WPX, other Thurber et al. (2014): All |
| Photo assessment of lesion length x width | Low | Low | Moderate | Low accuracy, and high variation with camera angle and rugosity. | Provides permanent record of lesion and measurement. | Williams and Miller (2005): RTL |
| Photo assessment using polygon to outline lesion | Moderate | Low | Moderate-High | Camera angles or rugose surfaces may impact accuracy | Provides permanent record of lesion and measurement. |
Roff et al. (2011): AWS Aeby et al. (2015): BBD Townsend et al. (2023): wound healing Lozada-Misa et al. (2015): WS Meiling et al. (2021): SCTLD Ushijima et al. (2020): SCTLD |
| 3-D photogrammetry | High | High | High | Requires time and computational power. | Provides permanent 3-D record of lesions and measurements. |
Meiling et al. (2020): SCTLD Elmer et al. (2021): SCTLD Camacho-Vite et al. (2022): SCTLD |
Comparison of methodologies used in coral disease lesion assessments.
Studies using each methodology are listed in the last column with the disease studied. Disease abbreviations are: AWS (Acroporid white syndrome), BBD (black band disease), BrB (brown band), DSD (dark spot disease), GA (growth anomalies), RTL (rapid tissue loss), SEB (skeletal eroding band), SCTLD (stony coral tissue loss disease), WP (white plague), WPX (white pox), WS (white syndrome), and YBD (yellow band disease).
3.1 Linear progression
Linear progression rates assess how quickly a single point on a lesion radiates outward from its center point or previous lesion edge. The measurement can be taken in several ways over at least two time points:
1. Direct field measurements from a fixed point.
Measurements from a fixed point to the lesion edge, taken over time, can provide the lesion progression rate. A naturally occurring fixed point, such as a tubeworm or distinct polyp pattern, can be used as long as the observer can easily find and identify it. More frequently, a manmade object is affixed to the coral. Such objects include small masonry nails for boulder corals, or a small zip tie secured around the branch of a branching coral. Though unlikely, it is worth considering whether such an object could itself impact the lesion progression rate. The fixed object can be placed directly on the current lesion edge, with the distance between that object and the new lesion edge being measured during a subsequent visitation. Fixed objects can also be placed at a more central point of lesions rather than at their edges; measurements from the fixed object to the lesion edge can be taken during each visitation and subtracted to determine the rate of progression. For example, if a nail/ziptie is placed near a lesion at time 0 when the distance to the lesion edge is 10 cm at time 0, and the distance from that same nail/ziptie to the lesion edge at time 1week is 15 cm, the lesion progression rate is 5cm/week.
Some potential flaws with this single-measurement method are that lesions may not always progress uniformly across their boundary; some parts of the lesion may progress more slowly or quickly than others. A single measurement may thus not be representative of the lesion as a whole. Additionally, if doing measurements over multiple time points, it is important to measure in the same direction from the fixed point each time in order to appropriately subtract previous measurements. This may be challenging with only a single fixed point as reference and no orientation on which direction from that point to measure. An alternative, on massive corals, is to place two nails along the lesion to provide a base for perpendicular measurement from the original lesion line. Other studies have addressed these concerns by taking multiple measurements in different directions from a central fixed point and using the average of the lesion progression rates to account for potential variability in lesion progression rates across a single lesion boundary (Figure 1A).
Figure 1
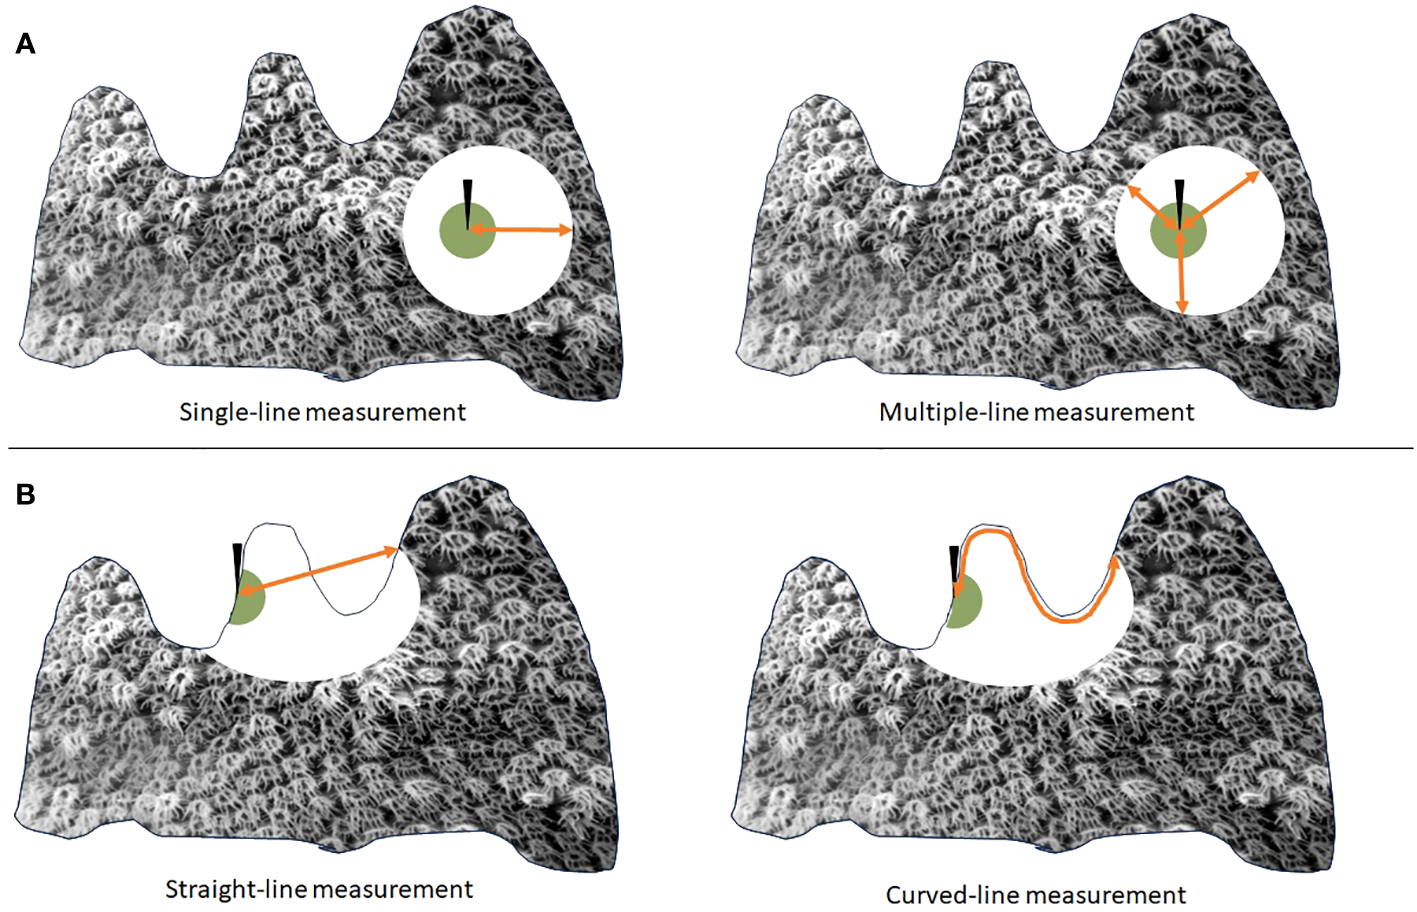
Visualization of an active coral lesion (white circle) progressing across a colony from an area of old mortality (green circle) in which a fixed object (black arrow) has been affixed. If lesions progress unevenly from a fixed point (A), multiple measurements (right) averaged together may provide a more accurate assessment of linear progression rate than a single measurement (left). If lesions progress across a rugose surface (B), a straight-line measurement (left) may underestimate the actual lesion progression rate, which can better be measured using a flexible tape measure (right).
Field measurements from a fixed point to the lesion edge can be straight-line, measured with calipers or straight-edge rulers. Measurements can also be curved using a flexible measuring tape. The preferred method may depend on the type of coral and whether measurements are being compared to previous studies using similar methodology. As the lesion is moving across the coral’s surface, it must progress through any valleys and ridges, which should be reflected in measured progression rates. For rugose corals, a curved measuring tape may be preferred. For corals on which straight- and curved-line measurements are similar or equal, a straight-line measurement may be sufficient (Figure 1B).
2. Photographic assessments of lesion progression rates.
Some studies utilize photographs from the field to assess lesion progression rates. Various software programs, like ImageJ and Canvas, can be used for this, presuming that some scale reference like a ruler is present in the photo. It is important to have some estimation as to how far the lesion may progress before the next monitoring period to ensure that any advancing lesion line will be present across photos from all time periods. Similar to field measurements, the software can be used to measure the distance from a natural or manmade reference point on the coral to the active lesion margin. This can be done using a single measurement, or taking an average of several. Brandt et al. (2013), assessed the progression of a linear lesion by drawing a digital line across images, parallel to the lesion, and measuring at multiple points from the line to the active lesion so as to get an average progression rate that might also account for any variability or distortion from camera angles or non-planar surfaces. One advantage of photographic assessments over field-based measurements is a permanent, repeatable record through use of the image. Disadvantages are that only straight-line distance can be measured because of the two-dimensional nature of the image, and that slight differences in the angle of the camera when taking photos can lead to inaccurate measurements.
Photogrammetry has recently been used to develop three-dimensional models of corals. A large number of photos are taken of the coral while circling around it, thus providing overlapping imagery from a variety of angles. Software is used to stitch the imagery together and, with the use of a scale bar in the imagery, measure lesion progression rate across the curved surface of the coral with relatively high precision. The method also provides a permanent record of the full coral, including live tissue area and coloration. For small-medium size corals, the time required to take the large number of images underwater is approximately equivalent to field-based measuring of multiple lesions. However, the topside computer processing time to stitch the images together and build the models can be substantial, though expected to decrease as computer processing power improves.
3.2 Areal progression
Areal progression rates estimate the surface area of tissue lost as a result of lesion expansion over a set period of time. Similar to linear progression rates, these measurements require visitation over at least two time points, and can be measured a variety of different ways, although photographic-based assessments are most common.
1. Direct field measurements.
Because lesions and corals are rarely rectangular, field measurements of lesion-related losses will be estimations. One way of quantifying is to measure the length and width of lesion-related mortality and fit the measurements to the surface area of a shape best approximating the lost tissue area. For example, a radially expanding lesion could be approximated as the area of an oval or circle using field measurements. Measurements from two different time points could be used in a subtractive function to estimate change in amount of dead tissue and thus areal progression.
More commonly, field estimates are based on the proportion of the coral exhibiting recent mortality. If the size of the coral is known, and the proportion of the coral that is dead across multiple time points is known, then estimates of the amount of tissue lost can be calculated. There are many assumptions in these calculations. With width and height measurements of a coral, surface area can roughly be estimated as the surface of a hemisphere, and the addition of a length measurement increases the accuracy of this. However, most corals are not perfect hemispheres and so estimates will not be exact. For highly-rugose corals such as branching corals, these measurements may be far from accurate. Estimating the percentage of a coral which is dead can also vary based on the observer or even the day for the same observer. Interobserver comparisons are recommended if multiple individuals will be doing assessments in order to standardize observations and reduce bias. Additionally, photos can assist should additional ground-truthing be required later. Nevertheless, similar estimates are generally regarded as within 10% (i.e. the same coral could easily be visually assessed as having 45% or 55% dead tissue by different observers, or by the same observer on different days). Despite these notable inaccuracies, this is a common method of assessment for coral monitoring programs. It is one of the more rapid methods of coral assessment, thus allowing for a larger number of corals to be monitored over a short period of time.
2. Photographic assessments of progression rates.
For more precise measurements of areal progression rates, photographic surveys can be used. Williams and Miller (2005) measured length and width of disease lesions from photographs to estimate areal loss calculated as an open-ended cylinder. Modern software has improved the ability to estimate the area of irregular shapes. Various programs allow for the tracing of lesion edges and, if the scale is known, can calculate the surface area. Calculating the area of these polygons across two time points allows for the subtractive value to assess areal loss over a set time period. The advantage of this method over field measurements is a much greater increase in precision as well as a permanent record. However, like the linear progression rate estimates using photography, limitations of areal progression rate with photography include a three-dimensional surface area being represented by a two-dimensional photograph, a limitation which increases inaccuracy with increasing rugosity of the coral. Further, even small variations in camera angle can lead to substantial differences in areal coverage estimates; this problem also increases with increased rugosity or curvature of the area of interest.
Three-dimensional models using photogrammetry resolve many of these issues. Like with the two-dimensional photo assessments, areas of live and/or dead tissue can be digitally traced, and the values subtracted to determine tissue loss. However, the three-dimensional nature accounts for surface rugosity, and camera angle issues are eliminated. The drawback however is again the moderate amount of underwater time needed to get full imagery as well as the substantial subsequent computational time required.
3.3 Linear vs. areal measurements
While both linear and areal measurements have been used to assess lesion progression in past studies, there are limitations to their comparability. In particular, areal measurements have high variability. The area of coral tissue impacted by lesions is dependent on multiple factors, including number of lesions, placement of lesions in relation to already dead tissue area or edges, and, of particular concern, the size of the lesion. Areal progression can be assessed on a per-lesion basis or summed when multiple lesions occur on one coral for a colony-level accounting (Figure 2A). This can provide information on the impact to a diseased colony as a whole, but is not useful for comparing different diseases or lesion progression rates.
Figure 2
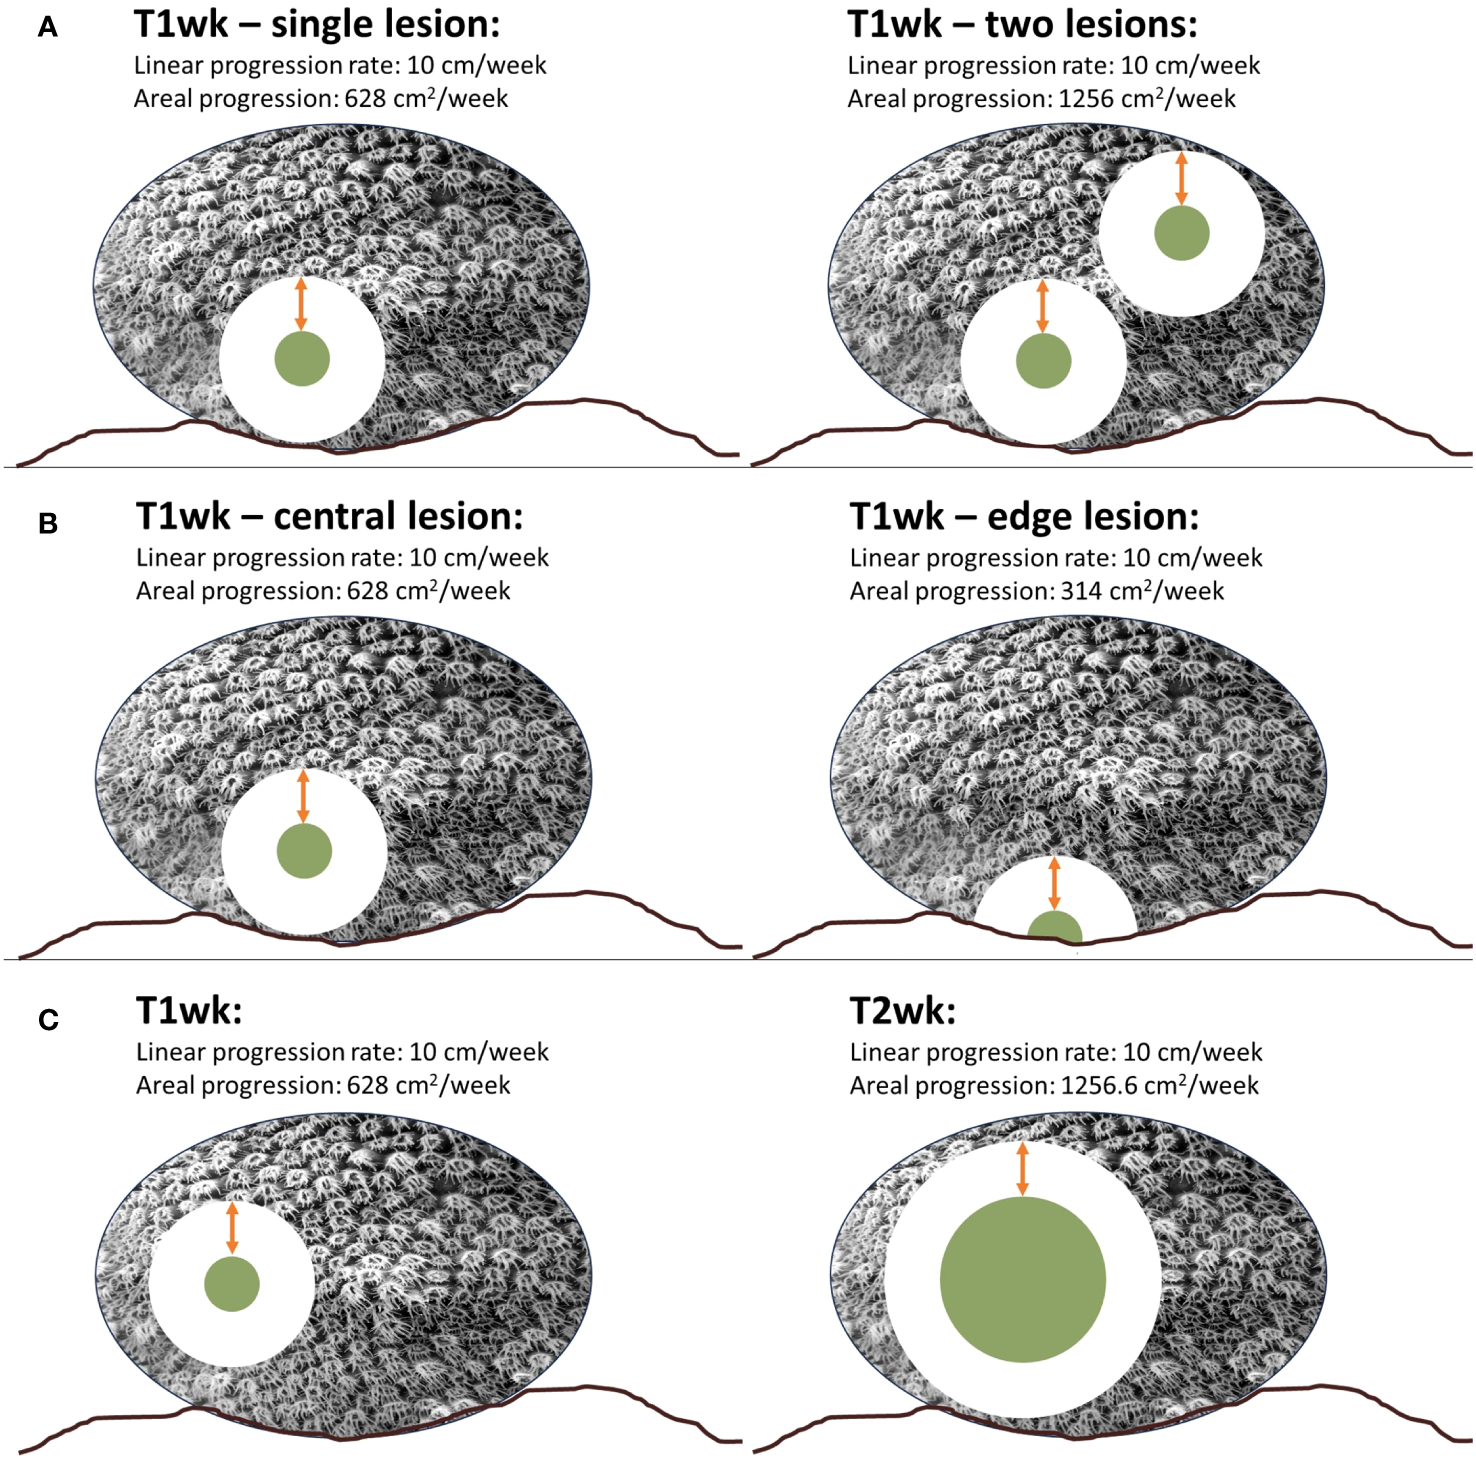
Comparisons of linear versus areal progression rates demonstrate that a consistent linear progression rate (in this example, 10 cm per week) can have highly variable areal progression rates based on number of lesions (A), location of lesion on a colony (B), and size of lesion (C).
The placement of lesions can also impact areal progression rates: if they overlap already dead areas, or stem from an existing live/dead tissue margin as many diseases do, areal progression will be less than that from lesions stemming from an area surrounded by live tissue (Figure 2B). Another notable drawback of areal progression rates is that their value generally depends heavily on the size of the lesion when examined. In a theoretical setting, a straight-line lesion progressing uniformly and consistently across a rectangular coral colony would cause areal mortality at a fixed rate. However, most corals are not rectangular and most lesions do not progress linearly but rather radially outwards from an origin point. A circular lesion expanding at a constant rate will cover increasingly greater amounts of tissue as the lesion size increases. For example, a 10 cm diameter lesion increasing radially at 10 cm/week will cause mortality on 628 cm2 of tissue within a week. At the end of that week, the lesion will be 30 cm in diameter. If it continues to radiate outward from each edge at 10 cm/week, the tissue killed between the 1-week monitoring point and the subsequent week is 1256.6 cm2/week. In this case, the same lesion, with the same rate of linear progression, is killing twice as much tissue during the second week (Figure 2C). As such, disease progression rates measured using areal metrics are highly dependent on lesion size which, particularly for fast-progressing diseases like SCTLD, can vary dramatically within a matter of days to weeks. As a result of the variables outlined here for areal progression – number of lesions, location of lesions, and size of lesions – caution must be applied when using areal progression to compare lesions between colonies, species, regions, or diseases. In support of areal progression rates, they may provide information on the total tissue loss or the proportion of a coral impacted by disease in a way that linear progression rates cannot. Linear progression rates can only inform about the rate a lesion moves in a single direction across a colony; it does little to inform on the total impact to that colony, particularly in terms of the percentage of coral lost.
Compared to areal progression rates, linear progression rates are less affected by temporal or spatial variables. Linear progression rates are only interrupted if the lesion direction that is being measured intersects another lesion or an area of live/dead tissue margin sometime during the interval between measurements, both of which halt its progression and thus result in a lower measured progression rate than would occur if it were to continue unimpeded. Importantly, in the absence of changes to the disease itself, linear progression rate is the same regardless of the size of the lesion, thus measurements taken at any time point are representative of lesion behavior. Comparisons between corals, species, regions, or diseases are more comparable with this method than areal progression.
In summary, determining which lesion progression methodology to use will depend on the hypotheses being tested. Overall, linear progression rates will provide a consistent metric for progression regardless of lesion size, location, or number of lesions. Field-based measurements (particularly if several can be taken and averaged) are likely to be more accurate than those determined from two-dimensional photographs, though it may be desirable to additionally have a photographic record for visualization purposes and permanent records. Areal progression rates vary much more depending on the number, size, and location of lesions. Field measurements and two-dimensional photographic assessments, particularly on non-planar surfaces, are likely to be inaccurate, but three-dimensional models can overcome these limitations. Though these areal measurements can provide impressive metrics about tissue loss, there are challenges when comparing among studies, diseases, or even time points because of the many variables that impact the measurements. Overall, the methodology chosen should be based on the questions being asked, the underwater as well as topside time available, technological capacity, and whether comparisons to other studies are anticipated and valid using the methods selected.
Statements
Data availability statement
The original contributions presented in the study are included in the article. Further inquiries can be directed to the corresponding author.
Author contributions
KN: Conceptualization, Methodology, Visualization, Writing – original draft, Writing – review & editing.
Funding
The author(s) declare that no financial support was received for the research, authorship, and/or publication of this article.
Acknowledgments
The author is grateful to Judy Lang and to two reviewers who provided valuable feedback which improved this manuscript.
Conflict of interest
The author declares that the research was conducted in the absence of any commercial or financial relationships that could be construed as a potential conflict of interest.
Publisher’s note
All claims expressed in this article are solely those of the authors and do not necessarily represent those of their affiliated organizations, or those of the publisher, the editors and the reviewers. Any product that may be evaluated in this article, or claim that may be made by its manufacturer, is not guaranteed or endorsed by the publisher.
References
1
Aeby G. S. Work T. M. Runyon C. M. Shore-Maggio A. Ushijima B. Videau P. et al . (2015). First record of black band disease in the Hawaiian archipelago: response, outbreak status, virulence, and a method of treatment. PLoS One10(3):e0120853. doi: 10.1371/journal.pone.0120853
2
Alvarez-Filip L. González-Barrios F. J. Pérez-Cervantes E. Molina-Hernández A. Estrada-Saldívar N. (2022). Stony coral tissue loss disease decimated Caribbean coral populations and reshaped reef functionality. Commun. Biol.5, 1–10. doi: 10.1038/s42003-022-03398-6
3
Aronson R. B. Precht W. F. (2001). White-band disease and the changing face of Caribbean coral reefs. Hydrobiologia460, 25–38. doi: 10.1023/A:1013103928980
4
Borger J. L. Steiner S. C. (2005). The spatial and temporal dynamics of coral diseases in Dominica, West Indies. Bull. Mar. Sci.77, 137–154.
5
Brandt M. E. Smith T. B. Correa A. M. Vega-Thurber R. (2013). Disturbance driven colony fragmentation as a driver of a coral disease outbreak. PLoS One8, e57164. doi: 10.1371/journal.pone.0057164
6
Camacho-Vite C. Estrada-Saldívar N. Perez-Cervantes E. Alvarez-Filip L. (2022). Differences in the progression rate of SCTLD in Pseudodiploria strigosa are related to colony size and morphology. Front. Mar. Sci.9, 790818. doi: 10.3389/fmars.2022.790818
7
Eaton K. R. Clark A. S. Curtis K. Favero M. Hanna Holloway N. Ewen K. et al . (2022). A highly effective therapeutic ointment for treating corals with black band disease. PLoS One17, e0276902. doi: 10.1371/journal.pone.0276902
8
Eaton K. R. Landsberg J. H. Kiryu Y. Peters E. C. Muller E. M. (2021). Measuring stony coral tissue loss disease induction and lesion progression within two intermediately susceptible species, Montastraea cavernosa and Orbicella faveolata. Front. Mar. Sci.8, 717265. doi: 10.3389/fmars.2021.717265
9
Elmer F. Cruz Y. D. Dock C. Ortega A. A. Wedel S. J. Hertler H. (2021). Determining lesion progression rate of stony coral tissue loss disease using structure-from-motion photogrammetry. Gulf Caribbean Res.32, SC12–SC17. doi: 10.18785/gcr.3201.15
10
Estrada-Saldívar N. Molina-Hernández A. Pérez-Cervantes E. Medellın-Maldonado F. González-Barrios F. J. Alvarez-Filip L. (2020). Reef-scale impacts of the stony coral tissue loss disease outbreak. Coral Reefs39, 861–866. doi: 10.1007/s00338-020-01949-z
11
Estrada-Saldívar N. Quiroga-García B. A. Pérez-Cervantes E. Rivera-Garibay O. O. Alvarez-Filip L. (2021). Effects of the stony coral tissue loss disease outbreak on coral communities and the benthic composition of Cozumel reefs. Front. Mar. Sci.8, 632777. doi: 10.3389/fmars.2021.632777
12
Goreau T. J. Cervino J. M. Goreau M. Hayes R. Hayes M. Richardson L. et al . (1998). Rapid spread of diseases in Caribbean coral reefs. Rev. Biol. Trop.46, 157–171.
13
Haapkylä J. Unsworth R. K. Seymour A. S. Melbourne-Thomas J. Flavell M. Willis B. L. et al . (2009). Spatio-temporal coral disease dynamics in the Wakatobi Marine National Park, south-east Sulawesi, Indonesia. Dis. Aquat. Organisms87, 105–115. doi: 10.3354/dao02160
14
Hayes N. K. Walton C. J. Gilliam D. S. (2022). Tissue loss disease outbreak significantly alters the Southeast Florida stony coral assemblage. Front. Mar. Sci.1633. doi: 10.3389/fmars.2022.975894
15
Heres M. M. Farmer B. H. Elmer F. Hertler H. (2021). Ecological consequences of stony coral tissue loss disease in the Turks and Caicos Islands. Coral Reefs40, 609–624. doi: 10.1007/s00338-021-02071-4
16
Howells E. J. Bauman A. G. Vaughan G. O. Hume B. C. Voolstra C. R. Burt J. A. (2020). Corals in the hottest reefs in the world exhibit symbiont fidelity not flexibility. Mol. Ecol.29, 899–911. doi: 10.1111/mec.15372
17
Lozada-Misa P. Kerr A. Raymundo L. (2015). Contrasting lesion dynamics of white syndrome among the scleractinian corals Porites spp. PLoS One10, e0129841. doi: 10.1371/journal.pone.0129841
18
Maynard J. Van Hooidonk R. Eakin C. M. Puotinen M. Garren M. Williams G. et al . (2015). Projections of climate conditions that increase coral disease susceptibility and pathogen abundance and virulence. Nat. Climate Change5, 688–694. doi: 10.1038/nclimate2625
19
Meiling S. Muller E. M. Smith T. B. Brandt M. E. (2020). 3D photogrammetry reveals dynamics of stony coral tissue loss disease (SCTLD) lesion progression across a thermal stress event. Front. Mar. Sci.7, 597643. doi: 10.3389/fmars.2020.597643
20
Meiling S. S. Muller E. M. Lasseigne D. Rossin A. Veglia A. J. Macknight N. et al . (2021). Variable species responses to experimental stony coral tissue loss disease (SCTLD) exposure. Front. Mar. Sci.8, 464. doi: 10.3389/fmars.2021.670829
21
Neely K. L. Lewis C. L. Lunz K. S. Kabay L. (2021). Rapid population decline of the pillar coral Dendrogyra cylindrus along the Florida reef tract. Front. Mar. Sci.8. doi: 10.3389/fmars.2021.656515
22
Neely K. L. Macaulay K. A. Lunz K. S. (2022). Population trajectory and stressors of Acropora palmata sites in the Florida Keys. Front. Mar. Sci.9. doi: 10.3389/fmars.2022.978785
23
Pollock F. Katz S. Bourne D. Willis B. (2013). Cymo melanodactylus crabs slow progression of white syndrome lesions on corals. Coral Reefs32, 43–48. doi: 10.1007/s00338-012-0978-9
24
Randall C. Whitcher,. E. M. Code T. Pollock C. Lundgren I. Hillis-Starr Z. et al . (2018). Testing methods to mitigate Caribbean yellow-band disease on Orbicella faveolata. PeerJ6, e4800. doi: 10.7717/peerj.4800
25
Richardson L. Goldberg W. Carlton R. G. Halas J. C. (1998). Coral disease outbreak in the Florida Keys: Plague Type II. Rev. Biol. Trop.46, 187–198.
26
Richardson L. L. (1998). Coral diseases: what is really known? Trends Ecol. Evol.13, 438–443. doi: 10.1016/s0169-5347(98)01460-8
27
Roff G. Kvennefors E. C. E. Fine M. Ortiz J. Davy J. E. Hoegh-Guldberg O. (2011). The ecology of ‘Acroporid white syndrome', a coral disease from the southern Great Barrier Reef. PLoS One6, e26829. doi: 10.1371/journal.pone.0026829
28
Sato Y. Bourne D. G. Willis B. L. (2009). Dynamics of seasonal outbreaks of black band disease in an assemblage of Montipora species at Pelorus Island (Great Barrier Reef, Australia). Proc. R. Soc. B: Biol. Sci.276, 2795–2803. doi: 10.1098/rspb.2009.0481
29
Sato Y. Bourne D. G. Willis B. L. (2011). Effects of temperature and light on the progression of black band disease on the reef coral, Montipora hispida. Coral Reefs30, 753–761. doi: 10.1007/s00338-011-0751-5
30
Shilling E. N. Combs I. R. Voss J. D. (2021). Assessing the effectiveness of two intervention methods for stony coral tissue loss disease on Montastraea cavernosa. Sci. Rep.11, 1–11. doi: 10.1038/s41598-021-86926-4
31
Squires D. F. (1965). Neoplasia in a coral? Science148, 503–505. doi: 10.1126/science.148.3669.503
32
Thinesh T. Mathews G. Raj K. D. Edward J. P. (2014). Variation in black and white band disease progression in corals of the Gulf of Mannar and Palk Bay, Southeastern India. Dis. Aquat. Organisms110, 227–234. doi: 10.3354/dao02750
33
Thurber R. L. V. Burkepile D. E. Fuchs C. Shantz A. A. Mcminds R. Zaneveld J. R. (2014). Chronic nutrient enrichment increases prevalence and severity of coral disease and bleaching. Global Change Biol.20, 544–554. doi: 10.1111/gcb.12450
34
Townsend J. E. Brandt M. E. Mukherjee S. Medina M. Smith T. B. (2023). Differing lesion recovery rates of two Caribbean stony coral species across a shallow water to mesophotic depth gradient suggest different sensitivity to repeated disturbance. Coral Reefs42, 1–11. doi: 10.1007/s00338-023-02414-3
35
Ushijima B. Meyer J. L. Thompson S. Pitts K. Marusich M. F. Tittl J. et al . (2020). Disease diagnostics and coinfections by Vibrio coralliilyticus during an ongoing coral disease outbreak in Florida. Front. Microbiol.11, 2682. doi: 10.3389/fmicb.2020.569354
36
Wada N. Mano N. Yanagisawa Y. Mori T. (2017). Occurrence of coral diseases at Akajima, Okinawa, Japan in 2010 and 2011. Galaxea J. Coral Reef Stud.19, 35–44. doi: 10.3755/galaxea.19.1_35
37
Williams D. E. Miller M. W. (2005). Coral disease outbreak: pattern, prevalence and transmission in Acropora cervicornis. Mar. Ecol. Prog. Ser.301, 119–128. doi: 10.3354/meps301119
38
Williams D. E. Miller M. W. (2012). Attributing mortality among drivers of population decline in Acropora palmata in the Florida Keys (USA). Coral Reefs31, 369–382. doi: 10.1007/s00338-011-0847-y
Summary
Keywords
coral, disease, lesions, linear progression, areal progression
Citation
Neely KL (2024) Measuring coral disease lesions: a comparison of methodologies. Front. Mar. Sci. 11:1348929. doi: 10.3389/fmars.2024.1348929
Received
03 December 2023
Accepted
13 February 2024
Published
13 March 2024
Volume
11 - 2024
Edited by
Aldo Cróquer, The Nature Conservancy, Dominican Republic
Reviewed by
Marilyn Brandt, University of the Virgin Islands, US Virgin Islands
Kimberly B. Ritchie, University of South Carolina Beaufort, United States
Updates
Copyright
© 2024 Neely.
This is an open-access article distributed under the terms of the Creative Commons Attribution License (CC BY). The use, distribution or reproduction in other forums is permitted, provided the original author(s) and the copyright owner(s) are credited and that the original publication in this journal is cited, in accordance with accepted academic practice. No use, distribution or reproduction is permitted which does not comply with these terms.
*Correspondence: Karen L. Neely, kneely0@nova.edu
Disclaimer
All claims expressed in this article are solely those of the authors and do not necessarily represent those of their affiliated organizations, or those of the publisher, the editors and the reviewers. Any product that may be evaluated in this article or claim that may be made by its manufacturer is not guaranteed or endorsed by the publisher.