Abstract
Introduction:
Cold-water coral reefs form complex benthic habitats, supporting thousands of species. The broadscale environmental tolerances of reef-forming species such as Lophelia pertusa are well studied, but small-scale differences between different reef settings have received little attention so far. The controlling factors of thriving cold-water coral reefs and how these habitats differ in terms of framework extent, coral colony morphology, and associated fauna could reveal how these benthic ecosystems form and expand. Information on the natural range of environmental fluctuations could provide a better understanding of the resilience of such ecosystems towards environmental changes. Our study aimed to elaborate small-scale forces on local hydrodynamics and oceanographic parameters at two geographically close but contrasting reef sites in mid-Norway.
Methods:
We investigated natural fluctuations and the seasonal variability of environmental conditions of an inshore and an offshore Lophelia-dominated reef over an annual cycle by time series monitoring of physical properties by benthic landers and water sampling for biogeochemical variables using CTD casts.
Results and discussion:
The flow fields at the extensive reef on the offshore Sula Ridge and a bank reef at Nord-Leksa in a fjord-system differed regarding both short-term and seasonal levels. The inshore flow field was strong and tidally driven, whereas the offshore flow field was slower with large seasonal variability. The local flow regimes and the seasonal atmospheric forcing could explain the observed seasonality of the hydrographic variables and the observed inter-annual variability in biogeochemical variables. Comparison with a flow model showed that the natural short-term and seasonal variability are driven by small-scale forcing that is not represented in model analyses. These results suggest that local hydrodynamics together with sea-floor topography control the reef extent and the morphology of cold-water coral colonies.
1 Introduction
Cold-water corals (CWCs) build vast ecosystems, promoting high biodiversity and high species richness in the deeper ocean (Freiwald et al., 2004) equally remarkable as in shallow-water tropical coral reefs (e.g. Freiwald et al., 1999; Henry and Roberts, 2017). The ecological requirements and tolerance thresholds of living reef-forming CWCs have been assessed by field-based analyses and habitat suitability modelling (e.g. Guinotte et al., 2006; Davies et al., 2008; Dullo et al., 2008; Freiwald et al., 2009; Davies and Guinotte, 2011; Brooke et al., 2013; Flögel et al., 2014; Zheng and Cao, 2014; Tong et al., 2023). Reef-forming CWCs are predominantly found in waters with temperatures between 4 and 14°C, a salinity range of 32 to 38 (Freiwald et al., 2004; Taviani et al., 2005; Freiwald et al., 2009), oxygen levels of > 2 mL L-1 (Fink et al., 2012) and aragonite saturation (ΩAr) levels around or above the aragonite saturation horizon (ASH) of 1 that promote calcification (Davies and Guinotte, 2011). In the Northeast Atlantic, a specific density layer (sigma-theta of 27.35–27.65 kg m-3) (Dullo et al., 2008) and low levels of dissolved inorganic carbon (DIC) (< 2,170 μmol kg-1) (Flögel et al., 2014) are linked to healthy CWC occurrences. Moreover, CWCs are associated with high surface productivity in combination with strong tidal bottom currents, i.e. regions where fresh labile food particles are transported rapidly from the surface and where an oscillating water flow enhances food supply (e.g., Freiwald et al., 2004; Thiem et al., 2006; Dorschel et al., 2007; Kiriakoulakis et al., 2007; Davies et al., 2009; Soetaert et al., 2016; Juva et al., 2020). Recently, Maier et al. (2023) reviewed the ‘paradox of thriving cold-water coral reefs in the food limited deep sea’ and compared habitat suitability models predicting reef-forming corals with regard to surface productivity and currents. In their global analysis, the authors found that currents/flow speed is a more important driver for CWC reef growth than primary productivity, with the majority of reef-forming corals occurring in areas with above global-average current velocity, while corals face a broad range of primary productivity conditions. Hydrodynamic processes such as internal tidal activity and seasonally driven oscillations cause periodic food pulses to the corals at varying temporal scales rather than constant food supply (Soetaert et al., 2016; Osterloff et al., 2019; de Froe et al., 2022; Maier et al., 2023).
Local hydrodynamics also plays an important role in the morphology of branching corals, i.e. the colony shape depends on the flow speed and direction. Unidirectional flow is linked to ‘bush-like’ growth patterns (Wilson, 1979) with living corals facing the main flow direction (Wagner et al., 2011; Chindapol et al., 2013). In more anisotropic or multi-directional flow fields, coral branches grow in multiple directions creating ‘cauliflower’-shaped colonies (Freiwald et al., 1999). The latter type is more compact and allows for more stability in environments with strong bottom currents, while bush-like colonies are more expanded and have thinner branches that provide better accessibility for capturing food particles (Hunter, 1989). Polyp size is further thought to be related to the size range of utilised food particles (Buhl-Mortensen and Freiwald, 2023) and may thus help to understand the mechanisms of food capture. In Norway, Lophelia’s primary food source are crustacean plankton, predominantly copepods (Järnegren and Kutti, 2014). On the reef scale, the large three-dimensional frameworks created by the corals further influence the flow patterns locally themselves, with their complex structure deflecting near-bed flow and decreasing turbulence levels and flow velocity (Mienis et al., 2019; Bartzke et al., 2021; Corbera et al., 2022), allowing for optimal flow for prey capture and sediment baffling (Hennige et al., 2021; Sanna et al., 2023).
Most of the CWC reefs in the North Atlantic are built by three main species, Lophelia pertusa (also referred to as Desmophyllum pertusum (Addamo et al., 2016)), Madrepora oculata, or Solenosmilia variabilis (e.g. Freiwald et al., 2004). Along the continental shelf off Norway L. pertusa is the main reef-framework forming species in the Northeast Atlantic (e.g. Buhl-Mortensen et al., 2015a, b). Of all known L. pertusa occurrences, 30% are located in Norwegian waters (Järnegren and Kutti, 2014). One of the most pronounced occurrences on the Norwegian margin is the Sula Reef Complex (Figure 1), which stretches about 14 km on the Sula Ridge off the coast of Trøndelag (county with Trondheim being the largest city) in mid-Norway (Freiwald et al., 1999, 2002; Hovland et al., 2005). The Sula Reef Complex consists of ~ 1,000 individual coral mounds (Thorsnes et al., 2016) with Holocene age reaching up to 8,000 years (e.g. Hovland et al., 1998; Freiwald et al., 1999; Hovland et al., 2005). Living L. pertusa colonies and the associated fauna thrive at relatively stable environmental conditions with temperatures between 7.6 and 7.8°C and salinities between 35.05 and 35.24 (Freiwald et al., 2002). Cold-water coral reefs off Norway are, however, not restricted to the continental shelf, but extend to the coasts and to narrow fjords from the Oslofjord in the south (Purser et al., 2009) to the Stjernsund in the north (Rüggeberg et al., 2011). Here, CWC occurrences are found on sills, banks and on vertical fjord walls (e.g. Mortensen and Fosså, 2001; Fosså et al., 2002; Hovland et al., 2002; Juva et al., 2021). The Trondheimsfjord in Trøndelag harbours several CWC reefs (Buhl-Mortensen et al., 2015a) including the Nord-Leksa Reef near the fjord entrance (Mortensen et al., 2001; Scheide, 2018) and the shallowest CWC reef known to date at 39–80 m on the Tautra Ridge (Zibrowius, 1980; Fosså et al., 2002).
Figure 1

(A) The study area (red rectangle) at the coast off mid-Norway. (B) Close-up of the study area with the three study sites: Sula Reef, Nord-Leksa Reef and Tautra Reef. The lander system deployments took place at Sula and Nord-Leksa, while at Tautra, in-reef water sampling was carried out during the first RV Poseidon survey in summer 2013. The Sula VME (Vulnerable Marine Ecosystem) protected area is shown with black polygon. (C) Map of south- to mid-Norway showing the prevailing current regime. Surface currents are indicated in red including the North Atlantic Current (NAC) and The Norwegian Coastal Current (NCC). The blue arrow highlights the main northwards moving intermediate water mass Atlantic Water (AW).
The environmental conditions in mid-Norway, both on the continental shelf and within the fjords, are driven by large-scale ocean circulation and seasonal forcing. The current system of the Norwegian shelf is dominated by the North Atlantic Current (NAC) and the Norwegian Coastal Current (NCC) (Sætre and Ljøen, 1971; Mork, 1981), which flow northwards along the Norwegian coast (Figure 1C). The NAC brings warm and salty (> 35 g kg-1) Atlantic Water (AW) to the shelf area. North of 63°N, AW is found beneath 100–150 metres (Sætre, 1999). The NAC flows as a slope current with its main core offshore of the shelf break. The NCC flows over the Norwegian shelf, supplied with brackish waters from the Baltic Sea, fjords and rivers along the Norwegian coast, forming fresher (< 35 g kg-1) Norwegian Coastal Water (NCW) (Haugan et al., 1991; Milzer et al., 2013). Its width varies due to season and weather conditions, but on average it stretches 100 km from the coast (Leinebø, 1973). As an effect of the topography, the NCC splits into two northward-flowing branches at about 63°30′N (Ljøen and Nakken, 1969; Eide, 1979; Poulain et al., 1996): the slow meandering branch follows the shelf break on top of the AW, and the fast and more stable branch flows along the coast (Sætre, 1999). The winter cooling of the upper few tens of metres creates a cool and fresh seasonal water mass – the Winter Mode Water (WMW) – which is less dense but cooler than the NCW. Subsequent warming of the surface waters during spring and summer shifts the WMW into deeper layers of the water column.
Besides the flow regime, the bedrock morphology beneath the CWC reef sets limits to the reef extent (Freiwald et al., 1999). The Sula Reef coral mounds and patches cover areas of several km2 with a vertical extent of up to 35 m height and diameters up to 100 m (Thorsnes et al., 2016). The Ridge extends from 230 to 330 m and the largest continuous coral cover is found between 270 and 310 m depth (Freiwald et al., 1999). The highest abundance of CWC mounds in Sula is reported at the steepest part to the southwest of the ridge (Thorsnes et al., 2016). To the northeast, single discrete patch reefs are more common (Mortensen et al., 1995). The Nord-Leksa reef system has two reef tops with the reef area being restricted to a narrow depth range of 138–180 m, but the horizontal extent covering almost 2.3 km2 (Scheide, 2018). In comparison, Scheide (2018) estimated the coral cover on Tautra sill to be 0.4–0.8 km2 in shallower water depths of 39–80 m. The Tautra CWC site includes several discrete reefs as well (Mortensen and Fosså, 2001).
CWCs within the fjords are likely to experience different seasonal and short-term variability in environmental conditions than CWCs on the shelf, but most studies represent only snapshots in time of point measurements at specific sites (e.g. Davies et al., 2010; Mienis et al., 2012). Small-scale variability and seasonal or tidal differences are therefore often not considered, but their influence on CWC growth is thought to be critical (Rüggeberg et al., 2011; Findlay et al., 2013; Hennige et al., 2014; Juva et al., 2020). Model approaches comparing two distinct CWC sites in the Northeast Atlantic, one at the Logachev mound province (Southeast Rockall Bank) and one at Condor Seamount (Azores), suggest that changes in small-scale hydrodynamics responding to basin-scale changes in water mass properties and currents through contrasting states of the Atlantic Meridional Overturning Circulation (AMOC), may affect coral occurrences at SE Rockall (with stronger bottom currents and cooler and less saline waters during strong AMOC), whereas waters at Condor Seamount at coral depths remained largely unaffected by AMOC changes (Mohn et al., 2023), demonstrating that some reef sites are periodically exposed to greater variations in environmental conditions, which is likely going to be amplified in the future under ongoing ocean change. In order to resolve small-scale spatial and temporal differences in the environmental conditions of CWC sites, we investigated natural fluctuations and the seasonal variability at two close but contrasting CWC reefs in mid-Norway by long-term observational monitoring. For this, we deployed three benthic lander systems at thriving offshore and inshore CWC reef sites off Trondheim over an annual cycle. At the time of deployment and recovery of the landers, the water column was additionally characterised by CTD casts, and video footage from the reefs was examined regarding differences of the corals’ morphology and the associated fauna. By using a multidisciplinary approach, we investigated the interconnection of biotic and abiotic processes on various scales such as the effect of the reef structure on the local hydrographic and biogeochemical settings, advancing our current understanding of the feedback mechanisms of these important marine ecosystems to the hydrodynamic, biochemical, and geomorphological boundary conditions, which support coral growth in Norwegian reefs.
2 Material and methods
2.1 Studied reef sites
The two studied mid-Norwegian Lophelia reef sites represent offshore and inshore environmental conditions of established CWC ecosystems (Figure 1). Offshore, the approximately 14 km long Sula Reef Complex on the Sula Ridge off the coast of Sør-Trøndelag was investigated in the mid-western area of the reef chain at about 300 m water depth (Figures 1B, 2A). Inshore, the CWC bank at Nord-Leksa (Nord-Leksa Reef) just outside the entrance of the Trondheimsfjord and about 40 nm from Trondheim was studied at 170–215 m depth (Figure 1B). For the less studied Nord-Leksa Reef, a bathymetric map (Figure 2B) of the reef was generated based on single beam echo sounder data recorded through the ship-board navigation system and GPS data of the vessel’s route to obtain an idea of the dimensions. The Nord-Leksa Reef rises from about 210 to 145 m water depth and has a dimension of about 1,700 m in west-to-east and about 600 m in north-to-south direction, with a saddle-like depression between two main reef tops (Figure 2B). Similar to the Sula Reef, Lophelia pertusa is the most dominant coral species at the inshore reef at Nord-Leksa.
Figure 2

Bathymetric maps of (A) the Sula Reef Complex obtained from the ‘Marine AREA database for NOrwegian waters’ (MAREANO) with the water depth profile indicated in a scale bar in metres adapted from Thorsnes et al. (2016), and (B) Nord-Leksa Reef Bank produced based on navigation data during our cruises with RV Poseidon. Yellow stars indicate the positions of the SEAGUARD® Recording Current Meter (RCM) deployed at Sula (C) and the benthic lander systems (Satellite Lander Module, ‘SLM’) deployed at Nord-Leksa (SLMreef and SLMoff-reef, D) to monitor oceanographic and environmental data such as temperature, conductivity and flow.
In addition to the two studied reef sites, a side experiment was carried out at the shallow Tautra Reef (Figure 1B) at 39–50 m, where water samples for characterisation of the biogeochemistry were taken by divers very close to the polyps. Water sampling at such close proximity to the polyps is usually not possible by CTD sampling in the deeper reef areas and the information might help to further understand the linkages of organic matter recycling processes within the reef.
The geochemical and physical sample collections and measurements as well as benthic lander deployments and recoveries were carried out during two cruises with RV Poseidon (GEOMAR, 2015) in June/July 2013 (POS455) and August 2014 (POS473). Lists of stations and water samples are provided in the cruise reports of POS455 and POS473 by (Form et al., 2014, 2015) and are summarised in Table 1.
Table 1
| Cruise | Station | Date | Site | Gear | Lat (°N) | Lon (°E) | Depth (m) | Remark |
|---|---|---|---|---|---|---|---|---|
| POS455 | 835/1 | 29.06.13 | Near NLeksa | CTD | 63°36.63’ | 9°19.91’ | 281 | |
| POS455 | 837/2 | 30.06.13 | NLeksa | CTD | 63°36.57’ | 9°22.48’ | 236 | WSD: 232, 197, 158, 118, 79, 59, 25 |
| POS455 | 838/1 | 30.06.13 | NLeksa | JAGO | 63°36.43’ | 9°22.74’ | 175 | |
| POS455 | 839/1 | 01.07.13 | NLeksa | JAGO | 63°43.31’ | 9°55.17’ | 140 | |
| POS455 | 842/1 | 02.07.13 | NLeksa | SLMreef | 63°36.48’ | 9°22.96’ | 185 | Deployed at 175m |
| POS455 | 844/1 | 02.07.13 | NLeksa | SLMoffreef | 63°36.54’ | 9°22.93’ | 216 | Deployed at 210m |
| POS455 | 846/1 | 02.07.13 | NLeksa | CTD | 63°36.40’ | 9°20.51’ | N/A | |
| POS455 | 848/1 | 03.07.13 | NLeksa | CTD | 63°36.54’ | 9°22.90’ | 216 | WSD: 211m |
| POS455 | 849/1 | 03.07.13 | NLeksa | CTD | 63°36.45’ | 9°22.95’ | 175 | WSD: 172 m |
| POS455 | 850/2 | 04.07.13 | Sula | SEAGUARD | 64°6.65’ | 8°7.06’ | 300 | Deployed at 290m |
| POS455 | 850/3 | 04.07.13 | Sula | JAGO | 64°6.64’ | 8°7.07’ | 301 | |
| POS455 | 851/1 | 04.07.13 | Sula | JAGO | 64°6.64’ | 8°7.13’ | 299 | |
| POS455 | 852/1 | 05.07.13 | Sula | CTD | 64°6.65’ | 8°7.23’ | 300 | WSD: 290, 260m |
| POS455 | 856/1 | 07.07.13 | NLeksa | CTD | 63°36.54’ | 9°22.96’ | 214 | WSD: 205, 175m |
| POS455 | 857/1 | 07.07.13 | NLeksa | CTD | 63°36.42’ | 9°22.93’ | 217 | WSD: 200, 170m |
| POS455 | 863/1 | 11.07.13 | Sula | CTD | 64°6.70’ | 8°7.13’ | N/A | |
| POS455 | 865/1 | 11.07.13 | Sula | CTD | 64°6.70’ | 8°7.02’ | 302 | WSD: 290, 260m |
| POS473 | 886-1 | 18.08.14 | NLeksa | CTD | 63°36.6’ | 9° 22.93’ | 195 | WSD: 182,170,20 m |
| POS473 | 887-1 | 18.08.14 | NLeksa | JAGO | 63°36.5’ | 9° 23.04’ | 221 | WSD: 180 m |
| POS473 | 888-1 | 18.08.14 | NLeksa | CTD | 63°36.5’ | 9° 23.03’ | 188 | |
| POS473 | 889-1 | 19.08.14 | NLeksa | CTD | 63°36.6’ | 9° 22.89’ | 217 | WSD: 208,198,20 m |
| POS473 | 891-1 | 19.08.14 | NLeksa | CTD | 63°36.5’ | 9° 22.96’ | 217 | |
| POS473 | 894-1 | 20.08.14 | NLeksa | SLMreef | 63°36.6’ | 9° 23.02’ | 207 | Recovery |
| POS473 | 896-1 | 21.08.14 | NLeksa | SLMoff-reef | 63°36.5’ | 9° 22.93’ | 211 | Recovery |
| POS473 | 899-1 | 22.08.14 | NLeksa | JAGO | 63°36.5’ | 9° 22.89’ | 210 | WSD: 163 m |
| POS473 | 902-1 | 23.08.14 | NLeksa | JAGO | 63°36.5’ | 9° 22.94’ | 174 | |
| POS473 | 907-1 | 25.08.14 | NLeksa | JAGO | 63°36.5’ | 9° 22.61’ | 220 | WSD: 219 m |
| POS473 | 909-1 | 26.08.14 | Sula | JAGO | 64°6.63’ | 8° 7.07’ | 304 | WSD: 304 m |
| POS473 | 910-1 | 26.08.14 | Sula | CTD | 64°6.66’ | 8° 7.12’ | 301 | WSD: 290,280,20 m |
| POS473 | 911-1 | 26.08.14 | Sula | JAGO | 64°6.63’ | 8° 7.09’ | 306 | WSD: 275 m |
| POS473 | 912-1 | 27.08.14 | Sula | SEAGUARD | 64°6.65’ | 8° 7.14’ | 300 | Recovery |
| POS473 | 915-1 | 28.08.14 | Sula | CTD | 64°4.91’ | 8° 1.97’ | 280 | WSD: 270, 260, 20m |
| POS473 | 917-1 | 28.08.14 | Sula | CTD | 64°4.95’ | 8° 1.97’ | 283 |
Stations of cruises P455 + P473 with RV Poseidon in 2013 and 2014, respectively.
WSD, water sampling depths.
2.2 Submersible dives
Dives for positioning the lander systems, coral sampling, and characterisation of the reefs via video and still photos were carried out with the manned submersible JAGO (GEOMAR, 2017) at Sula and Nord-Leksa reefs. The highly manoeuvrable research submersible is certified to an operating depth of up to 400 m and accommodates a pilot and an observer. The vehicle is equipped with an underwater navigation and positioning system (USBL), a compass, depth gauges, vertical and horizontal scanning sonar, underwater acoustic telephone communication, digital video (Full-HD 1080p/50p), still cameras and oceanographic sensors. With JAGO’s manipulator arm, sample collection and transportation of small research devices can be carried out such as the positioning of the benthic lander systems.
During the two cruises in 2013 and 2014, JAGO spent 116 hours under water during 40 dives at the two study sites. The JAGO video and still footage was further used to compare general reef characteristics like the reef health status according to Flögel et al. (2014) and the associated fauna between the reef sites. Since the main objectives of the dives were carried out for the purpose of deploying and recovering equipment and collecting samples, the video footage is not suitable for extensive habitat analysis, as distance to the reef changed continuously and no transects were followed. Some marked features can be described and compared between the study sites nonetheless and are described in the results (section 3.1).
2.3 Bottom water monitoring
Three lander systems equipped with oceanographic and environmental data loggers were deployed in the vicinity of the CWC reefs at the two reef locations Sula and Nord-Leksa for over 13 months (Figure 2). The deployment sites were chosen to allow comparison of the hydrodynamics inshore and offshore (Sula vs. Nord-Leksa, Figures 2A, B), as well as the central reef and the surrounding reef margin in Nord-Leksa (Figure 2B). After a detailed survey with JAGO during POS455 in 2013 to find suitable flat bottom topography in the vicinity of live corals for lander deployment, two benthic landers (Satellite Lander Modules, SLM’s, GEOMAR, Germany, Figure 2D) were deployed on 2nd July 2013 on the southwestern part of the Nord-Leksa Reef. The first SLM was deployed at 63°36.487’N and 09°22.956’E at a water depth of 175 m within the living reef structure in the valley between the two reef plateaus (referred to as SLMreef hereafter), surrounded by a diverse fauna of many live L. pertusa, gorgonians, Acesta excavata and Mycale sp. within a few metres to the west and dead coral rubble and soft corals to the east. The second SLM was deployed at 63°36.454’N and 09°22.915’E at 217 m depth adjacent to the reef (referred to as SLMoff-reef hereafter). The landers were deployed 70 m apart from each other (Figure 2B). Both landers were equipped with the following instruments, located 50 cm above the seafloor: an Acoustic Doppler Current Profiler (SBE 300kHz ADCP, Teledyne RD Instruments) to measure water column flow speed and direction in 10-minute intervals, a conductivity, temperature and pressure measuring instrument (SBE 16 PLUS CTD, Sea-Bird Scientific), and sensors to monitor dissolved oxygen (SBE 43), pH (SBE 27 pH and O.R.P. (Redox) sensor), turbidity and chlorophyll fluorescence (WETLabs ECO-FLNTU(RT)D) measuring in 15-minute intervals.
At Sula, a SEAGUARD® Recording Current Meter (TD 262b SEAGUARD® RCM, AANDERAA Data Instruments, Bergen, Norway) equipped with a ZPulse Doppler Current Sensor (DCS), a pressure/temperature sensor combination, and a conductivity/temperature sensor combination was mounted in a pyramid-shaped POM frame (Figure 2C) and deployed with the sensors located 75 cm above the seafloor. Oceanographic data comprised tilt-corrected horizontal flow speed and direction, pressure, conductivity, and temperature (both, conductivity and pressure sensors recorded temperature as well, of which the conductivity sensor-based temperature was used here). The parameters were logged in a 30-minute interval. The SEAGUARD® lander was deployed on 4th July 2013 at 64°06.66’N and 08°07.12’E in 305 m water depth 50–75 m from extensive live L. pertusa reef framework in the mid-west of the northern Sula Ridge reef area (Figure 2A).
The resolution and accuracy of the measurements of all three landers are shown in Table 2. In August 2014, almost 14 months after deployment, landers were successfully recovered.
Table 2
| SEAGUARD® lander | SLM landers | CTD RV Poseidon | |
|---|---|---|---|
| Flow measurements | Zpulse Doppler Current sensor | RDI Workhorse sentinel 300 kHz | |
| Velocity acc/res | ± 0.15 cm/s/0.01 cm/s | 0.5% | |
| Direction acc/res | ± 5°/0.01° | ||
| Echo intensity acc/res | ± 1.5 dB | ||
| CTD | SBE 16 plus | SBE 911 plus | |
| T in acc/res [°C] | 0.03/0.001 | ± 0.005/0.0001 | ± 0.001/0.0002 |
| C in acc/res [mS m-1] | ± 0.18/0.2 | ± 0.5/0.05 | ± 0.3/0.04 |
| P in acc/res [% WD-1] | ± 0.02/< 0.0001 (%FSO, 2000 m) | ± 0.1/0.002 | ± 0.015/0.001 |
| Releaser or Deck unit | Video-controlled launcher or K/MT 562 | SBE 11 plus deck unit | |
| Additional sensors and instruments | turbidity, dissolved oxygen, pH, chl-a, fluorescence | Fluorescence of chl-a, dissolved oxygen, turbidity, 12×10 rosette | |
Instrumentation details and metadata for landers and on-board CTDs.
acc, accuracy; res, resolution; T, temperature; C, conductivity; P, pressure; WD, water depth.
In Nord-Leksa, the benthic landers turned out to be too light to cope with the strong bottom currents at the deployment depths. SLMoff-reef moved uphill twice during the deployment period, with total vertical movement of 5 m. It first moved between 17th and 19th November 2013 from 216.5 to 214 m, and again between 13th to 14th April 2014 to 211 m depth. SLMreef moved downwards from deployment depth of 175 m to ~ 180 m within the first hour of deployment, where it remained for 5 days. The lander moved several times over the year between depths of 180 and 213 m. At the end of January 2014, the Lander-CTD stopped working at 207 m depth. Both SLMs were stable at the bottom and recording over three periods: 2nd – 7th July 2013, 22nd August – 16th November 2013 and 19th November 2013 – 30th January 2014. The SEAGUARD® lander in Sula remained in place and delivered continuous data of all sensors.
From Nord-Leksa, we have reliable time series of ADCP, CTD, oxygen of both landers and turbidity from SLMreef, while the pH sensors of both landers and the turbidity sensor of SLMoff-reef malfunctioned. The first five days of deployment were used to compare the environmental conditions within Nord-Leksa and only the measurements of SLMoff-reef were used to compare the intra-annual conditions between the inshore and offshore sites. The conductivity sensors had drifts that amounted to -0.3 g kg-1 (SLM) and to -1.2 g kg-1 (SEAGUARD) over the deployment periods. These drifts have been considered when the hydrographical variables (SA, Θ and σΘ) were calculated.
2.4 Water column characteristics and biogeochemistry
To measure water column characteristics at both sites, a CTD system (SBE 911 plus, Sea-Bird Scientific) was used during both cruises. The employed CTD system was built into a rosette housing with 12 10-litre water sampling bottles (Niskin-type). Water samples were taken close to the bottom and in pre-defined depths of the water column (see Table 1). In addition to the CTD system, the rosette frame was equipped with sensors measuring dissolved oxygen, fluorescence of chlorophyll-a, and turbidity. Of the latter two only data from POS455 (2013) are available. Calibrations of the sensors were performed prior to the cruise in the laboratory and all parameters yielded coefficients for a linear fit.
2.4.1 In-reef water sampling at Tautra Reef
At the shallow Tautra Reef in the Trondheimsfjord, water samples were taken by divers with a syringe at close proximity to live coral colonies (63°36.045’N, 10°30.466’E) during POS455 in 2013. The first sample was taken approximately a few tens of metres away from the reef at 50 m water depth on 3rd July 2013. The following day, samples were taken directly from within live coral colonies close to expanded polyps from the lower reef slope at 42 m, the upper reef slope at 40 m and the reef summit at 39 m water depth (Figure 3). Samples were taken using 100 mL syringes (Omnifix® Solo, B. Braun Melsungen AG). The water samples remained in the syringes with closed tip until surfacing and were then sterile-filtered (Sartopore® sterile capsule, Sartorius Stedim Biotech GmbH) on-board the diver’s zodiac and poisoned with mercuric chloride (HgCl2) when brought to RV Poseidon.
Figure 3

Diver taking water samples directly at Lophelia reef colonies from the milieu between the skeletal structures at the Tautra Reef (Trondheimsfjord) (A), at the reef summit, the upper and the lower reef slope of live corals (B). Photo credit in (A): Uli Kunz, Schematic (B) modified from Freiwald et al., 2004.
2.4.2 Carbonate chemistry and nutrient analyses
Water samples for measurements of total alkalinity (TA) and dissolved inorganic carbon (DIC) were sterile-filtered (0.2 µm disposable filters, Minisart®, Sartorius AG), HgCl2-poisoned to arrest biological activity, and stored in a cool, dark place until measurement as recommended by Dickson et al. (2007). TA was analysed via potentiometric open-cell titration with an automatic titrator (Titrino 862 Compact Titrosampler, Metrohm). DIC was analysed via infrared detection of CO2 using an Automated Infra-Red Inorganic Carbon Analyser (AIRICA with LI-COR 7000, Marianda). TA and DIC were calculated accounting for the salinity of the samples and corrected against Certified Reference Materials from A. G. Dickson (Scripps Institution of Oceanography). Additional parameters of the carbonate chemistry were calculated by means of the CO2sys_v.2.1 Excel macro (Pierrot et al., 2011) using the thermodynamic constants of Mehrbach et al. (1973), refitted by Dickson and Millero (1987), on the total scale.
Water samples for analysis of the dissolved inorganic nutrients nitrate (NO3-), nitrite (NO2-), ammonium (NH4+), and phosphate (PO43-), were sterile-filtered into 100 mL HDPE vials (Nalgene®) and frozen at -20°C until analysis. All nutrients were analysed based on the general methods described by Hansen and Koroleff (1999) using a four-channel Automated Continuous Segmented Flow Analyzer (A3, SEAL Analytical). Detection limits were 0.05 µmol L-1 for NO3- (as combined NO3- and NO2-), 0.06 µg L-1 for NO2-, 0.02 µmol L-1 for PO43-, and 0.04 µmol L-1 for NH4+. Nitrate concentrations were determined by subtracting nitrite values from the combined NO3- and NO2- measurements.
2.5 Data analysis
Further processing of the hydrographic data was performed using the software SBE Data Processing© (V7.26.7, Sea-Bird Scientific (2013)) for SLM landers and CTD cast data. For further conversions and visualisation of the oceanographic and environmental data, MATLAB 9.0 (R2016a, The MathWorks, Inc. (1984)) was used. For subsequent data analysis, the raw CTD and ADCP data were converted. CTD data were converted to absolute salinity (SA), conservative temperature (Θ), potential density (ρ) and potential density anomaly (σΘ), i.e. sigma-theta values according to TEOS-10 standard (McDougall and Barker, 2011). The current measurements were corrected for the local magnetic declination based on IGRF-11 model data (Finlay et al., 2010). The site-characteristic dominant tidal frequencies, ω, and their amplitudes, a, were analysed with the harmonic analysis toolbox T_Tide (Pawlowicz et al., 2002). The tidal signals were analysed by using bottom pressure and horizontal velocity fields. Only tidal signals with a signal-to-noise ratio > 2 are considered to be significant.
2.6 Global datasets and oceanographic models
For CWC habitat suitability and conservation analyses, large-scale habitat suitability models are utilised, using global databases and regional ocean models (Davies and Guinotte, 2011; Yesson et al., 2017; Morato et al., 2020). Comparison of field observations to these databases and ocean models is crucial, primarily to ground truth model data and to increase model reliability in general. The carbonate chemistry parameters and nutrients are usually obtained from global databases such as GLODAP (Lauvset et al., 2016) and World Ocean Atlas (Garcia et al., 2013) with low resolution of 1° and down-scaled. Since this resolution is not suitable for inshore sites, we compared the global values from 64.5°N, 8.5°E at 200–250 m depth for Sula and 64.5°N 9.5°E at 125–200 m depth for Nord-Leksa as closest approximation to our studied inshore site. For coastal Norway, the coastal currents are modelled with daily 800-m resolution with the NorKyst-model (Albretsen et al., 2011). This model data was compared with lander deployments from the closest model points for summer 2013 to summer 2014 and with the Tautra Reef area.
3 Results
3.1 Descriptive reef characteristics and biodiversity
Both Nord-Leksa and Sula reef sites belong to category I (healthy reefs and mounds) out of three according to the classification of CWC reef statuses described in Flögel et al. (2014), as both reef habitats are characterised by several 100 m2 horizontal area and > 2/3 vertical extent of living colonies, therewith comprising large biogenic constructions with discrete morphologies (Figure 4). Nevertheless, the colony morphology differs between sites. At Nord-Leksa, the corals form ‘cauliflower’-like colonies with compact polyp arrangement, while at Sula ‘cauliflower’-like colonies are more dispersedly branched with thinner and more extended polyps (Figures 4G, H).
Figure 4

Live L. pertusa colonies of the study areas at the Sula Reef Complex (left panels) and the Nord-Leksa Reef (right panels) in the vicinity of the deployed lander systems. Pictures (A, B) show the reef top at both study sites, commonly interspersed by Mycale sp. at Nord-Leksa Reef (B). (C, D) are pictures from the dead framework zone at the base of the reef, showing the rich and diverse associated fauna. (E, F) show white and orange colonies side by side at both study sites. Finally, (G, H) are close-ups of live colonies demonstrating the different morphologies/growth forms of polyps at Sula and Nord-Leksa. Photographs (A, B) from Max Wisshak, (C-H): JAGO-Team, GEOMAR.
Both sites have rich associated fauna. At Nord-Leksa the living coral reef framework is surrounded by a large coral rubble bed of dead L. pertusa fragments from depths of ~ 200 to 160 m, while the reef framework at Sula is surrounded by sandy bottom with sponge-covered boulders or drop stones. In Nord-Leksa, the rubble zone is ‘coral garden’-like, i.e. it is characterised by a benthic community dominated by non-reef-forming soft corals such as the gorgonians Paragorgia arborea and Primnoa resaediformes, Capnella glomerata, and Anthelia borealis. The rubble zone at Nord-Leksa is abundant in sponges (particularly Mycale lingua) and used as a habitat by a range of mobile fauna such as crustaceans (e.g. Munidopsis sp.), bivalves (including the large file clam Acesta excavata), echinoderms and tunicates. Between about 160 and 152 m, a transition zone follows, which makes up the reef base with first live L. pertusa appearing in the white and orange colour morph similar to the Sula Reef, and occasionally M. oculata colonies settling on dead coral framework and rubble. Upslope, the reef framework is characterised by an increasing number of live L. pertusa colonies accompanied by an increasing number of M. lingua, while the abundance of soft corals ceases.
At the offshore study site at Sula, the reef is not surrounded by large rubble fields, but the sandy, rocky seabed (at ~ 302 m) with hard-bottom sponge aggregates transits directly into the base of reef framework of mostly dead L. pertusa (~ 302–296 m) with a very diverse fauna. Associated species in the Sula Reef encompass the same phyla as in Nord-Leksa but appear to have a larger variety on the species level among poriferans, cnidarians and crustaceans. Numerous large actinians and shrimps (Pandalus sp.) are prominent, as well as chaetognaths as abundant zooplankton species. The most remarkable difference between the reef sites (inshore vs. offshore), however, is the abundance and distribution of sponges in the live coral reef zone. The reef top at Nord-Leksa (~ 152–140 m) is interspersed with Mycale sp. (Figure 4B) and occasionally also gorgonians, cluttered with mobile fauna such as Munidopsis sp. and Gorgonocephalus sp., whereas the living reef cover at Sula (~ 296–283 m) is free of sponges (Figure 4A) and only the dead basis of the reef in between broken-up colonies inhabits a large variety of particularly large sponges (e.g. very commonly Geodia sp.) and large gorgonian colonies of Paragorgia and Primnoa. In comparison to Nord-Leksa, only few A. excavata were found at Sula and often only shells. The few individual living A. excavata had far brighter, i.e. cleaner shells, whereas at Nord-Leksa shells were overgrown and more strongly eroded by bioeroders.
Similar fish species were spotted at both sites, including saithe (Pollachius virens), tusk (Brosme brosme), monkfish (Lophius sp.), and red fish (Sebastes sp.). The latter is the most common species living within the reef framework but was more abundant at Sula. Most common cartilaginous fish included chimaeras at Sula and the velvet belly lantern shark at Nord-Leksa, but also at Sula shark and ray eggs were observed.
3.2 Water column hydrography (CTD casts)
3.2.1 Nord-Leksa
In July 2013, the surface layer was 30 m deep with salinities < 33.5 g kg-1. The WMW was observed as a cool (~ 7.5°C) and fresh (33.5–34.6 g kg-1) layer between 30 and 100 m water depth (Figures 5A, B). It rested above the NCW, which occupied water depths from 100 to 150 m, and the AW in > 150 m water depths (Figure 6). The water column in summer 2013 was therefore composed of surface waters, the WMW, the NCW and the AW. In August 2014, the situation was different, as there was no mid-water temperature minimum (Figure 5A). Below surface waters (< 33.5 g kg-1) the NCW occupied waters between 10 and 100 metres (< 8°C, < 35 g kg-1) and the AW was found in depths > 100 m (Figure 6). The waters were well stratified. In July 2013, the WMW showed lower turbidity values compared to the rest of the water column. Turbidity increased at depths of the CWC reef (150–180 m; Figure 5F). Profiles of oxygen concentration were rather similar between July 2013 and August 2014 with lower values in 2014 (Figure 5D), which could be related to the time-lag of sensor calibration between both years. Oxygen concentrations were supersaturated in the relatively warm and fresh surface layer of ~ 20 m. Oxygen saturation decreased with depth to a minimum of ~ 91% between 60–80 m, below which values increased slightly and remained steadily at values between 92 to 93% up to the seabed.
Figure 5
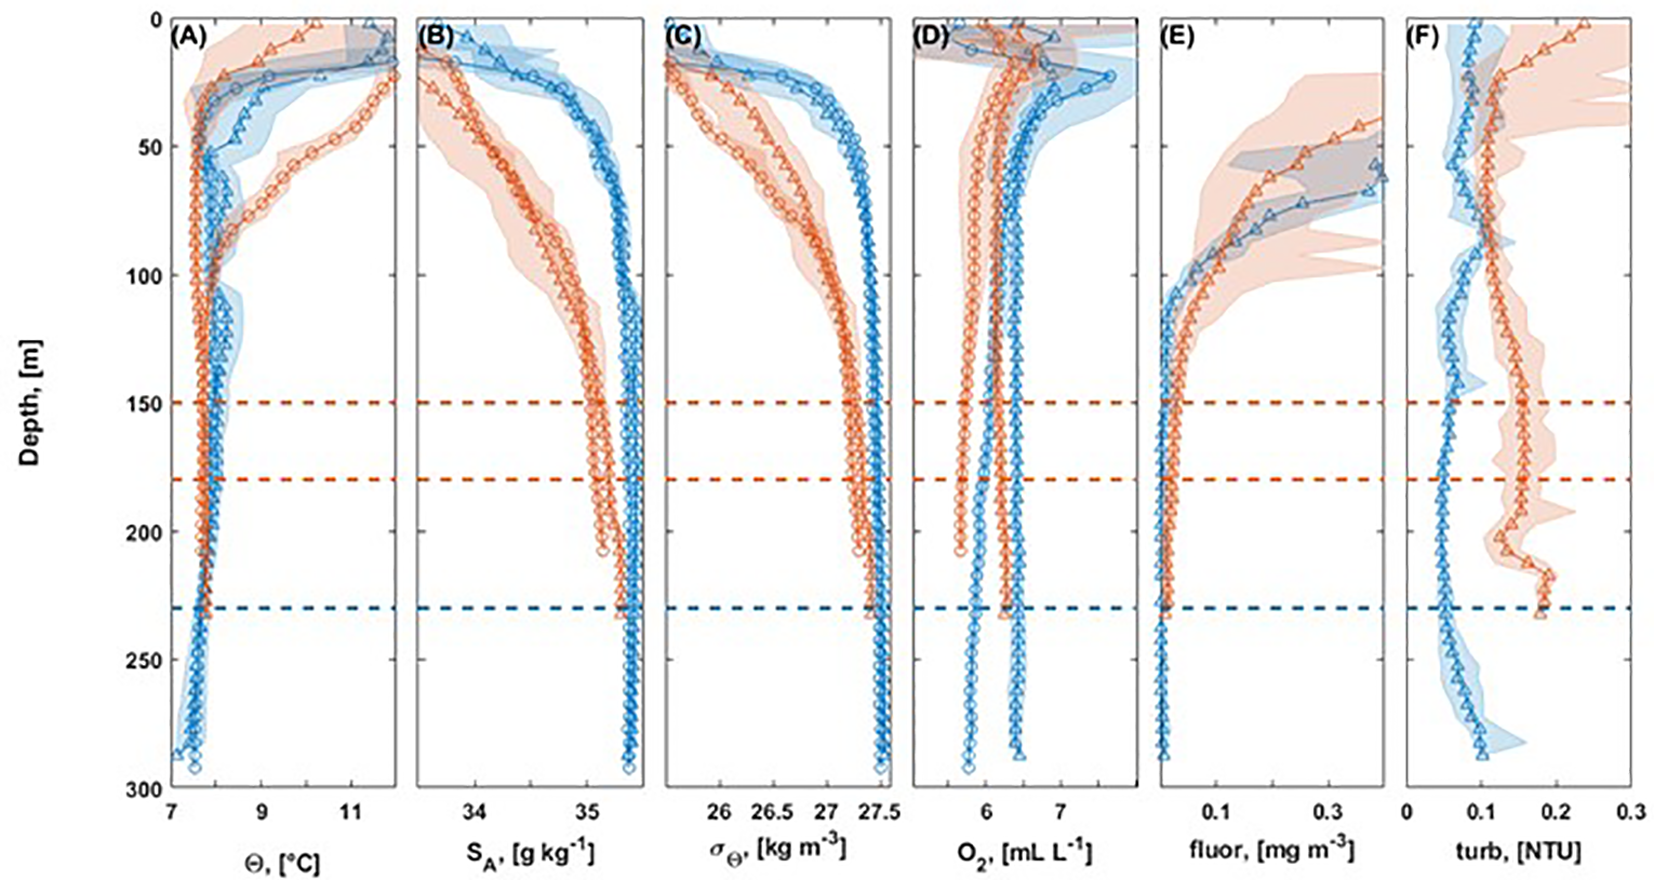
Downcast profiles of CTD stations for Sula (blue) and Nord-Leksa (orange) for cruises P455 in July 2013 (triangles) and P473 in July/August 2014 (circles) for conservative temperature (A), absolute salinity (B), sigma-theta (C), oxygen concentration (D), fluorescence (E), and turbidity (F). Dashed lines indicate depths of living cold-water corals at Nord-Leksa (orange) and Sula (blue).
Figure 6
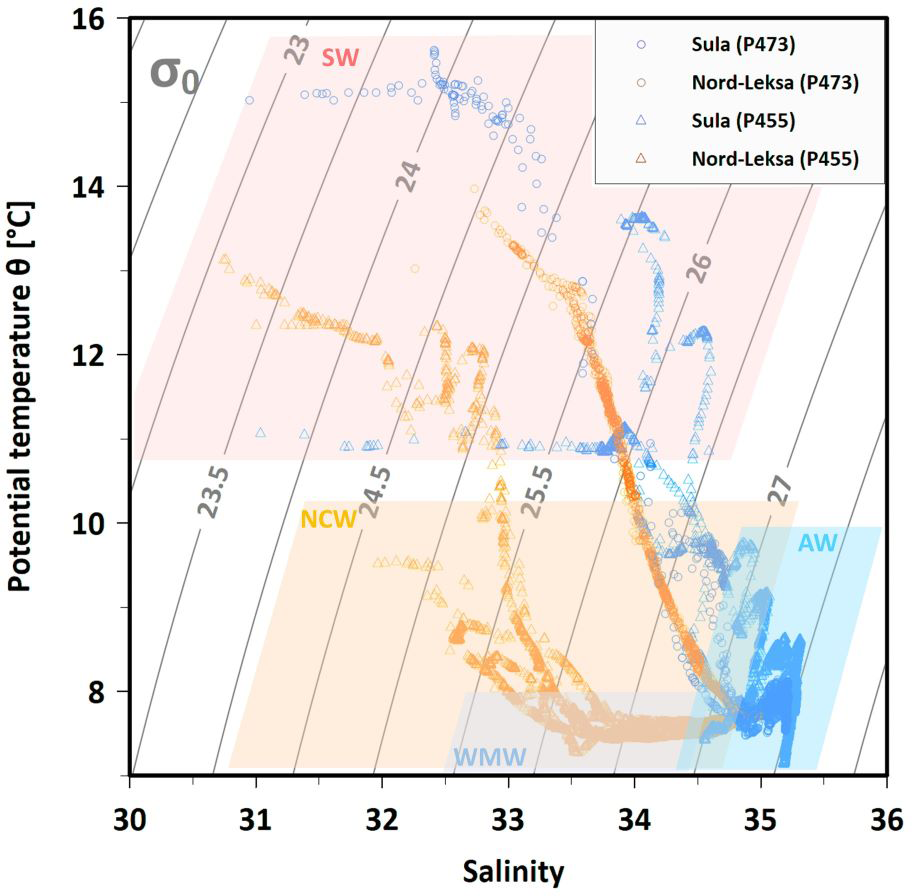
Temperature-Salinity plot based on CTD casts from summer 2013 and 2014 inshore (Nord-Leksa, orange) and offshore (Sula, blue), indicating water masses present in mid-Norway in shaded rectangles: Atlantic Water (AW) in blue, Norwegian Coastal Water (NCW) in orange, Winter Mode Water (WMW) in light-blue, Surface Water (SW) in red.
The environmental parameters at the depths of the CWC reef at Nord-Leksa showed typical values of temperatures of 7.69–7.76°C, salinities of 35.01–35.22 g kg-1, sigma-theta of 27.25–27.35 kg m-3, oxygen of 5.7–6.3 mL L-1, fluorescence of ≤ 0.03 mg m-3, and turbidity of 0.11–0.20 NTU during both cruises (Figure 5).
3.2.2 Sula
At Sula, the differences between July 2013 and August 2014 water column characteristics were small compared to Nord-Leksa (Figures 5, 6). In July ‘13, the water column was saltier and oxygen levels were higher than in August the following year, but in both months, the water column was composed of surface waters (the upper 50 m, SA < 35 g kg-1) and the AW below it (Figure 6). In July 2013, the fluorescence peaked at 30 m with 3.14 mg m-3 and was < 0.27 mg m-3 beneath 70 m (Figure 5E). Oxygen profiles at Sula were similar to Nord-Leksa with generally higher oxygen concentrations in both years. Oxygen concentrations peaked at ~ 23 m water depth, which coincided with elevated temperatures. Below oxygen concentrations remained steady (2013) or slightly decreased (2014) with depth.
The environmental parameters at depths of the CWC reef at Sula showed typical temperatures of 7.13–7.86°C, salinities of 35.35–35.44 g kg-1, sigma-theta of 27.50–27.55 kg m-3, oxygen of 5.7–6.5 mL L-1, fluorescence of ≤ 0.02 mg m-3, and turbidity of 0.04–0.16 NTU during the cruises (Figure 5).
3.3 Short-term environmental variability at Nord-Leksa (Benthic landers)
During the first week after deployment (from 2nd to 7th July 2013), both landers remained stable at their deployment positions (Figure 7). Although SLMreef was located in shallower depths, the water was cooler (Θ = 7.78 ± 0.01°C), more saline (SA = 35.23 ± 0.04 g kg-1) and, hence, denser (σΘ = 27.36 ± 0.03 kg m-3) than at SLMoff-reef (Θ = 7.79 ± 0.01°C, SA = 35.07 ± 0.02 g kg-1 and σΘ = 27.23 ± 0.02 kg m-3) (Figures 7A–F). The variance of the hydrographic variables was higher at SLMreef than at SLMoff-reef. Oxygen concentration levels were similar at both lander positions during the first week of deployment, but fluctuated more at SLMreef as well (Figures 7G, H). The bottom flow was stronger at SLMreef (Umean = 13.53 cm s-1, Umax = 41.59 cm s-1) than at SLMoff-reef (Umean = 12.9 cm s-1, Umax = 37.66 cm s-1) (Figures 7I, J). The flow direction oscillated between SSE and ESE at SLMreef whereas at SLMoff-reef, the flow oscillated between E and WSW (Figures 7K, L). For the other comparable periods (22th August – 16th November 2013 and 19th November 2013 – 30th January 2014), the SLMreef lander measured slightly higher salinities (ΔSA = 0.2 g kg-1) and bottom flow speeds (ΔUmean = 1 cm s-1) than SLMoff-reef, but fluctuations and range of the oceanographic variables were close to each other (not shown).
Figure 7
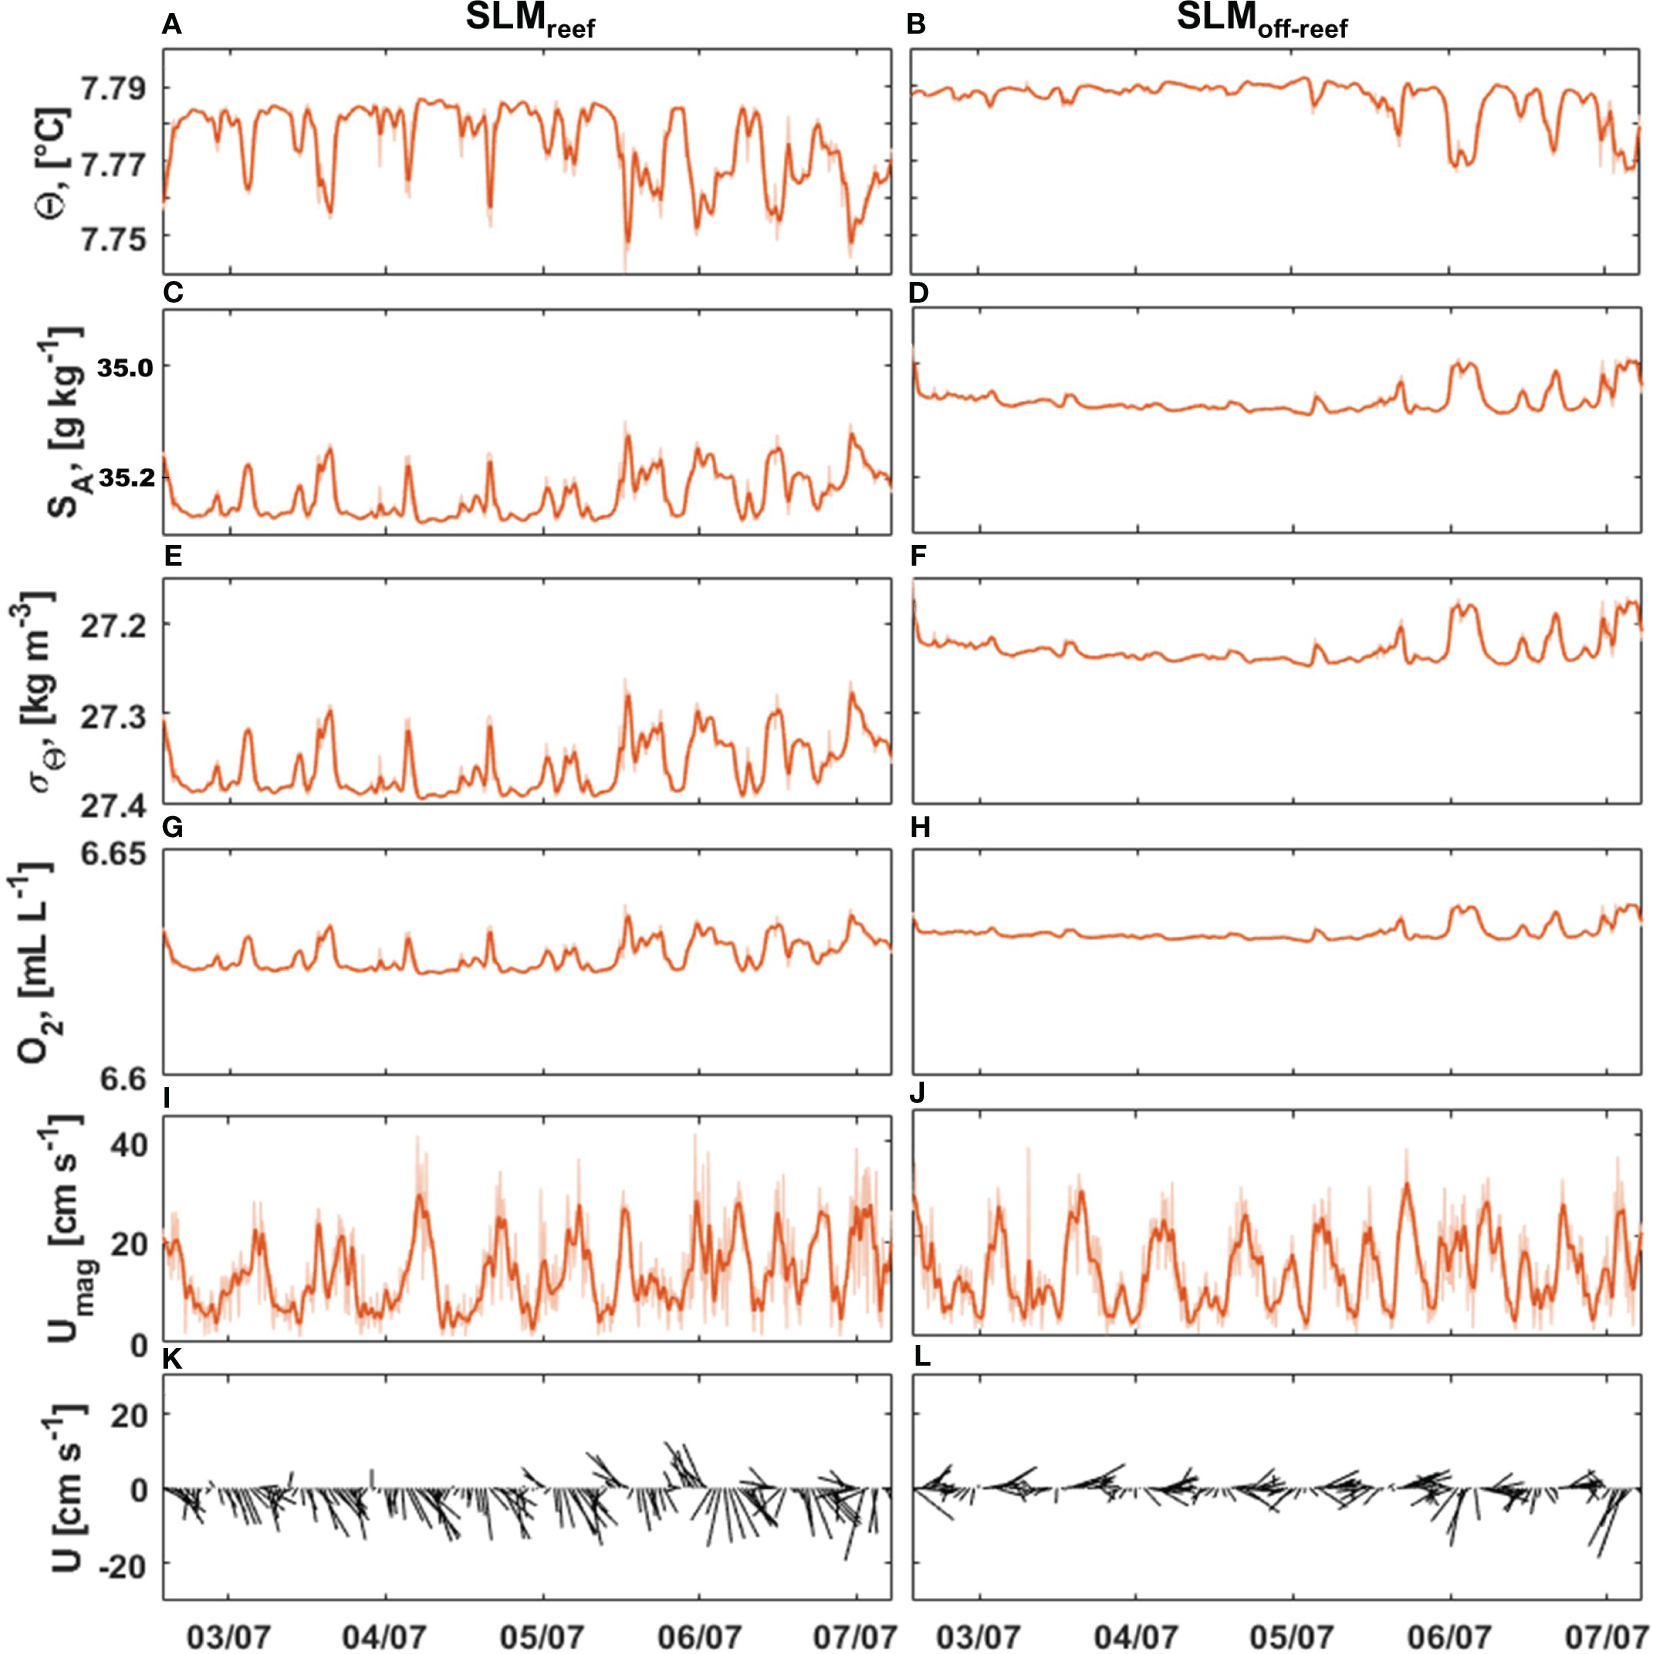
Comparison of bottom water characteristics of the first week of deployment for SLMreef (left panels) and SLMoff-reef (right panels) for potential temperature (A, B), absolute salinity (C, D), sigma-theta (E, F), oxygen concentration (G, H), flow speed (I, J), and horizontal direction (up - north, down - south) (K, L). The thicker orange line shows the 1-h running mean and the horizontal direction is shown with 1-h resolution. Note the reversed y-axis for absolute salinity (subplots C, D).
3.4 Long-term environmental variability at Sula and Nord-Leksa (Benthic landers)
3.4.1 Hydrography
The bottom water temperature, Θ, varied between 7.03°C and 8.91°C in Sula and between 6.83°C and 8.97°C in Nord-Leksa over the year (Figure 8). On average, the bottom waters were warmer in Nord-Leksa (7.93 ± 0.34°C, Figure 8B) than in Sula (7.52 ± 0.30°C, Figure 8A) throughout the year. The bottom water salinity, SA, varied between 31.12 g kg-1 and 36.06 g kg-1 in Sula and between 34.11 g kg-1 and 35.09 g kg-1 in Nord-Leksa. On average, bottom water salinities were higher at Sula (35.13 ± 0.50 g kg-1, Figure 8D) than at Nord-Leksa (34.80 ± 0.16 g kg-1) (Figure 8E). Sigma-theta, σΘ, varied from 24.18 kg m-3 to 28.04 kg m-3 in Sula (Figure 8G) and from 26.47 kg m-3 to 27.25 kg m-3 in Nord-Leksa (Figure 8H).
Figure 8

Long-term bottom water characteristics for Sula (left panels, blue) and Nord-Leksa (middle panels, orange) compared to Kyst800-model data (grey) for the three sites Sula (left panels), Nordleksa (middle panels) and Tautra (right panels) showing temperature (A–C), absolute salinity (D–F), sigma-theta (G–I), oxygen concentration (for Nord-Leksa only, J), flow speed (K–M), and horizontal direction (N–P) (up -north, down-south). The thicker blue and orange lines show the 1-d running mean and the horizontal direction is shown with 1-d resolution. Note the reversed y-axes in salinity (D–F) and sigma-theta plots (G–H).
On a seasonal level, bottom waters at Sula were densest between April and September, with relatively high monthly mean salinity (> 35.2 g kg-1). The bottom water warmed and became fresher during autumn. The warmest values (> 8.5°C) were observed between November and January followed by > 0.5°C drop in monthly mean temperature between January and February (Figure 9A). Bottom water was fresh (< 34 g kg-1) between January and February. Lowest average monthly temperatures were observed in July to September (~ 7.2°C).
Figure 9
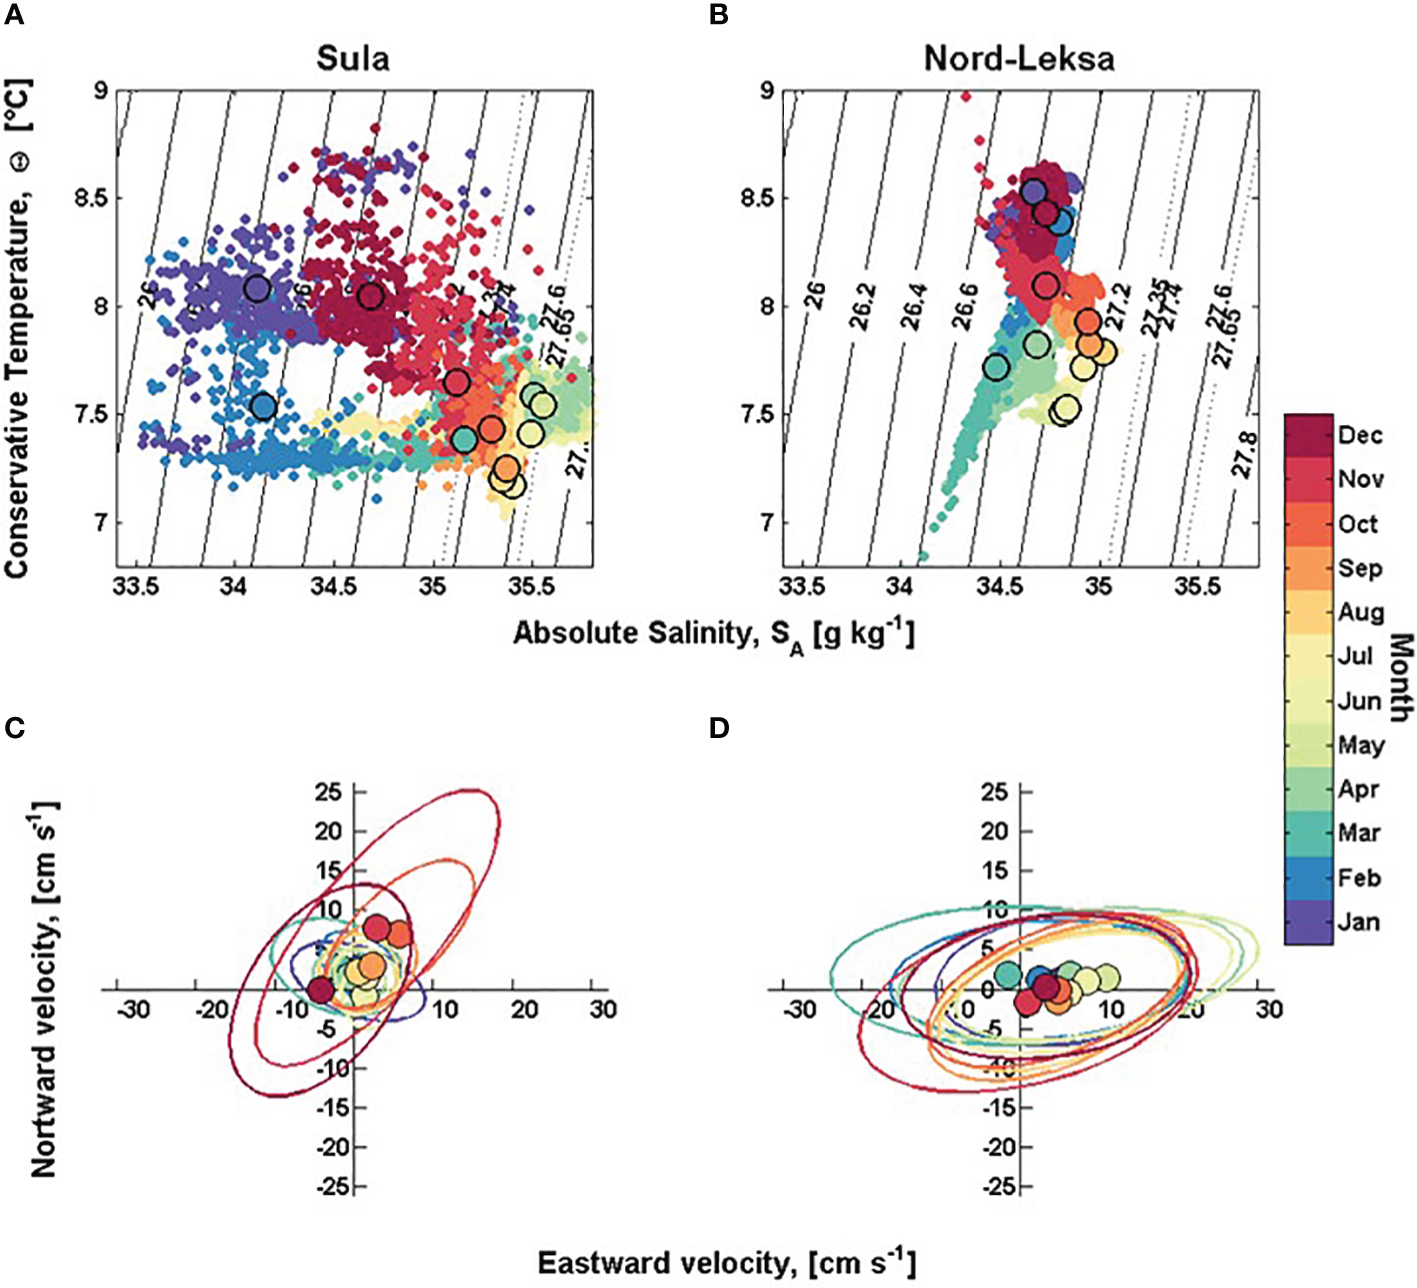
(A, B) Conservative Temperature – Absolute Salinity (Θ–SA) plot of bottom waters from lander deployments from Sula (left) and Nord-Leksa (right). The annual cycle is shown with monthly representative colours and monthly mean values (bigger circles). The sigma-theta range 27.35–27.65 kg m-3 from Dullo et al. (2008) is marked with dotted lines. (C, D) Monthly horizontal velocity variance ellipses with mean velocity from Sula (left) and Nord-Leksa SLMoff-reef (right) from 0.75 masf and 2 masf, respectively, indicating main flow direction and speed each month. The colour scale shows the respective month of the year. Axis scale is ± 32 cm s-1 in eastward and ± 26m s-1 in northward direction.
At Nord-Leksa, the bottom water was densest and most saline from July to September. From August to January, bottom water got warmer and fresher. The bottom waters were warmest from December to February with mean temperatures > 8.3°C. In March, the temperature dropped to < 7.5°C and salinity to < 34.5 g kg-1. In March and in April, the temperature fluctuations were large (> 1°C) compared to other months. The coolest average monthly temperatures in Nord-Leksa (~ 7.5°C) were observed from May to June (Figure 9B).
Over a semidiurnal (M2) tidal cycle (12 h), hydrographic parameters varied, on average, ΔΘ = 0.03°C, ΔSA = 0.08 g kg-1 and ΔσΘ = 0.06 kg m-3 in Nord-Leksa, and ΔΘ = 0.05°C, ΔSA = 0.17 g kg-1 and ΔσΘ = 0.14 kg m-3 in Sula. The maximum semidiurnal variability was measured between November and March with the largest change within 12 h of ΔΘ = 0.90°C, ΔSA = 0.50 g kg-1 and ΔσΘ = 0.38 kg m-3 in Nord-Leksa, and ΔΘ = 0.84°C, ΔSA = 1.64 g kg-1 and ΔσΘ = 1.2 kg m-3 in Sula.
The NorKyst-model for hydrographic values (Albretsen et al., 2011) differed from our observations. The model temperatures were lower than the observed temperatures and the variation range in the model was overestimated. Temperature drops in February/March were more rapid in the model than in the observations (Figures 8A, B). At Tautra, the bottom temperature was estimated to be around 7.31 ± 0.58°C (Figure 8C). At Sula, the mean bottom salinity values were close to each other (SA,NorKyst = 35.27 ± 0.04 g kg-1, SA,meas = 35.13 ± 0.5 g kg-1, Figure 8D). At Nord-Leksa, the model showed more saline waters with overestimated fluctuations of salinity (SA,NorKyst = 35.06 ± 0.26 g kg-1, SA,meas = 34.8 ± 0.16 g kg-1, Figure 8E). The Tautra region was estimated to be fresher than sites further offshore by the model with on average 34.54 ± 0.19 g kg-1 (Figures 8D–F). Due to the differences in temperature and salinity, the model showed ~ 0.25 kg m-3 denser water than observations with a mean density of 26.89 ± 0.21 kg m-3 (Figures 8G–I).
3.4.2 Oxygen
The average oxygen concentration at depth of the CWC reef in Nord-Leksa over the year as recorded by the benthic lander was 6.63 ± 0.05 mL L-1 (210–218 m water depth, Figure 8J). Lowest O2 concentrations of 6.5–6.6 mL L-1 were found in November to December 2013 and in February 2014 and coincided with peaks in temperature and drops in salinity (Figures 8B, E, J). From February to April 2014, O2 increased to maximum concentrations of 6.8 mL L-1, coinciding with decreasing temperatures and increases in salinity.
O2 concentrations recorded by the lander showed a consistent off-set to the CTD oxygen sensors of ~ 0.3 mL L-1 in 2013 to 0.9 mL L-1 in 2014, which is probably related to different sensors and calibrations. The lower end of values (5.7 mL L-1) recorded in 2014 (Figure 5D) may likely be a result of sensor drift due to lack of calibration between both surveys, as lander values revealed similar concentrations of 6.6 mL L-1 each year at the time of CTD data collection.
3.4.3 Flow characteristics
The time-averaged horizontal bottom flow speed, Umean, was 7.9 cm s-1 at Sula and 17.7 cm s-1 at Nord-Leksa. The peak horizontal flow speed was higher at Sula (157 cm s-1) than at Nord-Leksa (104 cm s-1) (Figures 8K, L). In Sula, the highest mean horizontal speeds were recorded in October and November, with mean direction towards northeast (Figures 8N, 9C). Lowest mean speeds were recorded in January, April and June. The direction of the flow oscillated between NE and SW, except from January to April, when the bottom flow direction oscillated between NW and SE (Figures 8N, 9C). Between April and September, the flow was slow and isotropic (Figure 9C).
In Nord-Leksa, the highest monthly mean horizontal bottom flow speeds were recorded in May and June. The bottom flow oscillated between east and west with eastward mean flow (Figures 8O, 9D).
At Nord-Leksa, flow-measurements revealed the vertical structure of the water column at water depths between 80 and 208 m (Figure 10). The mean flow speed peaked with 20–27 cm s-1 at depths of living CWCs at around 150–180 m. The monthly maximum speed values through the measured water column varied between 50 and 160 cm s-1.
Figure 10
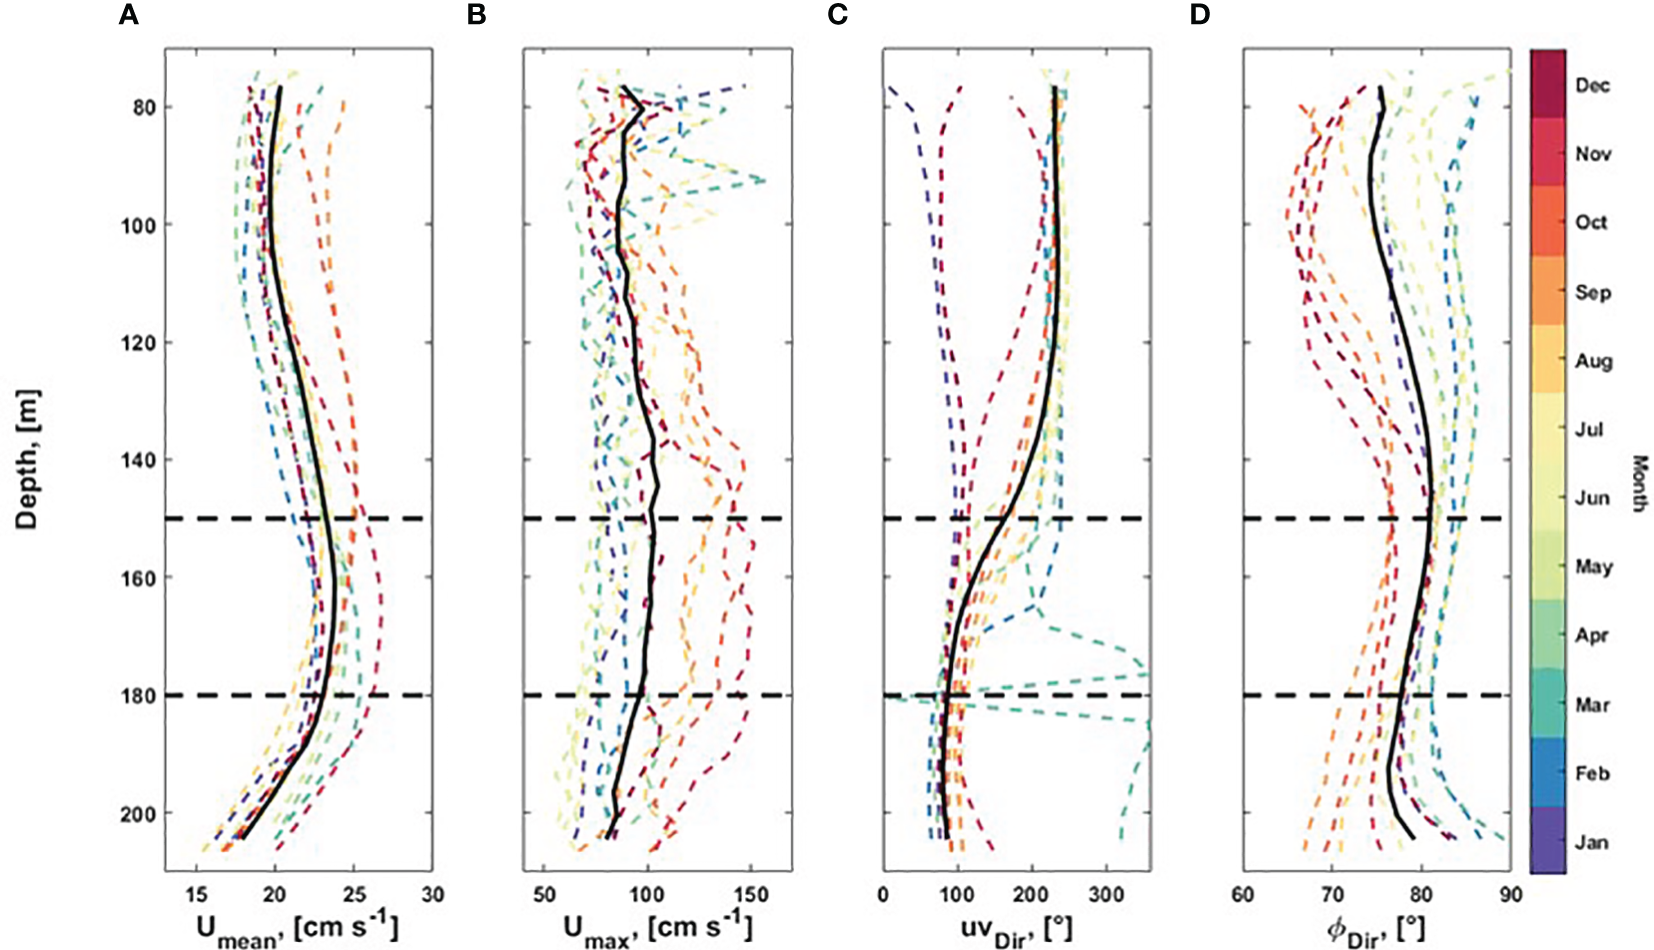
The flow characteristics at Nord-Leksa (SLMoff-reef) showing (A) the monthly mean and (B) maximum horizontal flow profiles, mean horizontal flow direction (C), and variance ellipse orientation (D). The black line shows the annual mean and the horizontal dashed lines show the CWC living depths.
Highest values were recorded from August to November with a peak around CWC depths and lowest maximum values between May and July. The flow oscillated between E and W or between NE and SW. During autumn, the flow was more northward and in winter more eastward. In general, the mean flow direction changed at the depths of the CWCs from east (90 ± 20°) at the lower part of the water column to southwest (230 ± 20°) at the depths above the corals. In December and January, the mean direction was relatively stable through the water column, varying between 76–109° and 46–97°, respectively. In November, the change in the mean direction from east to southwest occurred at depths between 100 and 130 m. In March, the mean direction of the lower part of the water column was towards the north.
The NorKyst-model indicates similar flow speeds, but different flow direction as observed (Figures 8K–P). At Sula, the mean flow magnitude was close to observations (Umean,meas = 7.9 cm s-1 and Umean,NorKyst = 7.32 cm s-1), but the NorKyst mean flow direction was southward, whereas the observed mean flow direction was northward. Peak velocities occurred at different times in Sula. In observations, the flow peaked in November, whereas in the model, the peak flow was in January. At Nord-Leksa, both the mean and the peak NorKyst flow values were lower than observed. Also, the observed flow in Nord-Leksa was tidal-driven with bi-directional velocity, whereas the model flow magnitude variability was more irregular with northward flow direction. At Tautra, the modelled bottom flow was slower than sites further offshore (Umean, NorKyst = 6.39 cm s-1, Umean, NorKyst = 20.2 cm s-1) (Figures 8K–P).
3.4.4 Tides
Tidal analysis of the pressure records explains 98.5% and 6.6% of the pressure fluctuations with 37 and 56 significant constituents at Sula and Nord-Leksa, respectively. When excluding the vertical lander movement periods at Nord-Leksa, the pressure fluctuation is > 95% tidal-driven (Table 3). At both sites, the semidiurnal (M2) signal generates the largest amplitude and it is thus the most significant tidal constituent. It generates an amplitude of 0.70 dbar (Sula) and 0.80 dbar (Nord-Leksa), followed by diurnal K1 (0.08–0.12 dbar) signal.
Table 3
| Site | % | Amplitude (of the most significant constituents) | |||
|---|---|---|---|---|---|
| Lower | Diurnal | Semidiurnal | Higher | ||
| NL | |||||
| p (dbar) | 95.8 | – | 0.07 (K1), 0.05 (O1) | 0.8 (M2), 0.27 (S2) | 0.02 (M4) |
| uv (cm s-1) | 56.6 | – | 0.8 (K1), 0.6 (O1) | 19.1 (M2), 7 (S2) | 1 (M4), 2 (MS4) |
| Sula | |||||
| p (dbar) | 98.4 | – | 0.07 (K1), 0.05 (O1) | 0.7 (M2), 0.24 (S2) | 0.01 (M4) |
| uv (cm s-1) | 6.8 | 2.1 (SA) | – | 2.4 (M2), 1 (S2) | – |
Tidal analysis for bottom pressure and flow record based on the harmonic analysis toolbox T_Tide (Pawlowicz et al., 2002).
For Nord-Leksa, the periods of vertical lander movements are not included in the analysis. Shown are the amplitudes of the two most important constituents in four categories: long, diurnal, semi-diurnal and short period constituents. Explained variance through the tidal model in percent is given next to the parameter. p, pressure; uv, bottom horizontal flow.
The analyses of the tidal constituents from the horizontal velocity records reveal larger differences between the two sites (Table 3). With 5 and 19 significant tidal constituents, tidal analysis explains 6.8% and 56.6% of the horizontal bottom velocity fluctuations at Sula and Nord-Leksa, respectively. The M2 generates amplitudes of 2 cm s-1 at Sula and 20 cm s-1 at Nord-Leksa. The direction of tidal flow was towards WNW (283 ± 10°) at Sula and towards ENE (79 ± 1°) at Nord-Leksa. After M2, the most significant constituents are other semidiurnal (S2 and N2), semi-annual (SSA) and annual (SA) constituents in Sula and semidiurnal (S2, N2), diurnal (H1) and shallow water (MS4) constituents in Nord-Leksa.
3.5 Carbonate chemistry and dissolved inorganic nutrients
3.5.1 Carbonate system
The carbonate chemistry at the lander positions differed between the times of deployment in 2013 and recovery in 2014 with regard to TA, corresponding to changes in the pH, pCO2, carbonate ions and the aragonite saturation state (ΩAr). DIC values were similar (maximum of ± 12 µmol kgseawater-1 in standard deviation among all six means) in both years, whereas TA values were about 95 µmol kgseawater-1 lower in August 2014 compared to July 2013, resulting in lower pH and ΩAr values, and higher pCO2 levels and bicarbonate concentrations in 2014 (Table 4). There were no pronounced differences between depths among the two lander positions in Nord-Leksa or the ~ 90 m deeper sampling location in Sula during sampling in 2013. In 2014, both TA and DIC were lower at Sula compared to Nord-Leksa, resulting in lower pCO2 and higher ΩAr values at Sula than at Nord-Leksa (Table 4). Both TA (TAGLODAP: 2,294–2,305 µmol kg-1) and DIC (DICGLODAP: 2,127–2,144 µmol kg-1) concentrations were lower in the GLODAP database than in the measured samples, yielding shifts in all carbonate chemistry variables accordingly.
Table 4
| Date | Location | Depth [m] | T [°C] | Sal | DIC [µmol kg-1] |
TA [µmol kg-1] |
pHTS |
pCO2 [µatm] |
HCO3- [µmol kg-1] |
CO32- [µmol kg-1] |
ΩAr | NO3- [µmol L-1] |
NO2- [µmol L-1] |
NH4+ [µmol L-1] |
PO43- [µmol L-1] |
|---|---|---|---|---|---|---|---|---|---|---|---|---|---|---|---|
| 03.07.13 | Nord-Leksareef | 175 | 7.8 | 35.1 | 2147.7 | 2403.9 | 8.212 | 265.1 | 1953.9 | 181.5 | 2.74 | 12.97 | 0.10 | 9.52 | 0.60 |
| 04.07.13 | Nord-Leksaoff-reef | 216 | 7.8 | 35.1 | 2142.4 | 2398.8 | 8.213 | 263.8 | 1948.7 | 181.4 | 2.74 | 10.72 | 0.00 | 8.04 | 0.60 |
| 05.07.13 | Sula Reef | 290 | 7.2 | 35.1 | 2148.7 | 2408.1 | 8.217 | 261.7 | 1952.8 | 183.6 | 2.77 | 9.17 | 0.10 | 5.51 | 0.60 |
| 18.08.14 | Nord-Leksareef | 170 | 7.7 | 34.9 | 2147.7 | 2303.6 | 8.010 | 434.8 | 2010.3 | 117.1 | 1.77 | 9.54 | 0.00 | 22.74 | 0.70 |
| 19.08.14 | Nord-Leksaoff-reef | 207 | 7.7 | 35.0 | 2156.4 | 2307.9 | 7.998 | 448.6 | 2020.7 | 114.7 | 1.73 | 10.67 | 0.03 | 14.32 | 0.64 |
| 26.08.14 | Sula Reef | 290 | 7.6 | 35.2 | 2120.8 | 2315.0 | 8.098 | 346.9 | 1964.4 | 140.2 | 2.12 | 11.36 | 0.00 | 12.72 | 0.60 |
Dissolved inorganic nutrients (nitrate (NO3-), nitrite (NO2-), ammonium (NH4+), and phosphate (PO43-)) and carbonate chemistry and physical seawater parameters analysed from water samples taken at the three lander positions (about 10 m above ground) during POS455 in 2013 and POS473 in 2014 at Nord-Leksa and Sula.
Given are analysed values of total alkalinity (TA) and dissolved inorganic carbon (DIC) in μmol kg seawater-1 (means of duplicate samples), in situ temperature (T) in °C and practical salinity (Sal), and calculated values of pH on the total scale (pHTS), pCO2 in μatm, bicarbonate (HCO3-) and carbonate (CO32-) concentrations in μmol kg seawater-1, and the aragonite saturation state (ΩAr) computed with CO2SYS.
3.5.2 Dissolved inorganic nutrients
Nitrate (NO3-), nitrite (NO2-), ammonium (NH4+), and phosphate (PO43-) were similarly indifferent between sites, depths and years (Table 4). Ammonium concentrations were quite high in measurements from both years, but were about twice as high in summer 2014 compared to 2013. Values were, except for ammonium, in a normal open ocean range of 9–13 µmol L-1 in NO3-, < 0.1 µmol L-1 in NO2- and ~ 0.6–0.7 µmol L-1 in PO43-. The N:P ratio (calculated from N sources excluding NH4+) was around the typical oceanic ratio (Redfield ratio) at all sites in both years, varying between 14:1 and 22:1. While in 2013, the N:P ratio decreased with depth from 22:1 on-reef in Nord-Leksa to 18:1 off-reef and lowest ratio offshore at Sula (15:1), it was the other way around in the following year with lowest N:P ratios in Nord-Leksa (14:1 on-reef, 17:1 off-reef) and a higher ratio of 19:1 at Sula compared to the fjord and the year before. The GLODAP nitrate and phosphate values were in a similar range as the measured values (NO3-GLODAP: 10.3–12.1 µmol kg-1, PO43-GLODAP: 0.6–0.8 µmol kg-1).
3.5.3 In-reef sampling at the Tautra Reef
DIC and TA values were slightly lower (ΔDIC ≈ 30 µmol kg-1 and ΔTA ≈ 80 µmol kg-1 on average) at Tautra Reef compared to the deeper Nord-Leksa Reef (Table 5). The pHTS was 0.1 units lower at Tautra than at Nord-Leksa at similar sampling time in 2013 with corresponding lower ΩAr values (1.8 vs. 2.2).
Table 5
| Location | Depth [m] |
T [°C] |
DIC [µmol kg-1] |
TA [µmol kg-1] |
pHTS |
pCO2 [µatm] |
HCO3- [µmol kg-1] |
CO32- [µmol kg-1] |
ΩAr | NO3- [µmol L-1] |
NO2- [µmol L-1] |
NH4+ [µmol L-1] |
PO43- [µmol L-1] |
|---|---|---|---|---|---|---|---|---|---|---|---|---|---|
| Off- reef | 50 | 6 | 2105.6 | 2285.5 | 8.101 | 338 | 1958.8 | 129.9 | 1.96 | 9.17 | 0.08 | 10.48 | 0.13 |
| Reef edge | 42 | 6 | 2108.8 | 2279.3 | 8.080 | 357 | 1966.8 | 124.1 | 1.87 | 7.83 | 0.01 | 10.58 | 0.35 |
| Reef slope | 40 | 6 | 2092.0 | 2264.6 | 8.086 | 348 | 1949.6 | 125.0 | 1.88 | 8.69 | 0.48 | 8.90 | 0.45 |
| Reef top | 39 | 6 | 2143.7 | 2279.6 | 7.993 | 447 | 2017.1 | 104.2 | 1.57 | 8.60 | 0.35 | 10.61 | 0.60 |
Carbonate chemistry and physical seawater parameters analysed from water samples taken by divers at different locations at the Tautra Reef in the Trondheimsfjord during POS455 in 2013.
Given are measured values of total alkalinity (TA) and dissolved inorganic carbon (DIC) in μmol kg seawater-1 (means of duplicate samples), in situ temperature (T) in °C, and calculated values of pH on the total scale (TS), pCO2 in μatm, bicarbonate (HCO3-) and carbonate (CO32-) concentrations in μmol kg seawater-1, and the aragonite saturation state (ΩAr) computed with CO2SYS. Dissolved inorganic nutrient analyses [nitrate (NO3-), nitrite (NO2-), ammonium (NH4+), and phosphate (PO43-)] from these samples are means of duplicate measurements expressed as µmol per litre.
Within the Tautra Reef area, there is a clear distinction of the samples taken further away from the corals to the samples taken close to live coral colonies and smaller scale changes within the samples taken directly at the colonies. Towards the reef top, pHTS and ΩAr decreased and the pCO2 and bicarbonate concentrations increased (Table 5). Off-reef, NO3- concentration was slightly higher and PO43- was lower compared to in-reef samples. NO2- was noticeably higher at the reef slope and on the top compared to the reef edge and further away from the reef.
4 Discussion
In this study we compare the environmental conditions between an offshore and an inshore thriving CWC reef habitat in mid-Norway. Both sites are characterised by dynamic environmental conditions with large seasonal variability of the physical parameters. The bottom water flow fields are driven by topography-flow-interaction, tidal activity, water column stratification and large-scale atmospheric forcing. These findings could explain the observed differences in associated fauna, coral colony morphology and partly even the reef extent, while biogeochemical water properties between the reef sites were comparable.
4.1 Hydrodynamics and coral colony morphology
The near-reef flow was relatively strong both at Nord-Leksa and Sula but was in the range of flow speeds reported for L. pertusa reef distribution in Norwegian waters (Buhl-Mortensen and Freiwald, 2023) and other CWC reefs in the NE Atlantic (White and Dorschel, 2010; Lim et al., 2020), with flow speeds on topographic highs > 20 cm s-1 (Mortensen et al., 2001; Thiem et al., 2006). The mean bottom flow speed was stronger in Nord-Leksa (~ 20 cm s-1) compared to Sula (~ 8 cm s-1). High flow speeds (> 80 cm s-1) occurred more regularly at Nord-Leksa than Sula throughout the year. Given the bathymetry, single high flow speed events will likely have a higher impact at the Leksa Reef, where waters are pushed to a narrow strait/fjord. Maximum flow speeds recorded in late autumn were in a similar range at both sites (100–150 cm s-1), which is about five-fold higher than previously reported maximum flow velocities at the Sula Ridge (< 30 cm s-1, Eide, 1978; Roberts et al., 2005). These maximum flow speed events coincided with strong wind speeds (Supplementary Figure S1) and therefore suggests storm events during this time. In November/December, the forcing resulting from this caused the movement of both landers at Nord-Leksa. Similarly high maximum flow speeds of 76 cm s-1 and 114 cm s-1 were recorded at two sites in the upper Porcupine Bank Canyon on the Irish continental shelf, which likewise led to landers being toppled upslope, suggesting even higher current velocities than recorded (Lim et al., 2020). Lim and colleagues suggest that in the Porcupine Bank area a higher live coral abundance is found at sites with lower coral-facing mean flow speeds and that sites that are consistently exposed to higher flow speeds have higher coral rubble percentages due to enhanced physical and biological erosion of the coral framework. In contrast, flow velocity at the inshore site of this study was consistently higher directly at the flourishing reef compared to the off-reef lander location surrounded by rubble where this could be compared, suggesting that the differences in flow direction (De Clippele et al., 2018) and environmental conditions play a greater role in coral distribution at the Nord-Leksa Reef than variations in current speed. In mid-Norway, the reefs are well-developed, large and dense framework structures (Hennige et al., 2014), which could make them less susceptible towards high current velocities than thickets and individual mounds. Nonetheless, current speeds were generally higher at coral sites when compared to non-coral bearing sites in the study by Lim et al. (2020) as well, underlining that corals require high flow speeds to thrive.
Relatively high flow speeds are thought to increase the food encounter rates of the corals (Hunter, 1989; Sebens et al., 1998) and prevent the polyps from clogging with sediments (Brooke et al., 2009; Larsson and Purser, 2011). In contrast, laboratory experiments have demonstrated the efficient prey capture rates of CWCs like L. pertusa to peak at relatively low flow speeds < 7 cm s-1 (for zooplankton at flow rates of ~ 2.5 cm s-1 and for phytoplankton ~ 5 cm s-1), as with stronger flow the prey could escape from the polyps (Purser et al., 2010; Orejas et al., 2016). The CWC framework slows down the ambient flow due to friction (Roberts et al., 2009) and dense coral framework creates stability for the colony (Chamberlain and Graus, 1975; Roberts et al., 2009; Hennige et al., 2014). The CWC framework thus acts as a natural sediment trap allowing the corals to capture food and utilise the enhanced particle delivery. The corals are adapted to a very dynamic environment as various hydrodynamic processes on different temporal scales cause food supply to come in periodically rather than constantly (Maier et al., 2023), linked to small-scale processes such as internal tidal activity (Davies et al., 2009; de Froe et al., 2022) as well as larger scale circulation patterns and specific water masses (Schulz et al., 2020; Mohn et al., 2023). On continental margins like the shelf edge along Norway and plateaus such as Rockall Bank, currents continuously interact with the seafloor, creating good feeding conditions for the corals (Frederiksen et al., 1992; White et al., 2005; Thiem et al., 2006). In the fjords, tidal effects play a more important role for food supply than offshore and higher fluorescence as well as higher turbidity at depths of CWC occurrence at Nord-Leksa may indicate higher local food supply at the time of sampling due to more turbulent conditions compared to Sula.
The colony morphology determines how much the water flow slows down within the framework. Coral colonies with long and thin branches slow down the flow less than more compact colonies with short and thick branches (Kaandorp and Sloot, 2001; Chindapol et al., 2013). The long-branched colony morphology, which is more common at Sula, is associated with low near-reef flow speeds (Kaandorp, 1999; Chindapol et al., 2013). The recorded near-bottom flow speed at Sula was < 7 cm s-1 for 60% of the time during lander deployment, while at Nord-Leksa it was only 19%, thus most of the time higher flow speeds were recorded during the lander deployment. The difference in the mean near-reef flow speeds likely explains the more extended colony shapes at Sula. High flow speed events (> 100 cm s-1) in winter may break exposed CWC skeleton in Sula more easily than at Nord-Leksa due to the thinner branches. Considering < 7 cm s-1 to be the optimal flow rate for prey capture not only in experimental conditions but also in the natural environment suggests that prey capture efficiency is supported better at the Sula Ridge than at Nord-Leksa based on the year-long continuous flow measurements presented here.
However, optimal flow conditions for coral feeding change within a reef system as the flow speed and direction change on a diurnal and seasonal time scale, thus different parts of the reef have different flow conditions for feeding. This affects the growth direction of the corals, which might help them to optimise food capture (Wheeler et al., 2007; Buhl-Mortensen et al., 2010; De Clippele et al., 2017, 2018).
Moreover, local flow dynamics also change with the complexity of the framework, with larger structures modifying their surrounding flow environment and potentially reducing the favourable flow conditions for other colonies in the vicinity, as suggested in a recent modelling study by Hennige et al. (2021) using the ‘Goldilocks Principle’. That corals effectively optimise their own local flow environment through habitat engineering is supported by the finding that surface complexity within and between colonies is similarly variable independent of the differences of the compactness at inshore versus offshore reef sites (i.e., the more compact growth form of corals exposed to strong currents in fjords for example) (Sanna et al., 2023).
The flow regime is controlled by short-term phenomena like tides and storms in Nord-Leksa and by seasonal atmospheric forcing at Sula. The short-term variability in the flow field is controlled by tides and storms. In winter 2013-2014, two storms with winds > 24.5 m s-1 were recorded over Trøndelag on 16–17th November 2013 (MET-info, 2013) and 12th December 2013 (MET-info and Fagerlid, 2014), which coincided with steep increases in flow speeds recorded by the landers (Supplementary Figure S1; Figure 8). The first storm coincided with the vertical lander movements in Nord-Leksa showing that the whole water column in the fjord system is affected when the waters are pushed towards the fjord entrance. At Nord-Leksa, the flow regime is tidally-driven with strong semi-diurnal (M2) flow (~ 20 cm s-1) towards the main current direction. This results in a larger amplitude than the average semi-diurnal tidal current on the central Norwegian shelf (amplitudes of 3–12 cm s−1) (Gjevik and Straume, 1989; Haugan et al., 1991). The tidal flow controls the bi-directional flow at Nord-Leksa supporting the observed ‘cauliflower’ colony shape. At Sula, the tidal flow is weak (~ 2 cm s-1), rotated westward due to an anticyclonic (clockwise) topographic effect of the Haltenbank and differs from the main current direction (northward).
At Sula, the seasonal variations in the flow regime are driven by the quasi-stationary topographical effects of Haltenbank and Frøyabank and the seasonal changes in the NAC-NCC -interaction. The flow is mostly directed by a northward flowing coastal branch of the NCC (Ljøen and Nakken, 1969; Eide, 1979; Poulain et al., 1996; Sætre, 1999). This strong current creates a distinct temperature front between the coastal branch of the NCC and the water masses further offshore (Audunson et al., 1981). The stratification is weakest in late autumn and winter, which yields to observed fresher and warmer surface water at greater depths (Figures 8A, D, 9A). In winter, the anticyclonic eddies are strongest due to changes in the prevailing wind direction (Eide, 1979; Sætre, 1999). This yields intrusions of high-salinity Atlantic Water (AW) to the shelf (Haugan et al., 1991) and the observed pronounced strong southward flow with increasing salinity in mid-winter (Figures 8D, N, 9A, C).
In the Trondheimsfjord, the seasonal variations in the flow field are controlled by fresh-water input and the dominant wind directions at the coast. Although we do not have flow measurements from Tautra, the flow has previously been reported to be similarly dominated by impacts of fresh-water input and strong tides as in Nord-Leksa (Mortensen and Fosså, 2001). The Trondheimsfjord has a mean fresh water runoff of 725 m3 s-1 with a spring flood maximum in April/May of up to 6,430 m3 s-1 (Sakshaug and Killingtveit, 2000). This partially coincides with the period of northerly winds and the shallow NCC that are believed to explain the inflow of dense AW to the fjord from February to June (Sakshaug and Killingtveit, 2000).
4.2 Environmental conditions
CWCs live in relatively cold (Θ = 6.83–8.97°C) and oxygen-rich (O2 = 5.7–6.6 mL L-1) waters in mid-Norway compared with other known CWC reef sites (Roberts et al., 2006; Dodds et al., 2007; Freiwald et al., 2009; Davies et al., 2010; Davies and Guinotte, 2011; White et al., 2012; Ramos et al., 2017; Hanz et al., 2019). The very low salinity values down to 31.12 g kg-1 recorded at Sula are most likely a result of sensor errors (values are peaks in unfiltered data). Disregarding those peaks shows a comparable salinity range (33.50–36.06 g kg-1) to other CWC habitats (Freiwald et al., 2004; Davies et al., 2008). However, our results revealed a broader range of salinities than previous studies suggested for the Sula Reef (35.0–35.2 psu) but keeping in mind that most comparable studies represent data solely from summer conditions, higher variability throughout the year can be expected. The measured annual range of hydrographic variables was larger than expected (Sula: > 1.5°C and > 2 g kg-1 and Nord-Leksa: > 1.5°C and > 1 g kg-1), but moderate when compared to the largest measured temperature fluctuations at a CWC site of 9°C within a day in the Cape Lookout area, NW Atlantic (Mienis et al., 2014). Due to coastal fresh-water influence and relatively warm winter bottom water temperatures, the bottom water was less dense over the whole year at Nord-Leksa and less dense from late autumn to winter at Sula than the suggested density range for NE Atlantic CWC sites (σΘ = 27.35–27.65 kg m-3) (Dullo et al., 2008).
Oxygen concentrations in Nord-Leksa ranged in a well-oxygenated state compared to other CWC reef or mound sites (Hebbeln et al., 2020) and showed relatively little variability throughout the entire year. Despite an off-set (~ 0.3–0.9 mL L-1) between lander and CTD oxygen sensors, both systems revealed values in the same order of magnitude within the range of previously recorded oxygen concentrations in Norwegian and other NE Atlantic CWC habitats (Dullo et al., 2008; Findlay et al., 2014; Hebbeln et al., 2020). Similar to observations in White et al. (2012) maximum values of dissolved oxygen were found in March/April and decreased to lowest values in November/December and is likely due to the supply and decay of organic matter. Lower oxygen concentrations in Nord-Leksa than in Sula may be due to higher O2 consumption rates inshore as a result of biological activity and eutrophication, which might be influenced by aquaculture activities as well (Aksnes et al., 2019). Despite being located at the entrance of the fjord and not enclosed in the fjord system as well as experiencing similarly high flow velocities like in Sula, it may also be that the open ocean shelf reef sites have higher renewal rates of dissolved oxygen due to the more direct influence of oceanic AW.
The carbonate chemistry variables measured here were comparable to values previously reported for Norwegian CWCs (Büscher et al., 2019) and indicate saturation of calcium carbonate, promoting calcification at Nord-Leksa and Sula. In the Norwegian Sea, the ASH is ~ 2,000 m (Jones et al., 2018). The CWCs at the studied sites thrive in shallower and therewith saturated waters (ΩAr = 1.57–2.77) in a similar range like other CWC occurrences in the NE Atlantic in the Rockall Trough region and the Outer Hebrides (McGrath et al., 2012; Findlay et al., 2014). For CWCs in the Gulf of Mexico in the NW Atlantic, occurring at deeper depths than studied here, between ~400 – 600 m, lower aragonite saturation values (ΩAr ≈ 1.15–1.44) were reported, as a result of higher mean DIC values (Georgian et al., 2016). Flögel et al. (2014) demonstrated that living CWCs in the NE Atlantic are linked to low DIC concentrations (< 2,170 µmol kg-1). This is confirmed for Sula and Nord-Leksa with DIC values ranging from 2,070 to 2,157 µmol kg-1, while in waters outside the NE Atlantic, live CWCs occur at higher DIC concentrations up to 2,470 µmol kg-1 (in the Marmara Sea), attributable to different water masses present in those areas (McCulloch et al., 2012; Findlay et al., 2014). McGrath et al. (2012) have shown that DIC concentrations have increased in the Rockall Trough by nearly 20 µmol kg-1 in subsurface waters over two decades (1991 – 2010), concomitant with an equivalent decrease in pH and ΩAr and a shoaling of the ASH. Hence, environmental conditions are changing in the North Atlantic and may shift boundary conditions outside the tolerance limits of benthic organisms such as CWCs.
Nutrient concentrations are scarcely reported from CWC reefs. Findlay et al. (2014) assembled reported data from known CWC reefs sites in the NE Atlantic, revealing a large range for dissolved inorganic nitrate (4.1–23.4 µmol L-1) and a smaller range for phosphate (0.6–1.6 µmol L-1). Analysed nitrate (7.8–13.0 µmol L-1) and phosphate (0.6–0.7 µmol L-1) values were in the lower range of those reported for the Rockall Trough region, but similar to values found in a comparable CWC reef setting (the Mingulay Reef Complex) at the Outer Hebrides.
Phosphate values within the reef structures at Tautra Reef were considerably lower (< 0.45 µmol kg-1) than the water above the reef and observed at other NE Atlantic CWC sites. Perhaps, these lower phosphate values close to the polyps point to higher turnover rates in the nutrient cycling within the reef structures. de Froe et al. (2019) recently demonstrated that CWC reef communities and specifically the living CWCs influence benthic nitrogen cycling by circumventing nitrification and NH4+ production. High NH4+ concentrations close to the coral reefs may thus be indicative of a NH4+ release of the corals as a result of nitrogen cycling. However, due to the sensitive nature of nutrient analysis, especially ammonium, and this being only a single point measurement, similar sampling and measurements should be repeated for comparison before jumping to conclusions.
4.3 Associated fauna
Both sites have rich associated fauna using the CWC framework for shelter, reproduction and as feeding grounds (Henry and Roberts, 2007; Baillon et al., 2012; Buhl-Mortensen et al., 2017), but higher diversity of coral-associated invertebrates was previously found in Nord-Leksa and other mid-Norwegian inshore reefs compared to the Sula Reef (Mortensen and Fosså, 2006). The reef framework provides substrate for other benthic filter feeders such as sponges (Orejas and Jiménez, 2017), which can form a substantial component of CWC reef biomass (Hogg et al., 2010). Reef sponges function as nutrient recyclers, substrate stabilizers, bioeroders, and as a food source and habitat for other organisms (Wulff, 2001). At Tisler Reef in the Oslofjord in southern Norway where similar environmental conditions prevail as at Nord-Leksa, both Geodia sp. and M. lingua were found growing in dead L. pertusa framework, but only M. lingua was found growing within live L. pertusa (De Clippele et al., 2018). Thus, M. lingua does not compete with the corals for hard substrate and can co-occur by growing within Lophelia colonies as was observed in Nord-Leksa, while Geodia sp. presumably competes for the same substrate as the corals and may not be able to outcompete L. pertusa’s growth rates in regions where substrate availability is limited (Purser et al., 2013; De Clippele et al., 2018). The coverage of M. lingua within the framework of L. pertusa at Nord-Leksa, whereas found on dead coral substrate between colonies at Sula, supports the observation that substrate availability is limited at Nord-Leksa and species have to co-exist, despite largely comparable environmental conditions like offshore. The absence of Geodia sp. could also be explained by small-scale differences in environmental conditions, e.g. with lower water temperatures by approximately half a degree at Sula on average and considerably lower bottom flow speeds. Temperatures at Tisler Reef, where Geodia sp. occur, are however generally higher than temperatures reached at Nord-Leksa at its maximum (compare De Clippele et al., 2018).
5 Conclusion
The data of this study show annual variability of environmental conditions of two thriving cold-water coral reefs in mid-Norway. It sheds new light on the environmental factors controlling habitat features like coral colony morphology and associated fauna on the reef scale. The near-reef flow regime is characterised by high flow velocities both within the fjord and on the shelf, with highest flow speeds peaking in winter (November 2013) and revealing far higher values at times than previously reported (Umax ~ 150 cm s-1). Inshore, the flow is strongly controlled by tides and storms, whereas on the shelf the seasonal atmospheric forcing determines the major variability in the flow regime. The ‘cauliflower’ colony morphology is dominating both in the fjord and on the shelf, but with weaker average flow speeds (Umean ~ 8 cm s-1 vs. ~ 20 cm s-1) the coral branches are thinner and longer on the shelf. The databases and oceanographic data used in habitat suitability models have a resolution too coarse to capture variability on a reef-scale. Thus, taking the natural small-scale temporal and spatial variability into account helps to understand the resilience of CWCs towards environmental fluctuations and would increase the accuracy of the models for future predictions of thriving CWCs.
Statements
Data availability statement
The raw data supporting the conclusions of this article will be made available by the authors, without undue reservation.
Author contributions
JB: Conceptualization, Data curation, Formal analysis, Funding acquisition, Investigation, Methodology, Project administration, Resources, Validation, Visualization, Writing – original draft, Writing – review & editing. KJ: Data curation, Formal analysis, Methodology, Software, Visualization, Writing – original draft, Writing – review & editing. SF: Data curation, Methodology, Supervision, Validation, Writing – review & editing. MW: Conceptualization, Data curation, Investigation, Methodology, Supervision, Writing – review & editing. AR: Data curation, Methodology, Validation, Writing – review & editing. UR: Funding acquisition, Resources, Supervision, Writing – review & editing. AF: Conceptualization, Funding acquisition, Investigation, Methodology, Project administration, Resources, Supervision, Writing – review & editing.
Funding
The author(s) declare financial support was received for the research, authorship, and/or publication of this article. This study was carried out as part of the BMBF (Federal Ministry of Education and Research) funded project BIOACID II (Grant number: FKZ 03F0655A). We are grateful for additional financial support from the Osk. Huttunen foundation doctorate research grant. SF acknowledges additional funding by the ARCHES project (HGF - Helmholtz Association).
Acknowledgments
Coral sampling was conducted with kind permission of the Norwegian Directorate of Fisheries (Fiskeridirektoratet). The captain and crew of RV Poseidon and the JAGO Team are greatly thanked for support during the research cruises POS455 and POS473. Export and import permits for the cold-water coral L. pertusa were obtained through the Convention on International Trade in Endangered Species of Wild Fauna and Flora (CITES) by the Norwegian Environment Agency (Miljø Direktoratet) and the Federal Agency for Nature Conservation (BfN). We would like to thank Kerstin Nachtigall for assistance with the analysis of dissolved inorganic nutrients.
Conflict of interest
The authors declare that the research was conducted in the absence of any commercial or financial relationships that could be construed as a potential conflict of interest.
The author(s) declared that they were an editorial board member of Frontiers, at the time of submission. This had no impact on the peer review process and the final decision.
Publisher’s note
All claims expressed in this article are solely those of the authors and do not necessarily represent those of their affiliated organizations, or those of the publisher, the editors and the reviewers. Any product that may be evaluated in this article, or claim that may be made by its manufacturer, is not guaranteed or endorsed by the publisher.
Supplementary material
The Supplementary Material for this article can be found online at: https://www.frontiersin.org/articles/10.3389/fmars.2024.1363542/full#supplementary-material
Supplementary Figure 1Pressure (dbar) (A) as an indication for lander movements and lander flow speed (B) compared with daily wind speeds (metres per second) (C).
References
1
Addamo A. M. Vertino A. Stolarski J. García-Jiménez R. Taviani M. Machordom A. (2016). Merging scleractinian genera: The overwhelming genetic similarity between solitary Desmophyllum and colonial Lophelia. BMC Evol. Biol.16 (108). doi: 10.1186/s12862-016-0654-8
2
Aksnes D. L. Aure J. Johansen P. O. Johnsen G. H. Vea Salvanes A. G. (2019). Multi-decadal warming of Atlantic water and associated decline of dissolved oxygen in a deep fjord. Estuar. Coast. Shelf Sci.228, 106392. doi: 10.1016/j.ecss.2019.106392
3
Albretsen J. Sperrevik A. K. Staalstrøm A. Sandvik A. D. Vikebø F. Asplin L. (2011). NorKyst-800 Report No. 1 User Manual and technical descriptions. Tech. Rep. Fisken og Havet 2/2011.
4
Audunson T. Dalen V. Krogstad H. Lie H. N. Steinbakke O. (1981). “Some observations of ocean fronts, waves and currents in the surface along the Norwegian coast from satellite images and drifting buoys,” in The Norwegian Coastal Current, Proceedings from Symposium, eds. SaetreR.MorkM.. (Norway: University of Bergen), 20–57.
5
Baillon S. Hamel J. F. Wareham V. E. Mercier A. (2012). Deep cold-water corals as nurseries for fish larvae. Front. Ecol. Environ. 10 (7), 351–356. doi: 10.1890/120022
6
Bartzke G. Siemann L. Büssing R. Nardone P. Koll K. Hebbeln D. et al . (2021). Investigating the prevailing hydrodynamics around a cold-water coral colony using a physical and a numerical approach. Front. Mar. Sci.8. doi: 10.3389/fmars.2021.663304
7
Brooke S. D. Holmes M. W. Young C. M. (2009). Sediment tolerance of two different morphotypes of the deep-sea coral Lophelia pertusa from the Gulf of Mexico. Mar. Ecol. Prog. Ser. 390, 137–144. doi: 10.3354/meps08191
8
Brooke S. Ross S. W. Bane J. M. Seim H. E. Young C. M. (2013). Temperature tolerance of the deep-sea coral Lophelia pertusa from the southeastern United States. Deep. Res. Part II Top. Stud. Oceanogr. 92, 240–248. doi: 10.1016/j.dsr2.2012.12.001
9
Buhl-Mortensen L. Buhl-Mortensen P. Dolan M. F. J. Holte B. (2015a). The MAREANO programme – A full coverage mapping of the Norwegian off-shore benthic environment and fauna. Mar. Biol. Res.11, 4–17. doi: 10.1080/17451000.2014.952312
10
Buhl-Mortensen P. Buhl-Mortensen L. Purser A. (2017). “Trophic ecology and habitat provision in cold-water coral ecosystems,” in Marine Animal Forests: The Ecology of Benthic Biodiversity Hotspots. Eds. RossiS.BramantiL.GoriA.OrejasC. (Cham, Springer). doi: 10.1007/978-3-319-21012-4_20
11
Buhl-Mortensen P. Freiwald A. (2023). “Norwegian Coral Reefs,” in Coral Reefs of the World, vol. 19 . Eds. CordesE.MienisF. (Springer, Cham). doi: 10.1007/978-3-031-40897-7_5
12
Buhl-Mortensen L. Olafsdottir S. H. Buhl-Mortensen P. Burgos J. M. Ragnarsson S. A. (2015b). Distribution of nine cold-water coral species (Scleractinia and Gorgonacea) in the cold temperate North Atlantic: effects of bathymetry and hydrography. Hydrobiologia759, 39–61. doi: 10.1007/s10750-014-2116-x
13
Buhl-Mortensen L. Vanreusel A. Gooday A. J. (2010). Biological structures as a source of habitat heterogeneity and biodiversity on the deep ocean margins. Mar. Ecol. 31, 21–50. doi: 10.1111/j.1439-0485.2010.00359.x
14
Büscher J. V. Wisshak M. Form A. U. Titschack J. Nachtigall K. Riebesell U. (2019). In situ growth and bioerosion rates of Lophelia pertusa in a Norwegian fjord and open shelf cold-water coral habitat. PeerJ7, e7586. doi: 10.7717/peerj.7586
15
Chamberlain J. A. Graus R. R. (1975). Water-flow and hydromechanical adaptations of branched reef corals. Bull. Mar. Sci.
16
Chindapol N. Kaandorp J. A. Cronemberger C. Mass T. Genin A. (2013). Modelling growth and form of the scleractinian coral pocillopora verrucosa and the influence of hydrodynamics E.J. PloS Comput. Biol.9, e1002849. doi: 10.1371/journal.pcbi.1002849
17
Corbera G. Lo Iacono C. Simarro G. Grinyó J. Ambroso S. Huvenne V. A. I. et al . (2022). Local-scale feedbacks influencing cold-water coral growth and subsequent reef formation. Sci. Rep.12, 20389. doi: 10.1038/s41598-022-24711-7
18
Davies A. J. Duineveld G. C. A. Lavaleye M. S. S. Bergman M. J. N. Van Haren H. (2009). Downwelling and deep-water bottom currents as food supply mechanisms to the cold-water coral Lophelia pertusa (Scleractinia) at the Mingulay Reef complex. Limnol. Oceanogr.54, 620–629. doi: 10.4319/lo.2009.54.2.0620
19
Davies A. J. Duineveld G. C. A. van Weering T. C. E. Mienis F. Quattrini A. M. Seim H. E. et al . (2010). Short-term environmental variability in cold-water coral habitat at Viosca Knoll, Gulf of Mexico. Deep. Res. Part I Oceanogr. Res. Pap.57, 199–212. doi: 10.1016/j.dsr.2009.10.012
20
Davies A. J. Guinotte J. M. (2011). Global habitat suitability for framework-forming cold-water corals. PloS One6 (4), e18483. doi: 10.1371/journal.pone.0018483
21
Davies A. J. Wisshak M. Orr J. C. Murray Roberts J. (2008). Predicting suitable habitat for the cold-water coral Lophelia pertusa (Scleractinia). Deep. Res. Part I Oceanogr. Res. Pap.55, 1048–1062. doi: 10.1016/j.dsr.2008.04.010
22
De Clippele L. H. Gafeira J. Robert K. Hennige S. Lavaleye M. S. Duineveld G. C. A. et al . (2017). Using novel acoustic and visual mapping tools to predict the small-scale spatial distribution of live biogenic reef framework in cold-water coral habitats. Coral Reefs36, 255–268. doi: 10.1007/s00338-016-1519-8
23
De Clippele L. H. Huvenne V. A. I. Orejas C. Lundälv T. Fox A. Hennige S. J. et al . (2018). The effect of local hydrodynamics on the spatial extent and morphology of cold-water coral habitats at Tisler Reef, Norway. Coral Reefs. 37, 253–266. doi: 10.1007/s00338-017-1653-y
24
de Froe E. Maier S. R. Horn H. G. Wolff G. A. Blackbird S. Mohn C. et al . (2022). Hydrography and food distribution during a tidal cycle above a cold-water coral mound. Oceanogr. Res. Papers Deep-Sea Res. I189, 103854. doi: 10.1016/j.dsr.2022.103854
25
de Froe E. Rovelli L. Glud R. N. Maier S. R. Duineveld G. Mienis F. et al . (2019). Benthic oxygen and nitrogen exchange on a cold-water coral reef in the North-East Atlantic Ocean. Front. Mar. Sci.6. doi: 10.3389/fmars.2019.00665
26
Dickson A. G. Millero F. J. (1987). A comparison of the equilibrium constants for the dissociation of carbonic acid in seawater media. Deep Sea Res. Part A Oceanogr. Res. Pap.34, 173–1743. doi: 10.1016/0198-0149(87)90021-5
27
Dickson A. G. Sabine C. L. Christian J. R. (2007). Guide to best practices for ocean CO2 measurements, PICES Spec (British Columbia: North Pacific Marine Science Organization Sidney).
28
Dodds L. A. Roberts J. M. Taylor A. C. Marubini F. (2007). Metabolic tolerance of the cold-water coral Lophelia pertusa (Scleractinia) to temperature and dissolved oxygen change. J. Exp. Mar. Bio. Ecol.349, 205–214. doi: 10.1016/j.jembe.2007.05.013
29
Dorschel B. Hebbeln D. Foubert A. White M. Wheeler A. J. (2007). Hydrodynamics and cold-water coral facies distribution related to recent sedimentary processes at Galway Mound west of Ireland. Mar. Geol.244, 184–195. doi: 10.1016/j.margeo.2007.06.010
30
Dullo W. C. Flögel S. Rüggeberg A. (2008). Cold-water coral growth in relation to the hydrography of the Celtic and Nordic European continental margin. Mar. Ecol. Prog. Ser.371, 165–176. doi: 10.3354/meps07623
31
Eide L. I. (1978). Ocean Currents on the Halten and Malangsgrunnen Banks: Analysis of Observations Carried Out August 1972-September 1976 (Institutt for Kontinentalsokkelundersokelser (Continental Shelf Institute).
32
Eide L. I. (1979). Evidence of a topographically trapped vortex on the Norwegian continental shelf. Deep Sea Res. Part A Oceanogr. Res. Pap.26, 601–621. doi: 10.1016/0198-0149(79)90036-0
33
Findlay H. S. Artioli Y. Moreno Navas J. Hennige S. J. Wicks L. C. Huvenne V. A. I. et al . (2013). Tidal downwelling and implications for the carbon biogeochemistry of cold-water corals in relation to future ocean acidification and warming. Glob. Change Biol.19, 2708–2719. doi: 10.1111/gcb.12256
34
Findlay H. S. Hennige S. J. Wicks L. C. Navas J. M. Woodward E. M. S. Roberts J. M. (2014). Fine-scale nutrient and carbonate system dynamics around cold-water coral reefs in the northeast Atlantic. Sci. Rep.4, 3671. doi: 10.1038/srep03671
35
Fink H. G. Wienberg C. Hebbeln D. McGregor H. V. Schmiedl G. Taviani M. et al . (2012). Oxygen control on Holocene cold-water coral development in the eastern Mediterranean Sea. Deep. Res. Part I Oceanogr. Res. Pap. 62, 89–96. doi: 10.1016/j.dsr.2011.12.013
36
Finlay C. C. Maus S. Beggan C. D. (2010). International Geomagnetic Reference Field: The eleventh generation. Geophys. J. Int.183, 1216–1230. doi: 10.1111/j.1365-246X.2010.04804.x
37
Flögel S. Dullo W. C. Pfannkuche O. Kiriakoulakis K. Rüggeberg A. (2014). Geochemical and physical constraints for the occurrence of living cold-water corals. Deep. Res. Part II Top. Stud. Oceanogr.99, 19–26. doi: 10.1016/j.dsr2.2013.06.006
38
Form A. U. Büscher J. Hissmann K. (2014). RV POSEIDON Cruise Report POS455 LORELEI LOphelia REef Lander Expedition and Investigation, Bremerhaven - (Kristiansund) - Kiel, 24.06. - (12.07.) - 17.07.2013. (Kiel: GEOMAR Helmholtz-Zentrum für Ozeanforschung), 29. doi: 10.3289/CR_POS_455
39
Form A. U. Büscher J. V. Hissmann K. (2015). RV POSEIDON Cruise Report POS473 LORELEI II: LOphelia REef Lander Expedition and Investigation II, Tromsø – Bergen – Esbjerg, 15.08. – 31.08. – 04.09.2014. (Kiel: GEOMAR Helmholtz-Zentrum für Ozeanforschung), 25. doi: 10.3289/CR_POS_473
40
Fosså J. H. Mortensen P. B. Furevik D. M. (2002). The deep-water coral Lophelia pertusa in Norwegian waters: Distribution and fishery impacts. Hydrobiologia. 471, 1–12. doi: 10.1023/A:1016504430684
41
Frederiksen R. Jensen A. Westerberg H. (1992). The distribution of the scleractinian coral Lophelia pertusa around the Faroe Islands and the relation to internal tidal mixing. Sarsia77, 157–171.
42
Freiwald A. Beuck L. Rüggeberg A. Taviani M. Hebbeln D. (2009). The white coral community in the central Mediterranean sea revealed by ROV surveys. Oceanography22, 58–74. doi: 10.5670/oceanog.2009.06
43
Freiwald A. Fosså J. H. Grehan A. Koslow T. Roberts J. M. (2004). Cold-water coral reefs. Cambridge, UK: UNEP-WCMC.
44
Freiwald A. Hühnerbach V. Lindberg B. Wilson J. B. Campbell J. (2002). The sula reef complex, Norwegian shelf. Facies47, 179–200. doi: 10.1007/BF02667712
45
Freiwald A. Wilson J. B. Henrich R. (1999). Grounding pleistocene icebergs shape recent deep-water coral reefs. Sediment. Geol.125, 1–8. doi: 10.1016/S0037-0738(98)00142-0
46
Garcia H. E. Locarnini R. A. Boyer T. P. Antonov J. I. Baranova O. K. Zweng M. M. et al . (2013). World Ocean Atlas 2013, Vol. 4, Dissolved Inorganic Nutrients (phosphate, nitrate, silicate). eds., LevitusS.MishonovA.. (Technical Ed. NOAA Atlas NESDIS) 76, 25. doi: 10.7289/V5J67DWD
47
GEOMAR Helmholtz-Zentrum für Ozeanforschung (2015). Research vessel POSEIDON. JLSRF1, A36. doi: 10.17815/jlsrf-1-62
48
GEOMAR Helmholtz-Zentrum für Ozeanforschung (2017). Manned submersible JAGO. JLSRF3, A110. doi: 10.17815/jlsrf-3-157
49
Georgian S. E. Deleo D. Durkin A. Gómez C. E. Kurman M. Lunden J. J. et al . (2016). Oceanographic patterns and carbonate chemistry in the vicinity of cold-water coral reefs in the Gulf of Mexico: implications for resilience in a changing ocean. Limnol. Oceanogr.61, 648–665. doi: 10.1002/lno.10242
50
Gjevik B. Straume T. (1989). Model simulations of the M2 and the K1 tide in the Nordic Seas and the Arctic Ocean. Tellus A. 41A, 73–96. doi: 10.1111/tela.1989.41A.issue-1
51
Guinotte J. M. Orr J. Cairns S. Freiwald A. Morgan L. George R. (2006). Will human-induced changes in seawater chemistry alter the distribution of deep-sea scleractinian corals? Front. Ecol. Environ.4, 141–146. doi: 10.1890/1540-9295(2006)004[0141:WHCISC]2.0.CO;2
52
Hansen H. P. Koroleff F. (1999). “Determination of nutrients,” in Methods of Seawater Analysis. Eds. GrasshoffK.KremlingK.EhrhardtM. (Germany: Wiley-VCH GmbH), 159–228.
53
Hanz U. Wienberg C. Hebbeln D. (2019). Environmental factors influencing benthic communities in the oxygen minimum zones on the Angolan and Namibian margins. Biogeosciences16, 4337–4356. doi: 10.5194/bg-16-4337-2019
54
Haugan P. M. Evensen G. Johannessen J. A. Johannessen O. M. Pettersson L. H. (1991). Modeled and observed mesoscale circulation and wave-current refraction during the 1988 Norwegian Continental Shelf Experiment. J. Geophys. Res.96, 10487. doi: 10.1029/91JC00299
55
Hebbeln D. Wienberg C. Dullo W.-C. Freiwald A. Mienis F. Orejas C. et al . (2020). Cold-water coral reefs thriving under hypoxia. Coral Reefs39, 853–859. doi: 10.1007/s00338-020-01934-6
56
Hennige S. J. Larsson A. I. Orejas C. Gori A. De Clippele L. H. Lee Y. C. et al . (2021). Using the Goldilocks Principle to model coral ecosystem engineering. Proc. R. Soc B.288, 20211260. doi: 10.1098/rspb.2021.1260
57
Hennige S. J. Wicks L. C. Kamenos N. A. Bakker D. C. E. Findlay H. S. Dumousseaud C. et al . (2014). Short-term metabolic and growth responses of the cold-water coral Lophelia pertusa to ocean acidification. Deep. Res. Part II Top. Stud. Oceanogr.99, 27–35. doi: 10.1016/j.dsr2.2013.07.005
58
Henry L. A. Roberts J. M. (2007). Biodiversity and ecological composition of macrobenthos on cold-water coral mounds and adjacent off-mound habitat in the bathyal Porcupine Seabight, NE Atlantic. Deep. Res. Part I Oceanogr. Res. Pap.54, 654–672. doi: 10.1016/j.dsr.2007.01.005
59
Henry L. A. Roberts J. M. (2017). “Global biodiversity in cold-water coral reef ecosystems,” in Marine Animal Forests: The Ecology of Benthic Biodiversity Hotspots (Cham: Springer International Publishing), 235–256.
60
Hogg M. M. Tendal O. S. Conway K. W. Pomponi S. A. Van Soest R. W. M. Gutt J. et al . (2010). “Deep Sea Sponge Grounds: Reservoirs of Biodiversity,” in UNEP-WCMC Biodiversity Series. Cambridge, UK: UNEP-WCMC.
61
Hovland M. Mortensen P. B. Brattegard T. Strass P. Rokoengen K. (1998). Ahermatypic coral banks off mid-Norway: evidence for a link with seepage of light hydrocarbons. Palaios. 13, 189–200. doi: 10.2307/3515489
62
Hovland M. Ottesen D. Thorsnes T. Foss J. H. Bryn P. (2005). Occurrence and implications of large Lophelia-reefs offshore Mid Norway. Nor. Pet. Soc Spec. Publ. 12, 265–270. doi: 10.1016/S0928-8937(05)80053-0
63
Hovland M. Vasshus S. Indreeide A. Austdal L. Nilsen Ø. (2002). Mapping and imaging deep-sea coral reefs off Norway 1982-2000. Hydrobiologia471, 13–17. doi: 10.1023/A:1016576514754
64
Hunter T. (1989). Suspension feeding in oscillating flow: the effect of colony morphology and flow regime on plankton capture by the hydroid obelia longissima. Biol. Bull. 176, 41–49. doi: 10.2307/1541887
65
Järnegren J. Kutti T. (2014). “Lophelia pertusa in Norwegian waters,” in What have we learned since 2008? NINA Report 1028. (Norsk institutt for naturforskning), 40.
66
Jones E. Chierici M. Skjelvan I. (2018). Monitoring ocean acidification in Norwegian seas in 2017. Rapport, Miljødirektoratet, M-XXX|2018.
67
Juva K. Flögel S. Karstensen J. Linke P. Dullo W.-C. (2020). Tidal dynamics control on cold-water coral growth: A high-resolution multivariable study on eastern Atlantic cold-water coral sites. Front. Mar. Sci.7. doi: 10.3389/fmars.2020.00132
68
Juva K. Kutti T. Chierici M. Dullo W.-C. Flögel S. (2021). Cold-water coral reefs in the Langenuen Fjord, Southwestern Norway—A window into future environmental change. Ocean2, 583–610. doi: 10.3390/oceans2030033
69
Kaandorp J. A. (1999). Morphological analysis of growth forms of branching marine sessile organisms along environmental gradients. Mar. Biol. 134, 295–306. doi: 10.1007/s002270050547
70
Kaandorp J. A. Sloot P. M. A. (2001). Morphological models of radiate accretive growth and the influence of hydrodynamics. J. Theor. Biol. 209 (3), 257–274. doi: 10.1006/jtbi.2001.2261
71
Kiriakoulakis K. Freiwald A. Fisher E. Wolff G. A. (2007). Organic matter quality and supply to deep-water coral/mound systems of the NW European Continental Margin. Int. J. Earth Sci. 96, 159–170. doi: 10.1007/s00531-006-0078-6
72
Larsson A. I. Purser A. (2011). Sedimentation on the cold-water coral Lophelia pertusa: Cleaning efficiency from natural sediments and drill cuttings. Mar. Pollut. Bull. 62, 1159–1168. doi: 10.1016/j.marpolbul.2011.03.041
73
Lauvset S. K. Key R. M. Olsen A. (2016). A new global interior ocean mapped climatology: The 1° × 1° GLODAP version 2. Earth Syst. Sci. Data8, 325–340. doi: 10.5194/essd-8-325-2016
74
Leinebø R. (1973). Water masses and current in a section across the Norwegian shelf off Stadt. “Meteor. Forsch.-Ergeb12, 11–23.
75
Lim A. Wheeler A. J. Price D. M. O’Reilly L. Harris K. Conti L. (2020). Influence of benthic currents on cold-water coral habitats: a combined benthic monitoring and 3D photogrammetric investigation. Sci. Rep.10, 19433. doi: 10.1038/s41598-020-76446-y
76
Ljøen R. Nakken O. (1969). On the hydrography of the shelf waters off Møre and Helgeland. FirkDir. Skr. Ser. HavUnders.15, 285–294.
77
Maier S. R. Brooke S. De Clippele L. H. de Froe E. van der Kaaden A. S. Kutti T. et al . (2023). On the paradox of thriving cold-water coral reefs in the food-limited deep sea. Biol. Rev.98, 1768–1795. doi: 10.1111/brv.12976
78
McCulloch M. Trotter J. Montagna P. (2012). Resilience of cold-water scleractinian corals to ocean acidification: Boron isotopic systematics of pH and saturation state up-regulation. Geochim. Cosmochim. Acta. 87, 21–34. doi: 10.1016/j.gca.2012.03.027
79
McDougall T. J. Barker P. M. (2011). Getting started with TEOS-10 and the Gibbs seawater (GSW) oceanographic toolbox28. Available at: https://www.teos-10.org.
80
McGrath T. Kivimae C. Tanhua T. Cave R. R. McGovern E. (2012). Inorganic carbon and pH levels in the Rockall Trough 1991–2010. Deep-Sea Res. I68, 79–91. doi: 10.1016/j.dsr.2012.05.011
81
Mehrbach C. Culberson C. H. Hawley J. E. Pytkowicx R. M. (1973). Measurement of the apparent dissociation constants of carbonic acid in seawater at atmospheric pressure. Limnol. Oceanogr.18, 897–907. doi: 10.4319/lo.1973.18.6.0897
82
MET-info (2013). Ekstremvêrrapport - Hending: Hilde, 16.-17.11.2013.
83
MET-info and Fagerlid G. O. (2014). Ekstremværrapport Ivar, desember 2013.
84
Mienis F. Bouma T. J. Witbaard R. van Oevelen D. Duineveld G. C. A. (2019). Experimental assessment of the effects of cold-water coral patches on water flow. Mar. Ecol. Prog. Ser.609, 101–117. doi: 10.3354/meps12815
85
Mienis F. Duineveld G. C. A. Davies A. J. (2014). Cold-water coral growth under extreme environmental conditions, the Cape Lookout area, NW Atlantic. Biogeosciences11, 2543–2560. doi: 10.5194/bg-11-2543-2014
86
Mienis F. Duineveld G. C. A. Davies A. J. Ross S. W. Seim H. Bane J. et al . (2012). The influence of near-bed hydrodynamic conditions on cold-water corals in the Viosca Knoll area, Gulf of Mexico. Deep. Res. Part I Oceanogr. Res. Pap.60, 32–45. doi: 10.1016/j.dsr.2011.10.007
87
Milzer G. Giraudeau J. Faust J. Knies J. Eynaud F. Rühlemann C. (2013). Spatial distribution of benthic foraminiferal stable isotopes and dinocyst assemblages in surface sediments of the Trondheimsfjord, central Norway. Biogeosciences. 10, 4433–4448. doi: 10.5194/bg-10-4433-2013
88
Mohn C. Hansen J. L. S. Carreiro-Silva M. Cunningham S. A. de Froe E. Dominguez-Carrió C. et al . (2023). Tidal to decadal scale hydrodynamics at two contrasting cold-water coral sites in the Northeast Atlantic. Progr. Oceanogr214, 103031. doi: 10.1016/j.pocean.2023.103031
89
Morato T. González-Irusta J. M. Dominguez-Carrió C. (2020). Climate-induced changes in the suitable habitat of cold-water corals and commercially important deep-sea fishes in the North Atlantic. Glob. Change Biol. 26 (4), 2181–2202. doi: 10.1111/gcb.14996
90
Mork M. (1981). Circulation phenomena and frontal dynamics of the Norwegian coastal current. Philos. Trans. R. Soc London. Ser. A Math. Phys. Sci.302, 635–647. doi: 10.1098/rsta.1981.0188
91
Mortensen P. B. Fosså J. H. (2001). “Coral reefs and other bottom habitats on the ridge of Tautra in Trondheimsfjorden (Norway),” in TT - Korallrev og Andre Bunnhabitater paa Tautraryggen i Trondheimsfjorden. Internal Norwegian research report.
92
Mortensen P. B. Fosså J. H. (2006). “Species diversity and spatial distribution of invertebrates on deep-water Lophelia reefs in Norway,” in Proceedings of the 10th International Coral reef Symposium (Okinawa). 1849–1868.
93
Mortensen P. B. Hovland M. Brattegard T. Farestveit R. (1995). Deep water bioherms of the scleractinian coral Lophelia pertusa (L.) at 64° n on the Norwegian shelf: Structure and associated megafauna. Sarsia80, 145–158. doi: 10.1080/00364827.1995.10413586
94
Mortensen P. B. Hovland T. Fosså J. H. Furevik D. M. (2001). Distribution, abundance and size of Lophelia pertusa coral reefs in mid-Norway in relation to seabed characteristics. J. Mar. Biol. Assoc. United Kingdom81, 581–597. doi: 10.1017/S002531540100426X
95
Orejas C. Gori A. Rad-Menéndez C. (2016). The effect of flow speed and food size on the capture efficiency and feeding behaviour of the cold-water coral Lophelia pertusa. J. Exp. Mar. Bio. Ecol.481, 34–40. doi: 10.1016/j.jembe.2016.04.002
96
Orejas C. Jiménez C. (2017). “The builders of the oceans - Part I: Coral architecture from the tropics to the poles, from the shallow to the deep,” in Marine Animal Forests: The Ecology of Benthic Biodiversity Hotspots, eds. RossiS.BramantiL.GoriA.OrejasC.. (Cham: Marine Animal Forests; Springer). doi: 10.1007/978-3-319-21012-4_10
97
Osterloff J. Nilssen I. Järnegren J. Engeland T. V. Buhl-Mortensen P. Nattkemper T. W. (2019). Computer vision enables short- and long-term analysis of Lophelia pertusa polyp behaviour and colour from an underwater observatory. Sci. Rep.9, 6578. doi: 10.1038/s41598-019-41275-1
98
Pawlowicz R. Beardsley B. Lentz S. (2002). Classical tidal harmonic analysis including error estimates in MATLAB using TDE. Comput. Geosci.28, 929–937. doi: 10.1016/S0098-3004(02)00013-4
99
Pierrot D. Lewis E. Wallace D. W. R. (2011). MS Excel program developed for CO2 system calculations. doi: 10.3334/CDIAC/otg.CO2SYS_XLS_CDIAC105a
100
Poulain P. M. Warn-Varnas A. Niiler P. P. (1996). Near-surface circulation of the Nordic seas as measured by Lagrangian drifters. J. Geophys. Res. C Ocean.101, 18237–18258. doi: 10.1029/96JC00506
101
Purser A. Bergmann M. Lund??lv T. Ontrup J. Nattkemper T. W. (2009). Use of machine-learning algorithms for the automated detection of cold-water coral habitats: A pilot study. Mar. Ecol. Prog. Ser.397, 241–251. doi: 10.3354/meps08154
102
Purser A. Larsson A. I. Thomsen L. van Oevelen D. (2010). The influence of flow velocity and food concentration on Lophelia pertusa (Scleractinia) zooplankton capture rates. J. Exp. Mar. Bio. Ecol.395, 55–62. doi: 10.1016/j.jembe.2010.08.013
103
Purser A. Orejas C. Gori A. Tong R. Unnithan V. Thomsen L. (2013). Local variation in the distribution of benthic megafauna species associated with cold-water coral reefs on the Norwegian margin. Cont. Shelf Res. 54, 37–51. doi: 10.1016/j.csr.2012.12.013
104
Ramos A. Sanz J. L. Ramil F. Agudo L. M. Presas-Navarro C. (2017). “The giant cold-water coral mounds barrier off Mauritania,” in Deep-Sea Ecosystems Off Mauritania, eds. RamosA.RamilF.SanzJ.. (Dordrecht: Springer). doi: 10.1007/978-94-024-1023-5
105
Roberts J. M. Peppe O. C. Dodds L. A. Mercer D. J. Thomson W. T. Gage J. D. et al . (2005). “Monitoring environmental variability around cold-water coral reefs: the use of a benthic photolander and the potential of seafloor observatories,” in Cold-Water Corals and Ecosystems. Erlangen Earth Conference Series, eds. FreiwaldA.RobertsJ. M.. (Berlin, Heidelberg: Springer), 483–502. doi: 10.1007/3-540-27673-4_24
106
Roberts J. M. Wheeler A. J. Freiwald A. (2006). Reefs of the deep: The biology and geology of cold-water coral ecosystems. Sci. (80-.)312, 543–547. doi: 10.1126/science.1119861
107
Roberts J. M. Wheeler A. J. Freiwald A. Cairns S. D. (2009). Cold-water corals: the biology and geology of deep-sea coral habitats. (Cambridge University Press). doi: 10.1017/CBO9780511581588
108
Rüggeberg A. Flögel S. Dullo W. C. Hissmann K. Freiwald A. (2011). Water mass characteristics and sill dynamics in a subpolar cold-water coral reef setting at Stjernsund, northern Norway. Mar. Geol.282, 5–12. doi: 10.1016/j.margeo.2010.05.009
109
Sætre R. (1999). Features of the central Norwegian shelf circulation. Cont. Shelf Res.19, 1809–1831. doi: 10.1016/S0278-4343(99)00041-2
110
Sætre R. Ljøen R. (1971). The Norwegian costal current. Proc. First Int. Conf. Port Ocean Eng.
111
Sakshaug E. Killingtveit Å. (2000). Elvene: et stort bidrag. Eds. SakshaugE.SneliJ. (Trondheimsfjorden: Tapir forlag), 65–75.
112
Sanna G. Büscher J. V. Freiwald A. (2023). Cold-water coral framework architecture is selectively shaped by bottom current flow. Coral Reefs42, 483–495. doi: 10.1016/S0278-4343(99)00041-2
113
Scheide M. S. (2018). Using Deep Learning for Automatic Classification of Marine Habitats in HiSAS Imagery. (Master's Thesis). Norwegian University of Science and Technology.
114
Schulz K. Soetaert K. Mohn C. Korte L. Mienis F. Duineveld G. et al . (2020). Linking large-scale circulation patterns to the distribution of cold water corals along the eastern Rockall Bank (northeast Atlantic). J. Mar. Syst.212, 103456. doi: 10.1016/j.jmarsys.2020.103456
115
Sebens K. P. Grace S. P. Helmuth B. Maney E. J. Miles J. S. (1998). Water flow and prey capture by three scleractinian corals, Madracis mirabilis, Montastrea cavernoss and Porites porites in a field enclosure. Mar. Biol. 131, 347–360. doi: 10.1007/s002270050328
116
Soetaert K. Mohn C. Rengstorf A. Grehan A. van Oevelen D. (2016). Ecosystem engineering creates a direct nutritional link between 600-m deep cold-water coral mounds and surface productivity. Sci. Rep.6, 35057. doi: 10.1038/srep35057
117
Taviani M. Freiwald A. Zibrowius H. (2005). “Deep coral growth in the Mediterranean Sea: an overview,” in Cold-Water Corals and Ecosystems. Erlangen Earth Conference Series. eds. FreiwaldA.RobertsJ. M.. (Berlin, Heidelberg: Springer), 137–156.
118
Thiem Ø. Ravagnan E. Fosså J. H. Berntsen J. (2006). Food supply mechanisms for cold-water corals along a continental shelf edge. J. Mar. Syst.60, 207–219. doi: 10.1016/j.jmarsys.2005.12.004
119
Thorsnes T. Bellec V. K. Dolan M. F. J. (2016). Cold-water coral reefs and glacial landforms from Sula Reef, mid-Norwegian shelf. Geol. Soc Mem.46, 307–308. doi: 10.1144/M46.74
120
Tong R. Davies A. J. Yesson C. Yu J. Luo Y. Zhang L. et al . (2023). Environmental drivers and the distribution of cold-water corals in the global ocean. Front. Mar. Sci.10. doi: 10.3389/fmars.2023.1217851
121
Wagner H. Purser A. Thomsen L. Jesus C. C. Lundälv T. (2011). Particulate organic matter fluxes and hydrodynamics at the Tisler cold-water coral reef. J. Mar. Syst. 85, 19–29. doi: 10.1016/j.jmarsys.2010.11.003
122
Wheeler A. J. Beyer A. Freiwald A. de Haas H. Huvenne V. A. I. Kozachenko M. et al . (2007). Morphology and environment of cold-water coral carbonate mounds on the NW European margin. Int. J. Earth Sci.96, 37–56. doi: 10.1007/s00531-006-0130-6
123
White M. Dorschel B. (2010). The importance of the permanent thermocline to the cold water coral carbonate mound distribution in the NE Atlantic. Earth Planet. Sci. Lett.296, 395–402. doi: 10.1016/j.epsl.2010.05.025
124
White M. Mohn C. Stigter H. Mottram G. (2005). “Deep-water coral development as a function of hydrodynamics and surface productivity around the submarine banks of the Rockall Trough, NE Atlantic,” in Cold-Water Corals and Ecosystems. Eds. FreiwaldA.RobertsJ. M. (Springer-Verlag, Berlin Heidelberg), 503–514.
125
White M. Wolff G. A. Lundälv T. Guihen D. Kiriakoulakis K. Lavaleye M. et al . (2012). Cold-water coral ecosystem (Tisler Reef, Norwegian shelf) may be a hotspot for carbon cycling. Mar. Ecol. Prog. Ser. 465, 11–23. doi: 10.3354/meps09888
126
Wilson J. B. (1979). Patch development of the deep-water coral lophelia pertusa (L.) on rockall bank. J. Mar. Biol. Assoc. 59 (1), 165–177. doi: 10.1017/S0025315400046257
127
Wulff J. (2001). Assessing and monitoring coral reef sponges: Why and how? Bull. Mar. Sci.69, 831–846.
128
Yesson C. Bedford F. Rogers A. D. Taylor M. L. (2017). The global distribution of deep-water Antipatharia habitat. Deep. Res. Part II Top. Stud. Oceanogr.145, 79–86. doi: 10.1016/j.dsr2.2015.12.004
129
Zheng M. D. Cao L. (2014). Simulation of global ocean acidification and chemical habitats of shallow- and cold-water coral reefs. Adv. Clim. Change Res. 5 (4), 189–196. doi: 10.1016/j.accre.2015.05.002
130
Zibrowius H. (1980). The scleractinian corals of the Mediterranean and the northeastern Atlantic. Mem. l’Instit. Oceanogr.
Summary
Keywords
cold-water corals, Lophelia pertusa , Desmophyllum pertusum , long-term monitoring, benthic landers, environmental characteristics, biogeochemistry, coral morphology
Citation
Büscher JV, Juva K, Flögel S, Wisshak M, Rüggeberg A, Riebesell U and Form AU (2024) Water mass characteristics and hydrodynamics at an inshore versus an offshore mid-Norwegian cold-water coral reef habitat. Front. Mar. Sci. 11:1363542. doi: 10.3389/fmars.2024.1363542
Received
30 December 2023
Accepted
16 July 2024
Published
15 August 2024
Volume
11 - 2024
Edited by
Anthony Grehan, University of Galway, Ireland
Reviewed by
Ruiju Tong, Fujian University of Technology, China
Christian Mohn, Aarhus University, Denmark
Updates
Copyright
© 2024 Büscher, Juva, Flögel, Wisshak, Rüggeberg, Riebesell and Form.
This is an open-access article distributed under the terms of the Creative Commons Attribution License (CC BY). The use, distribution or reproduction in other forums is permitted, provided the original author(s) and the copyright owner(s) are credited and that the original publication in this journal is cited, in accordance with accepted academic practice. No use, distribution or reproduction is permitted which does not comply with these terms.
*Correspondence: Janina Vanessa Büscher, j.buescher@ulster.ac.uk
†These authors share first authorship
Disclaimer
All claims expressed in this article are solely those of the authors and do not necessarily represent those of their affiliated organizations, or those of the publisher, the editors and the reviewers. Any product that may be evaluated in this article or claim that may be made by its manufacturer is not guaranteed or endorsed by the publisher.