Abstract
The bimodal wave climate of the semi-protected shallow Gulf St Vincent in South Australia has been analyzed through a forty-year (1980-2020) wave hindcast and an investigation into the climatic drivers of wave climate anomalies is presented. The sea and swell partitions of the wave climate were modelled independently as well as using an integrated model with both partitions represented. The wave hindcast was validated against two wave buoys located off the coast of Adelaide’s metropolitan beaches and key wave parameter anomalies were calculated across the gulf. Teleconnections were investigated, and the Southern Annular Mode is found to have the strongest correlations to wave parameter anomalies while the Southern Oscillation Index and the Dipole Mode Index fluctuations are found to correlate seasonally with wave parameter anomalies. Projected future trends of these climate drivers from literature have been related to the teleconnections found in this study to inform future trends of bimodal wave conditions in the gulf. The Southern Annular Mode is projected to trend positive which will reduce wave height and the westerly component of waves in the gulf, while the Southern Oscillation Index is projected to become more variable in the future which will lead to more extreme winter and spring wave conditions. An understanding of these trends allows coastal managers to pre-emptively manage the impacts of waves on the coastline at a seasonal to annual basis and provides insight into future wave conditions beyond these time periods.
1 Introduction
Ocean waves play an important role in sediment transport and mixing in the coastal zone (Wandres et al., 2018). Wave-driven forces are an important driver for coastal erosion in nearshore areas in conjunction with beach profile retreat due to sea level rise and increased storminess (Hemer et al., 2007; Ranasinghe et al., 2023). Coastline changes are the result of a very delicate balance of small gradients in alongshore transports, which are determined mainly by the local wave climate where even subtle changes can result in large scale erosion or accretion (Splinter et al., 2012), and self-reorganization (Ashton et al., 2001; Antolínez et al., 2018). Understanding regional wave climates is therefore important for coastal planning, management and protection (Wandres et al., 2018).
The most common approach to assess the current influence of wave climates on beaches is through a combination of data analysis and numerical models (Smith et al., 2021). Numerical models are able to fill the temporal and spatial gaps in measured data and are relatively inexpensive in comparison to physical measurements (Albuquerque et al., 2021). Numerical models can go a step further, not only characterising the present-day conditions (seasonal, inter decadal and long-term trends), but also assessing future impacts on the wave climate and subsequent effects for the coastal management (Méndez and Rueda, 2020).
Not only the average climate conditions, but also the temporal variability of the wave climate is relevant for coastline changes, especially at seasonal to yearly time scales. Those ‘medium-term’ fluctuations and anomalies can be derived from wave hindcasts and can be compared to climatic indices which describe the variability of global circulation patterns. These studies have frequently been performed at a global scale using global wave hindcasts. Reguero et al. (2015) found correlations between wave energy and a range of climate indices across the globe to highlight wave power resources and assess their drivers. Odériz et al. (2020) found spatially dependent positive and negative correlations between ENSO with both wave power and wave direction anomalies globally. The study showed that ENSO is the primary driver affecting global wave climates on interannual timescales and suggested that the quantification of wave climate variability attributed to ENSO could aid in first-pass coastal risk assessments. Marshall et al. (2018) and Hemer et al. (2010) have shown that the Southern Annular Mode (SAM) is a primary driver for seasonal and interannual variations in wave climate in the Southern Hemisphere. An improved understanding of the global climate drivers that cause seasonal to interannual fluctuations at the coast has also been extended to morphological impacts on coastal areas (Barnard et al., 2015), which provides insight for coastal managers and practitioners to perform necessary pre-emptive planning or management.
Global studies can provide a broad insight into the climate modes which impact wave climates at a large scale, however there are nuances in regional wave climates that are not well represented at a global scale and require higher resolution analysis. For example, local winds which force more localised sea waves are often poorly represented in global reanalysis and forecasts but are captured more effectively in higher resolution regional wave models (Elshinnawy and Antolínez, 2023). Where coastal settings are complex, the interpretation of global wave climate data is sensitive to spatial and spectral resolution, as transformation of multimodal wave conditions become key (Hegermiller et al., 2017). A study of a bimodal directional wave climate in the Nordic seas showed that sea wave height anomalies and swell wave height anomalies can have a contrasting relation to the North Atlantic Oscillation (Semedo et al., 2015). The study showed that in areas where sea waves are more prevalent, a negative correlation was found while swell waves tended to correlate positively highlighting the benefits of analysing sheltered waters with a bimodal approach. Albuquerque et al. (2021) performed a partitioned assessment of the New Zealand wave climate where point location correlations were found between sea and swell wave conditions with the Southern Oscillation Index (SOI), Dipole Mode Index (DMI) and Southern Annular Mode (SAM). This analysis provided insight into the differing relationships between climate indices and both sea and swell waves from various directions around New Zealand and similarly to Semedo et al. (2015) highlighted the benefits of a multimodal analysis. Though there have been studies of the links between multimodal wave climates and large-scale climate drivers, there remains a lack of literature concerning the detailed correlation analysis of multimodal wave climates in localised semi-enclosed basins.
The study location for this current research is the Gulf St Vincent (GSV) in South Australia (see Figure 1), which is a semi-enclosed gulf. The gulf is characterized by a bimodal wave climate with a combination of swell waves from the southwest and seasonally varying local sea waves. The precise occurrence and properties of swell and sea waves are expected to determine the delicate balance of sediment transports at the eastern side of the gulf and are therefore essential for management practices along the Adelaide Metropolitan Coast. Though waves in semi-protected gulfs have been included in broader studies, they have not been assessed in detail using a bimodal approach. Such knowledge on their effects is very relevant for understanding the drivers for regional coastal change when the study location is subject to a nuanced wave climate that cannot be well represented in broader global studies. GSV provides a suitable study site to assess the impacts of large-scale climate modes in semi enclosed gulfs where both wave climate modes impact sediment transport of managed coastlines. Identifying these relationships will also provide an example of how identifying historic relationships between wave climate modes and climate indices can allow coastal managers to pre-emptively manage coasts based on projections of how these climate drivers may change into the future.
Figure 1
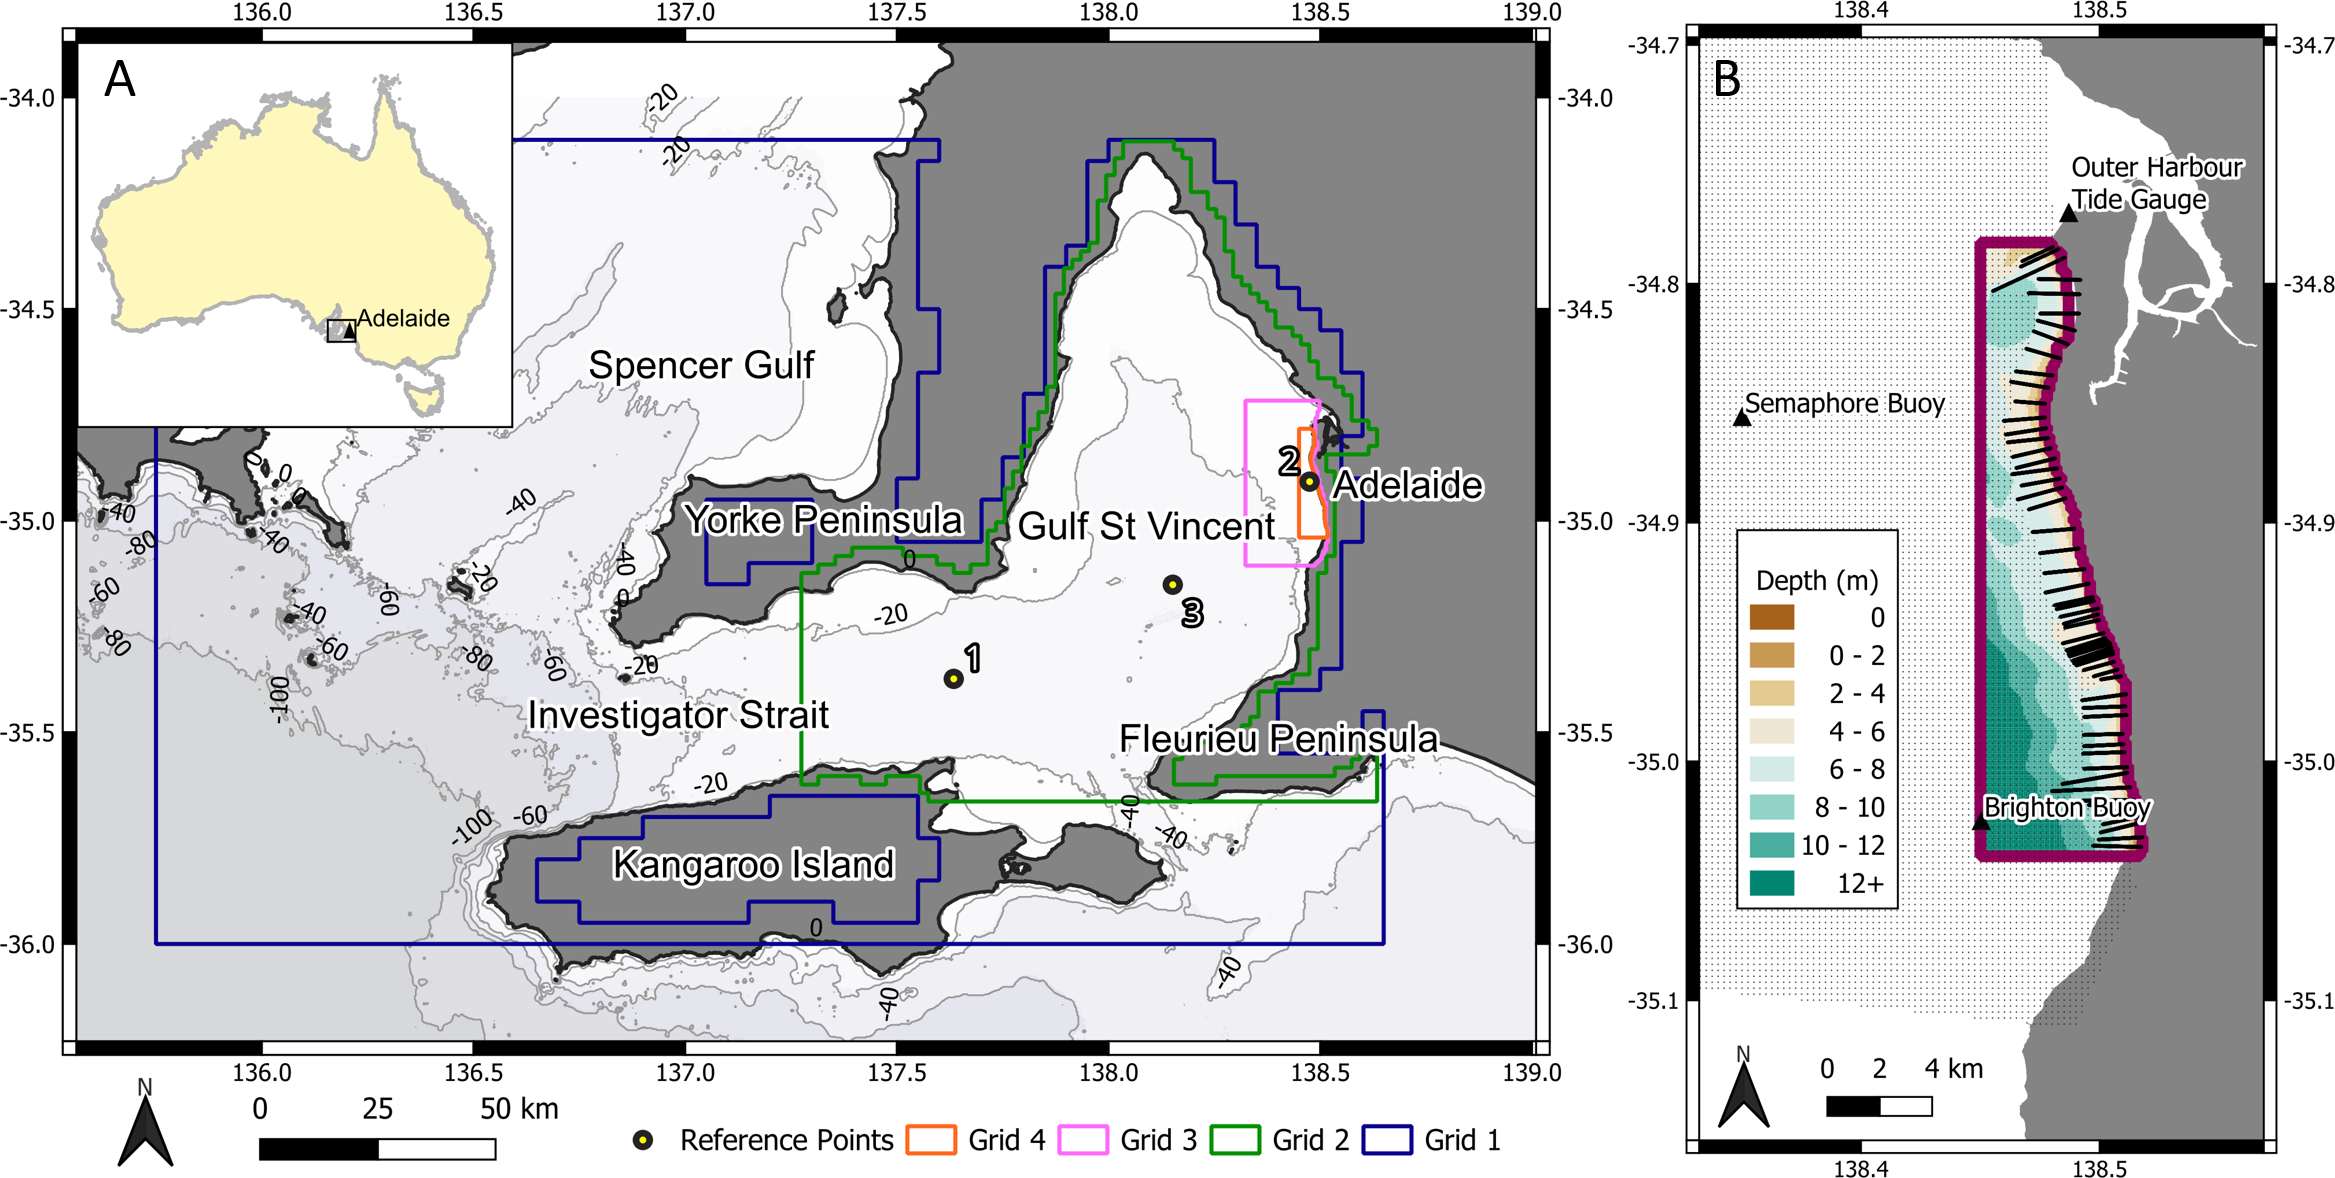
(A) Study location (Australia boundaries from Australian Bureau of Statistics, July 2021) and bathymetric contours in metres (Australian Bathymetry and Topography Grid, June 2009, Geoscience Australia), computational grid extents for the wave model and result output locations 1 to 3 displayed as yellow circles. Australia boundaries from Australian Bureau of Statistics, July 2021. (B) Model bathymetry of grid 4 adjacent to the Adelaide Metropolitan Coast (orange extent in A), beach survey profiles (Department for Environment and Water, 2020/2021) displayed as black lines and national bathymetry points (Geoscience Australia, 2009) displayed as black dots, Australia boundaries from Australian Bureau of Statistics, July 2021.
While in a national assessment Hemer et al. (2010) found that seasonal variations in South Australia offshore swell wave conditions related (with statistically significance at 95%) to the Southern Oscillation Index (SOI) and Southern Annular Mode (SAM), little is known if this correlation still holds for swells penetrating the GSV, or for local wave generation. Of note is that the Indian Ocean Dipole (IOD), which is due to the anomalous sea surface temperature gradient between the southeastern equatorial Indian Ocean and the western equatorial Indian Ocean, is of relevance for rainfall in the GSV area so may play a role in the generation of local seas (He and Guan, 2013; Kamruzzaman et al., 2020). This study presents a 40-year hindcast of the semi-enclosed GSV wave climate with an analysis of seasonal to interannual fluctuations of the bimodal sea state and locally relevant climatic indices. A novel understanding is provided of the correlations of the long-term global climate oscillations with the bimodal wave climate of GSV. These relations provide a basis for understanding the local coastal morphology of the Adelaide metropolitan coast and expected sensitivity of the coastal stability to climate change. The study site offers a suitable set of conditions to find correlations between the bimodal wave climate and large scale climate drivers, though it is expected that the methodology used in this study would be suitable to other semi-enclosed basins around the world.
2 Materials and methods
The methodology presented in this study develops a wave model to identify annual and seasonal trends in the bimodal wave climate that can be compared to climatic indices that describe the large scale climate drivers in the region. To perform this comparison, a correlation analysis can be performed at all points across the model domain in order to map areas in which significant correlations exist between wave parameter anomalies and climate indices. For the following sections, southern hemisphere seasons are defined as summer (December, January and February), autumn (March, April and May), winter (June, July and August) and spring (September, October and November).
2.1 Study area characteristics
The study site is Gulf St Vincent (GSV), a intercratonic shallow gulf (<40 m water depth) located in South Australia, bordered to the west by the Yorke Peninsula and to the east by the Fleurieu Peninsula (Figure 1). The gulf is part of the Great Australian Bight Shelf with seabed sediments composed of mixed terrigenous-carbonate sands (Short, 2020). The GSV’s area is ~7000 km² with a north to south fetch of ~150km and a west to east fetch of ~70 km at its widest point. It is largely protected from the Southern Ocean by Kangaroo Island which limits the swell contribution to the wave climate within the gulf.
Local prevailing winds are typically from the west quadrant with a higher prevalence of northwesterlies in winter and southerwesterlies in summer which generate sea waves within the gulf (Short, 2020). Seabreeze contributes to the wind climate with a net southwesterly direction as a result of westerly local gulf breeze and southerly continental sea breeze (Pazandeh Masouleh et al., 2016). Sea breeze intensities increase in the summer months with a greater southerly component. High-energy south/southwesterly swell waves that originated in the Southern Ocean with an annual mean significant wave height of approximately 3m (Young et al., 2020; Smith et al., 2021) dampen through refraction around Kangaroo Island. Some southwesterly swells can enter the gulf through Investigator Strait (between Kangaroo Island and the Yorke Peninsula, Figure 1) with less obstruction and consequently propagate high wave energy across the gulf (Short, 2020). The bimodal wave conditions are the dominant driver for sediment transport on the beaches which varies seasonally but has a net northerly transport. This imbalance requires active management techniques such as sand nourishment to maintain recreational beach widths (Townsend and Guy, 2017).
2.2 Wave model development
The wave climate hindcast was developed using the wave model SWAN (Simulating Waves Nearshore); an open-source, third generation wave model which implicitly takes into account the interaction between waves and currents through radiation stresses (Booij et al., 1996). Three models were created to assess the (i) swell partition, (ii) sea wave partition and (iii) integrated partition contribution to the GSV wave climate. The integrated partition model included both the sea wave component and swell boundary components described in the following sections, while the swell partition and local sea wave partition models only included their respective components. The development of these models allows for the common analysis of integrated conditions as well as extra insight into each mode of the bimodal wave climate in GSV.
2.2.1 Wave model grid and bathymetry
This study presents results across the full extent of GSV, however, the model grid is refined for greater accuracy offshore of the Adelaide Metropolitan Coastline which lies on the eastern side of the gulf (Figure 1). Nested grids of increasing resolution have been adopted to assess wave conditions with enough resolution to capture the dominant processes at the study site while keeping an efficient computational time. Grids are comprised of square grid cells with resolutions G1-4km, G2-2km, G3-500m and G4-100m.
Model bathymetry was developed using local surveyed beach transects and a coarser national bathymetric grid (Geoscience Australia, 2009). Beach profile surveys which extend approximately 2km seaward of the foreshore are performed regularly by the state’s environmental authority, the Department for Environment and Water. Recent profiles (2020/2021) were used to create nearshore bathymetry using triangular interpolation between profiles. The nearshore bathymetry from surveyed profiles was blended into the coarser national bathymetric grid to create the bathymetry used for the 40-years hindcast model (Figure 1).
2.2.2 Model boundary conditions
Wave boundary conditions were sourced from the Australian/Western Pacific WaveWatch III nested CAWCR (Centre for Australian Weather and Climate Research) wave hindcast (Smith et al., 2021). This model was developed to provide global data with increased resolution for applications in the Australian and West Pacific region. The forcing of this model varies through the simulation period with 1979-2013 generated using WaveWatch III v4.08 and 2013-2020 generated using WaveWatch III v4.18. Four-hourly integrated wave conditions were used from this model, applied to southern and western boundaries of Grid 1. These parametrised conditions are applied using a JONSWAP spectral shape with a default peak enhancement factor of 3.3.
Reanalysis wind data has been applied uniformly across the model domain at each four-hourly timestep from the ECMWF ERA5 model (Hersbach et al., 2020).
The effect of changes in water depth due to tides is represented using single uniform tidal level for each four-hourly timestep, the tidal levels are sourced from the Outer Harbour tidal gauge, location displayed in Figure 1.
2.2.3 Time period and computational time step
The model simulation spans from 1980-2020 (40 years). This simulation length allows for medium term fluctuations in wave characteristic anomalies to be established. The computational timestep is four hours which was the minimum timestep able to be used while maintaining a reasonable computational expense. This time step is appropriate to assess trends and mean anomalies which is the focus of this study, however extreme events may not be adequately represented.
2.2.4 Settings
The SWAN model was run using third generation physics in stationary mode. Depth induced breaking was used according to Battjes and Stive (1985) with dissipation coefficient Alpha=1.0 and breaker parameter Gamma=0.73. Whitecapping was activated according to van der Westhuysen et al. (2007) and bed friction according to (Hasselmann et al., 1973). Quadruplets were considered for non-linear wave interactions, but triads were not included. The model domain for each grid used a default circular directional space and 24 frequency bins.
2.2.5 Verification of modelled data against buoy measurements
Output extraction points are shown for two measured wave buoy locations offshore of Semaphore and Brighton for model validation (see Figure 1). Measured data from two SOFAR Spotter wave buoys deployed within Gulf St Vincent were used for these locations. At the time of model development, 1 month of measured wave data was available. Pearson’s correlation coefficient (R) was calculated to assess correlation, Root Mean Square Error (RMSE) was calculated to assess error margins, Scatter Index (SI) was calculated to standardize RMSE and bias was calculated to determine potential significant over or under prediction of modelled conditions. The wave buoys are located on the eastern side of the gulf (Figure 1), offshore of the Adelaide metropolitan coastline and provide half-hourly integrated parameters of wave height, period and direction.
2.3 Large scale climate modes
Southern Annular Mode (SAM), El Niño Southern Oscillation (ENSO) and Indian Ocean Dipole (IOD) are large scale climate drivers in the Southern Hemisphere (Cai et al., 2011a) with the potential to drive wave climate anomalies in GSV.
SAM is a widespread climate driver that encompasses the entire extratropical region of the Southern Hemisphere (Fogt and Marshall, 2020). It is defined as the zonal mean atmospheric pressure difference between the mid-latitudes (~40°S) and Antarctica (~60°S) (Marshall, 2003) and drives a westerly wind belt which moves between Antarctica and Australia. When SAM is positive, the belt of westerly winds moves closer to Antarctica, but when SAM is negative the belt of westerly winds moves closer to the southern regions of Australia (Swart et al., 2015). These fluctuations generally occur over a timescale of two weeks to a season and have been found to impact ocean waves in the Southern Ocean (Marshall et al., 2018).
The IOD represents the difference in ocean temperatures between the west and east tropical Indian Ocean and its negative phase is associated with an increase in northwest cloud bands over Australia (Cai et al., 2011b). When the Indian Ocean Dipole is positive there are warm anomalies in the equatorial western Indian Ocean and cold anomalies in the east (Cai et al., 2021b). Fluctuations in IOD are strongly seasonal with their impacts on Southern Australia predominantly felt in winter and spring (Ummenhofer et al., 2011). A negative IOD has been found to significantly correlate with increased rainfall, while a positive IOD was found to correlate to wetter conditions (Ashok et al., 2007).
ENSO describes the oscillations of El Niño, neutral and La Niña phases due to changes in intensity of the Walker circulation which modulates sea surface temperature in the central and eastern equatorial pacific (Cai et al., 2021). These surface temperature oscillations are part of a feedback loop with trade winds across the Pacific. McPhaden et al. (2006) describes this feedback, during La Niña the trade winds elevate surface temperatures in western Pacific and induce cooler water to upwelling in the eastern Pacific. This creates an east-west pressure gradient that drives the trade winds. The trade winds weaken during El Niño when the pressure gradient reduces as atmospheric pressure increases in the western Pacific and falls in the eastern Pacific. Oscillations of ENSO occur at a time scale of approximately 2-8 years (Takahashi et al., 2011).
These three climate drivers have associated indices which quantify their variability. The SAM index tracks the SAM, Dipole Mode Index (DMI) tracks the IOD and the Southern Oscillation Index (SOI) tracks ENSO. SAM and SOI were selected based upon the correlations found in broader wave climate correlation studies (Hemer et al., 2010), while DMI was selected based upon correlations to other weather conditions local to GSV (Kamruzzaman et al., 2020).
2.4 Analyses of the wave climate and correlations with climate indices
Analyses of the modelled wave hindcast has been performed to validate, characterize, and identify climatic drivers for the integrated wave, sea wave and swell wave conditions.
The full 40-year hindcast wave climate results were analyzed to characterize conditions in the gulf considering integrated, and sea and swell wave climates independently. Model outputs have been extracted and analyzed across grid extents with detailed time series analyses performed at point locations shown in Figure 1. Points 1 is positioned to capture the wave conditions passing through Investigator Strait. Points 3 provides wave climate information for the central Gulf St Vincent. Point 2 is positioned adjacent to the Adelaide metropolitan coastline. Wave roses have been created to identify seasonality in wave direction as well as call attention to wave directions corresponding to more energetic conditions. Joint probability analysis was performed on integrated conditions to identify connections between wave parameters and highlight discrete sets of conditions.
The 40-year modelled wave climate was then processed to find seasonal and annual anomalies of wave parameters across the extent of grid 2 with the aim of relating these anomalies to climate indices. Significant wave height and mean values of period and direction were chosen for analysis to include the entirety of the wave spectrum for each partitioned model following Hemer et al. (2010). Anomalies of these wave parameters were then correlated against seasonal and annual fluctuations of DMI, SOI and SAM to find relationships that characterize the seasonal and interannual wave climate. These relationships were assessed by finding statistically significant correlations between each parameter and each climatic index across the entirety of grid 2 as presented in Figure 1. Statistically significant correlations for this study were defined as linear relationships between wave climate anomaly and climate index with a Pearson correlation coefficient R>0.32, relating to a 95% significance (P>0.05) level given 40 data points. The correlations found in this analysis were then investigated to understand the causation of these relationships.
3 Results
3.1 Model validation
Measured wave data from the two wave buoys in Gulf St Vincent (see Figure 1) were compared to model outputs extracted from the nearest grid cell over a 1 month period in September 2021. Pearson’s correlation coefficient (R), Root Mean Square Error (RMSE), Scatter Index (SI) and bias were calculated and are presented in Figure 2.
Figure 2
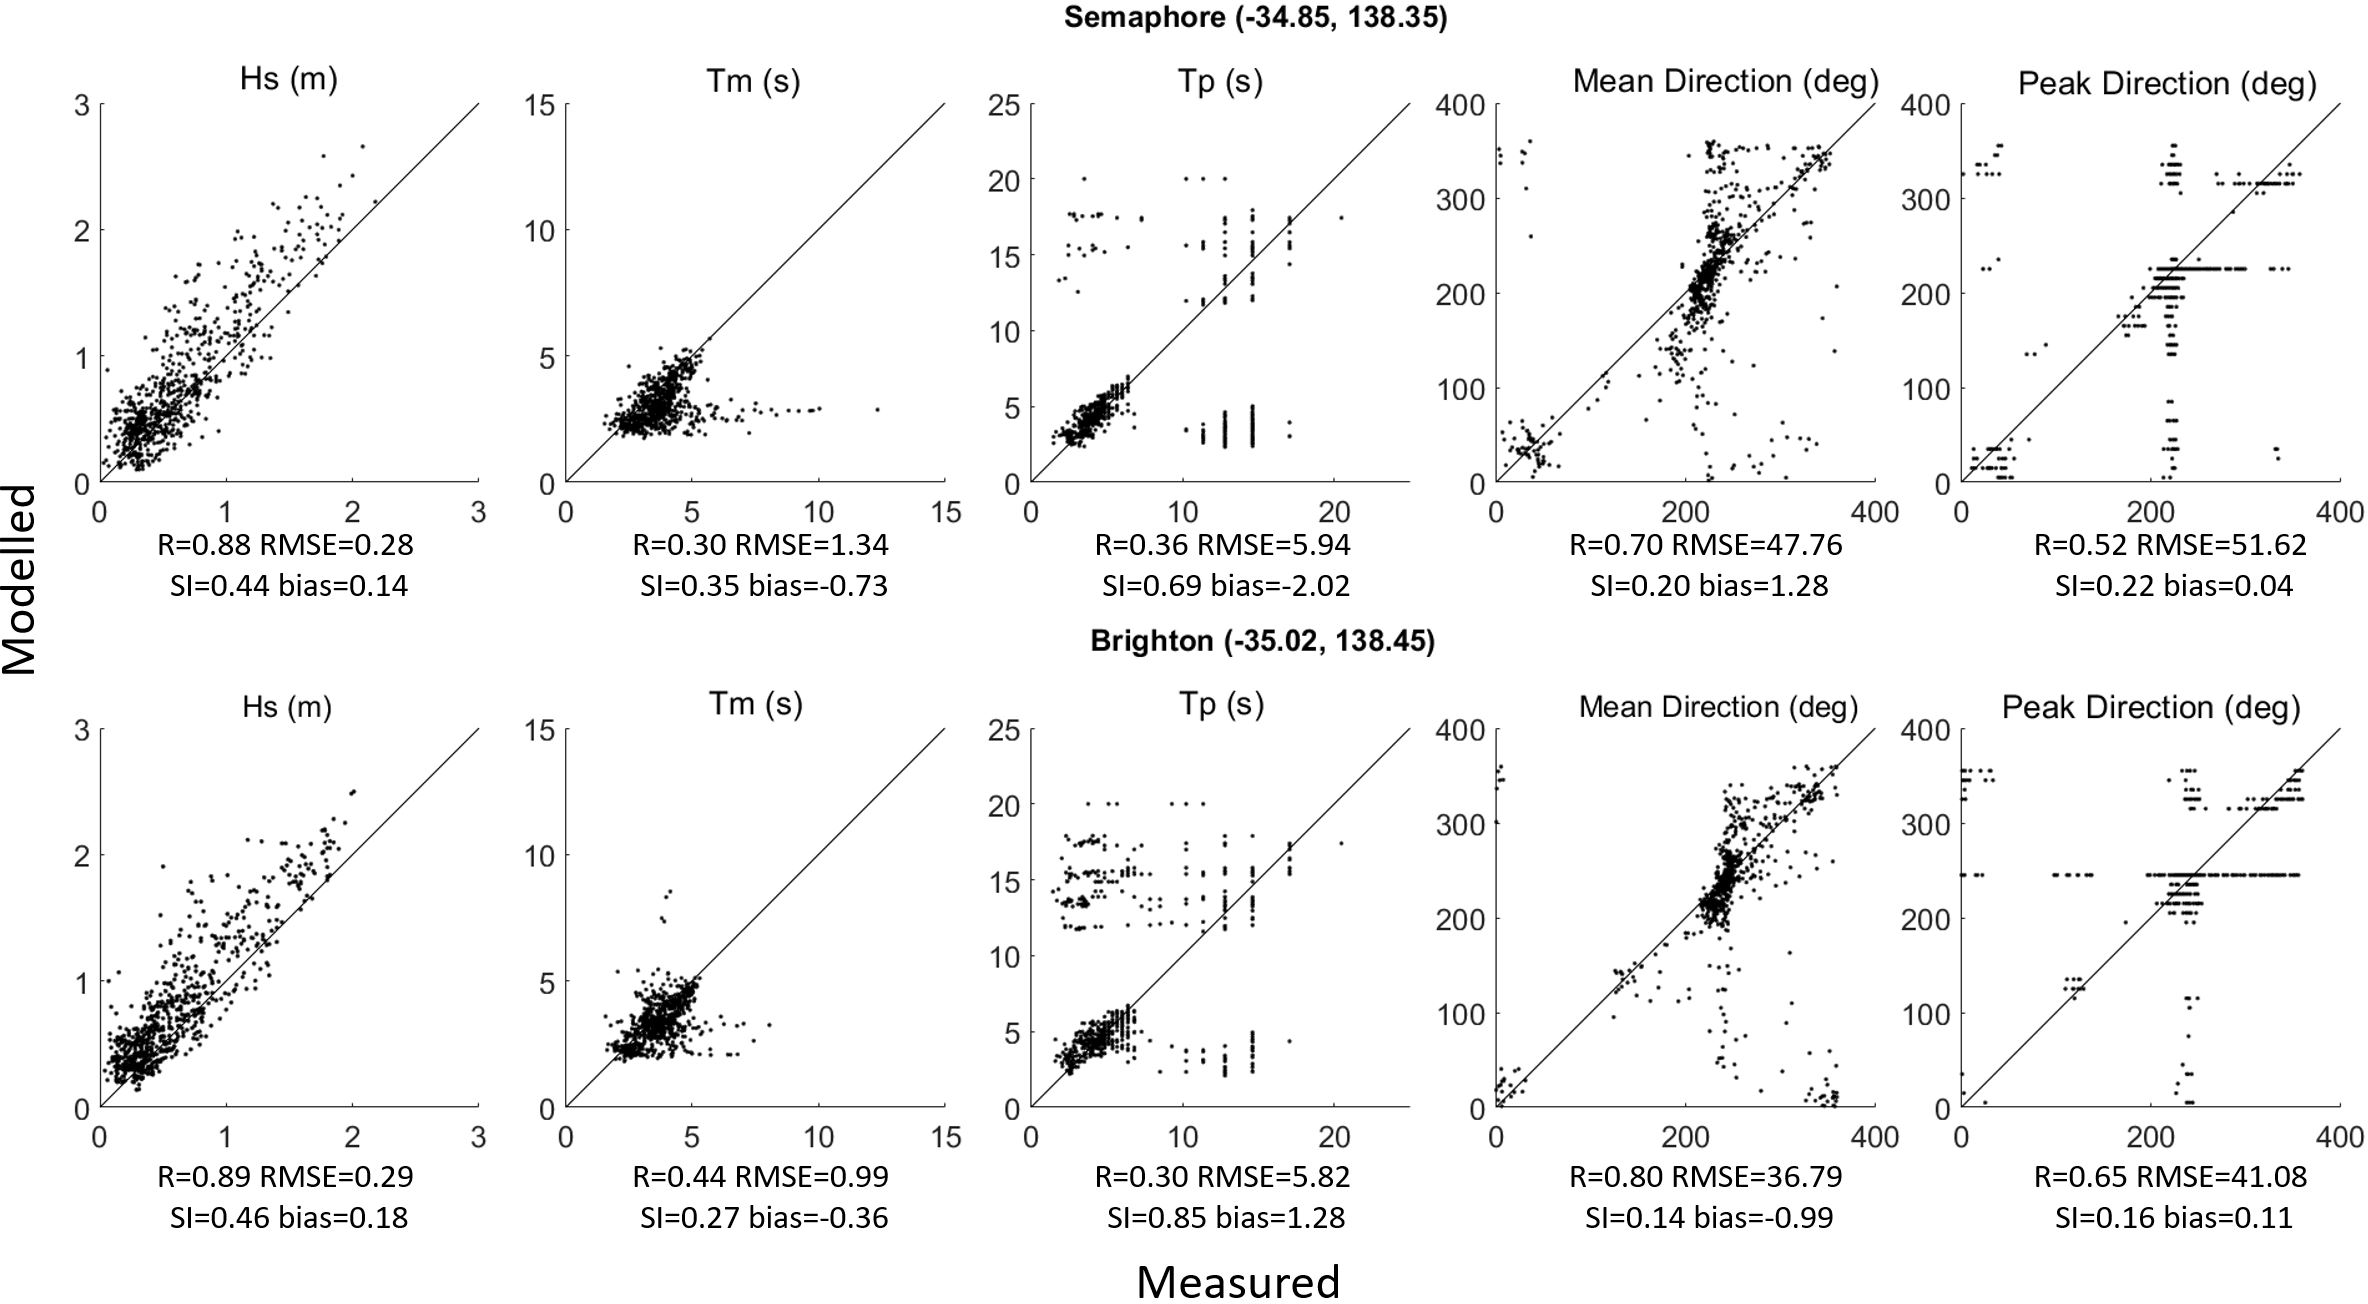
Model validation results of wave parameters (significant wave height (Hs), mean period (Tm), peak period (Tp), Mean direction and peak direction) from modelled waves plotted against measured data from wave buoys located offshore Semaphore Beach and offshore Brighton Beach. Validation statistics correlation coefficients (R), Root Mean Square Error (RMSE), Scatter Index (SI) and bias.
Significant wave height correlations are R=0.88 when compared against the Semaphore buoy and R=0.89 when compared against the Brighton buoy. RMSE and bias results for significant wave height suggest the model is overestimating wave height which is also evident in the scatter plots presented in Figure 2. Correlations for both mean and peak wave periods range between R=0.30 and R=0.45 at Semaphore and Brighton respectively with high RMSE (>5 seconds) for peak period. These statistics indicate that the peak spectral conditions are not in consistent alignment between modelled and measured data. The peak period scatter, as presented in Figure 2, shows some occasions in which the modelled peak period is underestimated at Semaphore and overestimated at Brighton, which is supported by their corresponding bias statistic. The mean and peak wave direction statistics range between R=0.52 and R=0.8 suggesting that there are reasonable correlations between modelled and measured data with bias of less than 2 degrees. There is however, a more significant RMSE and poor SI for direction parameters.
3.2 Mean wave conditions in GSV
Mean annual significant wave height has been calculated across the gulf with variation shown between integrated, sea and swell waves. The average annual significant wave height was computed for the (a) combined sea wave and swell model, (b) sea wave only model and (c) swell wave only model for the 40 year hindcast period (Figure 3). The local sea waves reach an annual significant wave height of approximately 0.5 m at offshore of the Adelaide metropolitan coast and are relatively homogeneously distributed across the gulf. Swell waves penetrate the gulf from the west through Investigator Strait with a mean annual significant wave height of approximately 0.8 m at point 1 (from Figure 1) and 0.3 m offshore of the Adelaide metropolitan coast and display a strong gradient in Hs that decreases towards the north. The combined sea and swell wave results (a) shows the characteristics of both results from (b) and (c) with an even distribution of mean Hs across the northern region of the gulf but an increase in Hs in the southern region is subject to greater swell wave influence.
Figure 3
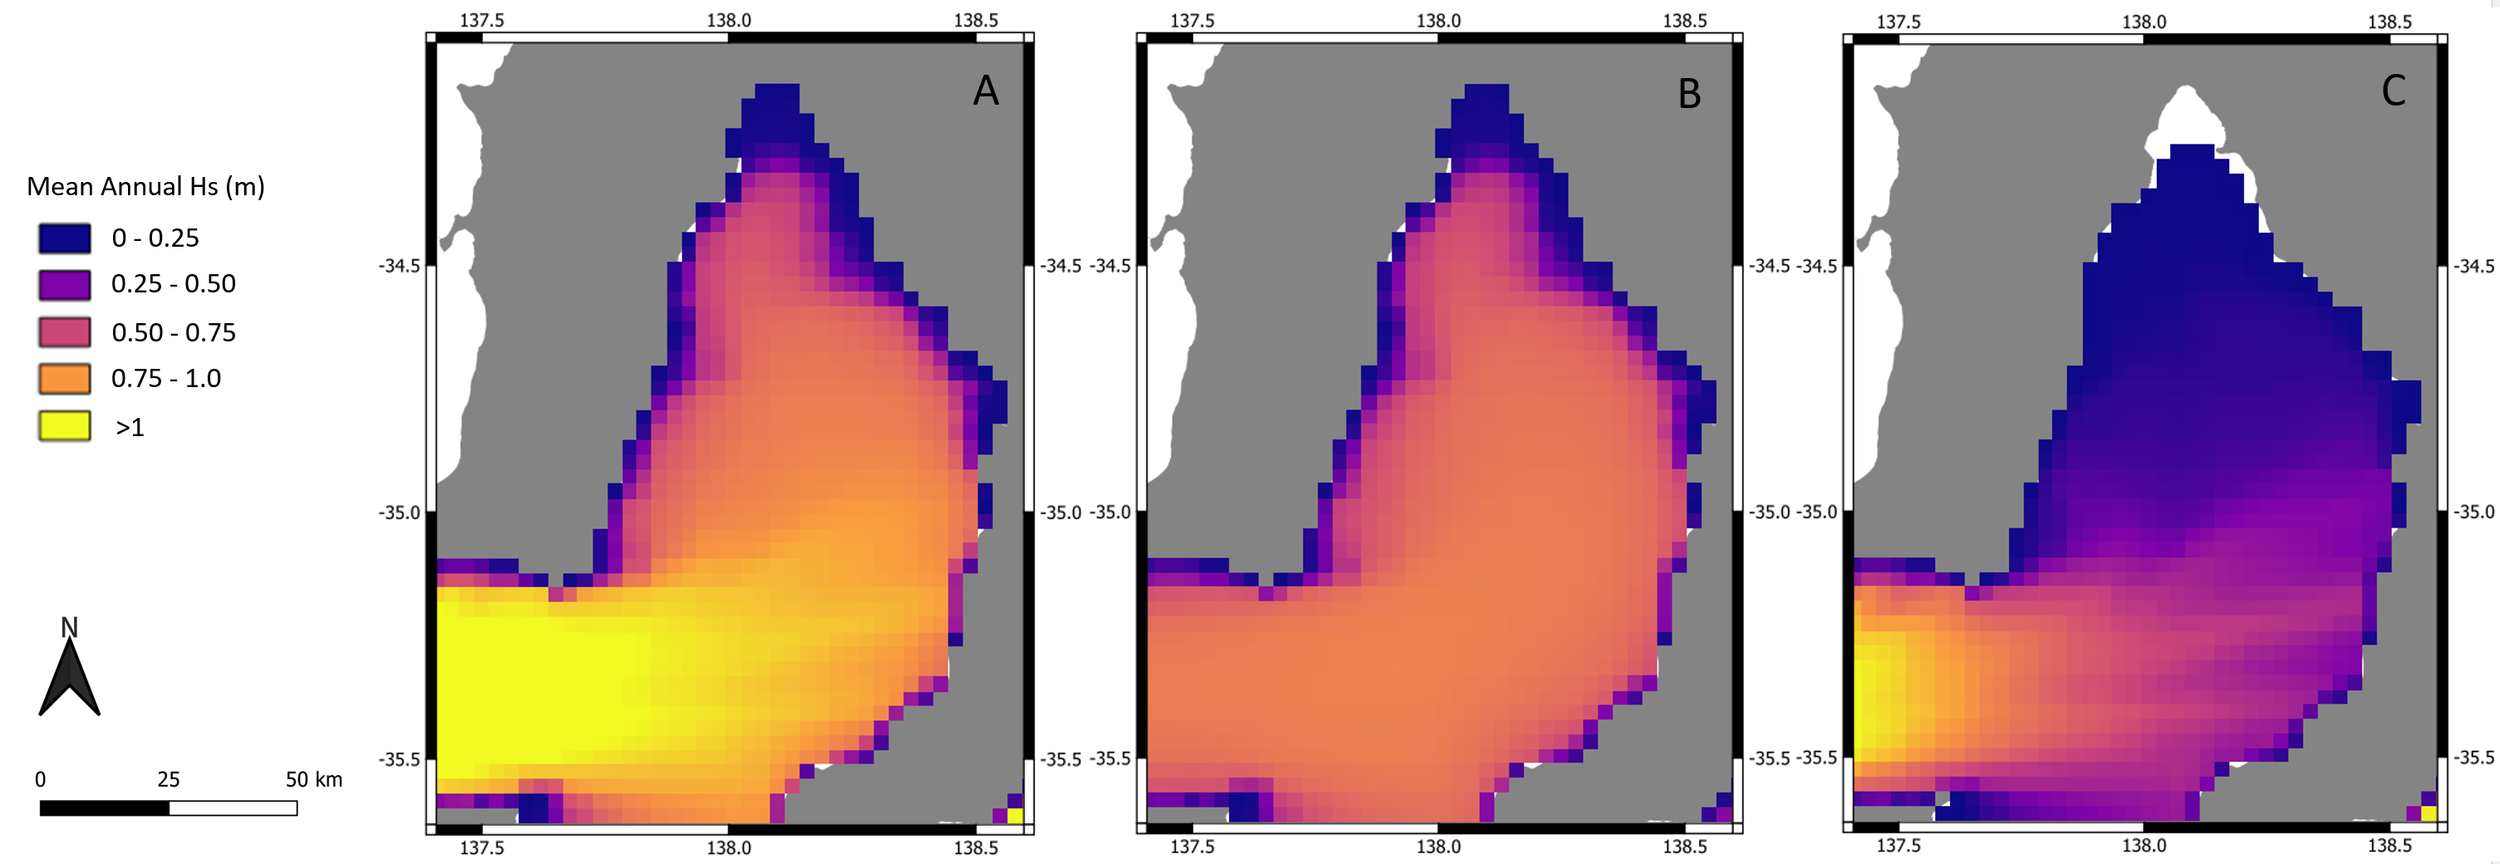
Annual mean Hs from modelled wave hindcast for the Gulf St Vincent. (A) combined sea and swell waves, (B) sea waves, (C) swell waves.
Anomalies to mean conditions, extracted from points 1 and 2 from Figure 1 are presented below in Figure 4. Fluctuations of mean significant wave height at point 1 often exceed ±0.1m which at this location is 20%.
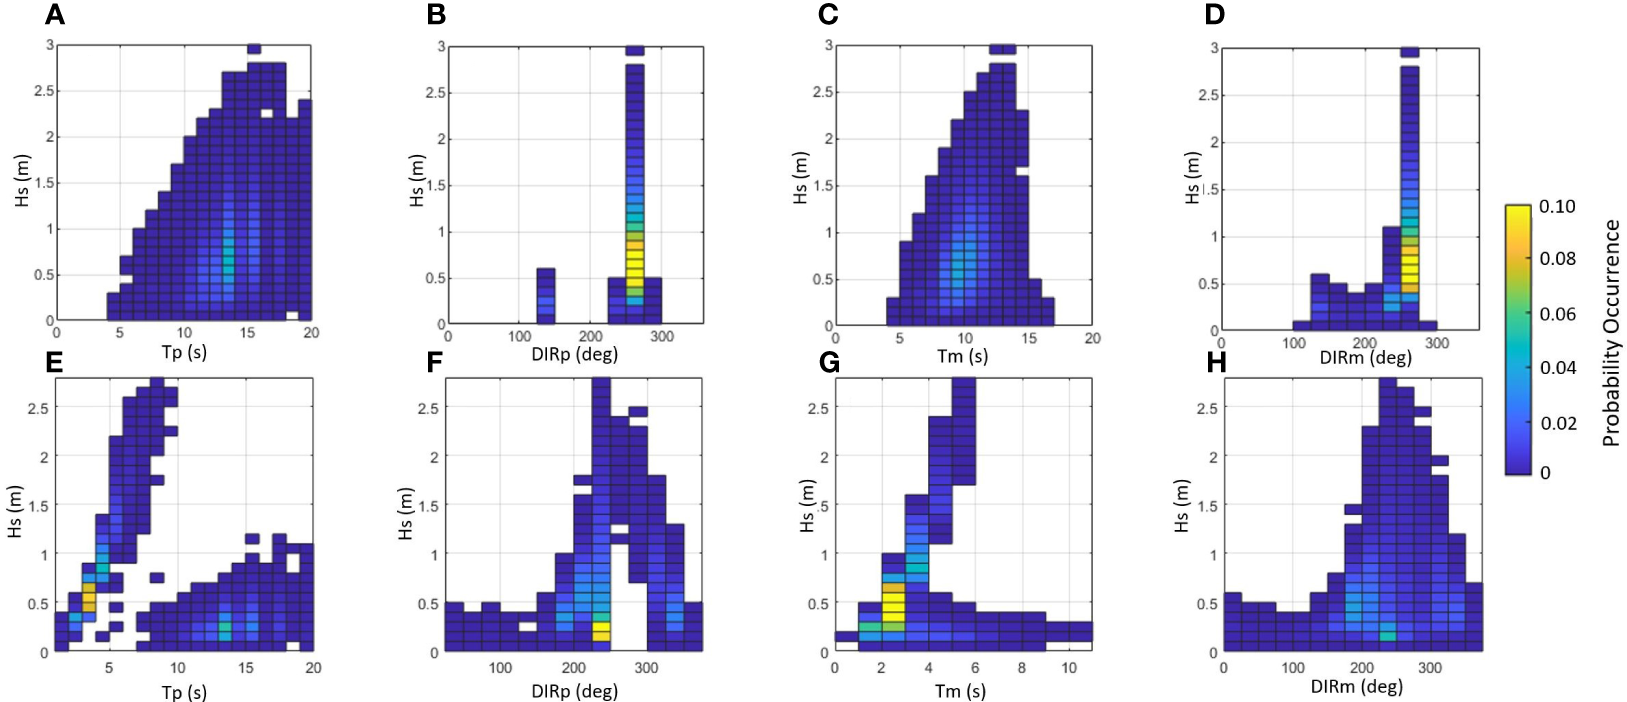
Figure 4
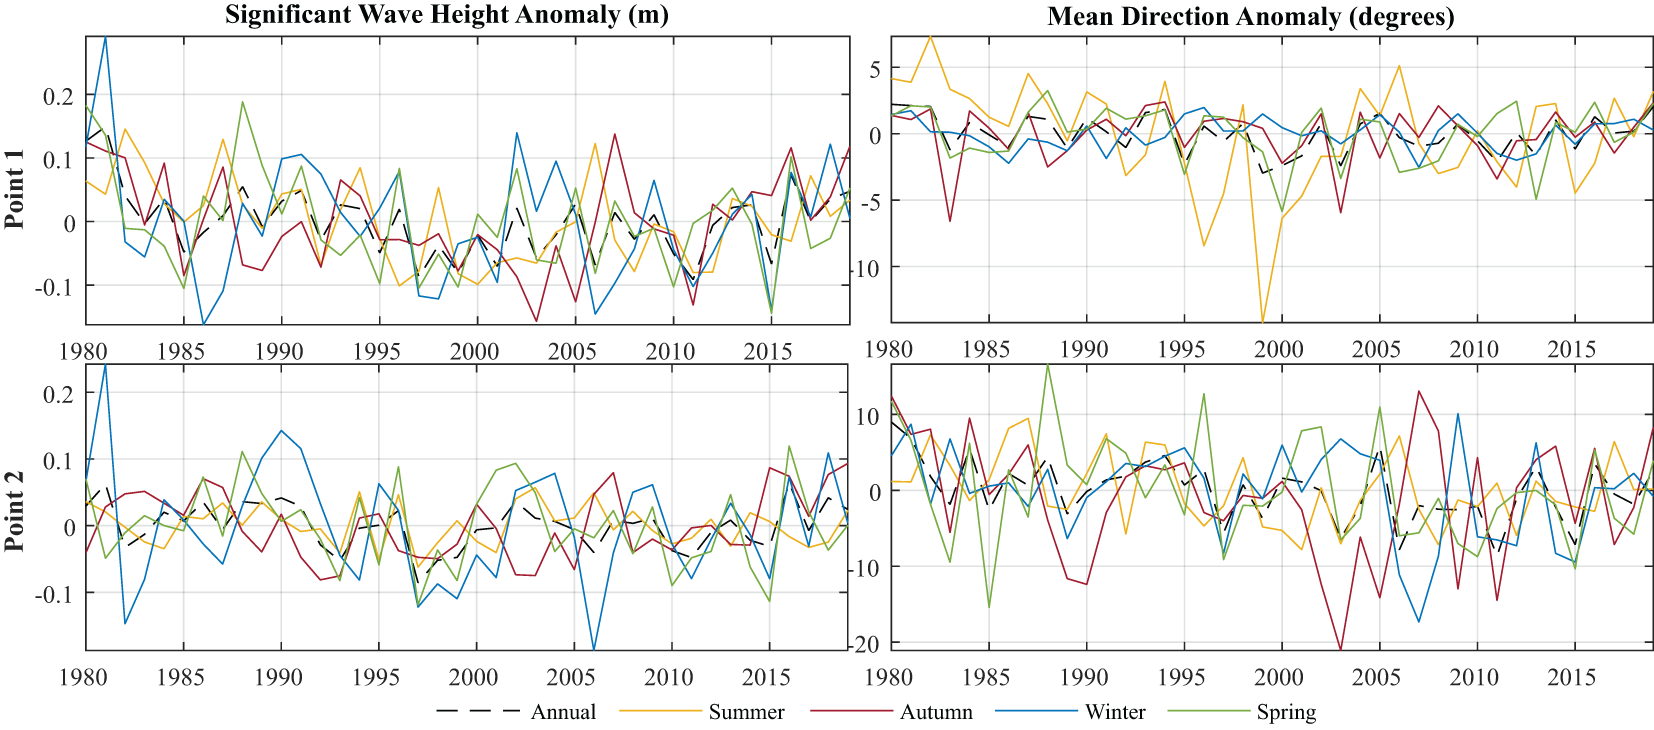
Joint occurrence plots at location P1 (A–D) and P2 (E–H) (see Figure 1) extracted from modelled wave timeseries. Significant wave height plotted against peak period (Tp) (A, E), peak direction (DIRp) (B, D), mean period (Tm) (C, G) and mean direction (DIRm) (D, H) using a probability of occurrence scale highlighting more common conditions (yellow) and less common conditions (blue).
Joint probability analyses displayed in Figure 5 show integrated wave parameters plotted against significant wave height for a location in Investigator Strait (P1) and a location adjacent to the Adelaide metropolitan coast (P2) (see Figure 1). The peak wave conditions at point 1 are largely from a southwesterly direction with a period of approximately 14 seconds. Wave heights exceeding 2 m at this location are swell waves with a peak period longer than 10 seconds from a direction of approximately 240 degrees North. Wave conditions at P2 are more varied with two distinct wave partitions displayed in panel (E) of Figure 5. Swell wave significant wave heights at this location are typically between 0.1-0.4 m and do not exceed 1.2 m. Sea waves at this location are typically between 0.3-1.1m and reach a significant wave height of 2.8 m.
Figure 5
Annual and seasonal wave roses at location P3 in the central part of GSV (see Figure 1) extracted from modelled wave timeseries with integrated conditions, swell conditions and sea wave conditons.
Seasonal and annual wave roses for a location in the central part of the gulf (P3) (Figure 1) and adjacent to the Adelaide metropolitan coast (P2) (Figure 1) have been constructed from integrated conditions, swell wave partition and sea wave partition and are shown in Figures 6 and 7, for P3 and P2 respectively. The integrated parameter results at location P3 show that the dominant wave direction is from the southwest with wave heights up to 3m entering the gulf. Significant wave heights greater than 2m are most common in winter, autumn and spring from a south westerly direction while the summer wave direction has a greater southerly component with less conditions exceeding a significant wave height of 2m. The seasonality of integrated conditions at location P2 follow a similar trend to location P3, however the seasonal signal is stronger with a greater contribution of northerly waves in winter. These plots show the uniform distribution of the swell component of waves within the gulf and highlight how this component accounts for a significant portion of wave heights below 0.5m, however they are not as energetic as the sea waves which are the dominant contributor to wave larger than 1m at both locations. These plots also highlight the seasonality of wave direction in the gulf with northerly sea wave conditions prevailing in winter only.
Figure 6
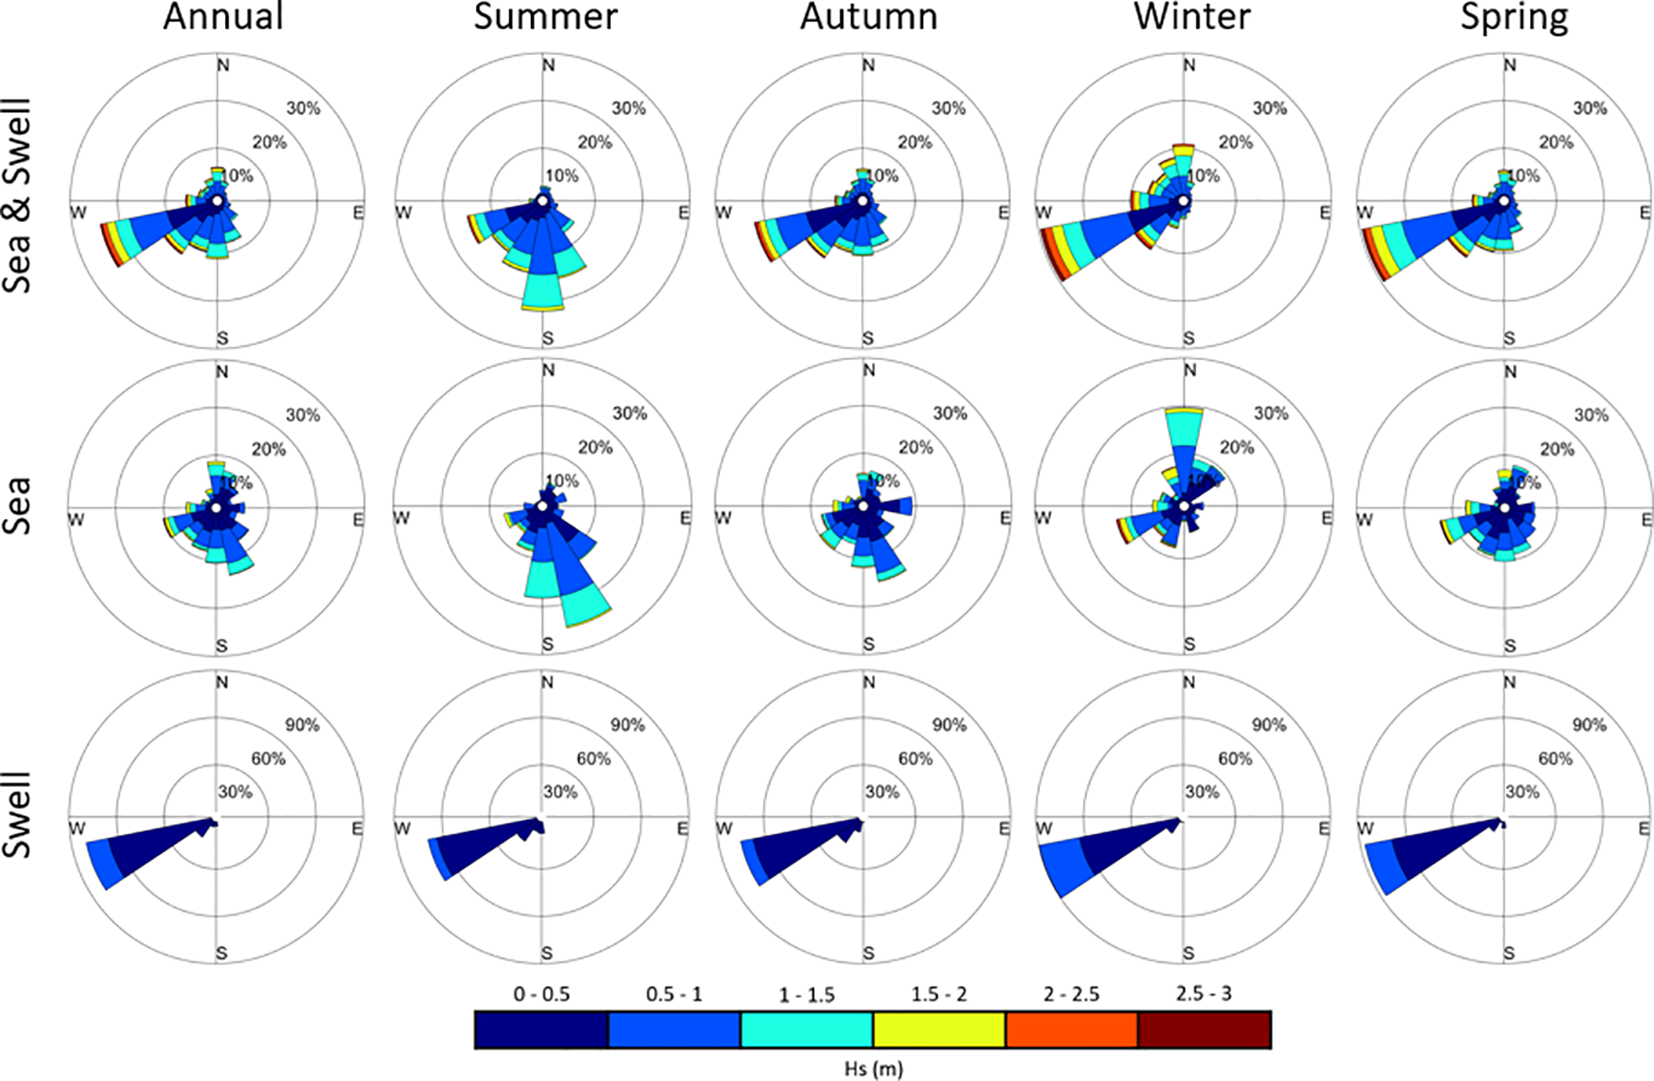
Annual and seasonal wave roses at location P2 adjacent to the Adelaide Metropolitan Coast (see Figure 1) extracted from modelled wave timeseries with integrated conditions, swell conditions and sea wave conditons.
Figure 7
Time-series annual and seasonal anomalies of significant wave height and mean direction, extracted from locations 1 and 2 (see Figure 1).
3.3 Seasonal and annual wave climate variability comparison to climate indices
Mean annual and seasonal significant anomalies of Hs, Tm and DIRm parameters were assessed at locations P1 and P2 from Figure 1. Given the annual (40 years) mean significant wave height at this location is 0.3m and 1m respectively, anomalies largely in the range of ±0.2 m are considered substantial. Mean direction anomalies of up to ±20 degrees were also found and considered significant, particularly when considering the potential effects of these anomalies on sediment transport. Anomalies of Tm were less significant with the biggest deviations from mean conditions being approximately 7%. Given the magnitude of anomalies and associated outcomes for longshore sediment transport, Hs and DIRm were the parameters selected to perform a correlation analysis with climate indices. The time series anomalies of this parameters for P1 and P2 are displayed in Figure 4.
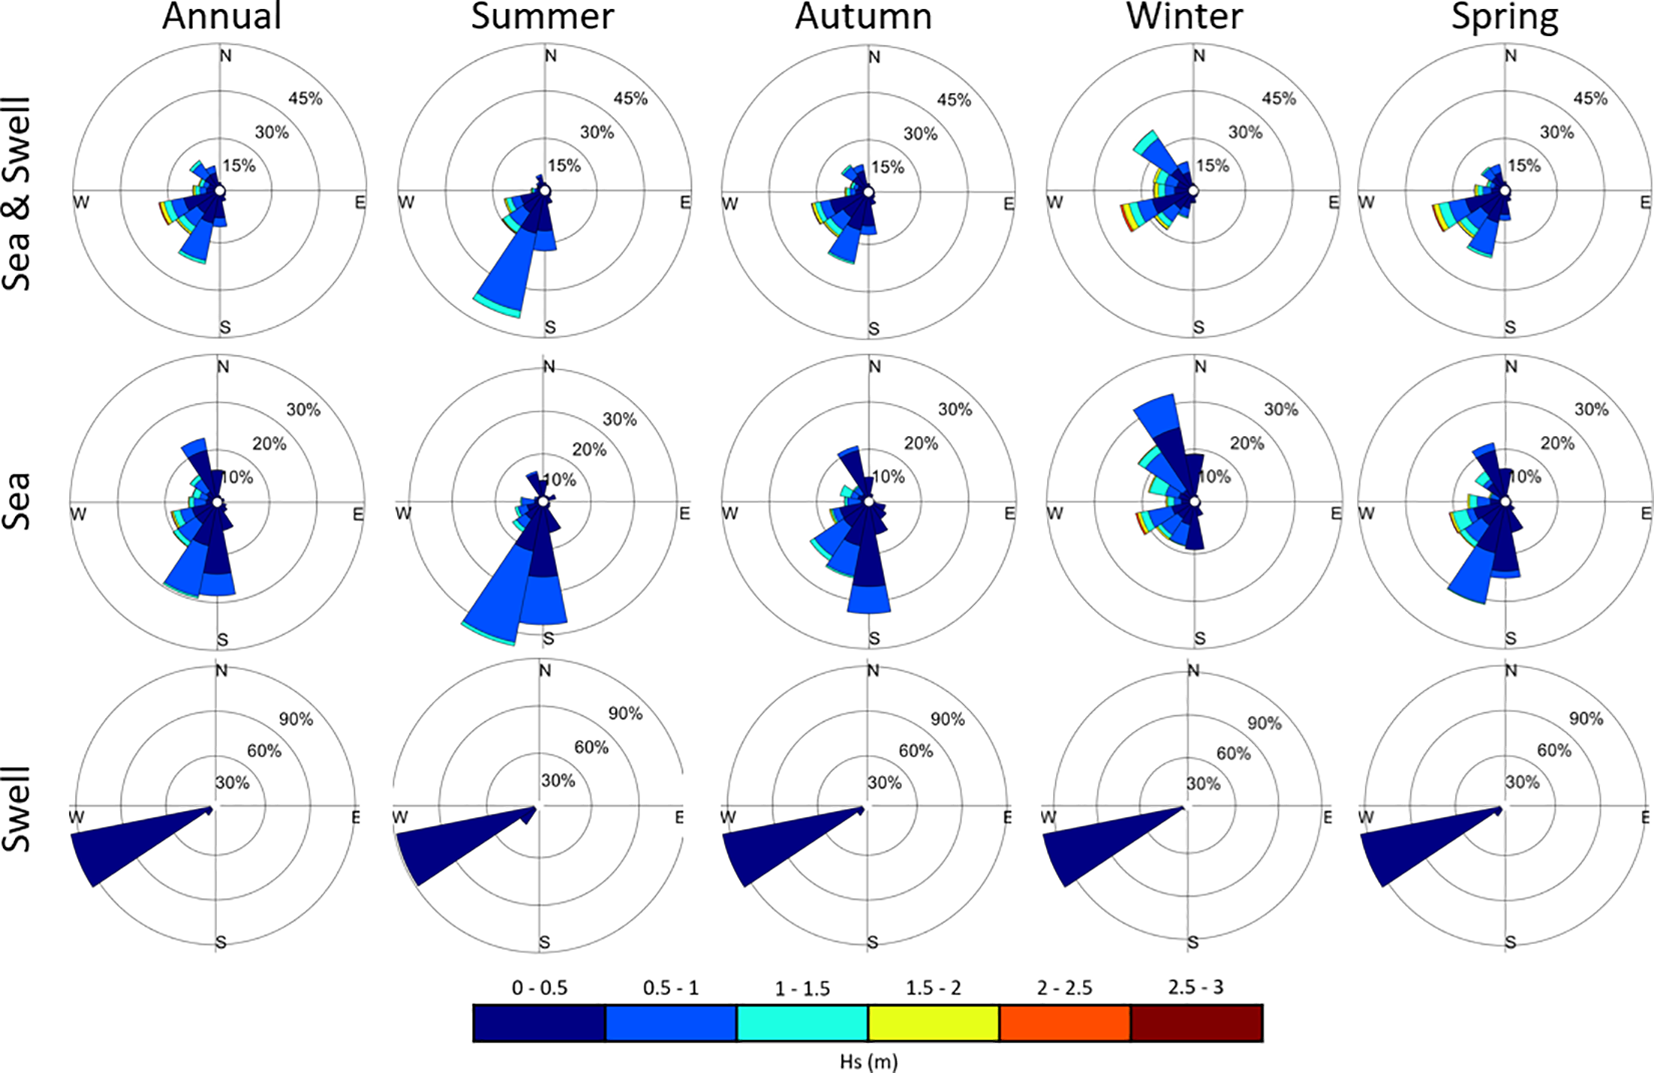
The time series of climate indices used for analysis in this study are presented in Figure 8.
Figure 8
Time series of Southern Oscillation Index (SOI), Southern Annular Mode Index (SAM and Dipole Mode Index (DMI) from 1980-2020, sourced from the Physical Sciences Laboratory (PSL) of the National Oceanic and Atmospheric Administration (NOAA).
3.3.1 Annual variations
Correlations of wave parameter anomalies with individual climate indices are described below and presented in Figure 9.
Figure 9
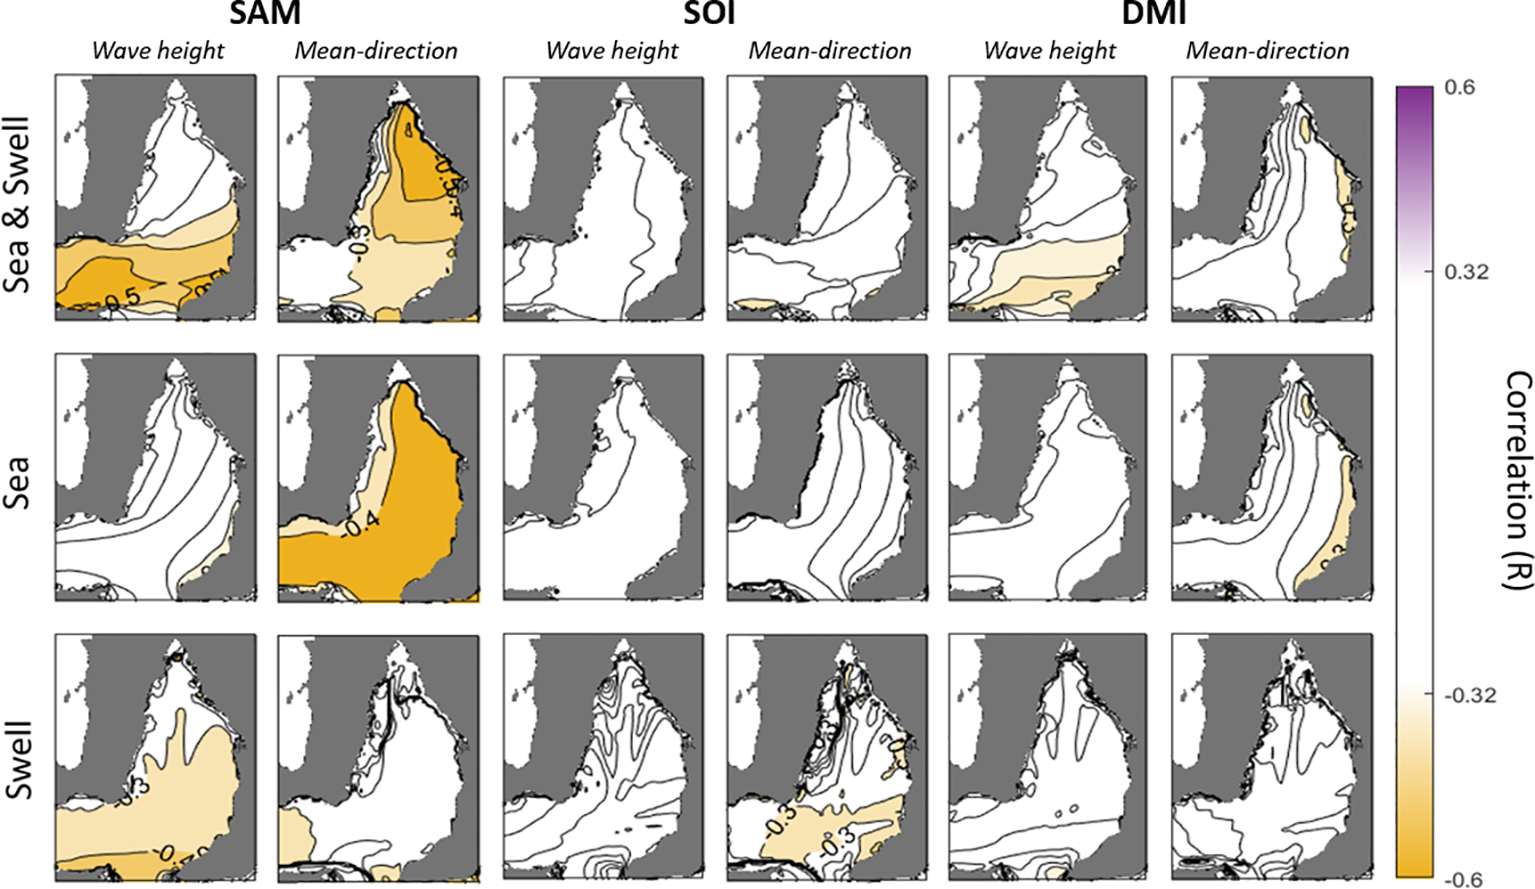
Correlation contour maps of annual modelled mean wave height and mean-direction with annual anomalies of Southern Annular Mode Index (SAM), Southern Oscillation Index (SOI) and Dipole Mode Index (DMI) for integrated conditions, sea waves only and swell waves only. Significant correlations occur when R>0.32 or R<-0.32.
Southern Annular Mode (SAM): Significant statistical correlations were observed between the SAM anomaly and wave conditions within the gulf. The annual mean significant wave height anomaly and annual mean wave direction anomaly for the integrated model both have significant negative correlations (R<-0.32) to SAM. The annual mean significant wave height correlation is stronger in the southern region (R<-0.5) of the gulf for integrated conditions, with the area of significant correlation extending further north for swell waves in particular. The annual mean wave direction correlation is generally stronger in the northern region for integrated conditions (R<-0.5), with the area of correlation spanning the entire gulf for the sea wave results. These correlations suggest SAM plays a significant role in annual swell direction and annual sea wave direction anomaly.
Southern Oscillation Index (SOI): No Significant correlations were found between the SOI annual anomaly and annual integrated significant wave height or annual integrated mean wave direction anomalies. An extent in the southern region of the gulf presents a correlation between annual swell wave direction anomaly and SOI annual anomaly, however no correlations were found between SOI anomaly and sea wave height parameters. This suggests that SOI only plays a minor role in influencing swell wave direction with no other significant teleconnections found at an annual scale.
Dipole Mode Index (DMI): A significant negative correlation (R<-0.32) was found between the annual anomaly in DMI and annual significant wave height anomaly in the southern region of the gulf. A small region on the eastern side of the gulf shows a significant correlation between annual anomaly in DMI and mean annual sea wave direction anomaly (R<-0.32). Given a significant correlation exists in the southern region between integrated wave height and DMI anomaly but not each partition individually, suggests that both partitions possess mild correlations which are insignificant at a 95% level but when integrated become significant. Mild correlations between annual DMI anomaly and annual wave parameter anomalies suggest that this climate mode influences swell wave heights in the southern region of the gulf and wave directions on the eastern side of the gulf.
3.3.2 Seasonal variations
Seasonal correlations between wave parameter anomalies and SAM anomalies are presented in Figure 10. The seasonal integrated conditions anomaly in significant wave height was found to have a significant negative correlation with SAM in winter (R<-0.4) and spring (R<-0.5) across most of the gulf. Both the sea and swell waves are affected by the SAM in the winter and spring season (R<-0.4). A smaller area of significant negative correlation was found across the southern region in summer (R<-0.32), which was affected just by the swell waves. The seasonal integrated (sea and swell) conditions anomaly in mean wave direction was found to have a significant negative correlation (R<-0.32) in summer and spring across much of the gulf with correlations as strong as R<-0.5. In smaller areas in the southern region of the gulf, these significant correlations (R<-0.5) also occur in winter. Significant negative correlations were found for the swell partition mean wave direction anomaly in summer (R<-0.5), spring (R<-0.4) and winter (R<-0.32) while significant negative correlations to the mean sea wave partition direction were found in summer (R<-0.32) and spring (R<-0.4) only. These correlations suggest that SAM has significant influence on wave conditions in GSV across all seasons except for Autumn.
Figure 10
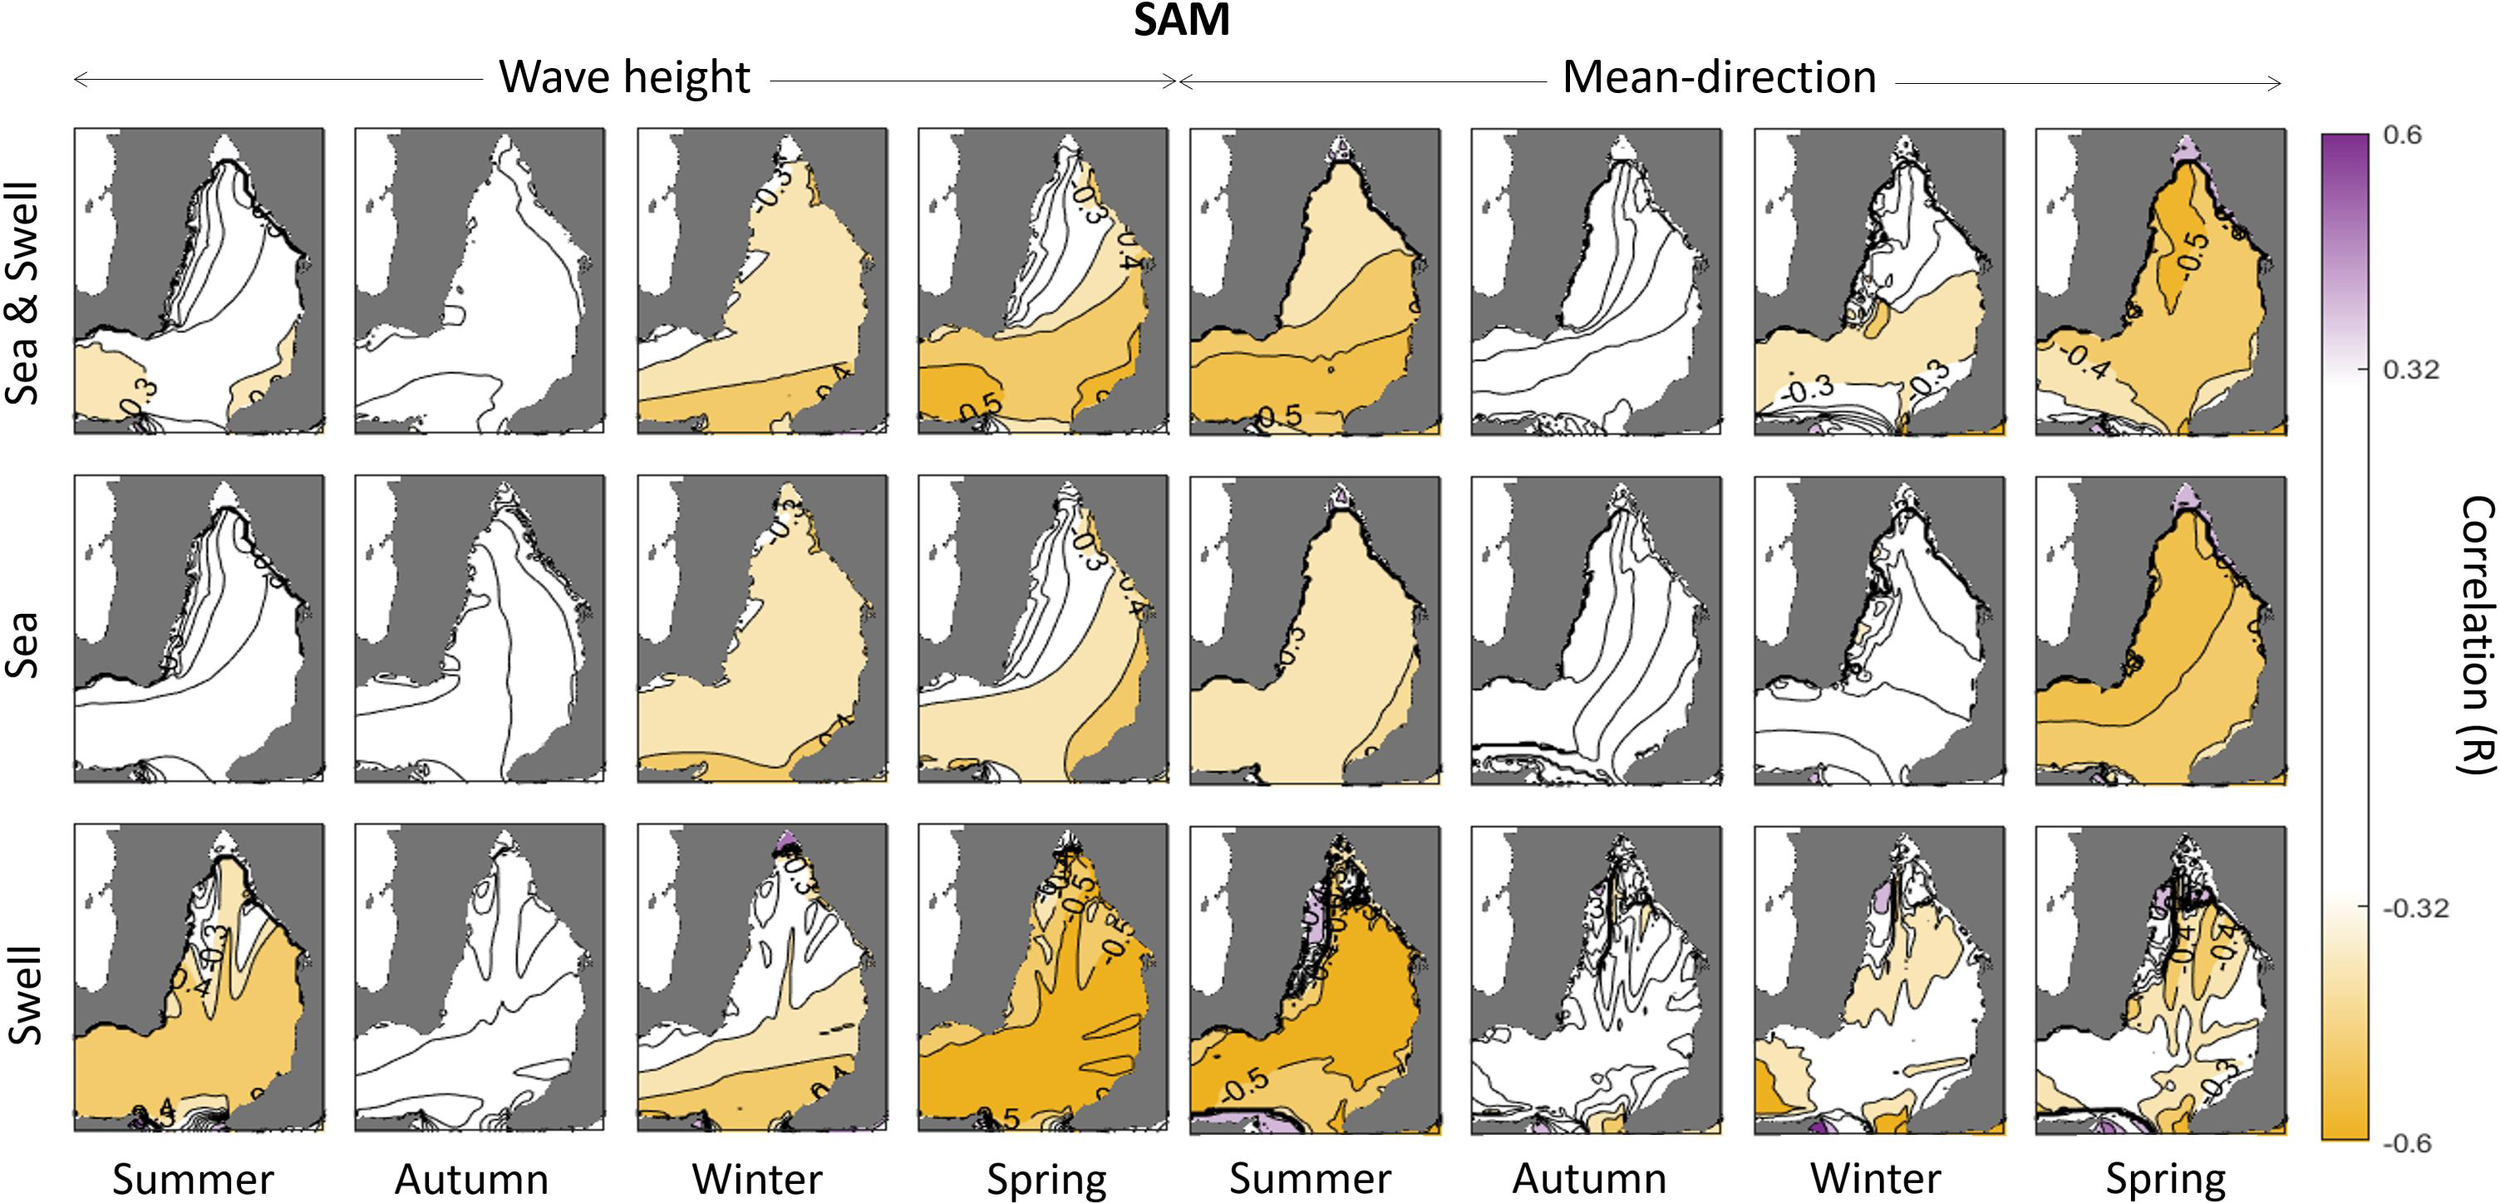
Correlation contour maps of seasonal modelled mean wave direction and height anomaly with seasonal anomalies of Southern Annular Mode Index for integrated conditions, sea waves only and swell waves only. Significant correlations occur when R>0.32 or R<-0.32.
Seasonal correlations between wave parameter anomalies and SOI anomalies are presented in Figure 11. A significant positive correlation was found between SOI and integrated significant wave height anomaly in the northern region of the gulf in winter (R>0.4). This winter correlation was found across the gulf in the sea wave partition (R>0.4) but was not present in the swell wave partition. A significant negative correlation is present for swell waves only during summer (Investigator Strait and western portion of GSV) and autumn in Investigator Strait. A significant negative correlation was found between SOI and integrated mean wave direction anomaly in the southern region of the gulf in summer (R<-0.4). This summer correlation was found across the gulf in the swell wave partition (R<-0.4) but was not present in the sea wave partition. Small areas within GSV show significant negative correlations during autumn and spring. These correlations suggest that SOI has very little influence wave conditions in Autumn and Spring, however it has been found to influence winter wave heights where sea waves are dominant and swell direction in the summer.
Figure 11
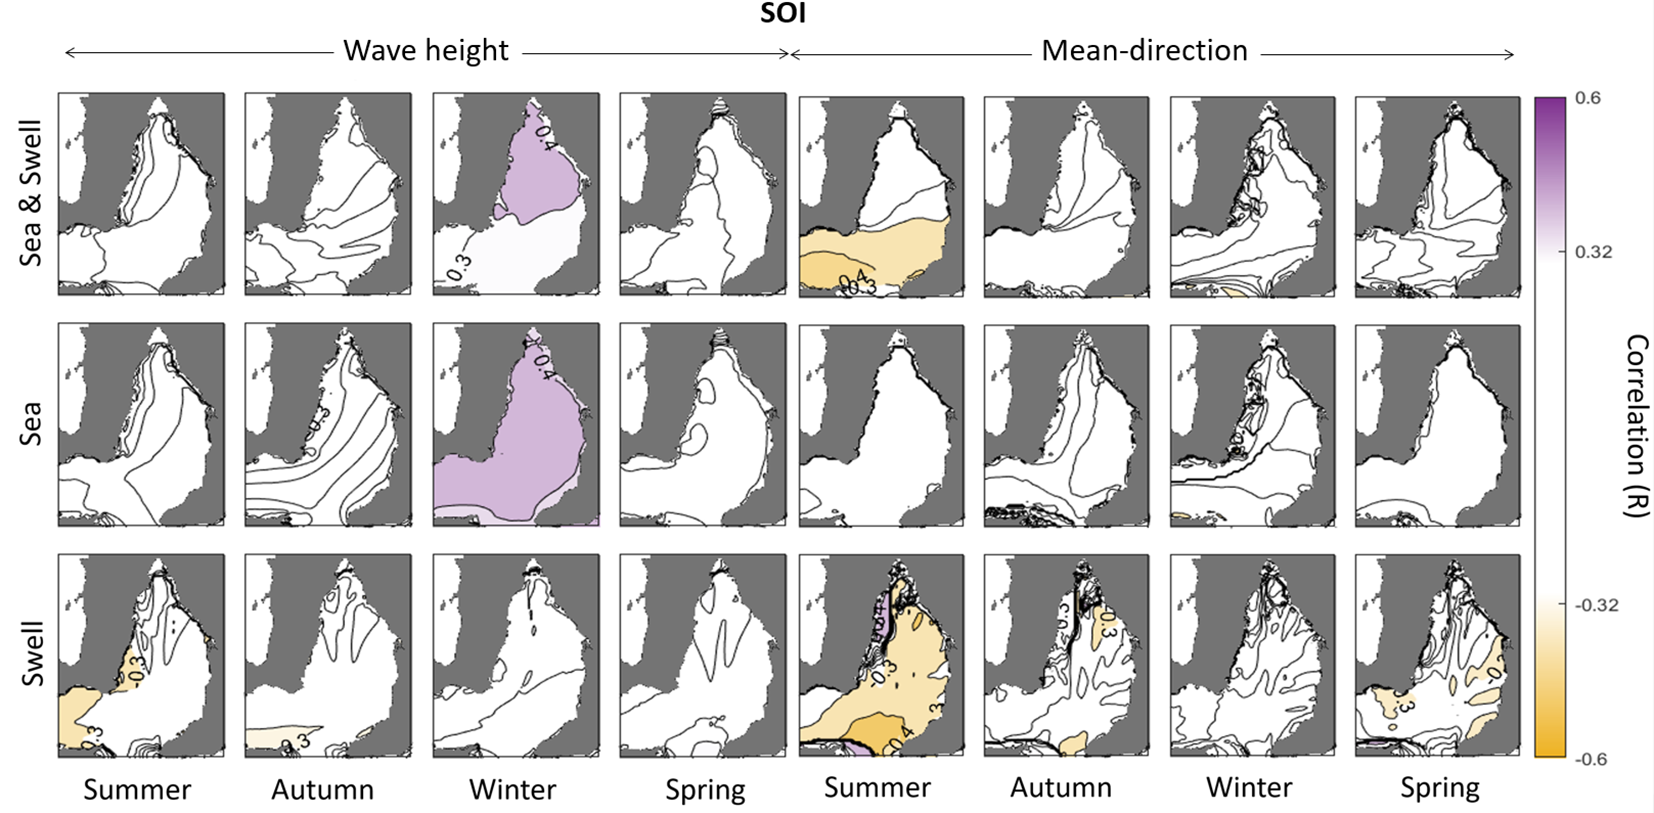
Correlation contour maps of seasonal modelled mean wave direction and height anomaly with seasonal anomalies of Southern Oscillation Index for integrated conditions, sea waves only and swell waves only. Significant correlations occur when R>0.32 or R<-0.32.
Seasonal correlations between wave parameter anomalies and DMI anomalies are presented in Figure 12. A significant correlation between DMI and significant wave height was found across the gulf particularly during winter (R<-0.4) but also during spring (R<-0.32), for both swell wave and sea wave partition anomalies. For mean direction seasonal anomalies, a significant negative correlation was found particularly in spring for sea wave conditions (R<-0.4) and the swell partition has some spatially sporadic correlation (R<-0.32) in winter and in autumn to a lesser spatial extent. These correlations suggest that DMI has a significant influence on wave conditions across the gulf in winter and spring but not in summer or autumn.
Figure 12
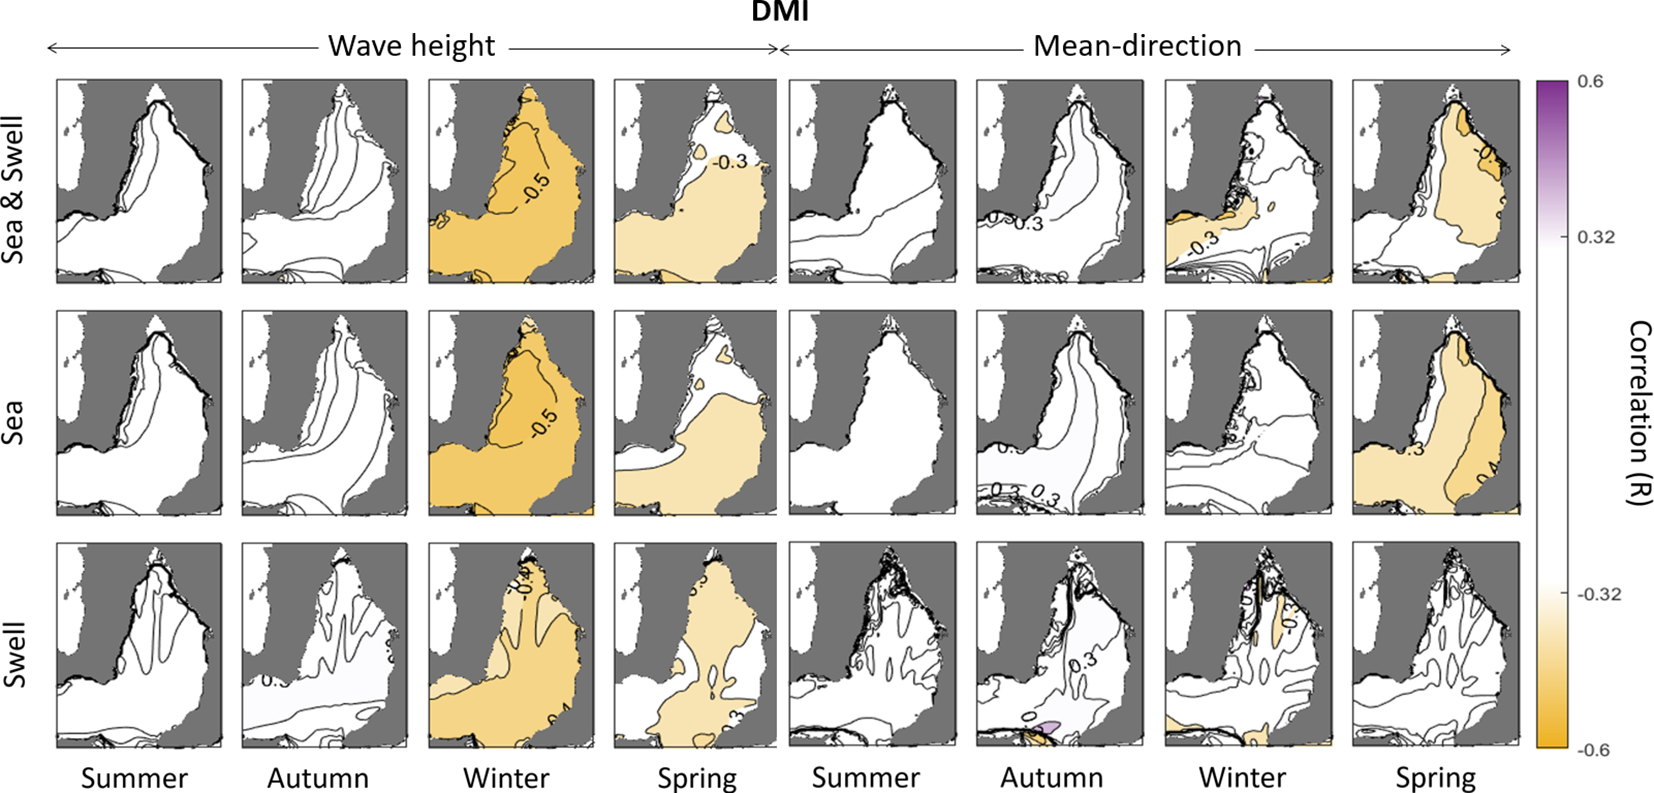
Correlation contour maps of seasonal modelled mean wave direction and height anomaly with seasonal anomalies of Dipole Mode Index for integrated conditions, sea waves only and swell waves only. Significant correlations occur when R>0.32 or R<-0.32.
4 Discussion
This study advances the understanding of bimodal wave climates at GSV through the development of a 40-year wave hindcast that captures medium term fluctuations which have been compared to various climate modes relevant to the region. The hindcast was developed to assess and compare sea waves, swell waves, and integrated conditions in GSV. The integrated conditions model was used for validation with measured integrated wave parameters buoy data over a one-month period. There was generally good agreement between measured and simulated wave conditions used for analysis in this study. There were strong significant wave height correlations of R=0.88 (Semaphore) and R=0.89 (Brighton), however the model was shown to overpredict wave heights with a bias of 0.14m (Semaphore) and 0.18m (Brighton). The agreement between modelled and measured mean direction was reasonable with correlations of R=0.70 (Semaphore) and R=0.8 (Brighton), however there was high RMSE values of 48 degrees (Semaphore) and 37 degrees (Brighton). The over prediction of wave height and wave direction error should be considered if assessing design wave conditions in GSV, however the model is appropriate for wave climate characterization as done in this study. In addition, the differentiation of wave directions from a bimodal wave climate is difficult for wave buoys to accurately capture.
Uniform wind was used as variations in the global model are not expected to significantly improve the representation of local conditions within the gulf. Resolution of Era5 outputs is 0.25° (~23km) and the width of the gulf is ~65km so the model will struggle to represent the nuances of local conditions. A possible avenue for improvement of this model could include a spatially variable wind input through the development of a local wind model, capable of capturing coastal breezes, blocking of winds, tunneling and convective processes. In addition, the computational timestep could be decreased and wind could be introduced in non-stationary mode, though this would come at significant computational cost. Limitations of boundary conditions used in this study should also be considered. Though outside the scope of this investigation, wave energy at the boundary could be corrected based on satellite altimeter data using the methodology suggested by Albuquerque et al. (2018). This correction could improve confidence in wave energy inputs, however uncertainties would remain in the wave direction and period which are not corrected by this approach. Limitations to the methodology used to introduce swell and sea waves should also be considered if the magnitude of these wave types is of interest. Given swell and sea waves were modelled using independent model simulations (as opposed to partitioned outputs of a single simulation) there is potential for differences in the energy of bulk conditions when compared to the summation of sea and swell. Any over or underestimates in wave energy from this limitation are likely minor and do not impact the conclusions of this study. An additional limitation to be considered in model applicability is the representation of tidal levels which were applied uniformly across the model. Kämpf (2014), found that tidal levels at the north of the gulf have an increased range of 4m when compared to the 3m tidal range at the entrance to the gulf. This is unlikely to significantly impact the investigation into climate driver correlations, however it should be considered if assessing nearshore wave conditions in the northern region of the gulf.
The results indicate that the wave climate on the eastern side of the gulf, adjacent to Adelaide’s metropolitan beaches is impacted by both local sea waves and swell waves. This impact is nuanced, with the peak partition of the wave spectrum varying spatially and temporally which indicates bimodal peak conditions along the coast. This bimodal wave climate is a result of the unidirectional swell waves which propagate through Investigator Strait from the southwest and local sea waves generated by winds within the gulf. These modes are evident in Figure 5 (panel E) in which Hs and Tp model results extracted from the nearshore on the eastern side of the gulf show two clear wave climate modes of longer period (>10 seconds) with Hs between 0-1.2m and shorter period (<8 seconds) with Hs between 0-2.7m. Figure 13 further highlights the bimodal conditions present in the gulf. Panel A shows the percentage of time swell wave Hs exceeds sea wave Hs. This varies spatially across the gulf from approximately 50% swell dominance in the south, decreasing to less that 10% swell dominance in the north of the gulf. This highlights the spatial gradient of swell impact from south to north where there is a decreasing presence of swell waves. Panel B provides an example of the bimodal sea state adjacent to Adelaide’s managed beaches at a single timestep of the model. The southwesterly swell partition of the wave spectrum has peak energy for the southern stretch of Adelaide’s metropolitan beaches while the locally generated northwesterly waves have peak energy for the northern stretch of beaches.
Figure 13
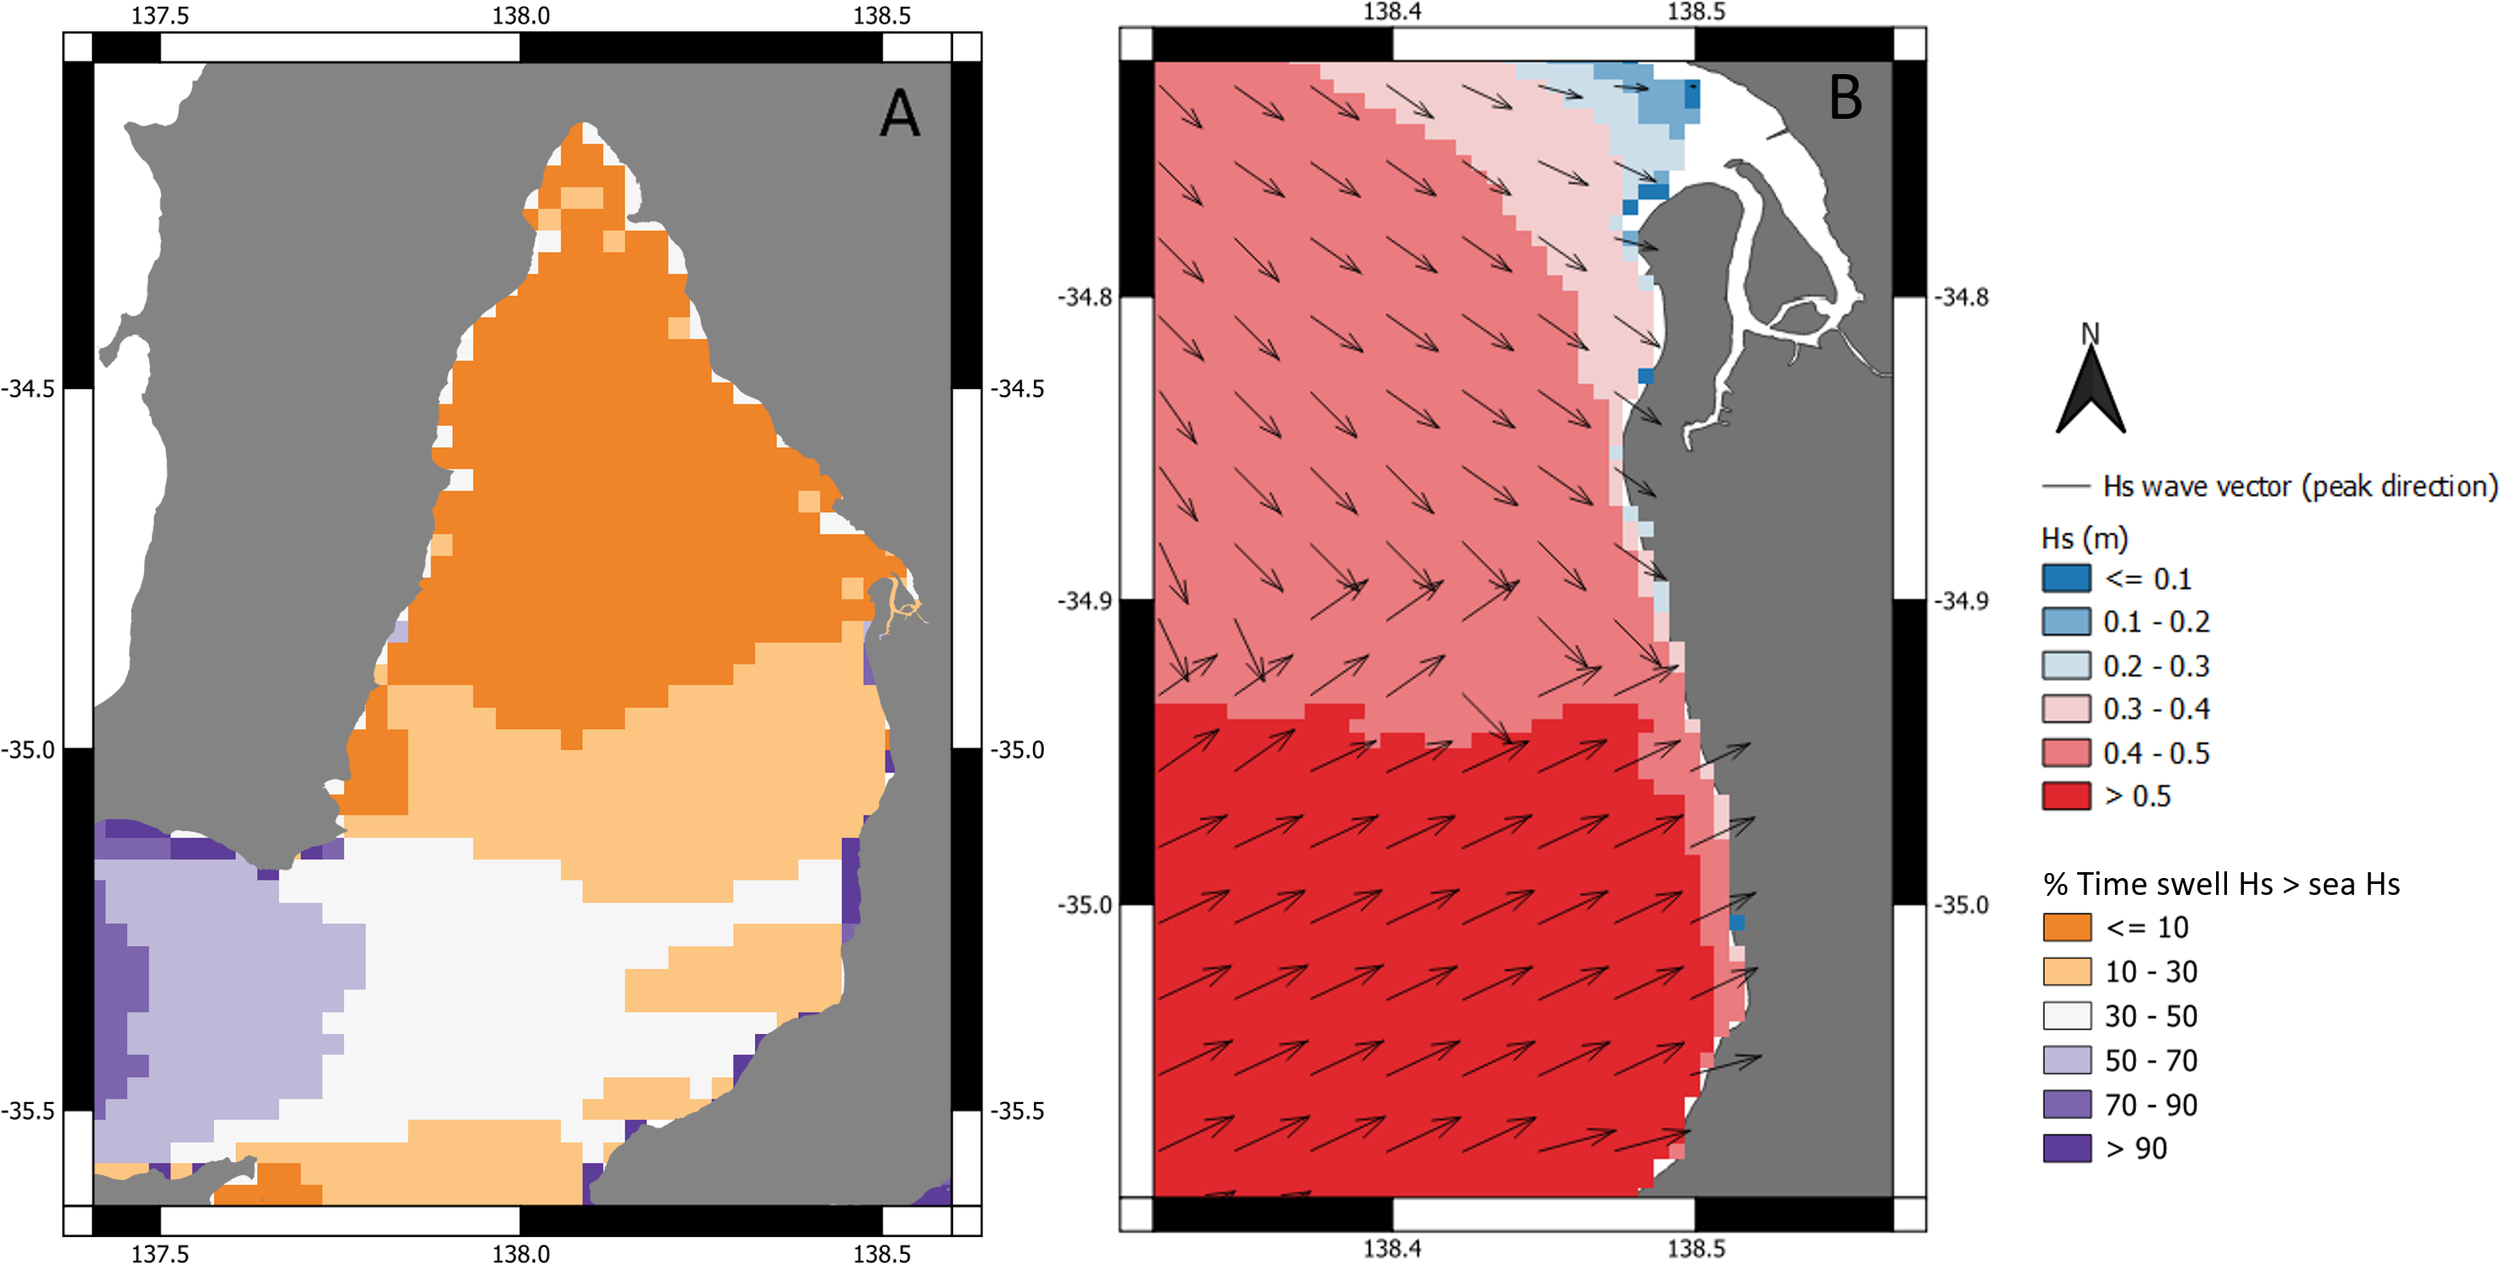
Bimodal integrated wave conditions from modelled wave hindcast. (A) displayed the percentage of time swell Hs is greater than sea Hs. (B) shows bimodal waves impacting Adelaide metropolitan coastline on December 20, 2019 – arrow vectors show peak wave direction and significant wave height magnitude.
The study of each spectral mode is important to the understanding of longshore sediment transport along Adelaide’s managed beaches which lie on the eastern side of GSV and are subject to the bimodal wave climate. The net observed littoral drift of this coastline occurs from south to north (Huiban et al., 2019) driven by the southwesterly components of the swell and sea waves, while transport from north to south can be contributed only from the northerly component of the sea waves. This means that for Adelaide’s managed beaches, an increase in wave direction or a decrease in Hs of swell SW waves may lead to a decrease in net south to north transport. In addition, the complex bimodal climate, often with waves from two sides at the same moment in time, will make it a challenge to assess the precise sediment transports in the region. This may even lead to opposite longshore transports at different depths driven by either the western swell or northeasterly wind sea conditions. The bimodality of the climate needs to be accounted for in morphological assessments in the region.
Significant correlations between both significant wave height and mean direction and the SAM index and SOI were observed for the GSV, which is similar to other studies in the southern region of Australia’s coast (Hemer et al., 2010; Reguero et al., 2015). In addition, correlations were found to DMI within the gulf. It is noted that these anomalies are of particular significance for the Adelaide metropolitan coastline, due to the relative magnitude of the anomalies and their impact on sediment transport.
The impact of the anomalies was found to vary over the seasons. Given the prevalence of the swell waves in the southern region of the gulf (see Figure 3), it was expected that stronger correlations in the southern region of the gulf may be related to the anomalies driving these swell waves, while stronger correlations in the northern region may be due to anomalies related to the sea waves. This was confirmed across several examples by analysing these modes separately, for instance the integrated condition correlations to SAM index, where there was a strong correlation in the southern region for Hs and a strong correlation in the northern region for mean direction. As expected, there is a significant negative correlation between the SAM anomaly and swell partition annual significant wave height anomaly as well as the sea wave partition annual mean wave direction anomaly (see Figures 9, 10).
The obtained understanding of the relationship between climate indices and key wave parameters in this study helps to give a sense of how the wave climate may fluctuate in the medium to long term. Forecasted climatic indices can, for example, be used to predict the anomalies at a monthly to seasonal timescale in the GSV. In addition, it will be possible to obtain insight into the long-term changes to the wave climate on the basis of the known trends in some climate indices (see Figure 14), which is relevant for climate adaptation of Adelaide’s coast. The long-term changes of SAM, SOI and IOD will impact the future wave climate of GSV, however, in different ways.
Figure 14
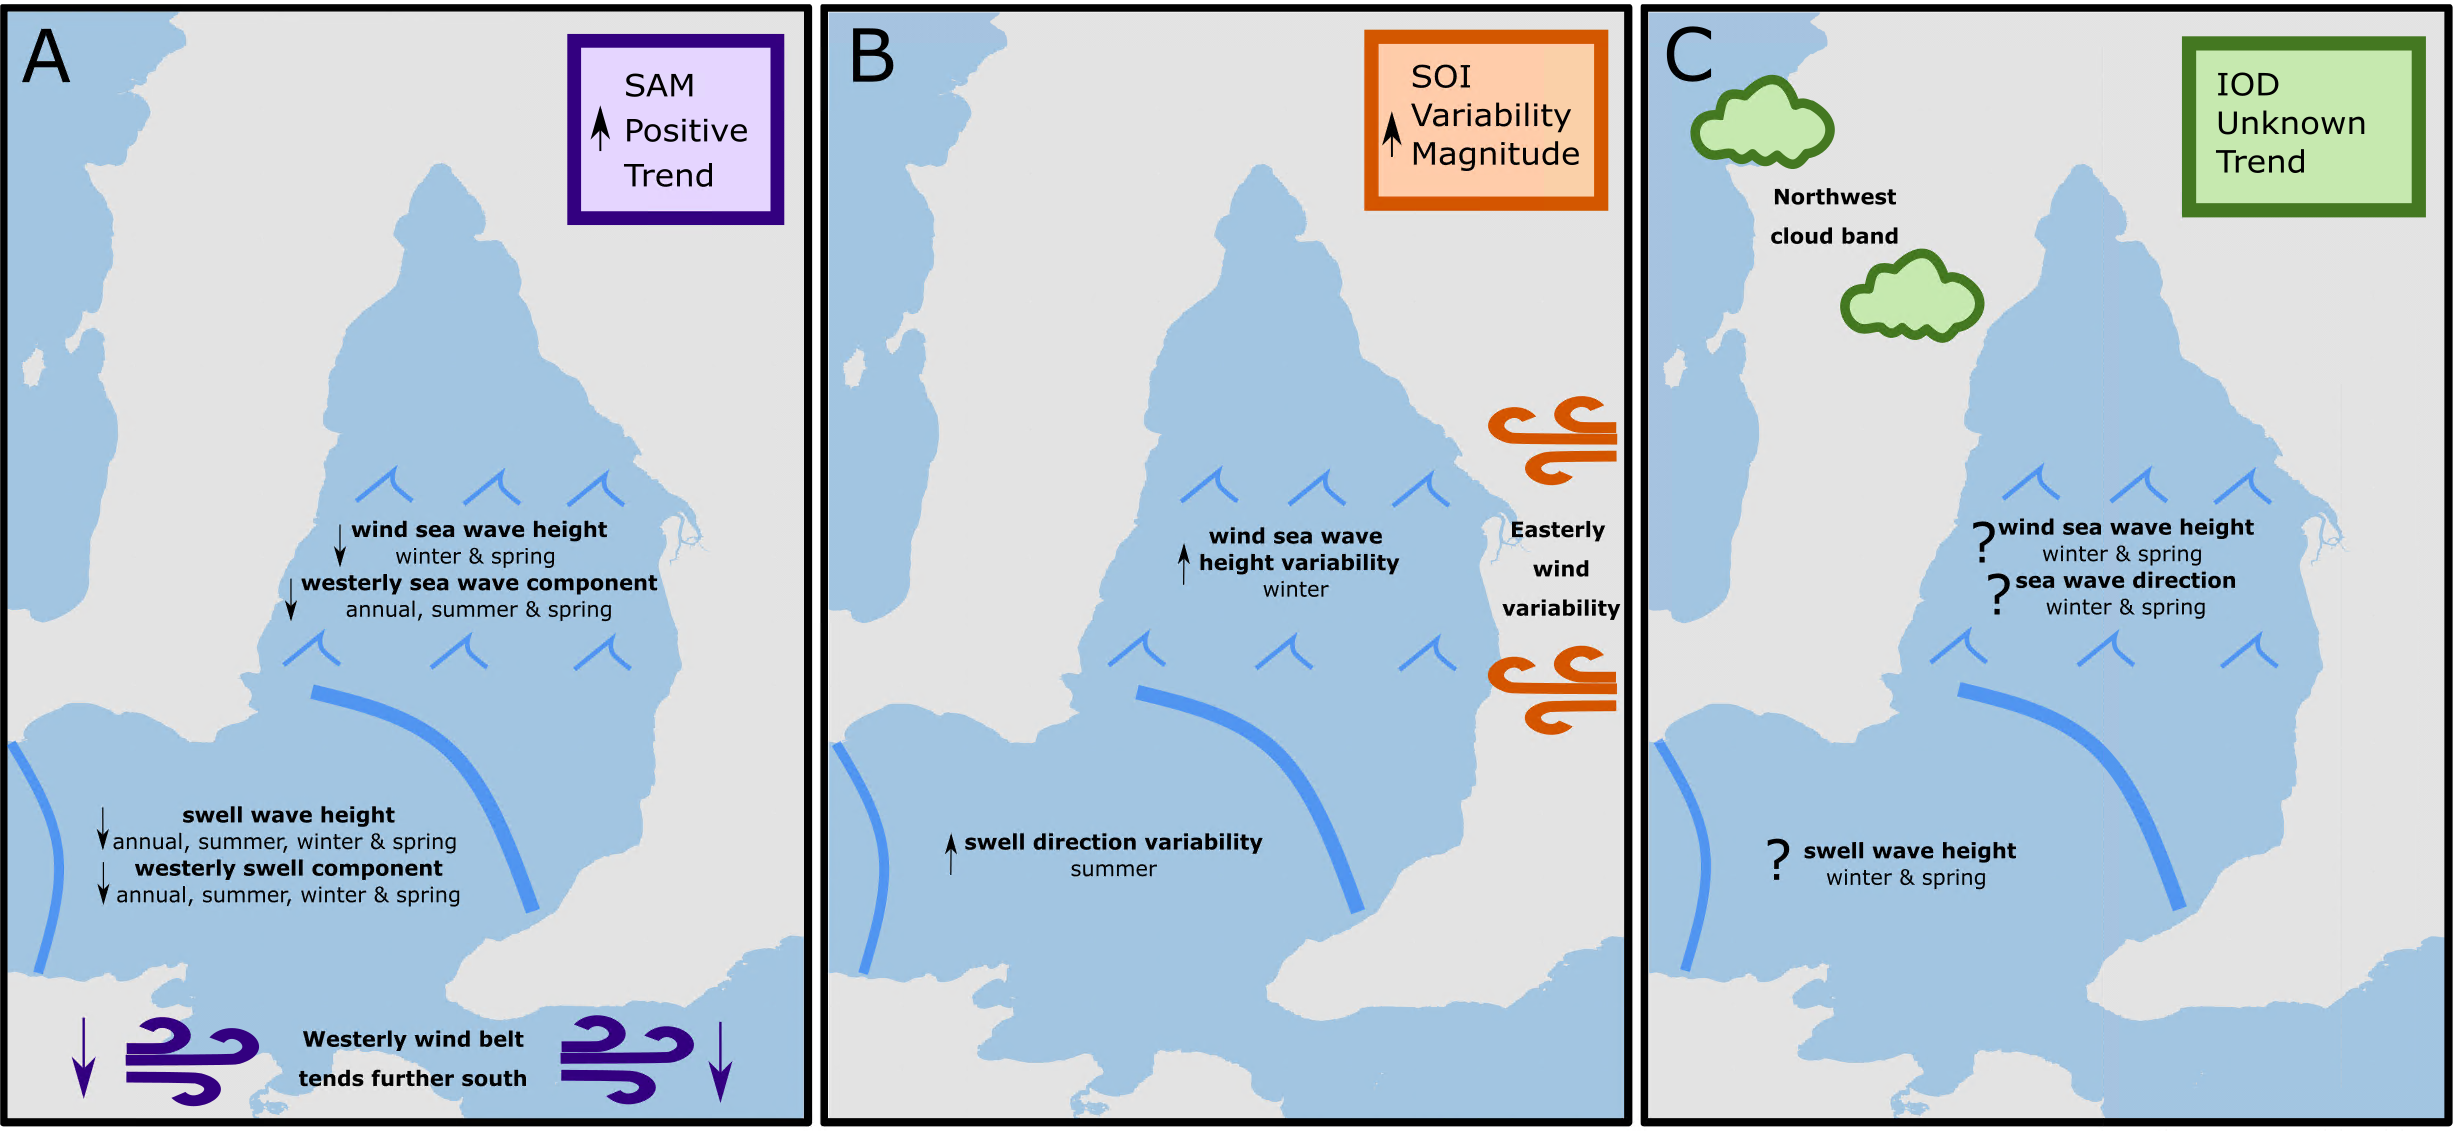
Future impacts of climate drivers that influence the wave climate in Gulf St Vincent – (A–C) show projected changes to SAM, SOI and IOD respectively (as per (Miller et al., 2006; Cai et al., 2021a, Cai et al., 2021b).
When SAM is positive, a belt of westerly winds moves closer to Antarctica, but when SAM is negative the belt of westerly winds moves closer to the southern regions of Australia (Swart et al., 2015). The impact of this shift in westerly winds on southern ocean waves has been documented by Hemer et al. (2010). This study has confirmed that relationships are also found within GSV. When the westerly winds tend closer to Australia (negative SAM) the results of this study show that this correlates to an annual and seasonal (summer, winter and spring) increase of significant wave height and an increase in wave direction. Given the dominant wave direction is from the southwest, this indicates waves tend more westerly with negative SAM. The nuances of the impact of SAM on the swell and sea waves within GSV can largely be attributed to the orientation of the gulf. Swell waves enter the gulf through Investigator Strait which is bound by the Yorke Peninsula to its north and Kangaroo Island to its south. This means that swell waves from a westerly direction enter the gulf less obstructed by Kangaroo Island and maintain their energy leading to increased wave heights in the gulf. The impact of the westerly wind belt controlled by SAM on sea waves within the gulf is more direct. Correlations of SAM anomaly with sea wave direction are prevalent across the gulf in summer and spring, while correlations with wave height are more prevalent of the eastern side of the gulf in winter and spring. The reason for this prevalence of wave height correlation on the eastern side of the gulf is likely the exposure to a longer fetch extending through Investigator Strait which allows for increased wind wave generation when westerly winds are more prevalent.
SAM has had a positive trend over the past 50 years, though forecasting it into the future is difficult due to the lack of understanding of the contributions of greenhouse gas increases, which would promote positive trends, while ozone recovery (greenhouse gas decrease) would promote negative trends (Fogt and Marshall, 2020). Studies of SAM which include ozone recovery have projected a range of scenarios from insignificantly negative trends (Arblaster et al., 2011; Polvani et al., 2011) to significantly positive (Miller et al., 2006). If the SAM continues a positive trend, the correlations to wave conditions in this study suggest that mean swell wave height will decrease in summer, winter, spring and annually whilst sea wave heights will decrease in winter and spring. The westerly component of swell waves would decrease in summer, winter, spring and annually whilst the westerly component of the sea waves will decrease in summer, spring and annually.
The SOI phases impact weather patterns in southern Australia with stronger La Niña phases leading to increased easterly winds and the westerly wind belt below Australia moving further south. Hemer et al. (2010), found a significant negative correlation between the SOI and winter significant wave height offshore of south Australia towards the south east. This correlation with offshore swell waves was not found to translate to swell waves within the gulf. Instead, significant correlations with SOI within the gulf were found for summer swell direction and winter sea wave height. The correlation between positive SOI (linked to La Niña) and positive anomaly in winter sea wave height across the gulf suggest an increase in wind stress. Though relationships between GSV wind anomalies and SOI have not been specifically investigated in literature, there has been studies that link La Niña periods to increased storminess across southern Australia (Ashok et al., 2007).
The SOI is predicted to show an increase in variability and magnitude associated to greenhouse warming (Cai et al., 2021a). This means there will likely be stronger El Niño and La Niña phases in the future. Given the correlations between wave conditions in GSV and the SOI, an increase in stronger La Niña events would lead to increases in extreme winters with increased wave heights, conversely stronger El Niño winters would lead to decreased mean wave height across the season. Correlations also suggest that stronger SOI fluctuations would also lead to an increase in swell direction variability between summer seasons.
The IOD impacts weather patterns in southern Australia in its negative phase when a cloud band extends from northwest Australia (Cai et al., 2011b). Ummenhofer et al. (2011) reports that IOD impacts rainfall across the western and southern regions of Australia during winter and spring. This seasonal phase lock was also found in this study where significant negative correlations with sea and swell wave conditions were identified in winter and spring. This suggests that the northwest cloud band associated to the IOD impact wave conditions in the gulf. This influence may arise from heightened wind strength during cloudier conditions, driven by increased pressure gradients.
The IOD is also expected to be influenced by the effects greenhouse gas emissions with the climate of the Indian Ocean projected to change significantly (Cai et al., 2013). The projected response of the IOD and associated DMI is a decrease in moderate positive events but an increase in the number of stronger positive events (Cai et al., 2011b). Though this trend has been identified for positive events, it largely remains unknown how negative IOD events will change or trend in the future (Rutlidge et al., 2023).
When considering the combined future effects of the drivers of seasonal to interannual fluctuations in GSV, it is important to consider underlying long term changes due to climate change. Reguero et al. (2019) investigated the impact of oceanic warming on global wave power and found a significant positive correlation in the Southern Ocean suggesting that wave power will increase as oceans warm which has also been reported by Young and Ribal (2019) who found that increases in mean wind speed and significant wave height over the past 33 years. This will have an impact on GSV, largely through an increase in swell energy from the Southern Ocean. This impact will have a contrasting effect on swell to the predicted decline in swell energy entering GSV due to a positive trending SAM. The contrasting and nuanced impacts of the seasonal to interannual fluctuations discussed in this study with interdecadal trends are critical to future wave climate forecasting. The results of this study highlight the importance of understanding downscaled impacts to more complex areas such as semi exposed gulfs where the application of offshore trends may not apply directly to the local area of concern.
The seasonal to interannual effects of climate drivers discussed in this paper are important to the future management of the coasts of the GSV. Of particular importance for GSV is identifying the combination of increased wave height and increased southerly component of the wave direction which leads to increased south to north sediment transport along the eastern side of the Gulf. Adelaide’s managed beaches require sand nourishments to maintain beach widths of southern beaches, and especially these south to north transports are responsible for the local sediment deficits.
The methodology used in this study to derive these regional correlations between large scale climate drivers and local wave conditions is expected to be applicable for semi-enclosed basins around the world. In these locations where swell waves only form part of the wave climate, it is crucial to consider the drivers for local sea waves to understand the drivers for conditions within the basin. It is expected that by understanding the nuances of the wave climates in these basins, coastal managers will be able to pre-emptively assess the possible severity of upcoming seasons on the coastal environment due to waves.
5 Conclusions
The factors that influence the seasonal to interannual timescale behavior of bimodal wave climates for semi-enclosed bays are better understood as a result of the comparison of modelled waves (over 40-years) with climate modes for the Gulf St Vincent, South Australia.
The eastern side of the gulf is influenced by a bimodal wave climate consisting of unidirectional swell waves from the southwest and sea waves generated within the gulf. The dominance of either the sea and swell climate varies spatially and temporally, which is of particular relevance for the coastal sediment transports and beach stability at Adelaide. The 3-month-averaged significant wave height and mean wave direction showed seasonal variations of up to 30% and ±20 degrees respectively. These seasonal anomalies of wave height and mean direction are significantly correlated (R>0.32 or R<-0.32) with the SAM index, SOI and DMI. SAM was found to have the strongest correlations with both wave parameters, especially having significant correlation with the swell wave height and sea wave direction.
The study highlights the benefits of considering modes of a bimodal wave climate separately when analysing wave parameter anomalies and their correlation to climate indices. It is predicted SAM, SOI and DMI will all be influenced by greenhouse gas emissions in the future so an understanding of how these projections relate to each mode of the wave climate is useful to give indications of how related coastal hazards may vary in the future. It is expected that the Southern Annular Mode will trend positively, resulting in a decrease in wave height and the westerly component of waves in the Gulf. Moreover, projections suggest that the Southern Oscillation Index will become more variable in the future, leading to more extreme winter and spring wave conditions in the gulf. The impact of greenhouse gas emissions on future trends of negative IOD events remains understudied, improved understanding would provide insight into future trends of winter and spring wave conditions in Gulf St Vincent. Understanding how these climate drivers impact the bimodal wave climate in the gulf will allow coastal managers to pre-emptively prepare appropriate management of a coast at a seasonal to annual timescale.
Statements
Data availability statement
The raw data supporting the conclusions of this article will be made available by the authors, without undue reservation.
Author contributions
BP: Conceptualization, Data curation, Formal analysis, Funding acquisition, Investigation, Methodology, Software, Validation, Visualization, Writing – original draft, Writing – review & editing. BH: Conceptualization, Methodology, Supervision, Writing – review & editing. JA: Conceptualization, Methodology, Supervision, Writing – review & editing. PH: Supervision, Funding acquisition, Writing – review & editing. GM: Conceptualization, Project administration, Supervision, Funding acquisition, Writing – review & editing.
Funding
The author(s) declare financial support was received for the research, authorship, and/or publication of this article. This research has been joint funded by the Coast Protection Board of South Australia and Flinders University.
Acknowledgments
The authors thank Murray Townsend, Jason Quinn and Anthony Virag from the Department for Environment and Water in South Australia for supplying data and background information for the project. We thank Flinders University and the South Australian Research and Development Institute (SARDI) for access to measured wave data used in the project. The data from these buoys is open source and publicly available at www.sawaves.org. We would also like to thank Flinders University for access to the DeepThought HPC (Flinders University, 2021) and Scott Anderson for technical support related to high performance computing.
Conflict of interest
The authors declare that the research was conducted in the absence of any commercial or financial relationships that could be construed as a potential conflict of interest.
Publisher’s note
All claims expressed in this article are solely those of the authors and do not necessarily represent those of their affiliated organizations, or those of the publisher, the editors and the reviewers. Any product that may be evaluated in this article, or claim that may be made by its manufacturer, is not guaranteed or endorsed by the publisher.
References
1
Albuquerque J. Antolínez J. A. A. Gorman R. M. Méndez F. J. Coco G. (2021). Seas and swells throughout New Zealand: A new partitioned hindcast. Ocean Model.168, 101897. doi: 10.1016/j.ocemod.2021.101897
2
Albuquerque J. Antolínez J. A. A. Rueda A. Méndez F. J. Coco G. (2018). Directional correction of modeled sea and swell wave heights using satellite altimeter data. Ocean Model.131, 103–114. doi: 10.1016/j.ocemod.2018.09.001
3
Antolínez J. A. A. Murray A. B. Méndez F. J. Moore L. J. Farley G. Wood J. (2018). Downscaling changing coastlines in a changing climate: the hybrid approach. J. Geophysical Research: Earth Surface123, 229–251. doi: 10.1002/2017JF004367
4
Arblaster J. M. Meehl G. A. Karoly D. J. (2011). Future climate change in the Southern Hemisphere: Competing effects of ozone and greenhouse gases. Geophysical Res. Lett.38, n/a–n/a. doi: 10.1029/2010GL045384
5
Ashok K. Nakamura H. Yamagata T. (2007). Impacts of ENSO and Indian Ocean dipole events on the Southern hemisphere storm-track activity during Austral Winter. J. Climate20, 3147–3163. doi: 10.1175/JCLI4155.1
6
Ashton A. Murray A. B. Arnoult O. (2001). Formation of coastline features by large-scale instabilities induced by high-angle waves. Nature414, 296–300. doi: 10.1038/35104541
7
Barnard P. L. Short A. D. Harley M. D. Splinter K. D. Vitousek S. Turner I. L. et al . (2015). Coastal vulnerability across the Pacific dominated by El Niño/Southern Oscillation. Nat. Geosci.8, 801–807. doi: 10.1038/ngeo2539
8
Battjes J. A. Stive M. J. F. (1985). Calibration and verification of a dissipation model for random breaking waves. J. Geophysical Res.90, 9159. doi: 10.1029/JC090iC05p09159
9
Booij N. Holthuijsen L. H. Ris R. C. (1996). THE “SWAN” WAVE MODEL FOR SHALLOW WATER. Coast. Eng. Proc.1, 668–676. doi: 10.9753/icce.v25.%p
10
Cai W. Santoso A. Collins M. Dewitte B. Karamperidou C. Kug J.-S. et al . (2021a). Changing El Niño–Southern Oscillation in a warming climate. Nat. Rev. Earth Environ.2, 628–644. doi: 10.1038/s43017-021-00199-z
11
Cai W. Sullivan A. Cowan T. (2011a). Interactions of ENSO, the IOD, and the SAM in CMIP3 models. J. Climate24, 1688–1704. doi: 10.1175/2010JCLI3744.1
12
Cai W. Van Rensch P. Cowan T. Hendon H. H. (2011b). Teleconnection pathways of ENSO and the IOD and the mechanisms for impacts on Australian rainfall. J. Climate24, 3910–3923. doi: 10.1175/2011JCLI4129.1
13
Cai W. Yang K. Wu L. Huang G. Santoso A. Ng B. et al . (2021b). Opposite response of strong and moderate positive Indian Ocean Dipole to global warming. Nat. Climate Change11, 27–32. doi: 10.1038/s41558-020-00943-1
14
Cai W. Zheng X.-T. Weller E. Collins M. Cowan T. Lengaigne M. et al . (2013). Projected response of the Indian Ocean Dipole to greenhouse warming. Nat. Geosci.6, 999–1007. doi: 10.1038/ngeo2009
15
Elshinnawy A. I. Antolínez J.A.Á. (2023). A changing wave climate in the Mediterranean Sea during 58-years using UERRA-MESCAN-SURFEX high-resolution wind fields. Ocean Eng.271, 113689. doi: 10.1016/j.oceaneng.2023.113689
16
Flinders University (2021). Deep thought (HPC) (Adelaide: Flinders University). doi: 10.25957/FLINDERS.HPC.DEEPTHOUGHT
17
Fogt R. L. Marshall G. J. (2020). The Southern Annular Mode: Variability, trends, and climate impacts across the Southern Hemisphere. WIREs Climate Change11. doi: 10.1002/wcc.652
18
Geoscience Australia (2009). Australian bathymetry and topography grid, June 2009 (Commonwealth of Australia: Geoscience Australia).
19
Hasselmann K. Barnett T. Bouws E. Carlson H. Cartwright D. Enke K. et al . (1973). Measurements of wind-wave growth and swell decay during the Joint North Sea Wave Project (JONSWAP). Deut. Hydrogr. Z.8, 1–95. doi: 10.1017/s0022112091000848
20
He X. Guan H. (2013). Multiresolution analysis of precipitation teleconnections with large-scale climate signals: A case study in South Australia. Water Resour. Res.49, 6995–7008. doi: 10.1002/wrcr.20560
21
Hegermiller C. A. Rueda A. Erikson L. H. Barnard P. L. Antolinez J. A. A. Mendez F. J. (2017). Controls of multimodal wave conditions in a complex coastal setting. Geophysical Res. Lett.44, 12,315-12,323. doi: 10.1002/2017GL075272
22
Hemer M. A. Church J. A. Hunter J. R. (2007). Waves and climate change on the Australian coast. J. Coast. Res.SI 50, 432–437. doi: 10.2112/JCR-SI50-083.1
23
Hemer M. A. Church J. A. Hunter J. R. (2010). Variability and trends in the directional wave climate of the Southern Hemisphere. Int. J. Climatology30, 475–491. doi: 10.1002/joc.1900
24
Hersbach H. Bell B. Berrisford P. Hirahara S. Horányi A. Muñoz-Sabater J. et al . (2020). The ERA5 global reanalysis. Q. J. R. Meteorological Soc.146, 1999–2049. doi: 10.1002/qj.3803
25
Huiban M. Womersley T. Kaergaard K. Townsend M. (2019). “A multidecadal analysis of the Adelaide metropolitan littoral sediment cell derived from shoreline profile measurements,” in Australasian Coasts and Ports 2019 Conference: Future directions from 40 [degrees] S and beyond, Hobart10-13 September 2019. (Hobart: Engineers Australia) 624 - 629.
26
Kämpf J. (2014). “South Australia’s large inverse estuaries: on the road to ruin,” in Estuaries of the World (Dordrecht: Springer Netherlands), 153–166. doi: 10.1007/978-94-007-7019-5_9
27
Kamruzzaman M. Metcalfe A. Beecham S. (2020). Modelling spatial and temporal rainfall and their relationship to climatic indicators in South Australia. Theor. Appl. Climatology142, 543–553. doi: 10.1007/s00704-020-03314-0
28
Marshall A. G. Hemer M. A. Hendon H. H. Mcinnes K. L. (2018). Southern annular mode impacts on global ocean surface waves. Ocean Model.129, 58–74. doi: 10.1016/j.ocemod.2018.07.007
29
Marshall G. J. (2003). Trends in the Southern annular mode from observations and reanalyses. J. Climate. 16, 4134–4143. doi: 10.21203/rs.3.rs-2755505/v2
30
McPhaden M. J. Zebiak S. E. Glantz M. et al . (2006). ENSO as an integrating concept in Earth science. 314, 1740–1745. doi: 10.1126/science.1132588
31
Méndez J. Rueda A. (2020). “3 - Wave climates: deep water to shoaling zone,” in Sandy Beach Morphodynamics. Eds. JacksonD. W. T.ShortA. D. (Amsterdam: Elsevier), 39–59. doi: 10.1016/B978-0-08-102927-5.00003-5
32
Miller R. L. Schmidt G. A. Shindell D. T. (2006). Forced annular variations in the 20th century Intergovernmental Panel on Climate Change Fourth Assessment Report models. J. Geophysical Res.111. doi: 10.1029/2005JD006323
33
Odériz I. Silva R. Mortlock T. R. Mori N. (2020). El niño-southern oscillation impacts on global wave climate and potential coastal hazards. J. Geophysical Research: Oceans125. doi: 10.1029/2020jc016464
34
Pazandeh Masouleh Z. Walker D. J. Crowther J. M. (2016). Sea breeze characteristics on two sides of a shallow gulf: study of the Gulf St Vincent in South Australia. Meteorological Appl.23, 222–229. doi: 10.1002/met.1547
35
Polvani L. M. Previdi M. Deser C. (2011). Large cancellation, due to ozone recovery, of future Southern Hemisphere atmospheric circulation trends. Geophysical Res. Lett.38, n/a–n/a. doi: 10.1029/2011GL046712
36
Ranasinghe R. Callaghan D. P. Li F. Wainwright D. J. Duong T. M. (2023). Assessing coastline recession for adaptation planning: sea level rise versus storm erosion. Sci. Rep.13. doi: 10.1038/s41598-023-35523-8
37
Reguero B. G. Losada I. J. Méndez F. J. (2015). A global wave power resource and its seasonal, interannual and long-term variability. Appl. Energy148, 366–380. doi: 10.1016/j.apenergy.2015.03.114
38
Reguero B. G. Losada I. J. Méndez F. J. (2019). A recent increase in global wave power as a consequence of oceanic warming. Nat. Commun.10. doi: 10.1038/s41467-018-08066-0
39
Rutlidge H. Taschetto A. Andersen M. Baker A. (2023). Negative Indian Ocean dipole drives groundwater recharge in southeast Australia. Res. Square. doi: 10.21203/rs.3.rs-2755505/v2
40
Semedo A. Vettor R. Breivik Ø. Sterl A. Reistad M. Soares C. G. et al . (2015). The wind sea and swell waves climate in the Nordic seas. Ocean Dynamics65, 223–240. doi: 10.1007/s10236-014-0788-4
41
Short A. D. (2020). “South Australian gulfs region,” in Australian Coastal Systems (Switzerland: Springer International Publishing), 891–936. doi: 10.1007/978-3-030-14294-0_27
42
Smith G. A. Hemer M. Greenslade D. Trenham C. Zieger S. Durrant T. (2021). Global wave hindcast with Australian and Pacific Island Focus: From past to present. Geosci. Data J.8, 24–33. doi: 10.1002/gdj3.104
43
Splinter K. D. Davidson M. A. Golshani A. Tomlinson R. (2012). Climate controls on longshore sediment transport. Continental Shelf Res.48, 146–156. doi: 10.1016/j.csr.2012.07.018
44
Swart N. C. Fyfe J. C. Gillett N. Marshall G. J. (2015). Comparing trends in the southern annular mode and surface westerly jet. J. Climate28, 8840–8859. doi: 10.1175/JCLI-D-15-0334.1
45
Takahashi K. Montecinos A. Goubanova K. Dewitte B. (2011). ENSO regimes: reinterpreting the canonical and Modoki El Niño. Geophys. Res. Lett.38, L10704. doi: 10.1029/2011GL04736
46
Townsend M. Guy J. (2017). Adelaide’s beaches: trial by storm. Aust. Coasts Ports2017, 526–531.
47
Ummenhofer C. C. Gupta A. S. Briggs P. R. England M. H. McIntosh P. C. Meyers G. A. et al . (2011). Indian and Pacific Ocean influences on Southeast Australian drought and soil moisture. J. Climate24, 1313–1336. doi: 10.1175/2010JCLI3475.1
48
van der Westhuysen A. J. Zijlema M. Battjes J. A. (2007). Nonlinear saturation-based whitecapping dissipation in SWAN for deep and shallow water. Coast. Eng.54, 151–170. doi: 10.1016/j.coastaleng.2006.08.006
49
Wandres M. Pattiaratchi C. Hetzel Y. Wijeratne E. M. S. (2018). The response of the southwest Western Australian wave climate to Indian Ocean climate variability. Climate Dynamics50, 1533–1557. doi: 10.1007/s00382-017-3704-z
50
Young I. R. Fontaine E. Liu Q. Babanin A. V. (2020). The wave climate of the southern ocean. J. Phys. Oceanography50, 1417–1433. doi: 10.1175/JPO-D-20-0031.1
51
Young I. R. Ribal A. (2019). Multiplatform evaluation of global trends in wind speed and wave height. Science364, 548–552. doi: 10.1126/science.aav9527
Summary
Keywords
wave modelling, southern annular mode, Enso, Indian Ocean Dipole, Gulf St Vincent, South Australia
Citation
Perry B, Huisman B, Antolínez JAA, Hesp PA and Miot da Silva G (2024) Impacts of large scale climate modes on the current and future bimodal wave climate of a semi-protected shallow gulf. Front. Mar. Sci. 11:1364736. doi: 10.3389/fmars.2024.1364736
Received
03 January 2024
Accepted
27 March 2024
Published
17 April 2024
Volume
11 - 2024
Edited by
Chunyan Li, Louisiana State University, United States
Reviewed by
Vanesa Magar, Center for Scientific Research and Higher Education in Ensenada (CICESE), Mexico
Laura Cagigal, University of Cantabria, Spain
Updates
Copyright
© 2024 Perry, Huisman, Antolínez, Hesp and Miot da Silva.
This is an open-access article distributed under the terms of the Creative Commons Attribution License (CC BY). The use, distribution or reproduction in other forums is permitted, provided the original author(s) and the copyright owner(s) are credited and that the original publication in this journal is cited, in accordance with accepted academic practice. No use, distribution or reproduction is permitted which does not comply with these terms.
*Correspondence: Benjamin Perry, ben.perry@flinders.edu.au; José A. A. Antolínez, j.a.a.antolinez@tudelft.nl
Disclaimer
All claims expressed in this article are solely those of the authors and do not necessarily represent those of their affiliated organizations, or those of the publisher, the editors and the reviewers. Any product that may be evaluated in this article or claim that may be made by its manufacturer is not guaranteed or endorsed by the publisher.