 Mariana Bonfim1*
 Samuel L. Bunson1†
 Andrew J. Sellers2
 Mark E. Torchin2
 Gregory M. Ruiz3Amy L. Freestone1,2,3
- 1Department of Biology, Temple University, Philadelphia, PA, United States
- 2Smithsonian Tropical Research Institute, Ancon, Panama
- 3Marine Invasions Research Laboratory, Smithsonian Environmental Research Center, Smithsonian Institution, Edgewater, MD, United States
Introduction: Global shipping has accelerated the spread of non-native species. Factors such as environmental filtering and interactions with local biota can affect invasion likelihood, yet their relative contribution to predicting invasion risk remains unresolved. To test how abiotic filters and an experimentally-derived measure of biotic resistance interact with propagule pressure, we developed an integrated model to evaluate their relative effects on invasion risk of marine biofouling organisms to different focal port regions. We predicted that environmental filtering impacts invasion risk when fewer but stronger connections are part of the network. Further, predation is a mechanism of biotic resistance, which can reduce invasion risk, with most pronounced effects predicted in the tropics that decline at higher latitudes.
Methods: We examined shipping traffic and predation impact at three coastal bioregions spanning 47-degrees of latitude al range in the Northeast Pacific (Alaska, California, and Panama). We used vessel traffic databases to characterize propagule pressure and construct a worldwide port network of marine shipping routes and ports. Environmental resistance was estimated using temperature and salinity data from donor and recipient regions. We further used standardized predator exposure experiments to quantify predation impact on fouling community biomass as an estimate of potential for biotic resistance. We then expanded on existing models of relative invasion risk to incorporate the probability that propagules will survive predation by local predators and overcome environmental filtering to generate a predicted invasion risk for each port.
Results: Environmental filtering in all regions and predation pressure in the tropics worked to reduce the invasion risk, resulting in markedly different cumulative risk profiles over time among regions.
Discussion: In an increasingly connected world with more vessel traffic, our results highlight that while the number and distribution of shipping routes are important to understand risk, abiotic and biotic filters can modify model predictions.
1 Introduction
Shipping and global trade are key drivers of human-mediated invasions of marine species across biogeographical barriers (Ruiz et al., 2000). Ships carry up to 80 percent of world trade (Sardain et al., 2019) and provide multiple microhabitats that diverse assemblages of species occupy, thereby serving as a vector for transportation of organisms beyond natural biogeographical regions and colonization of novel environments (Carlton and Ruiz, 2005; Ruiz et al., 2015; Bailey et al., 2020). Ship-borne invasions occur mainly by ballast water release (water used to maintain vessel stability during voyage that can contain aquatic species) and biofouling (organisms that accumulate on submerged structures of vessels). The latter mechanism is much less explored in ship-borne risk assessment models and recent evidence suggests biofouling on hulls of ships may be more important to the transportation of benthic invaders than ballast water, given that many larval stages do not survive voyages in ballast tanks (Moser et al., 2016; Simkanin et al., 2016) and regulations have advanced to further reduce such organism concentrations (Bailey et al., 2022; Outinen et al., 2024). The probability of invasions increases with greater propagule pressure (Lockwood et al., 2005) or the combination of release events and number of individuals released in each event. Nevertheless, several factors can reduce the likelihood of invasions upon arrival to recipient regions, including inappropriate environmental conditions (i.e., environmental mismatch; Keller et al., 2011) and interactions with local biota resulting in biotic resistance (Kimbro et al., 2013), yet the relative contribution of these factors to invasion risk remains unresolved.
Environmental mismatch is important for predicting establishment of potential new invaders (Maitner et al., 2012; Lovell et al., 2021) especially in marine nearshore systems (Seebens et al., 2013). Combining environmental distance, i.e., the difference in abiotic conditions between donor and recipient regions, into transportation networks (Keller et al., 2011) provides a useful proxy measure of environmental mismatch and can help identify dynamics affecting the translocation of species (Bush et al., 2014). Analyses of these networks can reveal patterns of connections among regions, such as clustering (shared connections) and asymmetry (unique connections) and can be evaluated in parallel to risk assessment models. The global cargo transportation network, particularly those of shipping routes, is a complex system of ports (nodes) that are connected by vessel traffic (edges or connections) (Kaluza et al., 2010; Sardain et al., 2019). Studies have predicted that areas with a high number of vessel arrivals and lower intra- and inter-annual variation are likely to be more susceptible to invasions (Drake and Lodge, 2004), especially when connections are established between environmentally similar regions (Keller et al., 2011). In an increasingly connected world, donor-recipient networks that integrate environmental distance can therefore both inform invasion risk and corroborate model predictions.
In addition to environmental conditions, biotic interactions can also mediate the success of an invasion (Mitchell et al., 2006), and evidence suggests that the strength of biotic interactions could change predictably across biogeographic gradients, such as latitude. Biotic resistance, or the ability of a native community to limit the distribution and abundance of non-native species (Elton, 1958; Levine et al., 2004), can be stronger in the tropics (Freestone et al., 2013; Kimbro et al., 2013; Cronin et al., 2015; Cheng et al., 2019) where biotic interactions are thought to be more intense and specialized than at higher latitudes (Dobzhansky, 1950; Mittelbach et al., 2007; Schemske et al., 2009). In fact, fewer non-native taxa have been observed in the tropics for several major taxonomic groups (Sax, 2001). Species richness can increase biotic resistance through more complete resource utilization (Stachowicz et al., 2002), suggesting that tropical communities may be more resistant to invasion due to increased competition, resulting from higher species richness in the tropics (Pianka, 1966; Brown, 2014; Fine, 2015).
Predation can also be a primary mechanism of biotic resistance with stronger intensity and impacts in the tropics. Predation impacts on prey communities can be more severe at low relative to high latitudes, shaping patterns of prey composition, biomass, and functional diversity (Freestone et al., 2020, 2021; López and Freestone, 2021; Ashton et al., 2022). Predators can limit non-native prey survival and growth (Hunt and Yamada, 2003), and strong predation can reduce the likelihood of successful invasions despite high introduction effort (i.e., propagule pressure) (Byun et al., 2015; Cheng et al., 2019). Yet, large scale and standardized experiments that assess the intensity and impact of predation to inform estimates of biotic resistance across biogeographic gradients are relatively recent (see Lavender et al., 2017; Roslin et al., 2017; Freestone et al., 2020, 2021; Torchin et al., 2021; Ashton et al., 2022).
The challenges associated with studying the potential for biotic resistance across large spatial scales is reflected in the absence of this component in many models of invasion risk and spread of non-native species (Wonham et al., 2013; but see Seebens et al., 2013, 2018). Most existing models integrate environmental conditions and propagule supply to predict invasion risk in a variety of ecological contexts, including marine ports and terrestrial plant invasions and spread (e.g., Seebens et al., 2015, 2018). Being primarily informed by vector dynamics, these models predict establishment probabilities as a function of colonization and survival at a new location but often ignore the ability of a local community to resist establishment of a non-native species through species interactions. In addition, emerging modelling approaches of marine invasions have rarely been applied to other pathways of introduction beyond ballast water despite the importance of hull biofouling, which has the potential to introduce large numbers of individuals and remains largely unregulated (Zabin et al., 2018; Donelan et al., 2022).
We developed an integrated model that examines how propagule pressure, environmental, and biotic resistance may affect risk of invasion at recipient port regions in a marine vessel traffic network. We employed this approach to understand marine invasion risk due to transfers of biofouling organisms, representing a critical pathway of introduced marine species. We predicted that environmental resistance would be more important to invasion risk in ports where a low number of connections have a disproportionate contribution to propagule number, as environmental mismatch to these strong connections could heavily influence the overall risk of invasion at that port. We further predicted that the probability of predation impact, as a mechanism of biotic resistance, can reduce invasion risk from ship-borne introductions even under high propagule pressure and that this effect would be most pronounced in the tropics where predation is expected to be more intense than at higher latitudes. To test these hypotheses, we expanded existing modeling frameworks based on shipping (propagule) networks and environmental distance measures among ports (Keller et al., 2011; Seebens et al., 2013; Wonham et al., 2013; Moser et al., 2016; Miller et al., 2018) to incorporate biotic resistance by predation, using experimentally-derived data from different port regions. This approach leverages recent advances in invasion risk modeling while expanding the ecological realism to include a measure of biotic interactions. Our approach represents a novel advancement in the prediction of invasion risk with applicability to different ecosystems and contexts.
2 Materials and methods
To explore invasion risk across a donor-recipient network accounting for introduction effort (i.e., propagule pressure), environmental resistance, and biotic resistance, we focused on two main approaches. First, we used vessel traffic databases to construct a worldwide port network where marine shipping routes serve as connections and ports serve as nodes. This approach enabled us to visualize the distribution of transportation routes to the studied destination port regions in the context of environmental distances. Second, we expanded on existing establishment probability models (Seebens et al., 2013; Wonham et al., 2013; Seebens et al., 2016) to incorporate biotic resistance from predation to predict risk of invasions in port regions. We estimated the probability of invasion in recipient port j (i.e., recipient region) as a function of the probabilities that a propagule will (1) arrive on route r and be released at recipient port j (Pr[Supply]) or propagule arrival and release probability, (2) survive environmental differences between donor port i and recipient port j (Pij[Env]), and (3) survive predation by local predators in recipient port j (Pj[Pred]), thereby overcoming biotic resistance. The product of these probabilities therefore determines the likelihood of a new primary invasion (i.e., colonization of a new individual) by hull biofouling from one ship movement r (Equation 1).
While this approach builds on existing equations from validated models for estimating invasion risk in coastal systems (Seebens et al., 2013, 2016), we incorporated into these models the first estimate to our knowledge of the probability of biotic resistance using experimentally-derived data. Probabilities were proven independent in pair-wise tests (Pearson correlation; ρS,E = -0.06, ρS,P = 0.01, ρE,P = 0.27); their product thereby determines the likelihood of a new primary invasion. All calculations, simulations and data visualizations were performed in R version 4.0.3 (R Core Team, 2020).
2.1 Study regions
To test how biotic resistance and abiotic filters interact with propagule pressure to predict invasions and to explore the architecture of shipping networks, we selected three port regions to serve as models for distinct biogeographic regions and shipping profiles. This approach allowed us to assess invasion risk in distinct ecological and invasion contexts. We used three main criteria to select our study regions. Port regions needed to: 1) be intensively used and relevant economically to the overall region, including a high volume of international connections; 2) be located at different biogeographic regions within the marine biome to represent different ecological contexts; and 3) have distinct shipping regimes with variable propagule pressure. We selected three port regions along the northeast Pacific coastline, from subarctic latitudes to the tropics. Port regions combined all nearby commercial ports (less than 100 km distance) that would be relevant to that bioregion: 1) Panama Bay anchorage region (8° 52’ 12’’ N, 79° 30’ 0’’ W), including all arrivals and anchored ships about to cross the Panama Canal; 2) California’s San Francisco Bay port region, including all arrivals to the ports and commercial harbors at Alameda (37° 45’ 36’’ N, 122° 18’ 36’’ W), Benicia (38° 1’ 48’’ N, 122° 19’ 12’’ W), Oakland (37° 47’ 60’’ N, 122° 16’ 48’’ W), San Francisco (37° 47’ 60’’ N, -122° 25’ 12’’ W), and Redwood City (37° 30’ 0’’ N, 122° 13’ 12’’ W); and 3) Southeast Alaska port region, represented by the Port of Ketchikan (55° 20’ 33’’ N, 131° 39’ 22’’ W). These three port regions (hereafter referred as Panama, California, and Alaska respectively) were also identified consistently in the literature as potential routes of introduction for marine species (see databases curated by Fofonoff et al., 2018), as well as biogeographic regions where biotic interactions by predation have shown consistent differences (Freestone et al., 2021; López and Freestone, 2021).
Panama – Panama served as a tropical latitude port region with extremely high vessel traffic that was consistent year-round, which ensured potential high propagule pressure all year. The Panama Canal is a transoceanic aquatic corridor connecting the Pacific and Atlantic across the Isthmus of Panama. It is an important biogeographical connector and potential invasion hotspot (Ruiz et al., 2009; Muirhead et al., 2015). As expansion projects are implemented over time, the growing traffic capacity of larger vessels will likely increase invasion risk in the region (Ruiz et al., 2009, 2015; Castellanos-Galindo et al., 2020).
California – Recognized as a highly invaded estuary (Cohen and Carlton, 1998; Ruiz et al., 2011), the San Francisco Bay ports are located at a temperate latitude and are major ports of entry for goods to the United States. Continuous arrivals year-round and high arrival numbers contribute to high potential propagule pressure to this region.
Alaska – Ketchikan is a major port for passenger vessels in the Northeast Pacific facilitating tourism in southeast Alaska (McGee et al., 2006; Miller and Ruiz, 2014). In the region where it is located, Ketchikan has a higher number of arriving vessels relative to neighboring ports, with arrivals that peak in frequency during the northern hemisphere summer. The importance of this port region is growing given the emerging shipping routes in the Arctic Ocean that could potentially increase risk of invasions in this region (Verling et al., 2005).
2.2 Propagule supply
We obtained the historical port transit profile and shipping traffic information between 2006 and 2010 for the focal port regions. Data were obtained from the National Ballast Information Clearinghouse (National Ballast Information Clearinghouse, 2021) for those ports located on coastal United States of America and provided by the Panamanian Canal authorities (ACP) for Panama. Overall number of arrivals, monthly traffic, port connections (i.e., potential donor ports) and vessel type were used to estimate contributions of shipping intensity to propagule pressure (Miller et al., 2018). While our data from Panama only includes ship transits through the Panama Canal and do not include arrivals at Pacific ports that do not also transit the Canal, Pacific anchorages represent most of the annual commercial vessel traffic in the region. Therefore, our estimate of shipping traffic to this region is likely underestimated but captures the majority of regional vessel traffic. In addition, vessel traffic data from Panama initially included all loading port stops within a route for cargo vessels. In comparison, NBIC data only includes the last port-of-call for each arrival. To ensure direct comparison to the other port regions, we estimated last port-of-call for Panama arrivals by assuming that the geographically closest port was the last stop before the final destination in Panama. We then selected the smallest geodesic distance from each stop and the Panama port region within a ship route r using package Geosphere 1.5–10 (Hijmans, 2019). Invasion risk models (P[Inv]) were computed for the Panama dataset with estimated last port-of-call and all stops, but no substantial differences were observed in the results of the model. Therefore, we focus our results on the estimated last port-of-call, which allows a more direct comparison to the other studied port regions.
We further focused on hull fouling (i.e., biofouling) as an important mechanism for accidental introduction of propagules overseas. To calculate the number of individuals in each release event (i.e., ship arrival), we estimated the number of potential biofouling organisms that could colonize the wetted surface area of commercial vessel hulls (Moser et al., 2016) and associated structures (“niche areas”; rudders, propellers, shafts etc., see Moser et al., 2017; Miller et al., 2018) in each arrival. Wetted surface area (WSA) refers to the estimated area of a ship’s hull that is submerged when loaded with maximum cargo and has important applications in maritime engineering. To estimate the potential colonization space for macrofouling organisms on the analyzed vessels, we primarily employed mean total WSA with incorporated fractions of total niche area for each vessel type (Miller et al., 2018). When total niche area data was unavailable for specific vessel types (e.g., fishing vessel), we utilized total wetted surface area as a substitute (Moser et al., 2016), but those vessel arrivals represented less than 1% of our data. Both approaches serve as proxies for propagule supply, allowing us to assess the potential threat of accidental biofouling organism transfer by ships.
The likelihood of propagules being released from a ship’s hull in a recipient region j is estimated for each ship arrival using a modified equation from (Wonham et al., 2013).
Probability of propagule arrival and release, or Pr(Supply), reflects the likelihood of a successful propagule release from a ship arrival on route r. Pr(Supply) considers a fixed baseline probability (p) of 0.00002 (as estimated by Seebens et al., 2013), that represents a single propagule failing to be released and Nc, which acts as a proxy for propagule pressure based on the colonization potential of the ship’s hull. This model therefore leverages vector-based dynamics to estimate invasion risk due to the abundance of propagules per ship arrival (Wonham et al., 2013). The core principle is that the probability of colonization increases with the successful release of propagules, which Pr(Supply) captures through the interplay of p and Nc. To estimate Nc, we calculated the number of potential macrofouling organisms that could colonize each ship’s hull (WSA) using the average area occupied by a common fouling barnacle (6.45 cm2), following established methods (Moser et al., 2016). Hull fouling treatment is not as regulated as ballast water transfer overseas (Zabin et al., 2018), so this model assumes an upper limit of propagule pressure by considering every entry event to have an equal probability of propagule arrival and release, scaled to total WSA of the various ships. This approach disregards any husbandry treatment that could reduce chances of propagule release, such as specific anti-fouling coatings or hull cleaning practices. While complete hull fouling is uncommon in modern ships (Chan et al., 2022) this model serves to capture the potential magnitude of commercial vessels to deliver propagules via biofouling across recipient ports. While hull fouling is an important vector of marine invasions, ships could also transport native species within their range. Since there is no known probability that a species that is transported via hull fouling is non-native to a recipient port, this model assumes that all introduced propagules to a port have the potential to be non-native, allowing the calculation of relative invasion risk based on overall propagule pressure.
2.3 Environmental matching
To explore the potential for environmental conditions at the arrival port to mediate invasion risk, we obtained environmental data for all connected ports in our database from published data on global ports (Keller et al., 2011). Water salinity and minimum, maximum, and average annual water temperature were obtained for each port. We consulted open-source tools such as MarineTraffic (marinetraffic.com) and VesselFinder (https://www.vesselfinder.com/) to resolve inconsistencies in port names. We further estimated missing environmental values using publicly available data (United States Geological Survey, through waterdata.usgs.gov; Bio-ORACLE, through Tyberghein et al., 2012; Assis et al., 2018). Ports that could not be identified were excluded from the final dataset but were less than 1% of all entries combined (< 400).
To explore the contribution of environmental distance to invasion risk within the shipping network, we built weighted network maps using R package visNetwork 2.0.9 (Almende et al., 2019) and igraph (Csardi and Nepusz, 2006). This approach allowed us to visualize the over 40,000 arrivals in our combined datasets and evaluate patterns of evenness (Pielou’s evenness index J′) and diversity (Shannon diversity H′) of donor ports for each study region. Evenness and diversity metrics were computed using the vegan 2.5–6 package (Oksanen et al., 2022). Environmental distances were calculated by estimating the Euclidean distance between data matrices of donor and recipient port environmental conditions (Keller et al., 2011).
The likelihood of an organism surviving abiotic filters increases with environmental similarity between donor and recipient regions, which was modelled as a modified Gaussian function (Seebens et al., 2013).
The probability of environmental survival results from the differences in mean annual water temperature T and mean annual salinity S between donor port i and recipient region j, standardized by the width of the ecological niche σT and σS, i.e., the variance of the distributions (Supplementary Table 1). The base probability α was modelled with the assumption that organisms would survive perfectly in matched environmental conditions; therefore, we set values of α equal to 1. In this model either salinity or temperature can affect mismatch to the same extent (correlation tests between salinity and temperature revealed no significant relationship, ρ = 0.2). We used mean salinity and temperature conditions to estimate environmental matching given their utility in prior modeling efforts (e.g., Seebens et al., 2013, 2016, 2018), while noting that other attributes may also contribute to environmental resistance (e.g., temperature variation, upwelling regimes, etc.). The constant is a fundamental mathematical constant, approximately equal to 2.71828, that is widely used in exponential and logarithmic functions.
2.4 Biotic resistance
To quantify predation pressure in recipient regions, and therefore the potential for biotic resistance, we conducted a short-term predator exposure experiment on biofouling communities. Experiments were deployed at three recreational marinas in each study region (see Freestone et al., 2021 for detailed experiments and results). Median distance between study sites and focal port regions was 5.8 km. Biofouling communities represent a diverse multiphyletic assemblage of marine invertebrate taxa, including barnacles, ascidians, and bryozoans capable of colonizing artificial substrates and ship’s hulls (Godwin, 2003; Sylvester et al., 2011), and these communities also harbor many of the known coastal invertebrate invasions in the United States (Ruiz et al., 2000). To control for potential confounding factors of habitat type (i.e., substrate) and area, we used polyvinyl chloride panels (PVC, 14 x 14 x 0.95 cm) as artificial model habitat for the fouling communities. While these panels may not fully replicate the complexities of real ship hulls, they offer a well-established and comparable method for assessing fouling communities on artificial substrates (Marraffini et al., 2017). Biofouling communities developed on panels for a period of three months under reduced predation (inside a marine plastic cage, mesh size 6.35 mm) and were then exposed to ambient predation for three days (n = 5 panels/site). Biomass of the community (i.e., wet weight, g) was measured before and after the experiment (see Freestone et al., 2021 for results and Freestone et al., 2022 for publicly available data). Experiments were deployed from floating docks at 1m below the water surface, allowing us to assess the impacts of predatory fish as an important predator guild affecting biofouling on visiting vessels.
We then used the experimentally-derived measures of predation impact on fouling prey communities to obtain an estimated predation survival probability as a metric for biotic resistance for each focal port region.
Probability of predation survival Prj(Pred) at recipient port j from a ship arrival from route r is a probability density function, similar to Equation 3, and results from biofouling community biomass differences before (b) and after (a) exposure to predation, standardized by the variance in weight data (σW) (Supplementary Table 1). The baseline probability of an organism surviving predation is indicated by α, which we set at 1. P(Pred) uses loss of biomass from predation as an estimate of surviving predation impact and overcoming biotic resistance potential. To capture the inherent variability in predation pressure, we modeled the probability of predation (P[Pred]) using a Gaussian function. This function best approximates the distribution of community biomass differences () in each region, but does not account for any selectivity of predators on native or non-native prey, or use of habitat refuges. Therefore, the probability of predation survival increases with lower impacts of predators on biomass of fouling communities, therefore decreasing biotic resistance.
Probability of biotic resistance was then estimated using Equation 4 for each experimental sampling unit (i.e., panel) using the observed pre- and post-exposure biomass differences, rendering 15 values for each of the three study regions. To incorporate observed variability in predation pressure within and among regions into the invasion risk model, one value of P(Pred) was randomly pulled from bootstrapped values (reps = 1000) in each iteration of the model (i.e., each ship arrival) when calculating P(Inv). Therefore, for each route r a random value was selected from the calculated P(Pred) values for that recipient region j.
2.5 Cumulative risk
This model captures the magnitude of commercial vessels contributing to the potential transfer of marine organisms and its interplay with factors that could mediate the risk of invasion, including environmental mismatch and biotic resistance from predation. Given that all three probabilities contribute to risk of invasion in a recipient port and are considered independent events, their product is what determines the relative likelihood of new invasions in the port region of interest for each individual ship arrival (Equation 1). We consider, however, that risk is cumulative through time. We therefore provide estimates of invasion risk per arrival as well as a cumulative (i.e., summed) risk for the full four-year duration of the dataset (2006–2010).
3 Results
3.1 Arrival profile of recipient port regions
Shipping intensity varied by an order of magnitude among port regions with most arrivals in Panama during 2006–2010 (Figure 1). From the overall 47,456 arrivals in the dataset, 30,218 were to Panama in comparison to 15,336 and 1,902 to California and Alaska, respectively. Most vessels arriving to Alaska were passenger ships (n = 1,786), while arrivals to both Panama and California were primarily container ships (nPanama = 10,619 and nCalifornia = 10,431) (Figure 1). There was no consistent inter-annual variation in any of the focal port regions, but Alaska had intra-annual variation with peak arrivals occurring between May and August, coinciding with expected patterns of tourism. Panama also displayed the largest diversity of vessel types, highest total WSA (Panama: 1.644e+08 vs. California: 0.994e+08, Alaska: 4.645e+06) and had an estimated total propagule size (i.e., sum of estimated fouling barnacles given WSA; Panama: 2.549e+09) that was almost 1.7 times larger than even California (1.543e+09; Alaska: 7.201e+07).

Figure 1 Number of arrivals by vessel type to each of the studied recipient port regions from 2006–2010. Different colors indicate each vessel type with their respective total wetted surface area (TWSA) used to estimate propagule pressure. Port regions are ordered from lower to higher latitude (left to right). LNG/LPG = liquefied natural gases or liquefied petroleum gases tanker; RO/RO, Roll-on or roll-off cargo ships.
3.2 Port networks and environmental distances
Lower environmental distance per connection increased average risk of invasions. Despite California having a number of arrivals that was an order of magnitude higher than Alaska, in both regions the number of connections per donor port was skewed with some ports being more highly connected than others, rendering very similar evenness values (California J′= 0.520; Alaska J′ = 0.526). Furthermore, Alaska had the lowest diversity of port connections (Figure 2; H′ = 1.98), and the average environmental distance of connections was two times lower than the other regions, thereby increasing the risk of invasion from environmental matching given the high number of connections to environmentally close ports (Figure 3). In contrast, California had a higher diversity of connections (California H′ = 2.29) to more environmentally dissimilar regions, which moderated invasion risk. While there were shared connections among all ports, Panama displayed the highest number of unique connections and therefore the highest port diversity (Figure 2; H′ = 4.34), approximately twice that of California or Alaska. Panama also had a more even distribution of connections among donor ports relative to the other regions (J′ = 0.68) in addition to greater variability of environmental distances between connections. Overall, results suggest that environmental filtering might systematically reduce invasion risk in all regions but act more strongly in California.
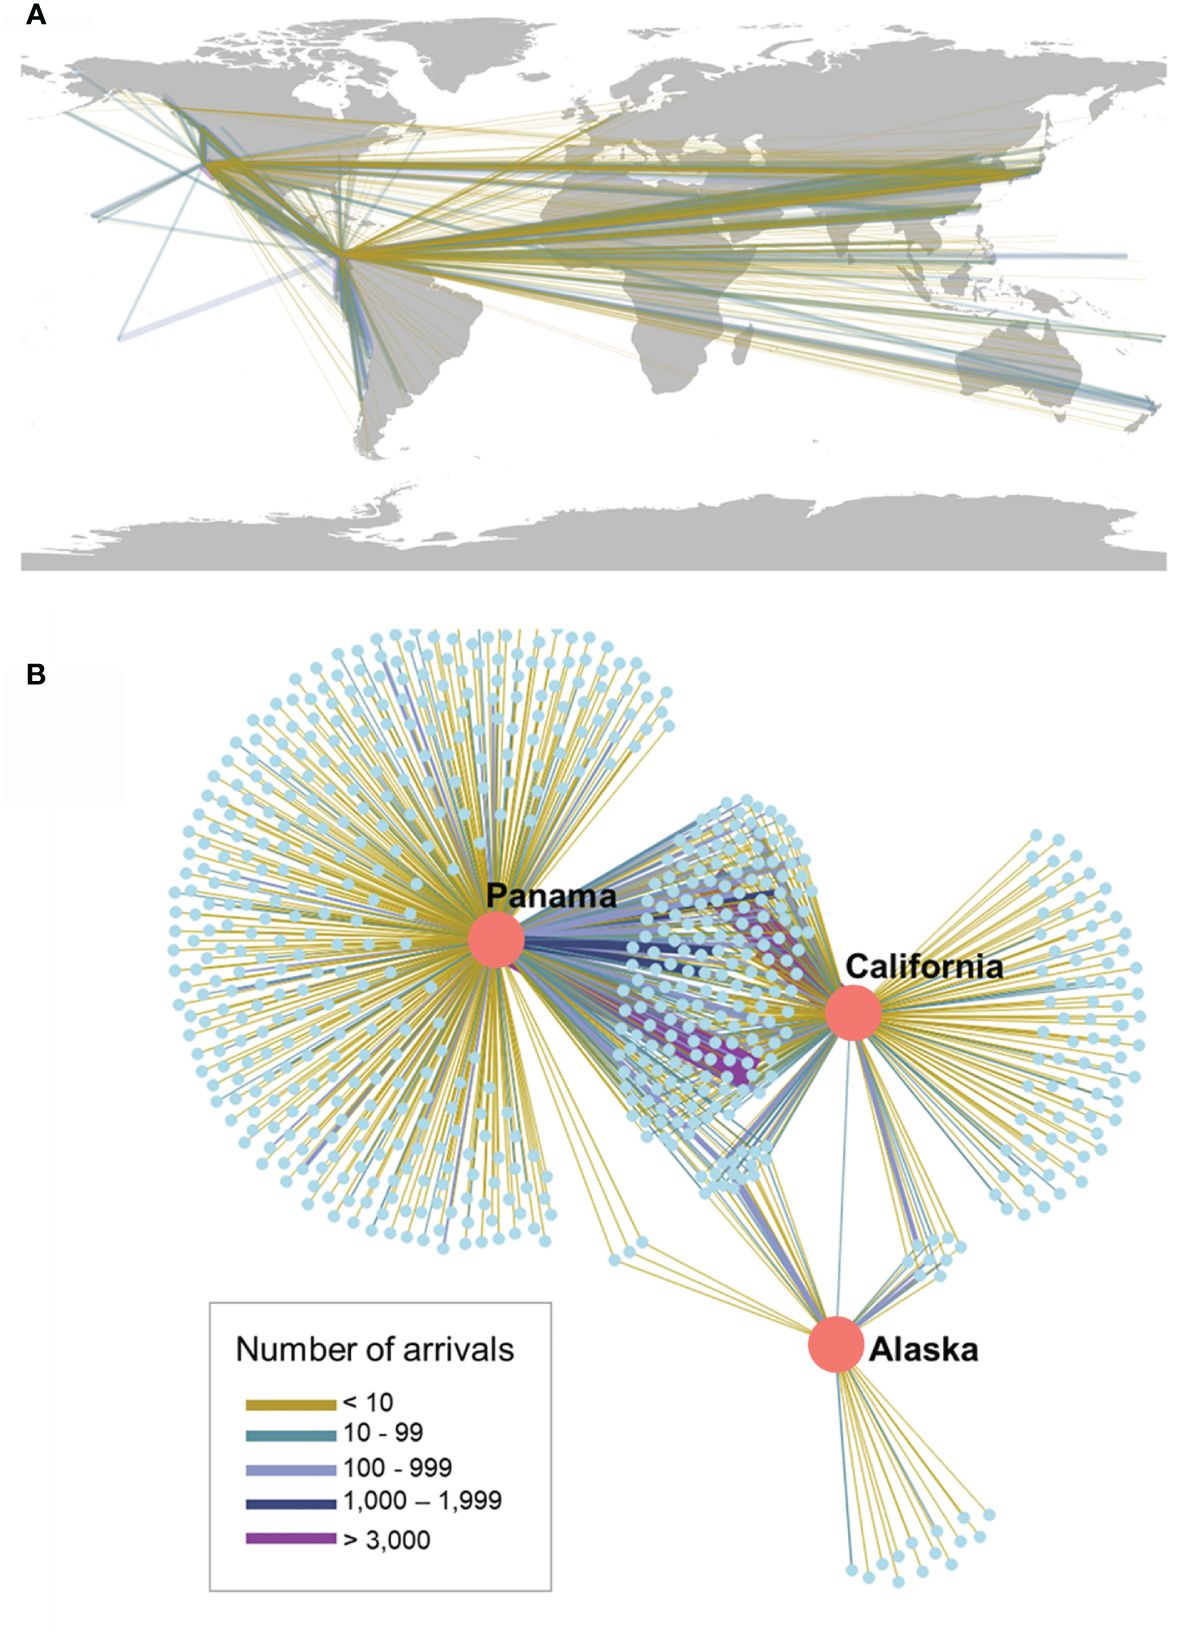
Figure 2 Vessel traffic network to focal recipient ports in Northeastern Pacific. Lines connect donor and recipient locations based on vessel traffic. Connections (lines) are weighted by number of ship arrivals connecting ports (nodes), with different line colors indicating the range of those values. (A) Map depicts the global distribution of arrivals. (B) Transportation network.
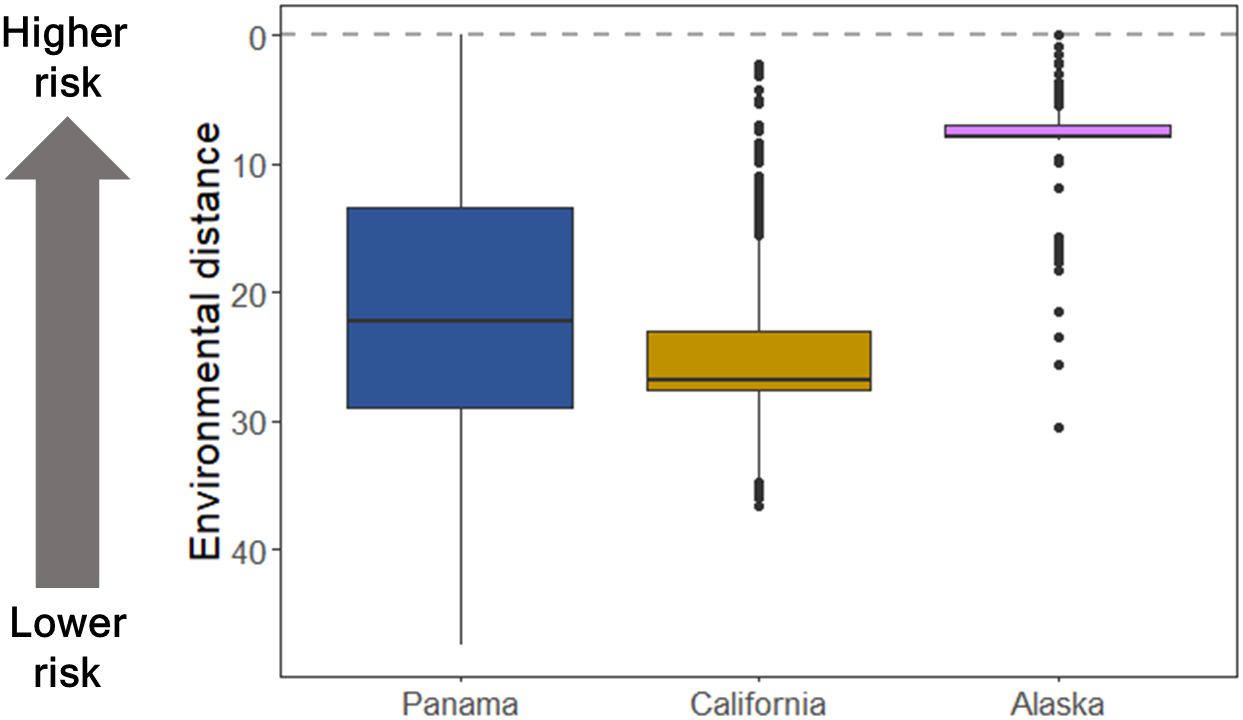
Figure 3 Environmental distance among donor and recipient ports can affect risk of invasion. Environmental distance was measured as a Euclidean distance between donor and recipient regions using differences in water temperature and salinity for each port connection. Dashed line indicates zero environmental distance (i.e., perfect match between donor and recipient regions).
3.3 Invasion risk in recipient port regions
When considering both propagule supply (P[Supply]) and resistance (P[Env] and P[Pred]) together, our models estimated a very low mean probability of invasion per arrival across all port regions (Figure 4), and this low probability stemmed from a combination of environmental and biotic resistance. The relative importance of each of these factors to invasion risk, however, differed significantly among regions. Mean probability of invasion due to propagule supply alone was at least 30% higher in Panama and California than Alaska, but variability (i.e., standard deviation) was greater in Panama. Despite high propagule pressure in some regions, environmental mismatch contributed to a substantial number of potential failures in all regions and markedly reduced invasion probability (P[Inv]) in California. Further, stronger predation in tropical Panama lowered the average probability of invasion due to biotic resistance by up to 80%. In contrast, biotic resistance had a negligible effect on invasion risk in California and Alaska. Therefore, the low overall risk of invasion per arrival across all regions can be attributed to the interplay of strong biotic resistance in Panama, low propagule supply in Alaska and consistently low environmental matching in all regions.
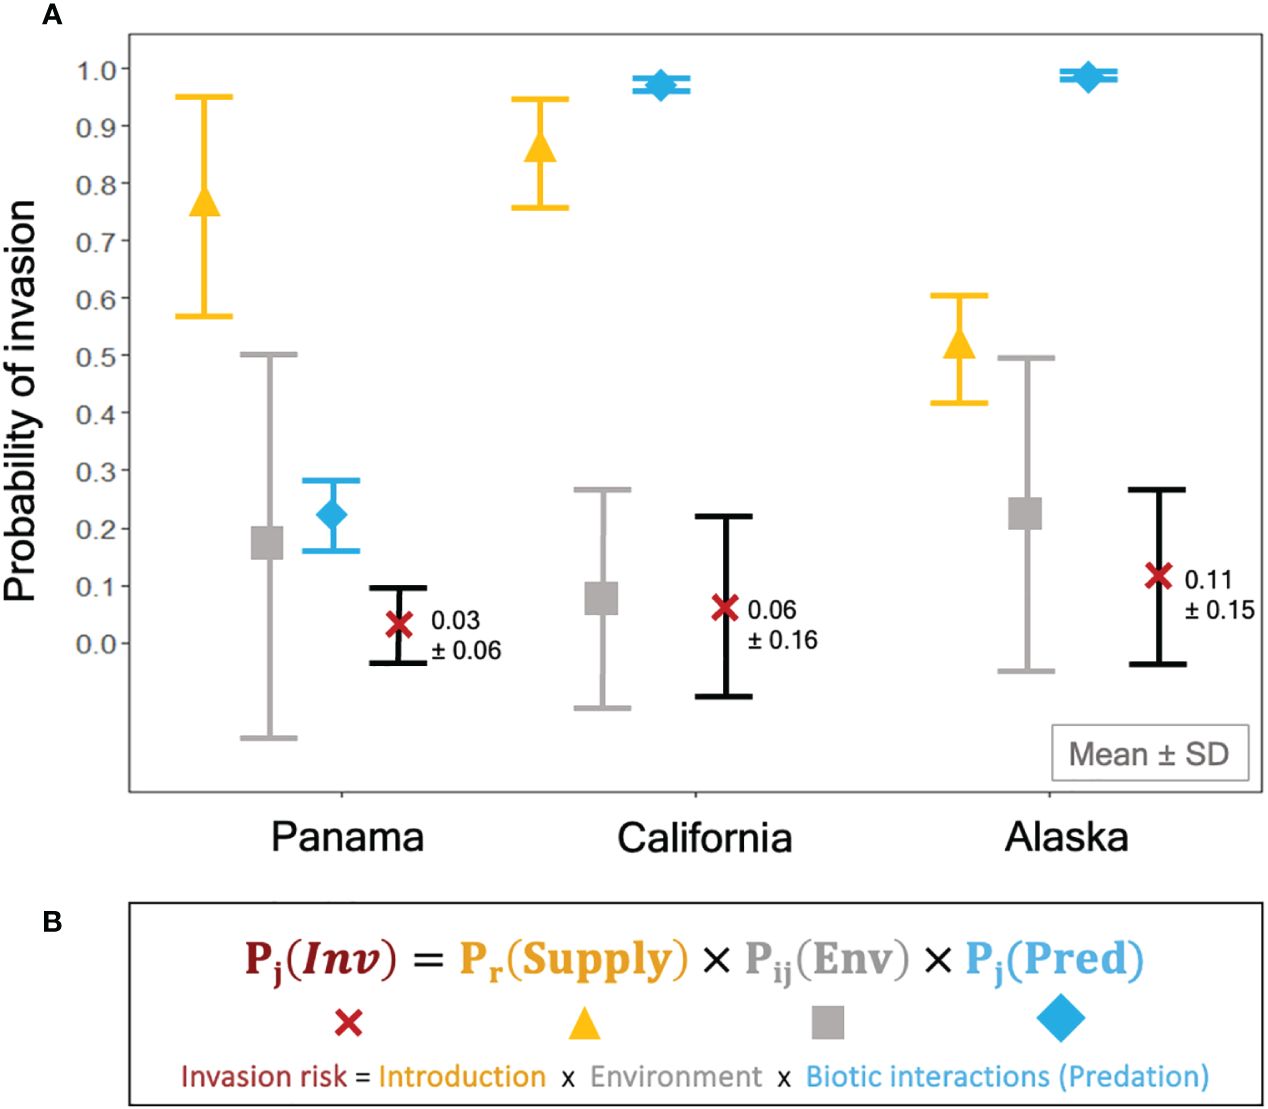
Figure 4 Propagule supply, environmental, and biotic resistance by predation are combined in a risk assessment model to predict invasion probability in port regions. (A) Probability of invasion (Mean ± SD) was estimated using each component of the equation (B) independently and interactively, represented by yellow triangles: ▲ = P(Supply) [Equation 2], grey squares: ■ = P(Env) [Equation 3], blue diamonds: ♦ = P(Pred) [Equation 4]), red Xs = Pj(Inv) [Equation 4].
While average invasion risk per arrival was low in all three port regions, cumulative risk due to the sheer volume of arrivals in some ports showed markedly different patterns (Figure 5). In Alaska, cumulative risk increased very steeply but reached a maximum value that was forty times lower than California and Panama, due to fewer arrivals in this region (Figure 5A, inset). Biotic resistance reduced cumulative risk of invasions in Panama, but not in the other regions (Figure 5). Interestingly, cumulative risk of invasion in California was substantially reduced by environmental matching but was as high as Panama, which had double the number of arrivals but with much greater potential for biotic resistance.
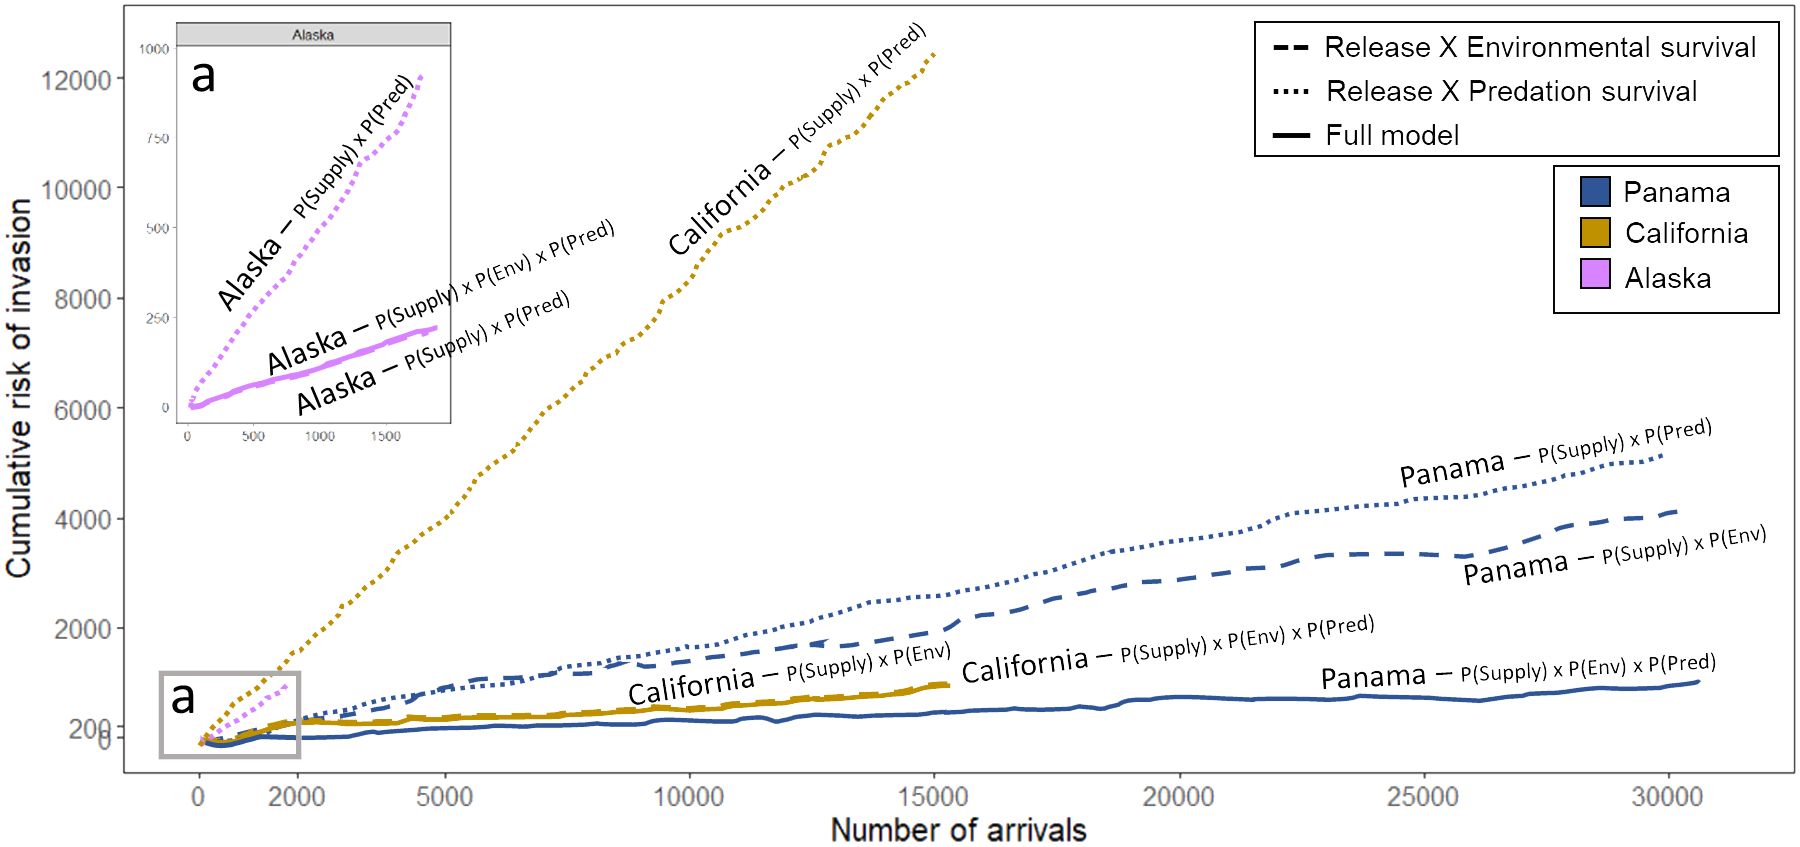
Figure 5 Cumulative probability of invasion as a function of arrival count in three port regions. The aggregation of releases may lead to a compounded risk across successive events. Environmental resistance mitigates invasion risk across all regions, while biotic resistance introduces a significant shift in predictions, particularly in Panama. Dashed lines denote cumulative invasion risk computed without factoring in predation survival, thus excluding biotic resistance but including environmental resistance. Dotted lines represent cumulative invasion risk calculated by excluding the probability of environmental survival (i.e., environmental resistance), while still incorporating biotic resistance. Solid lines encapsulate the comprehensive model. Inset (A) provides a detailed view of cumulative invasion risk in Alaska. It is important to note that solid and dashed lines in Alaska and California exhibit substantial overlap.
4 Discussion
While the magnitude and frequency of organism transfers by various vectors contributes to increasing risk of invasions (Carlton and Ruiz, 2005; Haydar and Wolff, 2011), we show here how environmental matching and biotic resistance may modify invasion risk beyond introduction effort alone. Several lines of evidence have suggested propagule pressure is one of the most important predictors of invasion success (Lockwood et al., 2005; Verling et al., 2005; Simberloff, 2009). Our results show, however, that each entry event is mediated by several possibilities of failure, and environmental filtering in all regions and predation pressure in the tropics worked to reduce invasion risk. Further, risk is cumulative, increasing with time and successive arrivals, and cumulative risk differed markedly in all regions due to these factors. In an increasingly connected world with more vessel traffic (e.g., expansion of Panama Canal, see Muirhead et al., 2015) and emergence of novel routes (e.g., Northern Sea Route [NSR] through Russia, and Northwest Passage [NWP] over North America, see Miller and Ruiz, 2014), our results highlight that while the number and distribution of shipping routes are important to understand risk, abiotic and biotic filters can modify predictions about invasion probabilities.
Environmental filtering can systematically lower risk of invasions, as we observed in all regions. In California, for instance, environmental filtering substantially reduced the probability of invasions associated with propagule pressure alone. Despite poor environmental matching overall, however, a subset of donor regions that were well connected to California were also more environmentally similar. The consistent arrival of large numbers of propagules from places with similar environmental conditions could have created a sustainable source of propagules to California. These large and consistent releases can enable species to overcome limitations of small population sizes (Lockwood et al., 2005). This attribute of the California port network may underlie the high cumulative risk in this region that rivals if not exceeds Panama, where there were double the number of arrivals.
Biotic resistance can be an important mechanism in determining cumulative invasion risk in tropical ports, and including an experimentally-derived estimate of the potential for biotic resistance produced marked differences to model predictions. Biotic resistance shifted long-term predictions in Panama beyond propagule supply and environmental matching alone, reducing the total cumulative risk of invasions by four-fold and lowering the rate of increase over time. High ambient propagule pressure, however, can overwhelm effects of predators as agents of biotic resistance at the local scale (Cheng et al., 2019), highlighting the importance of propagule pressure even in regions with high biotic resistance. The Panama Canal is one of the most important aquatic corridors supporting shipping worldwide with a notably high propagule pressure and diversity of donor regions among the focal regions examined here and across the tropics more broadly (Ruiz et al., 2009; Muirhead et al., 2015) which likely dampen the potential impact of biotic resistance to invasion risk in this region. Tropical areas that have lower propagule pressure but still have high resistance are likely to have substantially different cumulative risk with biotic resistance having a proportionately stronger effect on limiting that risk. Importantly, our measure of biotic resistance quantifies the removal of biomass of biofouling organisms by predators, representing one of several potential mechanisms of biotic resistance acting in the tropics that can impede initial establishment or shape the abundance and distribution of established invaders (Torchin et al., 2021). Other species interactions such as competition (Levine et al., 2004) and parasitism (Blackburn and Ewen, 2017), or effects of predators on other attributes of biofouling communities (e.g., functional traits; López and Freestone, 2021) may magnify the patterns observed here and should be incorporated into future risk assessment models. Indeed, local species richness at recipient ports has been incorporated into previous models (Seebens et al., 2013) as an estimate of the potential for biotic resistance via competition (Stachowicz et al., 2007). Biotic resistance therefore can substantially modify introduction success, and improving modeling approaches that quantify ecological filters can have important implications for management and prevention of future species introductions.
Consistent introduction of propagules from environmentally similar regions can increase invasion risk, even in ports where current propagule pressure is low. On average, Alaska connections had environmental similarity that was four times greater than California or Panama and yet the invasion risk was low, likely due to lower propagule pressure. Alaska’s cumulative risk of invasions, however, had a steep increase with number of arrivals, approximately equal to Panama without biotic resistance, demonstrating that environmental mismatch might not be sufficient to reduce the relative risk of invasion if propagule pressure increases. As widely acknowledged, ship-borne invasions are very likely to accelerate in the absence of increased management requirements as shipping traffic intensifies (Sardain et al., 2019; Seebens et al., 2019) especially with increased connectivity among environmentally similar regions, as we highlight here. Reduction of summer ice due to warming temperatures now enable large cargo ships to cross the Arctic Ocean, creating an opportunity for using the NSR for commercial shipping (Ho, 2010). In the next several years, ice-breaking vessels are projected to open larger paths to allow passage to regular cargo ships, thereby increasing traffic and establishing new routes (Liu and Kronbak, 2010). Since 2010, which marks the last year of the data included in this study, occurrences of newly introduced or persistent populations of four non-native aquatic species have been reported on the coast of Ketchikan, Alaska (Jurgens et al., 2018). Increasing shipping traffic through the NSR could result in new invasions in coastal Alaska, and further analyses are needed to understand the consequences of shifting vessel traffic and climate conditions on invasion dynamics to these subarctic and arctic ports, which remain relatively uninvaded compared to coastlines at lower latitudes (de Rivera et al., 2011).
Successful invasions result from the complex interplay of multiple factors, and our study demonstrates the consequential impacts that biotic resistance, environmental matching, and propagule supply can have on predictions of invasion risk. Exploring these factors within the context of traffic networks is an important first step towards understanding vector-based bioinvasions. To capture more of the complexity of natural systems, we suggest an approach that leverages the growing standardized large-scale experimental data on biotic interactions. This approach can account for factors like temperature-dependent variation in interaction strength (Ashton et al., 2022), which also likely contributes to geographic differences in how these interactions impact non-native species (Freestone et al., 2013; López and Freestone, 2021). Predicting invasions is becoming increasingly accurate, however, and approaches are now available to integrate growing empirical evidence and large-scale studies into risk assessment models, thereby improving their ecological realism and application to preventing the introduction and spread of non-native species. The level of connectedness, among what were once considered distant biogeographical regions, is undergoing rapid change. Large-scale modeling of the mechanisms and processes that shape global patterns of biological invasions are critical in the design of global conservation strategies, especially in a more connected world.
Data availability statement
Predator exposure experiment data (Freestone et al. 2022) are available through the Biological & Chemical Oceanography Data Management Office (DOI 10.26008/1912/bco-dmo.862092.1). Shipping traffic and port arrival data for the United States were obtained through the National Ballast Information Clearinghouse (NBIC Online Database, Smithsonian Environmental Research Center & United States Coast Guard; http://dx.doi.org/10.5479/data.serc.nbic; searched on December 20, 2021). Transit data for the Panama Canal were provided by the Panamanian Canal authorities (ACP) for Panama and are proprietary.
Ethics statement
The manuscript presents research on animals that do not require ethical approval for their study.
Author contributions
MB: Conceptualization, Data curation, Formal analysis, Investigation, Methodology, Project administration, Resources, Software, Supervision, Validation, Visualization, Writing – original draft, Writing – review & editing. SB: Data curation, Formal analysis, Methodology, Software, Visualization, Writing – review & editing. AS: Data curation, Investigation, Methodology, Resources, Writing – review & editing. MT: Data curation, Funding acquisition, Investigation, Methodology, Project administration, Resources, Supervision, Writing – review & editing. GR: Data curation, Funding acquisition, Investigation, Methodology, Project administration, Resources, Supervision, Writing – review & editing. AF: Conceptualization, Funding acquisition, Investigation, Methodology, Project administration, Resources, Supervision, Validation, Writing – review & editing.
Funding
The author(s) declare financial support was received for the research, authorship, and/or publication of this article. This work was funded by NSF OCE #1434528. MB was partially funded by Science Without Borders fellowship (CNPq -Brazil) and Temple University.
Acknowledgments
We are very grateful to C. Gehret who assisted in port data curation and to all others that helped maintain field experiments: S. Alley, K. Blatz, V. Bravo, A. Conejo, Z. Hoffman, E. Huynh, T. Lee, B. McInturff, B. Moreno, A. Neterer, L. Oswald, M. Saldana, D. Gamero. Development of this research greatly benefited from the feedback and support of D.P. Lopez, M.F. Repetto, C. Schloeder, M. Minton, W. Miller, J. Behm, B. Sewall, and G. Muniz-Dias. Our sincere appreciation to L. Jurgens, G. Freitag, R. Riosmena- Rodriguez (in memorian), C. Sanchez Ortiz, J.M. Lopez Vivas, A. Chang for providing resources and helping accommodate our research. Publication of this article was funded in part by the Temple University Libraries Open Access Publishing Fund.
Conflict of interest
The authors declare that the research was conducted in the absence of any commercial or financial relationships that could be construed as a potential conflict of interest.
Publisher’s note
All claims expressed in this article are solely those of the authors and do not necessarily represent those of their affiliated organizations, or those of the publisher, the editors and the reviewers. Any product that may be evaluated in this article, or claim that may be made by its manufacturer, is not guaranteed or endorsed by the publisher.
Supplementary material
The Supplementary Material for this article can be found online at: https://www.frontiersin.org/articles/10.3389/fmars.2024.1374887/full#supplementary-material
References
Almende B., Thieurmel B., Robert T. (2019). “Package ‘visnetwork’,” in Network visualization using ‘vis. js’ Library, version 2. Available at: https://CRAN.R-project.org/package=visNetwork.
Ashton G. V., Freestone A. L., Duffy J. E., Torchin M. E., Sewall B. J., Tracy B., et al. (2022). Predator control of marine communities increases with temperature across 115 degrees of latitude. Science 376, 1215–1219. doi: 10.1126/science.abc4916
Assis J., Tyberghein L., Bosch S., Verbruggen H., Serrão E. A., De Clerck O. (2018). Bio-ORACLE v2. 0: Extending marine data layers for bioclimatic modelling. Global Ecol. Biogeography 27, 277–284. doi: 10.1111/geb.12693
Bailey S. A., Brown L., Campbell M. L., Canning-Clode J., Carlton J. T., Castro N., et al. (2020). Trends in the detection of aquatic non-indigenous species across global marine, estuarine and freshwater ecosystems: A 50-year perspective. Diversity Distributions 26, 1780–1797. doi: 10.1111/ddi.13167
Bailey S. A., Brydges T., Casas-Monroy O., Kydd J., Linley R. D., Rozon R. M., et al. (2022). First evaluation of ballast water management systems on operational ships for minimizing introductions of nonindigenous zooplankton. Mar. pollut. Bull. 182, 113947. doi: 10.1016/j.marpolbul.2022.113947
Blackburn T. M., Ewen J. G. (2017). Parasites as drivers and passengers of human-mediated biological invasions. EcoHealth 14, 61–73. doi: 10.1007/s10393-015-1092-6
Brown J. H. (2014). Why are there so many species in the tropics? J. biogeography 41, 8–22. doi: 10.1111/jbi.12228
Bush E. R., Baker S. E., Macdonald D. W. (2014). Global trade in exotic pets 2006–2012. Conserv. Biol. 28, 663–676. doi: 10.1111/cobi.12240
Byun C., De Blois S., Brisson J. (2015). Interactions between abiotic constraint, propagule pressure, and biotic resistance regulate plant invasion. Oecologia 178, 285–296. doi: 10.1007/s00442-014-3188-z
Carlton J. T., Ruiz G. M. (2005). Vector science and integrated vector management in bioinvasion ecology: conceptual frameworks. Scope-Scientific Committee Problems Environ. Int. Council Sci. Unions 63, 36.
Castellanos-Galindo G. A., Robertson D. R., Sharpe D. M., Torchin M. E. (2020). A new wave of marine fish invasions through the Panama and Suez canals. Nat. Ecol. Evol. 4, 1444–1446. doi: 10.1038/s41559-020-01301-2
Chan F. T., Ogilvie D., Sylvester F., Bailey S. A. (2022). Ship biofouling as a vector for non-indigenous aquatic species to Canadian arctic coastal ecosystems: a survey and modeling-based assessment. Front. Mar. Sci. 9, 808055. doi: 10.3389/fmars.2022.808055
Cheng B. S., Ruiz G. M., Altieri A. H., Torchin M. E. (2019). The biogeography of invasion in tropical and temperate seagrass beds: Testing interactive effects of predation and propagule pressure. Diversity Distributions 25, 285–297. doi: 10.1111/ddi.12850
Cohen A. N., Carlton J. T. (1998). Accelerating invasion rate in a highly invaded estuary. Science 279, 555–558. doi: 10.1126/science.279.5350.555
Cronin J. T., Bhattarai G. P., Allen W. J., Meyerson L. A. (2015). Biogeography of a plant invasion: plant–herbivore interactions. Ecology 96, 1115–1127. doi: 10.1890/14-1091.1
Csardi G., Nepusz T. (2006). The igraph software package for complex network research. InterJournal Complex Syst. 1695, 1–9. Available at: https://igraph.org.
de Rivera C. E., Steves B. P., Fofonoff P. W., Hines A. H., Ruiz G. M. (2011). Potential for high-latitude marine invasions along western North America. Diversity Distributions 17, 1198–1209. doi: 10.1111/ddi.2011.17.issue-6
Donelan S. C., Miller A. W., Muirhead J. R., Ruiz G. M. (2022). Marine species introduction via reproduction and its response to ship transit routes. Front. Ecol. Environ. 20, 581–588. doi: 10.1002/fee.2551
Drake J. M., Lodge D. M. (2004). Global hot spots of biological invasions: evaluating options for ballast–water management. Proc. R. Soc. London. Ser. B: Biol. Sci. 271, 575–580. doi: 10.1098/rspb.2003.2629
Elton C. (1958). The ecology of invasions by animals and plants (Chicago: University of Chicago Press).
Fine P. V. (2015). Ecological and evolutionary drivers of geographic variation in species diversity. Annu. Rev. Ecology Evolution Systematics 46, 369–392. doi: 10.1146/annurev-ecolsys-112414-054102
Fofonoff P. W., Ruiz G. M., Steves B., Simkanin C., Carlton J. T. (2018). National Exotic Marine and Estuarine Species Information System. Available at: https://invasions.si.edu/nemesis.
Freestone A. L., Carroll E. W., Papacostas K. J., Ruiz G. M., Torchin M. E., Sewall B. J. (2020). Predation shapes invertebrate diversity in tropical but not temperate seagrass communities. J. Anim. Ecol. 89, 323–333. doi: 10.1111/1365-2656.13133
Freestone A. L., Ruiz G. M., Torchin M. E. (2013). Stronger biotic resistance in tropics relative to temperate zone: effects of predation on marine invasion dynamics. Ecology 94, 1370–1377. doi: 10.1890/12-1382.1
Freestone A. L., Torchin M. E., Bonfim M., Jurgens L. J., Lopez D. P., Repetto M. F., et al. (2022). Biomass of experimental marine invertebrate communities across latitude (Competition and Predation across Latitude) (Version 1) [Data set]. Biological and Chemical Oceanography Data Management Office (BCO-DMO). doi: 10.26008/1912/BCO-DMO.862092.1
Freestone A. L., Torchin M. E., Jurgens L. J., Bonfim M., López D. P., Repetto M. F., et al. (2021). Stronger predation intensity and impact on prey communities in the tropics. Ecology 102, e03428. doi: 10.1002/ecy.3428
Godwin L. S. (2003). Hull fouling of maritime vessels as a pathway for marine species invasions to the Hawaiian Islands. Biofouling 19, 123–131. doi: 10.1080/0892701031000061750
Haydar D., Wolff W. J. (2011). Predicting invasion patterns in coastal ecosystems: relationship between vector strength and vector tempo. Mar. Ecol. Prog. Ser. 431, 1–10. doi: 10.3354/meps09170
Hijmans R. J. (2019). Introduction to the "geosphere” package (Version 1.5-10) (Citeseer). Available at: https://CRAN.R-project.org/package=geosphere.
Ho J. (2010). The implications of Arctic sea ice decline on shipping. Mar. Policy 34, 713–715. doi: 10.1016/j.marpol.2009.10.009
Hunt C. E., Yamada S. B. (2003). Biotic resistance experienced by an invasive crustacean in a temperate estuary. Mar. Bioinvasions: Patterns Processes Perspect. 5, 33–43. doi: 10.1023/A:1024011226799
Jurgens L. J., Bonfim M., Lopez D. P., Repetto M. F., Freitag G., Mccann L., et al. (2018). Poleward range expansion of a non-indigenous bryozoan and new occurrences of exotic ascidians in southeast Alaska. BioInvasions Rec 7, 357–366. doi: 10.3391/bir
Kaluza P., Kolzsch A., Gastner M. T., Blasius B. (2010). The complex network of global cargo ship movements. J. R. Soc. Interface 7, 1093–1103. doi: 10.1098/rsif.2009.0495
Keller R. P., Drake J. M., Drew M. B., Lodge D. M. (2011). Linking environmental conditions and ship movements to estimate invasive species transport across the global shipping network. Diversity Distributions 17, 93–102. doi: 10.1111/ddi.2010.17.issue-1
Kimbro D. L., Cheng B. S., Grosholz E. D. (2013). Biotic resistance in marine environments. Ecol. Lett. 16, 821–833. doi: 10.1111/ele.12106
Lavender J. T., Dafforn K. A., Bishop M. J., Johnston E. L. (2017). An empirical examination of consumer effects across twenty degrees of latitude. Ecology 98, 2391–2400. doi: 10.1002/ecy.1926
Levine J. M., Adler P. B., Yelenik S. G. (2004). A meta-analysis of biotic resistance to exotic plant invasions. Ecol. Lett. 7, 975–989. doi: 10.1111/j.1461-0248.2004.00657.x
Liu M., Kronbak J. (2010). The potential economic viability of using the Northern Sea Route (NSR) as an alternative route between Asia and Europe. J. transport Geogr. 18, 434–444. doi: 10.1016/j.jtrangeo.2009.08.004
Lockwood J. L., Cassey P., Blackburn T. (2005). The role of propagule pressure in explaining species invasions. Trends Ecol. Evol. 20, 223–228. doi: 10.1016/j.tree.2005.02.004
López D. P., Freestone A. L. (2021). History of co-occurrence shapes predation effects on functional diversity and structure at low latitudes. Funct. Ecol. 35, 535–545. doi: 10.1111/1365-2435.13725
Lovell R. S. L., Blackburn T. M., Dyer E. E., Pigot A. L. (2021). Environmental resistance predicts the spread of alien species. Nat. Ecol. Evol. 5, 17. doi: 10.1038/s41559-020-01376-x
Maitner B. S., Rudgers J. A., Dunham A. E., Whitney K. D. (2012). Patterns of bird invasion are consistent with environmental filtering. Ecography 35, 614–623. doi: 10.1111/j.1600-0587.2011.07176.x
Marraffini M. L., Ashton G. V., Brown C. W., Chang A. L., Ruiz G. M. (2017). Settlement plates as monitoring devices for non-indigenous species in marine fouling communities. Manage. Biol. Invasions 8, 559–566. doi: 10.3391/mbi
McGee S., Piorkowski R., Ruiz G. (2006). Analysis of recent vessel arrivals and ballast water discharge in Alaska: toward assessing ship-mediated invasion risk. Mar. pollut. Bull. 52, 1634–1645. doi: 10.1016/j.marpolbul.2006.06.005
Miller A. W., Davidson I. C., Minton M. S., Steves B., Moser C. S., Drake L. A., et al. (2018). Evaluation of wetted surface area of commercial ships as biofouling habitat flux to the United States. Biol. Invasions 20, 1977–1990. doi: 10.1007/s10530-018-1672-9
Miller A. W., Ruiz G. M. (2014). Arctic shipping and marine invaders. Nat. Climate Change 4, 413–416. doi: 10.1038/nclimate2244
Mitchell C. E., Agrawal A. A., Bever J. D., Gilbert G. S., Hufbauer R. A., Klironomos J. N., et al. (2006). Biotic interactions and plant invasions. Ecol. Lett. 9, 726–740. doi: 10.1111/j.1461-0248.2006.00908.x
Mittelbach G. G., Schemske D. W., Cornell H. V., Allen A. P., Brown J. M., Bush M. B., et al. (2007). Evolution and the latitudinal diversity gradient: speciation, extinction and biogeography. Ecol. Lett. 10, 315–331. doi: 10.1111/j.1461-0248.2007.01020.x
Moser C. S., Wier T. P., First M. R., Grant J. F., Riley S. C., Robbins-Wamsley S. H., et al. (2017). Quantifying the extent of niche areas in the global fleet of commercial ships: the potential for “super-hot spots” of biofouling. Biol. Invasions 19, 1745–1759. doi: 10.1007/s10530-017-1386-4
Moser C. S., Wier T. P., Grant J. F., First M. R., Tamburri M. N., Ruiz G. M., et al. (2016). Quantifying the total wetted surface area of the world fleet: a first step in determining the potential extent of ships' biofouling. Biol. Invasions 18, 265–277. doi: 10.1007/s10530-015-1007-z
Muirhead J. R., Minton M. S., Miller W. A., Ruiz G. M. (2015). Projected effects of the Panama Canal expansion on shipping traffic and biological invasions. Diversity Distributions 21, 75–87. doi: 10.1111/ddi.12260
National Ballast Information Clearinghouse. (2021). NBIC Online Database. Electronic publication, Smithsonian Environmental Research Center & United States Coast Guard. Available at: http://dx.doi.org/10.5479/data.serc.nbic.
Oksanen J., Blanchet F. G., Friendly M., Kindt R., Legendre P., Mcglinn D., et al. (2022). vegan: community ecology package, Vol. 3. 1–152, R package version 2.5-7. 2020. Available at: https://CRAN.R-project.org/package=vegan.
Outinen O., Bailey S. A., Casas-Monroy O., Delacroix S., Gorgula S., Griniene E., et al. (2024). Biological testing of ships’ ballast water indicates challenges for the implementation of the Ballast Water Management Convention. Front. Mar. Sci. 11, 1334286. doi: 10.3389/fmars.2024.1334286
Pianka E. R. (1966). Latitudinal gradients in species diversity: a review of concepts. Am. Nat. 100, 33–46. doi: 10.1086/282398
R Core Team. (2020). R: A Language and Environment for Statistical Computing. Vienna, Austria: R Foundation for Statistical Computing. Available at: https://www.R-project.org/.
Roslin T., Hardwick B., Novotny V., Petry W. K., Andrew N. R., Asmus A., et al. (2017). Higher predation risk for insect prey at low latitudes and elevations. Science 356, 742–744. doi: 10.1126/science.aaj1631
Ruiz G. M., Fofonoff P. W., Carlton J. T., Wonham M. J., Hines A. H. (2000). Invasion of coastal marine communities in North America: Apparent patterns, processes, and biases. Annu. Rev. Ecol. Systematics 31, 481–531. doi: 10.1146/annurev.ecolsys.31.1.481
Ruiz G. M., Fofonoff P. W., Steves B. P., Carlton J. T. (2015). Invasion history and vector dynamics in coastal marine ecosystems: A North American perspective. Aquat. Ecosystem Health Manage. 18, 299–311. doi: 10.1080/14634988.2015.1027534
Ruiz G. M., Fofonoff P. W., Steves B., Foss S. F., Shiba S. N. (2011). Marine invasion history and vector analysis of California: a hotspot for western North America. Diversity Distributions 17, 362–373. doi: 10.1111/j.1472-4642.2011.00742.x
Ruiz G. M., Torchin M. E., Grant K. (2009). Using the Panama Canal to test predictions about tropical marine invasions. Smithsonian Contributions to Mar. Sci. 38, 291–300.
Sardain A., Sardain E., Leung B. (2019). Global forecasts of shipping traffic and biological invasions to 2050. Nat. Sustainability 2, 274–282. doi: 10.1038/s41893-019-0245-y
Sax D. (2001). Latitudinal gradients and geographic ranges of exotic species: implications for biogeography. J. Biogeography 28, 139–150. doi: 10.1046/j.1365-2699.2001.00536.x
Schemske D. W., Mittelbach G. G., Cornell H. V., Sobel J. M., Roy K. (2009). Is there a latitudinal gradient in the importance of biotic interactions? Annu. Rev. Ecol. Evol. Syst. 40, 245–269. doi: 10.1146/annurev.ecolsys.39.110707.173430
Seebens H., Blackburn T. M., Dyer E. E., Genovesi P., Hulme P. E., Jeschke J. M., et al. (2018). Global rise in emerging alien species results from increased accessibility of new source pools. Proc. Natl. Acad. Sci. 115, E2264–E2273. doi: 10.1073/pnas.1719429115
Seebens H., Briski E., Ghabooli S., Shiganova T., Macisaac H. J., Blasius B. (2019). Non-native species spread in a complex network: the interaction of global transport and local population dynamics determines invasion success. Proc. R. Soc. B 286, 20190036. doi: 10.1098/rspb.2019.0036
Seebens H., Essl F., Dawson W., Fuentes N., Moser D., Pergl J., et al. (2015). Global trade will accelerate plant invasions in emerging economies under climate change. Global Change Biol. 21, 4128–4140. doi: 10.1111/gcb.13021
Seebens H., Gastner M., Blasius B. (2013). The risk of marine bioinvasion caused by global shipping. Ecol. Lett. 16, 782–790. doi: 10.1111/ele.12111
Seebens H., Schwartz N., Schupp P. J., Blasius B. (2016). Predicting the spread of marine species introduced by global shipping. Proc. Natl. Acad. Sci. 113, 5646–5651. doi: 10.1073/pnas.1524427113
Simberloff D. (2009). The role of propagule pressure in biological invasions. Annu. Rev. Ecology Evolution Systematics 40, 81–102. doi: 10.1146/annurev.ecolsys.110308.120304
Simkanin C., Fofonoff P. W., Larson K., Lambert G., Dijkstra J. A., Ruiz G. M. (2016). Spatial and temporal dynamics of ascidian invasions in the continental United States and Alaska. Mar. Biol. 163.
Stachowicz J. J., Bruno J. F., Duffy J. E. (2007). Understanding the effects of marine biodiversity on communities and ecosystems. Annu. Rev. Ecol. Evol. Syst. 38, 739–766. doi: 10.1146/annurev.ecolsys.38.091206.095659
Stachowicz J. J., Fried H., Osman R. W., Whitlatch R. B. (2002). Biodiversity, invasion resistance, and marine ecosystem function: reconciling pattern and process. Ecology 83, 2575–2590. doi: 10.1890/0012-9658(2002)083[2575:BIRAME]2.0.CO;2
Sylvester F., Kalaci O., Leung B., Lacoursière-Roussel A., Murray C. C., Choi F. M., et al. (2011). Hull fouling as an invasion vector: can simple models explain a complex problem? J. Appl. Ecol. 48, 415–423. doi: 10.1111/j.1365-2664.2011.01957.x
Torchin M. E., Freestone A. L., Mccann L., Larson K., Schlöder C., Steves B. P., et al. (2021). Asymmetry of marine invasions across tropical oceans. Ecology 102, e03434. doi: 10.1002/ecy.3434
Tyberghein L., Verbruggen H., Pauly K., Troupin C., Mineur F., De Clerck O. (2012). Bio-ORACLE: a global environmental dataset for marine species distribution modelling. Global Ecol. Biogeography 21, 272–281. doi: 10.1111/j.1466-8238.2011.00656.x
Verling E., Ruiz G. M., Smith L. D., Galil B., Miller A. W., Murphy K. R. (2005). Supply-side invasion ecology: characterizing propagule pressure in coastal ecosystems. Proc. R. Soc. B: Biol. Sci. 272, 1249–1257. doi: 10.1098/rspb.2005.3090
Wonham M. J., Byers J. E., Grosholz E. D., Leung B. (2013). Modeling the relationship between propagule pressure and invasion risk to inform policy and management. Ecol. Appl. 23, 1691–1706. doi: 10.1890/12-1985.1
Keywords: biofouling, biogeographic gradients, biotic interaction hypothesis, experimental macroecology, marine invertebrates, marine traffic, Pacific Ocean, predation
Citation: Bonfim M, Bunson SL, Sellers AJ, Torchin ME, Ruiz GM and Freestone AL (2024) Biogeographic variation in environmental and biotic resistance modifies predicted risk of marine invasions by ships. Front. Mar. Sci. 11:1374887. doi: 10.3389/fmars.2024.1374887
Received: 22 January 2024; Accepted: 13 June 2024;
Published: 17 July 2024.
Edited by:
Clara Belen Giachetti, CONICET Instituto de Biología de Organismos Marinos (IBIOMAR), ArgentinaReviewed by:
Nicolás Battini, National Scientific and Technical Research Council (CONICET), ArgentinaAdriana Giangrande, University of Salento, Italy
Copyright © 2024 Bonfim, Bunson, Sellers, Torchin, Ruiz and Freestone. This is an open-access article distributed under the terms of the Creative Commons Attribution License (CC BY). The use, distribution or reproduction in other forums is permitted, provided the original author(s) and the copyright owner(s) are credited and that the original publication in this journal is cited, in accordance with accepted academic practice. No use, distribution or reproduction is permitted which does not comply with these terms.
*Correspondence: Mariana Bonfim, bWFyaWFuYS5ib25maW1AdGVtcGxlLmVkdQ==
†Present address: Samuel L. Bunson, University of South Florida College of Marine Science, St. Petersburg, FL, United States