Abstract
Florida’s coral reefs are facing a multi-year outbreak of stony coral tissue loss disease (SCTLD) with dramatic consequences for coral communities. However, potential anthropogenic and environmental drivers of SCTLD progression and severity remain poorly understood. This study was designed to determine the potential impacts of nutrient amendments on the progression and spread of SCTLD on reefs in Southeast Florida. In situ fertilizer amendments with 30 g of Osmocote™ slow-release fertilizer were used to mimic the effects of agricultural and urban runoff. Fifteen healthy and thirty SCTLD-affected Montastraea cavernosa coral colonies were tagged and divided into three experimental groups: apparently healthy colonies, SCTLD-affected nutrient-amended colonies, and SCTLD-affected control colonies. SCTLD lesion progression, coral tissue loss, and disease prevalence were tracked over a 30-day nutrient amendment period and for an additional 40 days after nutrient amendment removal to determine if there were any latent or recovery effects. Coral tissue loss was tracked over time using Structure-from-Motion photogrammetry and disease prevalence was recorded from diver surveys within a 3-m radius surrounding five centroid colonies from each experimental group. Throughout the experiment, temperature, nutrient concentrations, and SCTLD status of the coral colonies were also monitored. Ultimately, we observed no significant differences in SCTLD progression or surrounding SCTLD prevalence between the nutrient-amended and control groups, suggesting that nutrient amendment had no effect on SCTLD severity during this experiment in Southeast Florida.
1 Introduction
With rising ocean temperatures, nutrient pollution, and overfishing driving ecological phase shifts, remaining coral communities have become increasingly stressed and susceptible to coral disease outbreaks (Green and Bruckner, 2000; Burke et al., 2011; Lafferty and Harvell, 2014). Limited reef monitoring, the abundance of anthropogenic stressors, and properties inherent to the coral holobiont (e.g., microbiomes) often make it difficult to determine the origin of newly-discovered coral diseases or environmental conditions that may exacerbate disease (Bourne et al., 2009). Throughout the Caribbean, coral diseases often exhibit spatial and temporal variation and affect different species regionally and seasonally, possibly due to differing environmental conditions across reefs (Weil, 2004). Experimental and observational studies have linked warming ocean temperatures to both coral diseases and coral bleaching events. For example, both white band disease and black band disease outbreaks have both been observed following bleaching events driven by high thermal anomalies (Burke et al., 2011; Van Woesik and Randall, 2017; Chaves-Fonnegra et al., 2021). While there is evidence that temperature stress may drive increased coral disease incidence, severity, and/or progression, the effect of other anomalous environmental factors and the interaction with the coral holobiont leading to coral diseases is still poorly understood (Richardson, 1998; Kuta and Richardson, 2002; Pollock et al., 2011; Vega Thurber et al., 2020).
Stony coral tissue loss disease (SCTLD) was first characterized in Florida off the coast of Miami-Dade County in 2014 following two bleaching events in September 2014, and the Port of Miami dredging project (Precht et al., 2016; Precht, 2021). This disease has since spread throughout the entirety of Florida’s Coral Reef, reaching even the remote areas of the Dry Tortugas in the spring of 2021 (Kramer et al., 2019). SCTLD has also spread to coral reefs in multiple countries throughout the tropical western Atlantic (Kramer et al., 2022). This rapid spread of SCTLD across wide geographic regions is attributed to the disease’s waterborne transmission (Aeby et al., 2019), demonstrated by tank transmission experiments and corroborated with ocean current modeling (Dobbelaere et al., 2020; Muller et al., 2020; Meiling et al., 2021). Sediments have also been identified as a potential vector (Studivan et al., 2022). Similar to many other coral diseases, a pathogen has yet to be identified for SCTLD and few clear links have been identified between SCTLD prevalence or severity and environmental factors (Aeby et al., 2019; Muller et al., 2020; Meiling et al., 2021; Papke et al., 2023). Unlike many other marine diseases, evidence for a relationship between SCTLD severity/prevalence and temperature is highly mixed and visual signs of SCTLD often vary on individual colonies, throughout the year, with visible waxing and waning of lesions (Aeby et al., 2019; Muller et al., 2020; Shilling et al., 2021; Hayes et al., 2022). Increased SCTLD prevalence and progression have been positively correlated to sea surface temperatures (Walton et al., 2018; Jones et al., 2021; Walker et al., 2021). However, others have reported SCTLD prevalence decreased with increasing coral bleaching prevalence and temperature stress (Meiling et al., 2020; Sharp et al., 2020; Williams et al., 2021). Additional studies found no correlation between SCTLD prevalence or progression with temperature variation (Aeby et al., 2019; Hayes et al., 2022).
Several experimental studies have provided evidence for nutrient enrichment driving increased prevalence or severity of various other coral diseases or syndromes using nutrient amendment approaches. In Mexico, Bruno et al. (2003), artificially enriched ambient seawater around Gorgonia ventalina sea fans, Orbicella franksi, and O. annularis coral colonies by attaching bags containing 30 g of Osmocote™ slow-release fertilizer, replacing fertilizer bags every 5-7 days for 90 days, and observed an increase in progression of aspergillosis on sea fans and yellow-band disease on stony corals. Voss and Richardson (2006) attached bags of 15 g of Osmocote™ onto Siderastrea siderea coral colonies in the Bahamas for 30 days, replaced the fertilizer every 5 days, and observed an increase in black band disease progression. In the Florida Keys, Vega Thurber et al. (2014), conducted a similar experiment in which 9 m2 plots of reef were treated with 175 g of Osmocote™ slow-release fertilizer, using PVC nutrient diffusers, replacing diffusers every month over three years, in which they observed an increase of dark spot syndrome prevalence and severity on S. siderea and coral bleaching on Agaricia spp. within the enrichment plots (Vega Thurber et al., 2014). However, in a five-day ex situ nutrient enrichment experiment using 25 g of Osmocote™ slow-release fertilizer, nutrients did not have a significant effect on dark spot syndrome prevalence in S. siderea, but did increase bleaching prevalence (Gochfeld et al., 2006).
Proximity to nutrient-rich sewage outfalls has also been linked to increased coral disease levels including increased black band disease prevalence in the U.S. Virgin Islands (Kaczmarsky et al., 2005) and white pox disease prevalence in the Florida Keys (Sutherland et al., 2010). In Florida and the U.S. Virgin Islands, reefs with relatively high SCTLD prevalence had enriched ammonium levels in the water column, potentially from the sloughing of the diseased tissue (Becker et al., 2023, 2024). Overall, the decline of water quality, specifically within Southeast Florida and the Florida Keys has been correlated with decreases in coral reef resilience to bleaching and disease, increased coral reef stress, and degradation in reef health (Lapointe et al., 2019; Whitall et al., 2019).
The primary goal of this study was to assess the potential effect of excess nutrient availability on SCTLD severity and prevalence through a controlled, in situ experiment. By combining high frequency coral disease surveys and in situ temperature monitoring, the study also targeted a secondary goal of assessing the potential relationship between SCTLD and thermal stress. Understanding the role of nutrients can determine if additional efforts to improve water quality can help to reduce SCTLD impacts, or if resources should be allocated to alternative management efforts to slow the spread and progression of SCTLD.
2 Methods
Apparently healthy and SCTLD-affected coral colonies were identified within a 200 x 50 m area ~200 m off the coastline of Lauderdale-by-the-Sea, Florida in September 2021 (Figure 1). Thirty SCTLD-affected Montastraea cavernosa colonies were selected based on visual signs of acute or subacute lesions. All selected colonies exhibited the typical signs of SCTLD, including bleached tissue borders surrounding areas of recent acute tissue loss. SCTLD-affected colonies with sufficient tissue remaining (>100 cm2) were selected so that during the 10-week experiment these colonies would be unlikely to experience complete mortality, providing response data for each timepoint. Histology has described SCTLD necrosis as first affecting the basal body wall before presenting at the coral tissue surface as a lesion (Landsberg et al., 2020). Therefore, for this experiment corals that were visibly healthy were selected as apparently healthy colonies, hereafter referred to as “healthy.” The 15 healthy colonies had similar live tissue area to the SCTLD-affected coral colonies but showed no grossly visible signs of bleaching, paling, past, or present tissue loss. Each coral colony in the experiment was at least 3 m away from other experimental coral colonies to reduce any potential influence of nutrient amendments on control colonies, following similar experimental methods in the literature (Bruno et al., 2003; Voss and Richardson, 2006). Water samples were collected and paired with coral disease surveys before any nutrient amendments were added to quantify baseline nutrient and disease levels. Each SCTLD-affected colony had a nail placed 5 cm from the healthy tissue margin of a SCTLD lesion along with two reference nails each placed 2 cm from the SCTLD lesion (Figure 2). Fifteen SCTLD-affected colonies were randomly assigned to the nutrient-amended group and the remaining fifteen colonies were assigned as the control group.
Figure 1
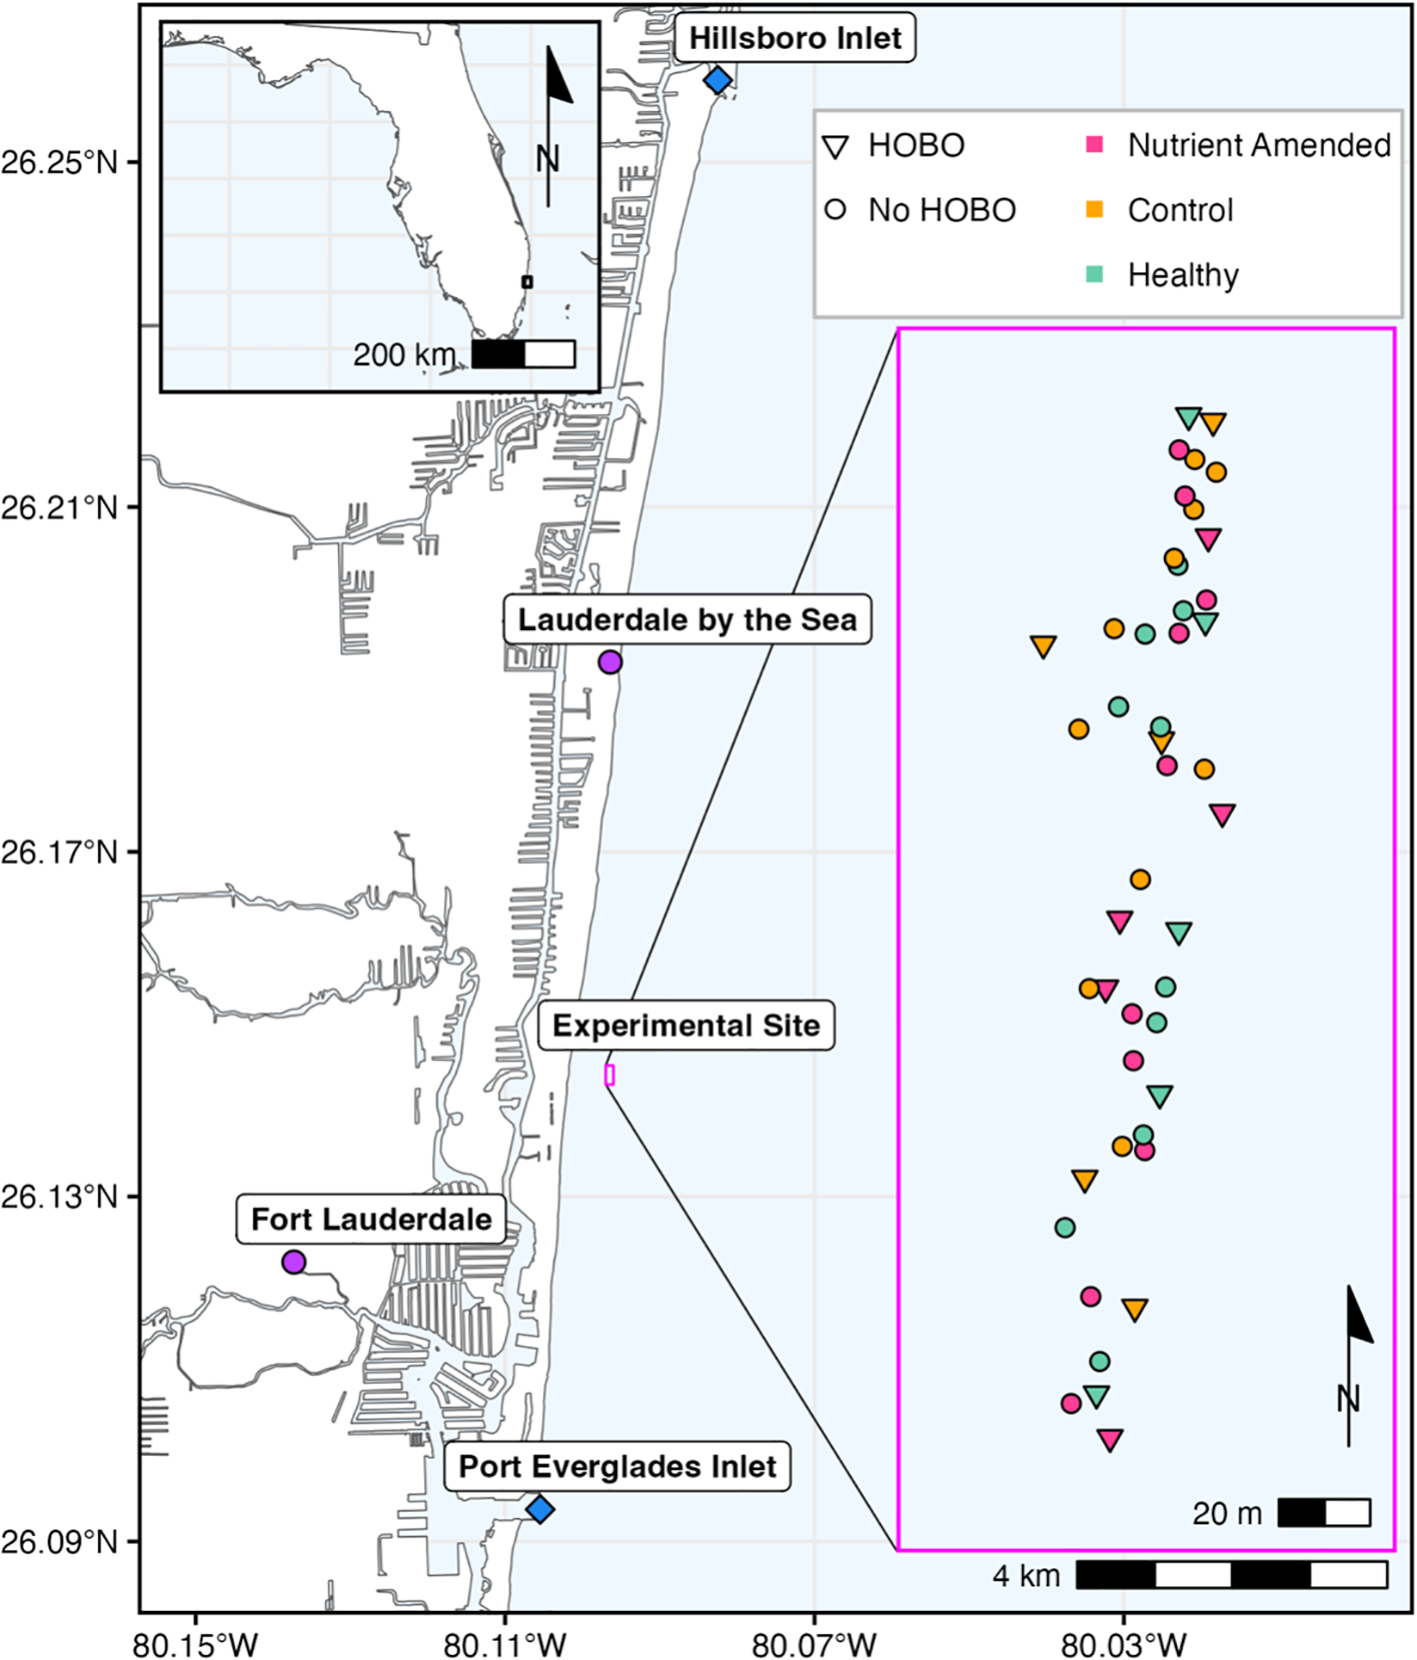
Experimental site, off Fort Lauderdale, FL between the Port Everglades and Hillsboro Inlets (indicated by blue diamonds). The map insert represents the Montastraea cavernosa coral colonies that were tagged and mapped via diver-towed GPS. The red points represent the nutrient-amended colonies (n=15), the orange points represent the control colonies (n=15), and the green points represent the apparently healthy colonies (n=15). The triangles represent the centroid colonies where HOBO loggers were placed, water samples were taken, and disease prevalence surveys were conducted. All colonies were ≥ 3 m apart from one another.
Figure 2
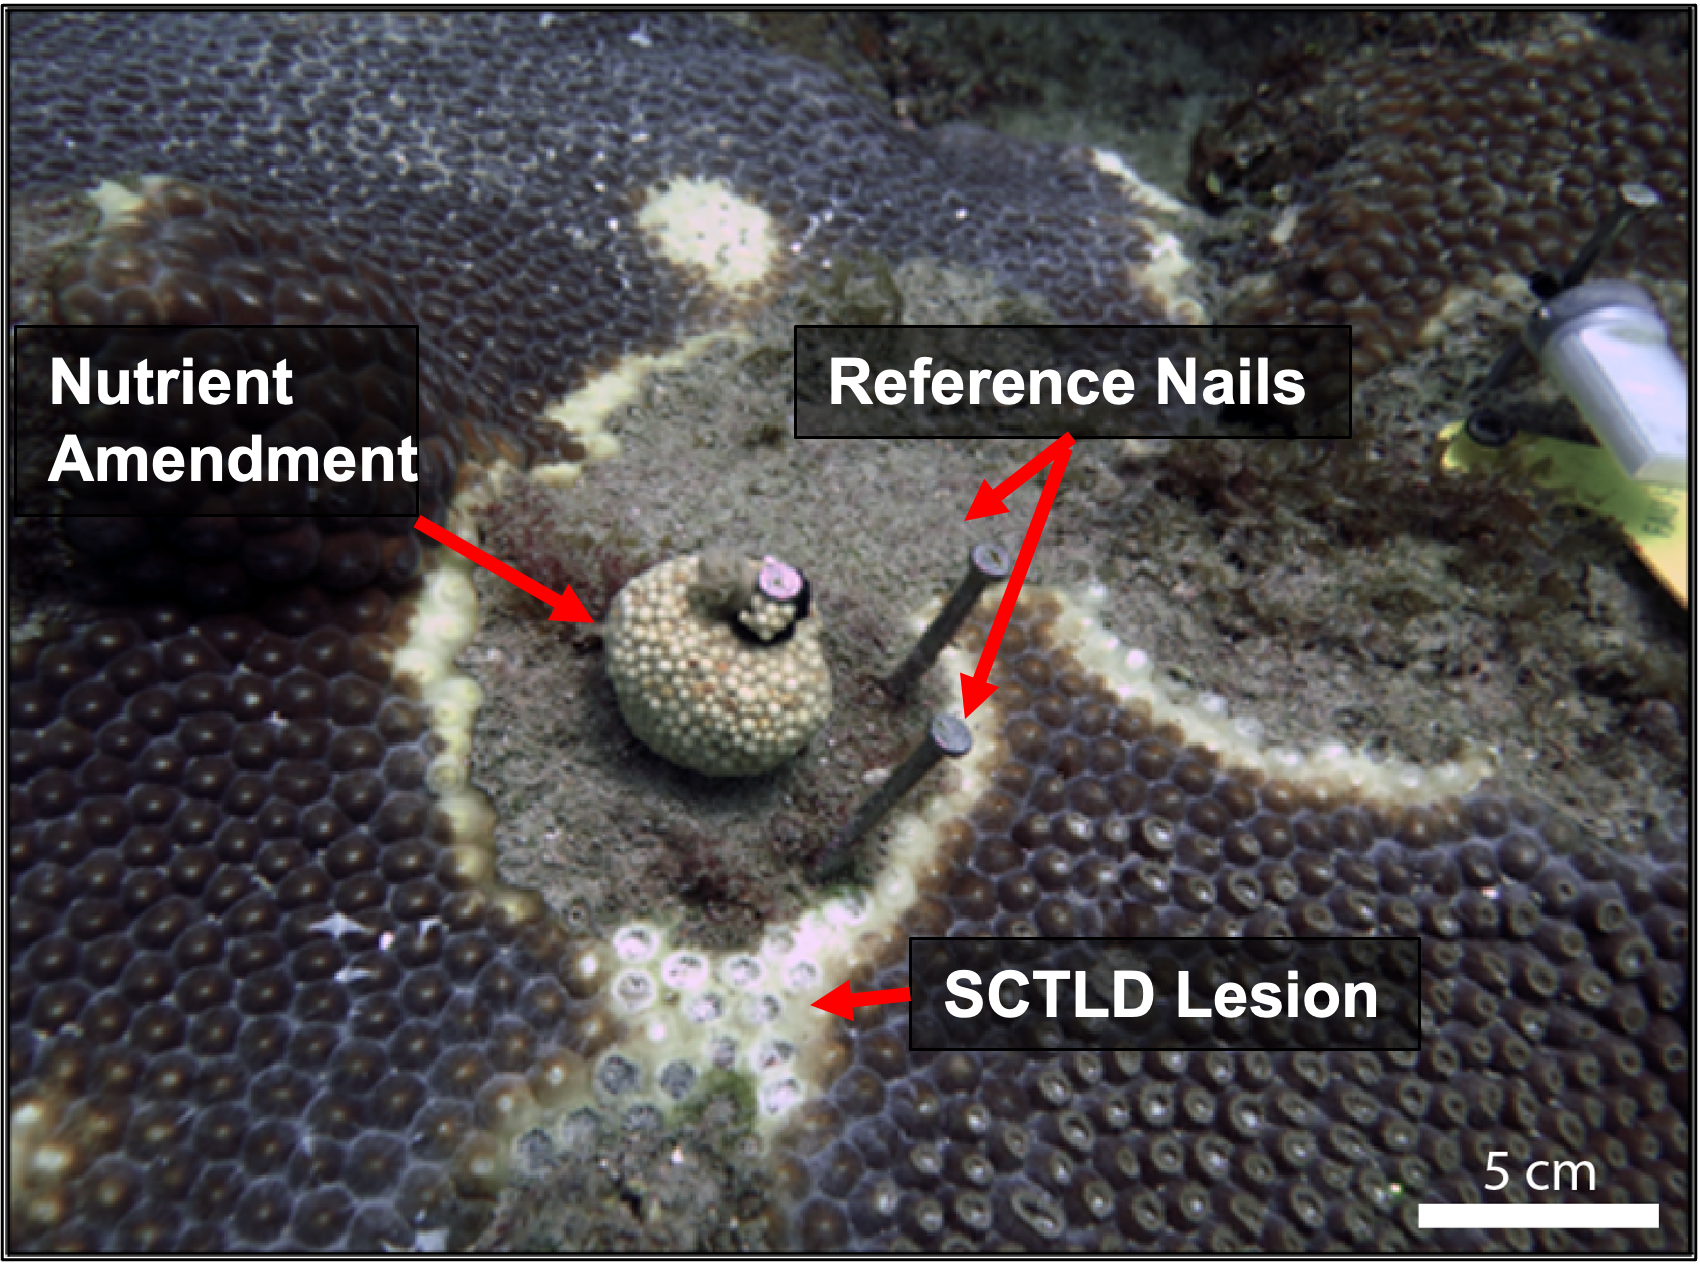
Small nylon mesh packets containing 30g of Osmocote™ 19-6-12 were applied to corals as shown, 5 cm away from an active SCTLD lesion. Reference nails were used to track SCTLD linear lesion progression.
The experiment was initiated on 22 September 2021. On each of the nutrient-amended colonies, a nylon mesh bag, made from polyester knee-high stockings, was filled with 30 g of coated Osmocote™ 19-6-12, N-P-K (19% total nitrogen (N)3 – [10% ammoniacal nitrogen (N-NH4) and 9% nitrate nitrogen (N-NO3)], 6% available phosphate (P2O5)3, and 12% soluble potash (K2O)3 [potassium]) slow-release fertilizer (Worm et al., 2000) and attached to the primary reference nail with a zip-tie, following previously described methods (Bruno et al., 2003; Voss and Richardson, 2006; Figure 2). This amount of fertilizer was shown in earlier studies to increase nutrient concentrations surrounding amended colonies within the range of anthropogenically enriched levels on coral reefs without exceeding maximum levels reported along Southeast Florida (Costa et al., 2000; Bruno et al., 2003; Dinsdale et al., 2008; Whitall et al., 2019). Control colonies received empty nylon bags zip-tied to their primary reference nail to control for any effect that the bag, nails, or diver visits might have on the coral colonies. Both the fertilizer-filled bags and empty control bags were replaced every 3–5 days to simulate ongoing nutrient pollution (Bruno et al., 2003; Voss and Richardson, 2006). The nutrient amendments continued for 30 days and were removed on 22 October 2021 (Figure 3). Monitoring continued twice over 40 days, from 22 November to 1 December to evaluate any potential latent effects and/or colony recovery.
Figure 3
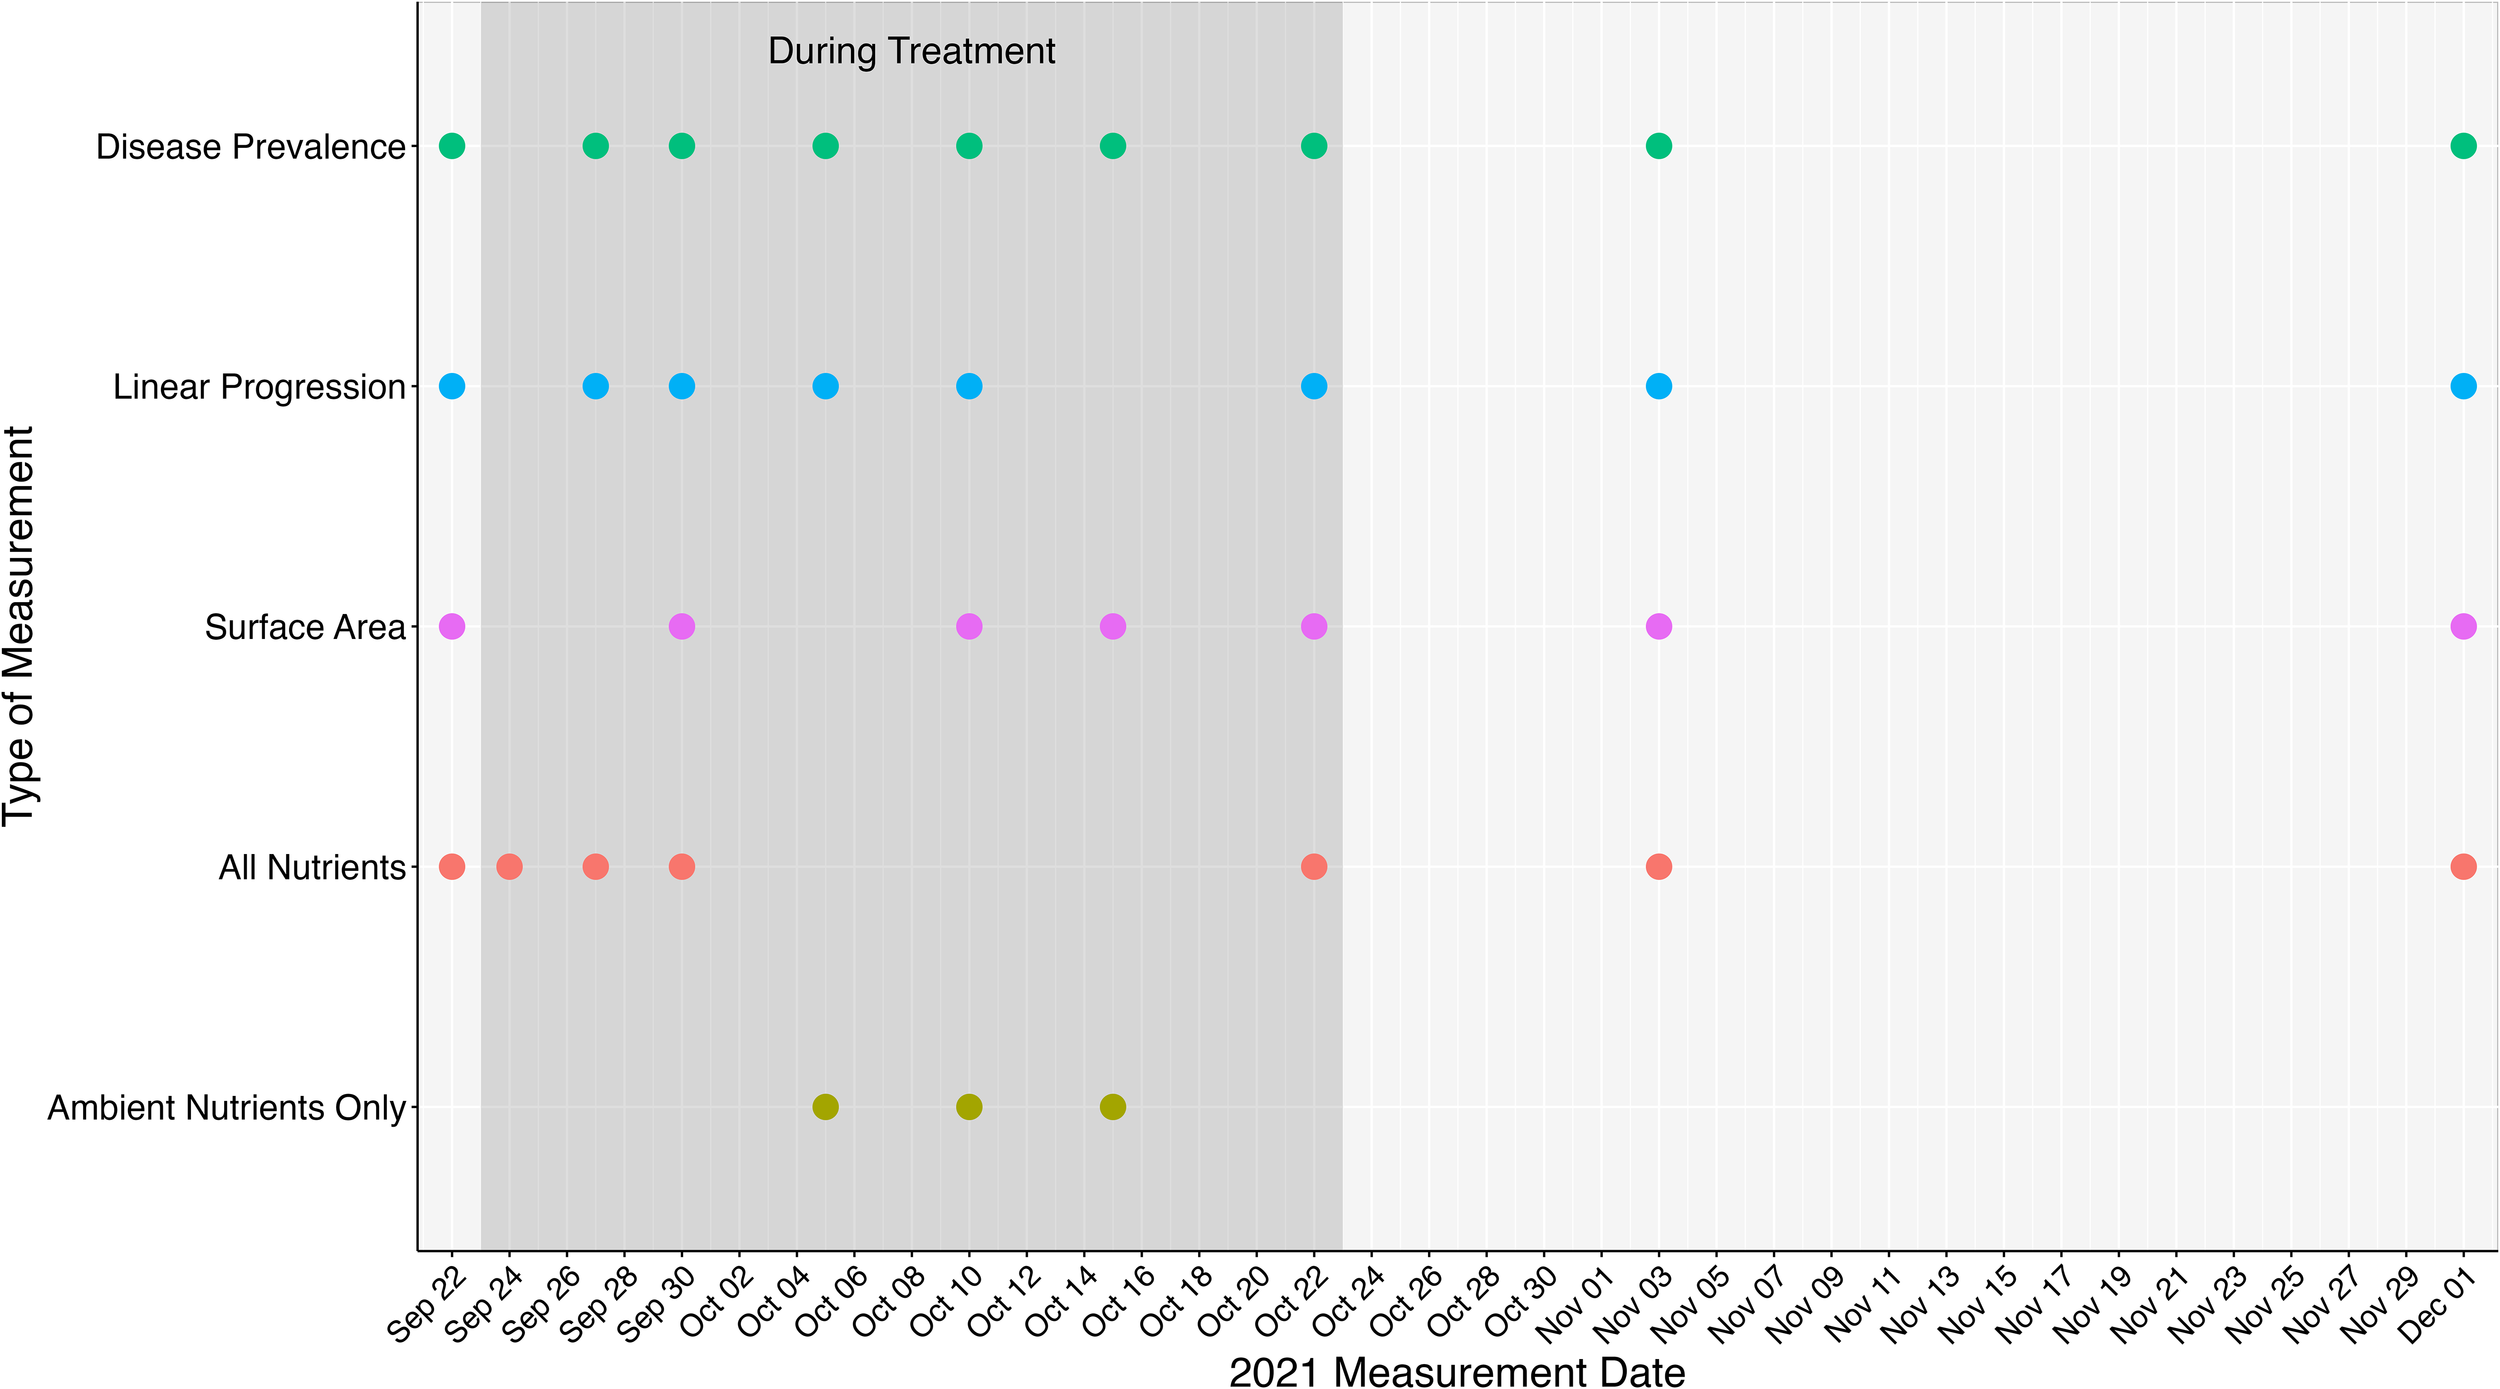
Dates measurements were taken throughout the experiment. The shaded box represents the dates and measurements collected when nutrient amendments were deployed (Sept 24 – Oct 22). Disease prevalence represents the dates disease prevalence surveys were conducted. Linear progression represents the days when nail to lesion measurements were taken. Surface area represents dates when structure from motion photogrammetry was conducted. All nutrients represents when water samples were taken above each experimental group (nutrient-amended, control, and healthy). Ambient nutrients only represent water samples were taken above healthy colonies only.
All statistical analyses were run using R statistical software, version 7.1.554 (R Core Team, 2018). Figures were made using the ggplot2 package (Wickham and Chang, 2014). All data were tested for normality by running the Shapiro-Wilk test in the rstatix package (Kassambara, 2020). Log transformation was attempted to improve normality metrics and used when successful. A t-Test was performed to assess if initial colony sizes were different between nutrient-amended and control colonies using the function t.test from the stats package (R Core Team, 2018). When assessing potential correlations exclusively between SCTLD activity and other environmental factors “SCTLD-affected colonies” (nutrient-amended and control) were combined based on SCTLD status, and healthy colonies were left out of these analyses as they remained healthy throughout the experiment.
2.1 Water sampling
Five colonies in each of the experimental groups (healthy, nutrient-amended, and control) were chosen haphazardly to serve as the centroids for point locations of water collections, 3-m radius disease prevalence surveys, and locations for Onset HOBO Pendant Temperature/Light 64k Data Logger (Part # UA-002-64) deployments. Water samples were collected ~10 cm above the centers of five colonies from each of the experimental groups: nutrient-amended, control, and healthy (n = 5 per group; Voss and Richardson, 2006; Vega Thurber et al., 2014), which resulted in measurements 25–100 cm away from the nutrient bags. Water was collected with an acid-washed 60 mL needleless syringe prior to nutrient amendment and repeated at 1 h, 2 days, 3 days, and 5 days during the nutrient amendment treatment and twice after the final removal of the nutrient amendments (Figure 3). This was done to measure nutrient concentrations directly around each nutrient-amended colony, as well as any changes in ambient conditions surrounding control and healthy colonies. Water samples were filtered through 25 mm diameter, 0.7 µm-pore, glass microfiber filters within 15 min of collection. From this, 30 mL of the filtered water was frozen and analyzed at the University of Maryland’s Chesapeake Biological Laboratory. Phosphorus, ammonium, and combined nitrate and nitrite concentrations were measured for all water samples. A second nutrient amendment test was initiated in March 2023 where five colonies were haphazardly chosen to serve as a control and experimental group and the experimental colonies were amended in the same way as the 2021 experiment. However, water samples were collected 5 cm from the nutrient-amended bags at 1 hr, 1 day, 3 day, and 5 day timepoints in order to determine if there was an effect of sampling distance on nutrient concentrations. These and the ambient water samples were processed the same as during the experimental phase, as described above.
The dissolved inorganic nitrogen to soluble reactive phosphorous (DIN: SRP) ratios were calculated (Table 1) to compare against the Redfield ratio of 16:1. Two-way mixed analysis of variance (ANOVAs) were used to look at between subject factors (treatment groups) and within-subject factors (time) throughout the analysis. Two-way mixed ANOVAs were performed using the function anova_test from the package rstatix on all nutrients, including DIN: SRP ratios, to assess the potential effects of experimental group, timepoint, and the interaction of the two on the variation in nutrient concentrations/ratios (R Core Team, 2018). For all ANOVA tests generalized Eta squared values () were also reported to better understand the effect size of the factors (Olejnik and Algina, 2003), using guidelines from Cohen (1988), with 0.02 as small, 0.13 as medium, and 0.26 as large effect size parameters (Cohen, 1988). Local rainfall data available from the South Florida Water Management District was utilized for Broward County at 24-hour periods (South Florida Water Management District’s corporate environmental database). To understand the correlation of rainfall to DIN: SRP ratios a Pearson’s correlation test using the function cor.test from the stats package was performed (R Core Team, 2018). The average rainfall between timepoints was taken, for timepoints ≥10 days apart the average rainfall was calculated from the previous seven days before the timepoint. All nutrient measurements from the second amendment trial, except for the DIN: SRP ratios, were log-transformed for analyses. To assess the differences between nutrient levels at closer sampling distances, two-way mixed ANOVAs were performed followed by pairwise post hoc tests using the pairwise_t_test function from the rstatix package with Bonferroni correction (R Core Team, 2018).
Table 1
| Calculation | Equation |
|---|---|
| Proportion of change in healthy tissue area | |
| Rate of change in healthy tissue area per day | |
| Proportional rate of change in healthy tissue area per day | |
| Rate of change in linear lesion progression per day | |
| Proportional rate of change in linear lesion progression per day | |
| Proportion of change in healthy tissue area over experimental phase | |
| Change in linear progression over experimental phase | |
| DIN: SRP ratio |
Equations used to calculate change in tissue areas, lesion progression, and the DIN: SRP ratio.
The number of days in between measurements is represented by d and the timepoint represented by T.
2.2 Tracking disease progression
Divers measured the linear progression of each disease lesion on all SCTLD-affected colonies every 3–5 days during treatment and twice afterward (Figure 3). Measurements were taken by resting a ruler on the nail with the nylon bag attached and each one of the two other reference nails to ensure that the same points are being measured at each timepoint (Voss and Richardson, 2006).
At the start of the experiment, 3–5 days during the experiment, and twice after nutrients were removed (Figure 3), 3D models were generated for each nutrient-amended colony and each control colony via scaled 3D Structure-from-Motion (SfM) photogrammetry to determine the rate of tissue loss (Combs et al., 2021). No models were generated for the healthy colonies as these colonies did not experience any tissue loss throughout the experiment. A Canon 6D mkII DSLR camera with a 24 mm lens in an Ikelite underwater housing was used to capture one still image every second. Scale bars were placed on each side of the coral colony and the diver swam approximately 1 m above the highest point of the colony following a lawnmower pattern and circling the colony, capturing photos at two different angles (45°and 90°), following a similar protocol to Young et al. (2018). Overlapping runs were oriented to achieve 60–80% overlap in the images. Images were imported into Agisoft Metashape Pro (Version 1.7.2, Agisoft LLC) for generation of 3D models through a four-step process: 1. Camera alignment, 2. Dense point cloud generation, 3. Mesh generation, 4. Texture overlay. The resulting 3D models were then imported into Rhinoceros 3D (Robert McNeel & Associates) for analysis (Young et al., 2018; Combs et al., 2021). The models were scaled using the scale bars and verified using the two additional scale markers with fixed distances. Of the 30 colonies captured throughout the experiment, four colonies were removed, (two controls and two nutrient-amended colonies) due to failure during QA/QC checks after 3D model generation. All subsequent analyses were completed using 26 colonies for all timepoints. On all models, the total visually healthy tissue was traced by hand in the program Rhinoceros 3D (Robert McNeel & Associates). A drape and mesh were laid over the entire colony, and the traced healthy area was selected to measure the surface area (mm2) using the area function (Young et al., 2018; Combs et al., 2021).
The proportion of change in healthy tissue area was calculated by subtracting the area of each subsequent timepoint from the previous and dividing by the total area of the previous timepoint (Table 1). The distribution of change in initial area proportion from the control and experimental colonies was not significantly different from the normal distribution, and a two-way mixed ANOVA was performed using the anova_test function from the rstatix package (Kassambara, 2020). Rate of change measurements were derived by taking the subsequent timepoint subtracted by the previous timepoint and dividing by the number days in between the two (Table 1). The proportional rate of change in healthy tissue area per day was calculated by taking the log of the subsequent timepoint divided by the previous timepoint and then dividing by the number of days between the two and used for analysis (Table 1). Linear lesion progression measurements were calculated by averaging together the measured two nail-to-lesion distances. The proportional rate of change in linear lesion progression per day were then calculated similarly to the healthy tissue area proportional rates and used for analysis (Table 1). Two-way mixed ANOVAs were performed, as above, to assess the effect of treatment group, timepoint, and their interactions on change in healthy tissue area, proportional rate of change in healthy tissue area per day, and proportional rate of change in linear lesion progression rates. The proportion of change in healthy tissue area over experimental phase; during treatment, post-treatment, and over the entire experiment were calculated (Table 1). Linear lesion progression over experimental phase (during treatment, post-treatment, and entire experiment) was also calculated by taking the average distance at the end of treatment and subtracting it from the initial distance (Table 1). To assess if experimental phase and treatment group interactions had any effect on change in area proportion change or linear lesion progression a two-way ANOVAs were performed followed by pairwise t.test post hoc analyses on statistically significant results.
2.3 Assessing SCTLD activity
During the treatment phase of the experiment, every 3–5 days, divers also conducted visual assessments of all the tagged colonies. The assessments included photographing and noting the health status of the colonies (active SCTLD, inactive SCTLD, or apparently healthy). Once the treatment was removed, assessments continued twice afterward on November 3 and December 1, 2023.
The analysis assessing the effects of SCTLD status was completed using colonies from the experimental and control groups, healthy colonies were not included as they remained apparently healthy throughout the entirety of the experiment. A generalized linear mixed model using the package glmmTMB was performed to assess the effects of treatment group, time, and the interaction of the two on the proportion of active SCTLD colonies, as well as the interaction effect of SCTLD active status and time on the change in area proportion, with colony ID as a random factor (Brooks et al., 2017). To understand the effects in the model a type III ANOVA was performed with the car package (Fox et al., 2023). For all models that identified significant interactions, a Tukey’s post hoc analysis was performed using the function glht (general linear hypothesis) from the multcomp package (Hothorn et al., 2008).
2.4 Monitoring SCTLD prevalence
To comply with permitting requirements and ensure that this experiment did not cause an SCTLD outbreak, we tracked SCTLD prevalence in the immediate area surrounding the centroid colonies (Figure 1). The surveys were conducted at the same intervals as SCTLD activity assessments (Figure 3). Within each 3-m radius survey area, divers counted, identified to the species level, and recorded the health status of all coral colonies ≥10 cm in diameter.
From the SCTLD monitoring data, SCTLD prevalence was calculated. A two-way mixed ANOVA was performed as above to assess the interactive effects of timepoint and experimental group (nutrient-amended vs. control vs. healthy; combined SCTLD-affected vs. healthy) on surrounding SCTLD prevalence. To assess changes in temperature throughout the experiment, a generalized linear model using the function glm from the stats package was performed (R Core Team, 2018), including Tukey’s post hoc analysis. Potential correlation between temperature and SCTLD prevalence were assessed using Pearson’s correlation in the function cor.test (R Core Team, 2018).
3 Results
The mean initial tissue area in the control group was 3,967 cm2 and 3,585 cm2 for the experimental group. For all colonies within the nutrient-amended and control group the mean initial tissue area was 3,781 ± 2,639 cm2 (mean ± SD), ranging from 183 – 11,216 cm2. There was no significant difference in the starting colony size between the nutrient-amended and control groups (t (23.501) = 0.353, p = 0.727).
3.1 Effect of treatment and time on nutrient concentrations
Time had a significant effect with a relatively large effect size on the levels of nitrate + nitrite (mixed ANOVA: F6,48 = 115.092, p< 0.001, = 0.915), ammonium (mixed ANOVA: F6,48 = 5.035, p = 0.004, = 0.349), phosphate (mixed ANOVA: F6,48 = 13.292, p < 0.001, = 0.582) and DIN: SRP ratios (mixed ANOVA: F6,48 = 8.720, p < 0.001, = 0.485). However, there was no significant effect of treatment group on nutrient levels nor any significant interaction effect of treatment group and timepoint. Post hoc tests revealed nitrate + nitrite to be significantly different at almost every timepoint besides the second sampling intervals (5 days post amendment and 1 hr post amendment), ammonium and the DIN: SRP ratios were significantly higher at the initial timepoint (pre-amendment) compared to most other sampling dates, and phosphate was significantly elevated at the last time point (no amendment) compared to all earlier timepoints (p < 0.001; Figure 4; Supplementary Figure S1). When nutrient samples were taken during the second amendment trial in 2023, from a 5 cm distance from the nutrient amendments, we found a significant difference in nitrate + nitrite levels (mixed ANOVA: F3,24 = 4.044, p = 0.018, = 0.274) and ammonium (mixed ANOVA: F3,24 = 4.672, p = 0.01, = 0.312) between time, treatment group, and the interaction of the two. Pairwise comparisons found significantly higher nitrate + nitrite and ammonium levels within the nutrient amendment group compared to the control group at the one-hour timepoint only (p < 0.05; Figure 5; Supplementary Figure S2). Phosphate levels differed significantly over time (mixed ANOVA: F1.49,11.89 = 8.865, p = 0.007, = 0.478); however, after Bonferroni corrections on p-values from the pairwise tests, no significant differences across time was found. We observed significant differences among treatment groups’ DIN: SRP ratios (mixed ANOVA: F1,8 = 7.033, p = 0.029, = 0.176), with post hoc pairwise comparisons revealing nutrient-amended DIN: SRP ratios to be higher than control (p = 0.02). The variation of rainfall throughout the experiment did not correlate to the variation in DIN: SRP ratios (Pearson correlation: t8 = 0.282, p = 0.785, r = 0.99).
Figure 4
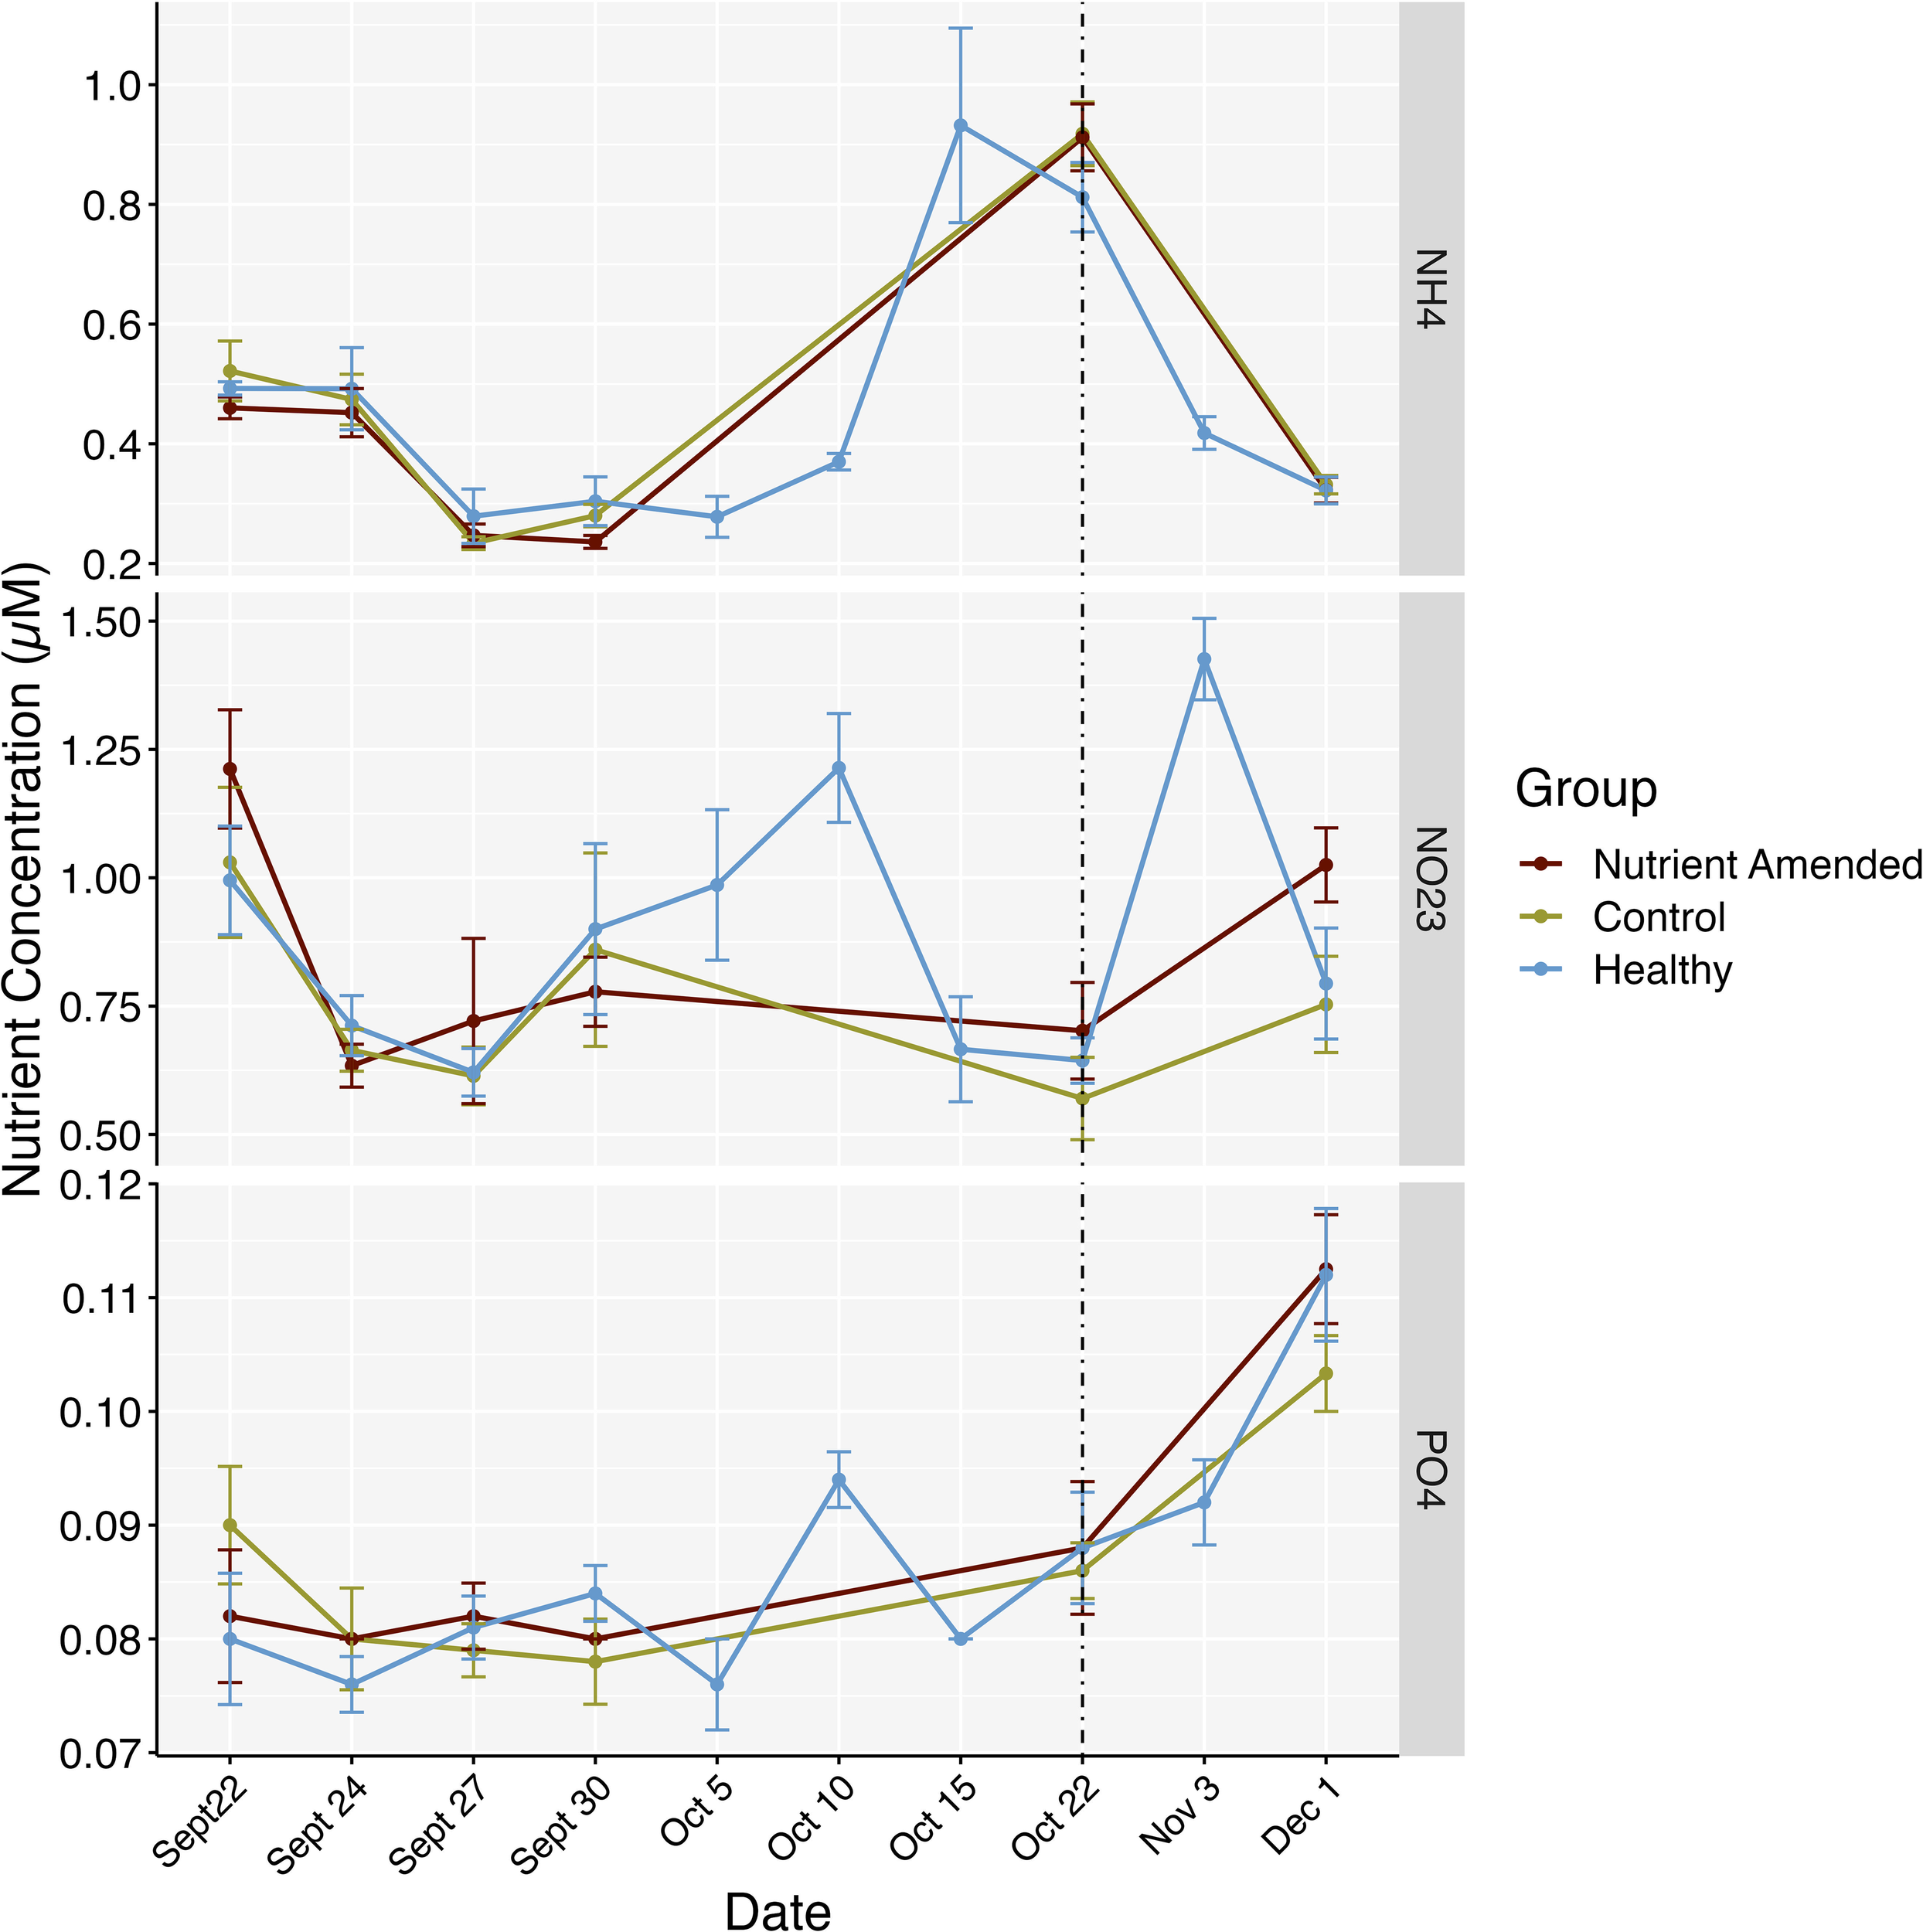
Average nutrient concentrations throughout the experiment from each of the experimental groups on sampling dates. Points represent the average concentrations on the dates when water samples were taken, no samples were taken above the nutrient-amended or control colonies from Oct 5 – Oct 15, 2021. The dotted line represents when nutrients were removed from the reef (Oct 22). Bars represent standard errors.
Figure 5
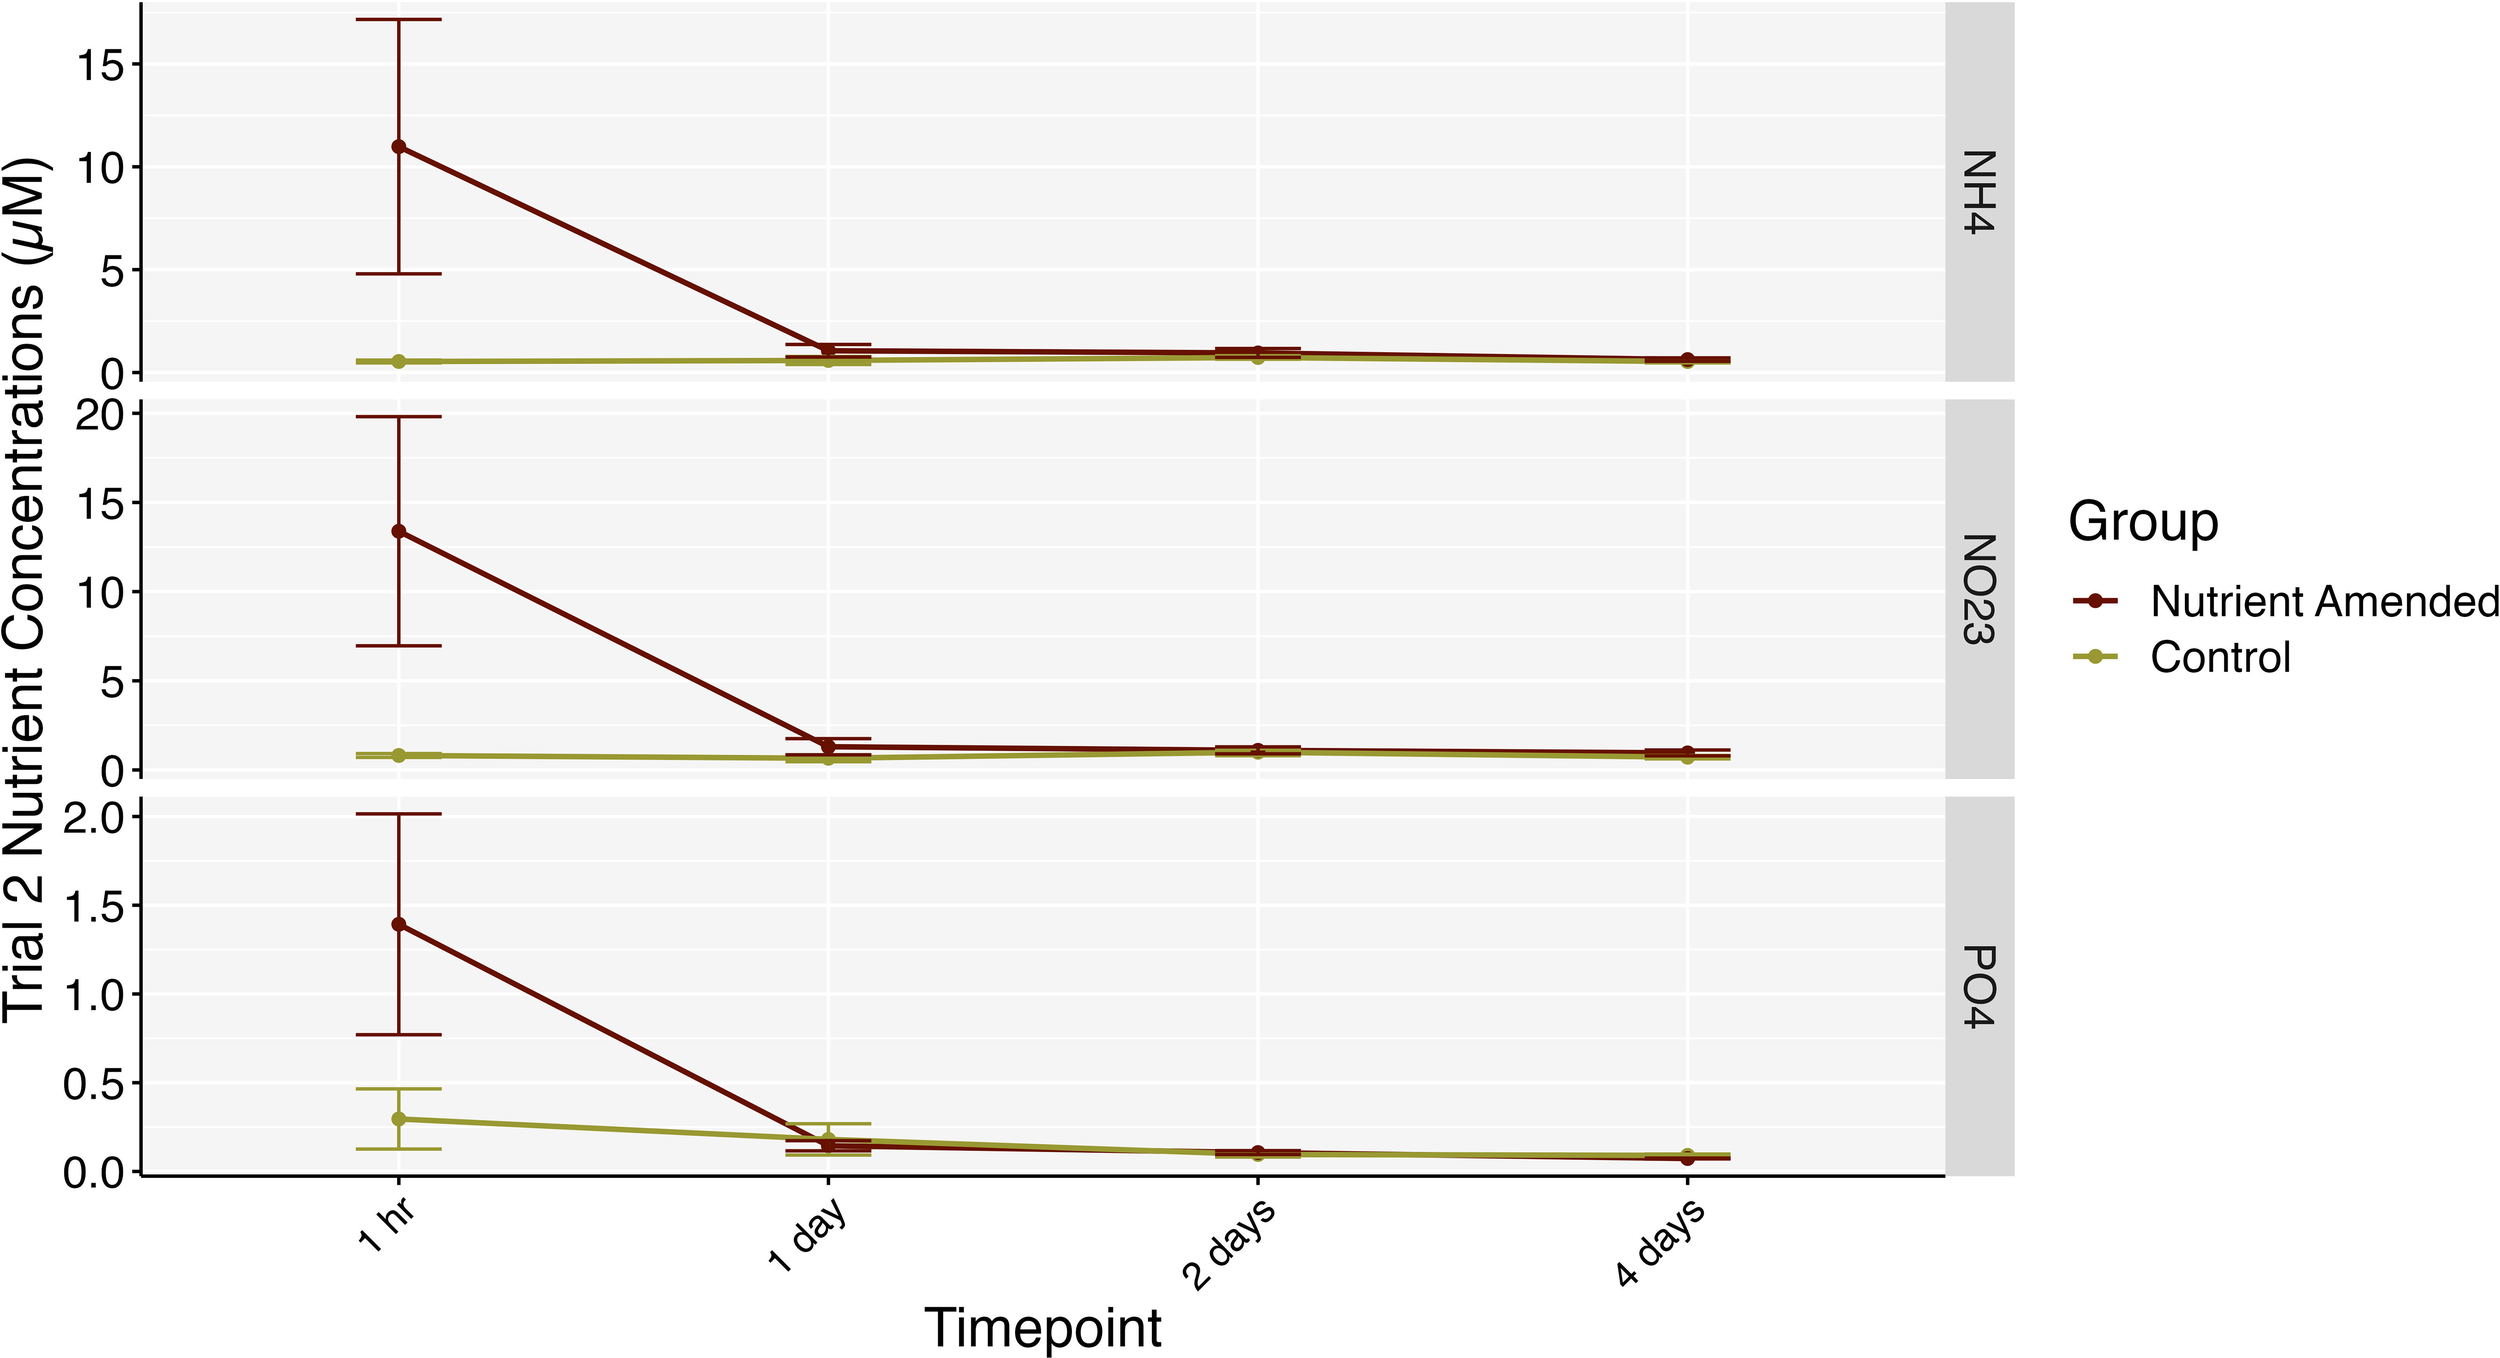
Nutrient concentrations between the nutrient-amended (garnet) and control groups (gold) from the 5 cm sampling distance trial in 2023. The x-axis represents the time/number of days after nutrient amendment that the water samples were taken. Bars represent standard errors.
3.2 Effect of treatment and time on disease progression
There was no significant effect of time, nutrient amendment, or the interaction of the two on the proportion of change in healthy tissue area (mixed ANOVA: F2.7,64.77 = 1.155, p = 0.331, = 0.036) and on the proportional rate of change in healthy tissue area per day (mixed ANOVA: F2.81,67.55 = 1.330, p = 0.272, = 0.044; Figure 6A). There was no interaction effect of time and treatment on the proportional rate of change in linear lesion progression per day (mixed ANOVA: F2.04,48.88 = 1.452, p = 0.244, = 0.054; Figure 6B) or an effect of just time (mixed ANOVA: F2.04,48.88 = 1.477, p = 0.238, = 0.055). Treatment did have an effect on the proportional rate of change in linear lesion progression per day (mixed ANOVA: F1,24 = 7.996, p = 0.009, = 0.019). However, the effect size of treatment was relatively small and after Bonferroni corrections on p-values from the pairwise tests, there was no significant effect of treatment group on proportional rate of change in linear progression. Neither experimental phase (during treatment, post-treatment, and total), nutrient amendment, nor the interaction of the two had a significant effect on the proportion of change in healthy tissue area over experimental phase (two-way ANOVA: F2,72 = 0.309, p = 0.735, = 0.009; Figure 7), the proportional rate of change in surface area over experimental phase (two-way ANOVA: F1,126 = 0.034, p = 0.854, = 0.0003), or the change in linear progression over experimental phase (two-way ANOVA: F1,73 = 0.004, p = 0.984, < 0.001).
Figure 6
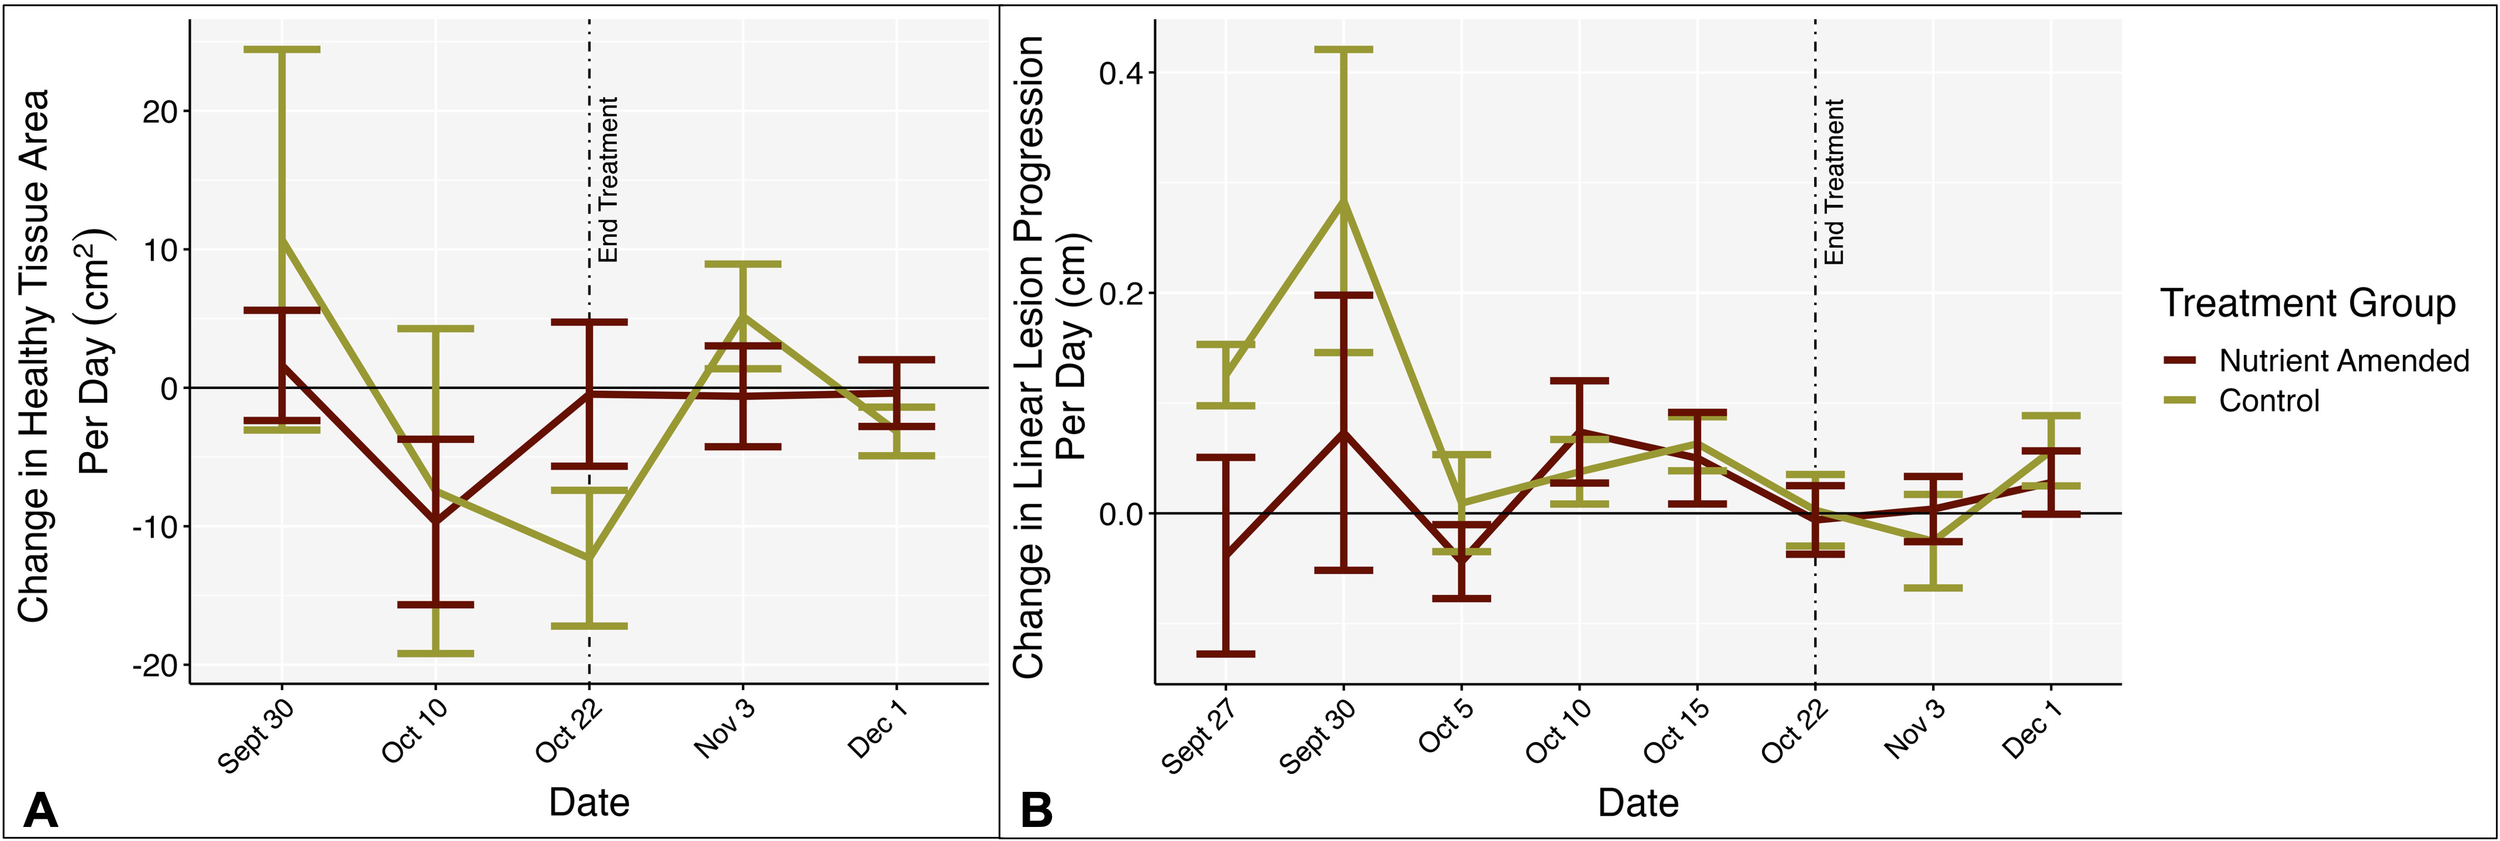
(A) Mean rate of change in healthy tissue area per day (cm2) by treatment group, from SfM photogrammetry. (B) Mean rate of change in linear lesion progression from 5 cm reference nail in cm/day. Negative numbers represent tissue loss and positive numbers represent tissue growth. In both plots the x-axis represents the rate of change between that date and the previous date. End treatment represents the timepoint when nutrient amendments were removed. Bars represent standard error.
Figure 7
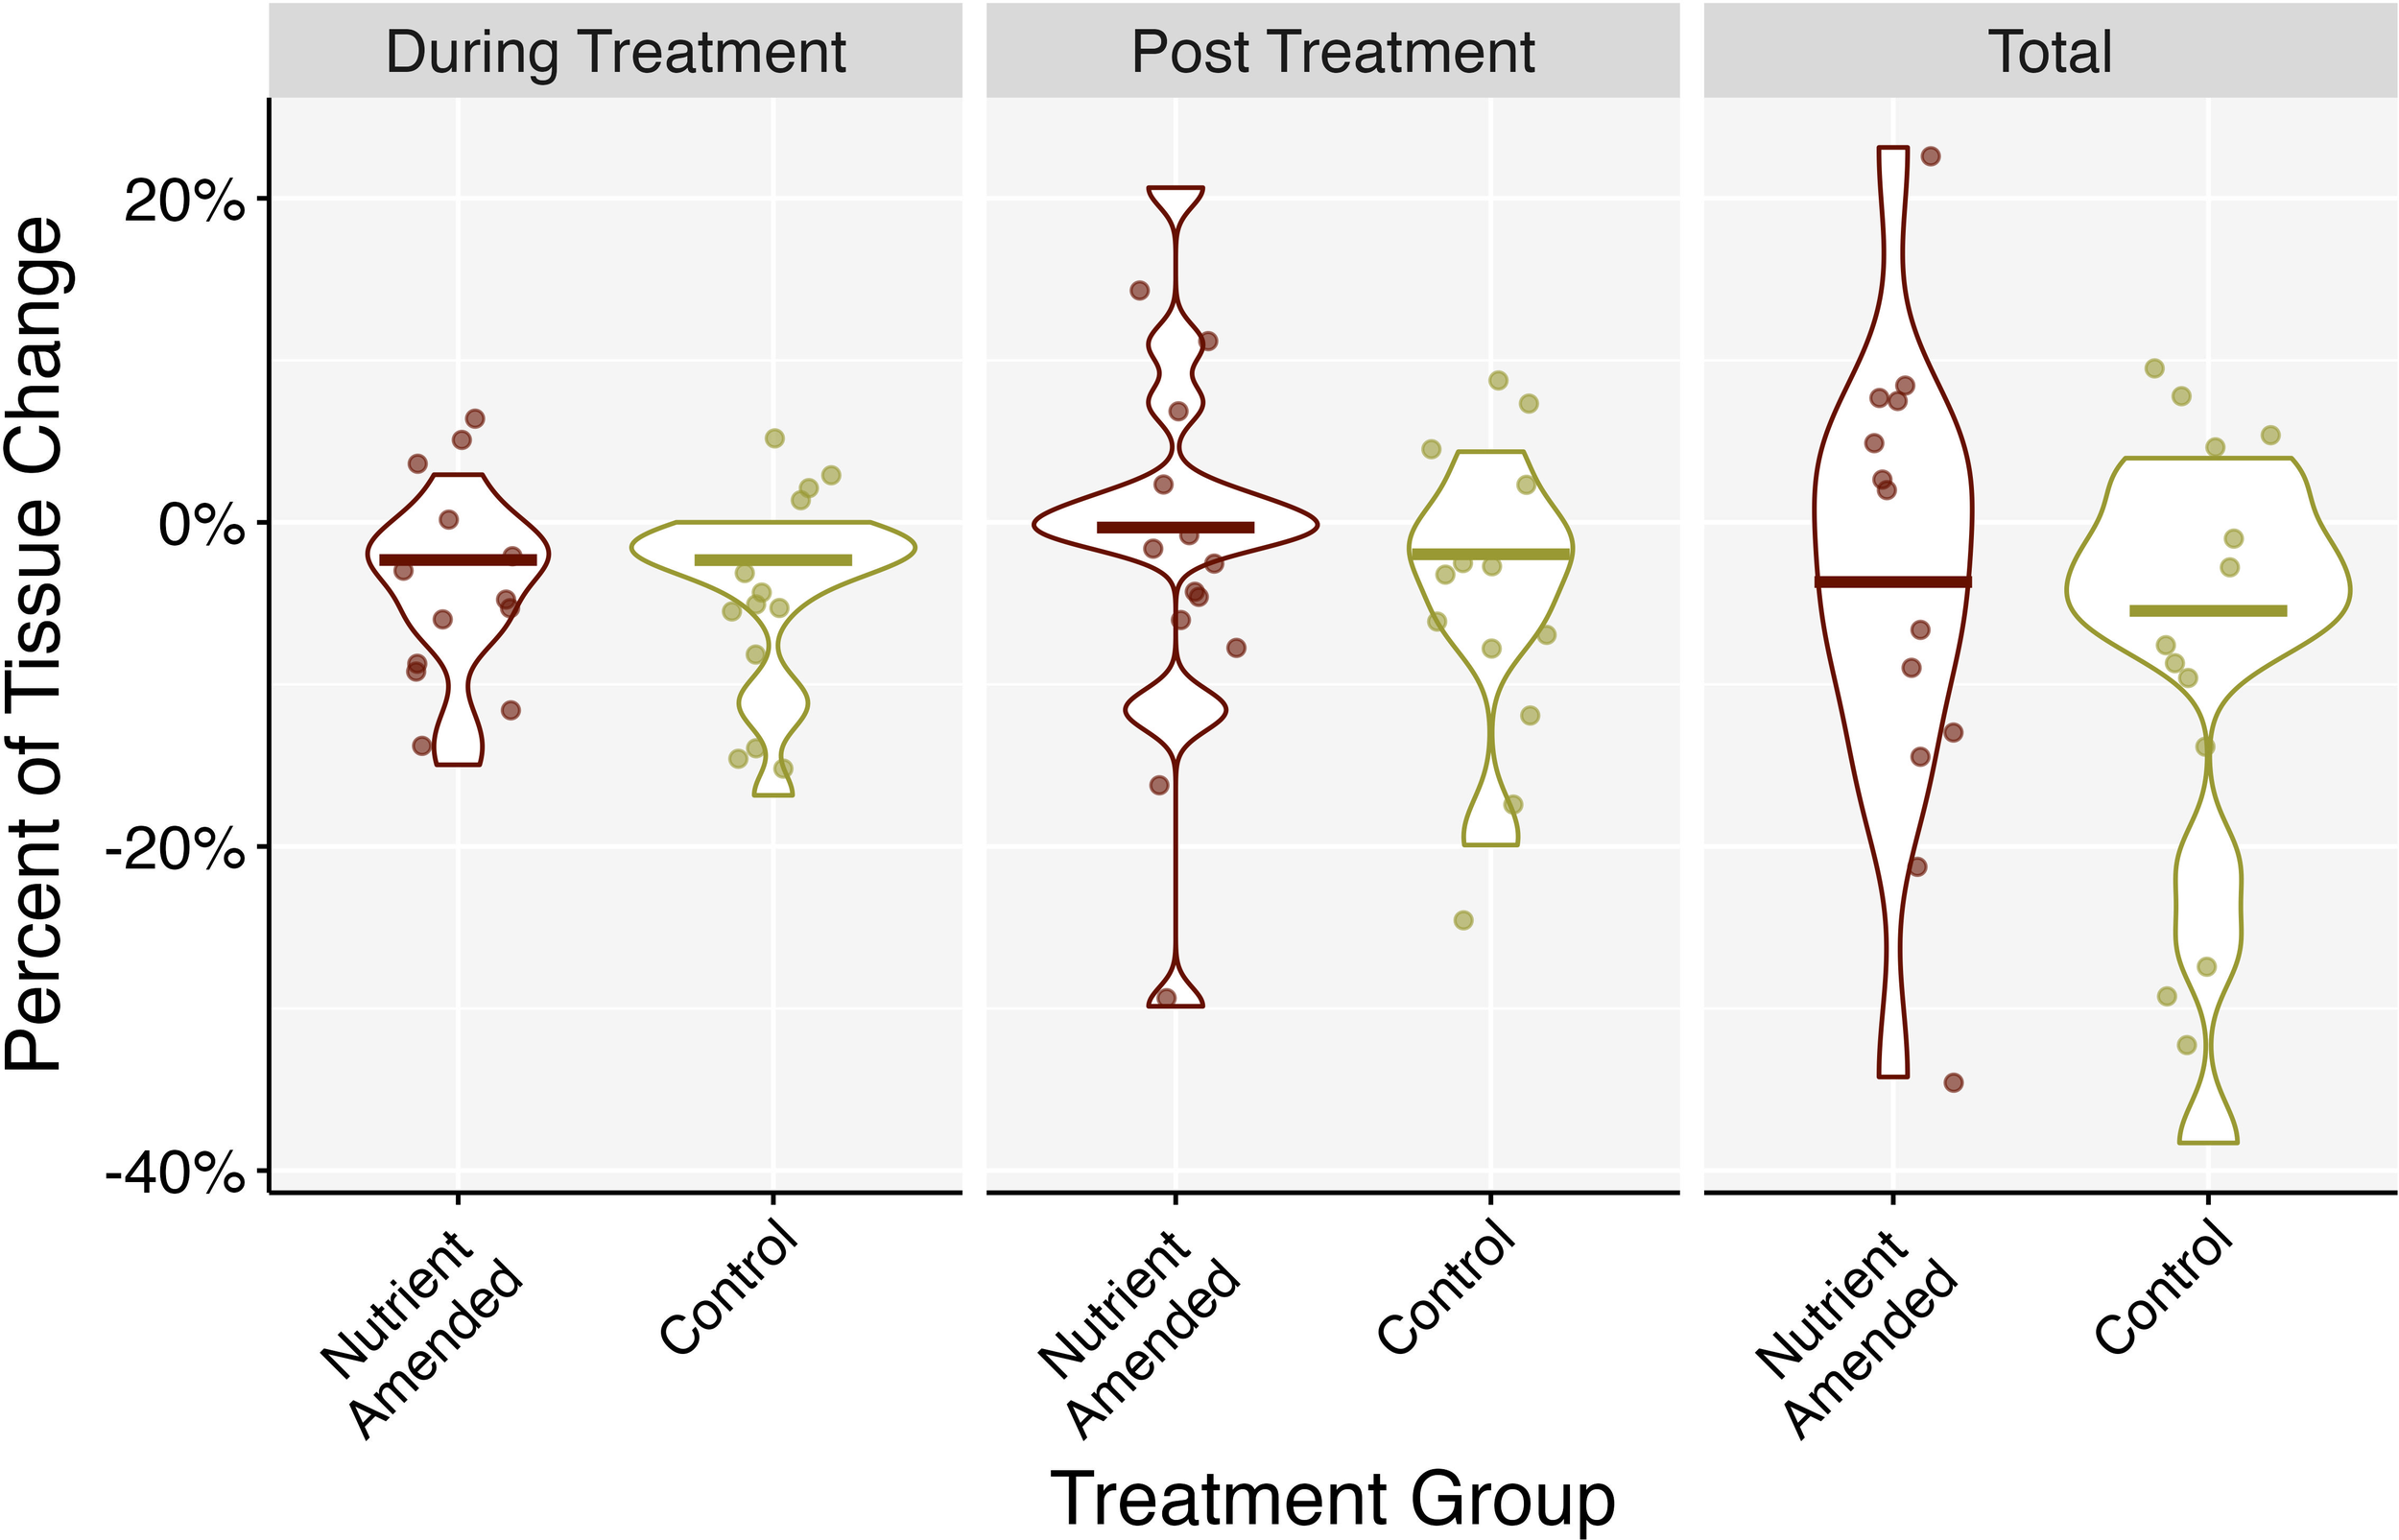
Change in healthy tissue area percentage between experiment and control treatment groups grouped by experimental phase: nutrient amendment (during treatment), once nutrients were removed (post-treatment), and then combined throughout the entire experiment (total). Negative values indicate loss of tissue and positive values indicate tissue growth. Middle bars represent the median.
3.3 Effect of experimental group and time on disease status
Neither nutrient amendment nor the interaction of nutrient amendment and time had a significant effect on SCTLD status (active or inactive; glmmTMB ANOVA: (5) = 1.199, p = 0.945). Time was significantly related to SCTLD status (glmmTMB ANOVA: (5) = 65.564, p< 0.001) with a decrease in the number of colonies with active SCTLD over time (p < 0.001; Supplementary Figure S3). There was a significant effect of SCTLD status (two-way ANOVA: F4,120 = 15.629, p < 0.01, = 0.115), date (two-way ANOVA: F4,120 = 3.449, p < 0.01, = 0.103) and the interaction of the (two-way ANOVA: F4,120 = 3.458, p < 0.01, = 0.103) on the proportion of change in healthy tissue area. Post hoc revealed a significant decrease in area on colonies with active SCTLD (p < 0.05) from the experiments initiation (Sept 22) to completion (Dec 1; p < 0.05) compared to those that had inactive SCTLD (Figure 8).
Figure 8
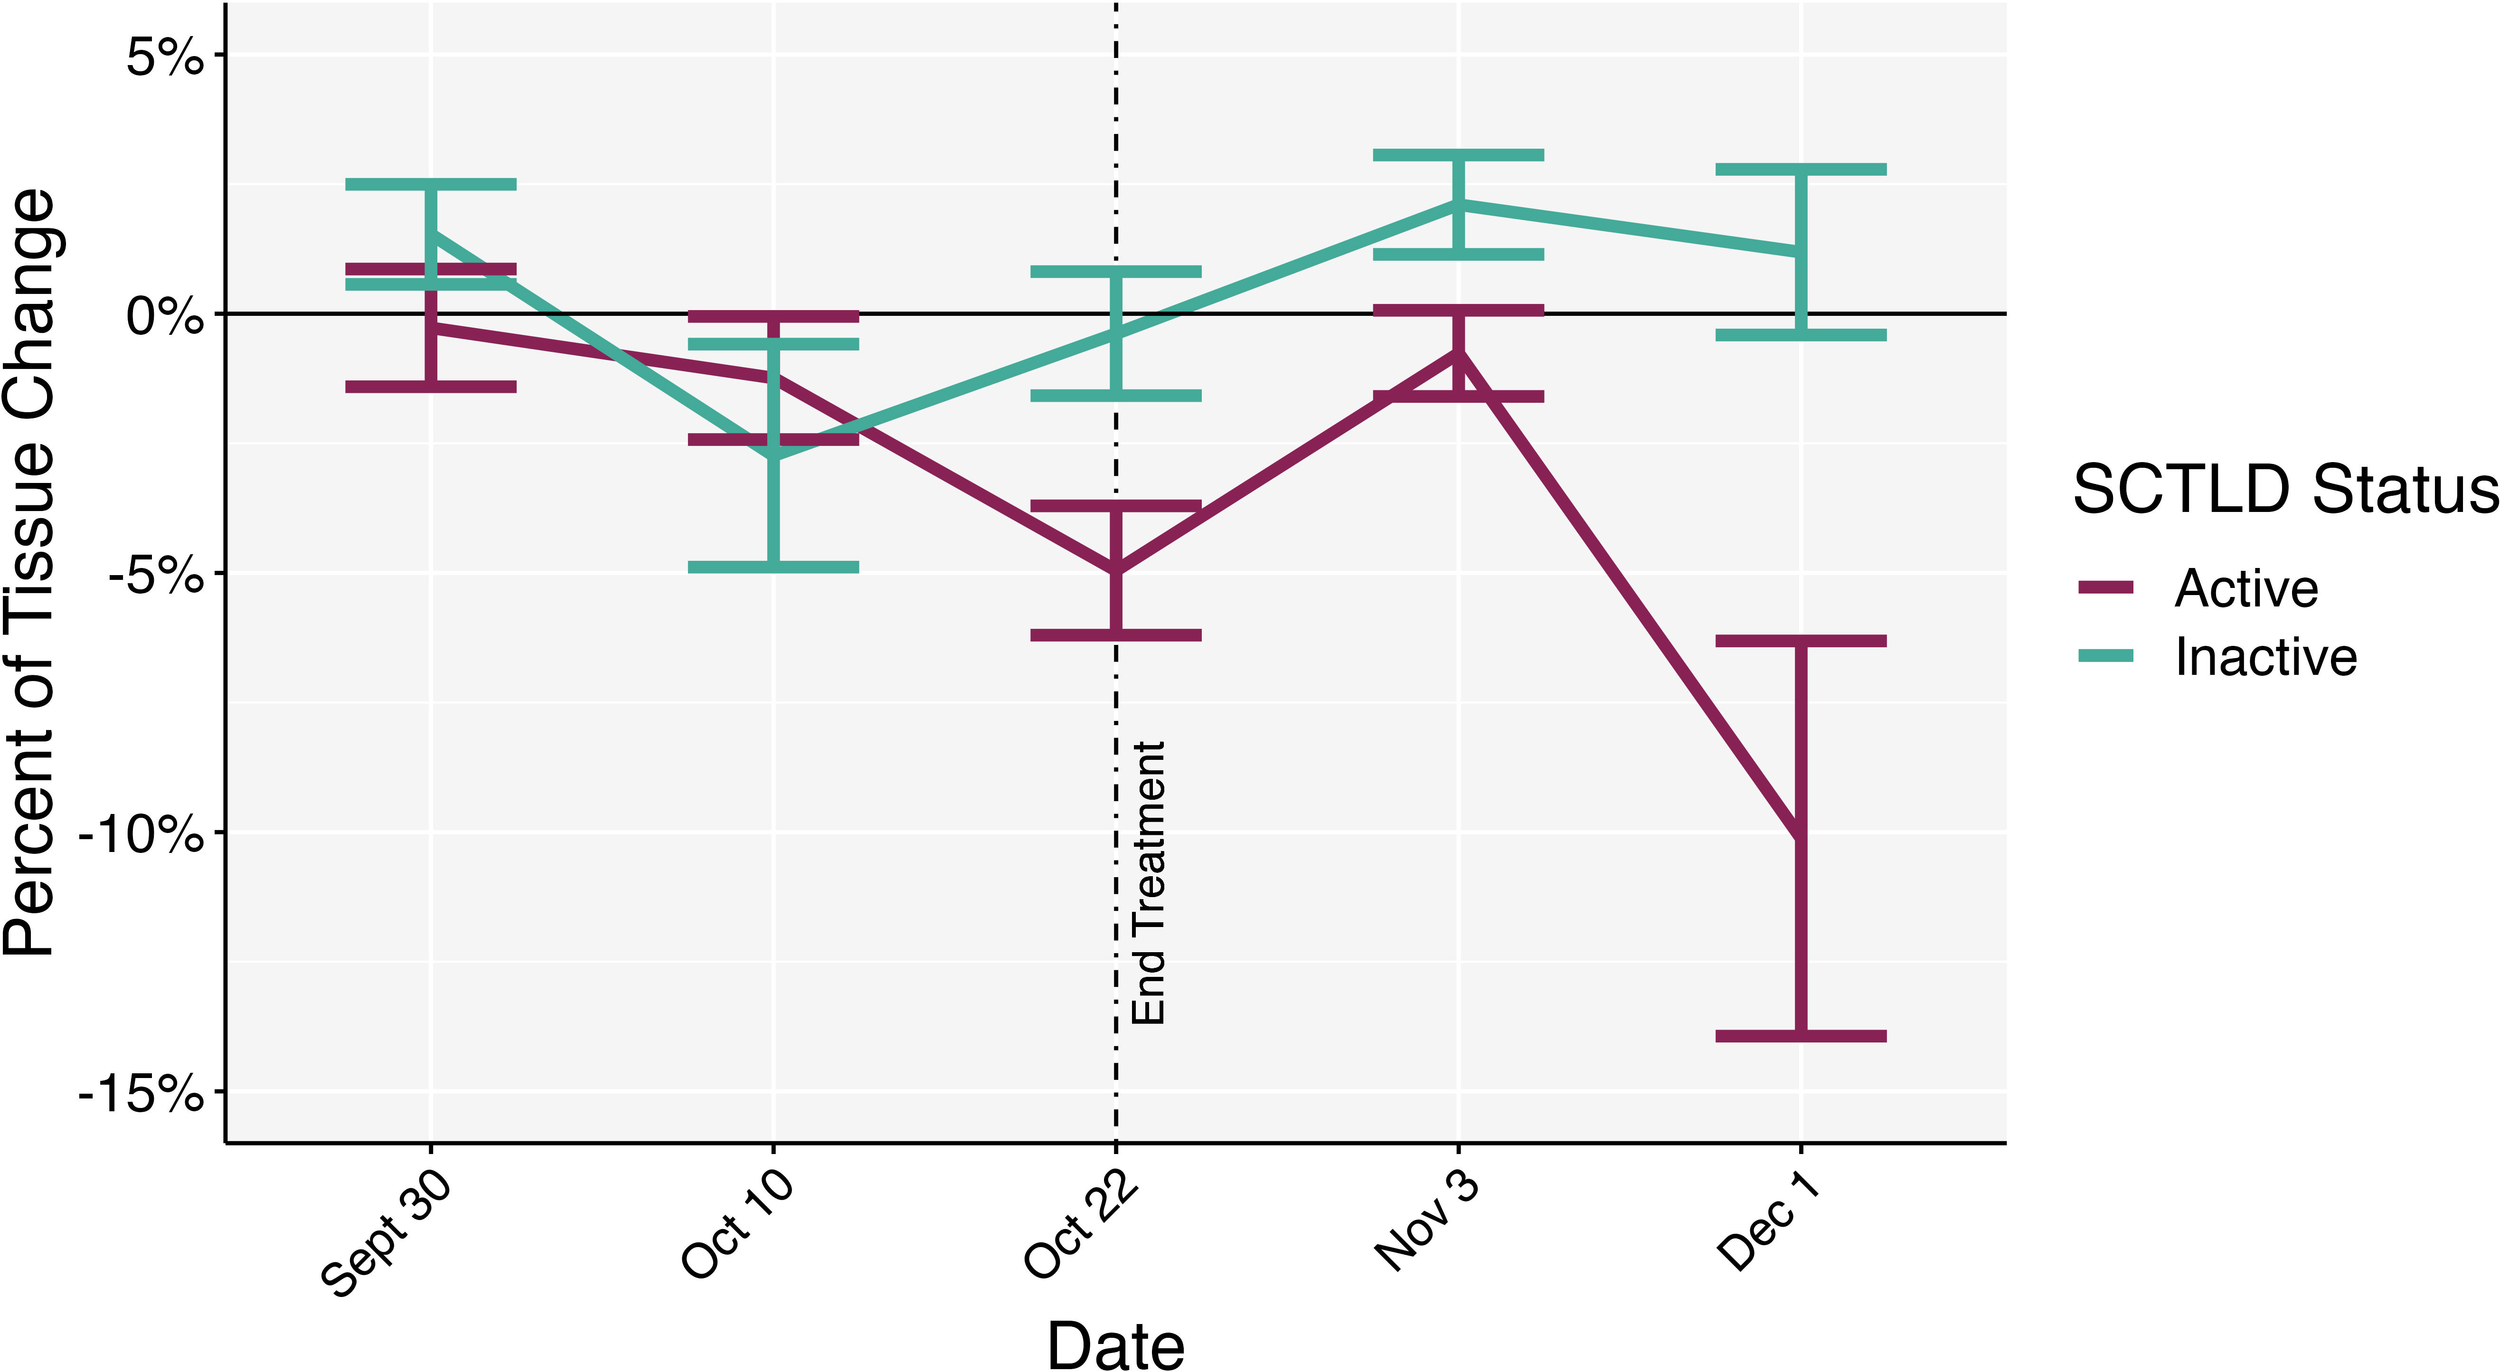
Percentage of change in healthy tissue area across timepoints between active SCTLD colonies and inactive SCTLD colonies. Negative values indicate tissue loss while positive values indicate tissue growth. End treatment represents the date when nutrient amendments were removed. Error bars represent standard error.
3.4 Effect of experimental group and time on disease prevalence
From the roving diver surveys 14 coral species were recorded; in order of decreasing relative abundance: M. cavernosa (70%), Siderastrea siderea (11%), Stephanocoenia intersepta (6%), Porites astreoides (5%), Siderastrea radians (3%), Solenastrea bournoni (3%), Orbicella faveolata (3%), and Acropora cervicornis, Agaricia agaricites, P. porites, Pseudodiploria strigosa, Mycetophyllia lamarckiana, O. franksi, and Pseudodiploria clivosa (<1% each). Average SCTLD prevalence followed a similar trend: M. cavernosa (3.4%), O. faveolata (0.56%), S. siderea (0.4%), S. intersepta (0.15%), S. bournoni (0.13%), P. astreoides (0.1%), S. radians (0.06%), O. franksi (0.04%), and the remaining species showed no visible SCTLD. There was no significant difference between treatment groups and healthy colonies and surrounding SCLTD prevalence (mixed ANOVA: F2,12 = 0.170, p = 0.846, = 0.011) or the interaction between treatment groups and time (mixed ANOVA: F16,96 = 0.803, p = 0.679, = 0.076). There was a significant effect of time on SCTLD prevalence (mixed ANOVA: F8,96 = 2.094, p = 0.044, = 0.097; Figure 9), however the effect size of time was relatively small and after Bonferroni corrections on p-values from the pairwise tests, no significant differences between time were found. The same was similar for SCLTD prevalence surrounding SCTLD-affected (combined nutrient-amended and control) and healthy colonies (Figure 10), with time being the only significant effect (mixed ANOVA: F8,104 = 2.148, p = 0.038, = 0.093), but again the effect size of time was small and post hoc tests with Bonferroni corrections on the p-value revealed no significant differences in time. Water temperature decreased significantly over time (glm ANOVA: (5) = 1.018 * e 31, p< 0.001), but was not significantly correlated to the change in surrounding SCTLD prevalence on the reef (Pearson correlation: t78 = 1.657, p = 0.102, r = 0.18).
Figure 9
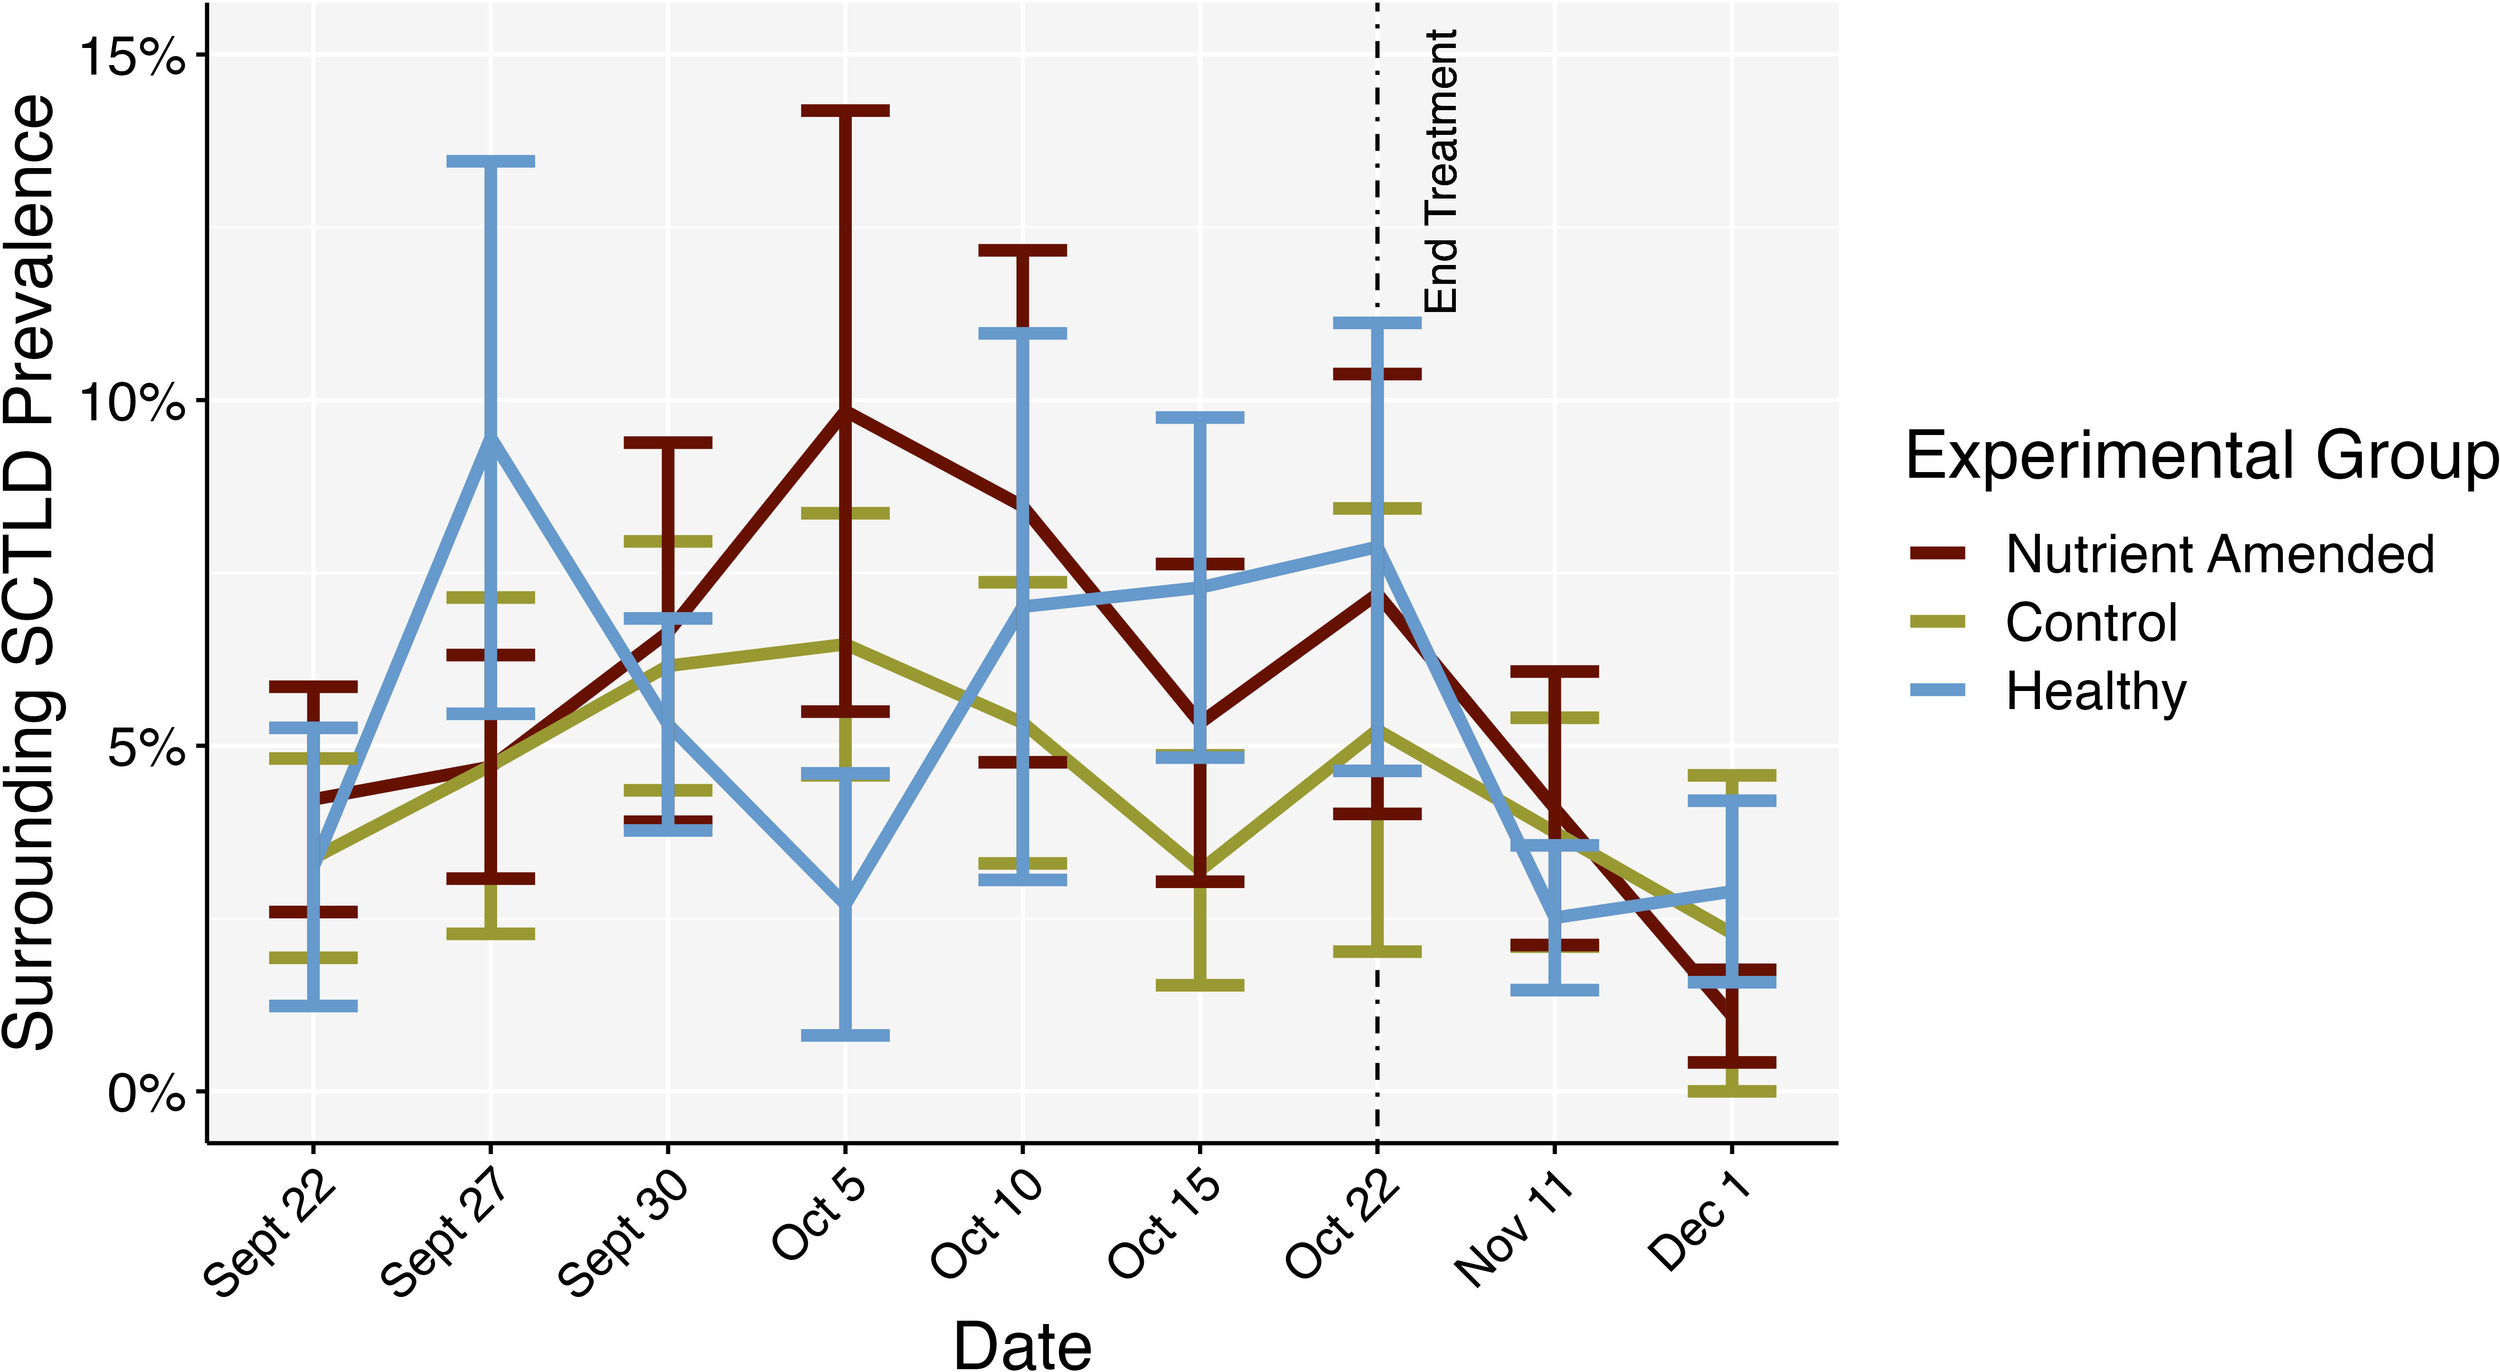
Mean SCTLD prevalence over time surrounding the centroid colonies of the experimental groups: nutrient-amended SCTLD-affected (nutrient-amended), unamended SCTLD-affected (control), and apparently healthy (healthy) colonies. End treatment represents the timepoint when nutrient amendents were removed. Error bars represent standard error.
Figure 10
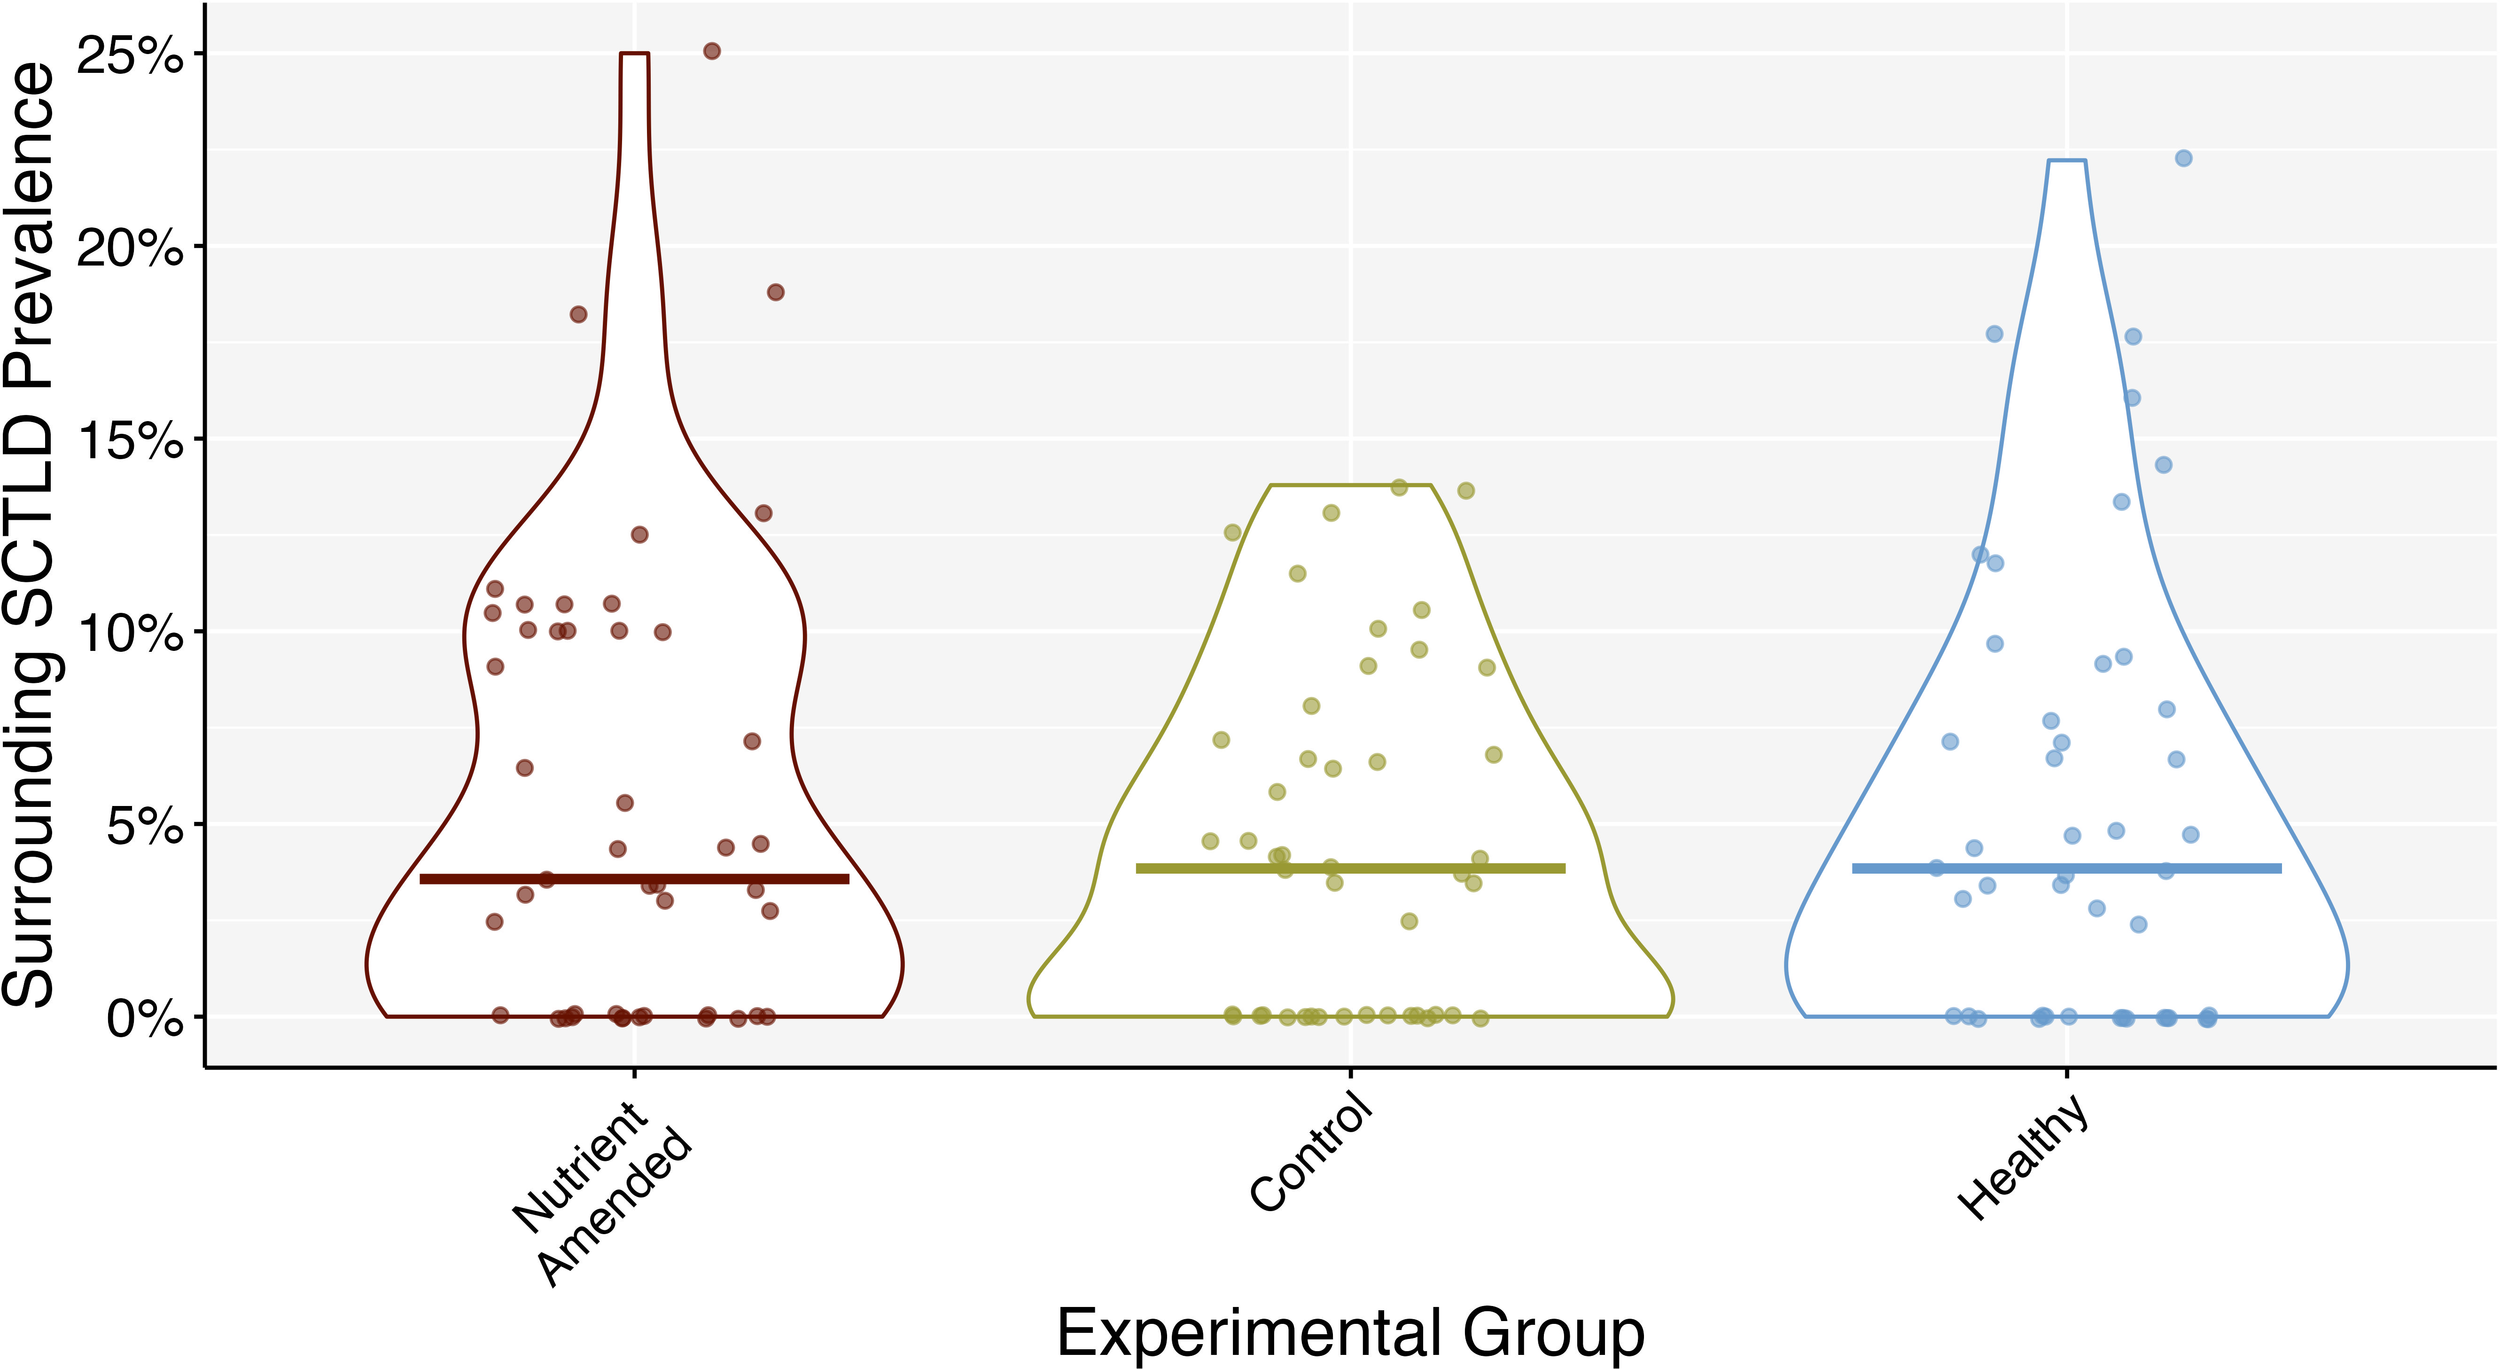
Surrounding SCTLD prevalence throughout the entire experiment grouped by experimental group: SCTLD-affected amended with nutrients (nutrient-amended), SCTLD-affected with no nutrient amendment (control), and apparently healthy coral colonies. Middle bars represent the median.
4 Discussion
This study sought to evaluate the effects of nutrient enrichment on SCTLD-affected Montastraea cavernosa colonies in Southeast Florida. Although we followed similar methods to previous studies in regard to fertilizer amounts and distance from sampling, we initially did not detect significant differences in nutrient levels surrounding the colonies among the treatment groups within the initial experimental phase (Figure 4). However, based on the results of the second nutrient amendment trial, there is evidence that nutrients were released and elevated as demonstrated by the significant differences measured at the 1 hr timepoint (Figure 5; Supplementary Figure S2). These nutrients appeared to dissipate or were absorbed; after 24 hours there were no significant differences in nutrient levels between the nutrient-amended and control colonies (Figure 5; Supplementary Figure S2). The lack of significant differences in the measured SCTLD response variables between nutrient-amended and control colonies suggests that nutrient amendments had no effect on SCTLD progression or prevalence during this 30-day experiment in Southeast Florida (Figures 6, 7, 9, 10). These findings are similar to an epidemiological study that did not find a significant relationship between SCTLD prevalence and density across Florida’s Coral Reef and chlorophyll-a concentration, which is often used as a proxy for nutrients (Muller et al., 2020). While generally eutrophication is thought to decrease holobiont health and performance, a nutrient enrichment study using 175 g of Osmocote™ fertilizer on an oligotrophic reef, instead reported increased coral holobiont performance and algal symbiont density (Becker et al., 2021). Likewise, a controlled tank experiment with elevated nutrients reported increased photochemical efficiency in coral's algal symbionts (Palacio-Castro et al., 2021). However, in our study, there were no significant differences in SCTLD progression rates among the experimental colonies; thus, we were unable to attribute nutrient amendments to either positive or negative effects on SCTLD-affected colonies.
This study took place within a disease endemic zone, where the disease has been present ≥ 9 years (Costa et al., 2021) and was at a relatively low prevalence during the experiment at an average of ~5% throughout the surrounding reef area (Figures 9, 10). SCTLD endemic reefs have also been characterized as having slower SCTLD progression rates (Costa et al., 2021). We observed, using 3D models, an average tissue loss rate of 0.11% per day among SCTLD-active colonies. Our results are comparable to a recent study tracking M. cavernosa tissue loss on SCTLD-endemic reefs in Fort Lauderdale, near our study site, which reported ~0.14% tissue loss per day using visual photo assessments (Aeby et al., 2021). We did not observe significant differences in SCTLD-driven tissue loss between control and nutrient-amended colonies or over time, nor did we observe significant differences in SCTLD disease prevalence between control and nutrient-amended colonies or over time. However, it remains important to consider that nutrient levels may affect SCTLD progression during phases of more rapid tissue loss such as in SCTLD epidemic reef zones.
Significant changes in tissue area were detected over time among those colonies that remained SCTLD active, independent of treatment group, between the first and last timepoint (Sept 30 – Dec 1; Figure 8). Small net changes in tissue area over time are difficult to capture, even using 3D photogrammetry, and model shape error can account for ~1.7 cm2 for each model, with relative error rates of ~6% (Combs et al., 2021). In this experiment, ~70% of the area change measurements between sequential timepoints were <6% change in area, indicating even precise photogrammetry may not be sufficient to capture surface area changes within a scale of days. Therefore, we hypothesize that significant surface area changes were not detected between sequential timepoints (e.g., Oct 10, Oct 22) due to the combination of slow SCTLD progression rates in the endemic zone, short periods between monitoring, and inherent error associated with calculating surface area from 3D models. Nonetheless, the lack of treatment effect across the entire 30-day duration of the experiment, suggests that nutrient amendment did not exacerbate SCTLD progression in this study.
Our methods followed those of previous experiments that observed significant increases in ambient nutrient levels using similar nutrient amendment methods. For example, Voss and Richardson (2006) used half of the amount of Osmocote (15 g; 9-6-12) compared to our experiment and observed a ~2-fold increase of ammonium, nitrite, and nitrate above ambient levels in the Bahamas. In Mexico, Bruno et al. (2003) used 30 g (9-6-12) of Osmocote™ (the same amount used in this study) and observed a 2–5 x increase in nearby nutrient levels. Here, we used a slightly different Osmocote formulation (19-6-12), for which we expected to see a greater increase in nitrogen levels than we observed.
We hypothesized that we were unable to detect significantly elevated nutrient concentrations during the initial experimental phase of the study due to the increased distance between the nutrient enrichment bags and the water sample collection location (25 – 100 cm away; Figure 4). When the same nutrient amendments were repeated with closer sampling distances (5 cm), significant nutrient enrichment over ambient levels were detected, but only at one-hour post-deployment (Figure 5; Supplementary Figure 2). Bruno et al. (2003) reported ~3– 4 x higher nutrient concentrations 1–10 cm away from the nutrient amendments compared to 100 cm, 10 min post-deployment. However, after 4 days there was a much weaker gradient of decreasing nutrient concentrations with distance (~0.5 µM at 1 cm away from the nutrient amendments compared to 100 cm). It is possible that the sampling distance in this study combined with other flow dynamics co-factors may account for the lack of significant difference in nutrient concentrations between the nutrient-amended and ambient water samples in the original experiment and the quick drop in enrichment during the second amendment trial.
During the follow-up trial, when nutrient amendment colonies were resampled at the 24-hour post-deployment timepoint, nutrient levels had dropped, and were insignificantly different from ambient levels (Figure 5; Supplementary Figure 2). This rapid decrease in nutrient levels post-amendment could have been due to rapid dilution of nutrients due to physical dynamics on the reef, and/or rapid uptake of the nutrients by other reef organisms. Algae, especially macroalgae, turf algae, and benthic cyanobacteria are known to rapidly uptake nutrients and are associated with more eutrophic reefs (Littler et al., 2006). A previous experiment examining enhanced nutrient uptake by different reef organisms showed that Dictyota macroalgae quickly acquired large amounts of nutrients from episodic runoff events (Den Haan et al., 2016). Fort Lauderdale reefs have high macroalgae cover (60%) and Dictyota spp. are relatively dominant within Southeast Florida (Banks et al., 2007; Aeby et al., 2021). There were noticeably large amounts of turf and macroalgae surrounding the coral colonies; however, their relative abundance was not monitored throughout this experiment. In comparison, reefs in Akumal, Mexico where Bruno et al. (2003) conducted their experiment, had <5% macroalgae cover during 2000–2004 (Randazzo-Eisemann et al., 2021).
Importantly, the ambient nutrient concentrations at our study site were already higher (maximum DIN = 3.12 µM) than what would be expected under oligotrophic conditions, which could explain why we did not observe a significant increase in nutrient levels from our amendments over ambient levels after the one-hour timepoint. Specifically, the maximum ambient concentrations of ammonium and nitrite + nitrate recorded here were 4.9 x and 0.5 x higher, respectively, than the maximum ambient concentrations reported by Bruno et al. (2003), and 6 x and 3.5 x higher, respectively, than the maximum ambient nutrient concentrations reported by Voss and Richardson (2006). Several maximum nutrient levels observed in our study were comparable to those observed in and around the eutrophic waters of the Hillsboro and Port Everglades inlets near Fort Lauderdale. One study reported that bacterial communities on reefs in Broward County were similar to those found nearby treated wastewater outfalls, speculating that there could be transport and mixing of wastewater from local currents through the formation of eddies driving the high levels of eutrophication on these reefs.
The timeframe of our experiment may also have prevented the observation of significant differences in disease progression or prevalence. The 30-day length of the experimental treatment was chosen because of the typically fast pace of SCTLD lesion progression and the uncertainty that colonies may reach mortality prior to the end of the experiment. Voss and Richardson (2006) observed significant increases in black band progression in just 20 days. However, similar experiments that attributed disease progression to chronic nutrient enrichment were over longer periods (Bruno et al., 2003; Vega Thurber et al., 2014). Vega Thurber et al. (2014) observed an increase in dark spot syndrome prevalence due to nutrient enrichment over three years, while Gochfeld et al. (2012) did not find nutrient enrichment to enhance dark spot syndrome over a much shorter 5-day experiment. Although these experiments used different amounts of fertilizer, it is possible that the short study period led to the lack of observable effects of the nutrients in the Gochfeld experiment (Gochfeld et al., 2012). Our experiment suggests that nutrient amendment over a month-long period does not directly affect SCTLD progression on M. cavernosa. This is important as nutrient enrichment events can occur over relatively short periods such as during a storm or from flux in tides and inlet outflows (Lapointe et al., 2005).
It is possible that SCTLD dynamics may differ if the nutrient amendments were sustained over a longer period. In Southeast Florida, temporal models showed a positive correlation of SCTLD lesions to temperature stress, inlet flow and total rainfall (Walker et al., 2022). Spatial models also indicated a positive correlation of SCTLD lesions to the number of septic tanks within a 5-km radius (Walker et al., 2022). This raises the question of whether long-term chronic nutrient enrichment might affect SCTLD dynamics differently than more common short-term, episodic nutrient events.
Different environments, species, and the timing of SCTLD onset may play a role in the effects of nutrient enrichment on the severity of SCTLD. For instance, we observed high variability in disease status and progression across individual colonies from both the control and nutrient-amended SCTLD-affected groups. This relatively high colony-level variation may explain why we did not observe statistically significant differences between the nutrient-amended and control groups. Intraspecific variation in SCTLD resistance and tolerance (i.e., the amount of time that colonies are infected but do not experience total colony mortality), as well as quiescence and reactivation of SCTLD lesions, have been observed in M. cavernosa populations in Fort Lauderdale and other SCTLD intermediately susceptible species such as O. faveolata (Walker and Klug, 2015; Aeby et al., 2019, 2021; Papke et al., 2023). Variation in holobiont partnerships including coral host genotype, algal symbiont, and microbial community structure combinations may be particularly advantageous, underpinning disease resistance and driving intraspecific variation (Vollmer and Kline, 2008; Aeby et al., 2021). The variability in disease dynamics observed across the SCTLD-affected colonies could be attributed to this intraspecific variation and make it difficult to interpret the effects of nutrient amendment.
From what we have observed, small-scale, colony-level nutrient amendments added over one month did not significantly affect SCTLD dynamics on M. cavernosa colonies or result in an SCTLD outbreak to surrounding coral colonies. These results are specific to this SCTLD endemic reef system with corals that exhibit high intraspecific variation in their susceptibility to SCTLD. We recommend that potential environmental drivers be tested individually and in combination ex situ. Such results could better inform how to allocate resources towards mitigating environmental drivers of SCTLD versus treatments or restoration efforts. It is also recommended to repeat these experiments on multiple species as SCTLD affects species differently, therefore an environmental factor may exacerbate SCTLD dynamics in some species and not others.
Water quality did not appear to influence SCTLD prevalence or severity in Southeast Florida during this timeframe. While efforts to improve water quality may improve overall coral reef resilience, direct effects on SCTLD were not observed in this study. Furthermore, it is important to prioritize pairing monitoring water quality in concert with coral reef health surveys as it is difficult to understand the effects of nutrient enrichment on SCTLD dynamics and other health indicators where baseline data is lacking.
Statements
Data availability statement
The datasets presented in this study can be found in online repositories. The names of the repository/repositories and accession number(s) can be found below: https://github.com/ashleycarreiro/SCTLD_Nutrient_Manuscript.
Ethics statement
The manuscript presents research on animals that do not require ethical approval for their study.
Author contributions
AC: Conceptualization, Data curation, Formal analysis, Funding acquisition, Investigation, Methodology, Visualization, Writing – original draft, Writing – review & editing. RE: Investigation, Visualization, Writing – original draft, Writing – review & editing. AS: Investigation, Writing – original draft, Writing – review & editing. TI: Writing – original draft, Writing – review & editing. IC: Formal analysis, Writing – original draft, Writing – review & editing. BW: Funding acquisition, Resources, Writing – original draft, Writing – review & editing. JV: Methodology, Conceptualization, Funding acquisition, Resources, Supervision, Writing – original draft, Writing – review & editing.
Funding
The author(s) declare financial support was received for the research, authorship, and/or publication of this article. This research was funded by awards from the Florida Department of Environmental Protection to JV (B9657D) and BW, as well as scholarships from the AAUS Foundation and PADI Foundation to AC. This experiment was completed under special activity license SAL-21-2332-SRP from the Florida Fish and Wildlife Conservation Commission.
Acknowledgments
We thank the members of the Voss laboratory, including Allison Klein, Gabrielle Pantoni, and Erin Shilling for assistance with field work and data collection. We thank the Walker GIS Spatial Ecology laboratory particularly Zachary Graff, Hunter Noren, and Allie Kozachuk for their assistance with field operations. This is contribution 2323 from FAU Harbor Branch Oceanographic Institute.
Conflict of interest
The authors declare that the research was conducted in the absence of any commercial or financial relationships that could be construed as a potential conflict of interest.
Publisher’s note
All claims expressed in this article are solely those of the authors and do not necessarily represent those of their affiliated organizations, or those of the publisher, the editors and the reviewers. Any product that may be evaluated in this article, or claim that may be made by its manufacturer, is not guaranteed or endorsed by the publisher.
Supplementary material
The Supplementary Material for this article can be found online at: https://www.frontiersin.org/articles/10.3389/fmars.2024.1384534/full#supplementary-material
Supplementary Figure 1The change in DIN: SRP ratio over time. Start treatment is the first timepoint when nutrient amendment were present, and end treatment is when nutrient amendment were removed. Error bars represent standard error.
Supplementary Figure 2Log scaled nutrient concentrations between the nutrient-amended (garnet) and control groups (gold) from the 5 cm sampling distance trial in 2023. The x-axis is on a log scale in order to see the differences more clearly. Bars represent standard error.
Supplementary Figure 3Proportion of SCTLD-affected colonies grouped by treatment at each SCTLD-activity monitoring timepoint.
References
1
Aeby G. Ushijima B. Bartels E. Walter C. Kuehl J. Jones S. et al . (2021). Changing stony coral tissue loss disease dynamics through time in Montastraea cavernosa. Front. Mar. Sci.8, 1–13. doi: 10.3389/fmars.2021.699075
2
Aeby G. S. Ushijima B. Campbell J. E. Jones S. Williams G. J. Meyer J. L. et al . (2019). Pathogenesis of a tissue loss disease affecting multiple species of corals along the Florida reef tract. Front. Mar. Sci.6, 678. doi: 10.3389/fmars.2019.00678
3
Banks K. W. Riegl B. M. Shinn E. A. Piller W. E. Dodge R. E. (2007). Geomorphology of the Southeast Florida continental reef tract (Miami-Dade, Broward, and Palm Beach Counties, USA). Coral Reefs26, 617–633. doi: 10.1007/s00338-007-0231-0
4
Becker D. M. Putnam H. M. Burkepile D. E. Adam T. C. Vega Thurber R. Silbiger N. J. (2021). Chronic low-level nutrient enrichment benefits coral thermal performance in a fore reef habitat. Coral Reefs40, 1637–1655. doi: 10.1007/s00338-021-02138-2
5
Becker C. C. Weber L. Llopiz J. K. Mooney T. A. Apprill A. (2024). Microorganisms uniquely capture and predict stony coral tissue loss disease and hurricane disturbance impacts on US Virgin Island reefs. Environ. Microbiol.26, 1–28. doi: 10.1111/1462-2920.16610
6
Becker C. C. Weber L. Zgliczynski B. Sullivan C. Sandin S. Muller E. et al . (2023). Microorganisms and dissolved metabolites distinguish Florida’s Coral Reef habitats. PNAS Nexus2, 1–14. doi: 10.1093/pnasnexus/pgad287
7
Bourne D. G. Garren M. Work T. M. Rosenberg E. Smith G. W. Harvell C. D. (2009). Microbial disease and the coral holobiont. Trends Microbiol.17, 554–562. doi: 10.1016/j.tim.2009.09.004
8
Brooks M. E. Kristensen K. van Bentham K. J. Magnusson A. Berg C. W. Nielsen A. et al . (2017). glmmTMB balances speed and flexibility among packages for zero-inflated generalized linear mixed modeling. R J. 9, 378–400. doi: 10.32614/rj-2017-066
9
Bruno J. F. Petes L. E. Harvell C. D. Hettinger A. (2003). Nutrient enrichment can increase the severity of coral diseases. Ecol. Lett.6, 1056–1061. doi: 10.1046/j.1461-0248.2003.00544.x
10
Burke L. Reytar K. Spalding M. Perry A. (2011). Reefs at risk revisited (Washington DC: : World Resources Institute).
11
Chaves-Fonnegra A. Panassiti B. Smith T. B. Brown E. Clemens E. Sevier M. et al . (2021). Environmental and biological drivers of white plague disease on shallow and mesophotic coral reefs. Ecography (Cop)44, 1071–1085. doi: 10.1111/ecog.05527
12
Cohen J. (1988). Statistical power analysis for the behavioral sciences (New York: Acad Press 2).
13
Combs I. R. Studivan M. S. Eckert R. J. Voss J. D. (2021). Quantifying impacts of stony coral tissue loss disease on corals in Southeast Florida through surveys and 3D photogrammetry. PloS One16, 1–17. doi: 10.1371/journal.pone.0252593
14
Costa S. V. Hibberts S. J. Olive D. A. Budd K. A. Long A. E. Meiling S. S. et al . (2021). Diversity and Disease: The effects of coral diversity on prevalence and impacts of stony coral tissue loss disease in Saint Thomas, U.S. Virgin Islands. Front. Mar. Sci.8, 682688. doi: 10.3389/fmars.2021.682688
15
Costa O. S. Leão Z. M. A. N. Nimmo M. Attrill M. J. (2000). Nutrification impacts on coral reefs from northern Bahia, Brazil. Hydrobiologia440, 307–315.
16
Den Haan J. Huisman J. Brocke H. J. Goehlich H. Latijnhouwers K. R. W. Van Heeringen S. et al . (2016). Nitrogen and phosphorus uptake rates of different species from a coral reef community after a nutrient pulse. Sci. Rep.6, 1–13. doi: 10.1038/srep28821
17
Dinsdale E. A. Pantos O. Smriga S. Edwards R. A. Angly F. Wegley L. et al . (2008). Microbial ecology of four coral atolls in the Northern Line Islands. PloS One3, e1584. doi: 10.1371/journal.pone.0001584
18
Dobbelaere T. Muller E. M. Gramer L. J. Holstein D. M. Hanert E. (2020). Coupled epidemio-hydrodynamic modeling to understand the spread of a deadly coral disease in Florida. Front. Mar. Sci.7, 1–16. doi: 10.3389/fmars.2020.591881
19
Fox J. Weisber S. Price B. Adler D. Bates D. Baud-Bovy G. et al . (2022). car: Companion to applied regression.
20
Gochfeld D. J. Easson C. G. Freeman C. J. Thacker R. W. Olson J. B. (2012). Disease and nutrient enrichment as potential stressors on the Caribbean sponge Aplysina cauliformis and its bacterial symbionts. Mar. Ecol. Prog. Ser.456, 101–111. doi: 10.3354/meps09716
21
Gochfeld D. J. Olson J. B. Slattery M. (2006). Colony versus population variation in susceptibility and resistance to dark spot syndrome in the Caribbean coral. Siderastrea siderea.69, 53–65. doi: 10.3354/dao069053
22
Green E. P. Bruckner A. W. (2000). The significance of coral disease epizootiology for coral reef conservation. Biol. Conserv.96, 347–361. doi: 10.1016/S0006-3207(00)00073-2
23
Hayes N. K. Walton C. J. Gilliam D. S. (2022). Tissue loss disease outbreak significantly alters the Southeast Florida stony coral assemblage. Front. Mar. Sci.9, 975894. doi: 10.3389/fmars.2022.975894
24
Hothorn T. Bretz F. Westfall P. Heiberger R. M. Schuetzenmeister A. Scheibe S. (2022). Simultaneous inference in general parametric models. Inst. Für. Statistik50 (3), 346–63.
25
Jones N. P. Kabay L. Semon Lunz K. Gilliam D. S. (2021). Temperature stress and disease drives the extirpation of the threatened pillar coral, Dendrogyra cylindrus, in southeast Florida. Sci. Rep.11, 1–10. doi: 10.1038/s41598-021-93111-0
26
Kaczmarsky L. Draud M. Williams E. (2005). Is there a relationship between the proximity to sewage effluent and the prevalence of coral diseases? Caribb J. Sci.41, 124–137.
27
Kassambara A. (2020). rstatix: pipe-friendly framework for basic statistical tests. Available at: https://CRAN.R-project.org/package=rstatix (Accessed March 2021).
28
Kramer P. R. Kramer J. Roth L. Larios D. (2022). “Field guide for monitoring coral disease outbreaks in the mesoamerican region,” in Integrated ridge to reef management of the mesoamerican reef ecoregion project.
29
Kramer P. Roth L. Lang J. (2019). Map of stony coral tissue loss disease outbreak in the caribbean. Available online at: www.agrra.org. Accessed Sept. 12, 2022.
30
Kuta K. G. Richardson L. L. (2002). Ecological aspects of black band disease of corals: Relationships between disease incidence and environmental factors. Coral Reefs21, 393–398. doi: 10.1007/s00338-002-0261-6
31
Lafferty K. D. Harvell C. D. (2014). The role of infectious diseases in marine communities. Mar. Community Ecol. Conserv., 85–108. Chapter 5, Sunderland, MA: Sinauer Associates.
32
Landsberg J. H. Kiryu Y. Peters E. C. Wilson P. W. Perry N. Waters Y. et al . (2020). Stony coral tissue loss disease in Florida Is associated With disruption of host–zooxanthellae physiology. Front. Mar. Sci.7, 1–24. doi: 10.3389/fmars.2020.576013
33
Lapointe B. E. Barile P. J. Littler M. M. Littler D. S. Bedford B. J. Gasque C. (2005). Macroalgal blooms on southeast Florida coral reefs: I. Nutrient stoichiometry of the invasive green alga Codium isthmocladum in the wider Caribbean indicates nutrient enrichment. Harmful Algae4, 1092–1105. doi: 10.1016/j.hal.2005.06.004
34
Lapointe B. E. Brewton R. A. Herren L. W. Porter J. W. Hu C. (2019). Nitrogen enrichment, altered stoichiometry, and coral reef decline at Looe Key, Florida Keys, USA: a 3-decade study (Berlin Heidelberg: Springer).
35
Littler M. M. Littler D. S. Brooks B. L. (2006). Harmful algae on tropical coral reefs: Bottom-up eutrophication and top-down herbivory. Harmful Algae5, 565–585. doi: 10.1016/j.hal.2005.11.003
36
Meiling S. S. Muller E. M. Lasseigne D. Rossin A. Veglia A. J. MacKnight N. et al . (2021). Variable species responses to experimental stony coral tissue loss disease (SCTLD) exposure. Front. Mar. Sci.8, 1–12. doi: 10.3389/fmars.2021.670829
37
Meiling S. Muller E. M. Smith T. B. Brandt M. E. (2020). 3D photogrammetry reveals dynamics of stony coral tissue loss disease (SCTLD) lesion progression across a thermal stress event. Front. Mar. Sci.7, 1–12. doi: 10.3389/fmars.2020.597643
38
Muller E. M. Sartor C. Alcaraz N. I. van Woesik R. (2020). Spatial epidemiology of the stony-coral-tissue-loss disease in Florida. Front. Mar. Sci.7, 163. doi: 10.3389/fmars.2020.00163
39
Olejnik S. Algina J. (2003). Generalized eta and omega squared statistics: measures of effect size for some common research designs. Psychol. Methods8, 434–447. doi: 10.1037/1082-989X.8.4.434
40
Palacio-Castro A. M. Dennison C. E. Rosales S. M. Baker A. C. (2021). Variation in susceptibility among three Caribbean coral species and their algal symbionts indicates the threatened staghorn coral, Acropora cervicornis, is particularly susceptible to elevated nutrients and heat stress. Coral Reefs40, 1601–1613. doi: 10.1007/s00338-021-02159-x
41
Papke E. Carreiro A. Dennison C. Deutsch J. M. Isma L. M. Meiling S. S. et al . (2023). Stony coral tissue loss disease: a review of emergence, impacts, etiology, diagnostics, and intervention. Front Mar Sci10, 1–23. doi: 10.3389/fmars.2023.1321271
42
Pollock F. J. Morris P. J. Willis B. L. Bourne D. G. (2011). The urgent need for robust coral disease diagnostics. PloS Pathog.7 (10), e1002183. doi: 10.1371/journal.ppat.1002183
43
Precht W. (2021). Failure to respond to a coral disease epizootic in Florida: Causes and consequences. Rethink Ecol.6, 1–47. doi: 10.3897/rethinkingecology.6.56285
44
Precht W. F. Gintert B. E. Robbart M. L. Fura R. Van Woesik R. (2016). Unprecedented disease-related coral mortality in Southeastern Florida. Sci. Rep.6, 31374. doi: 10.1038/srep31374
45
Randazzo-Eisemann Á. Garza-Pérez J. R. Penié-Rodriguez I. Figueroa-Zavala B. (2021). 25 years of multiple stressors driving the coral-algae phase shift in Akumal, Mexico. Ocean Coast. Manag214, 1–12. doi: 10.1016/j.ocecoaman.2021.105917
46
R Core Team (2018). R: A Language and Environment for Statistical Computing. Vienna: R Foundation for Statistical Computing.
47
Richardson L. L. (1998). Coral diseases: what is really known? Trends Ecol. Evol.13, 438–443. 10.1016/S0169-5347(98)01460-8
48
Sharp W. Maxwell K. Smith K. Hunt J. (2020). Evaluating the small-scale epidemiology of the stony-coral -tissue-loss-disease in the middle Florida Keys. PLoS One15, e0241871.
49
Shilling E. N. Combs I. R. Voss J. D. (2021). Assessing the effectiveness of two intervention methods for stony coral tissue loss disease on Montastraea cavernosa. Sci. Rep.11, 1–11. doi: 10.1038/s41598-021-86926-4
50
Studivan M. S. Rossin A. M. Rubin E. Soderberg N. Holstein D. M. Enochs I. C. (2022). Reef sediments can act as a stony coral tissue loss disease vector. Front. Mar. Sci.8, 815698. doi: 10.3389/fmars.2021.815698
51
Sutherland K. P. Porter J. W. Turner J. W. Thomas B. J. Looney E. E. Luna T. P. et al . (2010). Human sewage identified as likely source of white pox disease of the threatened Caribbean elkhorn coral, Acropora palmata. Environ. Microbiol.12, 1122–1131. doi: 10.1111/j.1462-2920.2010.02152.x
52
Van Woesik R. Randall C. J. (2017). Coral disease hotspots in the Caribbean. Ecosphere8, 1–10. doi: 10.1002/ecs2.1814
53
Vega Thurber R. Mydlarz L. D. Brandt M. Harvell D. Weil E. Raymundo L. et al . (2020). Deciphering coral disease dynamics: integrating host, microbiome, and the changing environment. Front. Ecol. Evol.8, 1–18. doi: 10.3389/fevo.2020.575927
54
Vega Thurber L. R. Burkepile D. E. Fuchs C. Shantz A. A. Mcminds R. Zaneveld J. R. (2014). Chronic nutrient enrichment increases prevalence and severity of coral disease and bleaching. Glob Chang Biol.20, 544–554. doi: 10.1111/gcb.12450
55
Vollmer S. V. Kline D. I. (2008). Natural disease resistance in threatened staghorn corals. PloS One3, 1–5. doi: 10.1371/journal.pone.0003718
56
Voss J. D. Richardson L. L. (2006). Nutrient enrichment enhances black band disease progression in corals. Coral Reefs25, 569–576. doi: 10.1007/s00338-006-0131-8
57
Walker B. K. Klug K. (2015). Southeast florida large coral assessment 2015 NSUWorks citation. 1–151. https://nsuworks.nova.edu/occ_facreports/125
58
Walker B. K. Turner N. R. Noren H. K. G. Buckley S. F. Pitts K. A. (2021). Optimizing stony coral tissue loss disease ( SCTLD ) intervention treatments on Montastraea cavernosa in an endemic zone. Front. Mar. Sci.8, 666224. doi: 10.3389/fmars.2021.666224
59
Walker B. K. Williams G. J. Aeby G. S. Jeffrey A. Whitall D. (2022). Environmental and human drivers of stony coral tissue loss disease ( SCTLD ) incidence within the Southeast Florida Coral Reef Ecosystem Conservation Area Final Report Report generated for : Florida Department of Environmental Protection Office of Resilie1–36.
60
Walton C. J. Hayes N. K. Gilliam D. S. (2018). Impacts of a regional, multi-year, multi-species coral disease outbreak in Southeast Florida. Front. Mar. Sci. 5. doi: 10.3389/fmars.2018.00323
61
Weil E. (2004). “Coral reef diseases in the wider caribbean”, in Coral Heal Dis. Eds. RosenbergE.LoyaY. (Berlin, Heidelberg: Springer), 35–68. doi: 10.1007/978-3-662-06414-6_2 Weisburg,
62
Whitall D. Bricker S. Cox D. Baez J. Stamates J. Gregg K. et al . (2019). Southeast Florida reef tract water quality assessment. NOAA Tech Memo NOS NCCOS271, 116. doi: 10.25923/kyft-ja41
63
Wickham H. Chang W. (2014). Package ggplot2: An implementation of the grammar of graphics. Creat elegant Data Vis. using Gramm Graph1, 1–189.
64
Williams S. D. Walter C. S. Muller E. M. (2021). Fine scale temporal and spatial dynamics of the stony coral tissue loss disease outbreak within the lower Florida Keys. Front. Mar. Sci.8, 631776. doi: 10.3389/fmars.2021.631776
65
Worm B. Reusch T. B. H. Lotze H. K. (2000). In situ nutrient enrichment: Methods for marine benthic ecology. Int. Rev. Hydrobiol85, 359–375. doi: 10.1002/(ISSN)1522-2632
66
Young G. C. Dey S. Rogers A. D. Exton D. (2018). Correction: Cost and time-effective method for multi-scale measures of rugosity, fractal dimension, and vector dispersion from coral reef 3D models (PLoS ONE, 2018)12: 4 (e0175341) DOI : 10.1371/journal.pone.0175341). PloS One13, 1–18. doi: 10.1371/journal.pone.0201847
Summary
Keywords
SCTLD, coral disease, nutrient pollution, structure-from-motion photogrammetry, Florida’s coral reef
Citation
Carreiro AM, Eckert RJ, Sturm AB, Ingalls TC, Combs IR, Walker BK and Voss JD (2024) Assessment of nutrient amendments on stony coral tissue loss disease in Southeast Florida. Front. Mar. Sci. 11:1384534. doi: 10.3389/fmars.2024.1384534
Received
09 February 2024
Accepted
09 September 2024
Published
10 October 2024
Volume
11 - 2024
Edited by
Lorenzo Alvarez-Filip, National Autonomous University of Mexico, Mexico
Reviewed by
Ryan McMinds, University of South Florida, United States
Stephanie M. Rosales, Oregon State University, United States
Updates
Copyright
© 2024 Carreiro, Eckert, Sturm, Ingalls, Combs, Walker and Voss.
This is an open-access article distributed under the terms of the Creative Commons Attribution License (CC BY). The use, distribution or reproduction in other forums is permitted, provided the original author(s) and the copyright owner(s) are credited and that the original publication in this journal is cited, in accordance with accepted academic practice. No use, distribution or reproduction is permitted which does not comply with these terms.
*Correspondence: Ashley M. Carreiro, acarreiro2019@fau.edu; Joshua D. Voss, Jvoss2@fau.edu
Disclaimer
All claims expressed in this article are solely those of the authors and do not necessarily represent those of their affiliated organizations, or those of the publisher, the editors and the reviewers. Any product that may be evaluated in this article or claim that may be made by its manufacturer is not guaranteed or endorsed by the publisher.