Abstract
Recent studies have revealed that stony corals create their extracellular skeletons via biologically controlled calcification, in which amorphous calcium carbonate (ACC), regarded as precursors of aragonite crystals, have been observed at nanoscale using electron microscopy. However, the exact mechanism by which ACC is generated, and how it contributes to skeletal growth in coral calcifying tissue, remains enigmatic. The septal skeleton of an individual polyp is composed of radially aligned plates extending upward from the aboral calcifying tissue. This structure includes microstructure known as the centers of calcification (CoC). However, despite its importance, direct in vivo observation of septal growth has not been reported. Observations under transmitted illumination using polarized light microscopy on calcifying tissue of young Acropora digitifera revealed small crystals, a few micrometers in size, that accompany subtle movements and that emerge exclusively on the inner wall of the pocket in extracellular calcifying fluid (ECF). Crystal growth initiated from small, scattered crystals on a glass plate resembles this phenomenon observed in coral skeletons. Time-lapse photographs of 12 individuals in early primary polyp settlement revealed this process in three individuals, documenting 13 of these crystal events. This phenomenon occurred solely at the bases of subsequently formed septa. These crystals differ notably from fusiform crystals and from dumbbell-like or rod-like crystals growing individually. Upright two-photon microscopy captured movement of sub-micron-sized fluorescent calcein-accumulating particles, emphasizing their presence on the surface of the growing fronts of septa. Methodological advances that facilitate comprehensive in vivo observation of sub-micron-sized structures, calcein-accumulating particles to the skeleton, are needed to develop a more detailed understanding of coral skeletal growth.
1 Introduction
Skeletal morphology of stony corals is diverse, but even though coral three-dimensional structures are used for species identification, processes of skeletal development at the tissue level remain poorly understood. Coral tissues consist of ectoderm and endoderm, separated by a gelatinous non-cellular layer known as mesoglea (Johnston, 1980). Ectoderm faces the seawater on the oral side, while the aboral side forms a layer of calcifying tissue that creates the exoskeleton through a biologically controlled process (Allemand et al., 2011; Tambutté et al., 2011; Drake et al., 2020). Coral skeletons combine an organic fraction with calcium carbonate (CaCO3), primarily in the form of aragonite, at the site of calcification (Clode & Marshall, 2002). The fluid-filled extracellular space between the skeleton and calicoblastic tissue is called the extracellular calcifying fluid (ECF). The terms extracellular calcifying medium (ECM), and sub-calicoblastic medium (SCM) are often used interchangeably; however, in this paper, only ECF will be used. The ECF is essential for acquiring ions from seawater and for regulating their concentrations (Allemand et al., 2011; Venn et al., 2011; Venn et al., 2013), particularly calcium and carbonate. Aragonite supersaturation is necessary for coral calcification (Sevilgen et al., 2019; Ram & Erez, 2023). Several studies using pH-dependent fluorescent dyes in combination with electrode tips have shown that the active removal of protons from the ECF results in a higher pH (approximately 0.5 pH units) and increased carbonate ion concentrations compared to the surrounding seawater (Venn et al., 2011; Cai et al., 2016; Sevilgen et al., 2019). It should also be noted that calcium ion concentrations in ECF are higher than in seawater by about 5 mM (Sevilgen et al., 2019). The skeletal organic matrix assumes a dual role, promoting calcification and providing a skeletal framework (Barnes, 1970; Puverel et al., 2005; Drake et al., 2020; Mummadisetti et al., 2021; Zaquin et al., 2021).
Septa are the vertical ridges or partitions found in corallites of stony corals. They are essential for classification due to their considerable variation in shape, size, and arrangement among coral species. These variations are governed by genetic factors and are specific to each taxon. The internal structure of skeletal corallites comprises various components, with two main regions traditionally distinguished: centers of calcification (CoC) and the fibrous skeleton that extends radially from the CoC (Cuif & Dauphin, 1998; Stolarski, 2003; Benzerara et al., 2011). In the primary coral polyp, septal growth initiates skeleton formation from basal plates of CoC (Sugiura et al., 2021). At the growing tips of septa in species such as Acropora (Gladfelter, 1983) and Pocillopora (Gilis et al., 2014; Gilis et al., 2015), fusiform-like crystals have been observed. Despite numerous fine-scale observations, the process by which septal growth is associated with generation of CoCs in live coral skeletal development has not been reported. Although CoCs in mature skeletons are thought to contain ACC and appear more granular than the fibers at a micron scale, both microstructural elements demonstrate clear evidence of growth through particle and ion attachment at the nanoscale (Mass et al., 2017a; Sun et al., 2020). The 100-nm-sized granular units align with the current coral skeletal growth model proposed by Gilbert et al. (2022), which integrates ACC particle attachment and ion-by-ion crystal formation (De Yoreo et al., 2015).
Techniques for nondestructive observation of the micro- and ultra-structural skeletal growth dynamics of living corals, as well as for discriminating between ACC and crystalline structures, are still developing. In 2006, Raz-Bahat et al. (2006) utilized optical microscopy to observe growth of live coral skeletons by affixing a coral nubbin to a glass coverslip and then attaching it to the bottom of a Petri dish. Similarly, induction of metamorphosis from planula larvae to early polyps in Acropora corals using the Hym-248 peptide (Iwao et al., 2002) allowed documentation of early skeletal development of coral polyps on glass substrates (Fujiwara et al., 2009) using polarized microscopy. These improvements in experimental techniques have made it possible to observe progression of skeletal formation at the bottom of live corals, albeit with a resolution that is inferior to that of SEM or AFM. Skeletal formation of aposymbiotic coral primary polyps was investigated using calcein, a fluorescent indicator, allowing observation of nascent crystals and pulsing motions of a pocket of ECF (Ohno et al., 2017a; Ohno et al., 2017b; Khalifa et al., 2021).
Our observations using polarized light microscopy show that small crystals emerged from pre-septa pockets of ECF and then adhere to glass plates, a detail that has not been previously observed in live corals. We documented CoC formation accompanied by appearance of micrometer-size crystals, culminating in formation of septa originating from the base of calcifying tissue. Furthermore, we utilized two-photon microscopy from oral side tissue to visualize particles at the septal growth front, in combination with calcein staining (Ohno et al., 2017b; Venn et al., 2020). In vivo imaging with two-photon laser scanning microscopy typically allows enhanced tissue penetration and reduces scattering compared to traditional single-photon confocal microscopy. This method enables more precise control over excitation depth by confining excitation to a focal volume, thus addressing issues such as photobleaching and phototoxicity (Denk et al., 1990; Zipfel et al., 2003; Helmchen and Denk, 2005). With this imaging method, sub-micron-size particles in proximity to moving septa were captured in time-lapse imaging in coral tissue in a nondestructive manner.
2 Materials and methods
2.1 Preparation of coral primary polyps
Several colonies of Acropra digitifera were collected in shallow water of Bise, Motobu-cho, Kunigami-gun, Okinawa (Suzuki et al., 2023), and were kept in an outdoor tank at the Sesoko Experimental Station, University of the Ryukyus, for about two weeks. The presence of a bundle set was confirmed in June 2013 and 2023, and gametes from five colonies were crossed in the facility to obtain fertilized eggs. Afterward, they were nurtured for three days until the planula larva stage, with regular water changes. Subsequently, they were transported by air to Kitasato University, in Sagamihara, Kanagawa Prefecture, where they were cultured in natural seawater from coastal areas of the Ogasawara Islands. This seawater is low in nutrients, making it suitable for coral breeding purposes. Upon acquisition, the natural seawater was stored in a refrigerated room (4°C) for approximately two weeks to reduce bacterial activity. Subsequently, it was filtered through 0.2-µm filters before being utilized in experiments (Filtered seawater: FSW). A penicillin and streptomycin-amphotericin B suspension (antibiotic-antimycotic solution, ×100), was procured from Antibiotic-Antifungal Solution, from Fujifilm Wako Pure Chemicals Co (Chuo-Ku, Osaka, Japan) about one-tenth of the prescribed quantity was added to culture medium. Coral planula larvae underwent metamorphosis and settled in dishes containing commercial peptide Hym-248 (Eurofins Genomics, Tokyo, Japan) in the laboratory. This peptide was used at a final concentration of 10 µM to obtain aposymbiotic coral primary polyps, as per Iijima et al. (2021). To induce planulae to metamorphose into primary polyps, Hym-248 peptide was added, and planulae were allowed to settle for several hours. In 400 µL of solution, approximately 70–80% of planula larvae successfully settled on glass substrates (Iwakai No. 1S, thickness: 0.15–0.18 mm, AGC Techno Glass Co., LTD. Shizuoka, Japan). Our current standard procedure involves overnight incubation of larvae for about 12 h following metamorphosis. After this incubation period, any larvae that had not settled were removed by pipetting upon addition of seawater. The final volume of the observation solution in the glass-bottomed dish was about 4 mL. Both culturing and observations were conducted at an induction temperature of 25.0–26.5°C.
2.2 Polarized light microscopy
Approximately 10 individuals were situated on each glass-bottomed dish, and 12 individuals were examined using this method. Polarizing microscopy was conducted utilizing an inverted microscope AXIO Vert.A1 from Carl Zeiss AG, equipped with a Zeiss microscope digital camera (AxioCam ERc5c) and controlled by Zeiss ZEN software (blue edition), resulting in 2560 ×1920-pixel resolution. Sequential observation of basal discs of primary polyps followed the method of Fujiwara et al. (2009). For subjects in which small crystals were visible during time-lapse photography, 30 – 60-s observations were made with illumination (Figure 1). Throughout the entire observation period, images were captured at intervals of several minutes. Subsequently, images were processed using Zen software and converted into uncompressed AVI files.
Figure 1
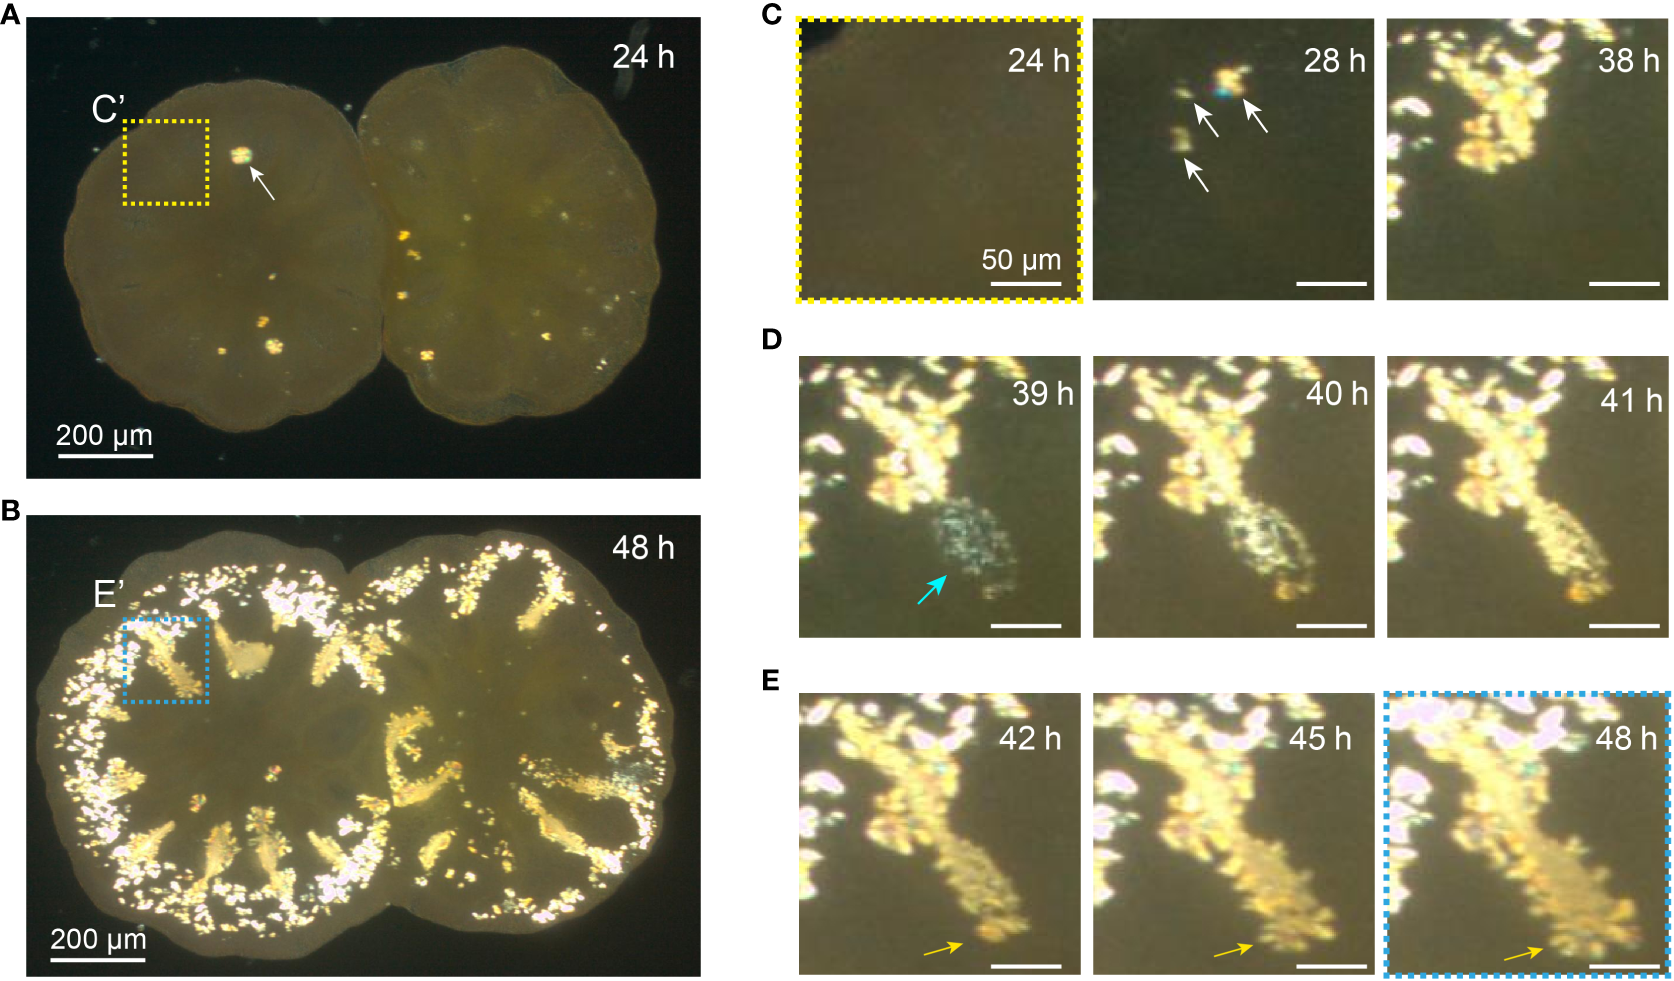
Appearance of crystal particles in primary polyps. (A) This polarized light image illustrates the contact between calicoblastic tissues of two primary polyps 24 h after addition of Hym-248. The area enclosed by dotted squares (C’) corresponds to an enlarged image from Figure C At this time, small crystals have not yet appeared. A white arrow indicates a developing crystal with an approximate diameter of 30 µm. Also see Supporting Video 1(B) After 48 h post-metamorphosis induction, the same specimens display small crystals around their peripheries, in close proximity to strained septa. The dotted square (E’) aligns with the enclosed image in Figure (E). (C) An enlarged image of coral calcified tissue in the upper left-hand corner in Figure A, depicting the respective time intervals (24, 28, and 38 h). Following induction of metamorphosis, the image at 24 h does not reveal any discernible bright spots associated with calcium carbonate. However, by 28 h, small crystals begin to appear (denoted by arrows), and subsequently grow by 38 h. (D) These successive images correspond to the same area seen in Figure C and indicate emergence of small crystals. Within an hour, small crystals emerge nearly simultaneously in an elliptical pattern at the location where septa form (blue arrow). An hour later, small crystals have coalesced, and within 2 h, some pre-septa have formed. Scale bars: 50 µm. Also see Supporting Video 2. (E) From 42 - 48 h after settlement, crystal orientation exhibits lateral growth toward the septa (orange arrows). Scale bars: 50 µm.
2.3 Image analysis
Generation of time-lapse videos using the polarizing microscope was followed by video editing in ImageJ Fiji. All calculations pertaining to crystal formation times were verified visually, and as there was no need for brightness adjustments, analysis was performed using raw data. ImageJ Fiji was employed for tasks such as cropping and scaling images, and for inserting time information. Long axes of crystals were also measured using the same software. Measurements of long axes of small crystals focused on regions indicated. Small crystals were measured from the point at which they became visible in Image J and could be detected as bright spots. Sizes of septum formation areas and the time taken for crystals to adhere to the glass bottom (retention) were calculated using the same software. During deposition of small crystals, extracellular calicoblastic fluid (ECF) pockets exhibited pulsing motions.
Consequently, the longest image of these pockets was utilized to measure inner pockets of the ECF using ImageJ software. When calculating the correlation coefficient in Figure 2, the area was determined by considering the most expanded region of each inner pocket of the ECF, as they exhibited slight fluctuations. Statistics, such as correlation coefficients (R) and p-values, were calculated using R statistical software. The final assembly of the inner pocket of the ECF was outlined with dashed lines using Illustrator and displayed in the figure. The duration was defined from appearance of microcrystals to their adherence on the glass bottom and subsequent stabilization. Supporting movies were created with scale and time information added using ImageJ. Subsequently, Adobe Premiere Pro and Media Encoder were employed to compile AVI files in MPEG format.
Figure 2
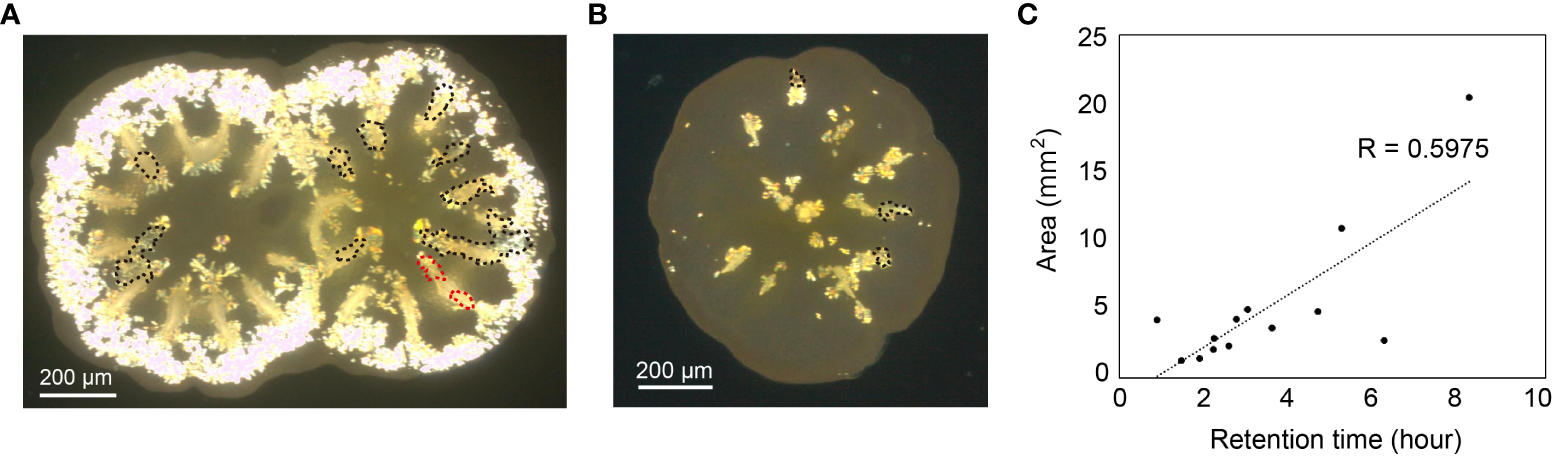
Location and the positional relationship of crystal deposition with septa at the coral basal plate are depicted in (A). The spatter phenomenon occurred in the enclosed dotted area (corresponding to Supporting Video 2) and is superimposed on the image taken 70 h post-metamorphosis. In this image, a dumbbell-shaped crystal already existed in a septal area, and the dotted encircled area was separated into two distinct regions (highlighted in red). (B) The spatter phenomenon was also observed in another individual, as depicted in an image captured 43 h post-settlement. (C) The correlation between the area of sputter deposition (x-axis) and the duration (y-axis, from crystalline emergence to settlement; duration) was estimated.
2.4 Two-photon microscopy
Specimens were incubated for 2 h in 100 µM calcein (Bis[N,N-bis(carboxymethyl)aminomethyl] fluorescein (Sigma-Aldrich Japan) before microscopic analysis. Calcein binds to alkaline earth metals, including calcium; thus, the signal increases dramatically where crystal growth occurs (Figures 3, 4). Significantly, use of 100-µM calcein with pH adjustment did not induce notable changes in coral skeletal growth (Ohno et al., 2017b). The fluorophore signal mitigated interference from coral autofluorescence (Ohno et al., 2017b; Venn et al., 2020). We employed primary polyps of Acropora digitifera to induce metamorphosis using the Hym-248 peptide. Natural, filtered seawater used for fluorescence observations was obtained at the Sesoko Experimental Facility, University of the Ryukyus. The final pH was adjusted to 8.1 on the NBS (National Bureau of Standards) pH scale using NaOH. For polyps that settled on glass-bottomed dishes, observations were made at septal growth fronts. Live imaging was performed using an upright microscope (Nikon Ni-E) equipped with an upright, two-photon laser scanning system (Nikon A1RMP) featuring an Apo LWD 25x 1.10W DIC N2 objective. This allowed visualization of skeletal growth in the septal region. Images were processed in Nikon Elements with minimal global adjustment of LUTs (Look-Up Tables) for acquired channels. A near-infrared (NIR) ultrashort pulse laser (Insight Deepsea laser, Spectra Physics, Milpitas, United States), operating from 820–1300 nm, was employed for calcein signal excitation at 920 nm. Emission filters were configured at 520–550 nm. Laser power was optimized to a low level after completion of 3D imaging (LP: 3.5%) during the pre-calcification stage (Supplementary Figure 1). Among examined individuals (n = 5), no phototoxic effects, such as tissue damage, were observed (Laissue et al., 2020). Images (512x512 pixels) were captured at 2 frames per sec. Figure 3 comprises 23 optical slices, while Figures 4A, B consist of 19 slices and Figures 5C–G includes 12 slices. The z-step size for each reconstruction was set to 3.66 µm.
Figure 3
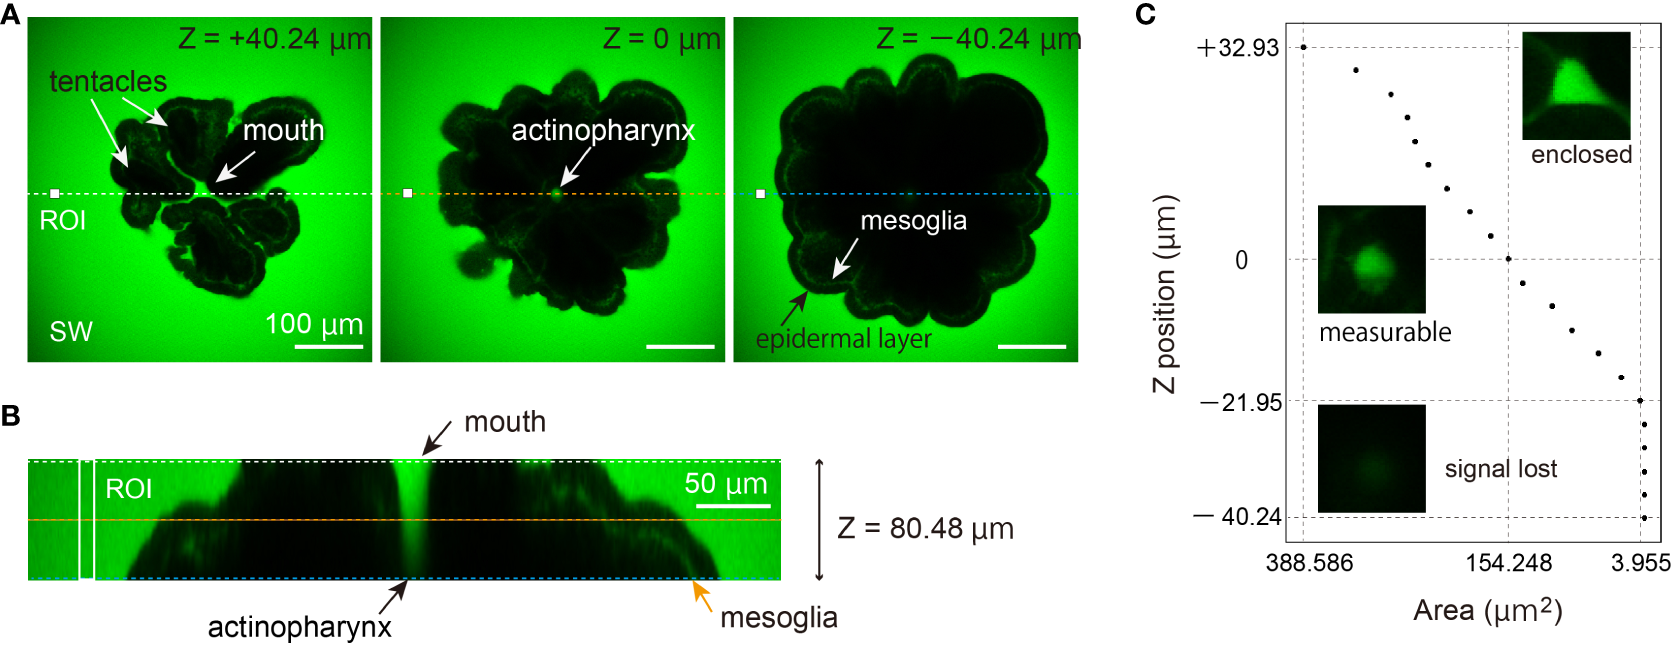
Two-photon imaging one day post-metamorphosis. At this follow-up (Ohno et al., 2017b), neither septa nor basal plates have initiated skeleton formation. (A) The tissue appears black in the fluorescent dye, and no auto-fluorescent signal can be observed in the calcein-FSW solution. The central optical plane of 80.48 µm volume was set as the reference (z=0 µm). Depth information is indicated in the upper right corner of each figure. The mouth and tentacles appear in black (z = +40.24 µm), while at z = 0 µm, the cross-section of the actinopharynx is seen as a green signal. However, the actinopharynx signal decreases, and the layer of mesoglea can be observed inside the epidermal layer (z = -48.24 µm). The colored dashed lines correspond to the position and alignment of the optical cross-section in (B) Scale bars: 100 µm. (B) Optical cross-section of 80.48 µm. ROI and colored dotted line correspond in (A, C) Estimation of the cross-sectional area of the actinopharynx based on the fluorescence of calcein. The x-axis represents the estimated actinopharynx area (mm2), while the y-axis reflects depth information, and the representative appearance of the section is depicted in photographs.
Figure 4
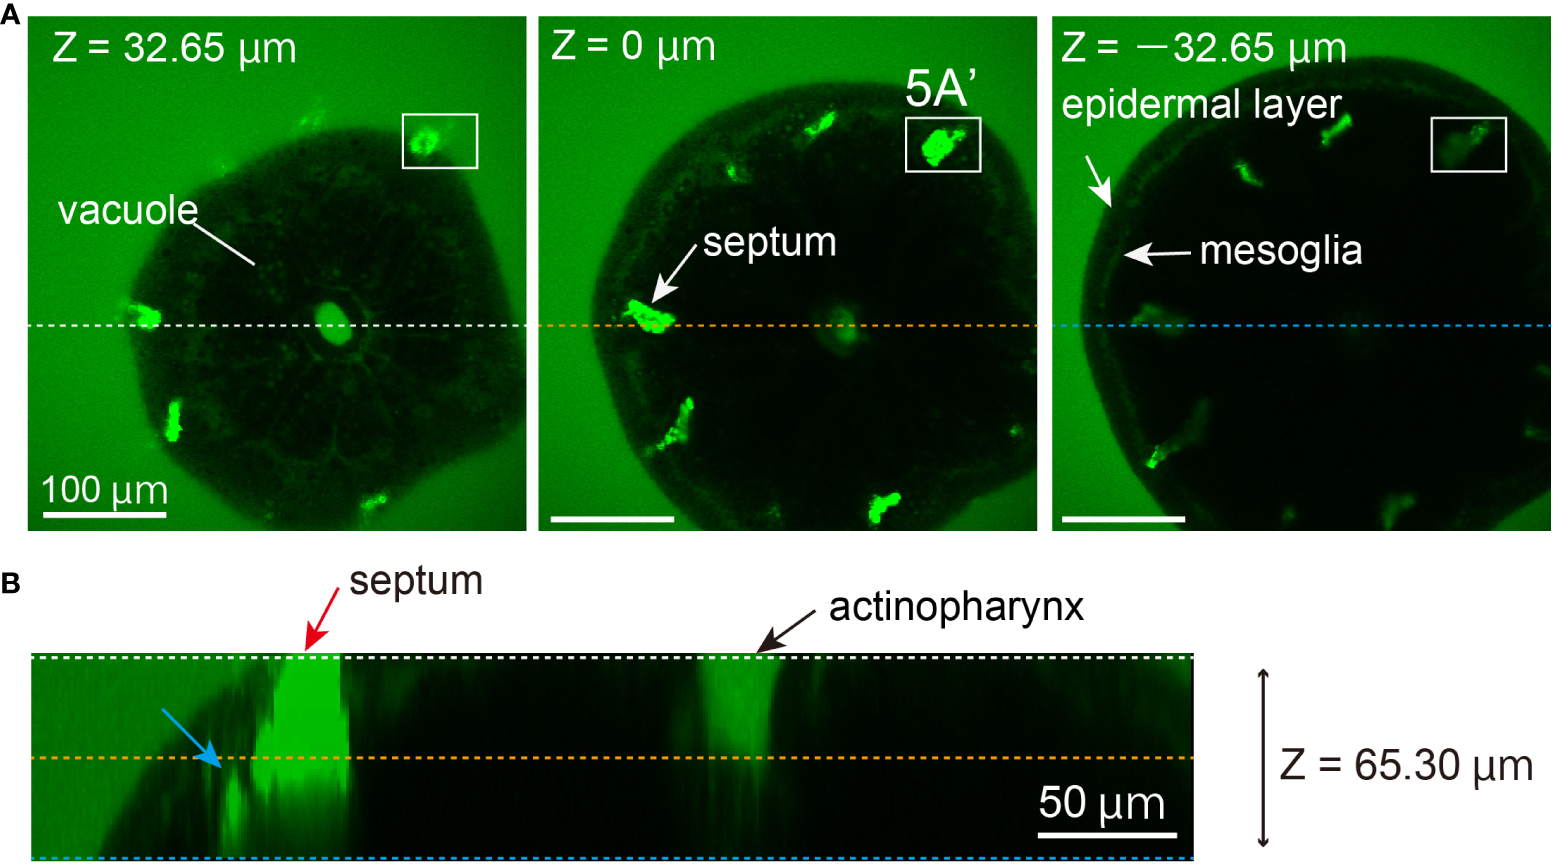
In vivo observation of septal growth in a primary polyp, 3 days post-metamorphosis. (A) Calcein-FSW solution was added 2 h before observation. Calcein accumulates in septa (white arrow), and a signal from the actinopharynx was detected at the same level as calcein-FSW. Due to the concentration of calcein in septa, the laser power was adjusted to almost the minimum (0.6%). Under these conditions, the fluorescent signal is absent. However, in the top image, there is leakage of fluorescence from septal spicules in the tissue, indicating an artifact. The Z position is displayed in the upper left corner of each image. The region inside the square corresponds to 5A. All scale bars: 100 µm. (B) An optical cross-section at 65.30 µm reveals that the fluorescent signal from the crystal composing septa in the tissue (blue arrows) as well as spicules of the septa (red arrows) can be detected at approximately 30 µm depth.
Figure 5
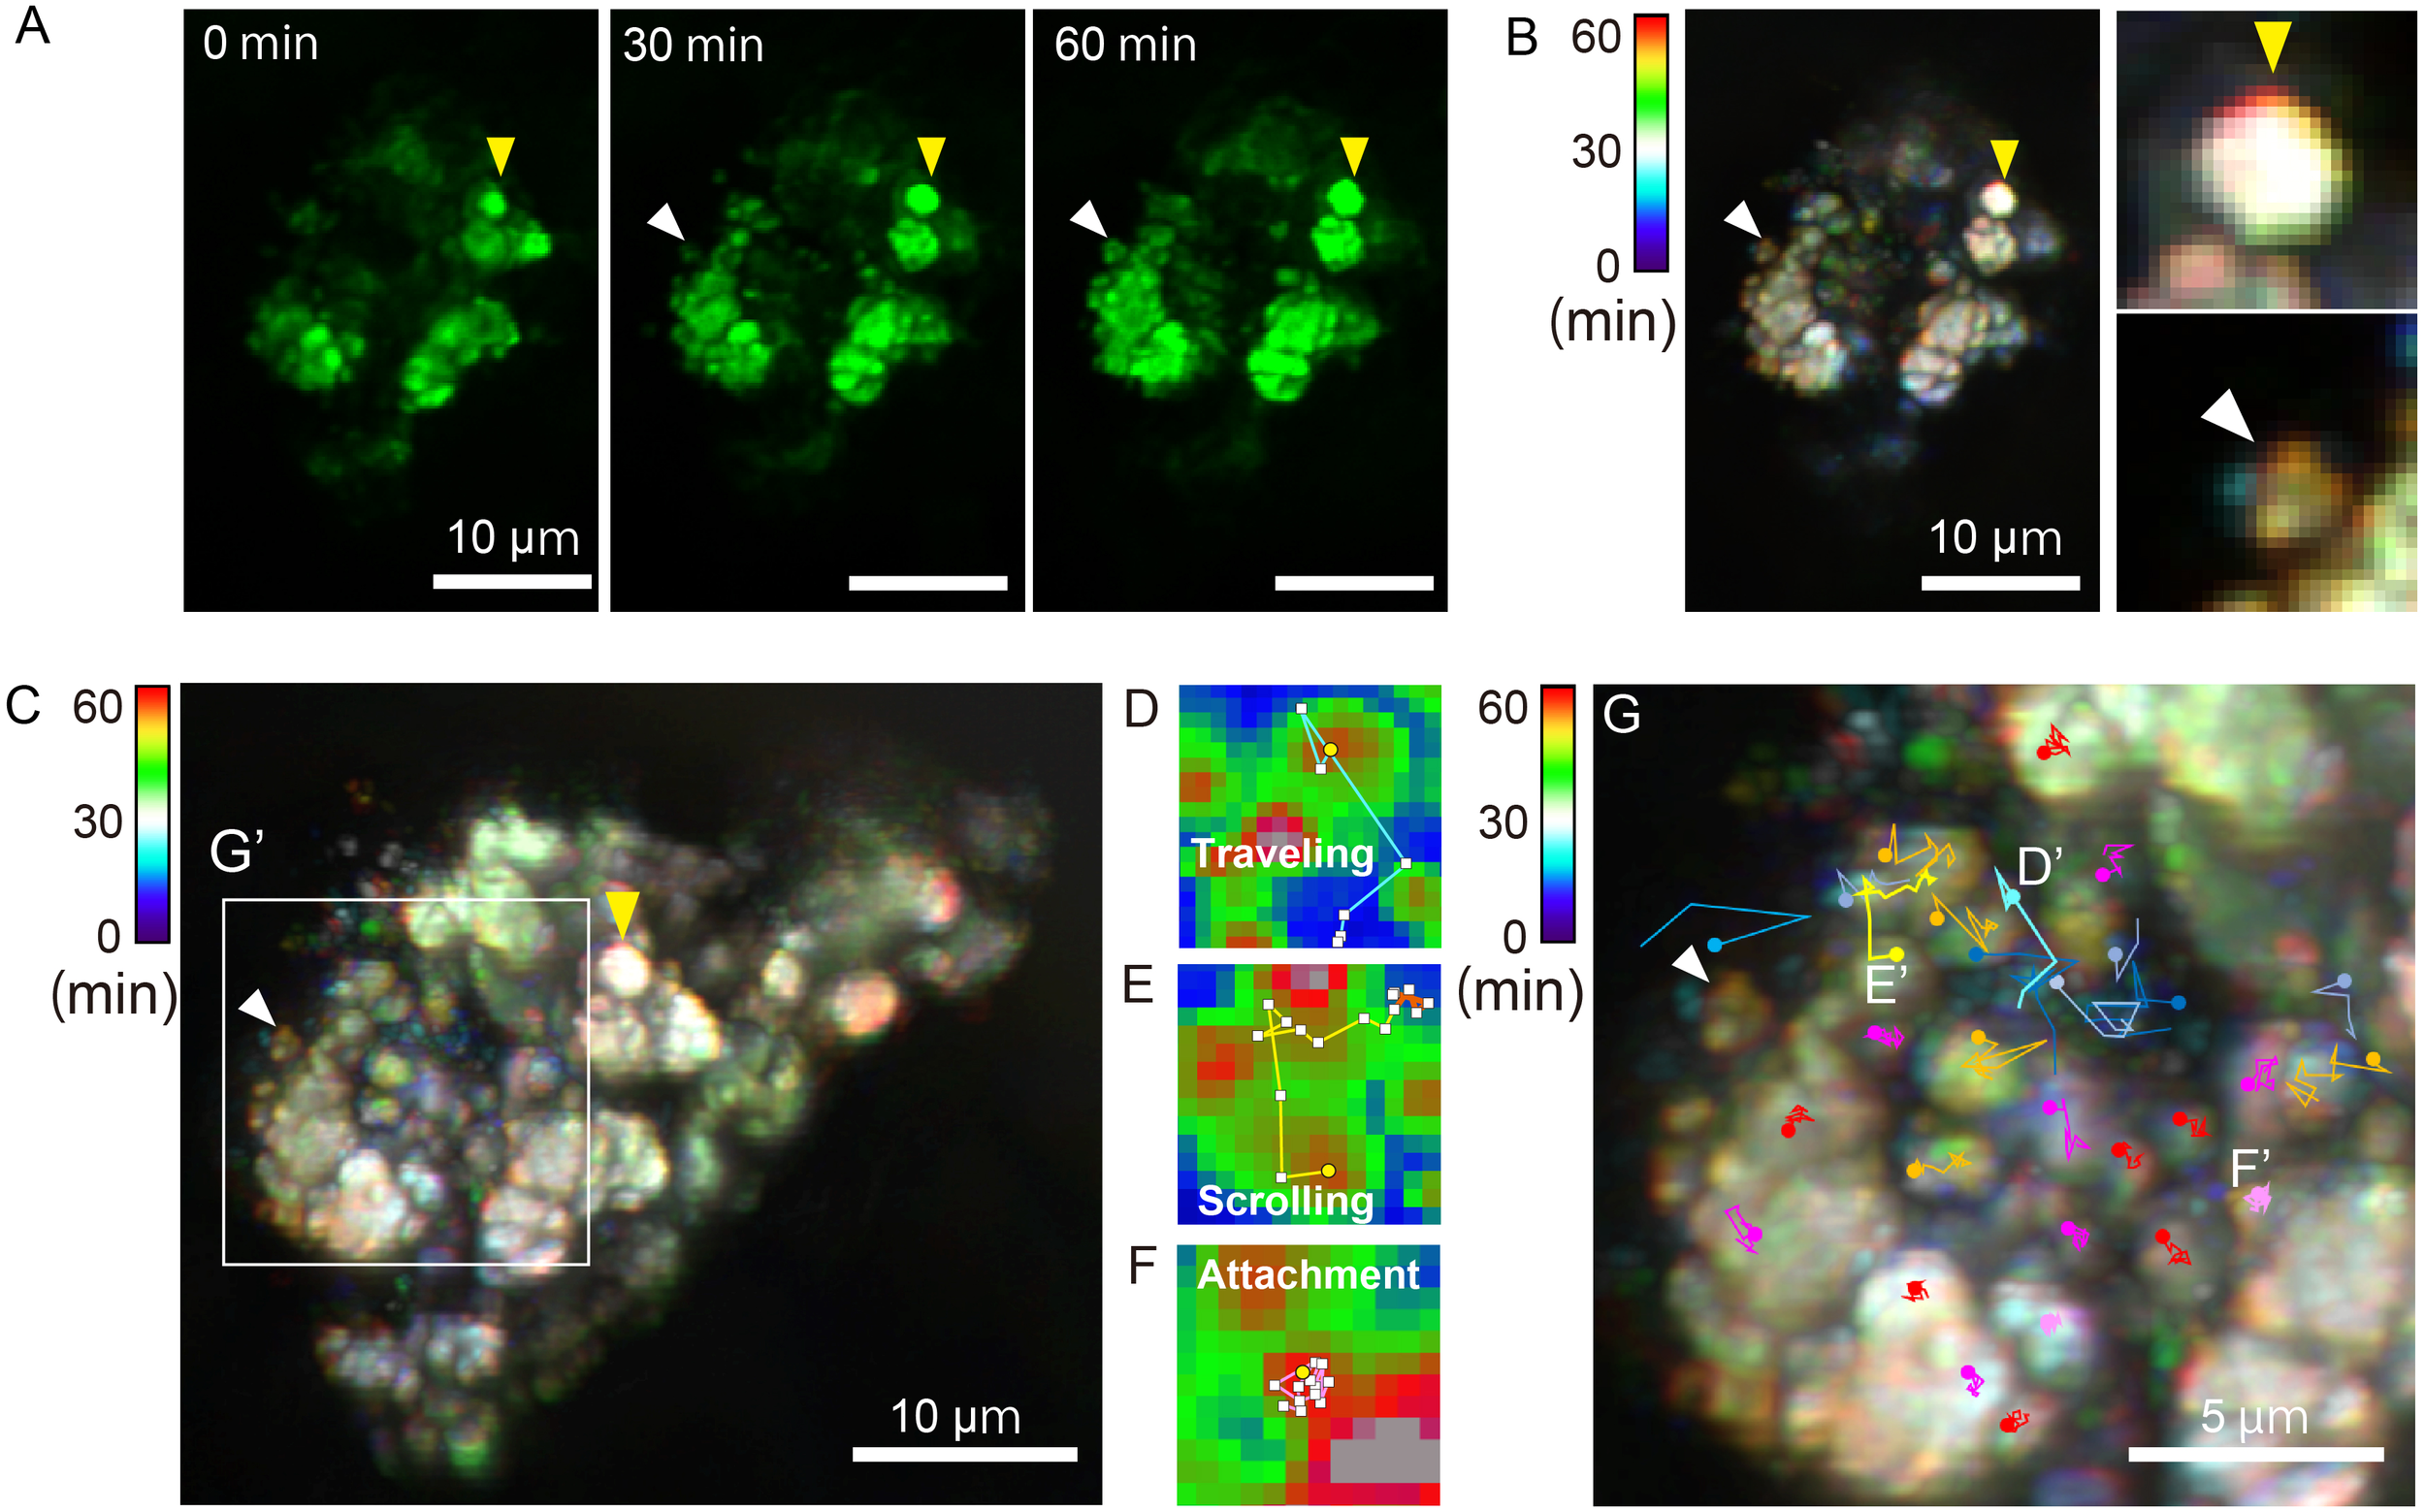
(A) Time-lapse imaging of optical sections of septa was conducted (Supporting Video 3), in the enclosed square in 4A. Yellow arrowheads indicate growing crystals, and white arrowheads point to a moving sub-µm-sized aggregated particle approaching the septa. All scale bars: 5 µm. (B) Overlapping time-lapse images (1-min intervals: 60 frames) in (A) were taken, and pseudo-colorization was applied using multiple exposure photography. The color bar in the upper left corner represents time. The redshift in images indicates a change in calcein signal distribution during the latter half of the 1-h time-lapse recording. (C) 4D imaging was conducted with the same septa as in A (Supporting Video 4). After creating a 4D image at 1-min intervals, a single overlay was performed from the top (depth: 40.24 µm, duration: 60 min). Similar to (B), pseudo-colorization was applied using multiple exposure photography. (D–F) Three patterns of representative particle trajectory are displayed. Pixel size = 0.16 µm (D) Particles move 10 pixels in 5 min or lose the signal along the way (blue line). (E) Traceability in yellow persisted for 60 min (12 points), transitioning to orange in the middle to later stages of the chase, marking particle retention (orange in color). (F) The fluorescent center has barely shifted from its initial position throughout the tracking process, indicated by particles colored red or magenta. (G) The white box in (C) is enlarged to display trajectories of 30 particles.
2.5 Particle tracking
For the particle tracking analysis, images of septa were superimposed to generate a composite 2D image. Subsequently, the central positions of each bright spot, representing particles, were determined as the intensity center for pixels (pixel size: 0.161µm), to optimize fluorescence intensity-based tracking efficiency. The trajectory of each particle was manually traced every 5 frames. Trajectories of 30 particles are superimposed onto the multiple-exposure photograph.
3 Results and discussion
3.1 Observation of small crystals using polarized light microscopy
Time-lapse photography using a polarizing microscope can be employed to illustrate coral crystal growth (Raz-Bahat et al., 2006; Fujiwara et al., 2009). Utilizing primary coral polyps, we observed emergence of small crystals on surfaces of dome-shaped pockets of ECF associated with tissue motion, followed by settling of small crystals on glass substrates (Figure 1; Supporting Video 1). The appearance of small suspended crystals in coral tissue (Ohno et al., 2017b), exhibiting movement and participating in skeletal formation, constitutes the early stage of crystal growth (Mass et al., 2017b). Figure 1C corresponds to 24–72 h after planula larva settlement (Stage B, in Gilis et al., 2014). Rod-shaped or fusiform crystals precipitate, and the outer basal plates of corals begin to form. These microscopic observations represent the initial process of crystal formation that has been previously reported.
Figures 1D, E illustrate deposition of small crystals at the site of calcification in primary coral polyps, where consecutive horizontal fibrous crystal growth patterns indicated the early stage of centers of calcification (CoC) (Supporting Video 2). This process is thought to involve template-induced nucleation of the mineral phase mediated by the skeletal organic matrix (SOM) (Drake et al., 2013; Ramos-Silva et al., 2013; Mass et al., 2014; Takeuchi et al., 2016; Von Euw et al., 2017; Sugiura et al., 2021). From 39 h post-metamorphosis, small crystalline structures, appearing faintly blue (Figure 5D), surround the inner surfaces of extracellular fluid (ECF) pockets. Possibly attached to the ECF pocket, these microcrystals move in sync with motions of the ECF pockets (~2.9 mm2) (Supporting Videos 1, 2), gradually turning yellowish during growth (from 40 h). As microcrystals settle (41h), crystal growth on fibers (Figure 1D) originates from these smaller crystals (42–48 h). These crystals exhibit lengths even smaller (n = 7, mean ± SEM: 3.46 ± 0.16 µm) than rod-shaped crystals (n = 7, mean ± SEM: 7.07 ± 0.60 µm), showing a statistically significant size difference (p < 0.05). When measuring small crystalline structures with a low-power objective, resolution is limited, so only bright spots were quantified. Moreover, it is possible to overestimate crystal sizes due to light leakage. Diameters of scattered crystals fall within the same size range (µm), classifying them as rod-shaped crystals.
CoCs are referred to as the Early Mineralization Zones (EMZs) (Cuif and Dauphin, 2005), or as Rapid Accretion Deposits (RAD) (Stolarski, 2003). Additionally, Stolarski (2003) introduced the term Thickening Deposits (TD) to describe fibrous parts of the skeleton. Dynamics of the initial septum formation process in this study, resemble a skeletal growth model based on numerous observations of coral structures and experimental labeling (Stolarski, 2003; Benzerara et al., 2011; Brahmi et al., 2012). According to this model of layered growth, the main disparity in skeletal growth among various skeletal components lies in the dynamics of growth. In regions of rapid growth, skeletal deposition occurs in the form of nanocrystalline material enriched in organics, termed rapid accretion deposits (RADs), whereas in regions of slower growth, the crystalline material tends to be more compact, forming thickening deposits (TDs). Importantly, evidence (Brahmi et al., 2012) suggests that formation of RADs is not a prerequisite for skeleton formation but represents only the rapid deposition phase of skeletal components. The nearly simultaneous emergence of tiny crystals at the growing front of septa, as illustrated by the authors (Figure 1D; Supporting Video 2), is fully consistent with the formation of RADs, whereas the formation of crystals oriented laterally to the septa (Figure 1E) would signify the initial appearance of TDs in the juvenile skeleton.
Scattered small crystals were exclusively observed in the pre-septa region (Figures 2A, B). This phenomenon occurred approximately 44 h post-metamorphosis (n = 13, mean ± SEM: 43.5 ± 2.87 hours). However, it could not be observed in all pre-septa regions, nor in all specimens (3 of 12 polyps, across 13 septal regions). Despite variations in the area of inner pockets of extracellular ECF, the time of slight crystal movement in tissue pockets of ECF does not correlate with the duration of small crystal emergence (R= 0.5975, p-value = 0.9849) (Figure 2C; Supplementary Table 1. This implies that during coral development, microcrystals were generated in intercellular spaces of the inner wall, as the ECF pocket gradually flattens. Under low-power polarized microscopy, we could not determine whether these small crystals exist intracellularly or in the intercellular space. At the tissue level, however, we speculate that small crystals accompanying pulsing motions of ECF pockets, concentrate on an organic substrate, leading to accumulation of small crystals and formation of septa (Figure 1D; Supporting Video 2).
3.2 Two-photon microscopy captured coral septa in the tissue
Pioneering coral physiology research utilizing two-photon microscopy examined autofluorescence in coral host tissue chromatophores and Symbiodiniaceae (chlorophyll a) simultaneously under excitation at 780 nm with 3D image creation (Sivaguru et al., 2021). In contrast, high concentrations of cell-impermeable calcein (Ohno et al., 2017b; Venn et al., 2020) resulted in suppression of coral calicoblasitc tissue color due to the brighter fluorescent background (Figure 3). Here, two-photon microscopy was employed to non-invasively visualize calcifying tissue from the oral side, enabling observation of septal growth in corals. This visualization method used calcein fluorophores to stain coral skeletons or ECF (Tambutté et al., 2012; Venn et al., 2013; Shapiro et al., 2016; Mass et al., 2017a; Mass et al., 2017b; Barott et al., 2020; Khalifa et al., 2021; Scucchia et al., 2021). This trial conducted during the summer of 2013 sought to determine the appropriate calcein concentration by employing a wide range of fluorescence microscopy methods. Two-photon microscopy with calcein staining enabled us to observe small, unfixed calcein accumulated particles at coral septa surfaces.
Observations in Figure 3 were conducted 12 h after induction of metamorphosis, and for primary polyps of A. digitifera, skeletal formation on the glass substrate commenced approximately 6 h thereafter (Ohno et al., 2017b). At this stage, no calcein accumulation was observed in relation to septal formation in near oral side tissue. Additionally, no vesicle-like structures were detected (n=3). The autofluorescent signal from the oral side of the tissue was minimal or absent in calcein solution, while the extracellular space containing calcein was visibly green (Figure 3A). Signals were consistently observed in the cavity leading from the mouth to the gastrovascular cavity (actinopharynx), as well as in the mesoglea. The average fluorescence intensity of a 400-µm2 region of interest (ROI) (Figure 3A) near coral tissue, indicated a slight increase in signal (2.5%) deeper in the same ROI. In this experiment, the tissue depth) at which the calcein signal could be detected with the IR laser entering from the top of the polyp (Figure 3B, is estimated at ~50 µm. When a 100-μm2 ROI was positioned on an upper focal plane, the average signal diminished about 90% at greater depths, making it impossible to measure deep tissue (Figure 3C). The specimen was scanned <30 s, making it improbable that tissue shrinkage occurred during observation. The estimated inner actinopharynx area is approximately 200–300 µm² (Figure 3C).
It is plausible, as demonstrated by Bouderlique et al. (2022), that the inner wall of the actinopharynx contains concentrated mucus. This could potentially impede entry of calcein-FSW solution, resulting in no calcein signal. The absence of staining in the gastrovascular cavity, juxtaposed with complete staining of the mesoglea layer by seawater-soluble calcein, is particularly noteworthy (Figures 3B, C). The methodology for measuring gastrovascular canal flow using fluorescent beads is well established (Bouderlique et al., 2022); however, coral appearance may differ depending upon whether water-soluble fluorescent indicators or nano-meter size beads that reach the site of calcification are used (Tambutté et al., 2012; Ganot et al., 2020). This preliminary study suggests that skeleton growth may involve mainly ion transport through intercellular spaces of coral epidermis, rather than just seawater entry from the mouth. This supposition was reinforced by the higher signal observed at the outermost edges of calcifying tissue on glass substrates, particularly in studies in which fluorescent dyes were allowed to enter the pocket for a few minutes (Ohno et al., 2017a; Ohno et al., 2017b; Venn et al., 2020). As discussed below, real-time, two-photon imaging could potential visualize the contribution of seawater entry via the mouth to coral skeletal formation. This approach may be beneficial for detailed physiological studies focusing on seawater transport via the paracellular pathway.
3.3 Calcein-bearing particles on septa spicules
Three days post-metamorphosis, growing septa spicules in coral tissue were clearly observed under two-photon microscopy with calcein (Figure 4). Laser power was adjusted to a minimum, and auto-fluorescent signals from coral tissue could not be detected. Vacuoles approximately 3–5 µm in size were observable. The strong calcein signal showed that septal spicules apparently project exteriorly from the oral epithelial tissue, indicating an artifact (Figure 4A, z = +32.65 µm). In the same image, a section of the actinopharynx was observed (approximately 670 µm²) (Figure 4B). Slight signals from the layer of mesoglea, similar to Figure 3A, were filled with calcein (Figure 4A, z = -32.65 µm). This observation may reflect the developmental stage of oral structure in primary coral polyps; however, even though the calcein-FSW fluorescent signal is at the same level in the calcein-FSW (65.30 µm in depth), the actinopharynx signal from calcein is lost at the optical cross-section (Figure 4B). The depth to which the NIR laser can penetrate and detect a signal in the coral skeleton (optical depth) is estimated at 30 µm in this experiment (Figure 4B). However, in this study, two-photon microscopy could not detect a fluorescent signal from the basal part of calcifying tissue.
Despite entry of seawater through the oral opening, two-photon microscopy with calcein showed that notwithstanding the tissue penetration of the NIR laser, the calcein-FSW signal disappeared in the actinopharynx (Figures 3B, 4B). This necessitates reconsideration of whether ions from seawater reach calcifying tissue through the gastrovascular cavity. This developmental stage corresponds to stages C-D (Gilis et al., 2014) when septal spicules emerge from the basal plate. At this initial developmental stage, there may be no significant structural differences in actinopharynx development among coral species, including aposymbiotic Acropora primary polyps (Ohno et al., 2017b), symbiotic Pocillopora (Gilis et al., 2014), and Stylophora primary polyps (Khalifa et al., 2021).
Coral septa surfaces accumulate nano crystals, forming polycrystalline fibers, which comprise centers of calcification (Clode and Marshall, 2003; Von Euw et al., 2017). Two-photon observations offer valuable insights into the process of coral skeleton formation. While conventional techniques are limited to observing crystal growth at the bottom of a glass dish, two-photon microscopy enabled us to visualize sub-µm-sized crystals around and attached to septa (n = 3) in the tissue (n = 42, mean ± SEM: 0.55 ± 0.033 µm). Locations of crystals adjacent to the skeleton, as well as their sizes, are consonant with initial findings by Mass et al. (2017a), implying that ACC particles form coral skeletons. Although calcein-bearing particles of ≤1 μm could be detected, no observation method has yet been devised to confirm in vivo whether these particles are amorphous. Pseudo-colorization was applied using multiple exposure photography, highlighting red-shifted crystals in optical sections (Figure 5A) and superimposed images (Figure 5B). Growth of septa in a single optical plane can be seen in Supporting Video 3, showcasing movement of particles in calcifying tissue surrounding septa. Due to continuous movement of the tissue, the fluorescence signal exhibited slight blinking (Supporting Video 4). Stage drift did not occur during the observation, and it is evident that microcrystals were actively moving around growing septa.
3.4 Reconsidering characteristics of the solid-liquid interface in coral skeletons
At the septal growth front (Figure 5) calcein-stained particles are visible, yet their exact location in calicoblastic cells or intercellular spaces could not be unambiguously determined from our results. The growing front of septa appears uneven, composed of clusters of particles. Utilizing differences in fluorescence intensity for tracking, regions exhibiting higher fluorescence intensity than surrounding areas were extracted, identifying particle centers. Trajectories of 30 particles were analyzed and categorized into three types of patterns: those that moved significantly between pixels (Figure 5D: traveling), those that moved erratically and then stalled (Figure 5E: scrolling), and those that remain stationary (Figure 5F: attachment). Presumably, the aforementioned process leads to particle attachment to the skeleton at coral septa. The latter phase of particle scrolling and attachment, showing cessation of Brownian motion, may indicate adsorption onto the skeleton or particle growth. Clear particle signals were tracked, but they appear not to move between cells, and particle movement is confined within the diameter of a typical animal cell (about 20 µm) over 1 h (Figure 5G). Previous findings using calcein blue in cell vesicles (Neder et al., 2019), with co-localization of FM dye-stained vesicles, suggested that these vesicles are likely intracellular particles. In contrast, a study of detailed coral tissue sections has shown the ubiquitous presence of vesicles several hundred nm in size; however, vesicles could not be detected in ECF (Ganot et al., 2020). Therefore, contact of calcein-bearing particles with the skeleton most likely occurs at the surface between calicoblasitc cells and the skeleton. Precise microscopic observations will be essential to determine the mechanism by which particles attach to the coral skeleton.
While crystal growth is evident in our observations, the absence of clear ECF pockets in calcifying tissue in the septa raises questions contrasting with reports in which dome-shaped pockets of ECF structures were observed using inverted microscopy (Venn et al., 2011; Tambutté et al., 2012; Venn et al., 2013; Shapiro et al., 2016; Ohno et al., 2017a; Ohno et al., 2017b; Mass et al., 2017a; Barott et al., 2020; Venn et al., 2020; Khalifa et al., 2021; Scucchia et al., 2021; Iijima et al., 2022; Venn et al., 2022; Allison et al., 2023). Those studies were conducted with basal calicoblastic tissue attached to glass substrates. Therefore, the structure of the extracellular fluid (ECF) pocket and perhaps chemical components may vary in different areas of calicoblastic tissue sites between the septa. The relatively large volume of extracellular fluid (ECF) pockets makes them an ideal location for measuring ion balance near skeletal growth, but their distribution, as well as their structural properties in coral tissue, also need to be confirmed. As first reported by Clode & Marshall (2002), the gap between calicoblastic cells and the skeleton growth interface is filled with matrix film, with a thickness is approximately tens on nm.
A recent study (Ram and Erez, 2023) indicated that different coral species may have differences in their seawater semi-closed systems, and consequently in their ion enrichment processes. We hypothesized that even in the same coral, there may be differences in ion balance depending on the tissue location, such as between the base of the coral and the septa. Indeed, attempts have been made to visualize vertical pH gradients, suggesting changes in skeletal development processes at different sites in corals (Venn et al., 2022). Crovetto et al. (2024), from the same research group, found that variations in symbiotic algal density and light intensity within the coral cœlenteron lead to changes in ECF chemistry in microcolonies of Stylophora pistillata. Elemental composition of coral skeletons is also fundamental for reconstructing ancient oceanic environments and understanding reef formation. Despite this significance, few studies have considered biological influences associated with coral biomineralization (Meibom et al., 2007; Brahmi et al., 2012; Mass et al., 2014), which are overviewed in Drake et al., 2020. Therefore, comprehensive understanding of how cellular particles such as ACC contribute to formation of coral skeletons in vivo is essential. The present two-photon microscopy with calcein staining is only preliminary, and the influence of SOM has not been examined in live tissue (Gautret et al., 2000; Drake et al., 2020; Mummadisetti et al., 2021). Measurement of pH and ion concentration distributions throughout coral tissue may also need to be reconsidered (Cai et al., 2016; Sevilgen et al., 2019). Additionally, use of these measurements with high-resolution boron mapping revealed variable chemical composition in different parts of the skeleton in corals (Chalk et al., 2021; Fietzke & Wall, 2022; Standish et al., 2024). Focusing on different locations in the coral skeleton, such as septa and the basal plate, which have not been well-discussed in physiological studies, could offer new insights into evolution of diverse coral skeletal structures (Stanley, 2003).
3.5 Limitations of in vivo observations of the skeleton growth front in live corals
Polarized light microscopy offers benefits of being stain-free and facilitating easy confirmation of micron-sized crystals (Figures 1, 2). Nonetheless, it lacks the capacity to provide specific information about the tissue depth at which crystal lattice formation commences. Furthermore, observations are restricted to the glass surface at the bottom of coral calcifying tissue. Previous studies, relying on in vivo observations that employed fluorescence microscopy with calcein, focused primarily on tracking growth of individual crystals (Ohno et al., 2017b). Calcein fluorescence and calcein binding to calcium carbonate revealed sub-micron crystals in intercellular spaces of calcifying tissue in primary polyps. These small crystals were not on the glass surface, but were located in calcified tissue several micrometers above the glass, but our previous report did not focus on particle attachment. Calcein in seawater, which does not permeate cell membranes, is concentrated in the coral skeleton via the paracellular pathway (Tambutté et al., 2012). Accordingly, dye incorporation occurs in small crystals at the crystal growth front, interacting with alkaline earth metals, e.g., Mg2+ and Ca2+, followed by dehydration during solidification of crystal growth. This suggests that calcein accumulation detects hydrated ACC components (Mass et al., 2017a). Particles a few µm in size, as observed using PEEM (Mass et al., 2017a; Sun et al., 2020), and particles in calicoblastic cells during high-magnification, in vivo observations (Ohno et al., 2017b; Mass et al., 2017b; Neder et al., 2019) look very similar. Even though ACC are common in many calcifying marine organisms (Gilbert et al., 2022), it is still difficult to visualize their distributions and their accumulation at the site of calcification, i.e., solid-liquid interfaces, in live organisms. Utilizing light-sheet microscopy (Mass et al., 2017b; Laissue et al., 2020) or real-time confocal microscopy, especially with a spinning disk system (Ohno et al., 2017b), is essential for rapidly capturing frames, tracking crystal grains, and generating high-speed 3D images, while minimizing phototoxicity to corals. These methods offer improved solutions for detailed observation and analysis of small particle dynamics with positional information in tissues. Here, the first observation of calcein-bearing particles at the onset of septum formation was conducted using an upright two-photon microscope in vivo.
The potential of two-photon microscopy in studying coral calcification physiology is substantial. It effectively highlighted the calcein signal from septal spicules (Figure 4) as well as calcein-bearing particles (Figure 5). Multiphoton microscopy is well-known for its utility in observing deep tissues, especially in neuronal physiology. In brain studies, high lipid content causes light scattering, requiring observation methods that minimize phototoxicity. Development of observational methods has facilitated exploration at tissue depths exceeding 1000 µm, allowing examination of distributions of hippocampal CA1 neurons (Kawakami et al., 2013) and successful observation of intracellular calcium dynamics (Inoue et al., 2019). A recent study employed stimulated-emission-depletion (STED) (Hell, 2007) with laser pulses controlled by an electrical timer to improve spatial resolution in thick brain tissue (Ishii et al., 2023). For high-speed image acquisition, a Nipkow disc was applied with multiphoton microscopy, enabling high-speed imaging. Traditional issues, such as insufficient intensity of excitation light, have been addressed by reducing the frequency of laser pulses, rendering it suitable for tissue observation (Otomo et al., 2020). In addition, super-resolution radial fluctuation (SRRF) imaging was demonstrated under real-time, two-photon microscopy to observe fine structure of dendrites (Tsutsumi et al., 2023). This technique achieves results similar to those of structured illumination microscopy (SIM) with an XY resolution of 100 nm over 100 µm deep in live tissue. By integrating state-of-the-art in vivo microscopy techniques with skeletal staining methods, it becomes feasible to observe processes such as nanoscale adsorption of calcein onto coral skeletal surfaces, as well as the behavior and structure of nano-crystals during skeletal growth.
By utilizing high peak power, ultrashort, near-infrared (NIR) light pulses, laser scanning microscopy can visualize biological microstructures using various non-linear optical processes, notably multi-photon excitation, sum frequency generation (SFG), and second harmonic generation (SHG). These advanced imaging techniques hold promise for various applications in coral biology, including non-invasive visualization of calcifying tissues without staining. For example, SHG can detect structural elements like collagen or elastin fibrils (Chen et al., 2012; Gade et al., 2019), and can offer insights into gene expression in coral tissues, and the potential for in vivo visualization of coral calcification processes at the protein level. Involvement of genes for collagen Types I and II and alkaline phosphatase in endochondral bone formation induced by bone morphogenetic protein (BMP) is widely known in vertebrates (Xu et al., 2020). Collagen has been documented in corals (Wang et al., 1995; Gutner-Hoch et al., 2017; Wertheimer et al., 2021; Venn et al., 2022), indicating diverse functions. While a direct correlation between collagen and calcification has not been demonstrated, there is a hypothesis suggesting that collagen supports removal of protons produced during mineral deposition in coral calcification (Venn et al., 2022). In this study, attempts were made to detect second-harmonic generation (SHG) signals from coral skeletal tissue; however, due to weak laser output, these efforts were unsuccessful.
A comparative study of the bone marrow environment in young and adult mice to estimate calcium concentrations employed in vivo two-photon microscopy in combination with fluorescent dyes (Yeh et al., 2022). Our observations are only a first step toward non-invasively measuring ionic changes in skeleton formation deep in calcifying tissues of stony corals. Deeper assessments (>50 µm) may also be achievable in coral tissues with further improvements in experimental conditions and methods. We believe that two-photon imaging has potentially broad applications, such as observing tissue morphology, microenvironments, and physicochemical conditions deep in live coral tissue (Bouderlique et al., 2022; Hughes et al., 2022). In terms of coral calcification mechanisms, we have successfully broadened the observation area in corals from the limited aboral side to deeper tissue layers on the oral side. However, to enhance our understanding of the biologically regulated calcification process, developing non-destructive microscopy techniques is crucial for revealing intracellular formation and attachment of ACC.
4 Conclusions
Time-lapse observations with polarized light microscopy revealed the simultaneous appearance of crystals in the pre-septa region of live primary coral polyps. Examples of CoC emergence at calcifying tissue at the aboral calcifying tissue where septum formation was initiated were documented. Using two-photon microscopy, we visualized the initial stages of septum formation from the oral side without damaging tissue. With calcein staining, septal spicules were observed penetrating coral tissue from the oral side. Trajectories of calcein-bearing particles observed during septum growth, indicating restricted movement between cells. Nondestructive approaches described in this study open new avenues for studying coral exoskeleton formation in three dimensions. While we observed dynamic septal growth and the presence of mobile sub-micron particles, we could not confirm their ACC origin. Further advances in in vivo observation techniques are necessary to understand in greater detail how corals accomplish calcification in relation to ACC.
Statements
Data availability statement
The original contributions presented in the study are included in the article/Supplementary Material. Further inquiries can be directed to the corresponding author.
Ethics statement
The manuscript presents research on animals that do not require ethical approval for their study.
Author contributions
YO: Writing – original draft, Conceptualization, Funding acquisition, Investigation, Methodology, Visualization. AT: Investigation, Writing – review & editing, Methodology, Data curation, Formal analysis. MT: Funding acquisition, Investigation, Writing – review & editing, Data curation, Formal analysis. AK: Methodology, Writing – review & editing, Conceptualization. AI: Funding acquisition, Writing – review & editing, Data curation, Methodology. MI: Writing – review & editing, Methodology. NM: Writing – review & editing, Formal analysis, Investigation. TaN: Writing – review & editing, Resources. AS: Funding acquisition, Writing – review & editing, Methodology. MS: Funding acquisition, Writing – review & editing, Conceptualization. JY: Writing – review & editing, Funding acquisition. SW: Writing – review & editing. KS: Writing – review & editing, Methodology. ToN: Funding acquisition, Writing – review & editing. KY: Writing – review & editing, Resources, Supervision, Funding acquisition.
Funding
The author(s) declare financial support was received for the research, authorship, and/or publication of this article. This research was supported by the Research Laboratory on Environmentally Conscious Developments and Technologies (E-code) at the National Institute of Advanced Industrial Science and Technology, the Japan Society for the Promotion of Science (Grant Numbers 23K14222, 23H00339 and JP22H04926), the Grant-in-Aid for Transformative Research Areas ("Platforms for Advanced Technologies and Research Resources ― Advanced Bioimaging Support"), the Environment Research and Technology Development Fund (JPMEERF20221C01) of the Environmental Restoration and Conservation Agency provided by Ministry of the Environment of Japan, the Research Institute for Humanity and Nature (RIHN; project no. RIHN14200145), and the New Energy and Industrial Technology Development Organization.
Acknowledgments
The authors sincerely thank the technical staff at the Microscope Core Laboratory, The Institute of Medical Science, The University of Tokyo, for granting access and providing technical support for Nikon multiphoton microscopy. We are profoundly thankful to members of Prof. Nakamura’s laboratory at the University of Ryukyus for their invaluable assistance in collecting coral colonies. Special appreciation is extended to Ms. Shi Zongyan at the Graduate School of Engineering and Science, University of the Ryukyus, for her dedicated support in collection and preparation of coral larvae. Additionally, heartfelt thanks are extended to Prof. Jimbo and members of the Laboratory of Marine Biochemical Resources, Applied Marine Biological Chemistry, Kitasato University, for their support in culturing coral planula larvae.
Conflict of interest
Author AK was employed by the company JEOL Ltd.
The remaining authors declare that the research was conducted in the absence of any commercial or financial relationships that could be construed as a potential conflict of interest.
Publisher’s note
All claims expressed in this article are solely those of the authors and do not necessarily represent those of their affiliated organizations, or those of the publisher, the editors and the reviewers. Any product that may be evaluated in this article, or claim that may be made by its manufacturer, is not guaranteed or endorsed by the publisher.
Supplementary material
The Supplementary Material for this article can be found online at: https://www.frontiersin.org/articles/10.3389/fmars.2024.1406446/full#supplementary-material
References
1
Allemand D. Tambutté É. Zoccola D. Tambutté S. (2011). “Coral calcification, cells to reefs,” in Coral reefs: an ecosystem in transition (Dordrecht: Springer), 119–150. doi: 10.1016/j.gca.2023.07.005
2
Allison N. Venn A. A. Tambutte S. Tambutte E. Wilckens F. K. Kasemann S. A. et al . (2023). A comparison of SNARF-1 and skeletal δ11B estimates of calcification media pH in tropical coral. Geochimica Cosmochimica Acta355, 184–194. doi: 10.1016/j.gca.2023.07.005
3
Barnes D. J. (1970). Coral skeletons: an explanation of their growth and structure. Science170, 1305–1308. doi: 10.1126/science.170.3964.1305
4
Barott K. L. Venn A. A. Thies A. B. Tambutté S. Tresguerres M. (2020). Regulation of coral calcification by the acid-base sensing enzyme soluble adenylyl cyclase. Biochem. Biophys. Res. Commun.525, 576–580. doi: 10.1016/j.bbrc.2020.02.115
5
Benzerara K. Menguy N. Obst M. Stolarski J. Mazur M. Tylisczak T. et al . (2011). Study of the crystallographic architecture of corals at the nanoscale by scanning transmission X-ray microscopy and transmission electron microscopy. Ultramicroscopy111, 1268–1275. doi: 10.1016/j.ultramic.2011.03.023
6
Bouderlique T. Petersen J. Faure L. Abed-Navandi D. Bouchnita A. Mueller B. et al . (2022). Surface flow for colonial integration in reef-building corals. Curr. Biol.32, 2596–2609. doi: 10.1016/j.cub.2022.04.054
7
Brahmi C. Kopp C. Domart-Coulon I. Stolarski J. Meibom A. (2012). Skeletal growth dynamics linked to trace-element composition in the scleractinian coral Pocillopora damicornis. Geochimica Cosmochimica Acta99, 146–158. doi: 10.1016/j.gca.2012.09.031
8
Cai W. J. Ma Y. Hopkinson B. M. Grottoli A. G. Warner M. E. Ding Q. et al . (2016). Microelectrode characterization of coral daytime interior pH and carbonate chemistry. Nat. Commun.7, 11144. doi: 10.1038/ncomms11144
9
Chalk T. B. Standish C. D. D’Angelo C. Castillo K. D. Milton J. A. Foster G. L. (2021). Mapping coral calcification strategies from in situ boron isotope and trace element measurements of the tropical coral Siderastrea siderea. Sci. Rep.11, 472. doi: 10.1038/s41598–020-78778–1
10
Chen X. Nadiarynkh O. Plotnikov S. Campagnola P. J. (2012). Second harmonic generation microscopy for quantitative analysis of collagen fibrillar structure. Nat. Protoc.7, 654–669. doi: 10.1038/nprot.2012.009
11
Clode P. L. Marshall A. T. (2002). Low temperature FESEM of the calcifying interface of a scleractinian coral. Tissue Cell34, 187–198. doi: 10.1016/S0040-8166(02)00031-9
12
Clode P. L. Marshall A. T. (2003). Skeletal microstructure of Galaxea fascicularis exsert septa: a high-resolution SEM study. Biol. Bull.204, 146–154. doi: 10.2307/1543550
13
Crovetto L. Venn A. A. Sevilgen D. Tambutté S. Tambutté E. (2024). Spatial variability of and effect of light on the cœlenteron pH of a reef coral. Commun. Biol.7, 246. doi: 10.1038/s42003-024-05938-8
14
Cuif J. P. Dauphin Y. (1998). Microstructural and physico-chemical characterization of ‘centers of calcification’in septa of some Recent scleractinian corals. Paläontologische Z.72, 257–269. doi: 10.1007/BF02988357
15
Cuif J. P. Dauphin Y. (2005). The two-step mode of growth in the scleractinian coral skeletons from the micrometre to the overall scale. J. Struct. Biol.150, 319–331. doi: 10.1016/j.jsb.2005.03.004
16
Denk W. Strickler J. H. Webb W. W. (1990). Two-photon laser scanning fluorescence microscopy. Science248, 73–76. doi: 10.1126/science.2321027
17
De Yoreo J. J. Gilbert P. U. Sommerdijk N. A. Penn R. L. Whitelam S. Joester D. et al . (2015). Crystallization by particle attachment in synthetic, biogenic, and geologic environments. Science.349, aaa6760.
18
Drake J. L. Mass T. Haramaty L. Zelzion E. Bhattacharya D. Falkowski P. G. (2013). Proteomic analysis of skeletal organic matrix from the stony coral Stylophora pistillata. Proc. Natl. Acad. Sci.110, 3788–3793. doi: 10.1073/pnas.1301419110
19
Drake J. L. Mass T. Stolarski J. Von Euw S. van de Schootbrugge B. Falkowski P. G. (2020). How corals made rocks through the ages. Global Change Biol.26, 31–53. doi: 10.1111/gcb.14912
20
Fietzke J. Wall M. (2022). Distinct fine-scale variations in calcification control revealed by high-resolution 2D boron laser images in the cold-water coral Lophelia pertusa. Sci. Adv.8, eabj4172. doi: 10.1126/sciadv.abj4172
21
Fujiwara E. Matushima K. Hatta M. (2009). A sequential observation of basal skeleton formation in the primary polyp of Acropora. Galaxea J. Coral Reef Stud.11, 35–35. doi: 10.3755/galaxea.11.35
22
Gade P. S. Robertson A. M. Chuang C. Y. (2019). Multiphoton imaging of collagen, elastin, and calcification in intact soft-tissue samples. Curr. Protoc. Cytometry87, e51. doi: 10.1002/cpcy.51
23
Ganot P. Tambutte E. Caminiti-Segonds N. Toullec G. Allemand D. Tambutte S. (2020). Ubiquitous macropinocytosis in anthozoans. Elife9, e50022. doi: 10.7554/eLife.50022.sa2
24
Gautret P. Cuif J. P. Stolarski J. (2000). Organic components of the skeleton of scleractinian corals-evidence from in situ acridine orange staining. Acta Palaeontologica Polonica45, 107–118.
25
Gilbert P. U. Bergmann K. D. Boekelheide N. Tambutté S. Mass T. Marin F. et al . (2022). Biomineralization: Integrating mechanism and evolutionary history. Sci. Adv.8, eabl9653. doi: 10.1126/sciadv.abl9653
26
Gilis M. Meibom A. Alexander D. Grauby O. Stolarski J. Baronnet A. (2015). Morphology, microstructure, crystallography, and chemistry of distinct CaCO3 deposits formed by early recruits of the scleractinian coral P ocillopora damicornis. J. Morphol.276, 1146–1156. doi: 10.1002/jmor.v276.10
27
Gilis M. Meibom A. Domart-Coulon I. Grauby O. Stolarski J. Baronnet A. (2014). Biomineralization in newly settled recruits of the scleractinian coral Pocillopora damicornis. J. Morphol.275, 1349–1365. doi: 10.1002/jmor.20307
28
Gladfelter E. H. (1983). Skeletal development in Acropora cervicornis: II. Diel patterns of calcium carbonate accretion. Coral Reefs2, 91–100. doi: 10.1007/BF02395279
29
Gutner-Hoch E. Ben-Asher H. W. Yam R. Shemesh A. Levy O. (2017). Identifying genes and regulatory pathways associated with the scleractinian coral calcification process. PeerJ5, e3590. doi: 10.7717/peerj.3590
30
Hell S. W. (2007). Far-field optical nanoscopy. science316, 1153–1158. doi: 10.1126/science.1137395
31
Helmchen F. Denk W. (2005). Deep tissue two-photon microscopy. Nat. Methods2, 932–940. doi: 10.1038/nmeth818
32
Hughes D. J. Raina J. B. Nielsen D. A. Suggett D. J. Kühl M. (2022). Disentangling compartment functions in sessile marine invertebrates. Trends Ecol. Evol.37, 740–748. doi: 10.1016/j.tree.2022.04.008
33
Iijima M. Yasumoto J. Iguchi A. Koiso K. Ushigome S. Nakajima N. et al . (2021). Phosphate bound to calcareous sediments hampers skeletal development of juvenile coral. R. Soc. Open Sci.8, 201214. doi: 10.1098/rsos.201214
34
Iijima M. Yasumoto J. Mori-Yasumoto K. Yasumoto-Hirose M. Iguchi A. Suzuki A. et al . (2022). Visualisation of phosphate in subcalicoblastic extracellular calcifying medium and on a skeleton of coral by using a novel probe, fluorescein-4-isothiocyanate-labelled alendronic acid. Mar. Biotechnol.24, 524–530. doi: 10.1007/s10126-022-10115-1
35
Inoue M. Takeuchi A. Manita S. Horigane S. I. Sakamoto M. Kawakami R. et al . (2019). Rational engineering of XCaMPs, a multicolor GECI suite for in vivo imaging of complex brain circuit dynamics. Cell.177, 1346–1360. doi: 10.1016/j.cell.2019.04.007
36
Ishii H. Otomo K. Chang C. P. Yamasaki M. Watanabe M. Yokoyama H. et al . (2023). All-synchronized picosecond pulses and time-gated detection improve the spatial resolution of two-photon STED microscopy in brain tissue imaging. PLoS One18, e0290550. doi: 10.1371/journal.pone.0290550
37
Iwao K. Fujisawa T. Hatta M. (2002). A cnidarian neuropeptide of the GLWamide family induces metamorphosis of reef-building corals in the genus Acropora. Coral Reefs 21, 127–129. doi: 10.1007/s00338-002-0219-8
38
Johnston I. S. (1980). “The ultrastructure of skeletogenesis in hermatypic corals,” in International Review of Cytology (Academic Press), 171–214. doi: 10.1016/S0074–7696(08)62429–8
39
Kawakami R. Sawada K. Sato A. Hibi T. Kozawa Y. et al . (2013). Visualizing hippocampal neurons with in vivo two-photon microscopy using a 1030 nm picosecond pulse laser. Sci. Rep.3, 1014. doi: 10.1038/srep01014
40
Khalifa G. M. Levy S. Mass T. (2021). The calcifying interface in a stony coral primary polyp: An interplay between seawater and an extracellular calcifying space. J. Struct. Biol.213, 107803. doi: 10.1016/j.jsb.2021.107803
41
Laissue P. P. Roberson L. Gu Y. Qian C. Smith D. J. (2020). Long-term imaging of the photosensitive, reef-building coral Acropora muricata using light-sheet illumination. Sci. Rep.10, 10369. doi: 10.1038/s41598–020-67144-w
42
Mass T. Drake J. L. Heddleston J. M. Falkowski P. G. (2017b). Nanoscale visualization of biomineral formation in coral proto-polyps. Curr. Biol.27, 3191–3196. doi: 10.1016/j.cub.2017.09.012
43
Mass T. Drake J. L. Peters E. C. Jiang W. Falkowski P. G. (2014). Immunolocalization of skeletal matrix proteins in tissue and mineral of the coral Stylophora pistillata. Proc. Natl. Acad. Sci.111, 12728–12733. doi: 10.1073/pnas.1408621111
44
Mass T. Giuffre A. J. Sun C. Y. Stifler C. A. Frazier M. J. Neder M. et al . (2017a). Amorphous calcium carbonate particles form coral skeletons. Proc. Natl. Acad. Sci.114, E7670–E7678. doi: 10.1073/pnas.1707890114
45
Meibom A. Mostefaoui S. Cuif J. P. Dauphin Y. Houlbreque F. Dunbar R. et al . (2007). Biological forcing controls the chemistry of reef-building coral skeleton. Geophysical Res. Lett.34. doi: 10.1029/2006GL028657
46
Mummadisetti M. P. Drake J. L. Falkowski P. G. (2021). The spatial network of skeletal proteins in a stony coral. J. R. Soc. Interface18, 20200859. doi: 10.1098/rsif.2020.0859
47
Neder M. Laissue P. P. Akiva A. Akkaynak D. Albéric M. Spaeker O. et al . (2019). Mineral formation in the primary polyps of pocilloporoid corals. Acta biomaterialia96, 631–645. doi: 10.1016/j.actbio.2019.07.016
48
Ohno Y. Iguchi A. Shinzato C. Gushi M. Inoue M. Suzuki A. et al . (2017a). 734 Calcification process dynamics in coral primary polyps as observed using a calcein 735 incubation method. Biochem. Biophys. Rep.9, 289–294. doi: 73610.1016/j.bbrep.2017.01.006
49
Ohno Y. Iguchi A. Shinzato C. Inoue M. Suzuki A. Sakai K. et al . (2017b). An aposymbiotic primary coral polyp counteracts acidification by active pH regulation. Sci. Rep.7, 40324. doi: 10.1016/j.bbrep.2017.01.006
50
Otomo K. Goto A. Yamanaka Y. Hori T. Nakayama H. Nemoto T. (2020). High-peak-power 918-nm laser light source based two-photon spinning-disk microscopy for green fluorophores. Biochem. Biophys. Res. Commun.529, 238–242. doi: 10.1016/j.bbrc.2020.05.213
51
Puverel S. Tambutté E. Pereira-Mouries L. Zoccola D. Allemand D. Tambutté S. (2005). Soluble organic matrix of two Scleractinian corals: partial and comparative analysis. Comp. Biochem. Physiol. Part B: Biochem. Mol. Biol.141, 480–487. doi: 10.1016/j.cbpc.2005.05.013
52
Ram S. Erez J. (2023). Anion elements incorporation into corals skeletons: Experimental approach for biomineralization and paleo-proxies. Proc. Natl. Acad. Sci.120, e2306627120. doi: 10.1073/pnas.2306627120
53
Ramos-Silva P. Kaandorp J. Huisman L. Marie B. Zanella-Cléon I. Guichard N. et al . (2013). The skeletal proteome of the coral Acropora millepora: the evolution of calcification by co-option and domain shuffling. Mol. Biol. Evol.30, 2099–2112. doi: 10.1093/molbev/mst109
54
Raz-Bahat M. Erez J. Rinkevich B. (2006). In vivo light-microscopic documentation for primary calcification processes in the hermatypic coral Stylophora pistillata. Cell Tissue Res.325, 361–368. doi: 10.1007/s00441-006-0182-8
55
Scucchia F. Malik A. Zaslansky P. Putnam H. M. Mass T. (2021). Combined responses of primary coral polyps and their algal endosymbionts to decreasing seawater pH. Proc. R. Soc. B288, 20210328. doi: 10.1098/rspb.2021.0328
56
Sevilgen D. S. Venn A. A. Hu M. Y. Tambutté E. de Beer D. Planas-Bielsa V. et al . (2019). Full in vivo characterization of carbonate chemistry at the site of calcification in corals. Sci. Adv.5, eaau7447. doi: 10.1126/sciadv.aau7447
57
Shapiro O. H. Kramarsky-Winter E. Gavish A. R. Stocker R. Vardi A. (2016). A coral-on-a-chip microfluidic platform enabling live-imaging microscopy of reef-building corals. Nat. Commun.7, 10860. doi: 10.1038/ncomms10860
58
Sivaguru M. Todorov L. G. Miller C. A. Fouke C. E. Munro C. M. Fouke K. W. et al . (2021). Corals regulate the distribution and abundance of Symbiodiniaceae and biomolecules in response to changing water depth and sea surface temperature. Sci. Rep.11, 2230. doi: 10.1038/s41598–023-45562-w
59
Standish C. D. Trend J. Kleboe J. Chalk T. B. Mahajan S. Milton J. A. et al . (2024). Correlative geochemical imaging of Desmophyllum dianthus reveals biomineralisation strategy as a key coral vital effect. Sci. Rep.14, 11121. doi: 10.1038/s41598–024-61772–2
60
Stanley G. D. Jr (2003). The evolution of modern corals and their early history. Earth-Science Rev.60, 195–225. doi: 10.1016/S0012-8252(02)00104-6
61
Stolarski J. (2003). Three-dimensional micro-and nanostructural characteristics of the scleractinian coral skeleton: a biocalcification proxy. Acta Palaeontologica Polonica48.
62
Sugiura M. Yasumoto K. Iijima M. Oaki Y. Imai H. (2021). Morphological study of fibrous aragonite in the skeletal framework of a stony coral. CrystEngComm23, 3693–3700. doi: 10.1039/D1CE00357G
63
Sun C. Y. Stifler C. A. Chopdekar R. V. Schmidt C. A. Parida G. Schoeppler V. et al . (2020). From particle attachment to space-filling coral skeletons. Proc. Natl. Acad. Sci.117, 30159–30170. doi: 10.1073/pnas.2012025117
64
Suzuki A. Iguchi A. Sakai K. Hayashi M. Nojiri Y. (2023). Succession of ocean acidification and its effects on reef-building corals. Coral Reefs Eastern Asia under Anthropogenic Impacts, 97–112.
65
Takeuchi T. Yamada L. Shinzato C. Sawada H. Satoh N. (2016). Stepwise evolution of coral biomineralization revealed with genome-wide proteomics and transcriptomics. PLoS One11, e0156424. doi: 10.1371/journal.pone.0156424
66
Tambutté S. Holcomb M. Ferrier-Pagès C. Reynaud S. Tambutté É. Zoccola D. et al . (2011). Coral biomineralization: from the gene to the environment. J. Exp. Mar. Biol. Ecol.408, 58–78. doi: 10.1016/j.jembe.2011.07.026
67
Tambutté E. Tambutté S. Segonds N. Zoccola D. Venn A. Erez J. et al . (2012). Calcein labelling and electrophysiology: insights on coral tissue permeability and calcification. Proc. R. Soc. B: Biol. Sci.279, 19–27. doi: 10.1098/rspb.2011.0733
68
Tsutsumi M. Takahashi T. Kobayashi K. Nemoto T. (2023). Fluorescence radial fluctuation enables two-photon super-resolution microscopy. Front. Cell. Neurosci.17. doi: 10.3389/fncel.2023.1243633
69
Venn A. A. Bernardet C. Chabenat A. Tambutté E. Tambutté S. (2020). Paracellular transport to the coral calcifying medium: effects of environmental parameters. J. Exp. Biol.223, jeb227074. doi: 10.1242/jeb.227074
70
Venn A. A. Tambutte E. Comeau S. Tambutte S. (2022). Proton gradients across the coral calcifying cell layer: Effects of light, ocean acidification and carbonate chemistry. Front. Mar. Sci.9. doi: 10.3389/fmars.2022.973908
71
Venn A. Tambutté E. Holcomb M. Allemand D. Tambutté S. (2011). Live tissue imaging shows reef corals elevate pH under their calcifying tissue relative to seawater. PLoS One6, e20013. doi: 10.1371/journal.pone.0020013
72
Venn A. A. Tambutté E. Holcomb M. Laurent J. Allemand D. Tambutté S. (2013). Impact of seawater acidification on pH at the tissue–skeleton interface and calcification in reef corals. Proc. Natl. Acad. Sci.110, 1634–1639. doi: 10.1073/pnas.1216153110
73
Von Euw S. Zhang Q. Manichev V. Murali N. Gross J. Feldman L. C. et al . (2017). Biological control of aragonite formation in stony corals. Science356, 933–938. doi: 10.1126/science.aam6371
74
Wang W. Omori M. Hayashibara T. Shimoike K. Hatta M. Sugiyama T. et al . (1995). Isolation and characterization of a mini-collagen gene encoding a nematocyst capsule protein from a reef-building coral, Acropora donei. Gene.152, 195–200. doi: 10.1016/0378-1119(95)00644-L
75
Wertheimer S. Sharabi M. Shelah O. Lesman A. Haj-Ali R. (2021). Bio-composites reinforced with unique coral collagen fibers: towards biomimetic-based small diameter vascular grafts. J. Mech. Behav. Biomed. Mater.119, 104526. doi: 10.1016/j.jmbbm.2021.104526
76
Xu Y. Nudelman F. Eren E. D. Wirix M. J. Cantaert B. Nijhuis W. H. et al . (2020). Intermolecular channels direct crystal orientation in mineralized collagen. Nat. Commun.11, 5068. doi: 10.1038/s41467-020-18846-2
77
Yeh S. A. Hou J. Wu J. W. Yu S. Zhang Y. Belfield K. D. et al . (2022). Quantification of bone marrow interstitial pH and calcium concentration by intravital ratiometric imaging. Nat. Commun.13, 393. doi: 10.1038/s41467-022-27973-x
78
Zaquin T. Malik A. Drake J. L. Putnam H. M. Mass T. (2021). Evolution of protein-mediated biomineralization in scleractinian corals. Front. Genet.12. doi: 10.3389/fgene.2021.618517
79
Zipfel W. R. Williams R. M. Webb W. W. (2003). Nonlinear magic: multiphoton microscopy in the biosciences. Nat. Biotechnol.21, 1369–1377. doi: 10.1038/nbt899
Summary
Keywords
coral, calcification, septa, centers of calcification (CoC), two-photon microscopy (2-PM), calcein
Citation
Ohno Y, Takahashi A, Tsutsumi M, Kubota A, Iguchi A, Iijima M, Mizusawa N, Nakamura T, Suzuki A, Suzuki M, Yasumoto J, Watabe S, Sakai K, Nemoto T and Yasumoto K (2024) Live imaging of center of calcification formation during septum development in primary polyps of Acropora digitifera. Front. Mar. Sci. 11:1406446. doi: 10.3389/fmars.2024.1406446
Received
25 March 2024
Accepted
07 June 2024
Published
06 August 2024
Volume
11 - 2024
Edited by
Wei Jiang, Guangxi University, China
Reviewed by
Jarosław Stolarski, Polish Academy of Sciences, Poland
Anders Meibom, Swiss Federal Institute of Technology Lausanne, Switzerland
Updates
Copyright
© 2024 Ohno, Takahashi, Tsutsumi, Kubota, Iguchi, Iijima, Mizusawa, Nakamura, Suzuki, Suzuki, Yasumoto, Watabe, Sakai, Nemoto and Yasumoto.
This is an open-access article distributed under the terms of the Creative Commons Attribution License (CC BY). The use, distribution or reproduction in other forums is permitted, provided the original author(s) and the copyright owner(s) are credited and that the original publication in this journal is cited, in accordance with accepted academic practice. No use, distribution or reproduction is permitted which does not comply with these terms.
*Correspondence: Yoshikazu Ohno, ono.yoshikazu@kitasato-u.ac.jp
Disclaimer
All claims expressed in this article are solely those of the authors and do not necessarily represent those of their affiliated organizations, or those of the publisher, the editors and the reviewers. Any product that may be evaluated in this article or claim that may be made by its manufacturer is not guaranteed or endorsed by the publisher.