Abstract
Rhincodon typus, or the whale shark, is the largest extant fish in the world and is classified as endangered on the IUCN’s Red List. Due to their enormous size and conservation status, whale sharks are rarely housed in aquaria. Here we present a behavioral analysis culminating from a large effort by 89 observers from 2008–2012 to study four R. typus (ID codes: AL, TA, TR, YU) longitudinally in an aquarium setting. We found that relatively simple behavioral metrics such as swim speed, depth occupation, swimming direction, and lead-follow interactions demonstrated R. typus individual variation and responses to habitat changes. All sharks displayed increased swim speeds 30-minutes before regimented feed times, when there was scent of food being fed to other animals in the habitat. Consistently in the habitat, one male shark (YU) was recorded swimming more at depth, faster, almost exclusively clockwise, and engaged in fewer close proximity interactions with others than expected by chance. In contrast, a larger female shark (AL) was observed swimming the slowest, at the surface more than others, led other sharks more than she followed, and had strong lead-follow interactions with another shark of the opposite sex (TA). TA and TR did not differ from each other in depth profiles or speed, but did differ in their proclivity to lead or follow. Depth preferences and lead-follow interactions suggest some partitioning of the habitat and the possibility of social hierarchy in this species. These results represent the first longitudinal behavioral analysis of aquarium R. typus, offering meaningful similarities and contrasts to field observations.
1 Introduction
Rhincodon typus (Smith, 1828), more popularly referred to as the whale shark, is the world’s largest non-mammalian vertebrate and extant fish species (McClain et al., 2015). Due to their considerable size and docile nature, they are a favorite amongst the public. However, sightings in the open ocean are scant, relying solely on seasonal migration patterns governed by planktonic blooms in tropical and subtropical locations (Rowat and Brooks, 2012), such as Ningaloo Reef, Australia (Taylor, 1996), the Gulf of Tadjoura, Dijbouti (Rowat et al., 2007), the northern Gulf of Mexico (Hoffmayer et al., 2007), the Yucatan peninsula of Mexico (de la Parra Venegas et al., 2011), the Arabian Gulf and Gulf of Oman (Robinson et al., 2016), and the Maldives (Riley et al., 2010). While whale sharks are one of the most studied sharks in the world, only a select few biologists have had the opportunity for data collection and observation in an aquarium setting. Approximately 10 aquaria in the world have attempted to house such sharks, like the Georgia Aquarium in Atlanta, Georgia, and other locations in Japan, Taiwan, and parts of East China (Ming-Yih Leu et al., 2015; Matsumoto et al., 2019; Dove and Pierce, 2021). Factors like enclosure specifications, habitat size requirements, conservation concerns, and financial constraints, collectively contribute to the lack of R. typus in aquaria, despite public popularity.
Phylogenetic analyses place whale sharks in the Elasmobranchii subclass of Chondrichthyes, alongside other sharks, rays, and skates (White and Last, 2012; Alam et al., 2014). They are one of only three extant sharks to have evolved a planktivorous, pelagic, filter-feeding lifestyle (others including the basking shark, Cetorhinus maximus, and the megamouth shark, Megachasma pelagios) (Fasick et al., 2019). Interestingly, whale sharks’ closest relatives are benthic feeders, and not other filter feeders. In addition, whale sharks use a suction filter feeding technique that other planktivorous sharks do not (Nelson and Eckert, 2007), which is speculated to have evolved as an adaptation to their size (Gudger, 1941). They are also the only species in the elasmobranch subclass to exhibit vertical feeding (a type of suction feeding), where the shark’s body posture becomes completely vertical in a head-up fashion (Tomita et al., 2021). To satisfy the energetic costs of such an enormous size, the R. typus omnivorous diet includes invertebrate microfauna like crab larvae (Sampaio et al., 2018), mollusks, fish eggs, and small crustaceans (Silas and Rajagopalan, 1963). Some reports even note a diet of smaller fish like anchovies (Montero-Quintana et al., 2021) and in some cases, squid and cuttlefish (Gudger, 1941).
Predictable migratory patterns have made R. typus aggregation sites favored ecotourism destinations. The increase in ecotourism has significantly impacted whale sharks’ behavior and environment, demonstrating ecological consequences via disturbed behavioral states (Gayford et al., 2023), stress-related behaviors (Montero-Quintana et al., 2020), and alterations in R. typus diving behavior in provisioned sites (Araujo et al., 2020). In addition, unregulated tourism, boat strikes, opportunistic fishing, and other threats, have undoubtedly played a significant role in the reclassification from “Vulnerable” to “Endangered” in 2016 on the International Union for Conservation of Nature (IUCN)’s Red List of Threatened Species (Pierce and Norman, 2016). The Georgia Aquarium was able to obtain multiple whale sharks from a Taiwanese shore-based fishery between the years 2005–2007 (Schreiber and Coco, 2017), occupying the Ocean Voyager (OV) exhibit, a 6.3 million gallon tank (Dove et al., 2011). The OV is of particular importance because not only does it allow viewing of the sharks, but it also allows visitors to snorkel and/or scuba dive. This is only done at the Georgia Aquarium, Chimelong Ocean Kingdom Whale Shark Exhibit Aquarium, and the Cube Oceanarium, with the latter two based in China (Dove and Pierce, 2021).
The present study thus affords a rare opportunity to glean insight into an array of behaviors that would otherwise be difficult to assess in their natural habitat due to distance/depth limitations or technological constraints. In fact, this study represents the first longitudinal analysis of whale shark behavioral patterns in an aquarium environment. Only a few studies on long-term behavior have been conducted in provisioned sites (Thomson et al., 2017; Araujo et al., 2020) or international hotspots (Haskell et al., 2015). Data from the Georgia Aquarium were collected between the years of 2008–2012 from four whale sharks, two females and two males, referred to here as AL, TR, YU, and TA (see Figures 1A–C for a detailed schedule of observation dates and times). The goals were to (i) provide a deeper understanding of what simple metrics such as depth, swim speed, lead-follow interactions, and diver presence may say about behavior, individual variation, and social structure and (ii) to contextualize these simple behaviors via comparison with reference values from prior naturalistic studies in attempt to better understand their relationship with ecological roles in the wild.
Figure 1
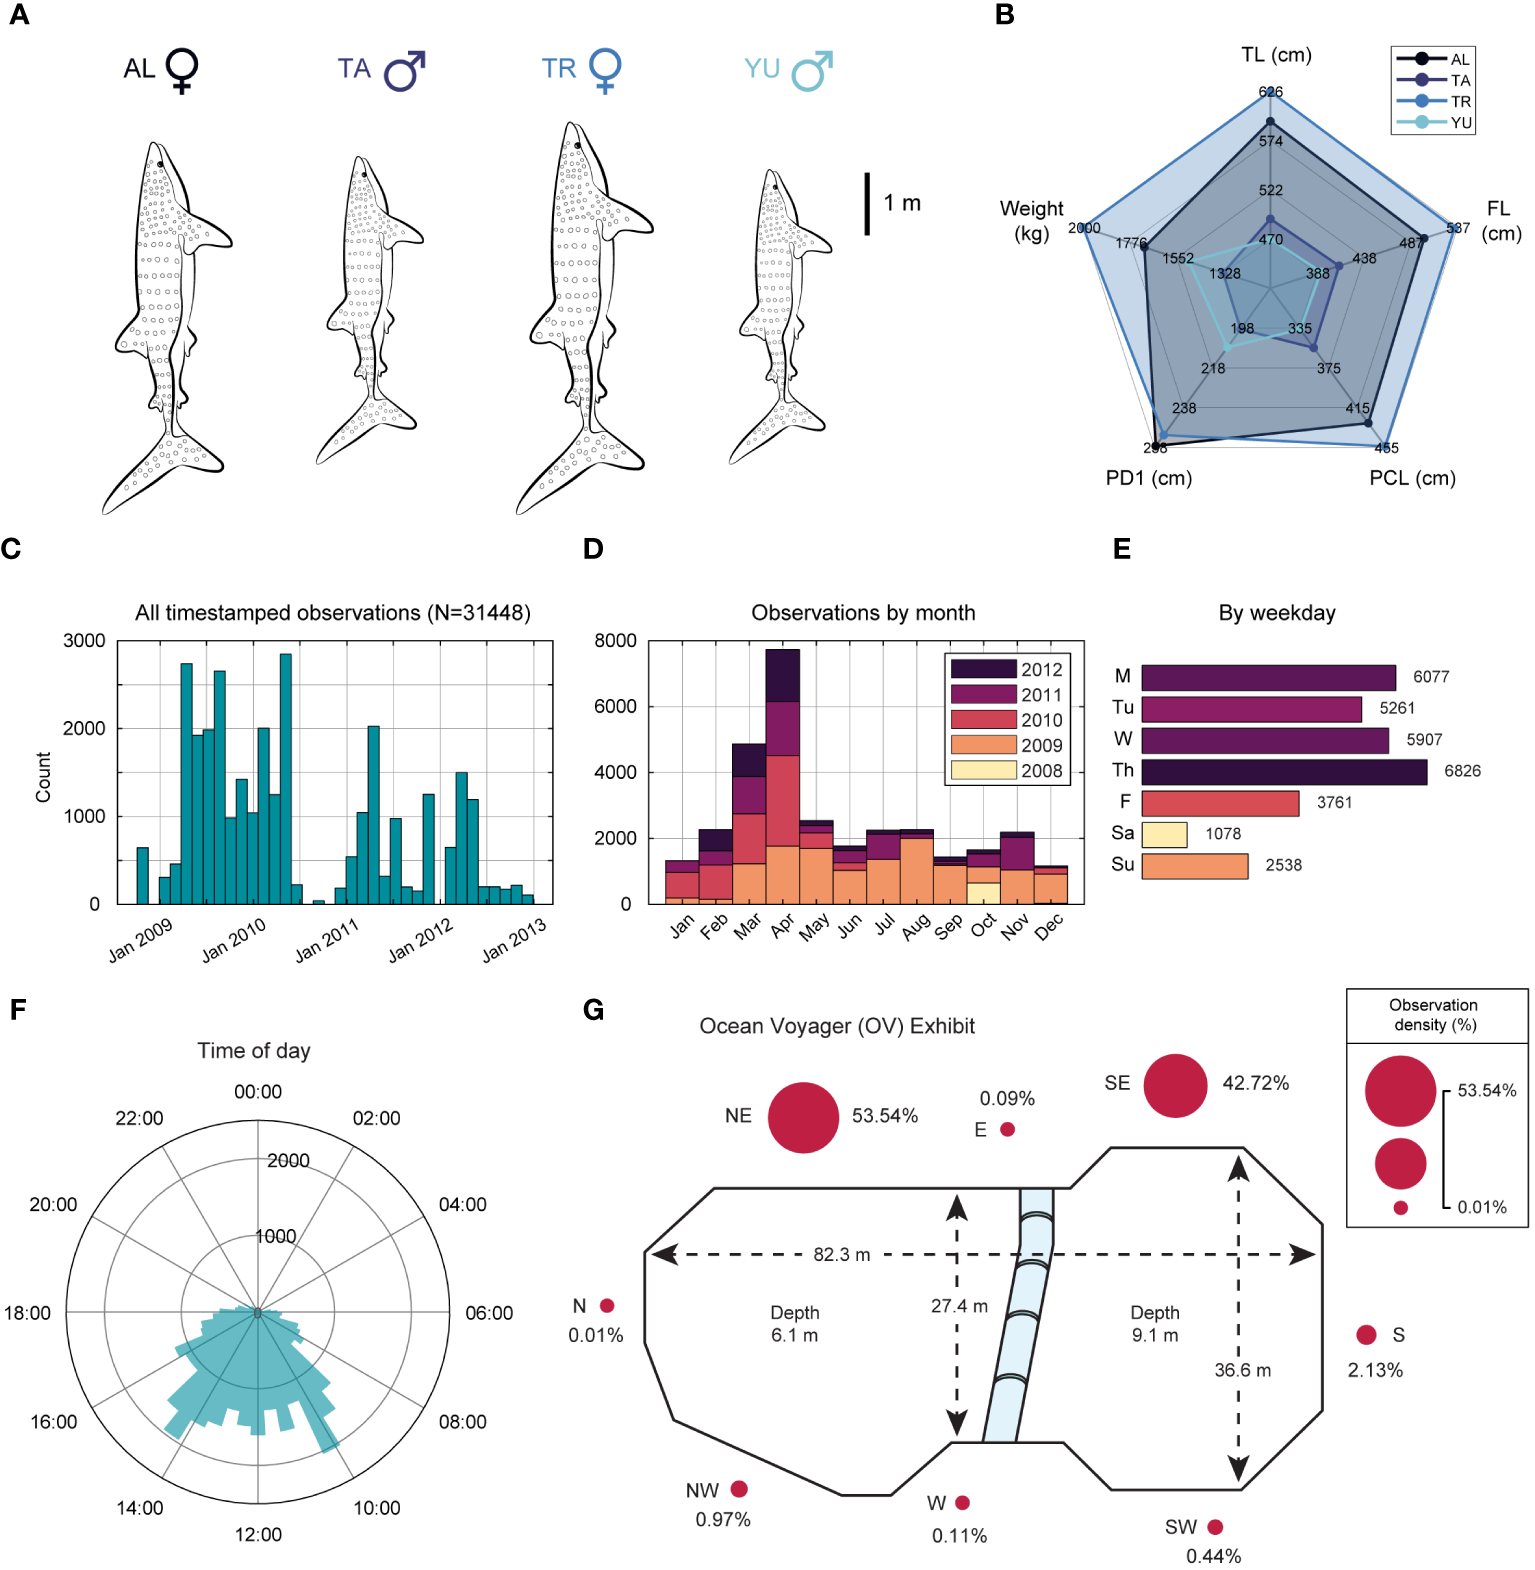
Observation statistics for four resident whale sharks over a four-year period at the Georgia Aquarium. (A) Relative sizes of the four resident sharks observed (total length; TL). (B) Summarizing radial plot of morphometric measurements. (C) Histogram of observations over the entire data collection period. October 2008 through December 2010 defined by far the most active years, accounting for nearly two-thirds (65.85%) of all observations. (D) Stacked histogram of observations by month, showing that more than 48% were collected in the Spring season (Mar-May), with active days throughout the four-year period favoring weekdays (Mon-Fri); (E). (F) Projecting observation counts on a 24-hour clock shows that 64% of all observations were collected between 9am and 3pm. (G) Schematic of Ocean Voyager, the 6.3 million gallon habitat [adapted from Coco and Schreiber (2017)], where surrounding bubbles are scaled in size to denote the fraction of observations recorded at that location, expressed as a percentage.
2 Methods
2.1 Animal husbandry in Ocean Voyager
All procedures were conducted in accordance with an approved Georgia State University and Georgia Aquarium Research and Animal Care Committee protocol (#A09036). Whale sharks were housed in a dumbbell-shaped habitat specifically designed to accommodate large aquatic animals, in addition to a variety of other species of fish, rays, sharks, and turtles (see Supplementary Material for complete list). Habitat dimensions were 82.3 m length, 36.6 m width at the south end, and ranged from 6.1–9.1 m deep (north, south, respectively). The habitat was filled with synthetic seawater (Instant Ocean/Spectrum Brands, Blacksburg, Virginia, USA) and treated using a closed recirculating life support system, which included foam fractionation followed by high-rate sand filtration (Dove et al., 2011; Schreiber and Coco, 2017). Water quality parameters are shown in Table 1. See Supplementary Material for a detailed explanation of water treatment and filtration. Physical and medical examinations were performed every 6 months, at several of which, common morphometric measurements were taken to track the growth of the animals over time. Notably, pre-caudal length (PCL), pre-first dorsal length (PD1), first dorsal fin anterior margin (D1A), fork length (FL), and total length (TL) (Matsumoto et al., 2017; Rogers et al., 2017). Figures 1A, B depict a snapshot of these morphometrics averaged across years 2007–2008 including estimated weights for each shark (kg). See Supplementary Figure S2 for these measurements at individual years (2006–2009).
Table 1
| Parameter | S.I. unit | Range |
|---|---|---|
| Temperature | °C | 21 - 25 |
| Salinity | g/L | 30 - 36 |
| pH | 7.8 - 8.3 | |
| Alkalinity | mg/L | 200 - 250 |
| Ammonia | mg/L | <0.01 |
| Nitrite | mg/L | <0.01 |
| Nitrate | mg/L | 50 - 100 |
Water quality parameters in the Ocean Voyager habitat at the Georgia Aquarium, Atlanta, USA (Reprinted from "Husbandry of whale sharks" in The elasmobranch husbandry manual II: recent advances in the care of sharks, rays and their relatives by Schreiber and Coco (2017), with written permission of the Ohio Biological Survey, Inc.)".
2.2 Feeding procedure and diet
Feeding sessions occurred between 10:30–10:45 and 15:00–15:15. Food was offered by staff in rope-guided rafts, where each shark had its own line to prevent competition and allow simultaneous feeding. Diet between the years 2008–2012 consisted of atlantic krill, silverside fish, squid, formulated gel, and vitamin supplements (Mazuri® Vita-Zu® Shark/Ray Tabs II, Land O’Lakes, Inc., Minnesota, USA). Rations and proportions depended on each R. typus individual, as their size and food preferences varied, but were ultimately given between 3–5% of their body mass per week. For a more comprehensive examination of diet and/or feeding protocol, see Schreiber and Coco (2017).
2.3 Data collection and processing
Data were collected from the top decks above the water line on paper data sheets by a team of 89 Georgia Aquarium volunteers and Georgia State University interns between the years 2008–2012. A total of 31448 observations were logged during this period. Volunteer training consisted of shadowing an experienced observer. During these sessions, the trainee and trainer compared observations to ensure inter-observer reliability. The trainee then completed two consecutive silent tests to evaluate before advancing to autonomous recording. Shark recordings were at least 15 minutes from a given location, truncated during feedings (time windows in 2.2 above), and resumed afterwards. Data curation consisted of aggregating timestamped notes into a tabular format alongside the shark being observed. Figure 1 details descriptive information about the sharks (N=4) and observation period, as well as a schematic of the Georgia Aquarium OV habitat (Figure 1G).
On average, divers were present at three periods throughout the day: (i) morning maintenance (7:30–9:00), (ii) early afternoon dive shows (12:00–13:00), and (iii) paid visitation associated with the Journey with Gentle Giants Diver Immersion Program (DIP; 16:00–18:00). Importantly, these times did not overlap with feeding times (see Supplementary Figure S3). Depth was estimated by an observer based on whether the animal was breaking the surface (S), directly below the surface (BS), occupying an area between directly below surface and the midpoint of the enclosure depth (Deep; D), or in the bottom 50% of the enclosure depth (Very Deep; VD).
Swimming speed was estimated by measuring the time it took a shark (to the nearest second) to traverse a series of panels, each four feet (1.22 m) in length. These two variables were converted to rate estimates at timestamps resolved to the nearest minute. Swimming direction (clockwise or counter-clockwise) was also noted by the observer. The resulting file was processed to standardize categorical variables (e.g. depth) and numeric codes indicating presence or absence of light/fan stimuli, divers, or pre-/post-feed observations.
For lead-follow interactions, if the shark was swimming alongside, or crossed paths within ≈3 meters of another shark during recording, observers noted the positioning of the other shark relative to (ahead of, next to, or behind) the recorded shark, and the accompanying shark was considered leading or following, respectively. Similarly, observers marked if the other shark was higher in the water column, equal depth, or lower in the water column than the observed shark. If the observed shark moved more than ≈3 meters out from the wall (where there was a rope line) during recording, the recording was stopped.
2.4 Data extraction and analysis
All analyses were performed in MATLAB® (The MathWorks Inc, 2022). To analyze swim speed leading up to morning and afternoon feedings, timestamp of feed was locked as the last observation preceding session onsets. In some cases, the latency between the last pre-feed observation and the first post-feed observation indicated too low a sampling rate. These feeding sessions were filtered out by bounding feed intervals to pre- and post-feed observations no greater than 45-minutes apart from one another, producing a subset of highly sampled feed periods with no difference in the number of observations per feed (two-sample t-test; t(213) = 0.254, p = 0.8). Variable timestamps were then binned chronologically within the 90-minute preceding window for each shark and each feeding session (119 morning, 96 afternoon). Measured speeds were subsequently averaged across all sharks and all feedings to yield a single pre-feed average speed time-series.
Changepoint analysis (Killick et al., 2012) was used to detect deviations in the linear pre-feed swim speed trend. Non-parametric hierarchical bootstrapping (Saravanan et al., 2020) was then performed on the time-series over 10-min windows designated between 70–80 min before and 0–10 min before feeding commenced. The time-points selected for the bootstrapped baseline and analysis windows were defined in this way because 70–80 min prior to feed occurred long before any stimuli that might cue upcoming feed to the sharks. Selected time-points were fixed across all sharks, but which feed they came from were randomized with replacement across 3000 iterations. Afterwards, bayesian posterior distributions were estimated by again randomizing with replacement which sharks were included in the final speed average for each of the 3000 repetitions.
Depth occupation proportions were tested for omnibus significance using Chi-square test of independence. For depth analysis, omnibus Chi-square was followed up with post-hoc pairwise comparisons for each of the six permutations and four depths using Fisher’s exact test (Shan and Gerstenberger, 2017). The 2 × 2 design matrices for Fisher’s exact tests were constructed as follows: the two sharks being compared had their four frequency values (one for each depth) isolated, then analysis depth was compared against the sum of observation frequencies at all other depths.
For depth analysis differentiating between day and night, or feed vs non-feed periods, pairwise design matrices were first constructed as a 2×4 of the depth frequencies for the comparison shark vs the sum of the frequencies for all other sharks, across both conditions, similar to (Latta et al., 2012). See Supplementary Material for a description of how day and night were defined. Importantly, the year 2010 accounted for nearly two-thirds of all nighttime observations (65.3%), with 12.5% of all observations for that year recorded at night (Supplementary Figure S3), so we restricted day vs night analysis of depth to this year alone. The 2 × 2 matrix for Fisher’s exact test was then constructed using the day and night frequencies for the depth to be analyzed (comparison shark vs the others).
Lead-follow behavior was analyzed as frequency counts based on the qualitative relative positioning notes described above. We developed a “lead-follow index” (LFI)
where c represents counts, expressing the difference in leading vs following divided by the total. The identity of the following sharks was then extracted to quantify deviation of individual leader-follower pairs from random chance using Chi-square test of independence, further visualized using social network analysis (Wey et al., 2008), similar to (Mavrodiev et al., 2021). The significance threshold was p< 0.05, where all calculated p-values for Chi-square or Fisher’s exact test were conservatively corrected for multiple comparisons using Bonferroni, as done in previous work (MacDonald and Gardner, 2000). See Supplementary Material for tables including the exact number of comparisons and critical p-values after correction.
3 Results
3.1 Aquarium whale sharks display a high degree of individual variability
A collection of simple behavioral metrics offered valuable insight into individual differences present among four resident whale sharks. Parsing each subject’s contributions to the aggregate swim speed distribution initially evinced noteworthy individual variation (Figure 2A, see also Supplementary Figure S5 for raw aggregate and individual shark histograms). The mean swim speed (meters/sec) and SD for each shark (N=4) were , , , and . All sharks exhibited a right-skewed swim speed distribution, with high values more rare than periods of slowed motion, especially for sharks AL, TA, and TR (skewness s, corrected for systematic population bias: ). AL, TA, and TR also exhibited speed distributions more outlier-prone than the standard normal distribution, whereas YU did not (kurtosis k, population-corrected with normality set at : ).
Figure 2
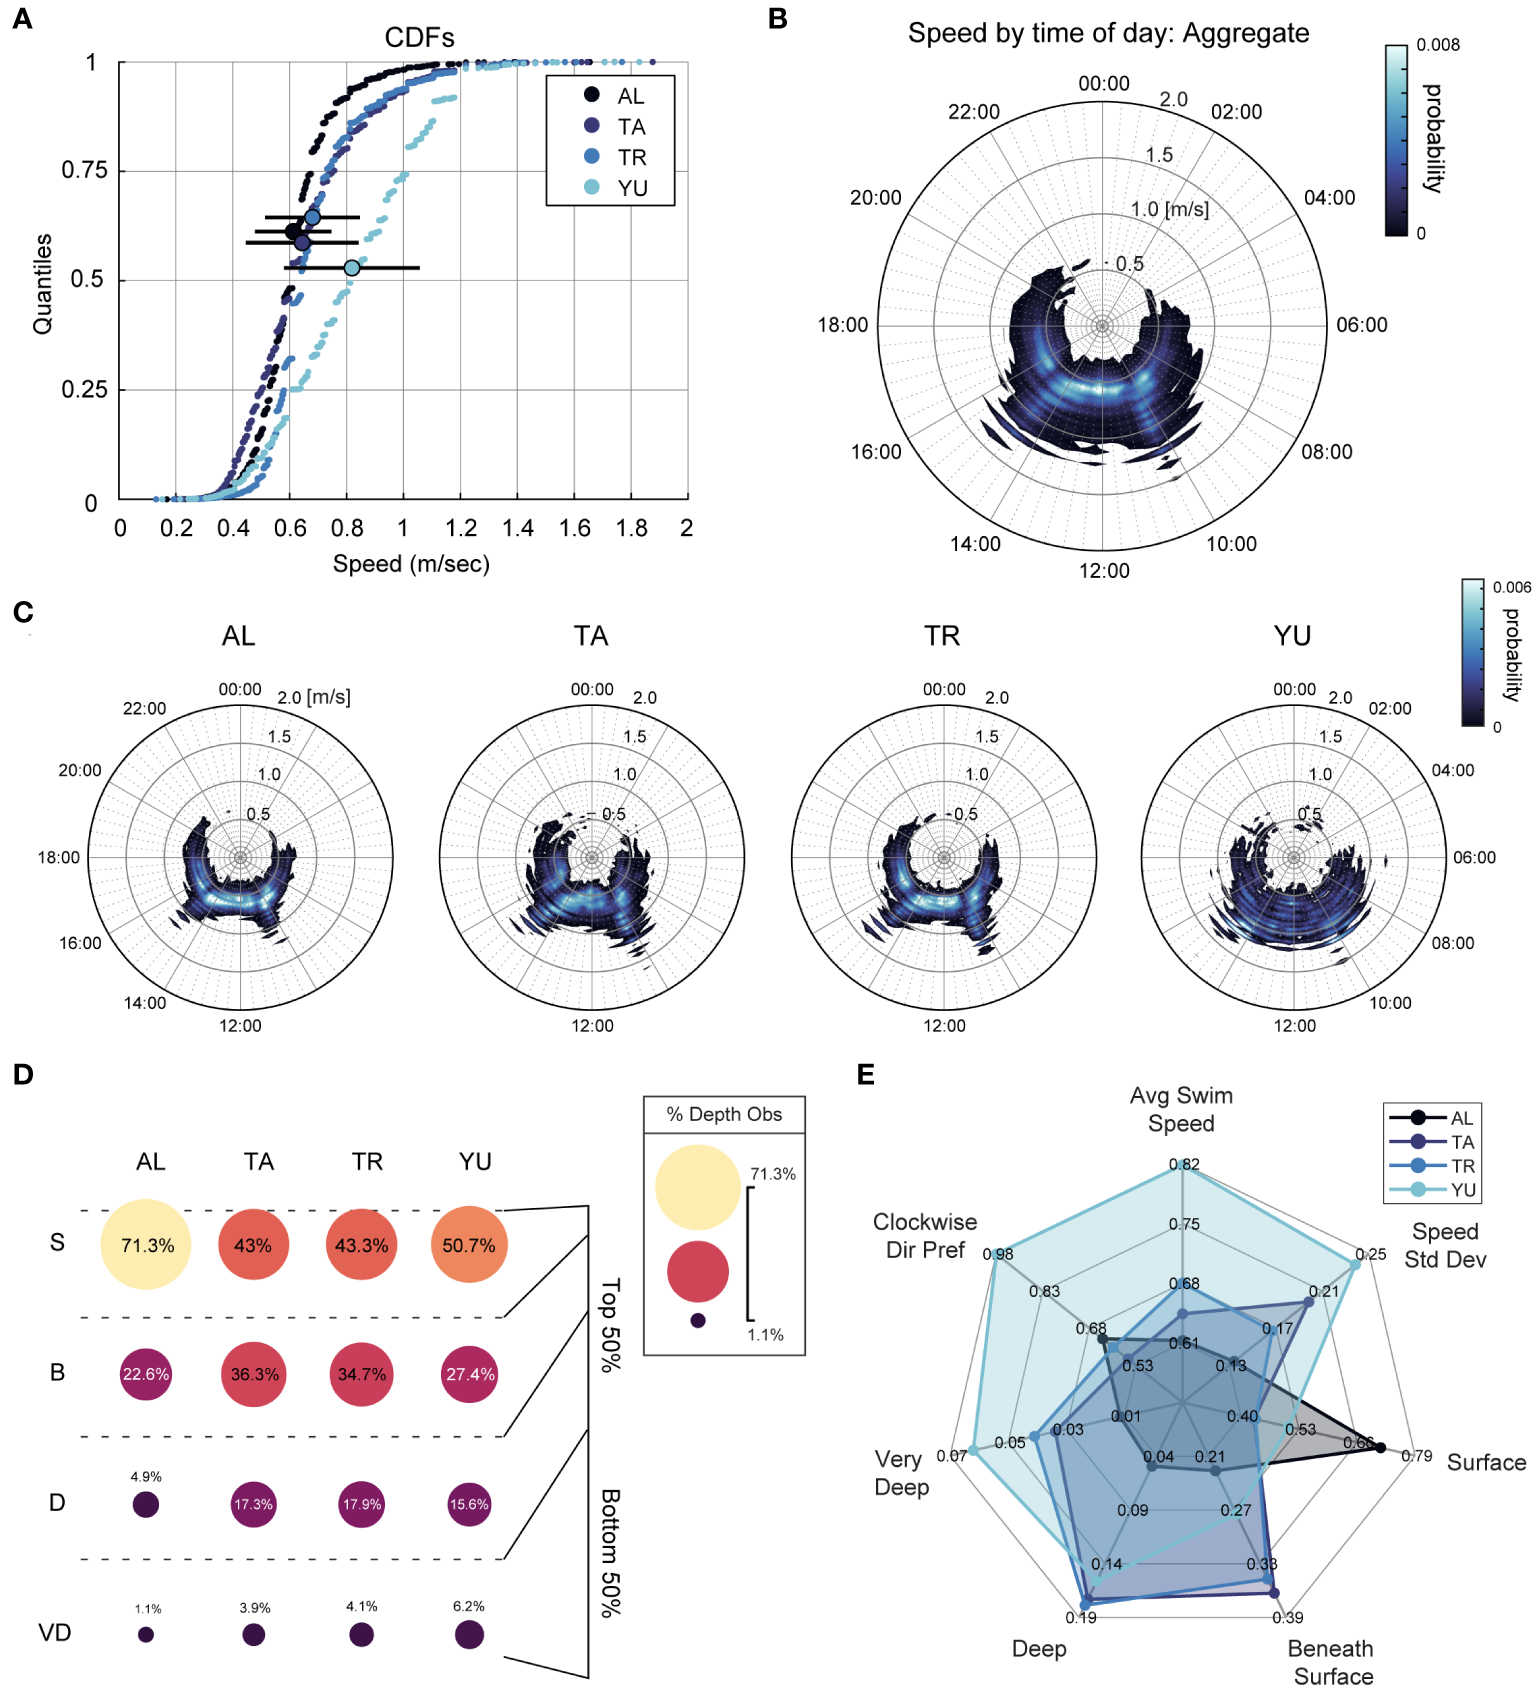
Aquarium whale sharks display a high degree of individual variability. (A) Cumulative distribution functions (CDFs) of swim speed for all 4 sharks, where the enlarged dot represents the quantile positioning of the mean (relative to the median, at 0.5) and black bars are the standard deviation (; ; ; , all m/sec). (B) Projection of all sharks’ swim speed onto a 24-hour clock, where increasing radius represents increasing swim speed, and color represents probability. (C) Depicts the same as (B), but for each individual shark normalized to a common probability scale (color). (D) Proportion of occupation at each depth of the habitat for each shark, and approximate location inset to the right. Notice the nonlinearity in depth definition. Key: S, breaking surface; B, beneath surface; D, deep; VD, very deep. (E) Summarizing radial plot where each polygon represents a shark, and vertices correspond to individual scores on a variety of metrics such as speed, depth, and directional preferences. Colormaps supplied by Thyng et al. (2016).
Figures 2B, C illustrate these distributions as a function of time and probability. Individual proportions for the way each shark utilized the depth of the habitat are shown in Figure 2D, expressed as a percentage of each animal’s own total (raw frequency counts can be found in Supplementary Table S2). Sharks AL and TR showed mild preferences for a clockwise swimming direction (64% and 60%, respectively), whereas TA exhibited this preference essentially no greater than chance-level (55%). YU was the only shark that showed a clear and stable pattern of clockwise swimming (98% of his total observations). Data for all sharks are summarized in the radial plot (Figure 2E) illustrating the differences between individuals on seven different metrics.
3.2 Swim speed begins to increase 30-minutes before scheduled feeds
The speed probability contours projected on the 24-hour clock in Figure 2C supplied compelling evidence themselves that acute speed increases track two specific daily events. Given the feeding regime adhered to a consistent 10:30–10:45 and 15:00–15:15 schedule, we binned swim speed data on a minute-by-minute basis leading up to onset (see 2.4). Changepoint analysis suggested that swim speeds started to increase ∼30-minutes before both morning and afternoon feeds (Figure 3D). We then applied hierarchical bootstrapping to baseline and analysis periods (described above), directly testing the hypothesis that swim speed immediately preceding feed exceeded that of the baseline window. This approach was selected for a few reasons: (i) individual whale sharks were sampled nonuniformly, lending disproportionate representation to sharks that spent more time near observers (e.g. AL); and (ii) time-points were also sampled nonuniformly, with variable observation counts in both baseline (70–80 min) and pre-feed (0–10 min) analysis periods. Randomly sampling each shark with replacement permits estimation of the Bayesian posterior speed distributions observed in those windows from this dataset, ensuring equal representation of each shark in the final statistical calculation, as well as proper same-day comparison for both baseline and pre-feed. Bootstrapping further provides a more interpretable metric for the desired hypothesis: a direct probability that swimming speed immediately prior to feed is greater than that over an hour before.
Figure 3
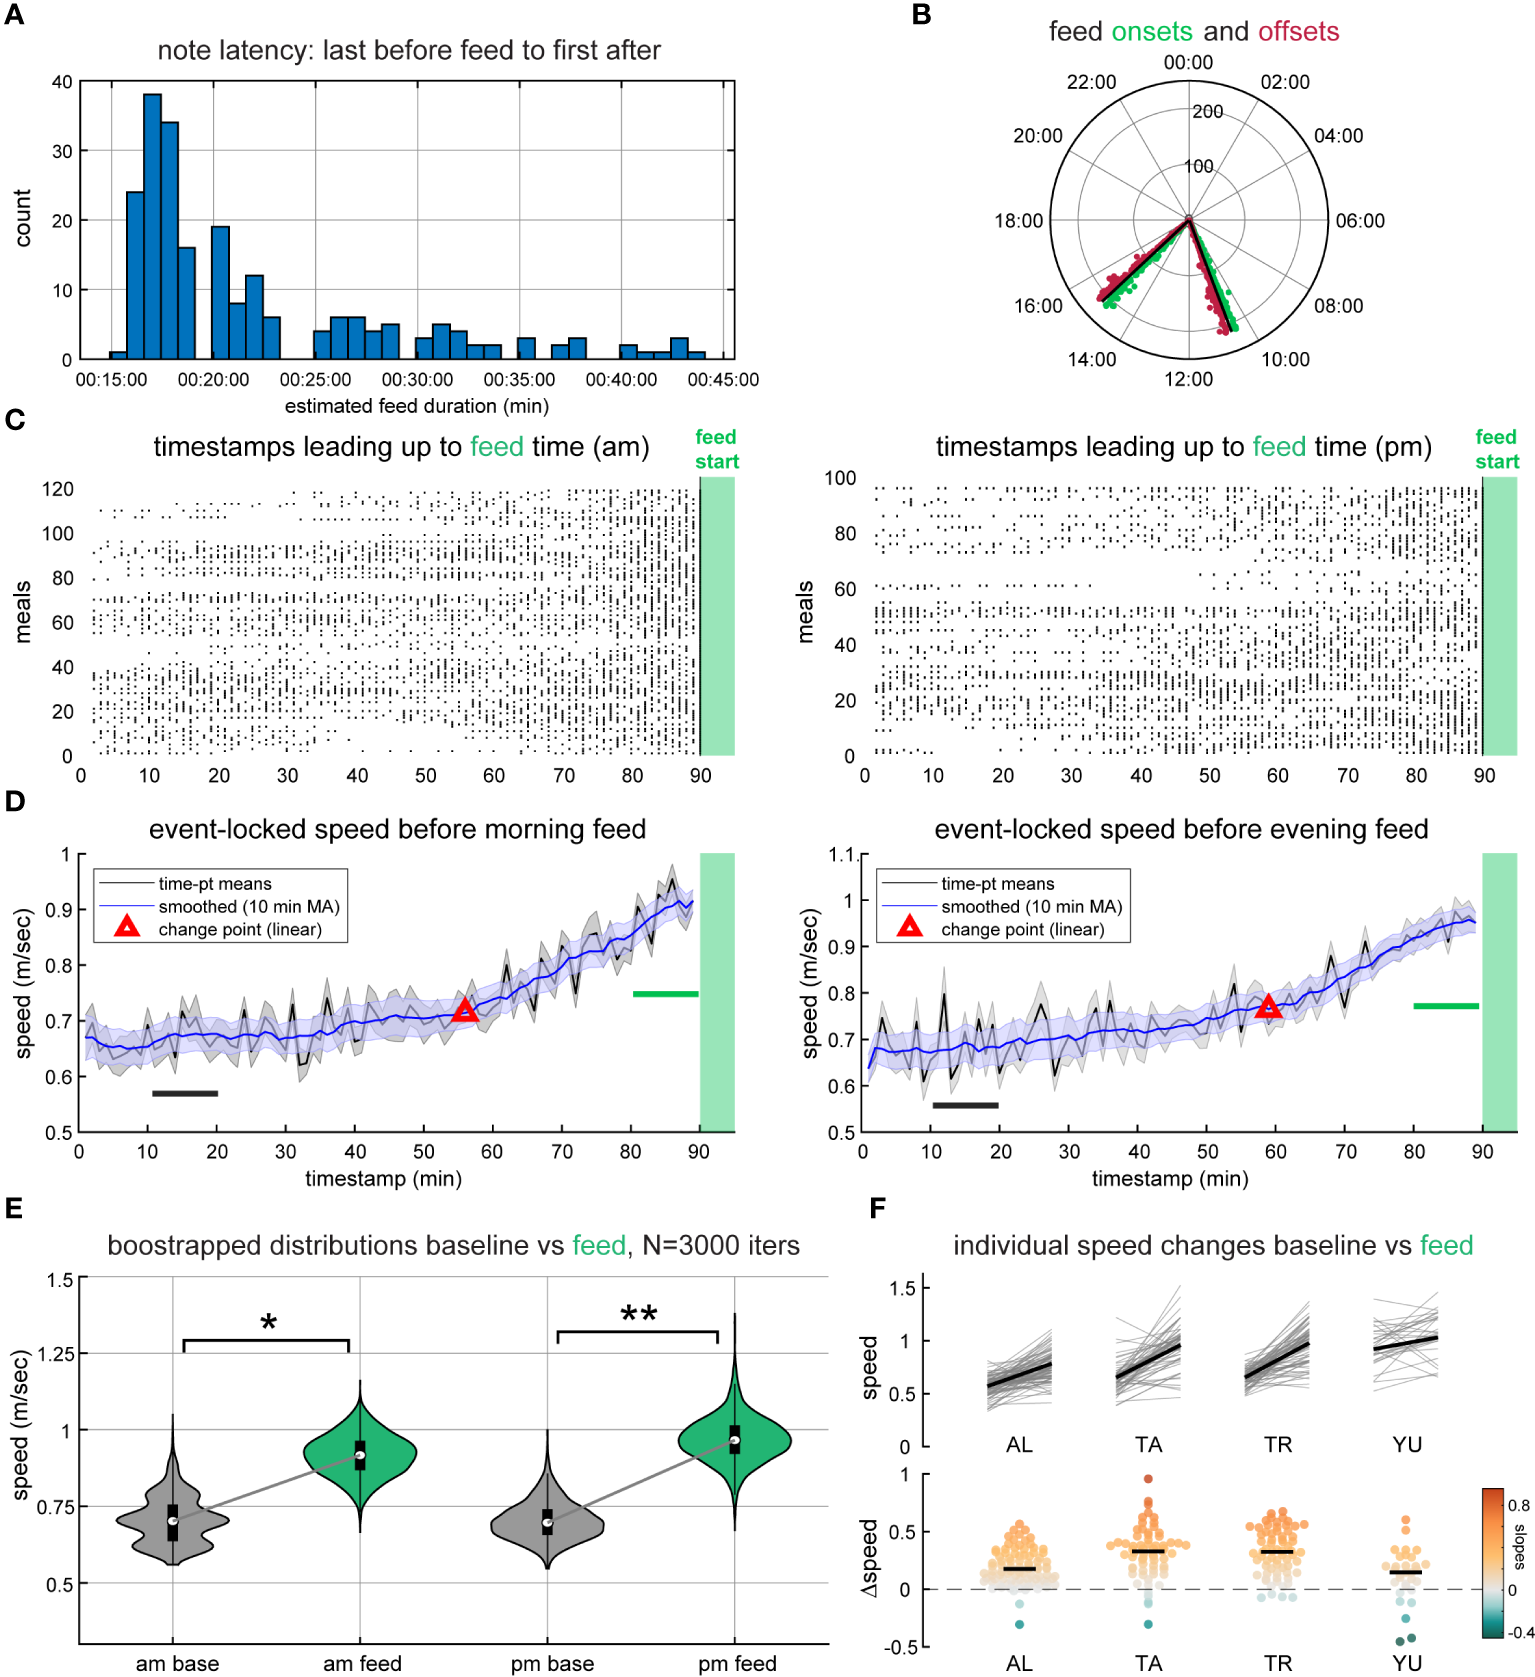
Resident whale sharks increase their swim speed in anticipation of food. (A) Histogram of feed durations that met the 45-minute criteria. (B) Feed onset and offset times included in this analysis. (C) Raster plots for morning and afternoon feed sessions showing observation density, where each tick represents an observation that corresponds to at least one of the four sharks. (D) Speed measurements for observations in (C) collapsed to a single average for each timepoint (black), contoured by the SEM (gray shading). Overlying blue line and shaded error traces represent the same data smoothed by a 10-minute moving average (MA) and changepoint (red) where the linear trend departs from early timepoints. (E) Bootstrapped distributions (3000 iterations) for the baseline (black) and analysis (green) windows in (D), p = 0.026 and p = 0.006 for morning and evening feeds, respectively, where *p < 0.05 and **p < 0.01. (F) Speed changes for each individual across baseline and analysis periods, pooling all feeds (top; n = 89, 65, 67, 31 for AL, TA, TR, YU, respectively), and their distributions of slopes (bottom). Black lines in (F) represent mean (top) and median (bottom).
Our analysis suggested that swim speed immediately prior to both morning and evening feeding sessions (0–10 min before) was indeed higher than at 70–80 min before that same feed (bootstrapped means and SEM N = 3000 iterations: morning, vs m/sec, ; evening, vs m/sec, ; Figure 3E). The bootstrapped probabilities reported here indicate that comparing measured speed from more sharks drawn from the same distribution would show higher speed immediately prior to feed in 97.4% of morning cases, and 99.4% of evening cases (1 − p), wherein SEM reflects the uncertainty about the mean (the 67% confidence interval). Put differently, the probability of observing a baseline speed higher than at feeding time is 2.6% and 0.6%, respectively, considerably lower than chance (50%).
High swim speeds were also not simply explained by routine circadian patterns (e.g. day/night activity fluctuations). When speed measurements were partitioned into three non-overlapping time windows (Daytime 30 min outside of feed onset/offset, Day-time 30 min within feed onset, and Night-time), values at the right-tail of the distribution were primarily accounted for by the overlap of daylight hours and the half hour surrounding feed onset ( ; Supplementary Figure S6). Further inspection of each individual shark showed that this result is robust across all animals measured here, and not driven by any one shark (Figure 3F). Importantly, this view offers a scale for the magnitude of speed change using each individual as its own internal control, given factors governing swimming speed (e.g. tailbeat frequency) are known functions of body size (Jacoby et al., 2015; Porter et al., 2020). Individual baseline and feed speed changes for each were pooled across all feeds, morning and evening, as there was no difference in the global proportion of increasing vs decreasing slopes (Fisher’s exact test, ).
3.3 Resident whale sharks occupy space differently from one another
Next, we analyzed shark distributions along the depth axis. Depth was estimated based on the criteria described above (see 2.3), providing an informative view of how they occupy vertical space. While all four sharks spent a vast majority of their time in the upper half of the habitat and less than 4% of the aggregate observations occupying the bottom 50% of the water’s depth, consistent with reports from the wild (Eckert and Stewart, 2001; Rowat and Gore, 2007; Womersley et al., 2021; Andrzejaczek et al., 2022), we were interested to see if the sharks in this study differed from each other in this respect. An omnibus chi-square test of the four depth categories noted for each shark suggested extreme deviations from expected frequencies, indicating at least one shark differs from the rest in its proclivity for certain depths (Figure 4A; χ2(9, 31080) = 2362, p = 0).
Figure 4
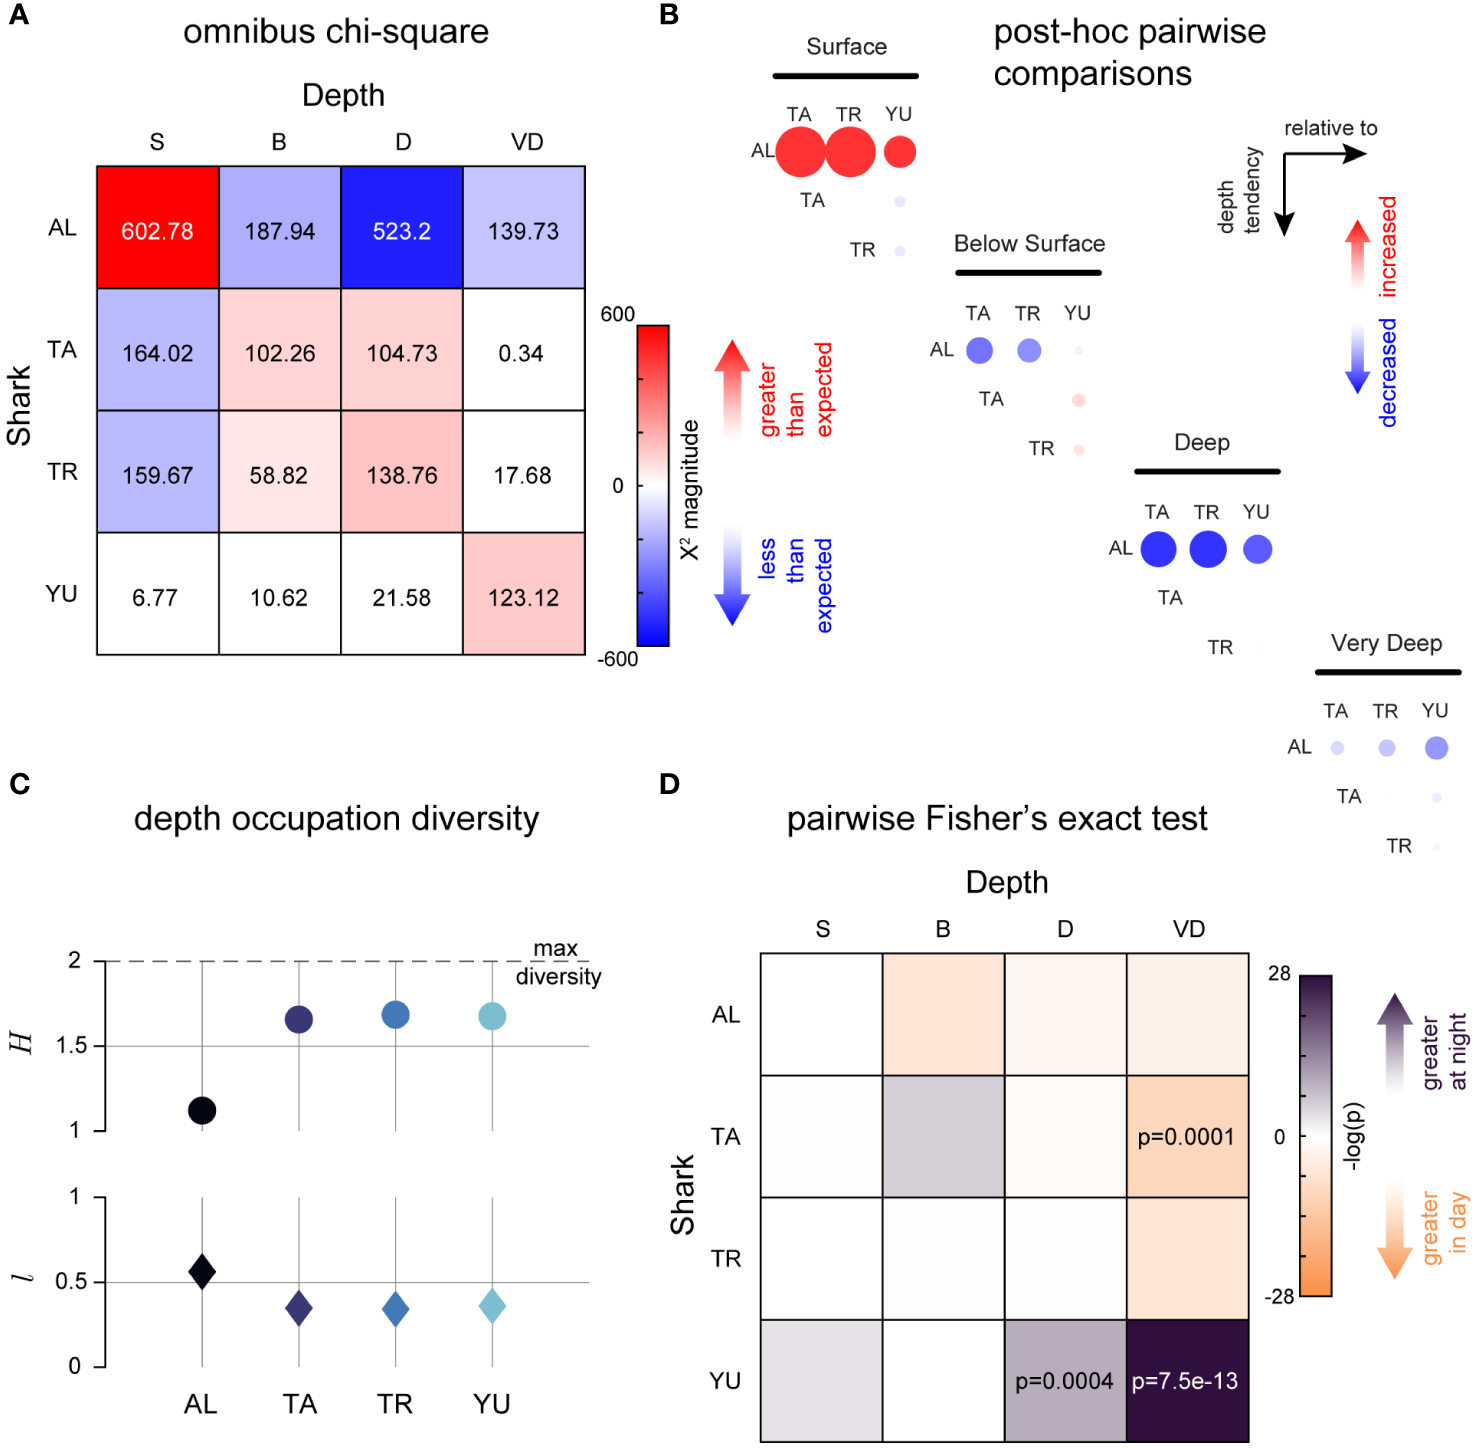
Resident whale sharks exhibit differences in depth occupation. (A) Matrix of calculated χ2 values for individual cells in the omnibus between-subjects chi-square test, . Cells with a computed were zeroed, whitening them on the color scale, whereas those with () were multiplied by -1 to illustrate the direction of deviation. (B)Post-hoc pairwise comparisons, where Fisher’s exact test was applied to all possible 2 × 2 design matrices. Dot sizes are scaled by the computed χ2 value for the design matrix, with the same procedure performed to color the directionality on the same magnitude scale as (A). Labels on the diagonal represent the shark being tested, whereas labels across the top represent the tendency the tested shark’s depth is relative to. (C) Shannon entropy (H) and Simpson’s similarity index (l) for each shark’s depth frequency counts. (D) Pairwise p-values for Fisher’s exact test applied to 2 × 2 matrices of each shark’s 2010 day- vs night-time depth distributions relative to all other sharks combined.
Post-hoc comparisons, as described above (see Data extraction and analysis, 2.4), showed that the identified difference was largely driven by AL, who spent substantially more time at the surface and less time in the bottom 75% of the habitat relative to the other three sharks (Figure 4B; Supplementary Table S3 shows exact p-values for all comparisons). Conversely, YU showed the greatest affinity for deeper waters, with all other sharks observed comparatively less at Very Deep , and only AL less at Deep depths . Sharks TA and TR were observed more frequently beneath the surface than YU , though interestingly, TA and TR did not differ themselves on any measure of depth (, and for S, B, D, and VD, respectively), demonstrating strikingly similar occupation proportions.
To further quantify depth occupation patterns, we used Shannon entropy [commonly reported as Shannon’s diversity index; (Shannon, 1948)] and Simpson’s similarity index (Simpson, 1949) to estimate behavioral diversity, as has been done in previous studies (Miller et al., 2020). Maximum entropy occurs when all outcomes are equally likely, and thus there is the least certainty about the outcome. Based on the proportions shown in Figure 2D, we found that AL had a lower depth occupation diversity than the other three sharks, whereas all others were comparable (, relative to and ; Figure 4C). Simpson’s similarity index, a complementary measure, reports a probability that two random samples drawn from each shark’s depth distribution would belong to the same category. AL had the highest probability of a same depth observation (, as compared to , and ; Figure 4C), indicating a more stable and reliable preference for a certain position in the water column.
In the year 2010, there was one day where a full 24-hours of observations were recorded, offering an interesting opportunity to observe behavioral changes from day to night. Looking at 2010 depth occupation proportions specifically, day-time depth proportions were highly comparable to the totals observed over the entire study (no difference across any category for any shark exceeded 5%; Supplementary Figure S7A). However, day/night comparisons for that year unveiled marked differences in spatial preference dependent on the time of day (Figure 4D). These circadian differences in depth proportion were accompanied by an entropy decrease in night-time for all sharks with exception of YU, whose entropy increased at night, and whose preference for Very Deep portions of the habitat rose by nearly 20% (Supplementary Figure S7B). AL, by contrast, showed the most drastic entropy decrease, and greater preference for the surface, which increased 17% at night. This divergence suggests some degree of spatial partitioning at night, and for 3 of the 4 sharks, demonstrates a decrease in behavioral variability.
3.4 Lead-follow interactions as a metric of social dynamics
Lastly, we analyzed lead-follow interactions among the four sharks to see whether it may index some underlying social structure. Nearly 90% of all close proximity swimming interactions involved sharks AL, TA, and TR (Figure 5A), all of which resided in the habitat longer than YU. Using a “lead-follow index” (LFI) to quantify the relative proportion of leadership vs following behavior, normalized by the shark’s participation in either, showed that AL lead other sharks more than it followed (Figure 5B). Factoring in the identities of following sharks, a chi-square test of the overall lead-follow frequency matrix showed that lead-follow interactions among individual pairs deviated from the expected distribution (; Figure 5C). AL and TA mutually participate in this interaction, such that AL follows TA and TA follows AL far more than expected ( and , respectively). AL and TR also participated in a mutual leader-follower interaction, such that AL follows TR and TR follows AL more than expected ( and , respectively). The same was true of TA and TR ( and ).
Figure 5
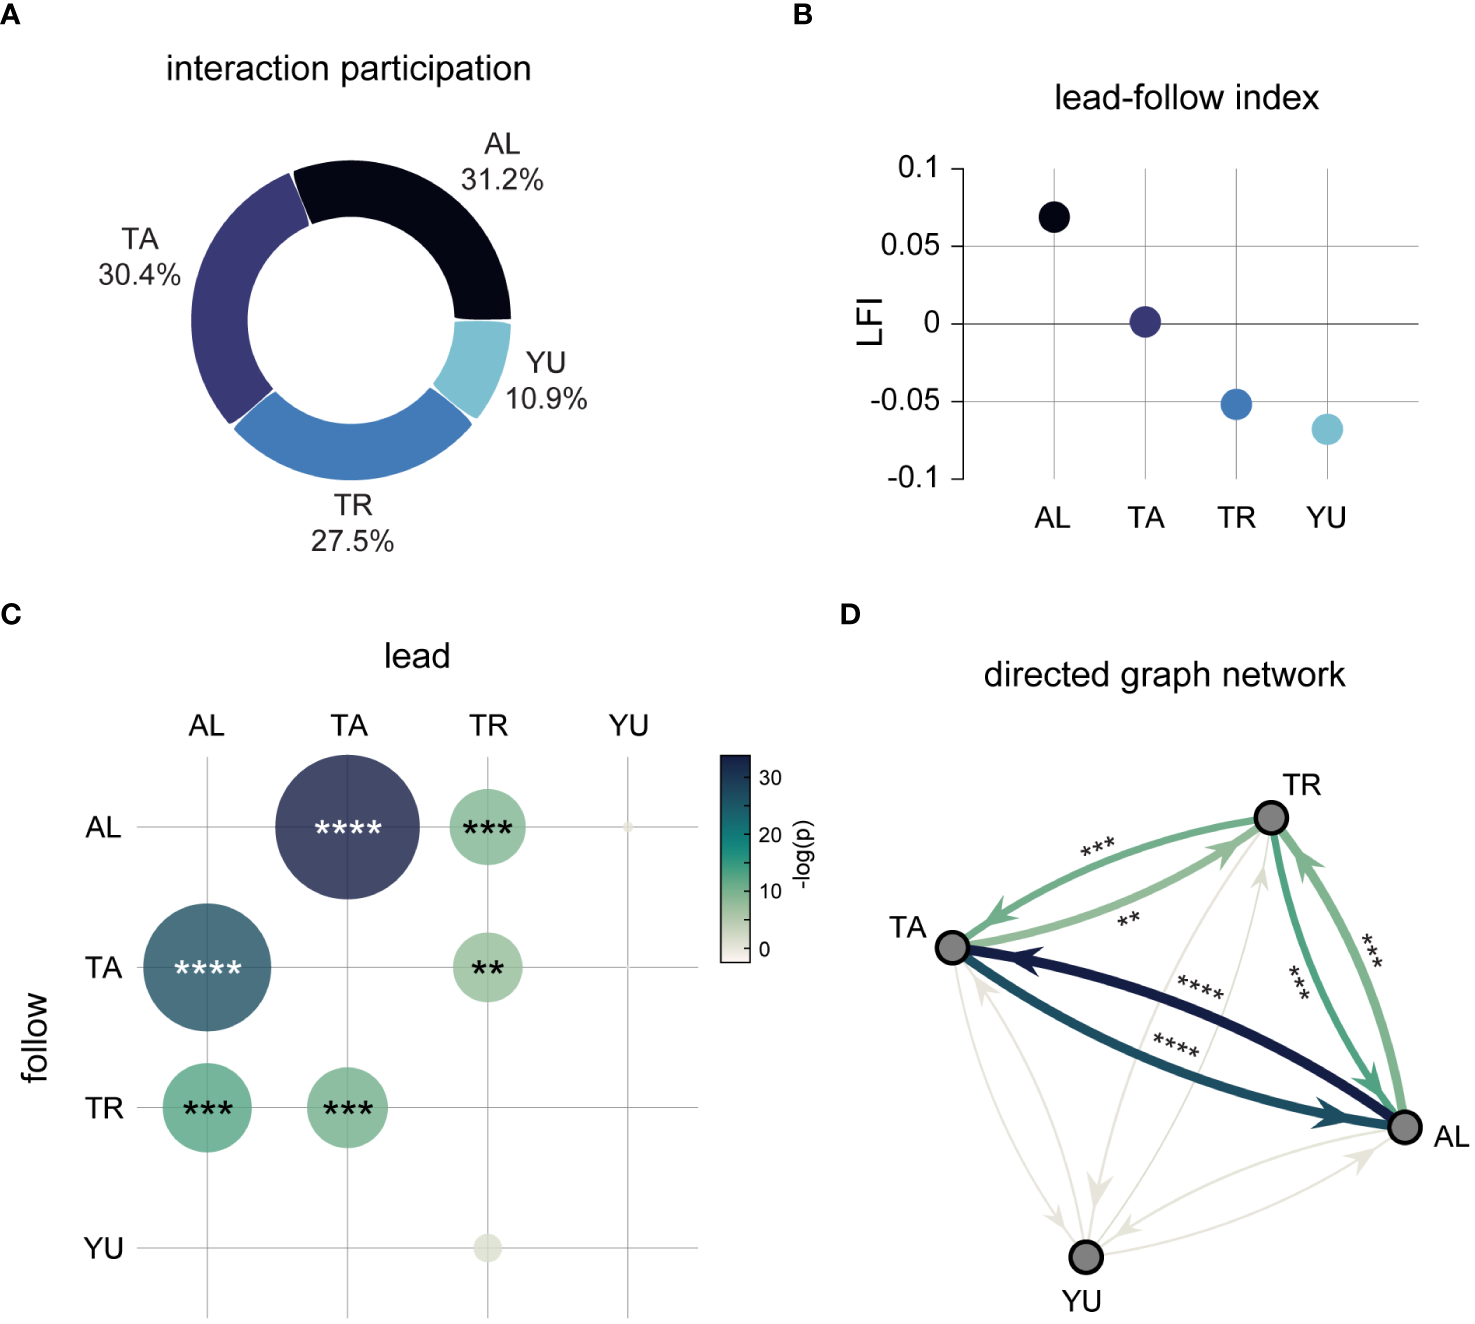
Lead-follow interactions as a metric of social dynamics. (A) Total participation in close proximity interactions for all sharks ( for AL, TA, TR, YU, respectively). (B) Scores for each shark on the lead-follow index (LFI), defined in Equation 1. (C) Depicts the matrix of p-values for individual cells in the omnibus between-subjects chi-square test, , , where dot size and color are scaled by −log(p). (D) Graphical network illustrating the directed nature of interaction, such that arrow direction represents “following” and the receiving node the “leader”. Arrow size is scaled by the observed: expected ratio, edge thickness corresponds to the observed following frequencies (Supplementary Table S6), and color conforms to the same scale as the matrix in (C). **p < 0.01, ***p < 0.0001, and ****p < 1.0 × 10⁻¹⁰.
In contrast, any combination involving YU was not significantly different from random, suggesting he had no meaningful interaction with the other sharks; at least, not one that was expressed through mutual following (Figure 5D). YU also showed the most subdued style of close proximity interaction, scoring lowest on the LFI, and with total interaction participation differing by an order of magnitude from the three other sharks (n = 545 as opposed to n = 1553, 1514, 1369 for AL, TA, and TR, respectively). Given that six combinations of leader-follower pairs far exceeded statistical significance, and all others were not remotely close to trend level, represents an interesting bifurcation suggestive of highly deliberate social behavior. TA and TR’s relative preference for following AL to a greater degree than each other is also noteworthy, despite their striking behavioral similarities shown above. This indicates that sharing pace and space together does not necessarily linearly map to close proximity leader-follower interaction.
3.5 Effects of divers on R. typus behavior
One additional finding, highly statistically significant, though perhaps small in practical magnitude, was an increase in swim speed when divers were not present ( vs for paired same-day measurements; Supplementary Figure S8). Importantly, this speed difference was not due to overlap with the speed increases in anticipation of upcoming feed reported in Figure 3, as feed windows were filtered out before daily averages were calculated in the presence or absence of divers.
4 Discussion
4.1 Wild and aquarium whale sharks exhibit average speed and depth similarities
Naturalistic R. typus, or elasmobranch studies more broadly, are the only comparisons that can be made to this current study, as to our knowledge, there are no other datasets of aquarium whale sharks to compare. Elasmobranch studies provide useful comparison since the whale sharks’ closest relatives are not other filter feeders, but rather, carpet sharks like the zebra shark (Stegostoma tigrinum) (Wilson and Martin, 2003) and the nurse shark (Ginglymostoma cirratum) (Dove and Pierce, 2021). In addition, when comparing sharks in aquaria to the wild, there are inherent limitations and/or obstacles that arise such as confinement barriers, enrichment terrains, depth limitations, behavioral changes in response to husbandry, and interspecies interactions. For example, enclosures can influence speed, as the distances between walls can limit the ability to develop full velocity in one direction and require frequent turning. Nevertheless, average speed has been found highly similar between wild and aquarium whale sharks. In one of the first studies measuring speed in wild whale sharks, Gunn et al. (1999) estimated an average speed of 0.7 m/s after recording rate of movement (ROM) over 24-hour periods from 30 sharks in shelf waters off the Ningaloo Reef. Interestingly, this average was the same during both day and night, not commonly demonstrated by elasmobranch species which usually exhibit different ROM’s depending on the time of day, such as the scalloped hammerhead (Sphyrna lewini) (Holland et al., 1993) and the lemon shark (Negaprion brevirostris) (Nixon and Gruber, 1988).
We found the global average swim speed, without respect to day or night, to be 0.67 ± 0.19 m/s, nearly identical to wild whale sharks. Controlling for day times 1-hour on either side of the feeding regiment, this average speed was similar at night as well ( vs ), consistent with Gunn et al. (1999). This suggests that unlike most elasmobranch species, whale sharks tend to maintain a steady swim speed throughout day and night, despite being a known diurnal species. Though considerably fewer observations were taken at night (nnight = 1314, as opposed to nday = 20964), and variance heterogeneity made statistical comparison difficult. Another study, however, found a slightly higher average swim speed of 1.1 ± 0.04 m/s for 33 whale sharks during the hours of 7:00–16:00, which they noted as their feeding time (Motta et al., 2010), lending credence to our findings here that anticipation of food may drive speed increases similarly to bouts of filter-feeding. Notably, the slighter higher average swim speed could be due to the type of feeding behavior exhibited, where the whale sharks need to swim faster for active surface suction feeding than when cruising.
Other notable similarities to wild sharks were depth preferences. While artificial habitat constraints complicate direct comparison, our data suggest that aquarium whale sharks prefer the surface over deeper depths, congruent with work from the wild (Eckert and Stewart, 2001; Rowat and Gore, 2007; Andrzejaczek et al., 2022). The study by Andrzejaczek et al. (2022) compellingly shows that whale sharks spend a statistical majority of their time in the top 250 meters of the water column, though it is important to note that they also had the widest range (0–1896 m), engaging in deep dives (as shown elsewhere (Brunnschweiler et al., 2009; Tyminski et al., 2015)) and have recently been observed bottom-feeding (Whitehead and Gayford, 2023). Both Motta et al. (2010) and Gunn et al. (1999) also found that whale sharks spent more than half of their time at the surface in naturalistic settings, comparable to the proportions we show here, wherein each resident shark spent roughly half the time at the surface or just below. However, the study by Gunn et al. (1999) does not specify if the calculated percentages include feeding times, in contrast to the study by Motta et al. (2010), which primarily concentrates on feeding periods. The analysis we present here did not exclude feeding times from overall or pairwise comparisons. Given that the sharks were fed at the surface of the water and observations tended to concentrate around feeding times on any given day, it is difficult to disentangle whether feeding patterns are a main driver of this preference, or if thermoregulation via solar body warming plays a role (Meekan et al., 2015). Additionally, since depth is relative, most studies in the wild categorize depth below the surface as being 60 m or below. In this case, whale sharks in captivity would have spent 100% of their time at the surface.
4.2 Whale sharks demonstrate persistent individual variation
One shark that spent a majority of time at the surface was AL. She preferred swimming alongside the wall, which was a perplexingly persistent behavior, despite efforts by Animal Husbandry staff from July-October 2008 to get AL to swim further out. Staff used barrels on the wall (which she briefly swam around), extra one-boat feeds (once or twice per day at either: 6:30, 7:30, 13:00, and 14:00), or projected food away from the wall once a day for 30 minutes at varying times of either 7:30, 8:00 9:00, 9:30, 12:00, 13:00, 13:30, 14:00, or 14:30. AL had the slowest and least variable average speed at 0.61 ± 0.13 m/s, which may have been related to her wall-side swimming or her size. Out of all the sharks, AL and TR (both female) resided in the aquarium the longest, were the largest, and presumed the oldest, which the slower average speed potentially reflects. However, the relationships of size and age with swim speed are not entirely clear. A study of growth trajectories by Meekan et al. (2020) implementing a von Bertalanffy growth model showed that male whale sharks reach a total length asymptote faster than females, implicating a potential sexual dimorphism of growth trajectory. These observations introduce the possibility that AL and TR were continuing to grow, and were further matured than YU and TA in general, who arrived together at a later time period. Their ages were undetermined, though the Georgia Aquarium was confident neither had reached sexual maturity based on their overall sizes and the shape of their claspers (Matsumoto et al., 2019).
In contrast to AL, YU had the fastest and most variable average speed of 0.82 ± 0.24 m/s. The males in the present study were faster overall, which has not been demonstrated in the wild. Two separate studies recorded average swim speeds of 14 km/day (equivalent to 0.16 m/s) in one male juvenile off the coast of Vietnam (Wang et al., 2012) and 15.5 ± 13.0 km/day (equivalent to 0.18 m/s) in 17 juveniles of mixed sexes in the Philippines (Araujo et al., 2018). This slower speed was not observed in the resident sharks in this study, despite their similar size. We caution that speeds over large units of time and distance (e.g. km/day) may involve fundamentally different behavioral strategies from those observed here, though we offer them as a reference to naturalistic settings.
In addition, YU was the only shark to show a near exclusive preference for a clockwise swimming direction, which, similar to AL, resisted attempts by Animal Husbandry staff to modify it for more than a few minutes. Behavioral inflexibilities in individuals may hint at a possible genetic or developmental component, as other fish have shown “handedness” or chirality with genetic heritability (Hori, 1993). We also cannot exclude the possibility that these behaviors are classic examples of stereotypy, a type of repetitive, abnormal behavior with no obvious function (Mason, 1991). Elasmobranchs in aquaria have been recorded to exhibit stereotypies (Scott et al., 1998; Näslund and Johnsson, 2016) as well as in the wild (Miller et al., 2011). While operational definitions of stereotyped behavior may vary, any repetitive behavior that takes up even a small portion of the animal’s time is alarming and thought to be indicative of stress (Broom, 1983). Further observations would be required for a more thorough review on whale shark welfare in an aquarium environment, as there are no other studies for comparison.
4.3 Olfactory stimuli may act as anticipatory cues to feed
Whale sharks are thought to contain only low to moderate visual acuity, however, their olfactory capsules are quite large, indicating heightened chemoreception (Martin, 2007). Prior literature has shown that pelagic, filter-feeding sharks such as the basking shark, use olfactory cues like Dimethyl Sulfide (DMS), a compound produced by a metabolite of phytoplankton and other marine algae (Dacey and Wakeham, 1986), to locate food at sea (Sims and Quayle, 1998). The Georgia Aquarium examined foraging and ingestive behavior of whale sharks in 2015 using homogenized krill and aqueous solutions of DMS and found that the sharks responded to both stimuli, but a stronger response was recorded for homogenized krill plumes (Dove, 2015). Krill, being the main ingredient of the whale sharks’ diet, is also used for other fish that cohabit the Ocean Voyager as well as the manta rays (fed at 10:00 and 14:30). Hence, the simultaneous delivery of a krill diet to manta rays and the distribution of approximately 100kg of feed to other fish through a PVC pipe at the aquarium’s shallow end, both scheduled 30 minutes before the whale sharks’ feeding period, presumably induced an anticipatory olfactory cue. All four whale sharks increased their speed as a response to this cue, possibly serving as a conditioned response indicative of Pavlovian (or classical) conditioning.
Classical conditioning in sharks was first observed in the lemon shark (N. brevirostris), pairing a light flash with an electric shock to produce a nictitating membrane response (Gruber and Schneiderman, 1975). Other shark species include the smooth dogfish (Mustelus canis) and the small-spotted cat shark (Scyliorhinus canicula) (Malyukova et al., 1983), the blacktip reef shark (Carcharhinus melanopterus) and the grey reef shark (Carcharhinus amblyrhynchos) (Tester and Kato, 1966), the bull shark (Carcharhinus leucas) (Kritzler and Wood, 1961), the nurse shark (G. cirratum) and the lemon shark (N. brevirostris) (Hamasaki and Bridges, 1965), and the horn shark (Heterodontus francisci) (Kelly and Nelson, 1975). Previous shark studies that examined associative learning involved either visual or auditory stimuli, however practically no literature has expanded into chemoreception (Guttridge et al., 2009). In addition, learning behavior in whale sharks has not been experimentally recorded, but is a highly probable behavior, considering the aforementioned examples are all from the Chondrichthyes class and the nurse shark (G. cirratum) is a close relative of the whale shark (Dove and Pierce, 2021). Furthermore, associative learning behavior from whale sharks has been reported by multiple animal husbandry staff members at the Georgia Aquarium (Dove, 2015).
Nevertheless, this scenario merits careful consideration, as it may involve more nuanced instinctual or natural behaviors than a classical conditioning scheme alone can account for. For example, the dispersal of krill through a PVC pipe distributes plumes throughout the water, which may lead whale sharks to respond directly to fluctuating spatial concentration gradients or temporal variations of odor reaching their nares (Gardiner et al., 2012). This phenomenon prompts directional movement toward the stimulus, which could result in an overall boost in speed for searching behavior and not arousal. Expanding on this idea, the aforementioned study at the Georgia Aquarium by Dove (2015) presented swim speed data that whale sharks were not consistent in response to the krill plumes (two whale sharks sped up and one slowed down). Therefore, there is some variability in how the sharks respond, but this may be due to the nature of responding to a concentrated stationary plume. In addition, they only observed speeds in a very small area around the plume, as compared to the larger distances measured in this current study, creating more difficult comparison. This interpretation suggests that while the reaction to the smell of krill might be rooted in a natural, unconditioned response, the specific anticipation of feeding based on the timing and context afforded by controlled aquarium conditions indicates an element of learned behavior. The distinction here lies in the temporal and situational specifics of the response, which may not be present in the wild and are instead a product of the unique routines established in captivity.
Lastly, it is alternatively possible that the increase in swim speed could be due to an adapted circadian rhythm in anticipation of the regularly-timed feed, like food anticipatory activity (López-Olmeda, 2017). There were not enough samples from days when the sharks were not fed at the normal time, either due to a canceled feed or a shifted feed due to Daylight Savings Time, to make any conclusions on that possibility. This would be interesting to investigate in future studies. Whatever the cue, the increased speed ahead of the feed was reliable and trended the same direction in all sharks. Anecdotally, the pre-feed speed increase was most noticeable in YU for observers, perhaps because of the already faster average speed of YU, as the speed increase was not substantially greater than the other sharks.
4.4 Differences in depth occupation may reflect spatial partitioning
How co-habitating animals distribute themselves in space may offer testament to an underlying social hierarchy. Partitioning, more specifically “resource partitioning”, is a term that first arose in the 1960s (Toft, 1985) used to describe how species differ in their use of resources, ostensibly to minimize competitive interaction, and which further defines a limit on the number of species that can stably coexist (Schoener, 1974). Spatial partitioning is a form that can arise from territoriality, as well as from competitive interactions within and among species (Papastamatiou et al., 2018). In general, different forms of partitioning, ranging from spatiotemporal to niche, ultimately help shape intra- and inter-special distributions within and across habitats. Several studies have identified environmental factors that may influence niche and space use partitioning, such as tidal phase (Lea et al., 2020) or seasonal fluctuations in salinity (Dwyer et al., 2020). However, aquarium studies provide an interesting example wherein these phenomena can be examined when such environmental conditions are held constant.
While YU did spend most of his time at the surface, it is notable that he also spent the most time of any shark at the “very deep” depth (6.2% of the time), whereas AL only spent 1.1% of her time there. These differences were further exacerbated depending on the time of day, wherein AL showed an even greater preference for the surface (83.6%) at night, and YU spent more time Very Deep (27%). The range of depth when compared to naturalistic settings is still relatively shallow, as “very deep” here represents the bottom 50% of a 6–9 meter depth habitat (compartment dependent). However, with depth being relative, the sharks seemed to spend more time in separate depths individually and even seemed to prefer certain locations in the tank as well, as previously mentioned. For example, AL spent the most time at the surface and was rarely seen at other depths, exhibiting the lowest depth occupation diversity of the four (as quantified by Shannon entropy).
One explanation for this behavior could be due to an established social hierarchy, where AL, being one of the oldest residents, has established a territory at the surface. It is known that other species of elasmobranchs, such as the white shark, establish temporary social ranks to feed (Compagno, 2002). Therefore, with food at the surface, AL may have priority in this location. Another reason could be since AL is female, she is attempting to avoid the other male sharks in the habitat. This avoidance behavior due to sex differences was also speculated in a study done with the lemon shark (N. brevirostris) (Guttridge et al., 2010). In hypothesizing about the existence of social hierarchy, it is useful to view lead-follow interactions in conjunction with depth preferences. Here, the shark with the greatest depth variability (YU) also had the lowest interaction participation and lowest LFI score. While depth occupation preferences were not analyzed as a function of time, it could be the case that traversing deeper compartments served to maximize separation from other sharks. Thus, aggregating simple metrics like depth and close proximity social interaction may provide richer insights about social structure and partitioning than in isolation, with potential utility for wild studies.
Lastly, interspecies interactions may have contributed to the spatial partitioning seen in the OV, more specifically with the manta rays (Mobula birostris). Different subspecies of M. birostris were periodically introduced between the years of 2007 and 2009 (Coco and Schreiber, 2017). Due to the considerable sizes of M. birostris, it is possible their introduction influenced R. typus social behavior. However, depth occupation data prior to the year 2008 were unavailable, and anecdotally, the M. birostris were the ones often displaced by any direct interaction of R. typus.
4.5 Conclusion
Since multi-year aquarium behavior for R. typus is not frequently recorded, future research is warranted to bring the literature up-to-date. With R. typus recently being listed as endangered status on the IUCN list, understanding their biology and behavior is paramount to ensure the well-being of these animals in the wild and in aquaria settings, as it facilitates public appreciation for the species and better understanding of maintenance requirements for such large and complex organisms. Our findings offer inroads for deeper investigations into the underlying social dynamics these animals participate in and abide by. We also put forth here future lines of inquiry that could more conclusively disambiguate the role of intrinsic biorhythms versus externally driven patterns. Notably, disrupting regimented feed after long-term conditioning, as well as diligent observation in artificial settings conforming to human constructions of time (e.g. “Daylight Savings”) unknown to the animal. This work additionally provides relevant considerations for animal husbandry, not only for assessing enclosure optimality, but also for understanding the impact of frequent diver presence on R. typus behavior. Frequent diver entry does seem to impact whale shark behavior, as there were statistically significant increases in shark speed when divers were absent. While counter intuitive, one explanation could be that divers do not appear as a predatory threat to whale sharks due to their relatively small size and/or slow speeds, only swimming slower to avoid collision. A study using spiny dogfish sharks (Squalus acanthias) observed predator-prey interactions in a controlled environment with the shark as the prey and found that these factors as well as approach orientation seemed to elicit avoidance behavior (Seamone et al., 2014). Of note, the decrease in swim speed was quite minor, from 0.63 m/s to 0.61 m/s, suggesting that any observed effects might not be practically significant, despite statistical significance. Thus, no effect on swim speed to frequent diver visits would indicate that the whale sharks have become habituated to the presence of divers. Learned habituation has been recorded in a large variety of sharks as far back as Myrberg et al. (1969) and then in Nelson and Johnson (1972). In addition, diver habituation in open waters has also been recorded by the reef whitetip shark (Triaenodon obesus) after several months of frequent diver exposure in Rangiroa, French Polynesia (Nelson, 1977). While the cause for a decrease in swim speed with divers is purely speculative, this finding in conjunction with the other analyses should be taken into consideration to mitigate stress and enhance quality of life in artificial habitat settings. Thorough analysis of these domains can lead to more appropriate conservation practices of the species and help preserve ecosystem homeostasis in both natural and artificial settings.
Statements
Data availability statement
The datasets presented in this study can be found in online repositories. The names of the repository/repositories and accession number(s) can be found below: https://github.com/cgallimore25/GA-aquarium-whale-sharks.
Ethics statement
The animal study was approved by Georgia State University and Georgia Aquarium Research and Animal Care Committee protocol. The study was conducted in accordance with the local legislation and institutional requirements.
Author contributions
CG: Writing – review & editing, Writing – original draft, Visualization, Validation, Formal analysis. CW: Writing – review & editing, Writing – original draft. RN: Writing – review & editing, Formal analysis, Data curation. MF: Writing – review & editing, Investigation, Conceptualization. LP: Writing – review & editing, Investigation, Data curation. CS: Writing – review & editing, Conceptualization. CC: Writing – review & editing, Conceptualization. MG: Writing – review & editing, Resources, Funding acquisition, Conceptualization. BC: Writing – review & editing, Conceptualization. AD: Writing – review & editing, Supervision, Resources, Funding acquisition, Formal analysis, Data curation, Conceptualization. MB: Writing – review & editing, Writing – original draft, Supervision, Resources, Investigation, Funding acquisition, Data curation, Conceptualization.
Funding
The author(s) declare financial support was received for the research, authorship, and/or publication of this article. This research was partially funded by the Georgia Aquarium, Georgia State University Technology Fee, and NRSA (F32MH079529; MB)
Acknowledgments
We would like to thank Pat Schlegel, Scarlett Salem, Alyssa Martini, Edward Perrow, Joy Llewallyn, Sid Roemer, Jennifer Alexander, Brandi Scott, Hillary Essig, Hollie Peters, Nirva Modi, Louise Bauck, Cherie Everhart, Katherine Valentin, Tara Esbeck, Susan Harrod, Kaitlyn Suckow, Debbie Price, Hannah Towner, Nancy Hickey, Nadine Louw, Belinda Smith, Jennifer Benecke, Samantha Puyenbroek, Julianna Strack, Chizom Ezeoke, William Hinton, Hyun Cho, Martha Ebra, Dhara Joshi, Faith Perry, Lisa Matragrano, Jacqueline Annis, Linda Lynch, De’janna Pressley, Grechen Aylor, Skylar McHenry, Phuc Vy, Robert Schwartz, Richard Orton, Allison Conboy, Rachel Mirpour, Shelley Taylor, Nicole Odom, Abbigail Rigdon, James Strahan, Jeff Tilt, Christina Michaels, Laura Butkovich, Ron Mussig, Lakeisha Stephens, Zachary Anderson, Victoria Smith, Elizabeth Martin, Ed Mercer, Nicole Davis, Kat Houston, Joshua Johnson, Karla Cocom Parra, David Sinkiewicz, Larry Gohl, Kimone Duncan, Micah Coleman, Rebecca Newton, Stephen Thompson, Kristine Gelhardt, Nancy Bryant, Susan “Marcie” Draper, James Drobny, Barbara Reardon, Lisa Folk, Terry Schaben, Rebecca Reese, David Jacobson, Mary Buchanan, Heidi Groom, Amber Keller, Haemin Lee, Tom Albers, James Bean, Brittany Todd, JBC, Mary Parmer, Debbie Gowder, Wade Klein, and all our observers over the years, including those whose work was not in this particular paper, for the tremendous amount of time and effort they put into collecting this longitudinal data.
Conflict of interest
The authors declare that the research was conducted in the absence of any commercial or financial relationships that could be construed as a potential conflict of interest.
Publisher’s note
All claims expressed in this article are solely those of the authors and do not necessarily represent those of their affiliated organizations, or those of the publisher, the editors and the reviewers. Any product that may be evaluated in this article, or claim that may be made by its manufacturer, is not guaranteed or endorsed by the publisher.
Supplementary material
The Supplementary Material for this article can be found online at: https://www.frontiersin.org/articles/10.3389/fmars.2024.1418002/full#supplementary-material
References
1
Alam M. T. Petit R. A. Read T. D. Dove A. D. M. (2014). The complete mitochondrial genome sequence of the world’s largest fish, the whale shark (Rhincodon typus), and its comparison with those of related shark species. Gene539, 44–49. doi: 10.1016/j.gene.2014.01.064
2
Andrzejaczek S. Lucas T. C. D. Goodman M. C. Hussey N. E. Armstrong A. J. Carlisle A. et al . (2022). Diving into the vertical dimension of elasmobranch movement ecology. Sci. Adv.8, 1–19. doi: 10.1126/sciadv.abo1754
3
Araujo G. Labaja J. Snow S. Huveneers C. Ponzo A. (2020). Changes in diving behaviour and habitat use of provisioned whale sharks: Implications for management. Sci. Rep.10, 16951. doi: 10.1038/s41598–020-73416–2
4
Araujo G. Rohner C. A. Labaja J. Conales S. J. Snow S. J. Murray R. et al . (2018). Satellite tracking of juvenile whale sharks in the Sulu and Bohol Seas, Philippines. PeerJ6, e5231. doi: 10.7717/peerj.5231
5
Broom D. M. (1983). “Stereotypies as animal welfare indicators,” in Indicators relevant to farm animal welfare, vol. 23. (Springer, Dordrecht), 81–87.
6
Brunnschweiler J. M. Baensch H. Pierce S. J. Sims D. W. (2009). Deep-diving behaviour of a whale shark Rhincodon typus during long-distance movement in the western Indian Ocean. J. Fish Biol.74, 706–714. doi: 10.1111/j.1095-8649.2008.02155.x
7
Coco C. Schreiber C. (2017). “Notes on the husbandry of manta rays,” in The elasmobranch husbandry manual II: recent advances in the care of sharks, rays and their relatives (Columbus, OH: Ohio Biological Survey), 59–65.
8
Compagno L. J. V. (2002). Sharks of the world: an annotated and illustrated catalogue of shark species known to date Vol. 2 (Rome: Food and Agriculture Organization of the United Nations).
9
Dacey J. W. H. Wakeham S. G. (1986). Oceanic dimethylsulfide: production during zooplankton grazing on phytoplankton. Science233, 1314–1316. doi: 10.1126/science.233.4770.1314
10
de la Parra Venegas R. Hueter R. González Cano J. Tyminski J. Gregorio Remolina J. Maslanka M. et al . (2011). An unprecedented aggregation of whale sharks, rhincodon typus, in Mexican coastal waters of the Caribbean sea. PloS One6, e18994. doi: 10.1371/journal.pone.0018994
11
Dove A. D. M. (2015). Foraging and ingestive behaviors of whale sharks, rhincodon typus, in response to chemical stimulus cues. Biol. Bull.228, 65–74. doi: 10.1086/BBLv228n1p65
12
Dove A. D. M. Coco C. Binder T. Schreiber C. Davis R. Carlson B. et al . (2011). “Acquisition, husbandry, and veterinary care of whale sharks (Rhincodon typus smith 1828) in an aquarium setting,” in Third bilateral conference between the United States and Russia (Khaled bin Sultan Living Oceans Foundation, Shepherdstown, WV), 12–20.
13
Dove A. D. M. Pierce S. J. (2021). Whale sharks: biology, ecology, and conservation. 1 edn (Boca Raton, FL: CRC Press). doi: 10.1201/b22502
14
Dwyer R. G. Campbell H. A. Cramp R. L. Burke C. L. Micheli-Campbell M. A. Pillans R. D. et al . (2020). Niche partitioning between river shark species is driven by seasonal fluctuations in environmental salinity. Funct. Ecol.34, 2170–2185. doi: 10.1111/1365-2435.13626
15
Eckert S. A. Stewart B. S. (2001). Telemetry and satellite tracking of whale sharks, rhincodon typus, in the Sea of Cortez, Mexico, and the North Pacific Ocean. Environ. Biol. Fishes60, 299–308. doi: 10.1023/A:1007674716437
16
Fasick J. I. Algrain H. Serba K. M. Robinson P. R. (2019). The retinal pigments of the whale shark (Rhincodon typus) and their role in visual foraging ecology. Visual Neurosci.36, E011. doi: 10.1017/S0952523819000105
17
Gardiner J. M. Hueter R. E. Maruska K. P. Sisneros J. A. Casper B. M. Mann D. A. et al . (2012). "Sensory physiology and behavior of elasmobranchs", Biology of Sharks and Their Relatives (Boca Raton, FL: CRC Press), 1, 349–401.
18
Gayford J. H. Pearse W. D. de la Parra Venegas R. Whitehead D. A. (2023). Quantifying the behavioural consequences of shark ecotourism. Sci. Rep.13, 12938. doi: 10.1038/s41598–023-39560–1
19
Gruber S. H. Schneiderman N. (1975). Classical conditioning of the nictitating membrane response of the lemon shark (Negaprion brevirostris). Behav. Res. Methods Instrumentation7, 430–434. doi: 10.3758/BF03201554
20
Gudger E. W. (1941). The food and feeding habits of the whale shark, rhineodon typus. J. Elisha Mitchell Sci. Soc.57, 57–72.
21
Gunn J. S. Stevens J. D. Davis T. L. O. Norman B. M. (1999). Observations on the short-term movements and behaviour of whale sharks (Rhincodon typus) at Ningaloo Reef, Western Australia. Mar. Biol.135, 553–559. doi: 10.1007/s002270050656
22
Guttridge T. L. Gruber S. H. Krause J. Sims D. W. (2010). Novel acoustic technology for studying free-ranging shark social behaviour by recording individuals’ Interactions. PloS One5, e9324. doi: 10.1371/journal.pone.0009324
23
Guttridge T. L. Myrberg A. A. Porcher I. F. Sims D. W. Krause J. (2009). The role of learning in shark behaviour. Fish Fisheries10, 450–469. doi: 10.1111/j.1467-2979.2009.00339.x
24
Hamasaki D. I. Bridges C. (1965). Properties of the electroretinogram in three elasmobranch species. Res. Vision5, 438–496. doi: 10.1016/0042-6989(65)90083-0
25
Haskell P. J. McGowan A. Westling A. Méndez-Jiménez A. Rohner C. A. Collins K. et al . (2015). Monitoring the effects of tourism on whale shark Rhincodon typus behaviour in Mozambique. Oryx49, 492–499. doi: 10.1017/S0030605313001257
26
Hoffmayer E. R. Franks J. S. Driggers W. B. Oswald K. J. Quattro J. M. (2007). Observations of a feeding aggregation of whale sharks, rhincodon typus, in the north central gulf of Mexico. Gulf Caribbean Res.19, 69–73. doi: 10.18785/gcr.1902.08
27
Holland K. N. Wetherbee B. M. Peterson J. D. Lowe C. G. (1993). Movements and distribution of hammerhead shark pups on their natal grounds. Copeia1993, 495–502. doi: 10.2307/1447150
28
Hori M. (1993). Frequency-dependent natural selection in the handedness of scale-eating cichlid fish. Science260, 216–219. doi: 10.1126/science.260.5105.216
29
Jacoby D. M. P. Siriwat P. Freeman R. Carbone C. (2015). Is the scaling of swim speed in sharks driven by metabolism? Biol. Lett.11, 20150781. doi: 10.1098/rsbl.2015.0781
30
Kelly J. C. Nelson D. R. (1975). Hearing thresholds of the horn shark, Heterodontus francisci. J. Acoust. Soc Am.58, 905–909. doi: 10.1121/1.380742
31
Killick R. Fearnhead P. Eckley I. A. (2012). Optimal detection of changepoints with a linear computational cost. J. Am. Stat. Assoc.107, 1590–1598. doi: 10.1080/01621459.2012.737745
32
Kritzler H. Wood L. (1961). Provisional audiogram for the shark, carcharhinus leucas. Science133, 1480–1482. doi: 10.1126/science.133.3463.1480
33
Latta S. C. Howell C. A. Dettling M. D. Cormier R. L. (2012). Use of data on avian demographics and site persistence during overwintering to assess quality of restored riparian habitat: assessing riparian restoration success. Conserv. Biol.26, 482–492. doi: 10.1111/j.1523-1739.2012.01828.x
34
Lea J. S. E. Humphries N. E. Bortoluzzi J. Daly R. Von Brandis R. G. Patel E. et al . (2020). At the turn of the tide: space use and habitat partitioning in two sympatric shark species is driven by tidal phase. Front. Mar. Sci.7. doi: 10.3389/fmars.2020.00624
35
Leu M.-Y. Li J.-J. Ju Y.-M. Hsiao C.-M. Chang C.-W. Meng P.-J. et al . (2015). Transportation, husbandary, and release of a whale shark (Rhincodon typus). J. Mar. Sci. Technol.23, 814–818. doi: 10.6119/JMST-015–0511-3
36
López-Olmeda J. F. (2017). Nonphotic entrainment in fish. Comp. Biochem. Physiol. Part A: Mol. Integr. Physiol.203, 133–143. doi: 10.1016/j.cbpa.2016.09.006
37
MacDonald P. L. Gardner R. C. (2000). Type I error rate comparisons of post hoc procedures for I j chi-square tables. Educ. psychol. Measurement60, 735–754. doi: 10.1177/00131640021970871
38
Malyukova I. Rakich L. Kovachevich N. (1983). Conditioned motor reactions in free-moving elasmobranchs and bony fishes. Neurosci. Behav. Physiol.13, 482–485. doi: 10.1007/BF01182694
39
Martin R. A. (2007). A review of behavioural ecology of whale sharks (Rhincodon typus). Fisheries Res.84, 10–16. doi: 10.1016/j.fishres.2006.11.010
40
Mason G. J. (1991). Stereotypies: A critical review. Anim. Behav.41, 1015–1037. doi: 10.1016/S0003-3472(05)80640-2
41
Matsumoto R. Matsumoto Y. Ueda K. Suzuki M. Asahina K. Sato K. (2019). Sexual maturation in a male whale shark (Rhincodon typus) based on observations made over 20 years of captivity. Fishery Bull.117, 78–86. doi: 10.7755/FB.117.1–2.9
42
Matsumoto R. Toda M. Matsumoto Y. Ueda K. Nakazato M. Sato K. et al . (2017). “Notes on husbandry of whale sharks, rhincodon typus, in aquaria,” in The elasmobranch husbandry manual II: recent advances in the care of sharks, rays and their relatives (Columbus, OH: Ohio Biological Survey), 15–22.
43
Mavrodiev P. Fleischmann D. Kerth G. Schweitzer F. (2021). Quantifying individual influence in leading-following behavior of Bechstein’s bats. Sci. Rep.11, 2691. doi: 10.1038/s41598–020-80946–2
44
McClain C. R. Balk M. A. Benfield M. C. Branch T. A. Chen C. Cosgrove J. et al . (2015). Sizing ocean giants: Patterns of intraspecific size variation in marine megafauna. PeerJ3, e715. doi: 10.7717/peerj.715
45
Meekan M. G. Fuiman L. A. Davis R. Berger Y. Thums M. (2015). Swimming strategy and body plan of the world’s largest fish: Implications for foraging efficiency and thermoregulation. Front. Mar. Sci.2. doi: 10.3389/fmars.2015.00064
46
Meekan M. G. Taylor B. M. Lester E. Ferreira L. C. Sequeira A. M. M. Dove A. D. M. et al . (2020). Asymptotic growth of whale sharks suggests sex-specific life-history strategies. Front. Mar. Sci.7. doi: 10.3389/fmars.2020.575683
47
Miller L. Kuczaj S. Herzing D. (2011). Stereotypic behavior in wild marine carnivores? Zoo Biol.30, 365–370. doi: 10.1002/zoo.20347
48
Miller L. Vicino G. Sheftel J. Lauderdale L. (2020). Behavioral diversity as a potential indicator of positive animal welfare. Animals10, 1211. doi: 10.3390/ani10071211
49
Montero-Quintana A. N. Ocampo-Valdez C. F. Vázquez-Haikin J. A. Sosa-Nishizaki O. Osorio-Beristain M. (2021). Whale shark (Rhincodon typus) predatory flexible feeding behaviors on schooling fish. J. Ethology39, 399–410. doi: 10.1007/s10164-021-00717-y
50
Montero-Quintana A. N. Vázquez-Haikin J. A. Merkling T. Blanchard P. Osorio-Beristain M. (2020). Ecotourism impacts on the behaviour of whale sharks: An experimental approach. Oryx54, 270–275. doi: 10.1017/S0030605318000017
51
Motta P. J. Maslanka M. Hueter R. E. Davis R. L. De La Parra R. Mulvany S. L. et al . (2010). Feeding anatomy, filter-feeding rate, and diet of whale sharks Rhincodon typus during surface ram filter feeding off the Yucatan Peninsula, Mexico. Zoology113, 199–212. doi: 10.1016/j.zool.2009.12.001
52
Myrberg A. Banner A. Richard J. (1969). Shark attraction using a video-acoustic system. Mar. Biol.2, 264–276. doi: 10.1007/BF00351149
53
Näslund J. Johnsson J. I. (2016). Environmental enrichment for fish in captive environments: Effects of physical structures and substrates. Fish Fisheries17, 1–30. doi: 10.1111/faf.12088
54
Nelson D. R. (1977). On the field study of shark behavior. Am. Zoologist17, 501–507. doi: 10.1093/icb/17.2.501
55
Nelson J. D. Eckert S. A. (2007). Foraging ecology of whale sharks (Rhincodon typus) within Bahía de Los Angeles, Baja California Norte, México. Fisheries Res. 84, 47–64 doi: 10.1016/j.fishres.2006.11.013
56
Nelson D. R. Johnson R. H. (1972). Acoustic attraction of pacific reef sharks: Effect of pulse intermittency and variability. Comp. Biochem. Physiol. Part A: Physiol.42, 85–95. doi: 10.1016/0300-9629(72)90370-2
57
Nixon A. J. Gruber S. H. (1988). Diel metabolic and activity patterns of the lemon shark (Negaprion brevirostris). J. Exp. Zoology248, 1–6. doi: 10.1002/jez.1402480102
58
Papastamatiou Y. P. Bodey T. W. Friedlander A. M. Lowe C. G. Bradley D. Weng K. et al . (2018). Spatial separation without territoriality in shark communities. Oikos127, 767–779. doi: 10.1111/oik.04289
59
Pierce S. J. Norman B. M. (2016). Rhincodon typus. The IUCN Red List of Threatened Species. 2016, 1-26. doi: 10.2305/IUCN.UK.2016–1.RLTS.T19488A2365291.en
60
Porter M. E. Ruddy B. T. Kajiura S. M. (2020). Volitional swimming kinematics of blacktip sharks, carcharhinus limbatus, in the wild. Drones4, 78. doi: 10.3390/drones4040078
61
Riley M. Hale M. Harman A. Rees R. (2010). Analysis of whale shark Rhincodon typus aggregations near South Ari Atoll, Maldives Archipelago. Aquat. Biol.8, 145–150. doi: 10.3354/ab00215
62
Robinson D. P. Jaidah M. Y. Bach S. Lee K. Jabado R. W. Rohner C. A. et al . (2016). Population structure, abundance and movement of whale sharks in the arabian gulf and the gulf of Oman. PloS One11, e0158593. doi: 10.1371/journal.pone.0158593
63
Rogers T. D. Cambiè G. Kaiser M. J. (2017). Determination of size, sex and maturity stage of free swimming catsharks using laser photogrammetry. Mar. Biol.164, 213. doi: 10.1007/s00227-017-3241-7
64
Rowat D. Brooks K. S. (2012). A review of the biology, fisheries and conservation of the whale shark Rhincodon typus. J. Fish Biol.80, 1019–1056. doi: 10.1111/j.1095-8649.2012.03252.x
65
Rowat D. Gore M. (2007). Regional scale horizontal and local scale vertical movements of whale sharks in the Indian Ocean off Seychelles. Fisheries Res.84, 32–40. doi: 10.1016/j.fishres.2006.11.009
66
Rowat D. Meekan M. G. Engelhardt U. Pardigon B. Vely M. (2007). Aggregations of juvenile whale sharks (Rhincodon typus) in the Gulf of Tadjoura, Djibouti. Environ. Biol. Fishes80, 465–472. doi: 10.1007/s10641-006-9148-7
67
Sampaio C. L. S. Leite L. Reis-Filho J. A. Loiola M. Miranda R. J. De Anchieta C. C. et al . (2018). New insights into whale shark Rhincodon typus diet in Brazil: An observation of ram filter-feeding on crab larvae and analysis of stomach contents from the first stranding in Bahia state. Environ. Biol. Fishes101, 1285–1293. doi: 10.1007/s10641-018-0775-6
68
Saravanan V. Berman G. J. Sober S. J. (2020). Application of the hierarchical bootstrap to multi-level data in neuroscience. Neurons Behavior Data analysis Theory3, 1–25. doi: 10.1101/819334
69
Schoener T. W. (1974). Resource Partitioning in Ecological Communities: Research on how similar species divide resources helps reveal the natural regulation of species diversity. Science185, 27–39. doi: 10.1126/science.185.4145.27
70
Schreiber C. Coco C. (2017). “Husbandry of whale sharks,” in The elasmobranch husbandry manual II: recent advances in the care of sharks, rays and their relatives (Columbus, OH: Ohio Biological Survey), 87–98.
71
Scott G. Hull S. Rollinson D. (1998). Surface breaking behaviour in a population of captive rays Raja: The expression of a need to forage? Aquarium Sci. Conserv.2, 161–169. doi: 10.1023/A:1009640022791
72
Seamone S. Blaine T. Higham T. E. (2014). Sharks modulate their escape behavior in response to predator size, speed and approach orientation. Zoology117, 377–382. doi: 10.1016/j.zool.2014.06.002
73
Shan G. Gerstenberger S. (2017). Fisher’s exact approach for post hoc analysis of a chi-squared test. PloS One12, e0188709. doi: 10.1371/journal.pone.0188709
74
Shannon C. E. (1948). A mathematical theory of communication. Bell System Tech. J.27, 379–423. doi: 10.1002/bltj.1948.27.issue-3
75
Silas E. G. Rajagopalan M. S. (1963). On a recent capture of a whale shark (Rhincodon typus Smith) at Tuticorin, with a note on information to be obtained on whale sharks from Indian waters. J. Mar. Biol. Assoc. India5, 153–157.
76
Simpson E. H. (1949). Measurement of diversity. Nature163, 688. doi: 10.1038/163688a0
77
Sims D. W. Quayle V. A. (1998). Selective foraging behaviour of basking sharks on zooplankton in a small-scale front. Nature393, 460–464. doi: 10.1038/30959
78
Smith A. (1828). Descriptions of new or imperfectly known objects of the animal kingdom, found in the South of Africa. South Afr. Commercial Advertiser3, 2.
79
Taylor J. G. (1996). Seasonal occurrence, distribution and movements of the whale shark, Rhincodon typus, at Ningaloo Reef, Western Australia. Mar. Freshw. Res.47, 637–642. doi: 10.1071/MF9960637
80
Tester A. L. Kato S. (1966). Visual Target Discrimination in Blacktip Sharks (Carcharhinus melanopterus) and Grey Sharks (C. menisorrah). Pacific Sci.20, 461–471.
81
The MathWorks Inc . (2022). MATLAB version: 9.13.0 (R2022b) (Natick, Massachusetts, United States: Computer Software).
82
Thomson J. A. Araujo G. Labaja J. McCoy E. Murray R. Ponzo A. (2017). Feeding the world’s largest fish: Highly variable whale shark residency patterns at a provisioning site in the Philippines. R. Soc. Open Sci.4, 170394. doi: 10.1098/rsos.170394
83
Thyng K. M. Greene C. A. Hetland R. D. Zimmerle H. M. DiMarco S. F. (2016). True colors of oceanography. Oceanography29, 9–13. doi: 10.5670/oceanog
84
Toft C. A. (1985). Resource partitioning in amphibians and reptiles. Copeia1985, 1-21. doi: 10.2307/1444785
85
Tomita T. Toda M. Murakumo K. Miyamoto K. Matsumoto R. Ueda K. et al . (2021). Volume of the whale shark and their mechanism of vertical feeding. Zoology147, 125932. doi: 10.1016/j.zool.2021.125932
86
Tyminski J. P. De La Parra-Venegas R. González Cano J. Hueter R. E. (2015). Vertical movements and patterns in diving behavior of whale sharks as revealed by pop-up satellite tags in the eastern gulf of Mexico. PloS One10, e0142156. doi: 10.1371/journal.pone.0142156
87
Wang Y. Li W. Zeng X. Cui Y. (2012). A short note on the horizontal and vertical movements of a whale shark, Rhincodon typus, tracked by satellite telemetry in the South China Sea. Integr. Zoology7, 94–98. doi: 10.1111/j.1749-4877.2011.00278.x
88
Wey T. Blumstein D. T. Shen W. Jordán F. (2008). Social network analysis of animal behaviour: A promising tool for the study of sociality. Anim. Behav.75, 333–344. doi: 10.1016/j.anbehav.2007.06.020
89
White W. T. Last P. R. (2012). A review of the taxonomy of chondrichthyan fishes: A modern perspective. J. Fish Biol.80, 901–917. doi: 10.1111/j.1095-8649.2011.03192.x
90
Whitehead D. A. Gayford J. (2023). First record of bottom-feeding behaviour in the whale shark (Rhincodon typus). J. Fish Biol.103, 448–452. doi: 10.1111/jfb.15457
91
Wilson S. G. Martin R. A. (2003). Body markings of the whale shark: Vestigial or functional? Western Aust. Nat.24, 118–134.
92
Womersley F. Hancock J. Perry C. T. Rowat D. (2021). Wound-healing capabilities of whale sharks (Rhincodon typus) and implications for conservation management. Conserv. Physiol.9, coaa120. doi: 10.1093/conphys/coaa120
Summary
Keywords
Rhincodon typus , swim speed, whale shark, anticipatory behavior, lead-follow, individual variation, aquarium, social interaction
Citation
Gallimore CG, Walton C, Nugent R, Fradkin M, Poppell L, Schreiber C, Coco C, Grober M, Carlson B, Dove ADM and Black MP (2024) A longitudinal behavioral analysis of aquarium whale sharks (Rhincodon typus): insights into anticipatory cues, individual variation, and social interaction. Front. Mar. Sci. 11:1418002. doi: 10.3389/fmars.2024.1418002
Received
15 April 2024
Accepted
06 June 2024
Published
05 July 2024
Volume
11 - 2024
Edited by
Todd Atwood, U.S. Geological Survey, United States
Reviewed by
Natascha Wosnick, Federal University of Paraná, Brazil
Joel Gayford, James Cook University, Australia
Updates
Copyright
© 2024 Gallimore, Walton, Nugent, Fradkin, Poppell, Schreiber, Coco, Grober, Carlson, Dove and Black.
This is an open-access article distributed under the terms of the Creative Commons Attribution License (CC BY). The use, distribution or reproduction in other forums is permitted, provided the original author(s) and the copyright owner(s) are credited and that the original publication in this journal is cited, in accordance with accepted academic practice. No use, distribution or reproduction is permitted which does not comply with these terms.
*Correspondence: Connor G. Gallimore, cggallimore@gmail.com
‡These authors have contributed equally to this work and share first authorship
†Present addresses: Christian Schreiber, The Florida Aquarium, Tampa, FL, United States Alistair D. M. Dove, Museum of Science and History, Jacksonville, FL, United States
§These authors share senior authorship
Disclaimer
All claims expressed in this article are solely those of the authors and do not necessarily represent those of their affiliated organizations, or those of the publisher, the editors and the reviewers. Any product that may be evaluated in this article or claim that may be made by its manufacturer is not guaranteed or endorsed by the publisher.