Abstract
Introduction:
Since its introduction about a decade ago, target enrichment sequencing of ultraconserved elements (UCEs) has proven to be an invaluable tool for studies across evolutionary scales, and thus employed from population genetics, to historical biogeography as well as deep-time phylogenetics. Here, we present the first probe set targeting UCEs in crustaceans, specifically designed for decapods and tested beyond decapods in other malacostracan lineages.
Methods:
Probes were designed using published genomes of nine decapod and one peracarid species, as well as raw Nanopore long reads of one additional brachyuran species. The final probe set consists of about 20,000 probes, targeting 1,384 unique UCE loci. We compiled a dataset across Malacostraca,as well as datasets of a deep-sea squat lobster genus, and an intertidal mangrove crab species, to test the probe set at different phylogenetic levels (i.e., class, order, genus, within species).
Results:
Final mean UCE recovery from fresh samples across Malacostraca was 568 loci, with up to 847 and 658 loci recovered from decapod and non-decapod species, respectively. Final mean recovery from fresh samples in the genus- and within species-level datasets was 849 and 787 loci, respectively. Up to several hundreds of UCEs were recovered from historical museum specimens (10 to > 150 years old), that were included in all datasets. UCE-based phylogenies largely reflected the known relationships of the included taxa, and we were able to infer population differentiation based on >600 SNPs extracted from the species-level dataset.
Discussion:
Our results showcase the versatility of this UCE probe set, yielding informative data from phylogenetic as well as population-genetic datasets. They demonstrate once more that UCEs are a promising technique for leveraging museum specimens for genomic studies, and overall highlight the probe set's potential for crustacean evolutionary studies.
1 Introduction
Ultraconserved elements (UCEs) are highly conserved genome regions that are present across many taxa. They are known to have regulatory expression functions in vertebrates, while being of exonic origin in arthropods (Faircloth et al., 2012; McCormack et al., 2012; Hedin et al., 2019). Since their discovery as syntenically conserved regions in the human, mouse and rat genomes (Bejerano et al., 2004), the use of UCEs for phylogenomic studies has rapidly increased, becoming a popular technique in the past few years (see references below). The increasing popularity of the UCEs approach relies on 1) the amount of generated data, since it allows to target between hundreds to thousands of orthologous loci, improving phylogenetic resolution and largely outperforming traditional multilocus sequencing; 2) in contrast to other genomic techniques such as transcriptomics, UCE sequencing allows to obtain historical DNA from ethanol preserved or dried specimens in museum collections (McCormack et al., 2012; Blaimer et al., 2016; Derkarabetian et al., 2019; Raxworthy and Smith, 2021); and, 3) unlike anchored hybrid enrichment (AHE; Lemmon et al., 2012), the full UCE probe set design and hybridization pipeline was originally published open source (Faircloth, 2017), allowing everybody to design baits to target their organisms of study.
UCEs have been used to reconstruct phylogenies for many taxa across the entire Tree of Life, and at multiple phylogenetic scales, from backbone phylogenies (e.g., Faircloth et al., 2013; Streicher and Wiens, 2017) to species-level or even population-level studies (e.g., Smith et al., 2014; Derkarabetian et al., 2018, 2022). The versatility of UCEs at different evolutionary scales relies on the sequencing of UCEs flanking regions, with a higher proportion of variable sites when increasing the distance from the highly conserved core of the UCE (Faircloth et al., 2012). This allows generation of conserved datasets useful for phylogenomic reconstruction at higher taxonomic levels, as well as the possibility to extract single nucleotide polymorphisms (SNPs) from each single locus, showing an efficacy comparable to microsatellites and ddRAD, for population genomics (Vinciguerra et al., 2019; Glon et al., 2021).
UCE probe sets are currently available for several invertebrate taxa, and at different levels of divergence, from phylum to genus-level: e.g., anthozoans (Cnidaria) (Quattrini et al., 2018), hexacorals (Cnidaria, Anthozoa) (Cowman et al., 2020), heterobranchs (Mollusca, Gastropoda) (Moles and Giribet, 2021), velvet worms (Onychophora) (Sato et al., 2024a), bivalves (Mollusca, Bivalvia) (González-Delgado et al., 2024) and for multiple arthropod taxa, including many groups of insects and arachnids (Starrett et al., 2017; Zhang et al., 2019, and references therein). Within arthropods, the most comprehensive probe set was designed for Arachnida, a group spanning more than 500 million years of evolution (Starrett et al., 2017). However, despite this huge divergence, this probe set has proven to be very useful across all chelicerate groups and across a variety of phylogenetic levels (e.g., Hedin et al., 2020; Ballesteros et al., 2021; Boyer et al., 2022; de Miranda et al., 2024; Sato et al., 2024b).
A major component of Earth’s biodiversity is represented by the crustaceans of the class Malacostraca. This group has a long evolutionary history, and like arachnids, probably started to diversify at least 500 million years ago (Schram, 1982; Schwentner et al., 2017; Bernot et al., 2023). It is the largest class of non-hexapod crustaceans, with more than 30,000 described species classified into 17 orders. Malacostracans display great morphological disparity, including multiple body forms such as shrimp-like, crab-like, lobster-like, with a bivalved carapace, mantis-like, conglobated forms, etc. This group has received much attention due to its ancient origin, morphological disparity and ecological diversity. However, although clearly monophyletic, the scarcity of genomic studies has hampered the understanding of the phylogenetic placement of many malacostracan groups (e.g., Schwentner et al., 2018; Bernot et al., 2023; Höpel et al., 2022). Additionally, within Malacostraca, decapods and peracarids are considered hyperdiverse taxa with independent radiations to the land and fresh waters (e.g., Hou et al., 2014; Wolfe et al., 2019, 2023; Tsang et al., 2022). They have colonized extreme environments in both marine and terrestrial habitats, such as anchialine caves, hydrothermal vents or hadal trenches (e.g., Gonzalez et al., 2020; Patel et al., 2020; Swan et al., 2021), and therefore represent a model group for several disciplines in evolutionary biology.
Genomic resources to tackle malacostracan and decapod relationships first focused on phylotranscriptomics (Schwentner et al., 2017, 2018; Lozano-Fernandez et al., 2019), but transcriptomes are expensive to generate, require fresh tissues, and the analytical pipelines are complex due to the need of an orthology-assignment step. Wolfe et al. (2019) thus turned to sequence capture techniques and generated a large dataset for decapods by developing a new anchored hybrid enrichment (AHE) kit for decapod phylogenetics designed from existing genomic and transcriptomic sequences. However, UCEs appear to have become the most popular tool for invertebrate phylogenomics now, with regular publications of new invertebrate UCE probe sets following Faircloth’s (2017) open source pipeline (see e.g. van der Sprong et al., 2024). We thus turned to UCEs for their versatility and open access, as, despite the rapid growth of UCEs to study the evolution of arthropod lineages, no crustacean probe set is currently available.
The use of target capture sequencing of UCEs in crustacean research can offer multiple benefits at various levels. Firstly, it can aid in resolving phylogenetic uncertainties in Malacostraca, providing insights into the evolutionary relationships of this diverse group of crustaceans. Secondly, it can improve phylogenetic resolution for the study of explosive radiations and other evolutionary events at different scales, ranging from intraspecific to interspecific levels. Finally, this approach can be especially valuable in cases where access to living specimens is limited and expensive, such as with deep-sea samples. By utilizing historical collections, researchers can leverage this technique to solve taxonomic questions using molecular methods, thereby advancing our understanding of this fascinating group of organisms and adding value to the extensive museum collections of deep-sea fauna and regions of the world where collecting is no longer feasible.
Here we present a new probe set targeting UCEs for Decapoda and other lineages of Malacostraca, which is also the first UCE probe set for any crustacean lineage to date. We tested this probe set in-silico and in-vitro by hybridization to DNA samples obtained from all major decapod lineages as well as several non-decapod Malacostraca. Our tests demonstrate the efficacy of the probe set at different taxonomic scales, regularly recovering hundreds to more than 1,000 loci across Malacostraca, including dozens to hundreds of loci from historical samples (collection dates 1865 to 2012) in our test datasets. The new probe set should thus provide a valuable resource for population-level to phylogenomic studies across Malacostraca.
2 Materials and methods
2.1 Taxon sampling
The publicly available genomes cover the majority of infraorders within Decapoda. For the probe set design, we used seven genomes from across the Decapoda tree of life, with a focus on the most diverse group, the true crabs (Brachyura), our main focal taxon. The mitten crab Eriocheir sinensis (Brachyura, Grapsoidea) was chosen as the base genome for its high level of completeness; Birgus latro (Anomura), Chionoecetes opilio (Brachyura), Homarus americanus (Astacidea), Macrobrachium nipponense (Caridea), Panulirus ornatus (Achelata) and Penaeus japonicus (Dendrobranchiata) were used as exemplar taxa. The peracarid Hyalella azteca (Amphipoda) was used as the outgroup taxon. See Table 1 for genome quality scores and accession numbers of all genomes used for probe set design and in-silico testing. Additionally, we added novel Oxford Nanopore raw reads (unassembled) of a third crab species, Aratus pisonii (Brachyura, Grapsoidea), to the probe set design pipeline. For this, we extracted high-molecular weight DNA from leg muscle tissue of a specimen (voucher no. MCZ:IZ:162234; collected on April 2021 on N Hutchinson Island, FL, fixed in liquid Nitrogen and stored at -80°C), using a custom high-salt extraction protocol, followed by chloroform-isoamyl-alcohol purification. The DNA sample was sequenced on a PromethION platform and basecalled with Guppy 5.0.11, yielding 29.6 Gbases across 64.7 million reads with a read N50 of 827 bases (reads available at BioProject PRJNA988117, accession numbers SRX20952170 – SRX20952177).
Table 1
| Higher taxonomy | Species | GenBank accession No. | Contig N50 | BUSCO | UCEs raw | UCEs 50% | UCEs 70% |
|---|---|---|---|---|---|---|---|
| Brachyura: Portunidae | Callinectes sapidus | GCA 020233015.1 | 9.3 | 94.6 | 1026 | 784 | 100 |
| Brachyura: Portunidae | Portunus trituberculatus | GCA 017591435.1 | 4100.0 | 95.9 | 1112 | 850 | 108 |
| Brachyura: Oregoniidae | Chionoecetes opilio | GCA 016584305.1 | 149.6 | 95.3 | 1155 | 837 | 102 |
| Brachyura: Varunidae | Eriocheir sinensis | GCA 013436485.1 | 3200.0 | 96.6 | 1167 | 863 | 107 |
| Anomura: Coenobitidae | Birgus latro | GCA 018397915.1 | 5.3 | 59.6 | 1196 | 840 | 107 |
| Anomura: Lithodidae | Paralithodes camtschaticus | GCA 018397895.1 | 5.8 | 47.2 | 949 | 682 | 88 |
| Astacidea: Cambaridae | Procambarus clarkii | GCA 020424385.2 | 217.7 | 97.1 | 1156 | 828 | 105 |
| Astacidea: Nephropidae | Homarus americanus | GCA 018991925.1 | 133.3 | 96.4 | 1190 | 852 | 109 |
| Astacidea: Parastacidae | Cherax destructor | GCA 009830355.1 | 80.9 | 82.6 | 1023 | 744 | 104 |
| Achelata: Palinuridae | Panulirus ornatus | GCA 018397875.1 | 5.4 | 72.5 | 1175 | 836 | 106 |
| Caridea: Atyidae | Caridina multidentata | GCA 002091895.1 | 0.8 | 24.8 | 919 | 680 | 101 |
| Caridea: Palaemonidae | Macrobrachium nipponense | GCA 015104395.1 | 255.0 | 42.8 | 994 | 682 | 82 |
| Dendrobranchiata: Penaeidae | Penaeus japonicus | GCA 017312705.2 | 132.8 | 95.9 | 1098 | 845 | 107 |
| Isopoda: Armadillidiidae | Armadillidium vulgare | GCA 004104545.1 | 38.4 | 88.6 | 840 | 569 | 90 |
| Isopoda: Cirolanidae | Bathynomus jamesi | GCA 023014485.1 | 586.5 | 93.9 | 805 | 567 | 90 |
| Isopoda: Idoteidae | Idotea balthica | GCA 023373965.1 | 6.1 | 76.7 | 704 | 509 | 85 |
| Amphipoda: Hyalidae | Parhyale hawaiensis | GCA 001587735.2 | 10.4 | 94.4 | 851 | 556 | 95 |
| Amphipoda: Hyalellidae | Hyalella azteca | GCA 000764305.4 | 112.9 | 95.5 | 1015 | 665 | 107 |
| Amphipoda: Gammaridae | Gammarus roeseli | GCA 016164225.1 | 4.7 | 36.0 | 946 | 619 | 99 |
| Branchiopoda: Artemiidae | Artemia franciscana | GCA 019857095.1 | 61.1 | 52.3 | 381 | 143 | 29 |
| Copepoda: Temoridae | Eurytemora affinis | GCA 000591075.2 | 67.7 | 94.4 | 452 | 115 | 25 |
Genome quality (contig N50 and BUSCO score as % completeness) and UCE recovery from in-silico samples: raw locus recovery with 65/65 % coverage/identity percentage thresholds (UCEs raw), and number of loci retained in 50% and 70% occupancy matrices after trimming and filtering.
Species in bold were used for probe set design.
We downloaded 13 additional crustacean genomes from NCBI to test the probe set in-silico. These included seven decapod, four peracarid, and two non-malacostracan genomes (one branchiopod and one copepod), to also assess performance and efficacy of the probe set on other crustacean taxa beyond Malacostraca (Table 1).
For the in-vitro test of the probe set, we compiled 41 samples from the collections of the Museum of Comparative Zoology, Cambridge, MA (MCZ), the Smithsonian National Museum of Natural History, Washington DC (USNM), and the Muséum national d’Histoire naturelle, Paris (MNHN), focusing on Decapoda, but also including representatives of Peracarida (Amphipoda, Cumacea, Isopoda), Euphausiacea, Stomatopoda, Phyllocarida, and Branchiopoda (Table 2). Ten of these samples were obtained from “historical” museum specimens with degraded DNA, i.e., collected more than 10 years ago, and stored in 70% ethanol at room temperature. The historical samples covered a range of collection years between 1865 and 2012, and were included to assess UCE locus recovery and utility of the probe set for phylogenetic studies of crustacean specimens from museum collections. These 41 in-vitro and 21 in-silico malacostracan samples combined are subsequently referred to as the “Malacostraca dataset”.
Table 2
| Higher taxonomy | Species | Voucher | Year | Reads | % reads on target | Contigs | UCEs raw | Locus length (bp) | UCEs 50% | UCEs 70% | ||
|---|---|---|---|---|---|---|---|---|---|---|---|---|
| mean | min | max | ||||||||||
| Brachyura | ||||||||||||
| Dynomenidae | Metadynomene sp. | MCZ:IZ:153343 | 2019 | 2,879,274 | 0.55 | 83,578 | 1,166 | 611.8 | 236 | 1,157 | 847 | 107 |
| Gecarcinidae | Gecarcinus ruricola | MCZ:IZ:46902 | 2003 | 186,296 | 1.80 | 1,982 | 48 | 258.0 | 80 | 496 | 29 | 6 |
| Grapsidae | Pachygrapsus transversus | MCZ:IZ:61995 | 2004 | 6,500,430 | 3.46 | 38,220 | 1,069 | 455.0 | 227 | 3,619 | 741 | 97 |
| Percnidae | Percnon planissimum | MCZ:IZ:163892 | 2022 | 38,706,346 | 2.16 | 463,250 | 657 | 1,399.9 | 394 | 5,678 | 528 | 80 |
| Portunidae | Callinectes sapidus | MCZ:IZ:23424 | 2010 | 7,036,308 | 0.06 | 94,335 | 290 | 329.4 | 80 | 6,602 | 16 | 2 |
| Sesarmidae | Aratus pisonii | MCZ:IZ:161758 | 2021 | 7,077,520 | 7.79 | 239,522 | 1,031 | 1,503.0 | 77 | 10,525 | 788 | 103 |
| Aratus pisonii | MCZ:IZ:6197 | 1865 | 2,275,666 | 41.19 | 2552 | 5 | 212.6 | 80 | 257 | 3 | 1 | |
| Armases cinereum | MCZ:IZ:162859 | 2021 | 26,878,648 | 4.08 | 417,860 | 744 | 1,217.5 | 245 | 5,048 | 589 | 94 | |
| Trapeziidae | Trapezia rufopunctata | MCZ:IZ:163860 | 2022 | 8,798,622 | 2.94 | 108,611 | 847 | 1,622.1 | 247 | 3,786 | 656 | 96 |
| Varunidae | Eriocheir sinensis | MCZ:IZ:68008 | 1932 | 3,466,502 | 15.61 | 10,746 | 40 | 265.5 | 79 | 493 | 13 | 1 |
| Xanthidae | Actaeodes tomentosus | MCZ:IZ:163780 | 2022 | 33,281,628 | 1.47 | 794,710 | 243 | 1,146.9 | 269 | 2,115 | 198 | 42 |
| Cymo melanodactylus | MCZ:IZ:163854 | 2022 | 28,583,220 | 0.90 | 578,024 | 601 | 841.8 | 205 | 4,203 | 463 | 70 | |
| Anomura | ||||||||||||
| Eumunididae | Eumunida cf. pacifica | MCZ:IZ:153356 | 2019 | 17,174,134 | 1.48 | 510,382 | 1,051 | 1,255.2 | 81 | 5,316 | 793 | 107 |
| Eumunida pacifica | MNHN-IU-2014-23737 | 1991 | 11,783,584 | 1.43 | 110,384 | 975 | 398.7 | 229 | 6,054 | 656 | 86 | |
| Pseudomunida fragilis | MCZ:IZ:151084 | 2018 | 3,070,266 | 1.69 | 84,402 | 965 | 1,275.2 | 229 | 6,592 | 730 | 102 | |
| Galatheidae | Coralliogalathea parva | MCZ:IZ:163893 | 2022 | 45,563,018 | 0.68 | 355,095 | 612 | 1,091.5 | 240 | 6,396 | 466 | 76 |
| Galathea platycheles | MCZ:IZ:163971 | 2022 | 41,649,784 | 0.57 | 733,875 | 510 | 1,118.5 | 280 | 2,322 | 412 | 71 | |
| Munididae | Grimothea quadrispina | MCZ:IZ:139215 | 2016 | 57,233,300 | 1.52 | 1,108,273 | 531 | 873.5 | 235 | 1,528 | 415 | 66 |
| Munidopsidae | Munidopsis lentigo | USNM 1487884 | 2012 | 44,612,328 | 0.86 | 423,853 | 1,000 | 1,043.2 | 232 | 8,073 | 748 | 99 |
| Paguridae | Porcellanopagurus sp. | MNHN-IU-2021-7149 | 2021 | 1,612,206 | 0.71 | 4,229 | 108 | 295.9 | 80 | 575 | 65 | 13 |
| Porcellanidae | Euceramus transversilineatus | MCZ:IZ:30775 | 2011 | 8,243,738 | 2.84 | 82,661 | 735 | 498.0 | 194 | 1,815 | 550 | 81 |
| Axiidea | ||||||||||||
| Axiidae | Axiidae sp. 1 | MCZ:IZ:150640 | 2016 | 19,780,698 | 1.07 | 138,693 | 957 | 650.3 | 229 | 4,892 | 664 | 92 |
| Axiidae sp. 2 | MCZ:IZ:163883 | 2022 | 14,444,094 | 0.67 | 157,219 | 837 | 1,083.0 | 229 | 13,111 | 623 | 96 | |
| Astacidea | ||||||||||||
| Cambaridae | Procambarus clarkii | MCZ:IZ:68053 | 2015 | 8,523,920 | 0.86 | 188,529 | 913 | 819.6 | 276 | 5,449 | 675 | 98 |
| Nephropidae | Homarus americanus | MCZ:IZ:162632 | 2019 | 3,711,656 | 11.27 | 55,790 | 918 | 1,672.0 | 323 | 8,079 | 711 | 96 |
| Polychelida | ||||||||||||
| Polychelidae | Pentacheles laevis | MCZ:IZ:19151 | 2012 | 23,839,132 | 1.17 | 181,358 | 669 | 1,161.5 | 232 | 6,871 | 528 | 95 |
| Caridea | ||||||||||||
| Alpheidae | Synalpheus sp. | MCZ:IZ:163842 | 2022 | 5,357,062 | 0.30 | 134,448 | 1,131 | 679.3 | 229 | 1,712 | 797 | 106 |
| Palaemonidae | Zenopontonia soror | MCZ:IZ:163834 | 2022 | 7,638,680 | 1.05 | 98,044 | 1,018 | 1,131.9 | 231 | 4,138 | 768 | 103 |
| Stenopodidea | ||||||||||||
| Stenopodidae | Stenopus hispidus | MCZ:IZ:163857 | 2022 | 14,546,840 | 2.11 | 417,365 | 842 | 890.0 | 186 | 1,933 | 602 | 89 |
| Dendrobranchiata | ||||||||||||
| Penaeidae | Penaeus japonicus | MCZ:IZ:9630 | 1933 | 3,143,632 | 20.76 | 4,698 | 38 | 251.4 | 80 | 393 | 3 | x |
| Sergestidae | Robustosergia robusta | MCZ:IZ:46338 | 2014 | 38,537,050 | 0.67 | 541,292 | 441 | 1,296.3 | 230 | 4,106 | 349 | 62 |
| Euphausiacea | ||||||||||||
| Euphausiidae | Euphausia pacifica | MCZ:IZ:148541 | 2018 | 3,829,828 | 0.48 | 86,011 | 828 | 1,034.8 | 157 | 7,162 | 573 | 90 |
| Stomatopoda | ||||||||||||
| Gonodactylidae | Gonodactylellus sp. | MCZ:IZ:163794 | 2022 | 25,116,804 | 0.76 | 311,979 | 906 | 1,052.6 | 230 | 5,658 | 658 | 96 |
| Isopoda | ||||||||||||
| Armadillidiidae | Armadillidium vulgare | MCZ:IZ:28779 | 2007 | 1,755,378 | 8.17 | 18,254 | 204 | 293.4 | 80 | 2,604 | 31 | 6 |
| Idoteidae | Idotea balthica | MCZ:IZ:150668 | 2018 | 7,471,644 | 0.69 | 154,544 | 799 | 1,175.0 | 235 | 10,191 | 612 | 97 |
| Amphipoda | ||||||||||||
| Hyalellidae | Hyalella azteca | MCZ:IZ:78322 | 1969 | 3,291,524 | 9.15 | 2,767 | 123 | 276.4 | 80 | 1,039 | 3 | 1 |
| Maeridae | Maeridae sp. | MCZ:IZ:163784 | 2022 | 16,162,444 | 0.44 | 278,164 | 820 | 986.1 | 140 | 2,381 | 571 | 89 |
| Cumacea | ||||||||||||
| Cumacea sp. | MCZ:IZ:742248 | 2015 | 12,128,034 | 0.01 | 215,981 | 454 | 927.6 | 83 | 2,948 | 285 | 48 | |
| Lophogastrida | ||||||||||||
| Gnathophausiidae | Gnathophausia zoea | MCZ:IZ:46341 | 2014 | 4,117,104 | 1.70 | 41,250 | 500 | 324.0 | 80 | 911 | 348 | 51 |
| Leptostraca | ||||||||||||
| Nebaliidae | Nebalia sp. | MCZ:IZ:126457 | 2004 | 2,658,028 | 0.32 | 5,896 | 72 | 278.2 | 79 | 586 | 14 | 2 |
| Anostraca | ||||||||||||
| Artemiidae | Artemia franciscana | MCZ:IZ:58866 | 2001 | 6,014,170 | 4.18 | 32,021 | 196 | 283.9 | 79 | 487 | 111 | 27 |
| mean fresh | 19,390,527 | 1.75 | 307,115 | 762 | 1,040.7 | 212 | 4,926 | 568 | 84 | |||
| mean total | 15,089,769 | 3.89 | 227,094 | 632 | 828.8 | 183 | 4,081 | 454 | 69 | |||
Assembly and UCE extraction summary statistics for the in-vitro samples in the Malacostraca dataset, with collection accession numbers (see main text for collection codes), collection years, raw reads, proportion of on-target reads (i.e. reads mapped to a UCE probe), assembled contigs, raw UCE loci recovered from contigs, the length of the raw UCE loci, and final numbers of UCEs in 50% and 70% taxon coverage matrices after trimming and filtering.
“x”: not included in the final matrix.
Mean values for fresh samples, and across all samples at the end of the table are highlighted in bold.
Furthermore, we compiled two additional datasets to assess the efficacy of the probe set at shallower taxonomic levels, i.e. its potential to recover variation among closely related species and populations of a single species: a set of 10 samples representing 6 species of the squat lobster family Eumunididae (Anomura) from the Western Indian Ocean (E. bispinata, E. capillata, E. minor, E. multispina, E. similior and E. spiridonovi), collected between 1972 and 2017, including historical specimens from the MNHN, and the California Academy of Sciences, San Francisco (CAS) (the “Eumunida dataset” in the following, Supplementary Table S1); and 30 specimens of the mangrove crab Aratus pisonii (Brachyura, Sesarmidae), collected between 1859 and 2021 in southeastern Florida, including historical specimens from the MCZ, USNM, the American Museum of Natural History, New York (AMNH) and the Florida Museum of Natural History, Gainesville (UF) (the “Aratus dataset” in the following, Supplementary Table S2).
2.2 Probe set design and synthesis
We used PHYLUCE version 1.7.1 (Faircloth, 2016) to design the probe set, following the tutorial on https://phyluce.readthedocs.io/en/latest/tutorials/tutorial-4.html (also see Faircloth, 2017). The downloaded genomes and A. pisonii raw reads were converted to FASTA format and file headers were modified for compatibility with the PHYLUCE pipeline using SeqIO, available on Bioconda (Grüning et al., 2018). Copies of the genomes in 2bit format, required further downstream in the pipeline, were created using faToTwoBit (Kent, 2002). ART (Huang et al., 2012) was then used to simulate 100-bp short reads with 200-bp insert size (150 standard deviation) from all exemplar genomes and the A. pisonii long reads, covering the base genome approximately 2X. These simulated reads were individually aligned to the base genome using STAMPY (Lunter and Goodson, 2011), identifying putatively conserved loci with less than 5% sequence divergence to the base genome. Unmapped reads were removed from the alignment files using the view function in SAMtools (Li et al., 2009), and the cleaned alignments were converted to BED format, sorted by position along scaffolds, and proximate contigs were merged using BEDTools (Quinlan and Hall, 2010). Finally, phyluce_probe_strip_masked_loci_from_set in PHYLUCE was used to filter out putatively conserved loci that are repetitive regions, by removing all contigs shorter than 80 bp and where more than 25% of the base genome were masked.
Based on these pairwise alignment files, an SQLite database was created to query conserved loci shared across several taxa. From this database, we identified those loci shared between the base genome and six out of seven exemplar genomes, and extracted sequences corresponding to these loci from the base genome, buffered to 160 bp, with phyluce_probe_get_genome_sequences_from_bed. For each of these sequences, two 120-bp probes with 40 bp overlap were designed to achieve 3X tiling density at the center of the conserved locus. Potentially problematic probes with more than 25% masked bases, below 30% or above 70% GC content, as well as potential duplicate probes with more than 50% coverage and identity were subsequently removed, to create a temporary probe set.
To design the final probe set, the temporary probes were aligned back to all exemplar genomes, now also including the outgroup Hyalella azteca, with a minimum identity of 50%. Sequences of 180 bp length were extracted from the targeted conserved loci in all taxa and written to FASTA files. Another SQLite database with the matches of the temporary probes to conserved loci across all taxa was created and used to identify loci that were recovered by a temporary probe in at least seven out of the nine taxa (7 exemplar, 1 outgroup, 1 base genome). For each of these loci, two 120-bp probes with 3X tiling density were designed from all taxa, filtered and duplicates removed as described above. In-silico tests of the UCE probe set were performed by assessing locus recovery across a range of decapod and non-decapod crustacean genomes, using phyluce_assembly_match_contigs_to_probes after aligning the probe set to these genomes (see Table 1).
The concatenated probe set file was sent to Arbor BioSciences, where final tests of the design were performed before synthesizing the probes. Each probe was BLASTed against the base genome, and hybridization was simulated under standard myBaits® (Arbor BioSciences, MI, USA) conditions, to identify and remove non-specific probes, as well as probes targeting over-represented regions.
2.3 DNA extraction, library preparation and UCE sequence capture
Genomic DNA was extracted from muscle tissue dissected from the pleon or one to several walking legs in the case of large-bodied specimens, from an entire set of legs, or from the whole body in the case of small-bodied specimens (e.g., Peracarida, Branchiopoda). For fresh specimens (collected at most 20 years ago, preserved in ca. 95% EtOH, and preserved at -20 °C) we used the Qiagen DNeasy Blood and Tissue kit following the manufacturer’s protocol, with final elution between 100 and 200 µL in ddH2O, depending on the amount of starting material. For older museum specimens (collected more than 10 years ago, preserved in 70–80% EtOH and stored at room temperature), we followed the protocol of Tin et al. (2014) for DNA extraction from degraded historical specimens using silica-based magnetic beads, with some in-lab modifications (Derkarabetian et al., 2019), and a final elution volume between 20 and 70 µL in ddH2O. These samples are below referred to as “historical” samples. All extractions were quantified on a Qubit 2.0 fluorometer using a dsDNA High Sensitivity kit (Life Technologies, Inc.).
Libraries were prepared using the KAPA HyperPlus kit, following the manufacturer’s protocol with some in-lab modifications (in parts described in Derkarabetian et al., 2019; Moles and Giribet, 2021), particularly for the historical samples. We used up to 250 ng of DNA as input material; however, input from historical samples was usually much lower (down to 4 ng). Fresh samples, as well as more recently collected historical samples, were enzymatically fragmented to a target length of 500–700 bp, using 5 µL KAPA Fragmentation Enzyme, 2.5 µL KAPA Fragmentation Buffer (10X) and 17.5 µL DNA sample for a final volume of 25 µL, with incubation times between 3 and 8 min at 37°C. Fragmentation times for samples of different age and DNA content were optimized by visualizing fragmentation results on an Agilent 2200 TapeStation. Older historical samples did not require fragmentation as they were naturally degraded, and 25 µL of the eluted DNA went directly into end-repair and A-tailing. End-repair and A-tailing was conducted using the KAPA HyperPlus enzyme mix for fresh, enzymatically fragmented samples, and KAPA HyperPrep enzyme mix for historical, naturally fragmented samples, with 30 min incubation at 65°C. This step was immediately followed by adapter ligation, using 10 µM universal iTru stubs and 45 min incubation at 20°C for fresh, high-input samples, and 5 µM stubs and up to 60 min incubation at 20°C for historical and low-input samples. A post-ligation cleanup was carried out using freshly prepared Serapure SpeedBeads (Rohland and Reich, 2012) with 0.8X beads for fresh, and up to 3X beads for old and low-input samples. Fifteen µL of ligated libraries were used in library amplification, with 25 µL 2X KAPA HiFi HotStart ReadyMix, 5 µL individual i5/i7 dual indexing adaptors (Glenn et al., 2019), and the following thermal protocol: 45 s at 98°C, 10–18 cycles of 15 s at 98°C, 30 s at 60°C, 60 s at 72°C (number of cycles adjusted to Qubit measures of post-ligation DNA concentration), and 5 min at 72°C final extension. Amplified libraries were purified with SpeedBeads (1X for high-, 3X for low-input samples), quantified, and pooled into equimolar batches of eight samples with 250 ng DNA per sample. If necessary, pools were speed-vacuumed to a final volume of 14 µL.
Hybridization followed the myBaits® Hybridization Capture for Targeted NGS manual v 5.01 with the following modifications: Hybridization time for pools of fresh samples was 24 h at 60°C, for pools of historical and low-input samples we used a touchdown-protocol with 4 h at 62°C, 16 h at 60°C and 4 h at 55°C. These settings decrease hybridization specificity, but increase hybridization yield, in particular for degraded samples. Fifteen µL of hybridized pools were amplified for 14–18 cycles using the same thermal protocol as described above, purified with AMPure beads (1.8X for pools of high-, 3X for pools of low-input samples), quantified on a Qubit 2.0, and size estimated on an Agilent TapeStation 2200. A final 1X bead cleanup was performed on pools where adapter-dimers were present. Amplified, hybridized pools were pooled in equimolar amounts and sequenced on an Illumina NovaSeq platform (paired-end, 150 bp) at the Bauer Core Facility, Faculty of Arts and Sciences, Harvard University.
2.4 Bioinformatics and phylogenetic analyses
Raw Illumina reads for the Malacostraca dataset were demultiplexed and processed using PHYLUCE version 1.7.2 following the workflow in the online tutorial. Adapters and low-quality bases were removed with illumiprocessor (Faircloth, 2013), which implements trimmomatic (Bolger et al., 2014). Contigs were assembled with SPAdes version 3.15.5 (Prjibelski et al., 2020) using the “–careful” option to reduce the number of mismatches and indels. Probes were matched to the assembled contigs with phyluce_assembly_match_contigs_to_probes, with a 65% threshold value for minimum locus coverage and identity. UCE sequences from all taxa were extracted to individual FASTA files per locus, including incomplete loci that were recovered only in a subset of the taxa. At this step, we also included contigs from the 22 genomes used for probe set design and in-silico tests, “harvested” with phyluce_probe_slice_sequence_from_genomes (see Table 1 for UCE recovery summary statistics for these samples). Extracted sequences were aligned with MAFFT (Katoh and Standley, 2013), and alignments were trimmed with GBlocks (Castresana, 2000; Talavera and Castresana, 2007), using very conservative settings, i.e. –b1 0.5 –b2 0.85 –b3 4 –b4 8, suitable for phylogenetic analyses on high taxonomic levels. We built >50% and >70% occupancy matrices, meaning that a UCE was included if present at least in 50% and 70% of taxa, respectively. In order to evaluate the effect of slower evolving UCEs on the resolution of deeper nodes, we additionally created a matrix containing the 25% most conserved UCEs (224 loci) by ordering the alignments of the 50% occupancy matrix by pairwise identity and selecting the 25% with the highest identity scores. These matrices were prepared in Geneious Prime version 2023.0.1 (Kearse et al., 2012). A further cleaning step was carried out with CIAlign (Tumescheit et al., 2022), to crop long gaps in sequence ends (threshold –crop_ends_mingap_perc 0.02) and to remove paralogous and outlier sequences (threshold –remove_divergent_minperc 0.65). All alignments with historical samples were additionally inspected manually in Geneious Prime, further removing non-orthologous sequences and potential contaminations.
Phylogenies for the Malacostraca dataset were estimated using the concatenated >50% and >70% occupancy matrices, as well as the 25% conserved loci matrix in IQ-TREE version 2.2.0 (Minh et al., 2020a), with model selection using ModelFinder (Kalyaanamoorthy et al., 2017) and an ultrafast bootstrap (Hoang et al., 2018) with 1500 replicates. We ran IQ-TREE on partitioned matrices, using the implemented terrace aware approach (Chernomor et al., 2016) and PartitionFinder (Lanfear et al., 2012), and calculated gene- and site-concordance factors (gCF and sCF; Minh et al., 2020b; Mo et al., 2023) as additional measures of nodal support. The resulting consensus trees were visualized with iTOL version 6.7.4 (Letunic and Bork, 2021), and edited in Inkscape version 1.2.
Assembly, UCE extraction and alignment for the Eumunida and Aratus datasets (Supplementary Tables S1, S2) followed the same pipeline as above. We used less conservative trimming settings for GBlocks (–b1 0.5 –b2 0.5 –b3 6 –b4 6 for the Eumunida dataset, –b1 0.5 –b2 0.5 –b3 10 –b4 4 for the Aratus dataset, respectively), but a slightly higher threshold for outlier removal with CIAlign (–remove_divergent_minperc 0.75), reflecting the shallower taxonomic level of these datasets. We built 50% occupancy matrices for downstream analysis of both datasets. In addition to assembly and UCE recovery statistics for the Eumunida and Aratus datasets, we assessed recovery of genetic variation on species- and population-level via “smilograms’’ using the PHYLUCE function phyluce_align_get_smilogram_from_alignments on both datasets. “Smilograms” visualize the frequency of base variations across UCE loci in relation to the distance from the alignment center, usually showing increasing variability in the flanking regions compared to the UCE core. Furthermore, we reconstructed a phylogeny for the Eumunida dataset using IQ-TREE as described above. To analyze the Aratus dataset, we called single-nucleotide polymorphisms (SNPs) from the 50% matrix using SNP-sites version 2.5.1 (Page et al., 2016), and randomly selected one SNP per UCE-locus using custom scripts. We assessed population structure by performing a discriminant analysis of principal components (DAPC; Jombart et al., 2010) with adegenet version 2.1.10 (Jombart and Ahmed, 2011) and estimated population differentiation (pairwise and population-specific FST values using hierfstat version 0.5 (Goudet and Jombart, 2022).
3 Results
3.1 UCE recovery and probe set efficacy
The final probe set after filtering and final testing included 20,304 probes targeting 1,384 loci. For the Malacostraca dataset, trimmed Illumina reads of the in-vitro samples were assembled to a mean number of 227,094 contigs per sample (range 1,982–1,108,273). Mean raw UCE locus recovery per sample was 632 across all samples (range 5–1,166), with the oldest sample in the dataset, Aratus pisonii, collected in 1865, recovering the lowest number of loci. When considering only fresh samples (collection date 2012 or later), mean raw UCE locus recovery was 785 (range 243–1166). Mean locus length across all in-vitro Malacostraca samples was 829 bp (range of mean per sample 213–1,627 bp), again with the oldest sample having the shortest mean UCE length (see Table 2 for detailed assembly and UCE extraction statistics of the in-vitro samples). Across malacostracan orders, locus recovery from fresh and in-silico samples was generally highest within Decapoda. Still, the probe set recovered > 800 loci from Euphausiacea and Stomatopoda, 454–1015 loci from various Peracarida, and even 381 and 452 loci from the non-malacostracan Copepoda (Eurytemora affinis) and Branchiopoda (Artemia franciscana), respectively, which were included as outgroups (Figure 1; Tables 1, 2). The trimmed and revised 50% occupancy matrix of the Malacostraca dataset contained 897 UCE loci with a mean length of 230 ± 8 bp per locus. The mean number of loci per sample in this matrix was 527 (range 3–863, Tables 1, 2). The concatenated alignment had a length of 206,250 bp and contained 100,102 informative sites, with a mean number of 112 informative sites per locus. The 70% occupancy matrix of the Malacostraca dataset contained 110 UCE loci with a mean length of 268 ± 30 bp per locus. The mean number of loci per sample in this matrix was 77 (range 1–109, Tables 1, 2). The concatenated alignment had a length of 29,518 bp and contained 14,651 informative sites, with a mean number of 133 informative sites per locus.
Figure 1
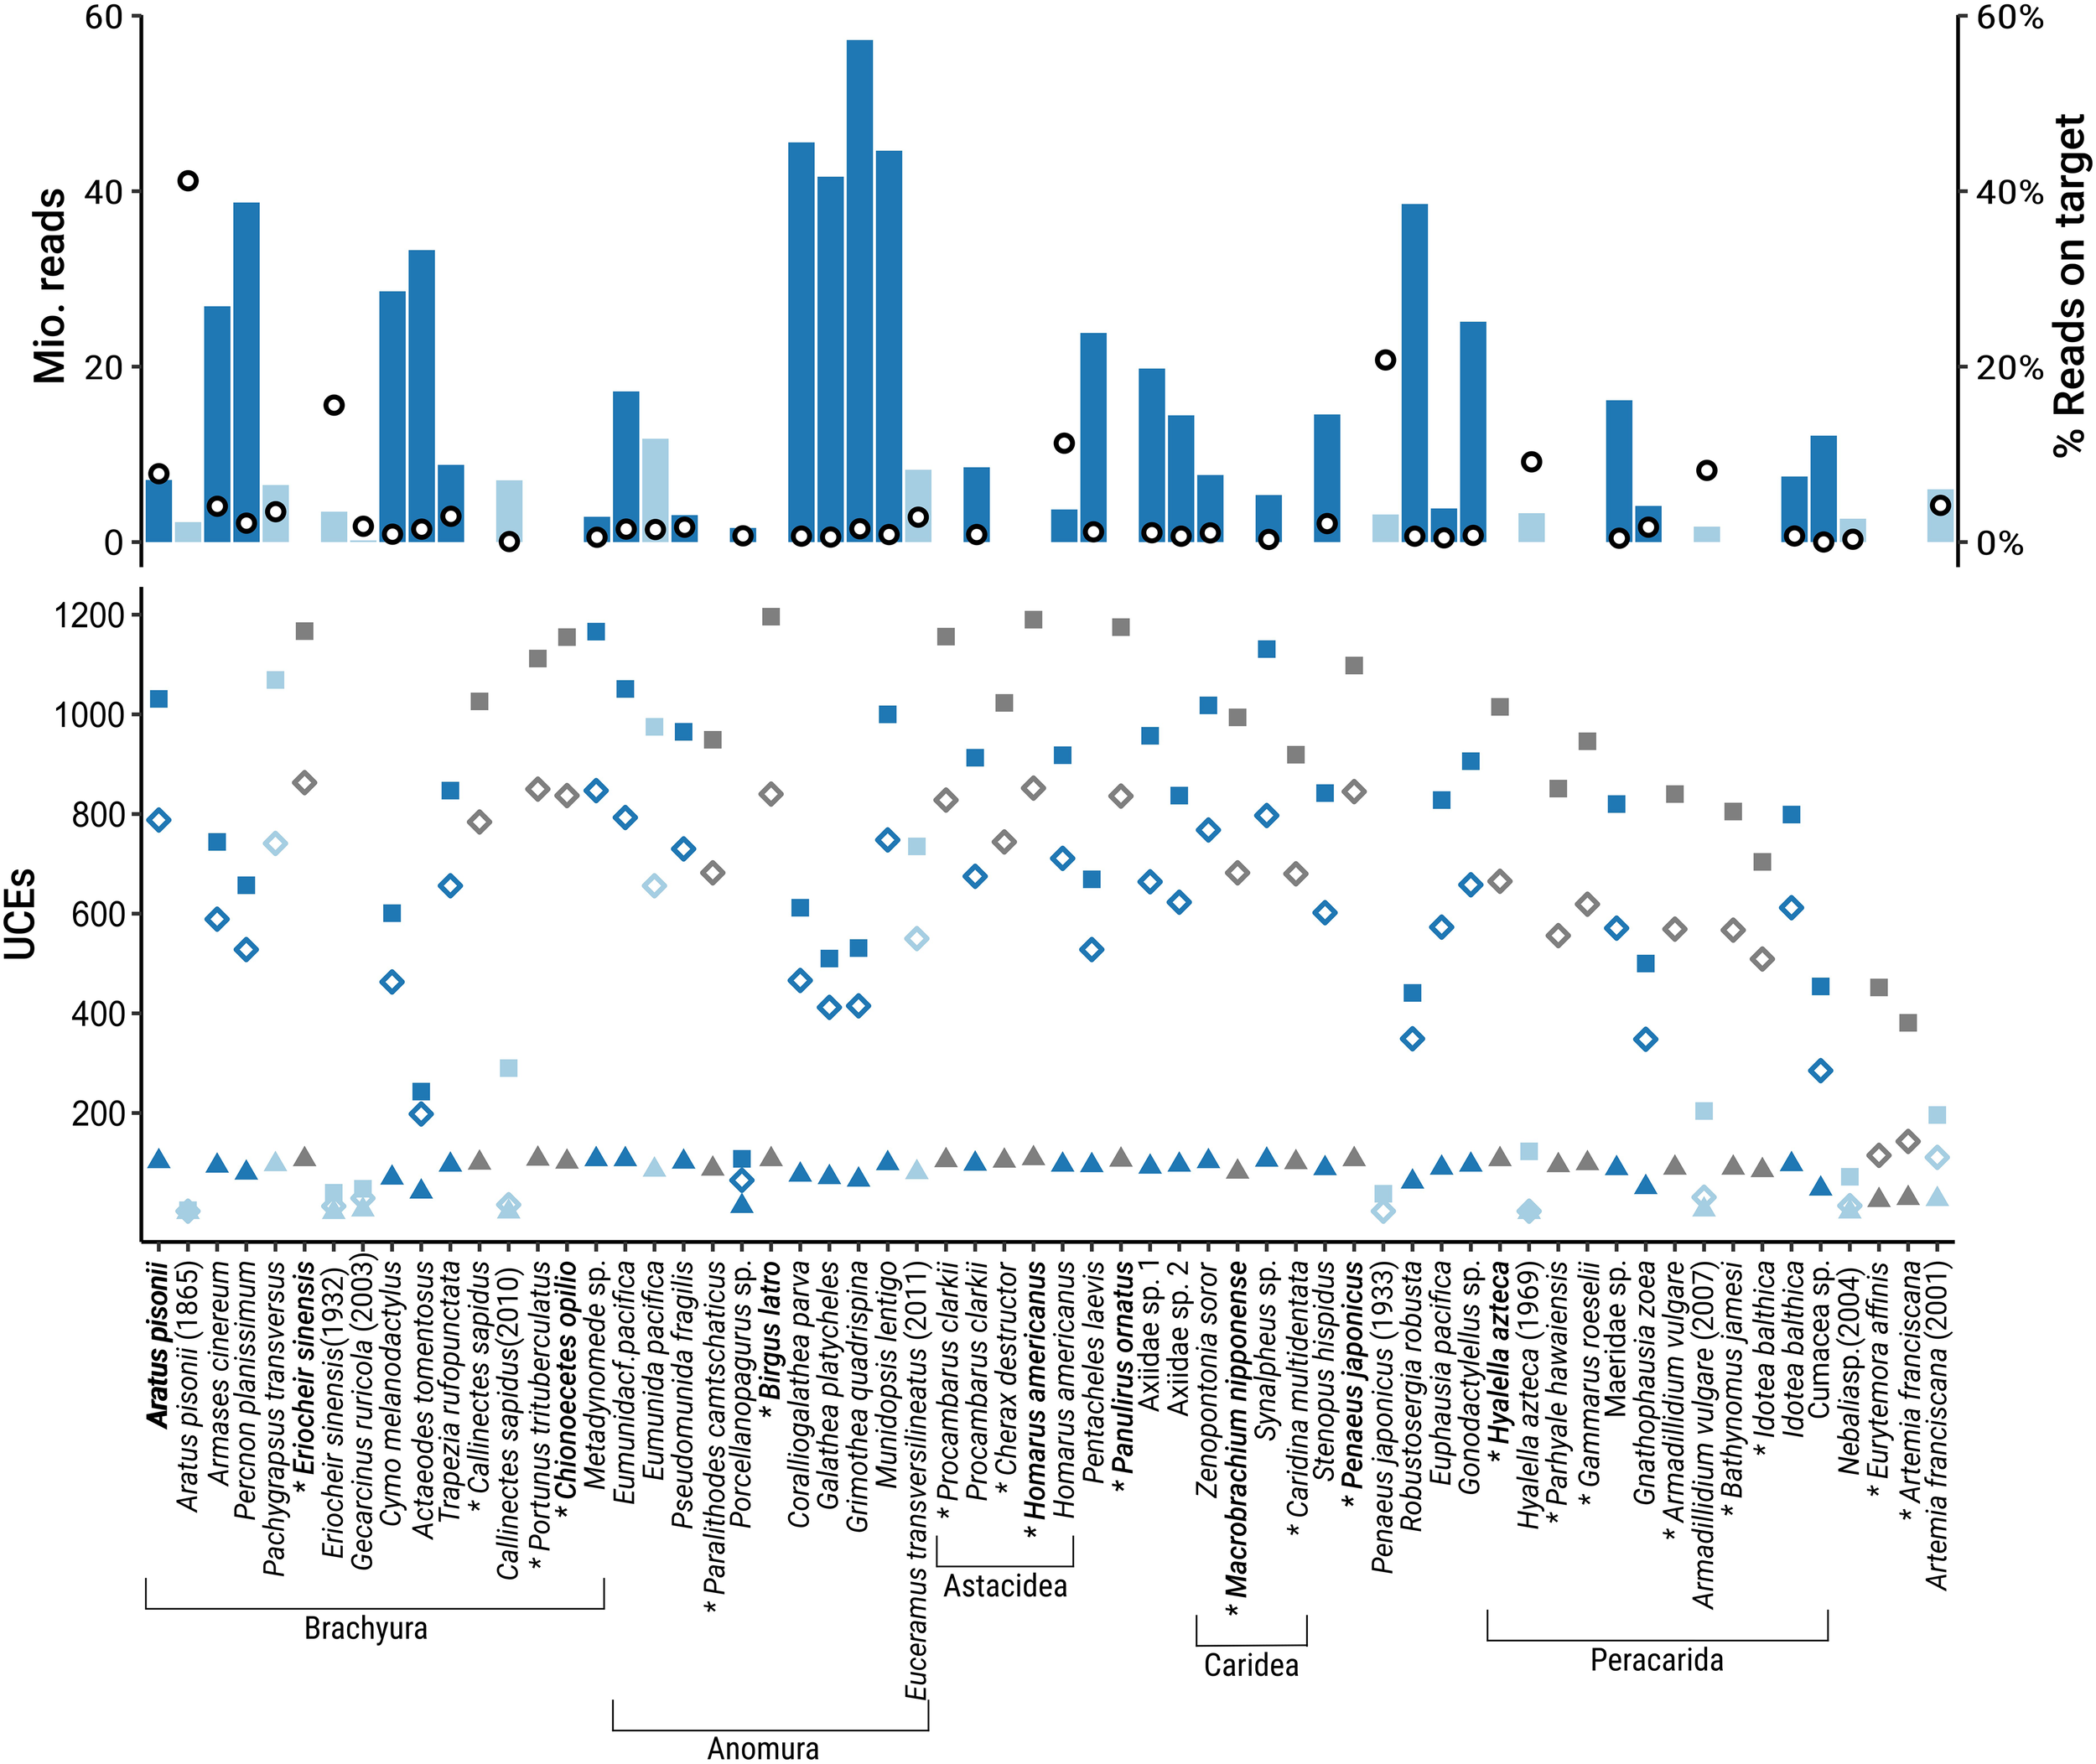
Reads and UCE recovery by species in the Malacostraca dataset. Top: number of raw illumina reads (bars) and percentage of on-target reads (open circles). Bottom: number of raw UCEs (squares), UCEs in the 50% occupancy matrix (open diamonds), and UCEs in the 70% occupancy matrix (triangles). Dark blue: fresh samples, light blue: historical samples (collected before 2013), grey: in-silico samples. Species used for probe set design are in bold.
For the Eumunida dataset, SPAdes assembly of the trimmed Illumina reads resulted in a mean number of 124,439 contigs (range 3,014–745,615). Mean raw UCE locus recovery was 685 across all samples (range 34–1,115), of which on average 600 loci were retained in the final 50% occupancy matrix (range 20–941). Mean locus length across all samples was 581 bp (range of mean per sample 190–1,339 bp), again with the oldest sample having the shortest mean locus length (Supplementary Table S1).
Lastly, the 30 samples in the Aratus dataset yielded mean of 828,724 assembled contigs from the trimmed Illumina reads (range 6,259–1,671,386). Mean raw UCE locus recovery was 654 (range 21–1,017), of which on average 530 loci were retained in the final 50% occupancy matrix (range 10–828). Mean UCE locus length per sample was 1,441 bp (range 213–1,622 bp). When considering only the fresh samples in this dataset (all collected in 2021), mean raw and final locus recovery was 941 and 530 loci, respectively. See Supplementary Table S2 for detailed assembly and UCE extraction summary statistics for this dataset.
Across all three datasets, UCE locus recovery and mean locus length clearly decreased with increasing sample age (Figure 2). Still, the probe set recovered 5–26 loci from the three oldest specimens (Aratus pisonii, MCZ: IZ:6194 [two specimens], and MCZ: IZ:6197 [1 specimen], collected 164 and 158 years ago, respectively), of which 3–15 loci were retained in the final matrices after trimming and manual inspection. Mean UCE lengths for these oldest samples were likewise among the lowest across all samples, ranging between 213 and 262 bp (compare Table 2; Supplementary Tables S1, S2). At the same time, UCE recovery and length showed considerable variation across the more recent historical, as well as the fresh specimens, reflecting differences in specimen preservation and storage (see Discussion for details).
Figure 2
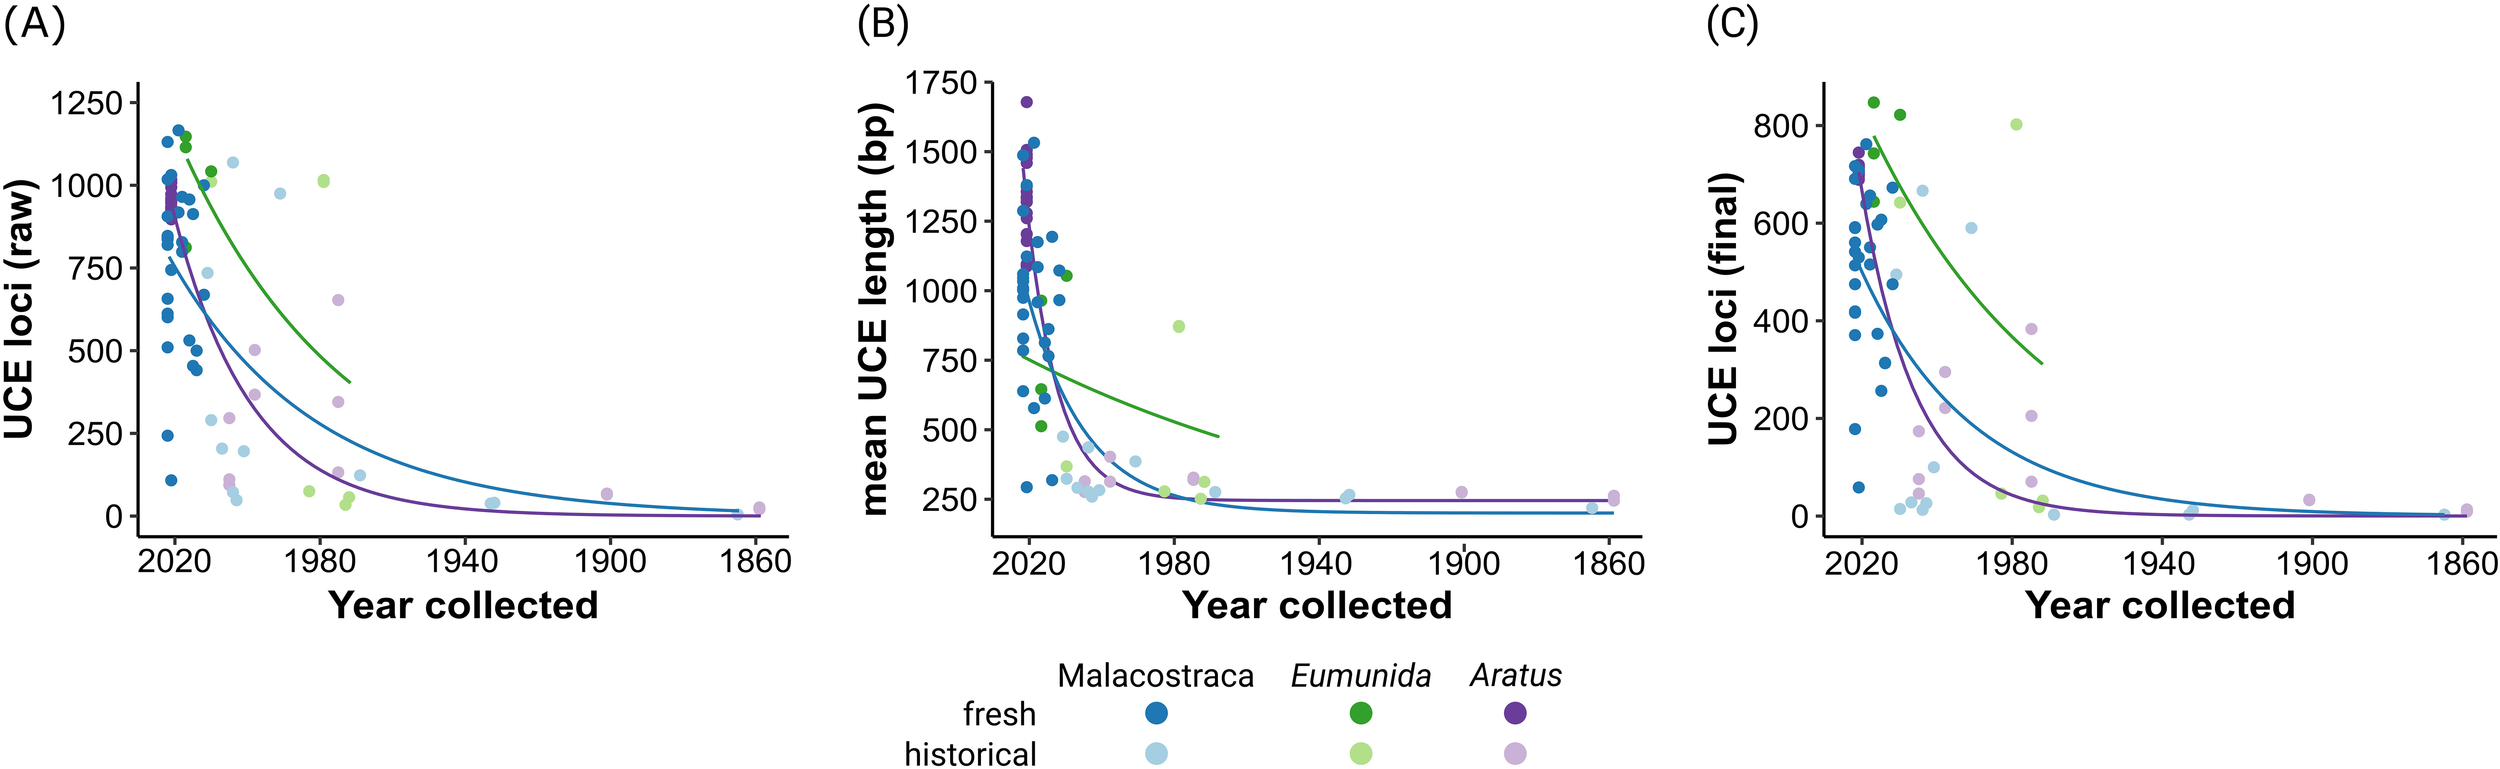
Relationship between sample age and UCE locus recovery and mean UCE locus length across the three datasets used in this study. (A) Number of raw (unaligned) UCE loci recovered by PHYLUCE. (B) Mean raw UCE length per sample. (C) Number of loci in final 50% occupancy matrices. Exponential trend lines fitted using nonlinear least squares regression. ‘Historical’ refers to samples collected before 2013. Note the different scales on the y-axis.
Further exploration of the Eumunida and Aratus datasets indicated that the targeted UCE loci are also informative at species and population levels. Sequence variation, as visualized by “smilograms”, generally increased with distance from the UCE core region, showing a bimodal/W-shaped distribution for the Eumunida subset (Figure 3A) and a more typical, U-shaped distribution for the Aratus dataset (Figure 3B). The trimmed and revised 50% occupancy matrix of Western Indian Ocean Eumunida spp. (six species, ten samples, see Supplementary Table S1) included 24,983 informative sites at a total length of 785,344 bp across 1,045 loci. The phylogeny derived from the Eumunida dataset showed congruent relationships among the six species included, with full support for almost all nodes, and the historical samples placed at their expected positions (Figure 4). We extracted 680 SNPs from the 50% occupancy matrix of the Aratus dataset (i.e., one SNP randomly sampled from each UCE locus containing SNPs). The four oldest samples in the dataset (collected in 1859 and 1901, respectively; see Supplementary Table S2) were removed before further analysis due to high amounts of missing data. The DAPC analysis (no. of retained PCAs = 8, no. of retained discriminant functions = 5) revealed only little structure in the genetic data, with five of the six sampling populations clustering closely together (Figure 5). The proportion of specimens assigned to their actual sampling population based on posterior probabilities estimated by DACP was 0.77 over the entire dataset, ranging between 0.6 and 1 for the six populations (compare Supplementary Figure S3). In line with the DAPC results, estimates of population differentiation were low overall (overall FST = 0.0176) as well as between populations, with just one population (Highland Beach, 3 specimens collected in 1975) showing signs of weak differentiation (pairwise FST > 0.05; Supplementary Table S3).
Figure 3
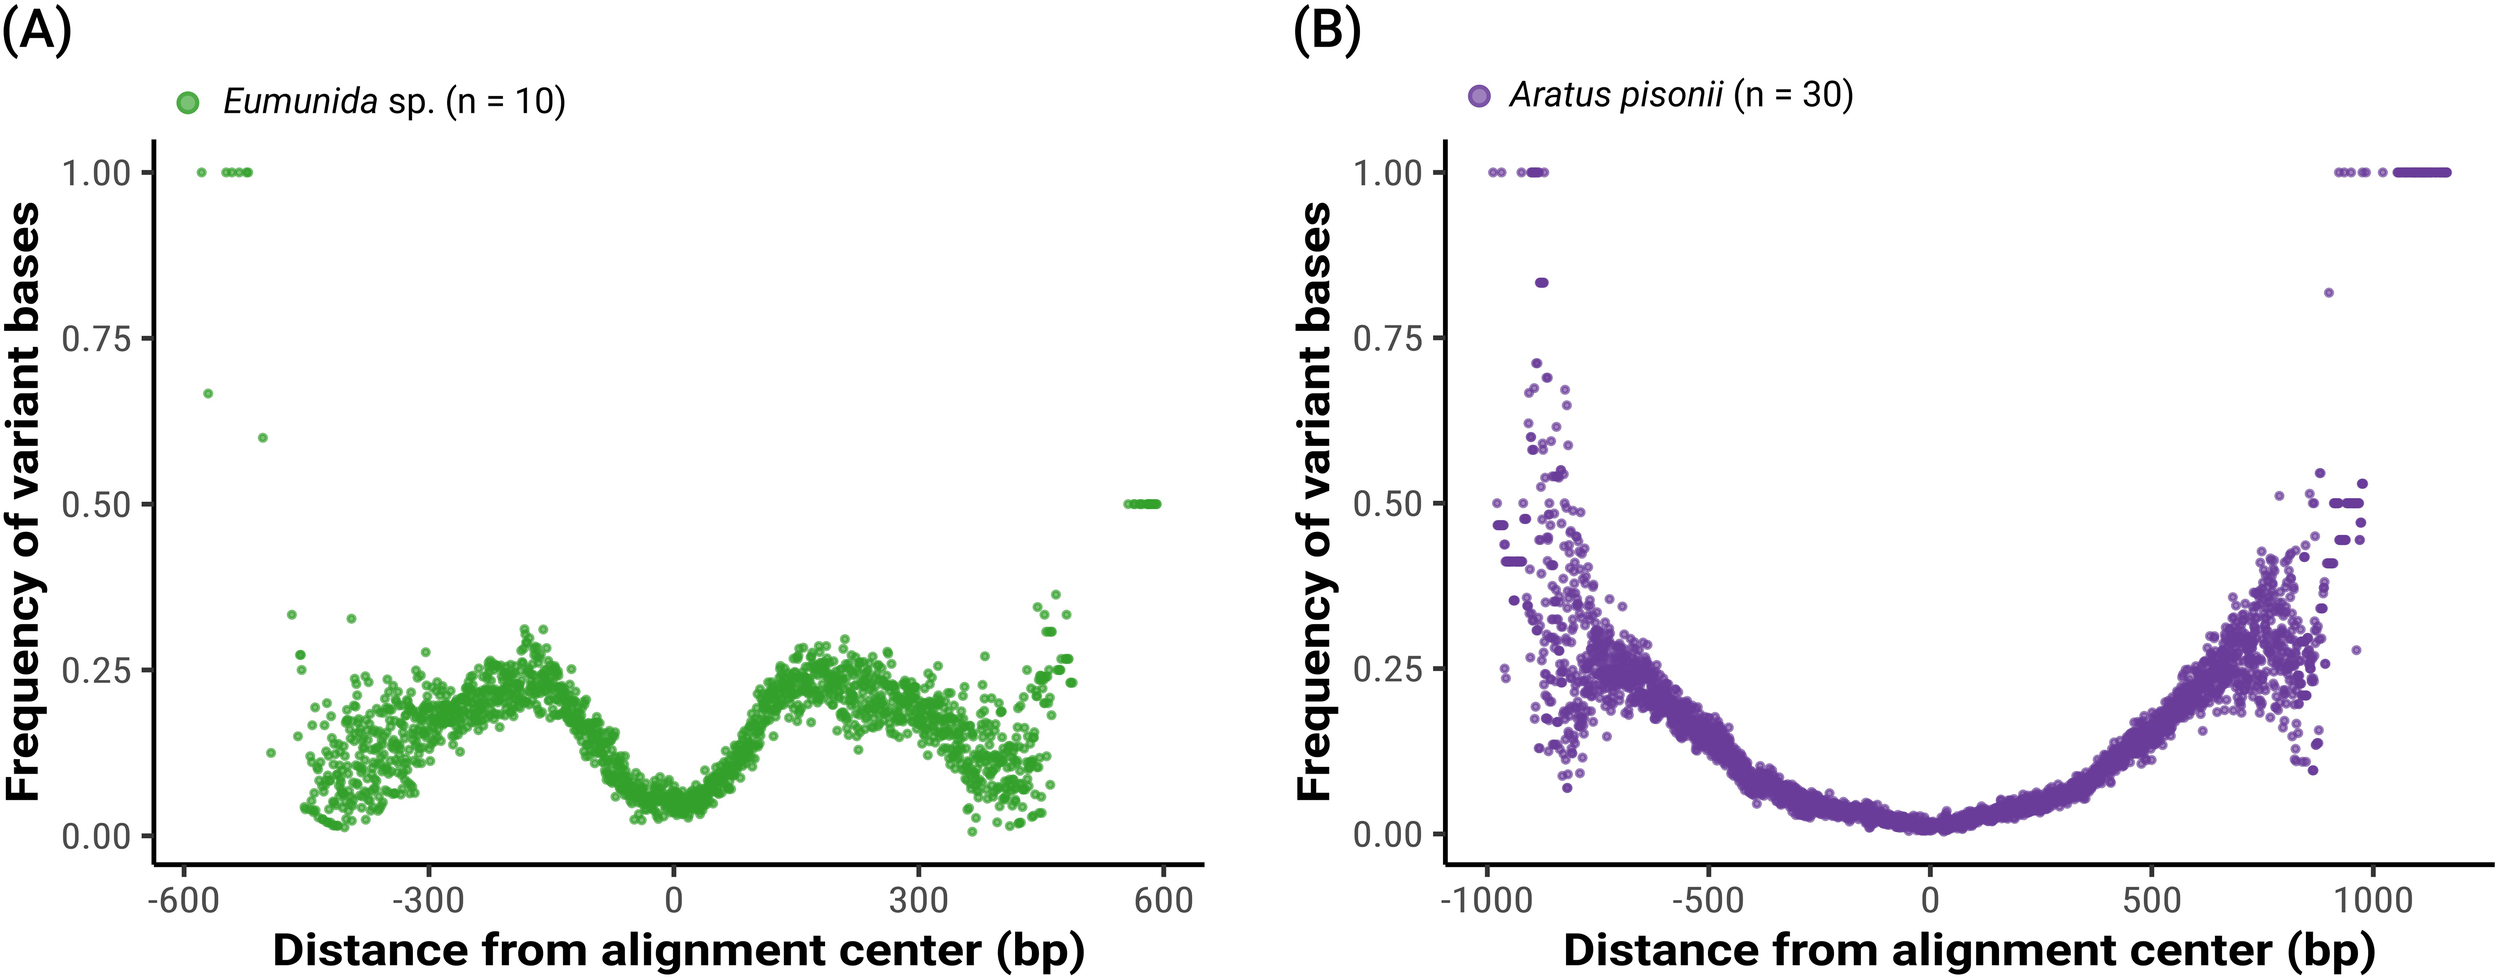
Species- and population-level genetic variation captured by the UCE probe set, shown as the frequency of variant bases in relation to their distance from the center of alignment. Variation data extracted from trimmed 50% occupancy matrices. (A) “Smilogram” for a dataset of six Eumunida species (10 specimens) from the Western Indian Ocean. (B) “Smilogram” for a dataset of 30 Aratus pisonii specimens collected in southeastern Florida.
Figure 4
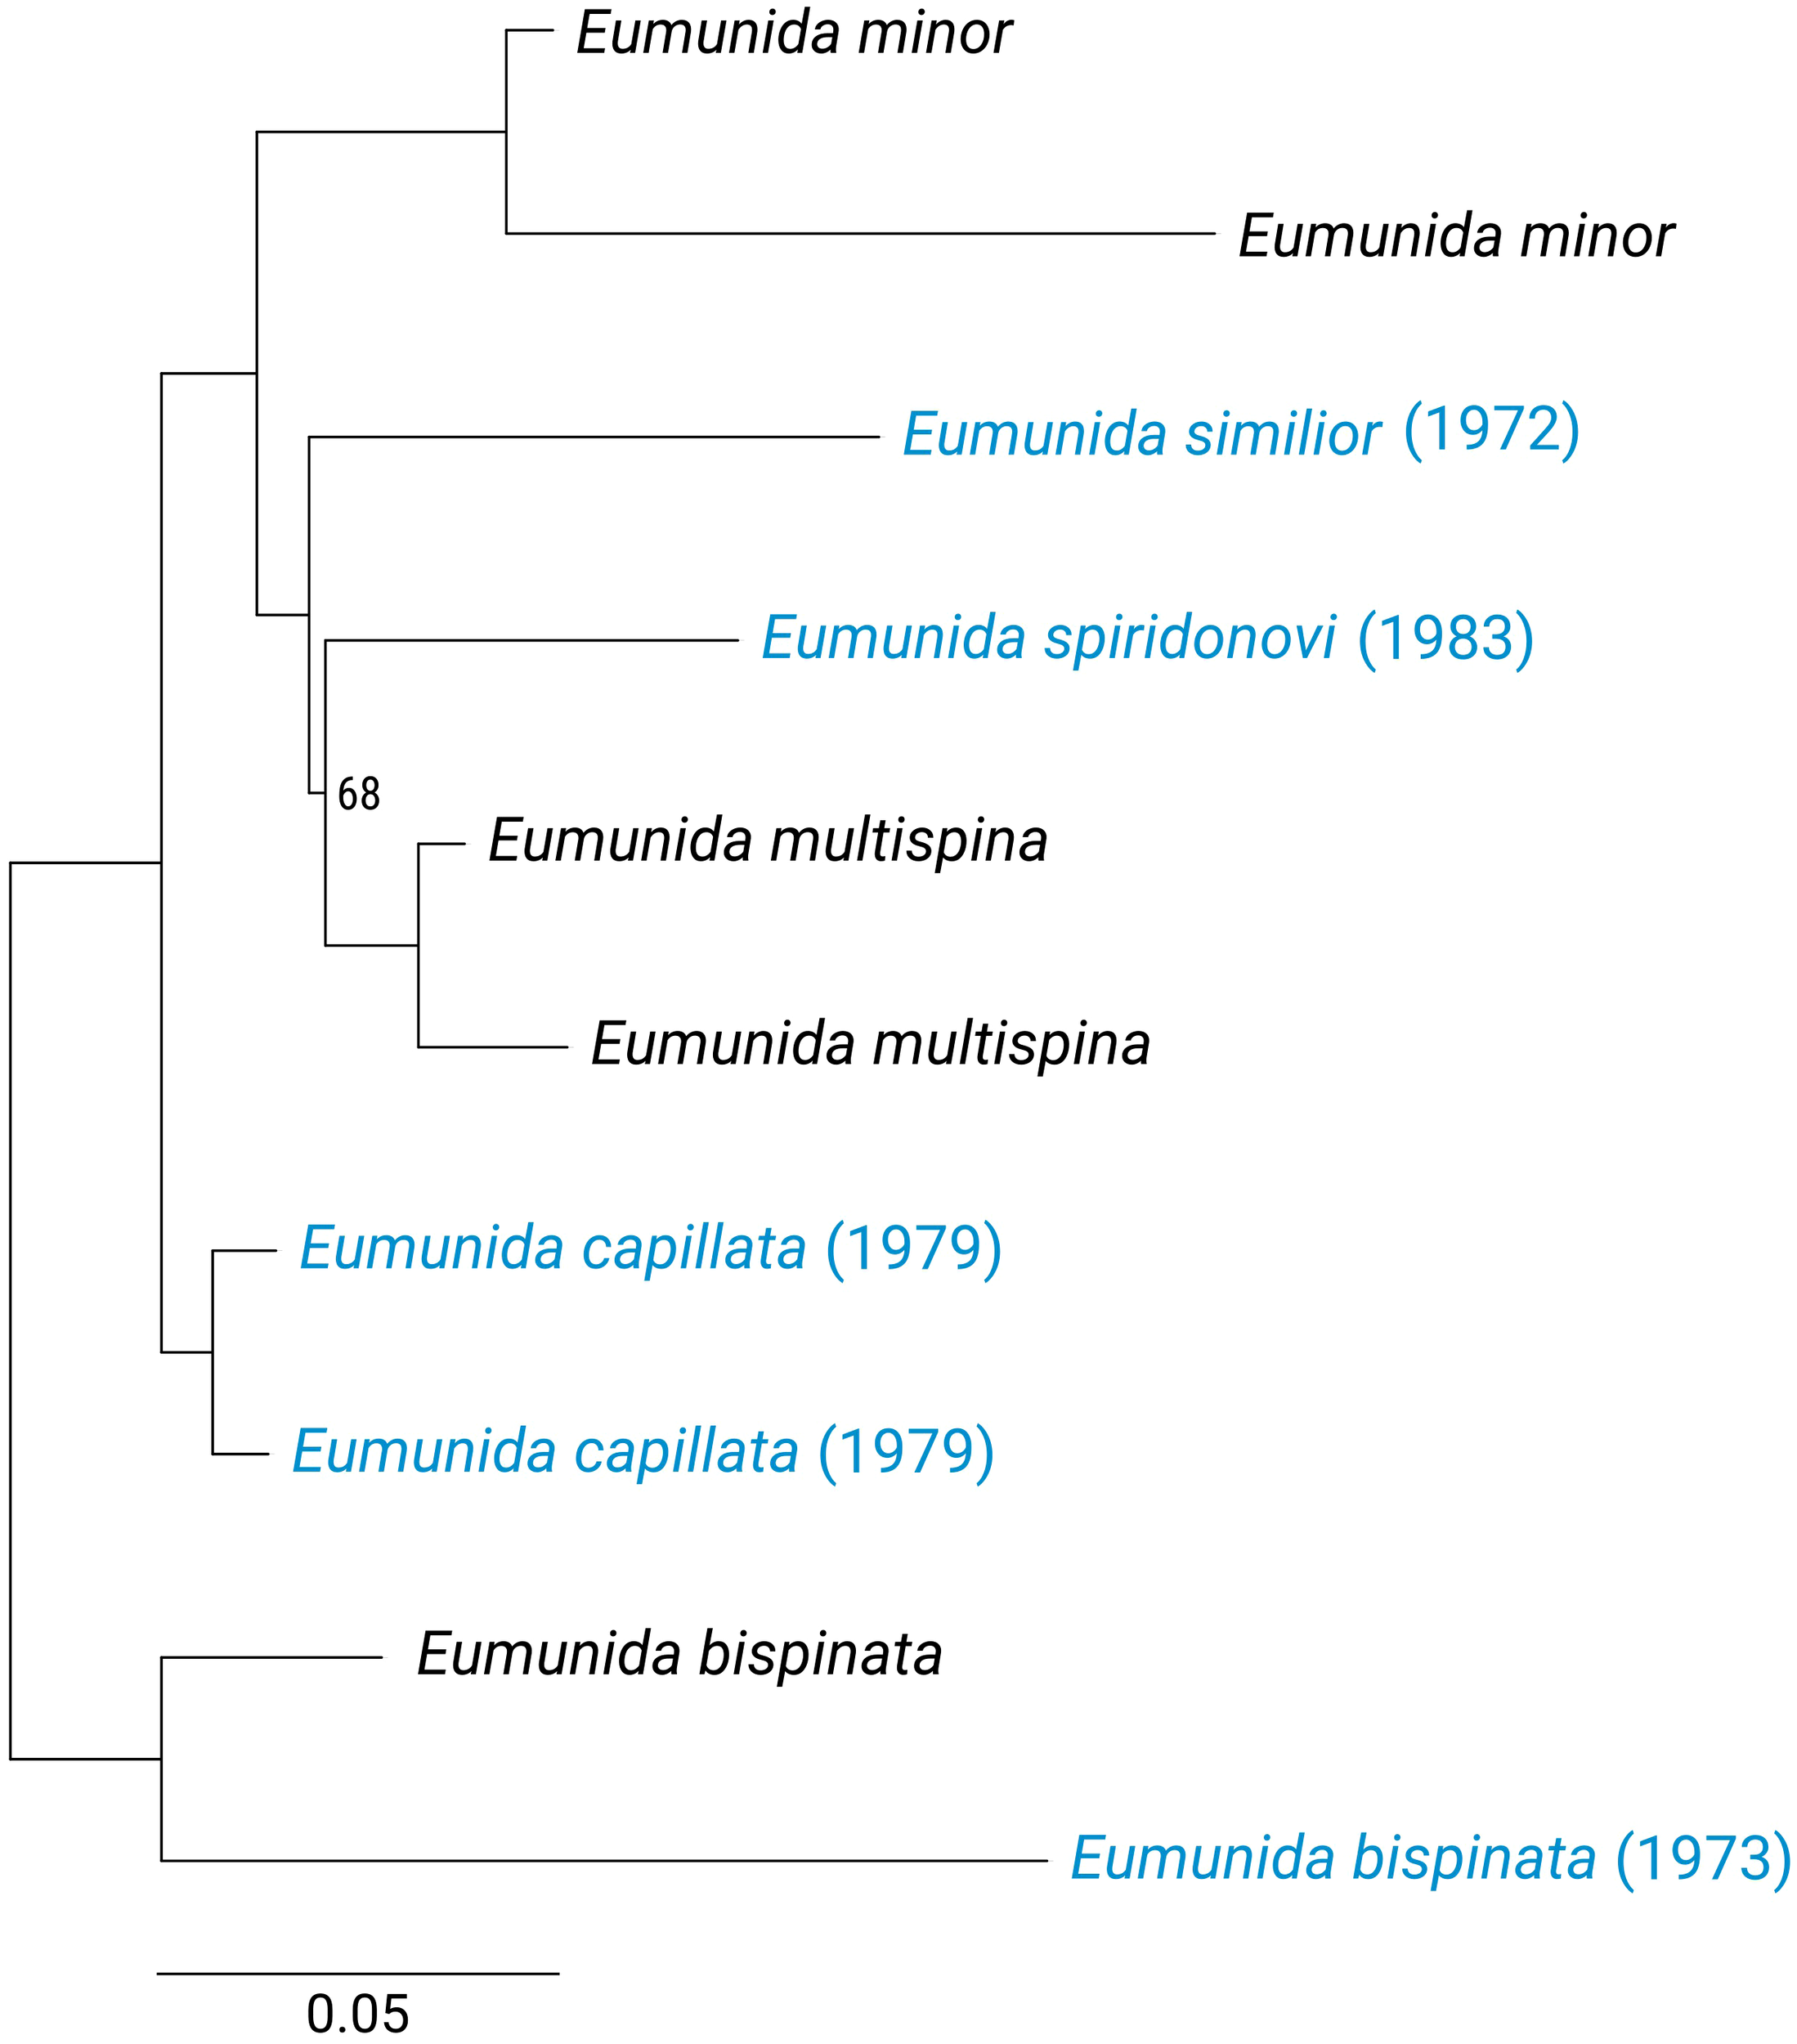
UCE-derived phylogenies (maximum likelihood) for six Eumunida species from the Western Indian Ocean, based on a 50% occupancy matrix of a 10-specimen dataset. Historical samples (collection year in parentheses) are highlighted in blue, and bootstrap values are given for nodes with support <100%.
Figure 5
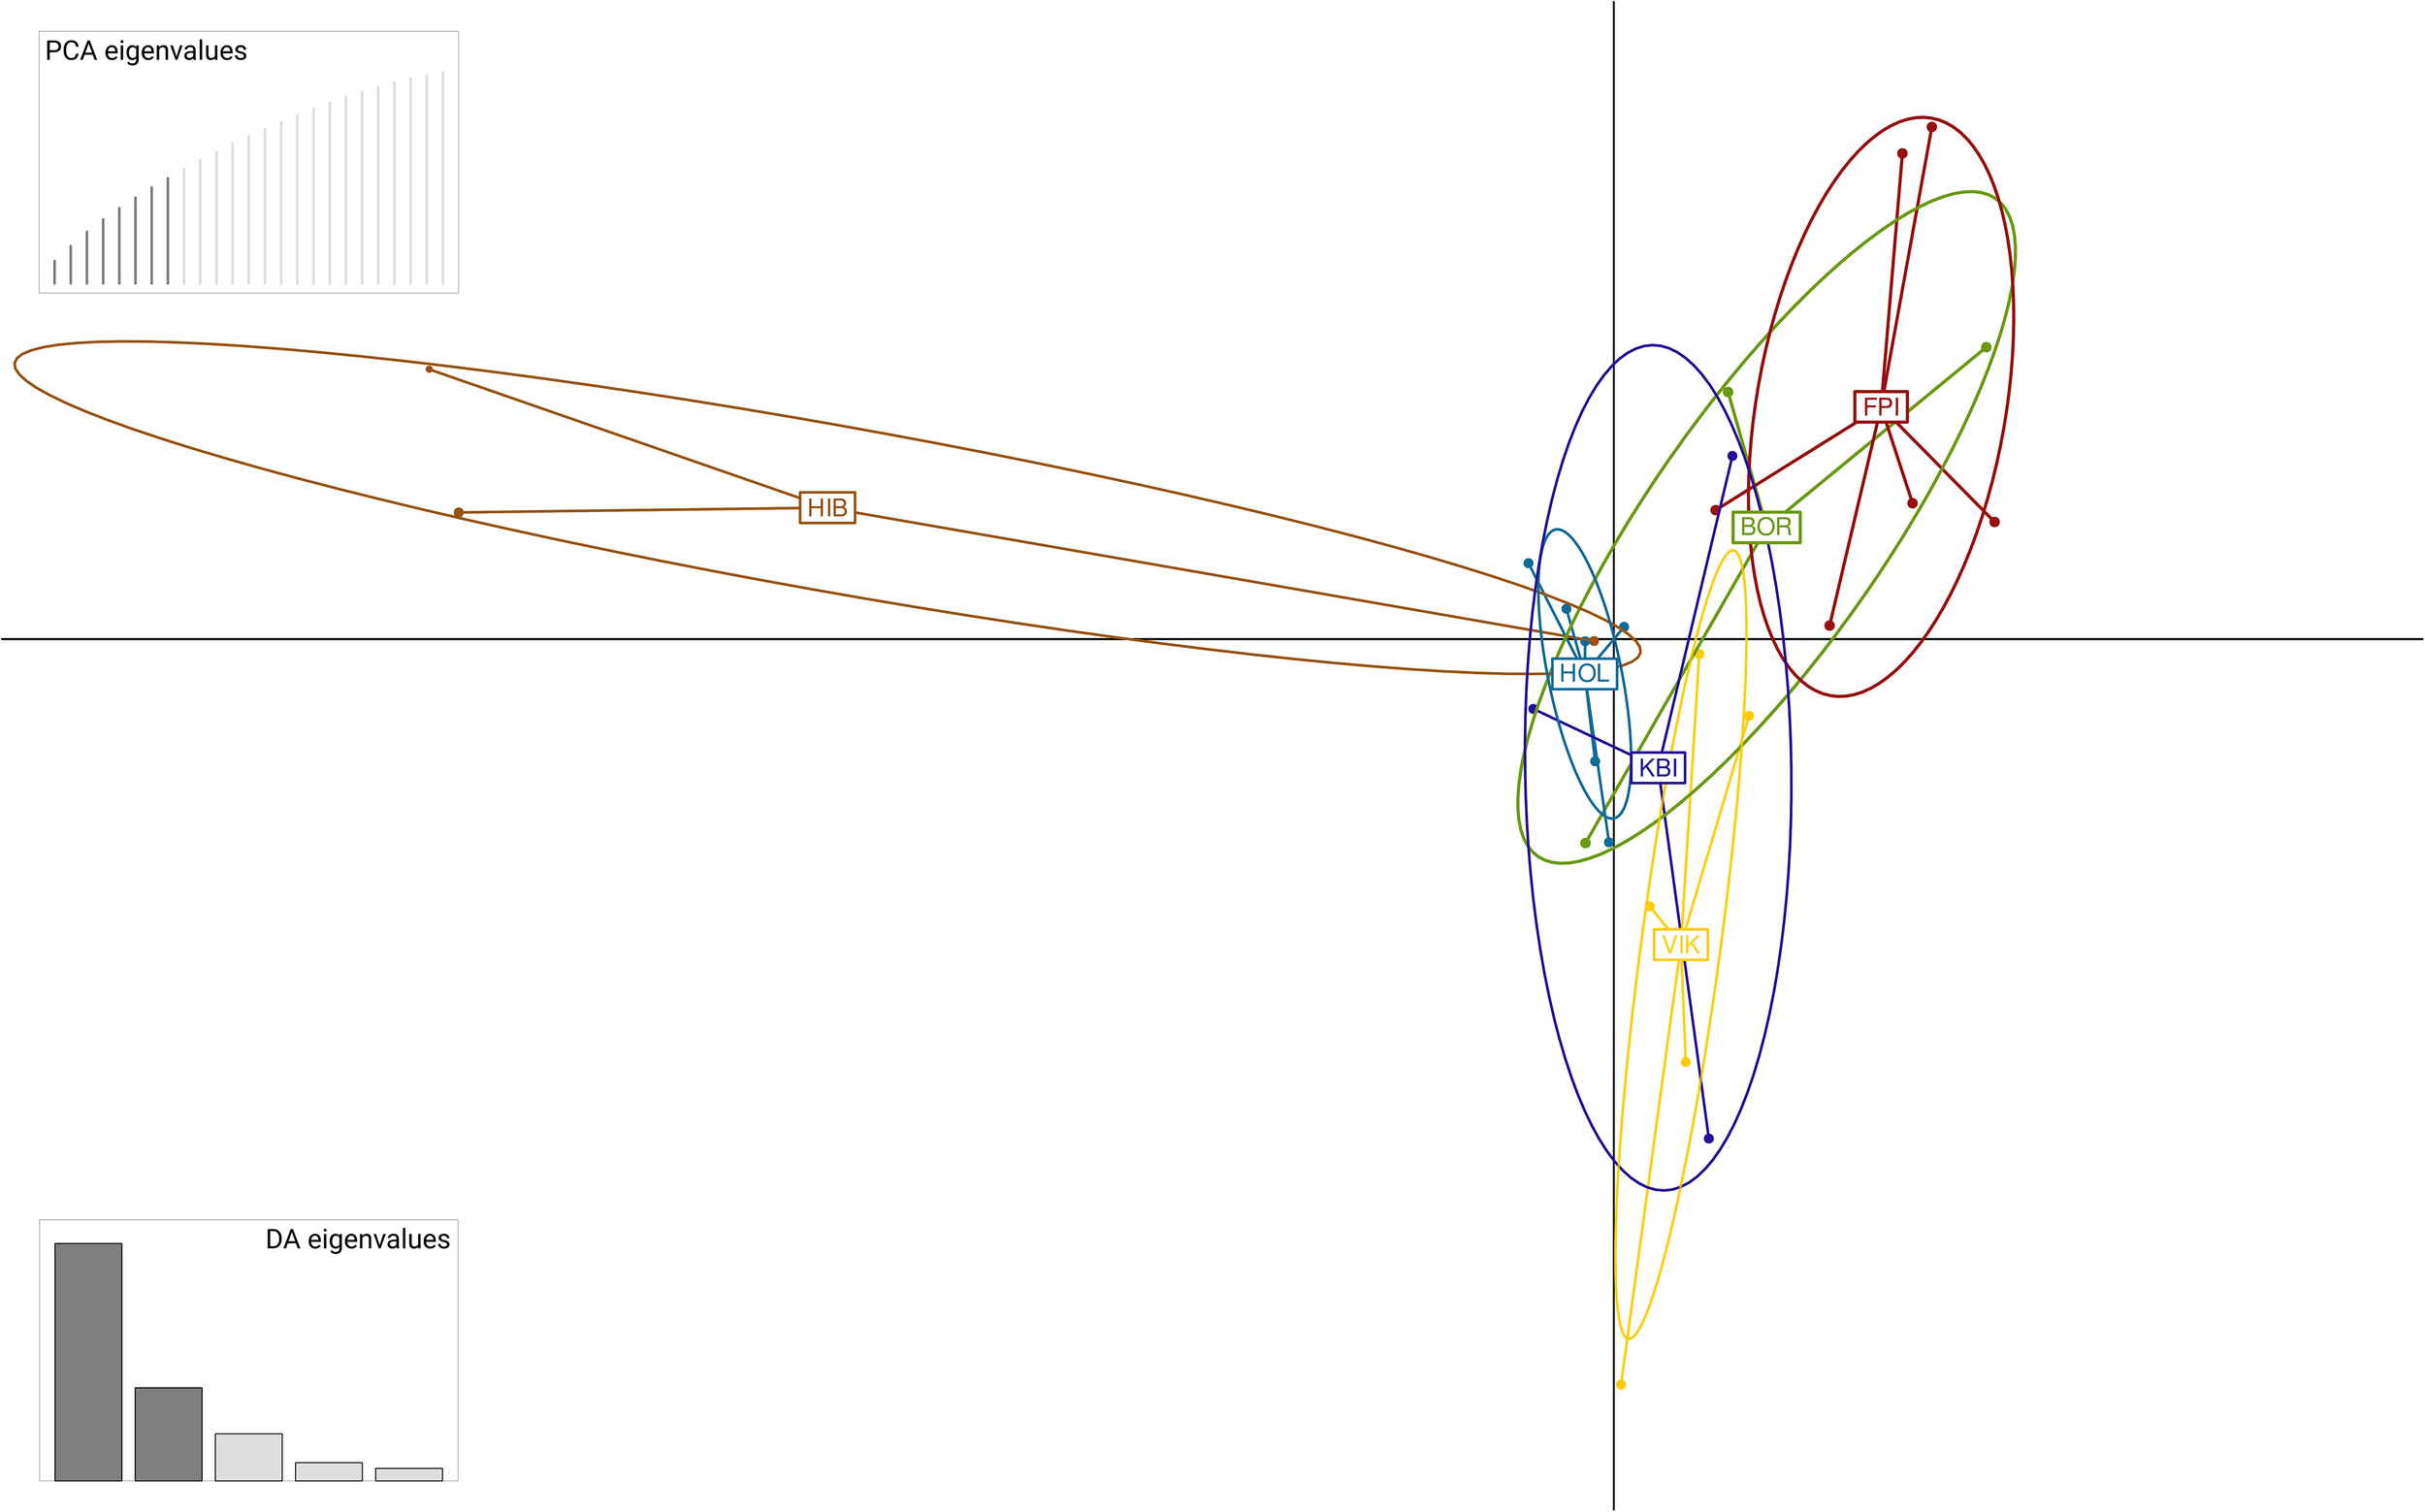
Discriminant analysis of principal components (DAPC) for 30 specimens of Aratus pisonii, sampled from six populations in southeastern Florida, based on a matrix of 680 SNPs. Population codes: BRO, Boca Raton; FPI, Fort Pierce; HIB, Highland Beach; HOL, Hollywood; KBI, Key Biscayne; VIK, Virginia Key.
3.2 UCE phylogeny of the Malacostraca
Maximum-likelihood analyses of the different matrices (50% and 70% occupancy thresholds, 25% most conserved loci) recovered fully resolved phylogenies of the included taxa (Figure 5; Supplementary Figures S1, S2). All matrices recovered Decapoda as monophyletic, with Euphausiacea, represented by Euphausia pacifica, as their sister group (forming the clade Eucarida), and Stomatopoda, represented by Gonodactylellus sp., as the sister group of Eucarida. The relationships within Decapoda were largely congruent between the different matrices: Dendrobranchiata were recovered as the sister group to all other decapod infraorders (the clade Pleocyemata). Pleocyemata were divided in two monophyletic groups, i.e. Caridea + Stenopodidea, and the ‘reptant’ groups (Achelata + Anomura + Astacidea + Axiidea + Brachyura + Polychelida). Axiidea clustered with a clade Astacidea + Achelata + Polychelida, and the two remaining groups, Anomura and Brachyura, formed a second monophyletic group of reptant decapods. Within Brachyura, all matrices supported an early diverging position of Dromioidea (Metadynomede sp.) with respect to the other groups, and also recovered the two major clades within the Eubrachyura, i.e., Heterotremata (Actaeodes, Callinectes, Chionoecetes, Cymo, Portunus, and Trapezia) and Thoracotremata (Aratus, Armases, Eriocheir, Gecarcinus, Pachygrapsus, and Percnon) (Figure 4; Supplementary Figures S1,S2). Incongruencies between the results based on the three data sets within Decapoda relate to the position of historical samples (see below). Relationships towards the base of the tree (i.e. outside Decapoda) were less stable, with varying topologies between data matrices. Peracarida is not monophyletic, irrespective of the analyzed data matrix, however, Isopoda and Amphipoda were each recovered as monophyletic in all topologies, and Lophogastrida (represented by Gnathophausia zoea) was always recovered as sister group to a clade containing Amphipoda + Stomatopoda + Eucarida. Leptostraca (Nebalia sp.) was recovered as sister group to Malacostraca only in the 50% occupancy matrix (Figure 6), while it clustered with Euphausiacea in the 70% occupancy matrix and in the one with the 25% most conserved UCEs (Supplementary Figures S1, S2). Likewise, Cumacea was recovered either as sister group to Isopoda (50% occupancy matrix, Figure 6), as sister group to all other Malacostraca (70% occupancy matrix, Supplementary Figure S2), or as sister group to all Malacostraca excluding Isopoda (25% most conserved UCEs matrix, Supplementary Figure S1).
Figure 6
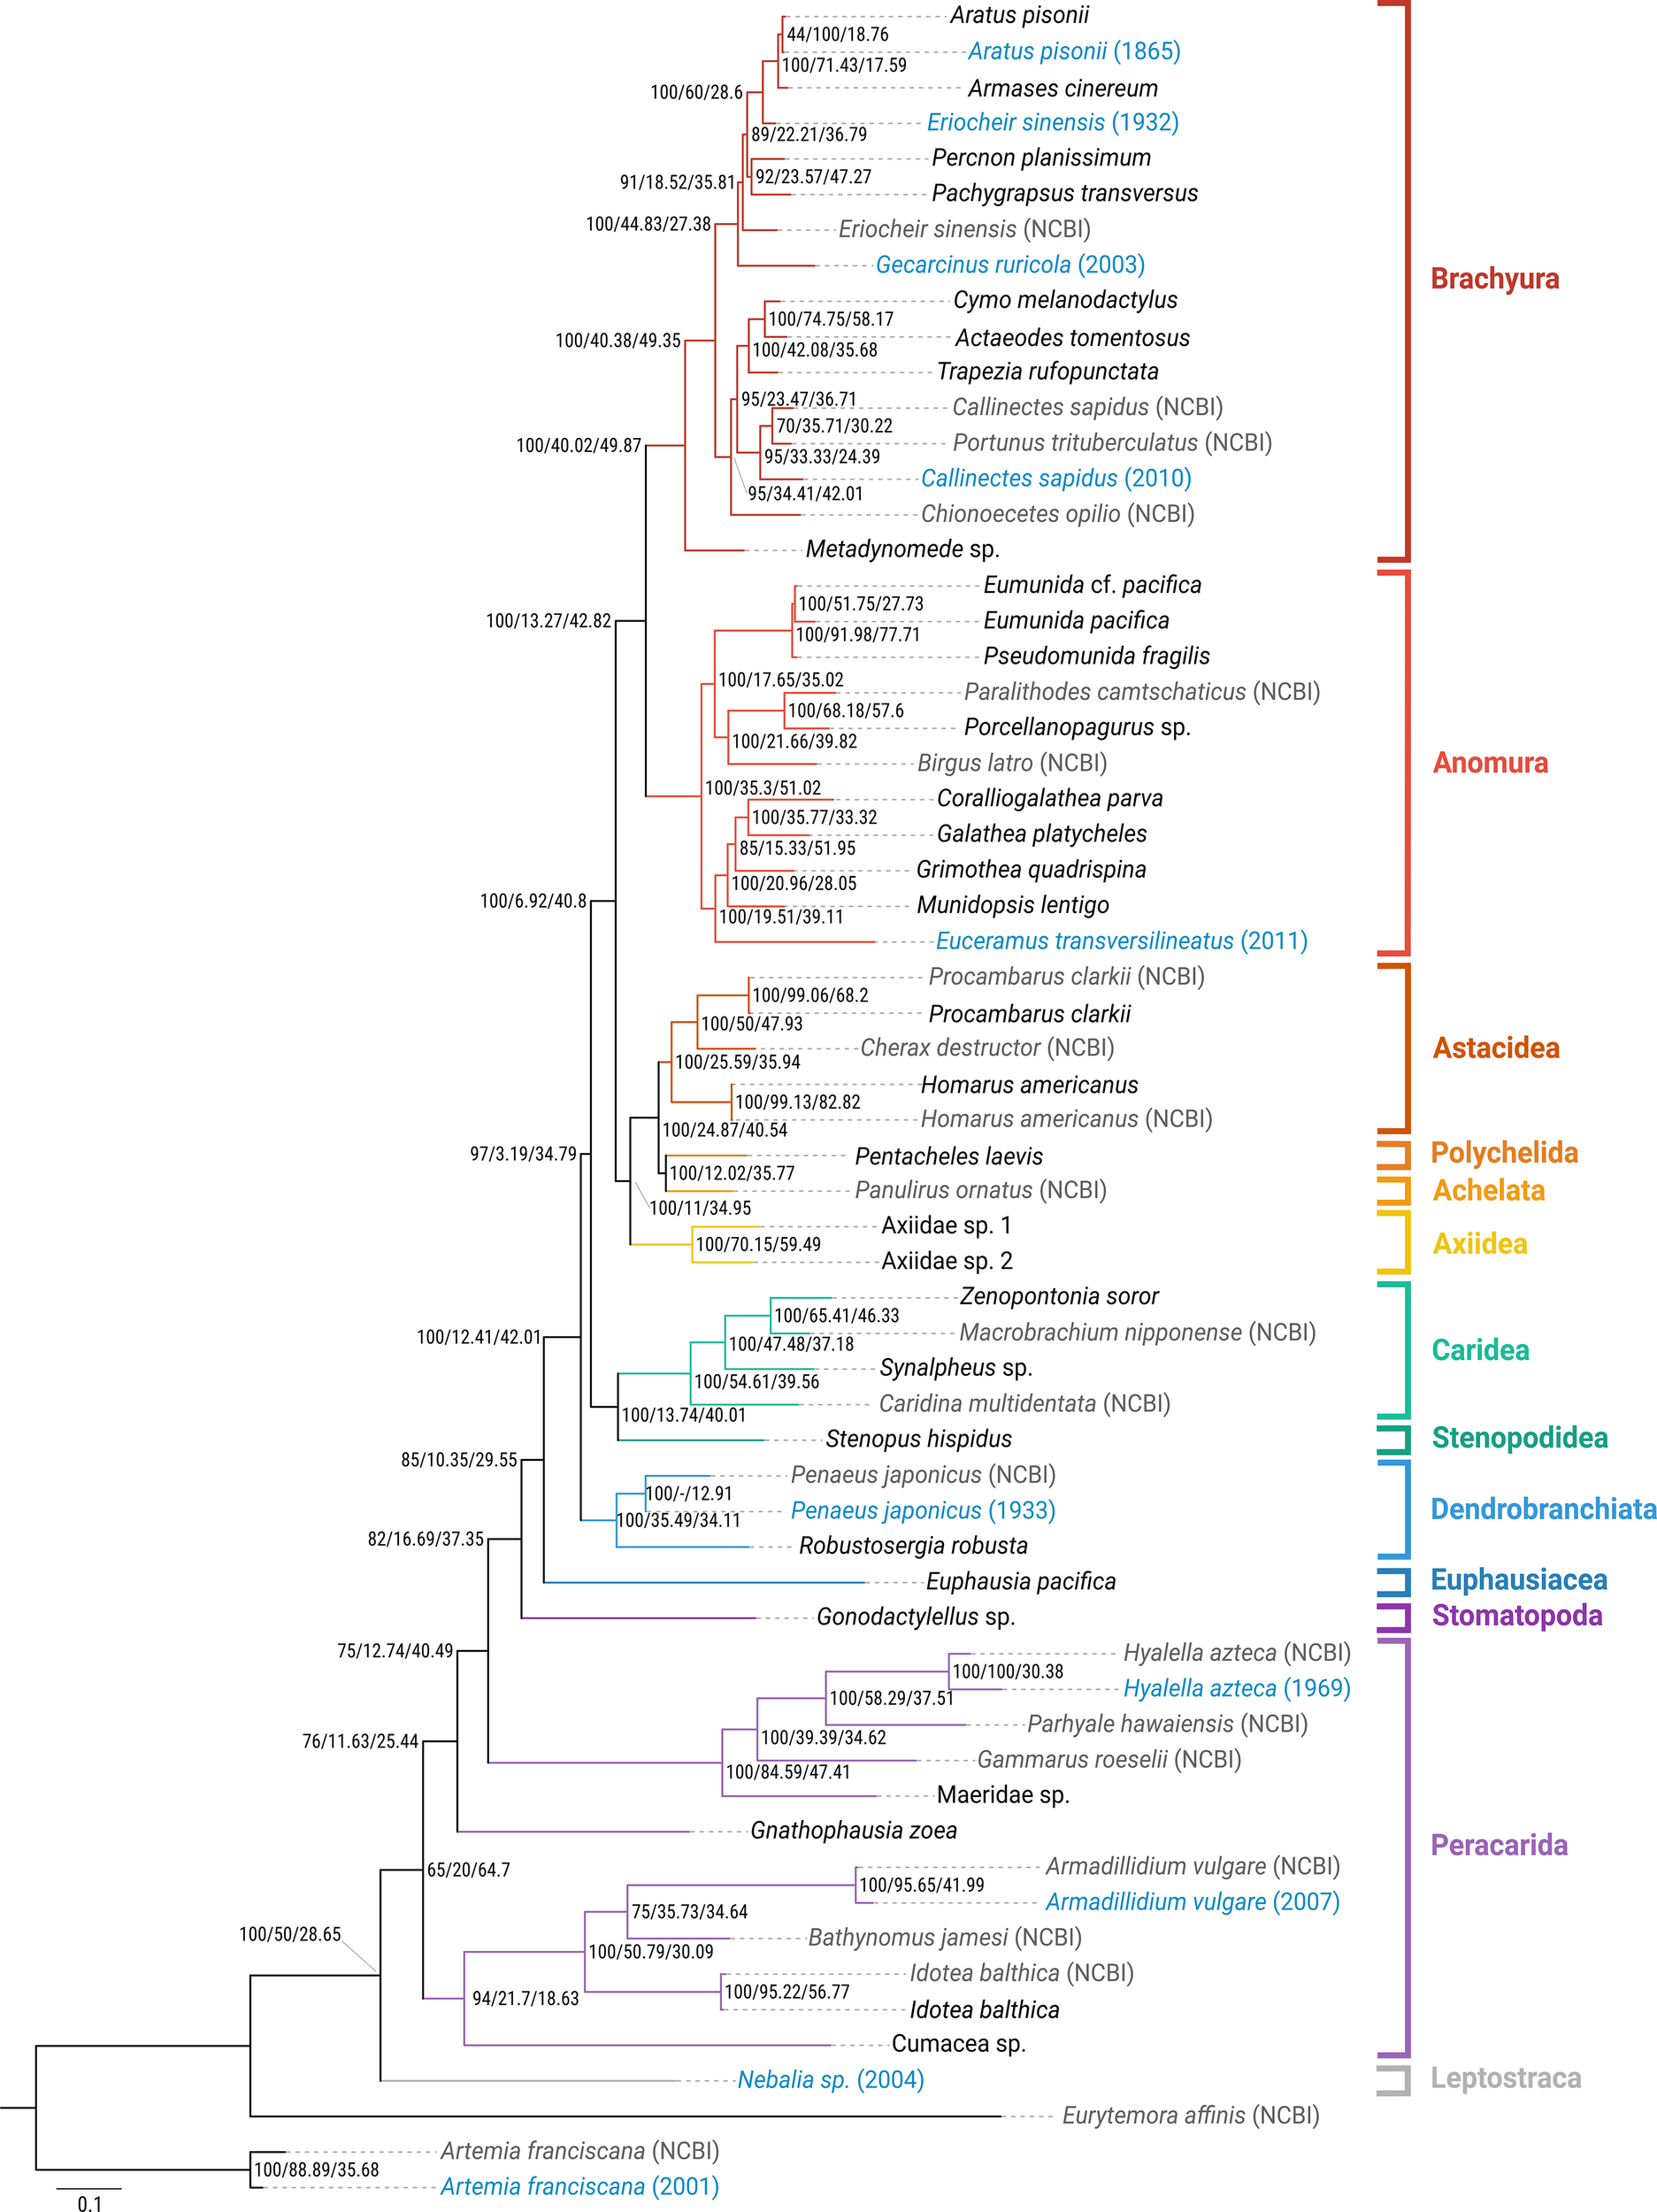
Phylogenetic hypothesis (maximum likelihood) for Malacostraca, based on a 50% occupancy matrix of 897 UCE loci. Historical samples are indicated in blue, with collection years in parentheses. In-silico samples (NCBI) are indicated in gray. Bootstrap values and concordance factors are shown for all nodes (bs/gCF/sCF).
The instability at the base of the malacostracan UCE phylogeny was also reflected by lower support for several of the deeper nodes in all topologies. The nodes grouping the major clades of the Peracarida, as well as Peradarida and Decapoda received low bootstrap (bs) support in the 50% (bs <80), and particularly the 70% occupancy matrix (bs <40), as well as gene concordance factors (gCF) mostly < 20. Also within Decapoda, gCF values were low for several of the deeper nodes (e.g., 3.19 in the 50% occupancy matrix for the node grouping Dendrobranchiata and Pleocyemata, and 6.92 for the node grouping Brachyura + Anomura and the other ‘reptant’ decapods; Figure 6), indicating that only few individual gene trees supported these nodes, despite high bootstrap support. Overall, all phylogenies showed a tendency towards decreasing nodal support (bs, and particularly gCF) in deeper nodes, and for those clades including historical samples.
The historical samples included in the dataset were largely placed at their expected positions in the phylogeny, despite a strong decrease of the number of retained loci with sample age (compare Table 2; Figure 6; Supplementary Figures S1, S2). The historical Aratus pisonii, Armadillidium vulgare, Artemia franciscana, Hyalella azteca and Penaeus japonicus samples (only included in the 50% occupancy matrix) clustered with their conspecific fresh or in-silico samples, respectively. In the 70% occupancy matrix the historical Callinectes sapidus and Eriocheir sinensis samples clustered with their conspecific in-silico samples, while the almost 20 year-old Nebalia sample, the only representative of Leptostraca in our analysis, was recovered as the sister group to all other Malacostraca only in the 50% occupancy matrix, but clustered with Euphausia pacifica in the 70% occupancy matrix and with the 25% most conserved UCEs.
4 Discussion
In this study, we present a newly designed UCE probe set initially tailored towards Decapoda, but resulting in a much broader applicability across Malacostraca. We further illustrate its applicability and effectiveness at different evolutionary scales, down to the level of populations. Over the past few years, UCEs have emerged as valuable markers for phylogenomic reconstruction and population studies due to their ability to provide large numbers of homologous loci, and to make use of fragmented DNA, as typically found in historical museum specimens. While UCE probe sets have been developed for many major taxa (e.g., Faircloth et al., 2012, 2013; Smith et al., 2014; Starrett et al., 2017; Quattrini et al., 2018; Moles and Giribet, 2021; Goulding et al., 2023; Sato et al., 2024a; van der Sprong et al., 2024), no probe set was available for any crustacean. Our research addresses this gap by introducing a specialized UCE probe set for investigating the intricate diversity within Malacostraca, with a specific emphasis on the diverse order Decapoda. It is important to note here that another study using a similar approach, anchored hybrid enrichment (AHE) has been available for a while (Wolfe et al., 2019), but such approach does not allow the easy incremental addition of samples since AHE was designed from the onset to be a proprietary technology (Lemmon et al., 2012) while UCEs operated under an open source paradigm (Faircloth et al., 2012).
We identified almost 1,400 highly conserved genomic regions between taxa of the hyperdiverse Malacostraca, and designed about 20,000 probes to target these UCEs. We tested the efficacy of this new genomic resource on three datasets representing various levels of phylogenetic depth. The mean number of UCE loci recovered from our main Malacostraca dataset of 31 fresh, 10 historical and 21 genome-derived in-silico samples (743 raw and 621 final loci in the 50% occupancy matrix, respectively), as well as mean locus length (742 bp in the raw, and 230 bp in the 50% occupancy matrix after GBlocks trimming, respectively), and the proportion of informative sites in the final alignment (48.5%) were comparable to similar-sized UCE probe sets for other invertebrate groups (e.g., Starrett et al., 2017; Quattrini et al., 2018; Moles and Giribet, 2021). Locus recovery of our probe set was also comparable to the Wolfe et al. (2019) AHE kit for Decapoda (max. 410 loci in a 60% matrix of a 94 species-dataset), while requiring a much smaller number of probes for this performance (about 20,000 vs. >50,000). It should be noted that we achieved these recovery statistics with a comparatively high proportion of historical samples in the dataset. When including fresh and in-silico samples only, locus recovery increased to a mean of 853 loci per sample in the raw, and 621 loci per sample in the final 50% occupancy matrix.
All the datasets analyzed in this study demonstrated the capability of the new probe set to capture sequence data from historical specimens, regularly highlighted as a key asset of UCEs in studies targeting various invertebrate and vertebrate taxa. We were able to recover up to 25 loci from specimens collected in 1859 (i.e., 164 years old), which are to our knowledge among the oldest used in targeted UCE sequencing studies (compare Derkarabetian et al., 2019; González-Delgado et al., 2024), and up to 68 loci from specimens collected in 1901 (see Supplementary Tables S1, S2). While the number of loci from historical specimens dropped considerably during alignment trimming and revisions, the retained loci were still informative enough to put most historical specimens to their expected phylogenetic position (Figure 6). At the same time, we observed very low locus recovery in a few samples collected less than 20 years ago (e.g. Callinectes sapidus, MCZ: IZ:23424, coll. 2010: 16 loci in 50% occupancy matrix, or Porcellanopagurus sp., MNHN-IU-2021-7149, coll. 2021: 65 loci in 50% occupancy matrix). A likely cause for the apparent lack of a clearer correlation between sample age and locus recovery is vastly varying collection, preservation, specimen size, and storage history among collection events of “standard” museum specimens, which are still mostly focused on preserving external morphology. Particularly in hard-bodied crustaceans like crabs, soft tissues usually used for DNA extraction may quickly degrade due to slow ethanol penetration through the exoskeleton, if it is not manually perforated (own observations). As fixation and storage history of specimens are oftentimes unknown and/or not reported in collection databases, the use of historical specimens for sequencing experiments will inevitably include the risk of selecting specimens that are unsuitable for molecular work (compare e.g., Wandeler et al., 2007; Bernstein and Ruane, 2022; González-Delgado et al., 2024).
Our data furthermore showed a notable broad-range applicability of the probe set across Decapoda, and even beyond, on Malacostraca. With the probe set design strongly focused on Decapoda, we consequently recovered the highest numbers of loci from samples within this group (49.1–62.4% of the total probe set for the in-silico samples, and 4.7–61.2% of the total probe set for fresh in-vitro samples in the 50% matrix), which also achieved better phylogenetic resolution and support. However, between 450 and > 1,000 loci were recovered from fresh or in-silico Euphausiacea, Stomatopoda, and several Peracarida, and still between about 200 and 450 loci from fresh and in-silico Copepoda and Branchiopoda. Capture efficiency for fresh non-decapod Malacostracan samples in the 50% matrix was 25.1%–47.4%. Thus, the probe set performed well across a vastly divergent group, spanning at least 540 million years of evolution (compare Bernot et al., 2023). In this respect, the Decapoda probe set appeared equivalent to the Arachnida probe set, spanning a similarly divergent lineage (Starrett et al., 2017), corroborating Bossert and Danforth’s (2018) findings on the universal character of UCEs. Yet, denser sampling within these outgroups to Decapoda will be needed to assess the information contained in these UCEs. At the other end of the spectrum of phylogenetic depth, the genus- (Eumunida sp.) and within species-level (Aratus pisonii) datasets showed increasing sequence variability in UCE locus alignments with increasing distance from the UCE core region, as expected (compare Figure 3). UCE capture efficiency for fresh samples in the 50% matrices of these datasets was 51.7%–68.1% (Eumunida dataset, n=4) and 55.3%–59.8% (Aratus dataset, n=18), respectively. Moreover, the UCE data fully resolved the phylogenetic relationships among the Western Indian Ocean Eumunida species with high support. The population genetic analysis of the evolutionary shallow Aratus dataset showcased the presence of SNPs in hundreds of loci captured by the probe set. While the apparent lack of geographic structure might be expected from a species with planktonic larval dispersal on such a restricted geographic range, the slight genetic differentiation detected between the oldest and the more recent specimens might hint at some temporal structure in the genetic data. Despite a relatively low proportion of variable sites in the final alignments of the Eumunida and Aratus datasets (3.1% and 2.2%, respectively), our data thus indicate the potential of the probe set for e.g., biogeographic or population genomic studies on genus- and species-level datasets. Future studies with larger datasets, as well as optimized locus trimming and filtering settings towards improved recovery of variable sites from UCE flanking regions, will further explore this potential.
The UCE-based malacostracan phylogeny demonstrated the utility of our probe set across several phylogenetic levels. Overall, the tree topologies derived from the three occupancy matrices agreed well with recent malacostracan phylogenies based on transcriptomes (Bernot et al., 2023) and mitogenomes (Höpel et al., 2022). Specifically, the focal group for probe set design, Decapoda, was recovered as monophyletic with full support by all, and most of the internal relationships within the order were congruent with Wolfe et al.’s (2019) phylogeny based on anchored hybrid enrichment (AHE) data–the only other genomic approach to crustacean phylogenetics other than transcriptomics. The only major discrepancy to previously published decapod phylogenies was the clustering of Axiidea in a clade with Astacidea, Polychelida and Achelata, instead of clustering with Anomura + Brachyura (e.g., Shen et al., 2015; Wolfe et al., 2019). However, there were some limitations regarding incongruent topologies on the deeper nodes of the Malacostraca phylogeny, most likely due to the antiquity of the group and the strong bias towards decapod taxa in both probe set design and testing, and also because taxon sampling was not optimized for non-decapod malacostracans. Further testing of this UCE set beyond Decapoda was beyond the scope of this study and remains to be further tested.
The historical samples included in the Malacostraca dataset were mostly recovered at their expected positions in the phylogenies, with single exceptions across the three matrices, e.g., Eriocheir sinensis (coll. 1932), and Callinectes sapidus (coll. 2010) not clustering with their respective conspecific in-silico samples in the 25% conserved loci and 50% matrices, or Nebalia sp. (coll. 2004) clustering with Euphausiidae in the 25% conserved loci and 70% matrices. Low DNA quantities and natural DNA degradation by biochemical processes (particularly oxidation and hydrolysis) do not only reduce locus recovery and locus lengths of historical samples (see above), but make them more prone to contamination, sequencing and assembly errors (compare McCormack et al., 2016; Derkarabetian et al., 2019). The misplacement of some historical samples may well be due to either, or a combination, of these factors. Alternatively stochastic effects of the low number and short length of recovered UCE loci may also play a role. The lower number of UCEs recovered from historical and non-decapod samples is also a potential cause for the incongruencies between tree topologies and the reduced support for many of the deeper nodes, as it reduces the number and length of single-locus trees that contain these nodes. Similarly, DNA degradation may lead to the incorporation and eventual accumulation of erroneous bases, particularly towards the edges of UCE loci, where assembly coverage is lower. While most of these erroneous bases should have been removed by the per-locus alignment trimming (see section 2.4 Bioinformatics and phylogenetic analyses), they are sometimes difficult to tell apart from “valid” mutations, leading to long branches. Finally, there is the possibility of misidentification of the GenBank in-vitro samples.
Regarding the deeper malacostracan phylogeny, the UCE loci recovered Leptostraca as the sister group to the remaining Malacostraca (only in the 50% occupancy matrix), as well as a clade including Stomatopoda, Euphausiacea and Decapoda (in all matrices), in line with the findings of Bernot et al. (2023) and Höpel et al. (2022). Peracarida, on the other hand, were not recovered as monophyletic. While their monophyly has been occasionally disputed (Richter and Scholtz, 2001; Poore, 2005; and references therein), morphological and multilocus phylogenies, as well as mitogenomic and phylotranscriptomic studies support a monophyletic Peracarida (Spears et al., 2005; Schwentner et al., 2018; Bernot et al., 2023; Höpel et al., 2022). A potential explanation for lacking monophyly of Peracarida in our data could be insufficient taxon sampling within the group (only one sample from each Cumacea and Lophogastrida, and no representatives of Mysida, Tanaidacea, and Thermosbaenacea), and strong taxon sampling bias towards Decapoda (particularly Anomura and Brachyura) in the Malacostraca dataset (compare Bernot et al., 2023). Furthermore, the fact that Peracarida were represented only by one amphipod genome in our probe set design might have caused a decrease in the number of loci that can resolve the deeper nodes within this group, which is almost as speciose as the Decapoda. We would like to stress, however, that the intention of this study was not to fully resolve phylogenetic relationships among and within malacostracan orders, but rather to provide a proof of concept, and a demonstration of the performance and utility of this new UCE probe set. Future analyses including more outgroup and ingroup taxa will focus on peracarid relationships to further test this clade.
Overall, our data provide strong evidence for the versatility of the UCE probe set we present in this study, mostly within the focal group of probe set design for Decapoda, but also shows potential across the highly divergent Malacostraca. They highlight the universality of the targeted probes and their ability to recover deep phylogenetic relationships, and genetic variation from taxonomically shallow datasets alike. They furthermore demonstrate the utility of the probe set to extract informative sequence data from historical museum specimens. This is particularly beneficial for studies including rare, or difficult to sample species, such as deep-sea crustaceans, as many of them will only be available as historical museum specimens. Therefore, we expect our probe set to become a valuable and affordable resource for targeted sequencing studies across multiple taxonomic levels and along varying lines of research, including biodiversity research and conservation genetics (e.g., Derkarabetian et al., 2022; Benham and Bowie, 2023). This probe set should therefore allow researchers to explore a wide range of evolutionary and population studies within one of the most diverse and economically significant marine invertebrate taxa.
Statements
Data availability statement
The datasets presented in this study can be found in online repositories. The names of the repository/repositories and accession number(s) can be found below: https://www.ncbi.nlm.nih.gov/, PRJNA988117, Harvard Dataverse, https://doi.org/10.7910/DVN/WASGMF.
Ethics statement
The manuscript presents research on animals that do not require ethical approval for their study.
Author contributions
JG: Writing – review & editing, Writing – original draft, Visualization, Methodology, Investigation, Funding acquisition, Formal analysis, Data curation, Conceptualization. PR-F: Writing – review & editing, Writing – original draft, Investigation, Funding acquisition, Formal analysis, Data curation. SD: Writing – review & editing, Methodology, Conceptualization. GG: Writing – review & editing, Supervision, Resources, Funding acquisition, Conceptualization.
Funding
The author(s) declare financial support was received for the research, authorship, and/or publication of this article. Funding for this study was provided by a Walter-Benjamin postdoctoral fellowship from the Deutsche Forschungsgemeinschaft (DFG, German Research Foundation) to JG (project number 447933028), by a Biodiversity Postdoctoral Fellowship from the Museum of Comparative Zoology, Harvard University (MCZ) to PR-F, as well as by Putnam Expedition Grants from the MCZ to JG and PR-F for collecting specimens in Florida and on Guam. Lab work and sequencing were financially supported by internal funds from the MCZ.
Acknowledgments
We thank Claire Hartmann of the Bauer Core Facility at Harvard University for her great help in troubleshooting and optimizing sequencing results. Héctor Torrado and David Combosch supported us during field work on Guam, as did Linnea and Sinikka Lennartz during field work in Florida. The historical specimens used in this study were provided in addition to the Museum of Comparative Zoology, by the Muséum national d’Histoire naturelle, the US National Museum of Natural History, the Florida Museum of Natural History, and the California Academy of Sciences, and we thank all curators who generously granted our loan and sampling requests including Laure Corbari, Paula Martin-Lefèvre, Martha Nizinski, Gustav Paulay, Christina Piotrowski, and Karen Reed. PR-F is grateful for Laure Corbari’s and Paula Martin-Lefèvre’s hospitality during her stays at the crustacean collection of the MNHN in Paris.
Conflict of interest
The authors declare that the research was conducted in the absence of any commercial or financial relationships that could be construed as a potential conflict of interest.
Publisher’s note
All claims expressed in this article are solely those of the authors and do not necessarily represent those of their affiliated organizations, or those of the publisher, the editors and the reviewers. Any product that may be evaluated in this article, or claim that may be made by its manufacturer, is not guaranteed or endorsed by the publisher.
Supplementary material
The Supplementary Material for this article can be found online at: https://www.frontiersin.org/articles/10.3389/fmars.2024.1429314/full#supplementary-material
Supplementary Figure 1Phylogenetic hypothesis (maximum-likelihood) for Malacostraca, based on a partitioned analysis of the 25% most conserved loci in the 50% occupancy matrix of the Malacostraca dataset (224 UCEs, selected by average pairwise identity among samples). Historical samples are in blue (with collection years), in-silico samples “(NCBI)” are in grey. For each node, bootstrap value, gene- and site-concordance factors are given (bs/gCF/sCF).
Supplementary Figure 2Phylogenetic hypothesis (maximum-likelihood) for Malacostraca, based on a partitioned analysis of a 70% occupancy matrix of 110 UCEs. Historical samples are in blue (with collection years), in-silico samples “(NCBI)” are in grey. For each node, bootstrap value, gene- and site-concordance factors are given (bs/gCF/sCF).
Supplementary Figure 3Posterior probabilities of population assignment of the specimens in the Aratus dataset, based on DAPC results. Colors represent assignment probability from 1 (red) to 0 (white), blue crosses indicate the actual sampling population.
Supplementary Table 1Assembly and UCE extraction summary statistics for the Eumunida dataset, including the number of assembled contigs, the number of raw UCE loci recovered from contigs, the length of the raw UCE loci, and the final number of UCE loci in a 50% occupancy matrix after trimming and filtering. Small letters appended to voucher numbers (a or b) denote different individuals from multi-specimen lots.
Supplementary Table 2Assembly and UCE extraction summary statistics for the Aratus dataset, including sampling locality, the number of assembled contigs, the number of raw UCE loci recovered from contigs, the length of the raw UCE loci, and the final number of UCE loci in a 50% occupancy matrix after trimming and filtering. Small letters appended to voucher numbers (a to e) denote different individuals from multi-specimen lots. Specimens with an asterisk were excluded from the SNP analysis due to high amounts of missing data.
Supplementary Table 3SNP-based pairwise FST values between six populations of Aratus pisonii in southeastern Florida (the Aratus dataset). The values in the last column (Population-specific FST) indicate whether the contribution of a specific population to the overall population differentiation is higher (population-specific FST > 0) or lower (population-specific FST < 0) than the mean contribution across all populations.
References
1
Ballesteros J. A. Setton E. V. W. Santibáñez-López C. E. Arango C. P. Brenneis G. Brix S. et al . (2021). Phylogenomic resolution of sea spider diversification through integration of multiple data classes. Mol. Biol. Evol.38, 686–701. doi: 10.1093/molbev/msaa228
2
Bejerano G. Pheasant M. Makunin I. Stephen S. Kent W. J. Mattick J. S. et al . (2004). Ultraconserved elements in the human genome. Science304, 1321–1325. doi: 10.1126/science.1098119
3
Benham P. M. Bowie R. C. K. (2023). Natural history collections as a resource for conservation genomics: Understanding the past to preserve the future. J. Hered.114, 367–384. doi: 10.1093/jhered/esac066
4
Bernot J. P. Owen C. L. Wolfe J. M. Meland K. Olesen J. Crandall K. A. (2023). Major revisions in pancrustacean phylogeny and evidence of sensitivity to taxon sampling. Mol. Biol. Evol.40, msad175. doi: 10.1093/molbev/msad175
5
Bernstein J. M. Ruane S. (2022). Maximizing molecular data from low-quality fluid-preserved specimens in natural history collections. Front. Ecol. Evol.10. doi: 10.3389/fevo.2022.893088
6
Blaimer B. B. Lloyd M. W. Guillory W. X. Brady S. G. (2016). Sequence capture and phylogenetic utility of genomic ultraconserved elements obtained from pinned insect specimens. PloS One11, e0161531. doi: 10.1371/journal.pone.0161531
7
Bolger A. M. Lohse M. Usadel B. (2014). Trimmomatic: a flexible trimmer for Illumina sequence data. Bioinformatics30, 2114–2120. doi: 10.1093/bioinformatics/btu170
8
Bossert S. Danforth B. N. (2018). On the universality of target-enrichment baits for phylogenomic research. Methods Ecol. Evol.9, 1453–1460. doi: 10.1111/2041-210X.12988
9
Boyer S. L. Dohr S. R. Tuffield M. S. Shu Y. Moore C. D. Hahn K. M. et al . (2022). Diversity and distribution of the New Zealand endemic mite harvestman genus Aoraki (Arachnida, Opiliones, Cyphophthalmi, Pettalidae), with the description of two new species. Invertebr. Syst.36, 372–387. doi: 10.1071/IS21044
10
Castresana J. (2000). Selection of conserved blocks from multiple alignments for their use in phylogenetic analysis. Mol. Biol. Evol.17, 540–552. doi: 10.1093/oxfordjournals.molbev.a026334
11
Chernomor O. von Haeseler A. Minh B. Q. (2016). Terrace aware data structure for phylogenomic inference from supermatrices. Syst. Biol.65, 997–1008. doi: 10.1093/sysbio/syw037
12
Cowman P. F. Quattrini A. M. Bridge T. C. L. Watkins-Colwell G. J. Fadli N. Grinblat M. et al . (2020). An enhanced target-enrichment bait set for Hexacorallia provides phylogenomic resolution of the staghorn corals (Acroporidae) and close relatives. Mol. Phylogenet. Evol.153, 106944. doi: 10.1016/j.ympev.2020.106944
13
de Miranda G. S. Kulkarni S. S. Tagliatela J. Baker C. M. Giupponi A. P. L. Labarque F. M. et al . (2024). The rediscovery of a relict unlocks the first global phylogeny of whip spiders (Amblypygi). Syst. Biol.73, 495–505. doi: 10.1093/sysbio/syae021
14
Derkarabetian S. Benavides L. R. Giribet G. (2019). Sequence capture phylogenomics of historical ethanol–preserved museum specimens: Unlocking the rest of the vault. Mol. Ecol. Resour.19, 1531–1544. doi: 10.1111/1755-0998.13072
15
Derkarabetian S. Paquin P. Reddell J. Hedin M. (2022). Conservation genomics of federally endangered Texella harvester species (Arachnida, Opiliones, Phalangodidae) from cave and karst habitats of central Texas. Conserv. Genet.23, 401–416. doi: 10.1007/s10592-022-01427-9
16
Derkarabetian S. Starrett J. Tsurusaki N. Ubick D. Castillo S. Hedin M. (2018). A stable phylogenomic classification of Travunioidea (Arachnida, Opiliones, Laniatores) based on sequence capture of ultraconserved elements. ZooKeys760, 1–36. doi: 10.3897/zookeys.760.24937
17
Faircloth B. C. (2013). Illumiprocessor: a trimmomatic wrapper for parallel adapter and quality trimming. Available at: https://github.com/faircloth-lab/illumiprocessor. doi: 10.6079/J9ILL.
18
Faircloth B. C. (2016). PHYLUCE is a software package for the analysis of conserved genomic loci. Bioinformatics32, 786–788. doi: 10.1093/bioinformatics/btv646
19
Faircloth B. C. (2017). Identifying conserved genomic elements and designing universal bait sets to enrich them. Methods Ecol. Evol.8, 1103–1112. doi: 10.1111/2041-210X.12754
20
Faircloth B. C. McCormack J. E. Crawford N. G. Harvey M. G. Brumfield R. T. Glenn T. C. (2012). Ultraconserved elements anchor thousands of genetic markers spanning multiple evolutionary timescales. Syst. Biol.61, 717–726. doi: 10.1093/sysbio/sys004
21
Faircloth B. C. Sorenson L. Santini F. Alfaro M. E. (2013). A phylogenomic perspective on the radiation of ray-finned fishes based upon targeted sequencing of ultraconserved elements (UCEs). PloS One8, e65923. doi: 10.1371/journal.pone.0065923
22
Glenn T. C. Nilsen R. A. Kieran T. J. Sanders J. G. Bayona-Vásquez N. J. Finger J. W. et al . (2019). Adapterama I: universal stubs and primers for 384 unique dual-indexed or 147,456 combinatorially-indexed Illumina libraries (iTru & iNext). PeerJ7, e7755. doi: 10.7717/peerj.7755
23
Glon H. Quattrini A. Rodríguez E. Titus B. M. Daly M. (2021). Comparison of sequence-capture and ddRAD approaches in resolving species and populations in hexacorallian anthozoans. Mol. Phylogenet. Evol.163, 107233. doi: 10.1016/j.ympev.2021.107233
24
Gonzalez B. Martínez A. Institute for Water Research Italian National Research Council Olesen J. Truskey S. B. et al . (2020). Anchialine biodiversity in the Turks and Caicos Islands: New discoveries and current faunal composition. Int. J. Speleol.49, 71–86. doi: 10.5038/1827-806X.49.2.2316
25
González-Delgado S. Rodríguez-Flores P. C. Giribet G. (2024). Testing ultraconserved elements (UCEs) for phylogenetic inference across bivalves (Mollusca: Bivalvia). Mol. Phylogenet. Evol.198, 108129. doi: 10.1016/j.ympev.2024.108129
26
Goudet J. Jombart T. (2022). hierfstat: estimation and tests of hierarchical F-statistics. Available online at: https://CRAN.R-project.org/package=hierfstat. (Accessed August 15, 2024).
27
Goulding T. C. Strong E. E. Quattrini A. M. (2023). Target-capture probes for phylogenomics of the Caenogastropoda. Mol. Ecol. Resour.23, 1372–1388. doi: 10.1111/1755-0998.13793
28
Grüning B. Dale R. Sjödin A. Chapman B. A. Rowe J. Tomkins-Tinch C. H. et al . (2018). Bioconda: sustainable and comprehensive software distribution for the life sciences. Nat. Methods15, 475–476. doi: 10.1038/s41592-018-0046-7
29
Hedin M. Derkarabetian S. Alfaro A. Ramírez M. J. Bond J. E. (2019). Phylogenomic analysis and revised classification of atypoid mygalomorph spiders (Araneae, Mygalomorphae), with notes on arachnid ultraconserved element loci. PeerJ7, e6864. doi: 10.7717/peerj.6864
30
Hedin M. Foldi S. Rajah-Boyer B. (2020). Evolutionary divergences mirror Pleistocene paleodrainages in a rapidly-evolving complex of oasis-dwelling jumping spiders (Salticidae, Habronattus tarsalis). Mol. Phylogenet. Evol.144, 106696. doi: 10.1016/j.ympev.2019.106696
31
Hoang D. T. Chernomor O. von Haeseler A. Minh B. Q. Vinh L. S. (2018). Ufboot2: improving the ultrafast bootstrap approximation. Mol. Biol. Evol.35, 518–522. doi: 10.1093/molbev/msx281
32
Höpel C. G. Yeo D. Grams M. Meier R. Richter S. (2022). Mitogenomics supports the monophyly of Mysidacea and Peracarida (Malacostraca). Zool. Scr.51, 603–613. doi: 10.1111/zsc.12554
33
Hou Z. Sket B. Li S. (2014). Phylogenetic analyses of Gammaridae crustacean reveal different diversification patterns among sister lineages in the Tethyan region. Cladistics30, 352–365. doi: 10.1111/cla.12055
34
Huang W. Li L. Myers J. R. Marth G. T. (2012). ART: a next-generation sequencing read simulator. Bioinformatics28, 593–594. doi: 10.1093/bioinformatics/btr708
35
Jombart T. Ahmed I. (2011). adegenet 1.3-1 : new tools for the analysis of genome-wide SNP data. Bioinformatics27, 3070–3071. doi: 10.1093/bioinformatics/btr521
36
Jombart T. Devillard S. Balloux F. (2010). Discriminant analysis of principal components: A new method for the analysis of genetically structured populations. BMC Genet.11, 94. doi: 10.1186/1471-2156-11-94
37
Kalyaanamoorthy S. Minh B. Q. Wong T. K. F. von Haeseler A. Jermiin L. S. (2017). ModelFinder: fast model selection for accurate phylogenetic estimates. Nat. Methods14, 587–589. doi: 10.1038/nmeth.4285
38
Katoh K. Standley D. M. (2013). Mafft multiple sequence alignment software version 7: improvements in performance and usability. Mol. Biol. Evol.30, 772–780. doi: 10.1093/molbev/mst010
39
Kearse M. Moir R. Wilson A. Stones-Havas S. Cheung M. Sturrock S. et al . (2012). Geneious Basic: An integrated and extendable desktop software platform for the organization and analysis of sequence data. Bioinformatics28, 1647–1649. doi: 10.1093/bioinformatics/bts199
40
Kent W. J. (2002). BLAT—The BLAST-like alignment tool. Genome Res.12, 656–664. doi: 10.1101/gr.229202
41
Lanfear R. Calcott B. Ho S. Y. W. Guindon S. (2012). Partitionfinder: combined selection of partitioning schemes and substitution models for phylogenetic analyses. Mol. Biol. Evol.29, 1695–1701. doi: 10.1093/molbev/mss020
42
Lemmon A. R. Emme S. A. Lemmon E. M. (2012). Anchored hybrid enrichment for massively high-throughput phylogenomics. Syst. Biol.61, 727–744. doi: 10.1093/sysbio/sys049
43
Letunic I. Bork P. (2021). Interactive Tree Of Life (iTOL) v5: an online tool for phylogenetic tree display and annotation. Nucleic Acids Res.49, W293–W296. doi: 10.1093/nar/gkab301
44
Li H. Handsaker B. Wysoker A. Fennell T. Ruan J. Homer N. et al . (2009). The sequence alignment/map format and SAMtools. Bioinforma. Oxf. Engl.25, 2078–2079. doi: 10.1093/bioinformatics/btp352
45
Lozano-Fernandez J. Giacomelli M. Fleming J. F. Chen A. Vinther J. Thomsen P. F. et al . (2019). Pancrustacean evolution illuminated by taxon-rich genomic-scale data sets with an expanded remipede sampling. Genome Biol. Evol.11, 2055–2070. doi: 10.1093/gbe/evz097
46
Lunter G. Goodson M. (2011). Stampy: A statistical algorithm for sensitive and fast mapping of Illumina sequence reads. Genome Res.21, 936–939. doi: 10.1101/gr.111120.110
47
McCormack J. E. Faircloth B. C. Crawford N. G. Gowaty P. A. Brumfield R. T. Glenn T. C. (2012). Ultraconserved elements are novel phylogenomic markers that resolve placental mammal phylogeny when combined with species-tree analysis. Genome Res.22, 746–754. doi: 10.1101/gr.125864.111
48
McCormack J. E. Tsai W. L. E. Faircloth B. C. (2016). Sequence capture of ultraconserved elements from bird museum specimens. Mol. Ecol. Resour.16, 1189–1203. doi: 10.1111/1755-0998.12466
49
Minh B. Q. Hahn M. W. Lanfear R. (2020b). New methods to calculate concordance factors for phylogenomic datasets. Mol. Biol. Evol.37, 2727–2733. doi: 10.1093/molbev/msaa106
50
Minh B. Q. Schmidt H. A. Chernomor O. Schrempf D. Woodhams M. D. von Haeseler A. et al . (2020a). IQ-TREE 2: new models and efficient methods for phylogenetic inference in the genomic era. Mol. Biol. Evol.37, 1530–1534. doi: 10.1093/molbev/msaa015
51
Mo Y. K. Lanfear R. Hahn M. W. Minh B. Q. (2023). Updated site concordance factors minimize effects of homoplasy and taxon sampling. Bioinformatics39, btac741. doi: 10.1093/bioinformatics/btac741
52
Moles J. Giribet G. (2021). A polyvalent and universal tool for genomic studies in gastropod molluscs (Heterobranchia). Mol. Phylogenet. Evol.155, 106996. doi: 10.1016/J.YMPEV.2020.106996
53
Page A. J. Taylor B. Delaney A. J. Soares J. Seemann T. Keane J. A. et al . (2016). SNP-sites: rapid efficient extraction of SNPs from multi-FASTA alignments. Microb. Genomics2, e000056. doi: 10.1099/mgen.0.000056
54
Patel T. Robert H. D’Udekem D’Acoz C. Martens K. De Mesel I. Degraer S. et al . (2020). Biogeography and community structure of abyssal scavenging Amphipoda (Crustacea) in the Pacific Ocean. Biogeosciences17, 2731–2744. doi: 10.5194/bg-17-2731-2020
55
Poore G. C. B. (2005). Peracarida: monophyly, relationships and evolutionary success. Nauplius13, 1–27.
56
Prjibelski A. Antipov D. Meleshko D. Lapidus A. Korobeynikov A. (2020). Using SPAdes de novo assembler. Curr. Protoc. Bioinforma.70, e102. doi: 10.1002/cpbi.102
57
Quattrini A. M. Faircloth B. C. Dueñas L. F. Bridge T. C. L. Brugler M. R. Calixto-Botía I. F. et al . (2018). Universal target-enrichment baits for anthozoan (Cnidaria) phylogenomics: New approaches to long-standing problems. Mol. Ecol. Resour.18, 281–295. doi: 10.1111/1755-0998.12736
58
Quinlan A. R. Hall I. M. (2010). BEDTools: a flexible suite of utilities for comparing genomic features. Bioinformatics26, 841–842. doi: 10.1093/bioinformatics/btq033
59
Raxworthy C. J. Smith B. T. (2021). Mining museums for historical DNA: advances and challenges in museomics. Trends Ecol. Evol.36, 1049–1060. doi: 10.1016/j.tree.2021.07.009
60
Richter S. Scholtz (2001). Phylogenetic analysis of the malacostraca (Crustacea). J. Zool. Syst. Evol. Res.39, 113–136. doi: 10.1046/j.1439-0469.2001.00164.x
61
Rohland N. Reich D. (2012). Cost-effective, high-throughput DNA sequencing. Genome Res. 22, 939–946. doi: 10.1101/gr.128124.111
62
Sato S. Derkarabetian S. Lord A. Giribet G. (2024a). An ultraconserved element probe set for velvet worms (Onychophora). Mol. Phylogenet. Evol.197, 108115. doi: 10.1016/j.ympev.2024.108115
63
Sato S. Derkarabetian S. Valdez-Mondragón A. Pérez-González A. Benavides L. R. Daniels S. R. et al . (2024b). Under the hood: Phylogenomics of hooded tick spiders (Arachnida, Ricinulei) uncovers discordance between morphology and molecules. Mol. Phylogenet. Evol.193, 108026. doi: 10.1016/j.ympev.2024.108026
64
Schram F. R. (1982). “The fossil record and evolution of Crustacea," in The Biology of the Crustacea, vol. 1, ed. AbeleL. G. (New York City, NY: Academic Press), 93–147.
65
Schwentner M. Combosch D. J. Pakes Nelson J. Giribet G. (2017). A phylogenomic solution to the origin of insects by resolving crustacean-hexapod relationships. Curr. Biol.27, 1818–1824.e5. doi: 10.1016/j.cub.2017.05.040
66
Schwentner M. Richter S. Rogers D. C. Giribet G. (2018). Tetraconatan phylogeny with special focus on Malacostraca and Branchiopoda: highlighting the strength of taxon-specific matrices in phylogenomics. Proc. R. Soc B Biol. Sci.285, 20181524. doi: 10.1098/rspb.2018.1524
67
Shen X. Tian M. Yan B. Chu K. (2015). Phylomitogenomics of malacostraca (Arthropoda: crustacea). Acta Oceanol. Sin.34, 84–92. doi: 10.1007/s13131-015-0583-1
68
Smith B. T. Harvey M. G. Faircloth B. C. Glenn T. C. Brumfield R. T. (2014). Target capture and massively parallel sequencing of ultraconserved elements for comparative studies at shallow evolutionary time scales. Syst. Biol.63, 83–95. doi: 10.1093/SYSBIO/SYT061
69
Spears T. DeBry R. W. Abele L. G. Chodyla K. (2005). Peracarid monophyly and interordinal phylogeny inferred from nuclear small-subunit ribosomal DNA sequences (Crustacea: Malacostraca: Peracarida). Proc. Biol. Soc Wash.118, 117–157. doi: 10.2988/0006-324X(2005)118[117:PMAIPI]2.0.CO;2
70
Starrett J. Derkarabetian S. Hedin M. Bryson R. W. McCormack J. E. Faircloth B. C. (2017). High phylogenetic utility of an ultraconserved element probe set designed for Arachnida. Mol. Ecol. Resour.17, 812–823. doi: 10.1111/1755-0998.12621
71
Streicher J. W. Wiens J. J. (2017). Phylogenomic analyses of more than 4000 nuclear loci resolve the origin of snakes among lizard families. Biol. Lett.13, 20170393. doi: 10.1098/rsbl.2017.0393
72
Swan J. A. Jamieson A. J. Linley T. D. Yancey P. H. (2021). Worldwide distribution and depth limits of decapod crustaceans (Penaeoidea, Oplophoroidea) across the abyssal-hadal transition zone of eleven subduction trenches and five additional deep-sea features. J. Crustac. Biol.41, 1–13. doi: 10.1093/jcbiol/ruaa102
73
Talavera G. Castresana J. (2007). Improvement of phylogenies after removing divergent and ambiguously aligned blocks from protein sequence alignments. Syst. Biol.56, 564–577. doi: 10.1080/10635150701472164
74
Tin M. M. Y. Economo E. P. Mikheyev A. S. (2014). Sequencing degraded DNA from non-destructively sampled museum specimens for RAD-tagging and low-coverage shotgun phylogenetics. PloS One9, e96793. doi: 10.1371/journal.pone.0096793
75
Tsang C. T. T. Schubart C. D. Chu K. H. Ng P. K. L. Tsang L. M. (2022). Molecular phylogeny of Thoracotremata crabs (Decapoda, Brachyura): Toward adopting monophyletic superfamilies, invasion history into terrestrial habitats and multiple origins of symbiosis. Mol. Phylogenet. Evol.177, 107596. doi: 10.1016/j.ympev.2022.107596
76
Tumescheit C. Firth A. E. Brown K. (2022). CIAlign: A highly customisable command line tool to clean, interpret and visualise multiple sequence alignments. PeerJ10, e12983. doi: 10.7717/peerj.12983
77
van der Sprong J. de Voogd N. J. McCormack G. P. Sandoval K. Schätzle S. Voigt O. et al . (2024). A novel target-enriched multilocus assay for sponges (Porifera): Red Sea Haplosclerida (Demospongiae) as a test case. Mol. Ecol. Resour.24, e13891. doi: 10.1111/1755-0998.13891
78
Vinciguerra N. T. Tsai W. L. E. Faircloth B. C. McCormack J. E. (2019). Comparison of ultraconserved elements (UCEs) to microsatellite markers for the study of avian hybrid zones: a test in Aphelocoma jays. BMC Res. Notes12, 456. doi: 10.1186/s13104-019-4481-z
79
Wandeler P. Hoeck P. E. A. Keller L. F. (2007). Back to the future: museum specimens in population genetics. Trends Ecol. Evol.22, 634–642. doi: 10.1016/j.tree.2007.08.017
80
Wolfe J. M. Ballou L. Luque J. Watson-Zink V. M. Ahyong S. T. Barido-Sottani J. et al . (2023). Convergent adaptation of true crabs (Decapoda: Brachyura) to a gradient of terrestrial environments. Syst. Biol.73, 247–262. doi: 10.1093/sysbio/syad066
81
Wolfe J. M. Breinholt J. W. Crandall K. A. Lemmon A. R. Lemmon E. M. Timm L. E. et al . (2019). A phylogenomic framework, evolutionary timeline and genomic resources for comparative studies of decapod crustaceans. Proc. R. Soc B Biol. Sci.286, 20190079. doi: 10.1098/rspb.2019.0079
82
Zhang Y. M. Williams J. L. Lucky A. (2019). Understanding UCEs: a comprehensive primer on using ultraconserved elements for arthropod phylogenomics. Insect Syst. Divers.3, 1–12. doi: 10.1093/ISD/IXZ016
Summary
Keywords
Arthropoda, UCEs, Brachyura, phylogenomics, population genetics
Citation
Geburzi JC, Rodríguez-Flores PC, Derkarabetian S and Giribet G (2024) From the shallows to the depths: a new probe set to target ultraconserved elements for Decapoda and other Malacostraca. Front. Mar. Sci. 11:1429314. doi: 10.3389/fmars.2024.1429314
Received
07 May 2024
Accepted
30 August 2024
Published
20 September 2024
Volume
11 - 2024
Edited by
Rachael Peart, National Institute of Water and Atmospheric Research (NIWA), New Zealand
Reviewed by
Ka Yan Ma, Sun Yat-sen University, China
Danielle M. DeLeo, Florida International University, United States
Updates
Copyright
© 2024 Geburzi, Rodríguez-Flores, Derkarabetian and Giribet.
This is an open-access article distributed under the terms of the Creative Commons Attribution License (CC BY). The use, distribution or reproduction in other forums is permitted, provided the original author(s) and the copyright owner(s) are credited and that the original publication in this journal is cited, in accordance with accepted academic practice. No use, distribution or reproduction is permitted which does not comply with these terms.
*Correspondence: Jonas C. Geburzi, jonas.geburzi@leibniz-zmt.de
†Present addresses: Paula C. Rodríguez-Flores, Department of Invertebrate Zoology, National Museum of Natural History, Washington, DC, United States; Shahan Derkarabetian, Department of Entomology, San Diego Natural History Museum, San Diego, CA, United States
Disclaimer
All claims expressed in this article are solely those of the authors and do not necessarily represent those of their affiliated organizations, or those of the publisher, the editors and the reviewers. Any product that may be evaluated in this article or claim that may be made by its manufacturer is not guaranteed or endorsed by the publisher.