Abstract
We deployed 8 surface drifters in the western North Pacific in 2022. By integrating the Global Drifter Program’s data, we analyzed the drifter-based sea surface currents and temperatures during tropical cyclones. The maximum in-situ surface current observed was 0.70 m/s during typhoon Hinnamnor. Our surface drifters provided similar observations as compared to an adjacent Global Drifter Program’s drifter. Furthermore, we investigated float profiling observations during tropical cyclones. Based on Argo float 2903647, the SST decreased by 1.4oC after the passage of typhoon Hinnamnor. This study demonstrates the reliability of our newly deployed surface drifters and exhibits the state-of-the-art capability for in-situ observations of tropical cyclone-ocean interaction.
1 Introduction
Tropical cyclones (TCs) typically originate in warm sea surface conditions (Gray, 1998). The ocean’s response to TCs is intense, particularly on surface currents and temperatures (Price, 1981; Lenain and Melville, 2014). Significant cooling of sea surface temperature is mainly observed around TC paths (Oey, 2023). Observing the ocean’s response and its feedback to TCs is crucial for understanding extreme air-sea interactions (Prasad and Hogan, 2007; Cao et al., 2022; Li et al., 2023), as well as for operational TC forecasting (Bender et al., 2007).
Strong ocean currents pose a significant risk to ocean engineering structures (Tavakoli et al., 2023), yet they also offer opportunities for renewable energy generation. Satellite altimeters provide a solution for measuring geostrophic currents (Deng, 2016). Additionally, the Geostationary Ocean Color Imager serves as a high resolution foundation for retrieving surface currents (Choi and Kim, 2018). High-frequency radar is widely employed for surface current measurements at scales of 100 km (Röhrs et al., 2015). However, in-situ sensor measurements of ocean currents are relatively costly (Sanford et al., 2011; He et al., 2022). Lagrangian tracking offers an alternative method for computing surface currents, leveraging satellite-based positioning systems, which are relatively reliable in terms of limited position error and real-time data transmission (Hansen and Poulain, 1996; Lumpkin and Johnson, 2013). Therefore, surface drifters, which measure Lagrangian currents, are widely used for in-situ surface current estimation (Laurindo et al., 2017).
TC-induced surface currents can reach speeds as high as 1 m/s (Fan et al., 2022; Yu et al., 2020). Surface drifters have been used to describe the spatial pattern of surface currents during TC events (Chang et al., 2013). However, the sparse distribution of surface drifters limits their ability to fully resolve TC cases (Chen et al., 2021; He et al., 2024). Therefore, additional surface drifters are required for more detailed TC case studies.
Recently, we deployed 8 surface drifters in the western North Pacific, each equipped with following advantageous features:
-
The data were transmitted to land in real-time.
-
The temporal resolution is as high as hourly.
Some of our drifters are influenced by TCs, however, their reliability for TC observation remains uncertain. This paper is largely motivated by this uncertainty. We aim to compare the measurement of our drifters with that of other drifters. On the other hand, in 2022, typhoon Hinnamnor proved to be particularly challenging due to its unpredictable nature. The unusual meridional turning in the western North Pacific presented a significant obstacle for track forecasting (Wang et al., 2023b, 2023a). Air-sea interaction likely contributed to its intensity change. Notably, our drifters were deployed during this typhoon event. Cases like Hinnamnor, characterized by sudden changes in track, warrant special attention and study (Zhang et al., 2023).
The dynamics of surface currents and temperature is also related to the vertical structure of ocean density, a profile typically measured using instruments like Argo floats or similar devices (Sanford et al., 2011; Fu et al., 2014; Oginni et al., 2021). However, the observation status of Argo floats during typhoon events in the western North Pacific remains unclear over the past decade (Wu and Chen, 2012), particularly regarding specific typhoon cases (Chen et al., 2021).
Therefore, the objectives of the present study are threefold: Firstly, to assess the data quality of our surface drifters. Secondly, to investigate the observational capabilities of ocean responses to typhoons in 2022, utilizing both surface drifters and Argo floats. Thirdly, to meticulously examine the ocean observation status during Typhoon Hinnamnor.
2 Materials and method
2.1 Best track of TC
We utilize the best track data provided by the Japan Meteorological Agency (JMA), with a temporal resolution of 6 or 3 hours (case dependent).
2.2 Surface drifter
We also utilize data from the Global Drifter Program (GDP), with a corresponding temporal resolution of 6 hours. The accuracy of Sea Surface Temperature (SST) in the GDP dataset is reported as 0.05°C, while the accuracy of surface currents is approximately 1 cm/s (Hansen and Poulain, 1996). Meanwhile, we have deployed 8 new surface drifters in the western North Pacific. The data collection period spans from July 19, 2022, to September 24, 2022. These surface drifters record both position and SST, and the data are transmitted to land via the BeiDou satellite system with a 1-hour resolution. The accuracy of our SST and surface current measurements is nearly consistent with that of the GDP.
2.3 Argo float
We also incorporate data from Argo floats, which observe ocean temperature and salinity profiles. These measurements enable us to compute ocean density based on water temperature and salinity. Argo floats typically repeat their profiling every 10 days, although for certain specialized floats, the temporal resolution can approach nearly 1 day (Wada et al., 2014).
3 Results
3.1 Best track
Figure 1 illustrates all TC tracks in 2022, totaling 25 TCs. Table 1 provides details such as start time, lifetime, and intensity (minimum central pressure) of each TC. TC Malakas, occurring in the spring season, exhibited a significant lifetime of 11.75 days with a minimum pressure reaching as low as 945 hPa. Conversely, Megi, also a spring TC, had a much shorter lifespan of 3.25 days. There were 19 TCs during the typical typhoon season (July–October). In a noteworthy case, Hinnamnor originated in the subtropical ocean at (150°E, 20°N). Initially, it moved northwestward, then changed direction to westward and southwestward around 125°E. Subsequently, Hinnamnor made a significant turnaround (125°E, 20°N), followed by a northward and northeastward trajectory. Among other TCs during the typhoon season, Ma-On formed near (130°E, 18°N), moved southwestward, then turned northwestward. It passed over the Philippines Island and entered the South China Sea, eventually making landfall on the China mainland near 110°E. Noru also developed around (130°E, 18°N), moved predominantly westward, crossed the Philippines Island, entered the South China Sea, and ultimately made landfall near (110°E, 18°N). Nesat followed a similar track to Noru, with its eye passing over Luzon Strait. Tracks of Tokage, Merbok, Kulap, Roke, and Haitang predominantly moved northward and northeastward, maintaining distance from land. Post-typhoon season, there were two TCs: Yamaneko in November and Pakhar in December. Both had lifetimes shorter than 3.5 days, with minimum pressures higher than 997 hPa.
Figure 1
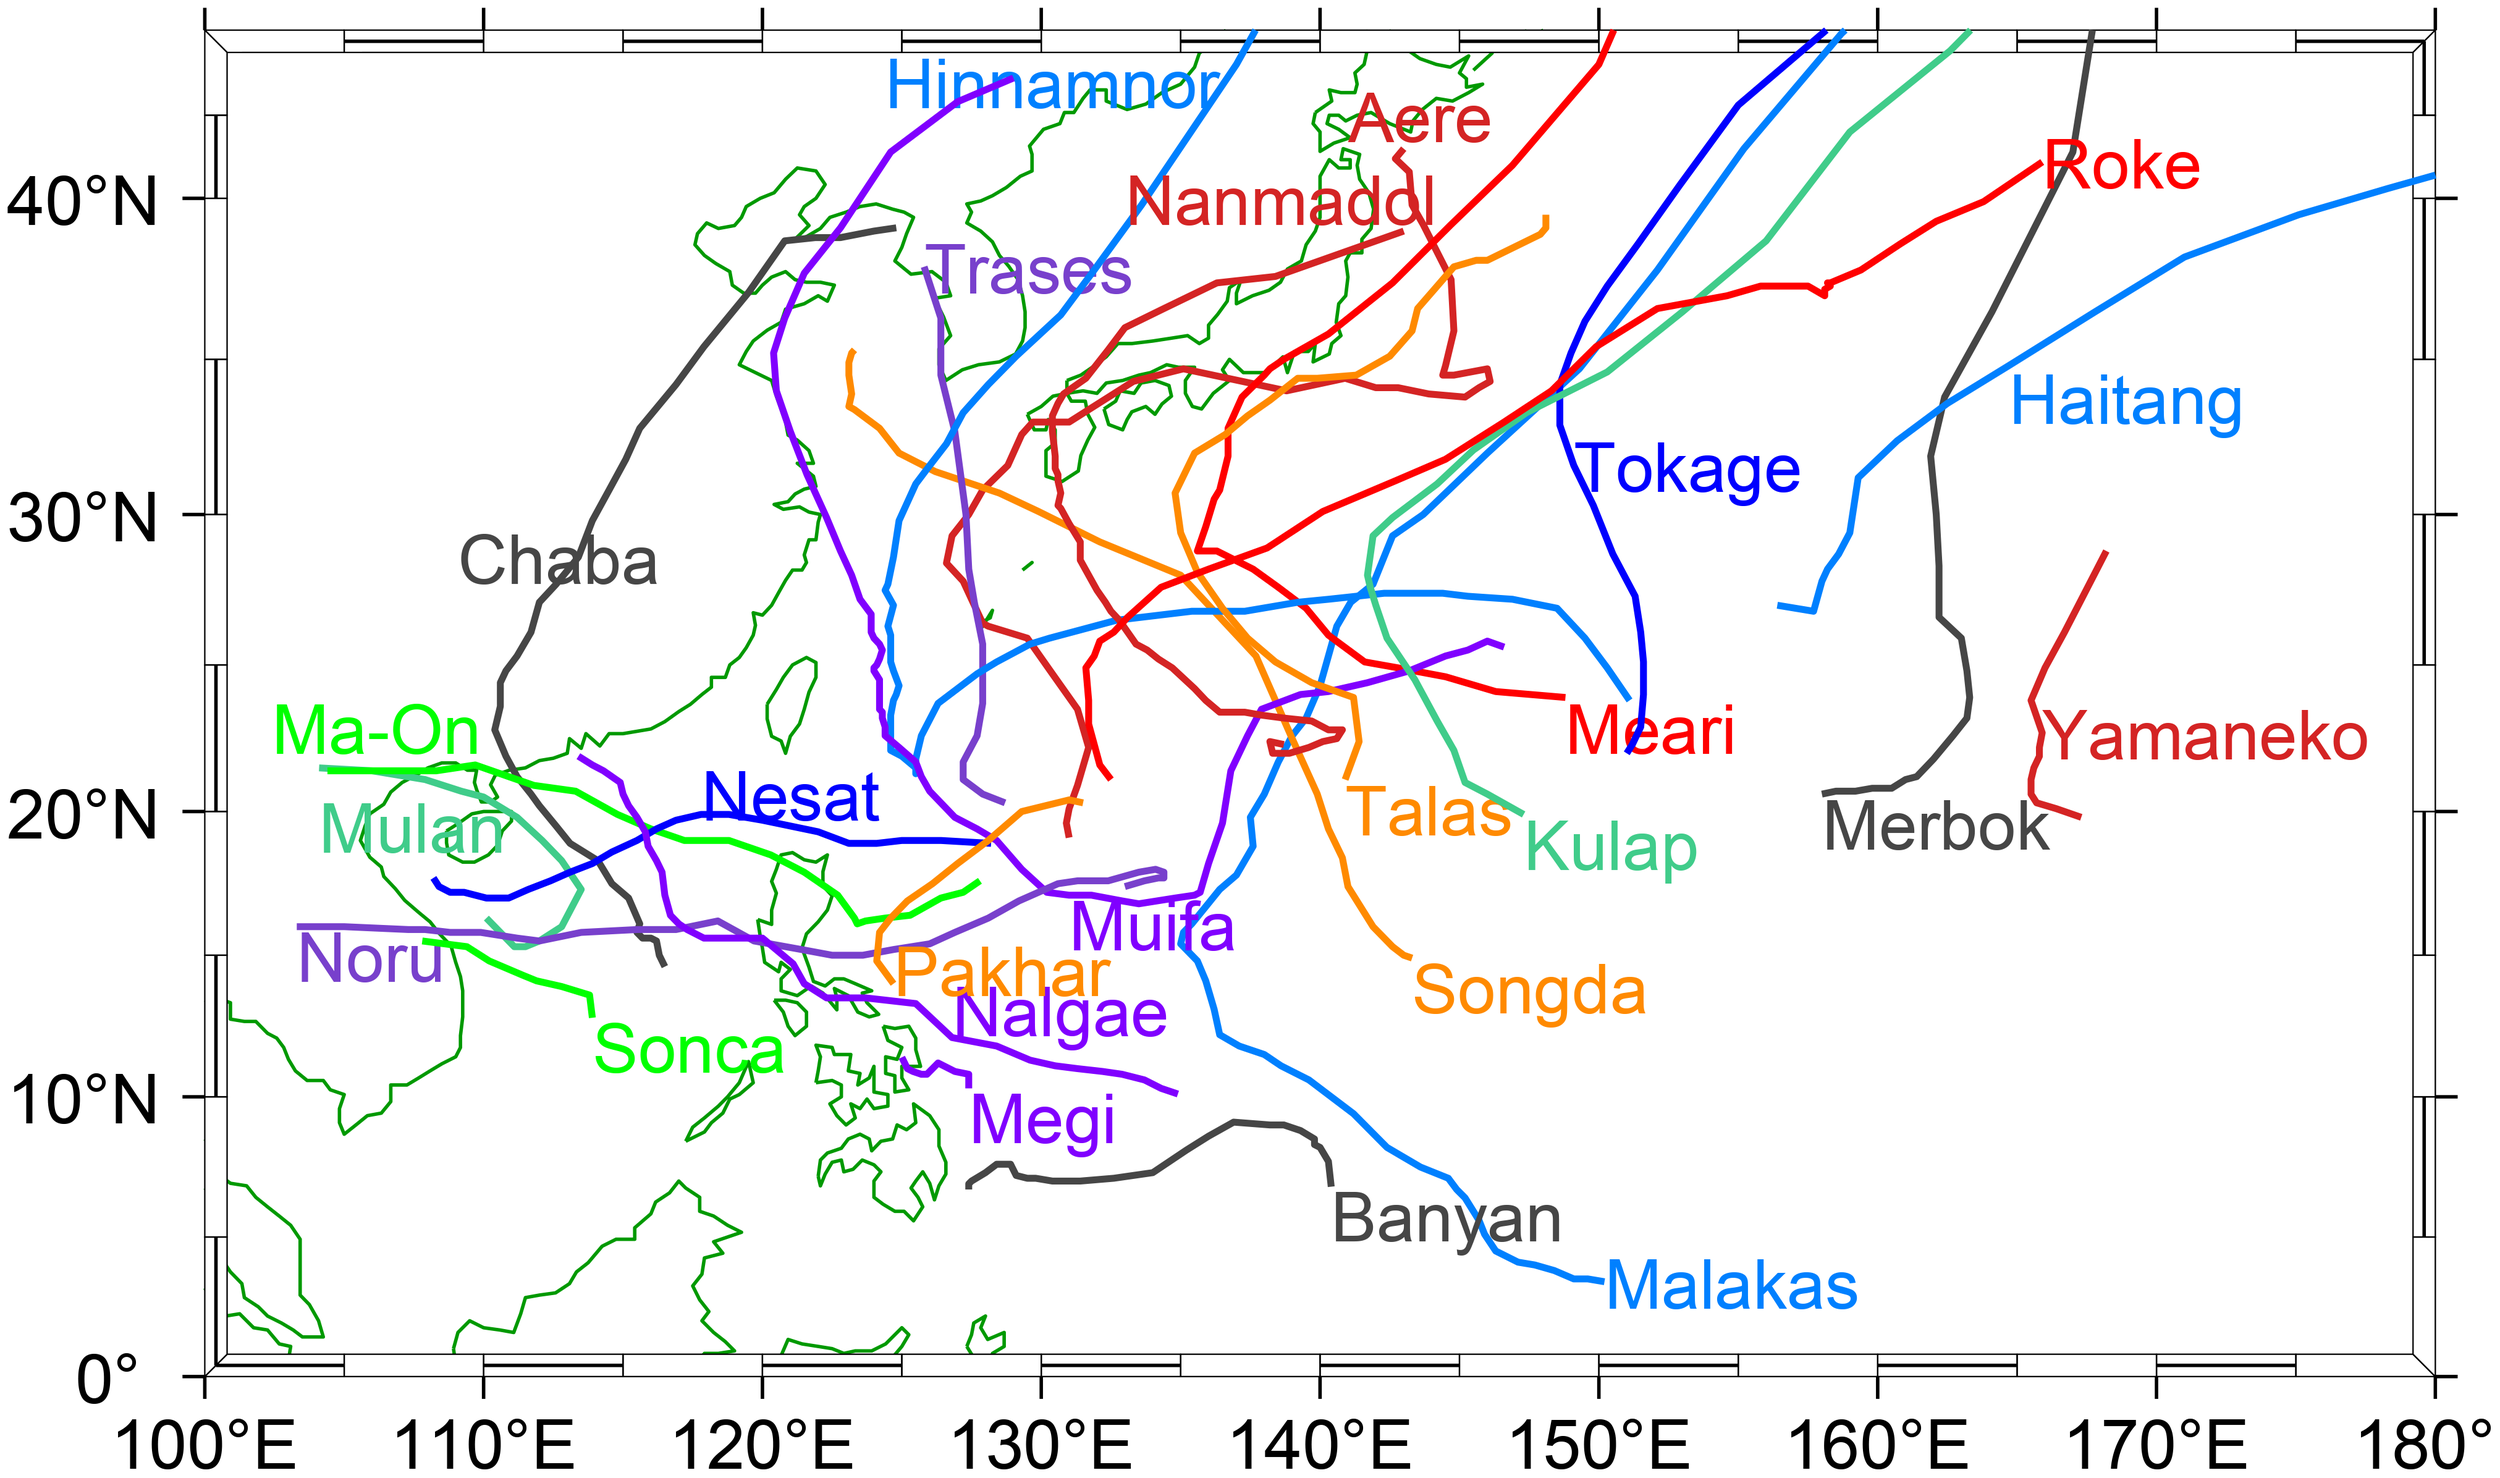
Best tracks of TCs in the western North Pacific during 2022. The best tracks were provided by Japan Meteorological Agency (JMA).
Table 1
| ID | Name | Genesis time | Life cycle | P min |
|---|---|---|---|---|
| YYYY-MM-DD HH | days | hPa | ||
| 1 | Malakas | 2022-04-06 06 | 11.75 | 945 |
| 2 | Megi | 2022-04-08 18 | 3.25 | 996 |
| 3 | Chaba | 2022-06-28 18 | 9.00 | 965 |
| 4 | Aere | 2022-06-30 12 | 10.00 | 994 |
| 5 | Songda | 2022-07-26 12 | 5.75 | 996 |
| 6 | Trases | 2022-07-29 12 | 3.25 | 998 |
| 7 | Mulan | 2022-08-08 00 | 3.25 | 994 |
| 8 | Meari | 2022-08-08 18 | 8.00 | 988 |
| 9 | Ma-On | 2022-08-21 00 | 5.00 | 985 |
| 10 | Tokage | 2022-08-21 06 | 5.75 | 970 |
| 11 | Hinnamnor | 2022-08-27 18 | 12.25 | 920 |
| 12 | Muifa | 2022-09-03 18 | 13.25 | 950 |
| 13 | Merbok | 2022-09-10 12 | 6.25 | 940 |
| 14 | Nanmadol | 2022-09-12 12 | 7.50 | 910 |
| 15 | Talas | 2022-09-20 18 | 6.75 | 1000 |
| 16 | Noru | 2022-09-21 06 | 8.00 | 940 |
| 17 | Kulap | 2022-09-25 00 | 6.50 | 940 |
| 18 | Roke | 2022-09-28 00 | 7.25 | 975 |
| 19 | Sonca | 2022-10-13 06 | 1.75 | 998 |
| 20 | Nesat | 2022-10-14 12 | 5.75 | 965 |
| 21 | Haitang | 2022-10-17 00 | 3.50 | 1004 |
| 22 | Nalgae | 2022-10-26 00 | 8.00 | 975 |
| 23 | Banyan | 2022-10-28 06 | 5.75 | 1002 |
| 24 | Yamaneko | 2022-11-11 12 | 3.25 | 1004 |
| 25 | Pakhar | 2022-12-10 00 | 2.50 | 998 |
Best tracks of TCs in 2022.
P min is the minimum pressure of TC center during the TC life. The data were provided by JMA.
3.2 Surface drifter observation
Figure 2 displays the trajectories of surface drifters during each TC. Figure 3 also depicts the number of drifters within a 500 km search radius. For certain TCs such as Megi, Chaba, Mulan, Sonca and Banyan, no surface drifters were present (Figure 3A). In the case of Meari, although the number of surface drifters exceeded 20, there were only 1 drifter during high category TCs (maximum sustain wind speed exceeds 17.5 m/s). In contrast, the situations during Hinnamnor and Kulap were more promising, with roughly 25 drifters within a 500 km search radius. The drifter count did not sharply decrease with high category TCs. As a result, there were mean 6.1 drifters for high-category TC. During the genesis of Meari, surface drifters provided valuable observations. Initially, there were nearly 20 drifters around the genesis area. However, due to the weak intensity at the beginning, the drifters were not significantly affected by higher category TCs (Figure 3A).
Figure 2
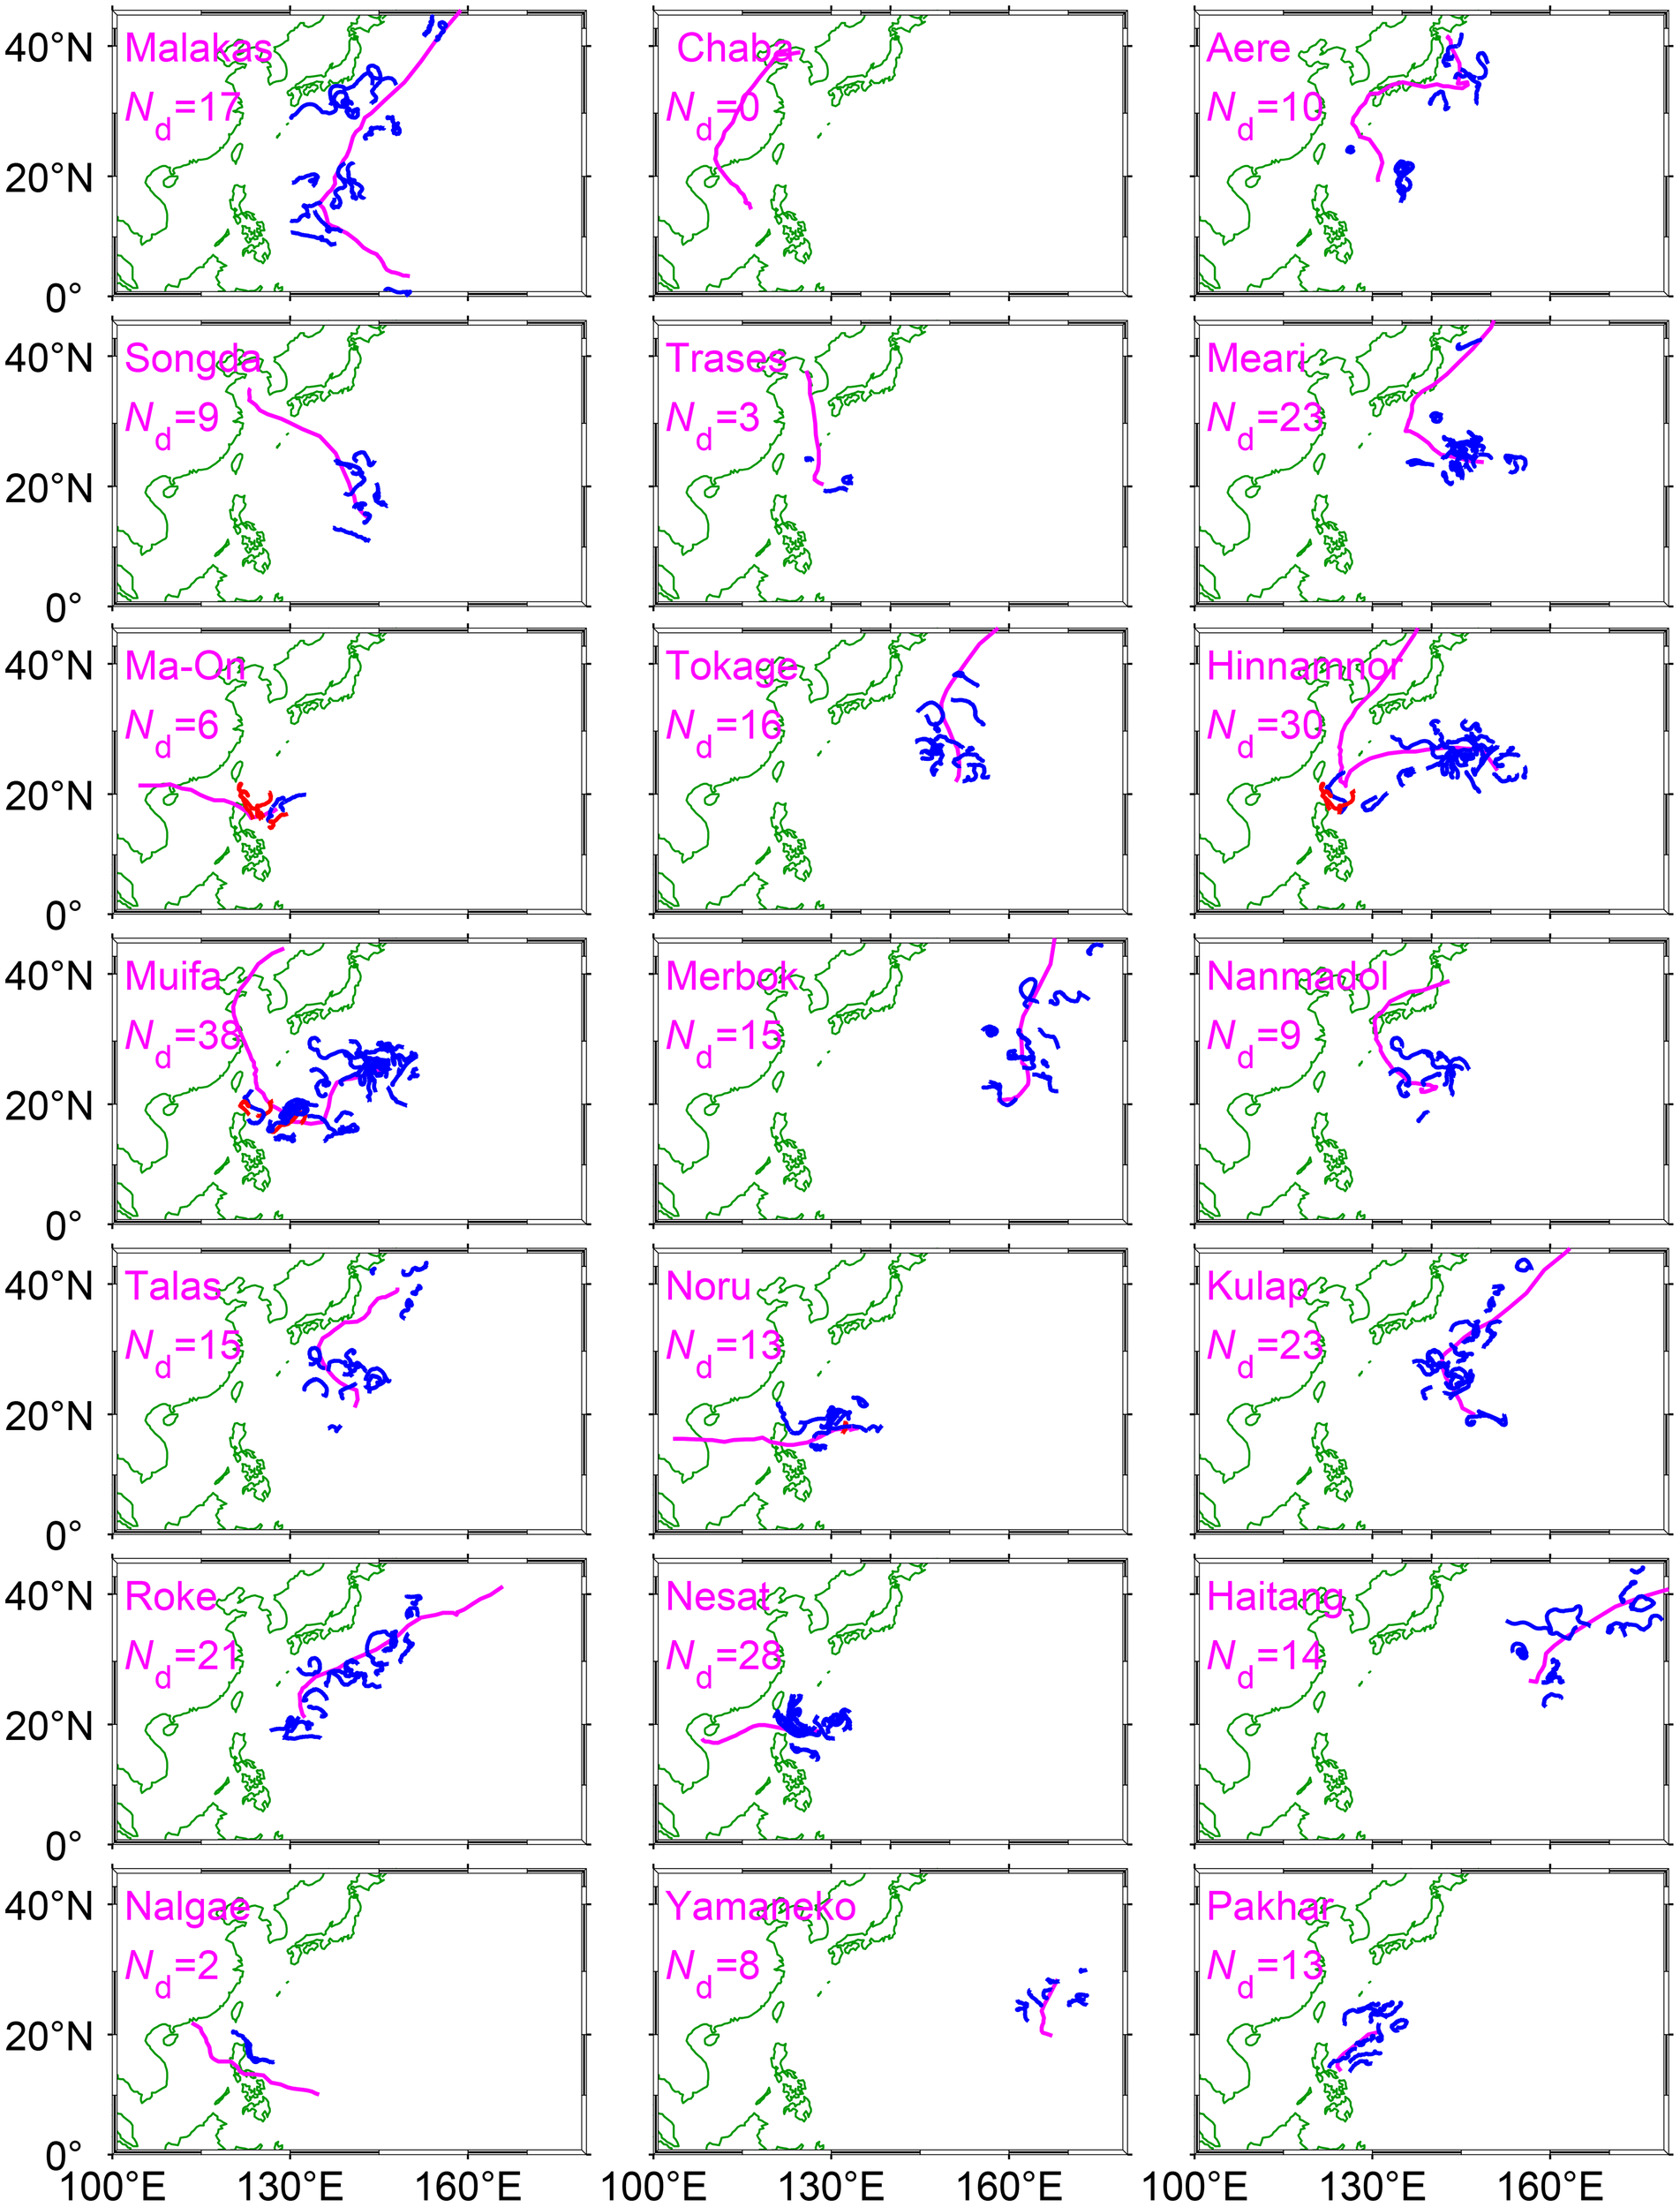
An overview of surface drifters during TCs in 2022. The magenta solid line depicts the best track of the TC, while the blue and red lines represent the trajectories of surface drifters in Global Drifter Program and our deployment, respectively. Nd is the number of captured surface drifters. The search radius is 500 km.
Figure 3
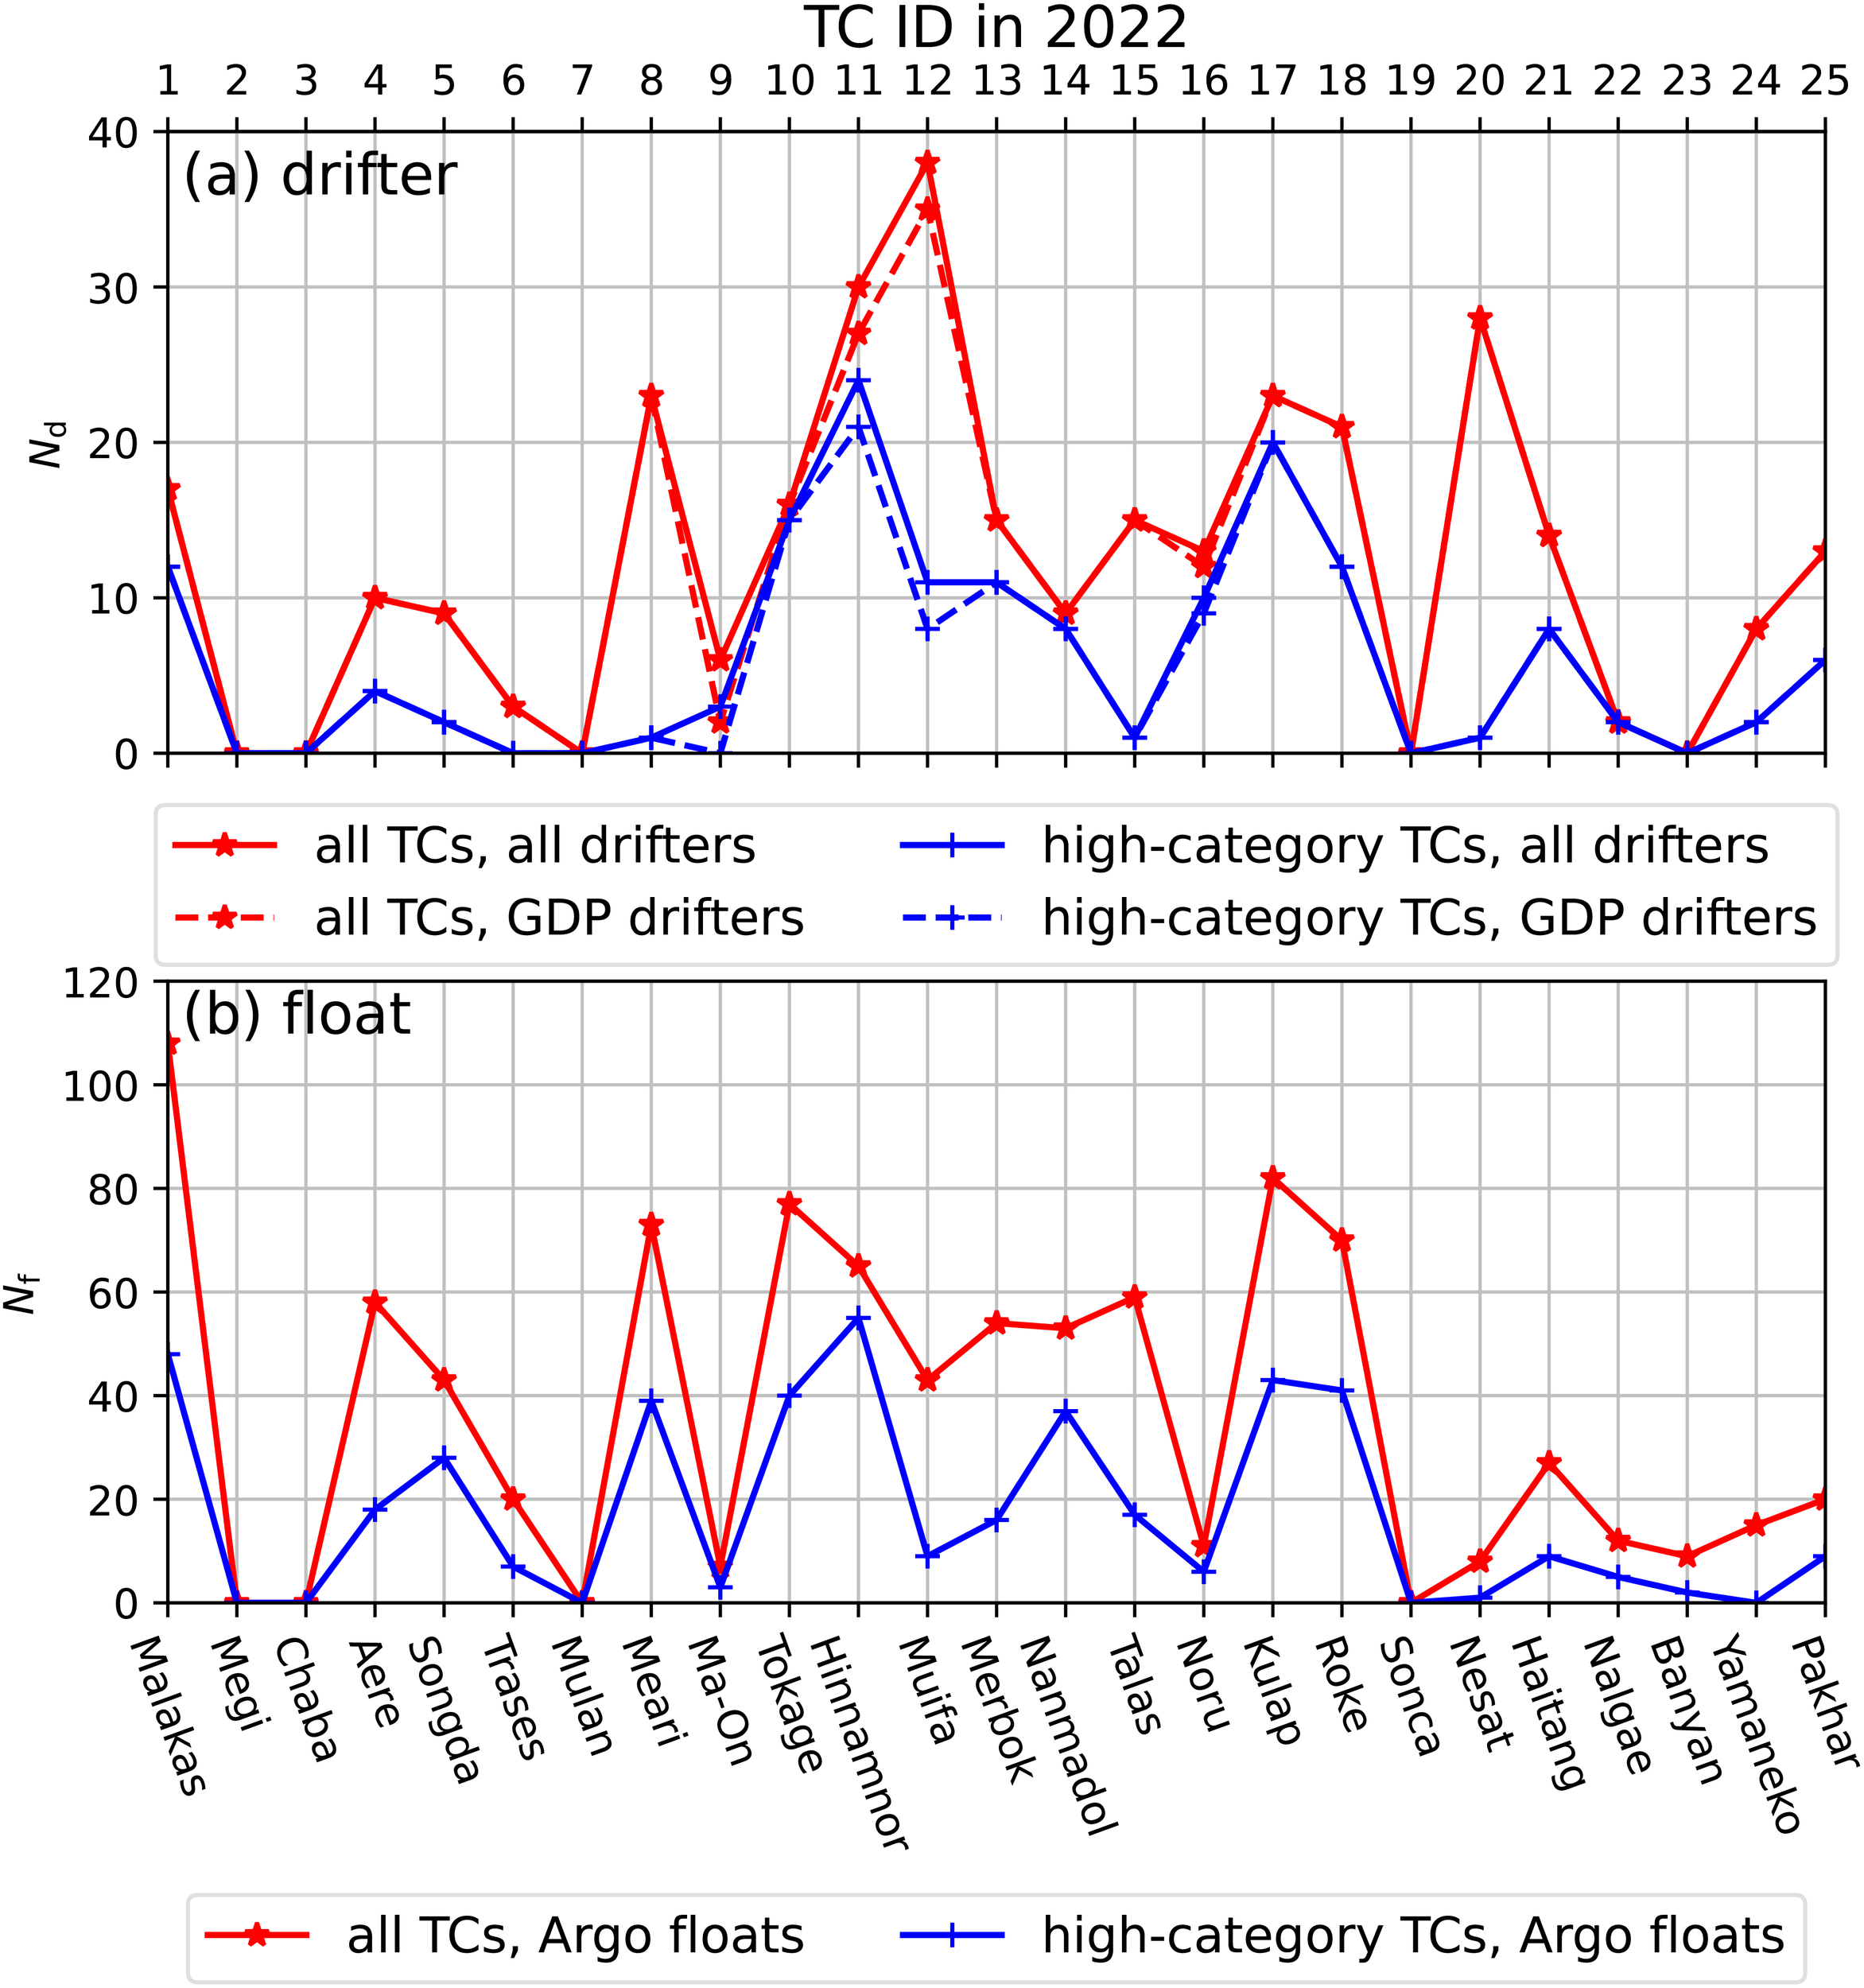
The number of (A) drifters (Nd) and (B) Argo floats (Nf) for each TC in 2022. In (A), solid and dashed lines represent all drifters and only Global Drifter Program’s drifters, respectively. The red lines denote all category TCs, while the blue lines represent high-category TCs (maximum sustained wind speeds greater than 17.5 m/s). The bottom abscissa displays the TC names, and the top abscissa indicates the TC IDs in 2022. The search radius is 500 km.
Our drifters significantly contributed to ocean observations. In terms of the number of surface drifters, our deployment increased the count captured by TCs (Figure 3A). Across all intensity levels of TCs, our drifters contributed during Ma-On (2209), Hinnamnor (2211), and Muifa (2212). Specifically, 3 of our drifters were deployed during Hinnamnor (2211). Even during high-category TCs, our drifters continued to function effectively, maintaining a count of 3 during the Hinnamnor event. While our drifters exactly observed the ocean response to Hinnamnor on its track turning point (Figure 2), and they were primarily located on its western side. Table 2 listed the drifter observations during Hinnamnor. The maximum SST cooling in these drifters attained -2.11°C (drifter 67649550), and the maximum surface current was 0.70 m/s (drifter 67544100).
Table 2
| Drifter ID |
t
0
YYYY-MM-DD HH |
x
0
km |
Vmax
m/s |
ΔSST °C |
|Umax| m/s |
|---|---|---|---|---|---|
| 67649550 | 2022-08-29 09 | 13 | 41.2 | -2.11 | 0.66 |
| 66216740 | 2022-08-28 15 | 13 | 24.4 | -0.40 | 0.31 |
| 61286260 | 2022-08-29 05 | 22 | 37.7 | -0.86 | 0.10 |
| 68542420 | 2022-08-28 09 | -27 | 19.3 | -0.24 | 0.08 |
| 68542390 | 2022-08-28 09 | -31 | 19.3 | -0.34 | 0.20 |
| 66432050 | 2022-08-28 15 | -61 | 24.4 | — | 0.26 |
| 68543130 | 2022-08-29 06 | 68 | 38.6 | -0.86 | 0.37 |
| 67544100 | 2022-08-28 18 | -72 | 28.3 | -0.15 | 0.70 |
| 68543140 | 2022-08-28 16 | 99 | 25.7 | -0.05 | 0.26 |
| 68543090 | 2022-08-28 22 | -141 | 33.4 | -0.42 | 0.14 |
| 65701850 | 2022-08-28 12 | -144 | 20.6 | -0.23 | 0.49 |
| 61286230 | 2022-09-02 12 | 233 | 38.6 | -0.25 | 0.31 |
| 68542300 | 2022-08-28 23 | -251 | 34.7 | -0.41 | 0.07 |
| 66213760 | 2022-08-29 11 | -287 | 42.9 | — | 0.14 |
| 66213700 | 2022-08-30 04 | -293 | 50.6 | 0.49 | 0.12 |
| 61658680 | 2022-08-28 17 | -325 | 27.0 | -0.39 | 0.43 |
| 30000003 | 2022-09-02 12 | 325 | 38.6 | -0.32 | 0.61 |
| 66813190 | 2022-08-28 00 | -331 | 0.0 | 0.33 | 0.63 |
| 60616560 | 2022-08-27 18 | 345 | — | -0.05 | 0.21 |
| 61394350 | 2022-08-28 03 | — | 9.0 | -0.44 | 0.11 |
| 30000008 | 2022-09-01 12 | -358 | 51.4 | -0.66 | 0.24 |
| 66213720 | 2022-08-30 03 | 361 | 50.2 | 0.16 | 0.09 |
| 60520110 | 2022-08-28 02 | -370 | 6.0 | 0.17 | 0.28 |
| 30000007 | 2022-09-02 12 | 399 | 38.6 | -0.94 | 0.26 |
| 66213740 | 2022-08-29 02 | -407 | 36.0 | -0.21 | 0.27 |
| 60753060 | 2022-08-29 05 | -419 | 37.7 | -0.18 | 0.30 |
| 60523120 | 2022-08-29 15 | -433 | 43.7 | 0.14 | 0.13 |
| 68542120 | 2022-08-28 03 | 438 | 9.0 | 0.04 | 0.34 |
| 61297880 | 2022-08-27 18 | -459 | — | -0.04 | 0.19 |
Surface drifters captured by TC Hinnamnor in the western North Pacific during 2022.
t 0 is the arrival time of TC. At t0, x0 is the cross-track coordinate, Vmax is the maximum sustain wind speed of TC, ΔSST is the SST change as referred to 1 day before, and |Umax| is the current speed. The search radius is 500 km.
A GDP drifter was in close proximity to ours, allowing for a comparison of transient surface current and temperature measurements, as detailed in Table 3. The minimum distance between the two drifters was 68 km. Our drifter recorded slightly stronger current speeds compared to the GDP drifter, with a relative difference of 30%. The difference in current direction was -16.42°. Furthermore, our drifter recorded a colder SST than the GDP drifter by 0.9°C, suggesting weak disparity in measurements between the two drifters.
Table 3
| Variable | Our drifter | GDP’s drifter | Δ | RD |
|---|---|---|---|---|
| |U| (m/s) | 0.31 | 0.24 | 0.07 | 30.23% |
| θ (°) | -59.89 | -43.47 | -16.42 | — |
| SST (°C) | 29.05 | 29.95 | -0.90 | -3.0% |
Comparisons between our and Global Drifter Program’s (GDP) drifters during TC Hinnamnor.
The ID of our drifter is 30000003, and the ID of GDP drifter is 61286230. The transient time is 2022/09/03 12:00:00. The distance between two drifters was 68 km. Δ indicates the difference, RD is the relative difference, |U| is the current speed, θ represents the current direction, and SST is the sea surface temperature.
Figure 4 further investigates the local coordinates with respect to the TC eye. The x coordinate denotes the cross-track direction, while the y coordinate represents the along-track direction. Similar to previous studies (Chang et al., 2013), surface current patterns typically exhibit a rightward bias (Chen et al., 2021). The vortex-like pattern and right-side bias are more pronounced in relatively high-category TCs, where the vortex wind forcing is stronger. The surface currents measured by our drifter are also broadly consistent with vortex distribution and right-side bias. It’s worth noting the presence of abnormal upward (positive) currents on the left side of the track, likely attributable to background currents, sudden changes in TC trajectory, or localized wind forcing.
Figure 4
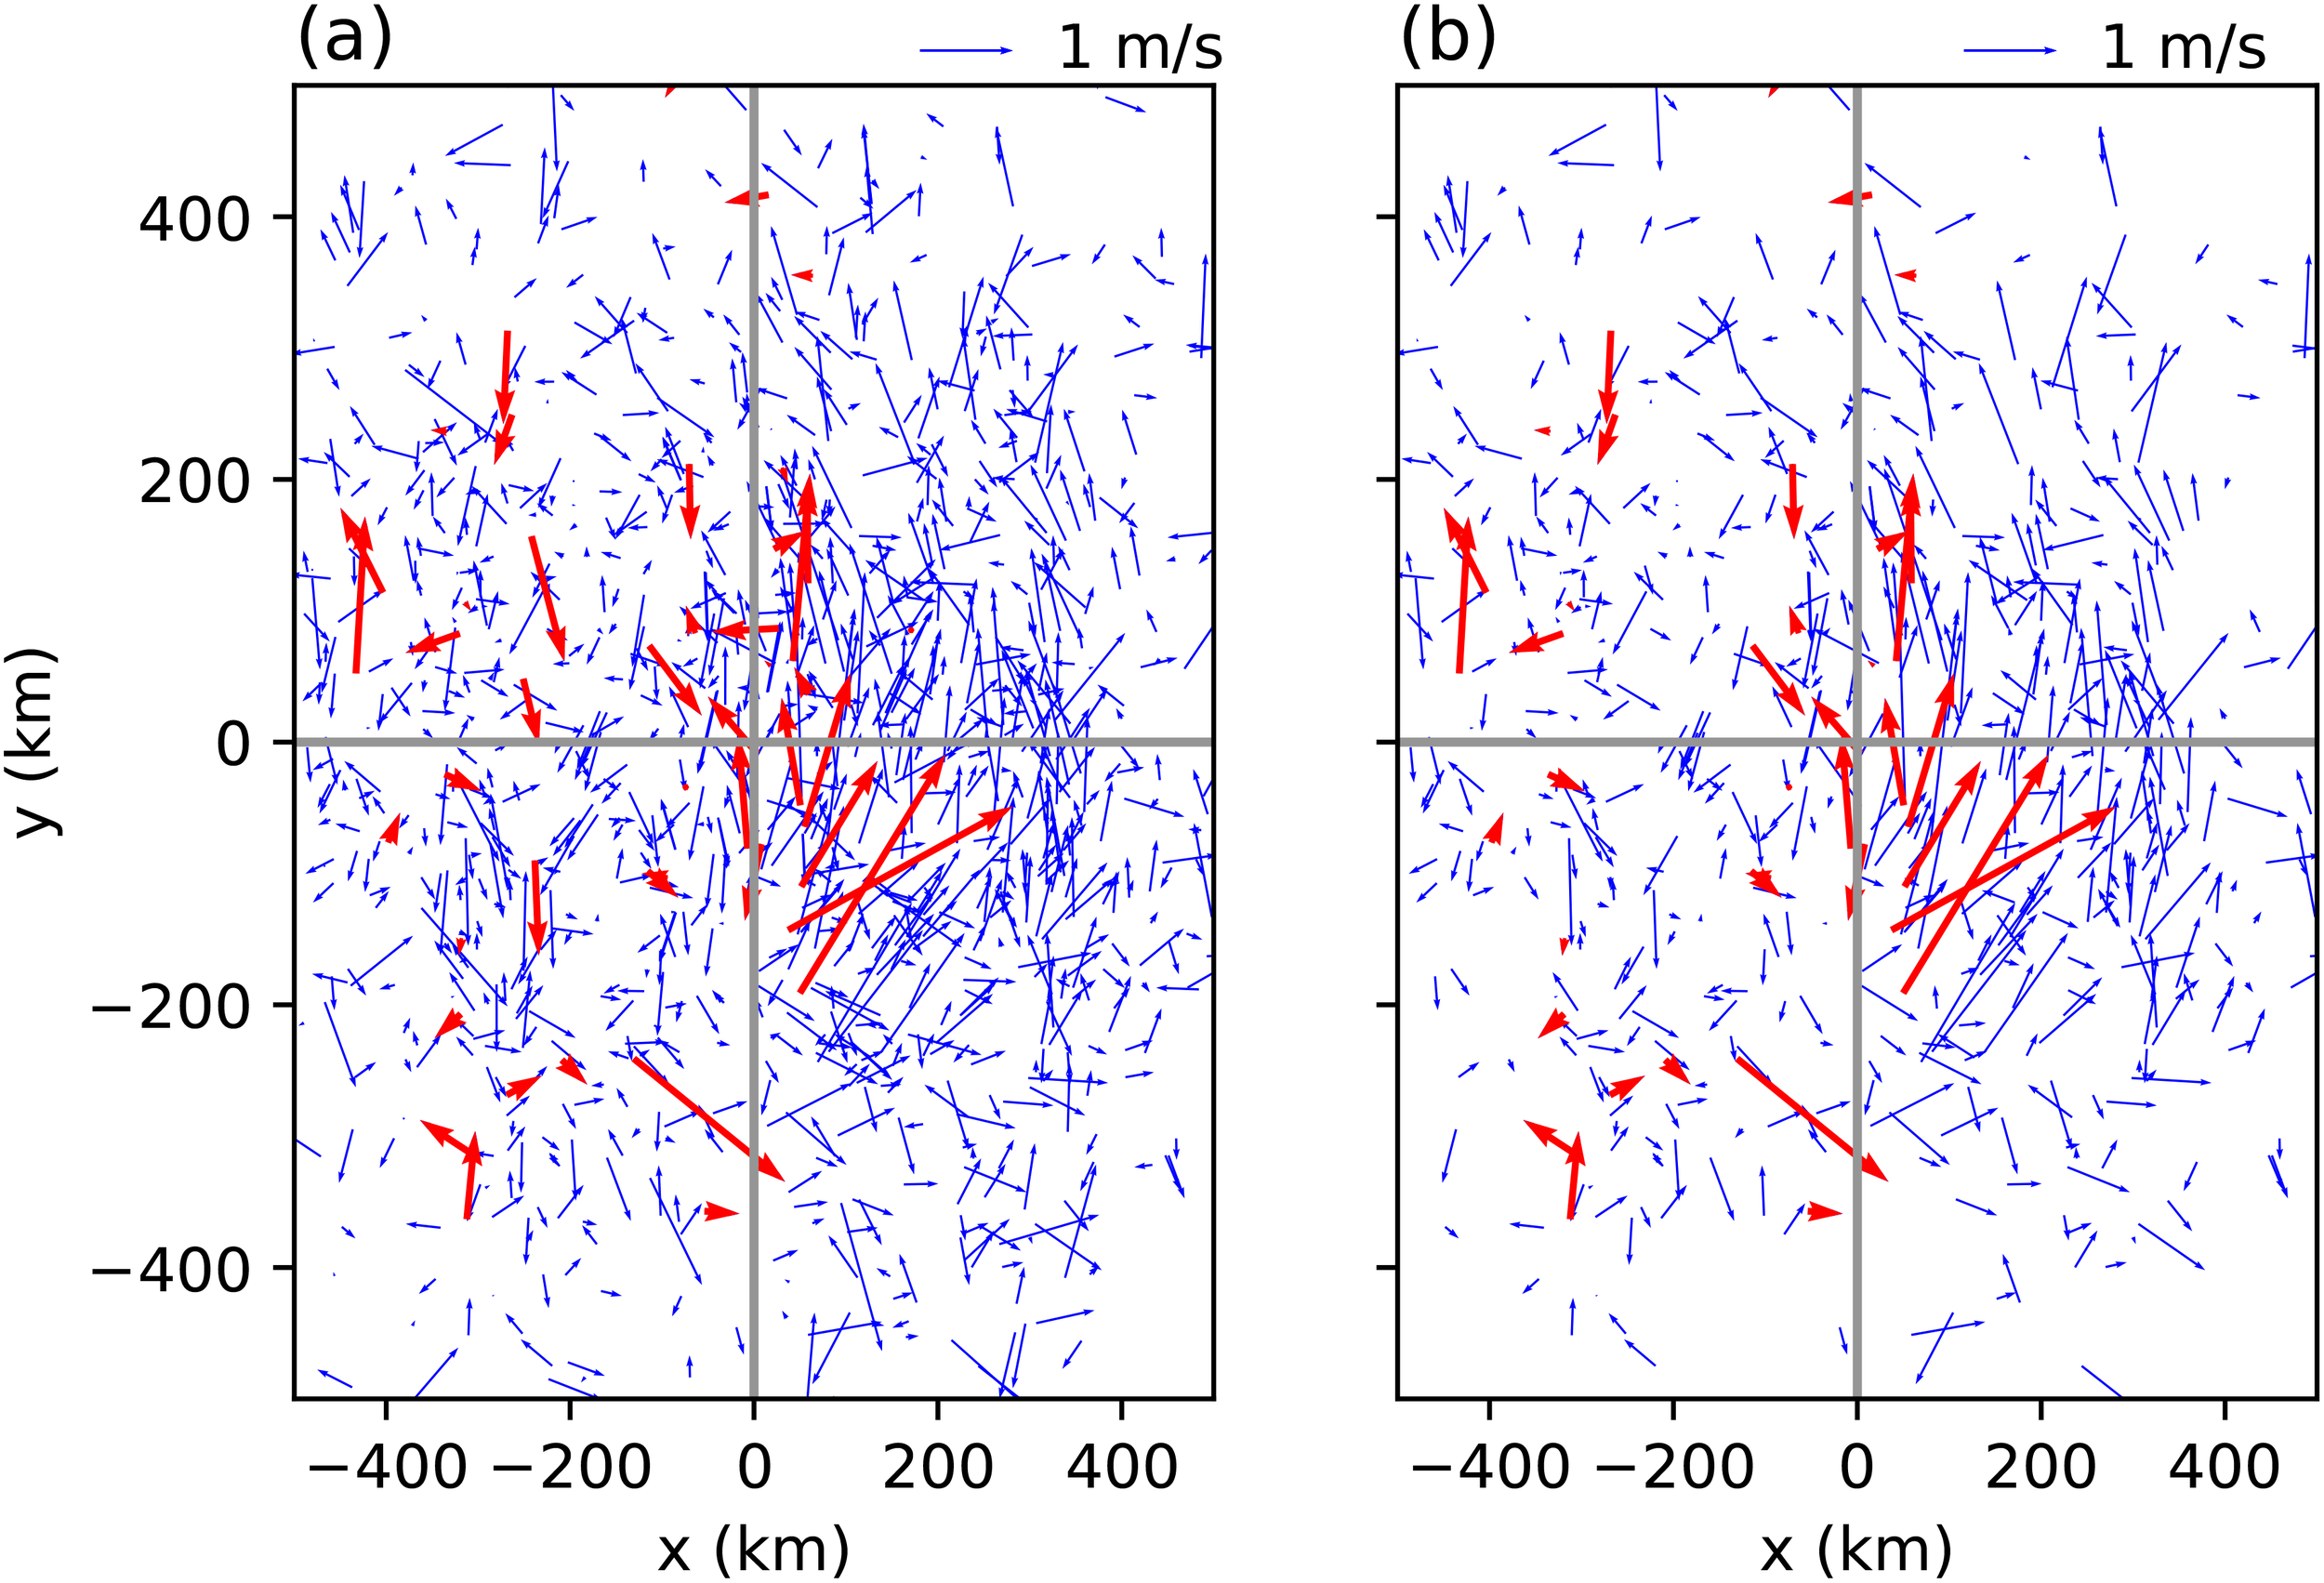
Observations of surface currents under TCs in 2022. (A) All category TCs, (B) high category TCs (maximum sustained wind speeds greater than 17.5 m/s). TC-following coordinate is used, where the x coordinate denotes cross-track, and the y coordinate signifies along-track. The TC heading direction aligns with the positive y direction. Blue arrows represent the Global Drifter Program’s surface drifters, while red arrows indicate our surface drifters.
3.3 Argo float observation
Argo floats offer a platform for oceanic profiling observations. On average, there were 17.3 Argo floats for high category TC. In the case of specific typhoons, such as Hinnamnor, the number of Argo floats deployed is considerably high (Figure 3). Within a 500 km search radius, nearly 65 Argo floats are captured. After excluding instances of weak TC conditions, approximately 55 Argo floats were found near the TC track (Figure 3). Examining the records of Argo floats during Hinnamnor, it is observed that the floats are primarily located around 25°N (Figure 5).
Figure 5
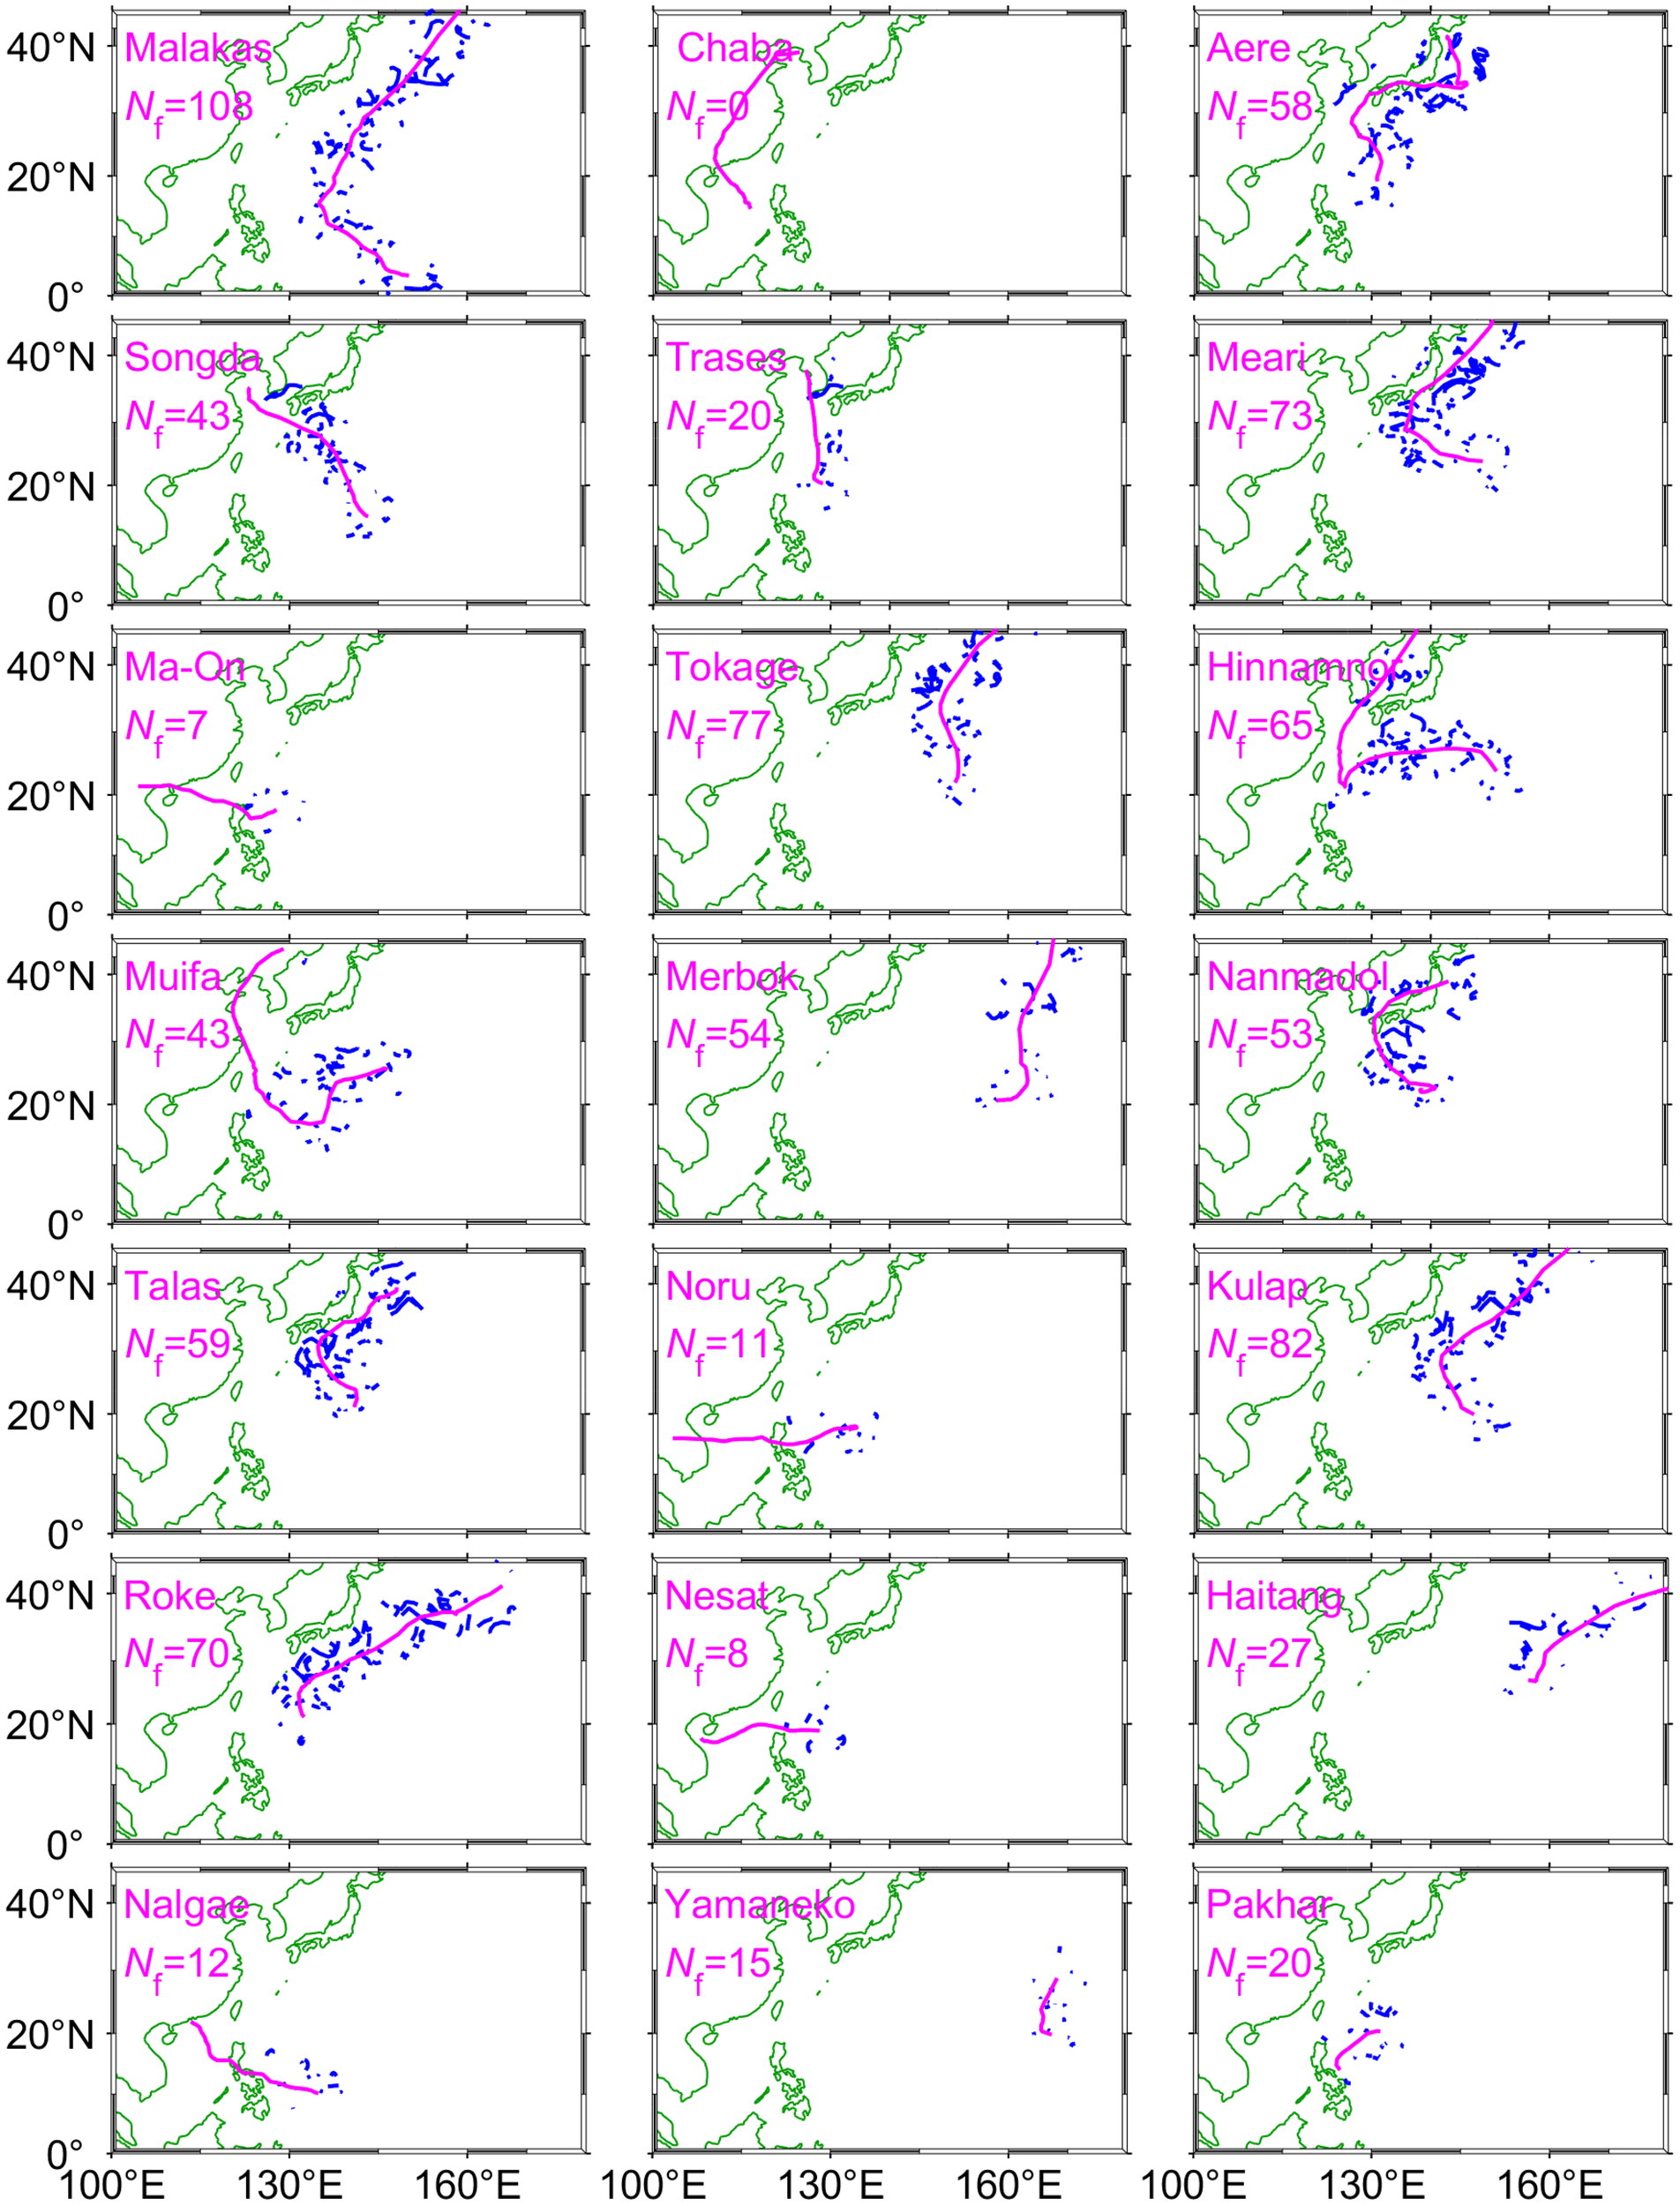
An overview of Argo floats during TCs in 2022. The magenta solid line depicts the best track of the TC, while blue solid line represents the trajectory of Argo float. Nf is the number of captured floats. The search radius is 500 km.
Figure 6 further illustrates the observational profiles of temperature and salinity during typhoon Hinnamnor. The drifter ID for this data is 2903674, with a minimum distance to the typhoon eye of 78 km. The temporal resolution of this float data is approximately 5 days. A noticeable cooling of SST is observed. Prior to the TC’s arrival, the SST was around 30.5°C. During the TC’s forcing, the SST decreased to 30.2°C, and post-TC passage, it further dropped to 29.1°C. Therefore, the SST cooling attained -1.4°C after the TC passage. In the vertical profile, the subsurface isothermocline rises towards the sea surface, indicating significant thermocline entrainment. Accordingly, a relatively fresher sea surface salinity is observed, likely due to surface precipitation. The mixed layer depth (MLD) deepened significantly. At the time of TC forcing, the MLD was approximately 21 m, extending further to 43 m on 5 days after the TC’s passage. The isothermal depth (ITD) generally mirrors the behavior of the MLD. The definitions of MLD and ITD used here follow those provided by Wada et al. (2014); Oginni et al. (2021). Table 4 further listed the Argo floats during TC Hinnamnor. At the forcing stage of Hinnamnor, the maximum SST cooling attained -0.53°C (Float 2903642). Meanwhile, the corresponding MLD change was 8.9 m.
Figure 6
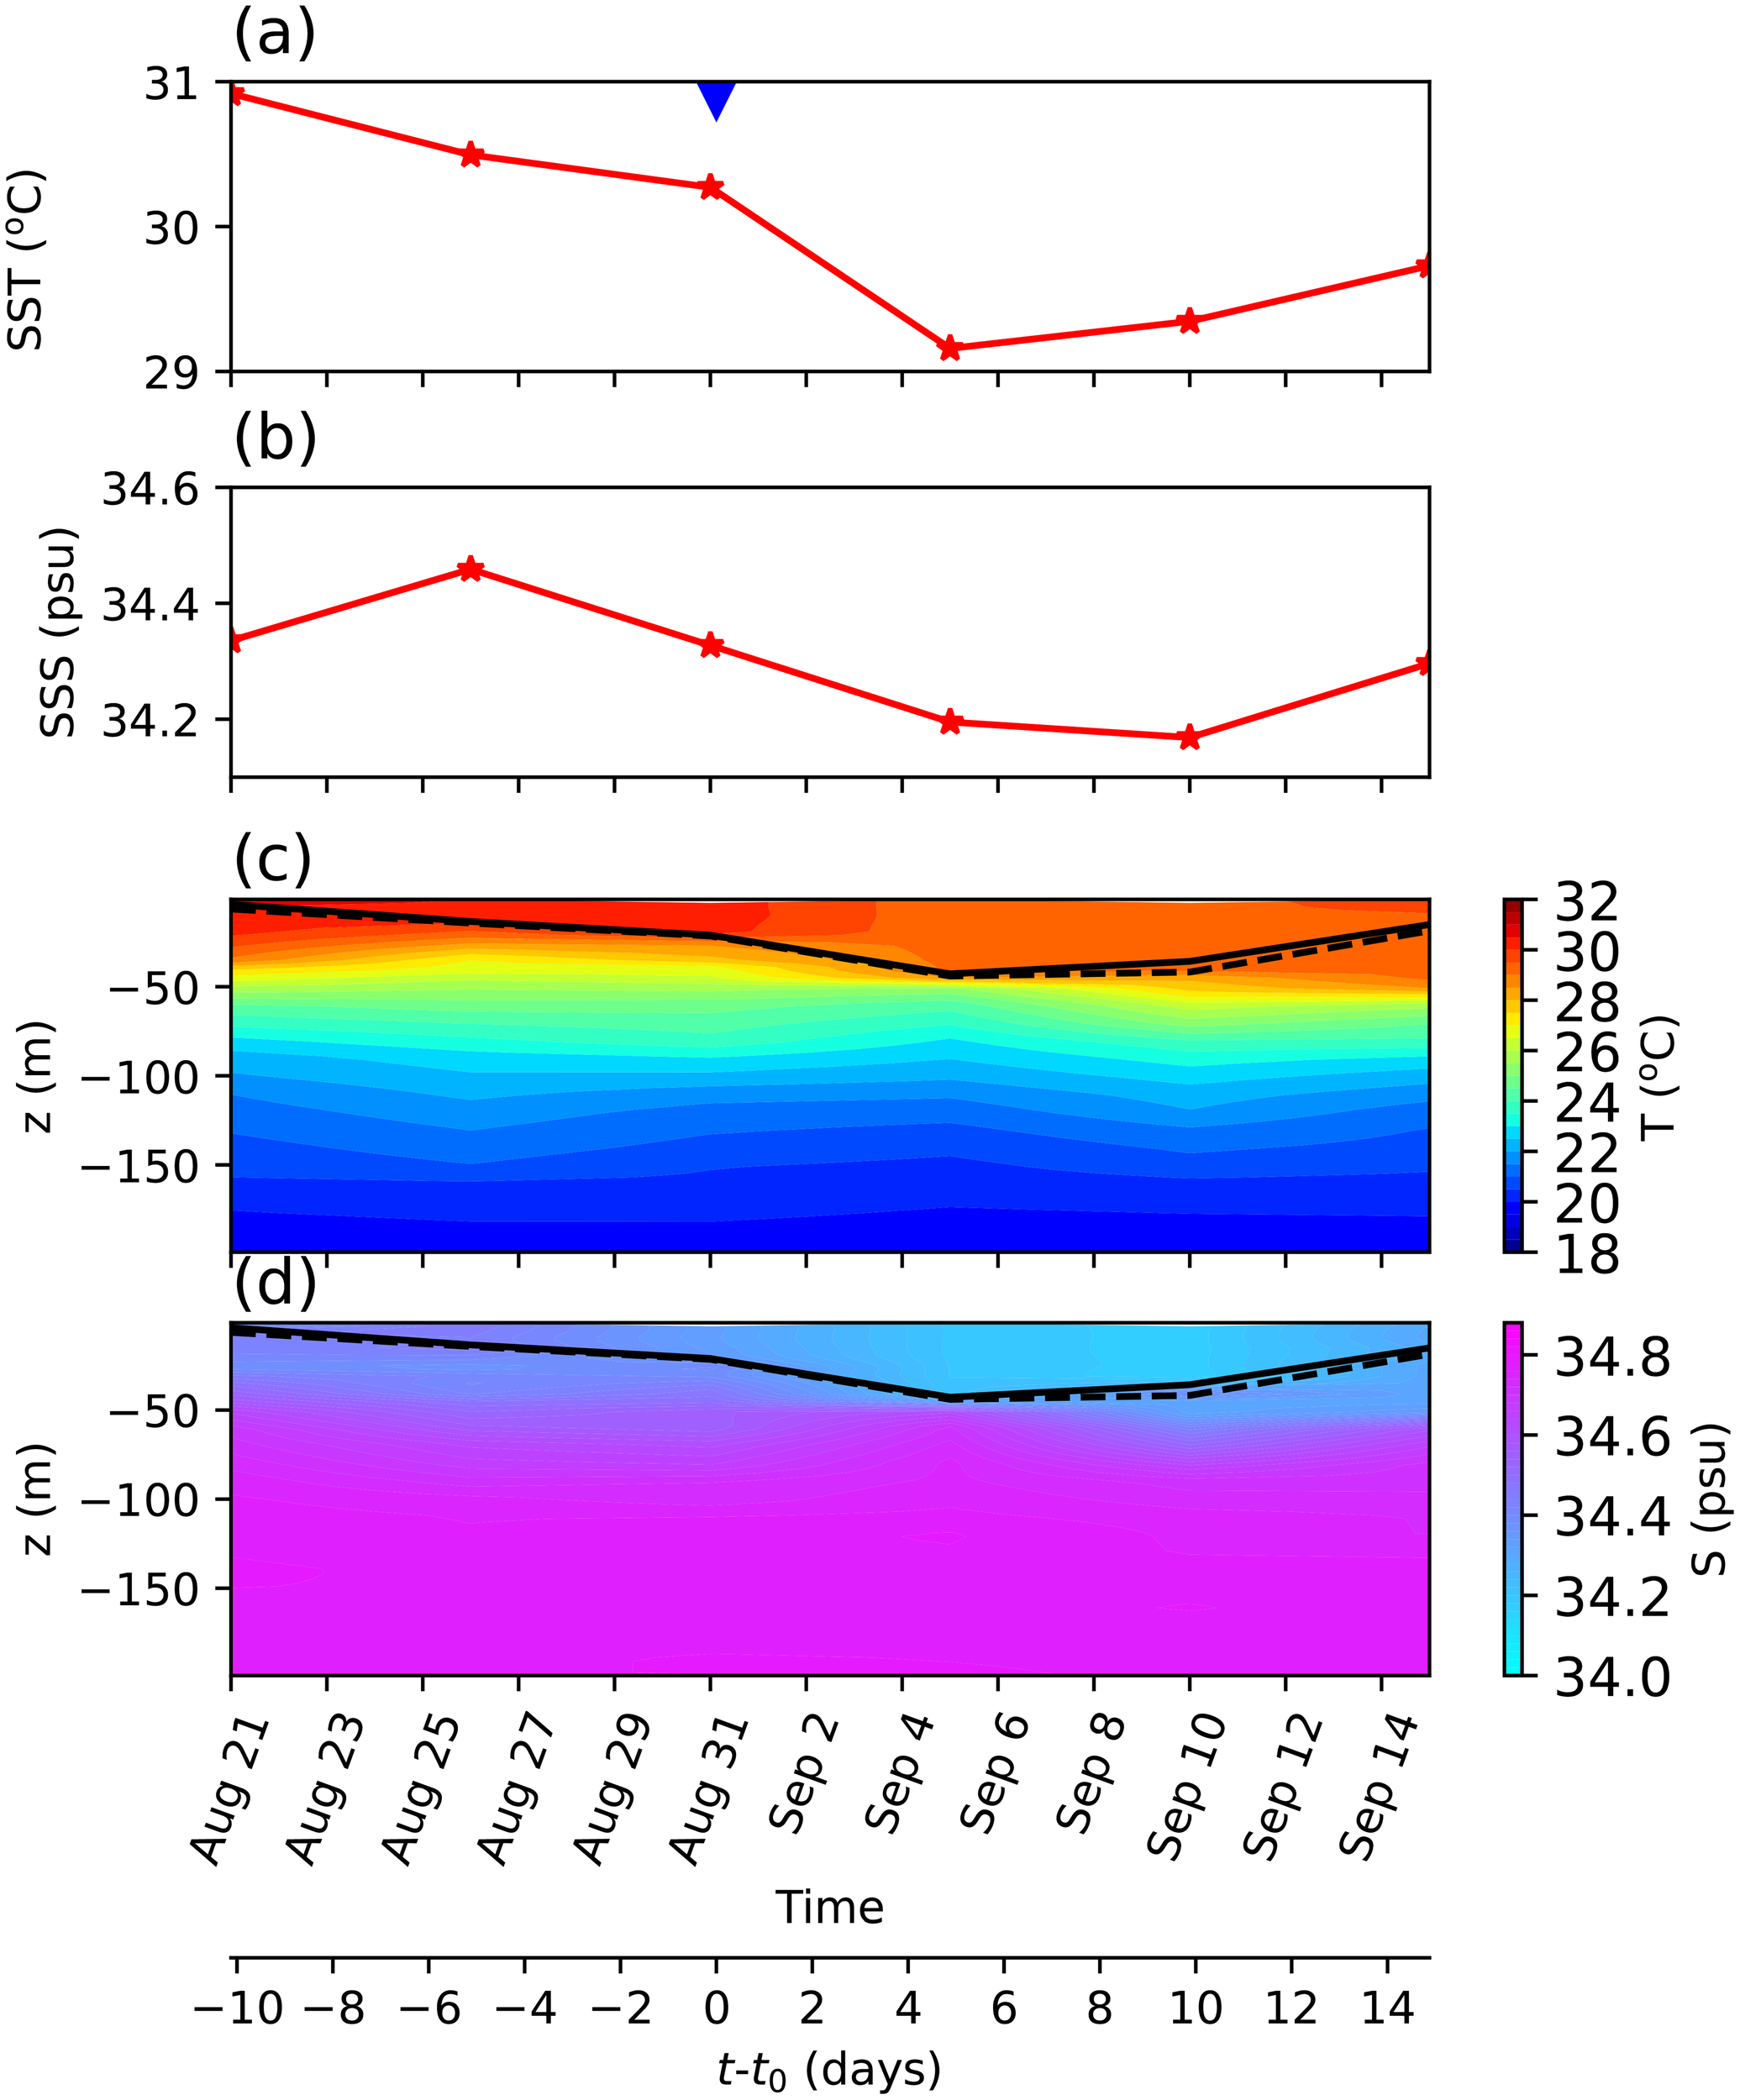
Profiles of Argo float during TC Hinnamnor. (A) Sea surface temperature (SST), (B) sea surface salinity (SSS), (C) temperature profiles and (D) salinity profiles. Float ID: 2903647. The minimum distance between float and TC is 78 km. In (A), blue triangular marker represents the arrival time of TC. In (C, D), black solid and dashed lines represent mixed-layer depth (MLD) and the isothermal depth (ITD) respectively. t is time, and t0 is the TC’s arrival time.
Table 4
| Float ID |
t
0
YYYY-MM-DD HH |
x
0
km |
Vmax
m/s |
ΔSST °C |
ΔMLD m |
|---|---|---|---|---|---|
| 2903648 | 2022-08-30 00 | 3 | 48.9 | -0.05 | 2.9 |
| 2901808 | 2022-09-05 20 | -8 | 36.0 | 0.04 | 0.6 |
| 4903637 | 2022-09-05 23 | -25 | 34.3 | -0.17 | 1.9 |
| 4903636 | 2022-09-05 23 | 8 | 34.3 | -0.14 | 0.9 |
| 2903705 | 2022-08-30 05 | 30 | 51.0 | -0.24 | 5.0 |
| 5906513 | 2022-08-29 22 | -29 | 48.0 | -0.08 | -1.1 |
| 2903676 | 2022-08-28 19 | -74 | 29.6 | -0.02 | -0.8 |
| 2903706 | 2022-08-30 08 | 77 | 52.3 | -0.05 | 5.5 |
| 2903647 | 2022-08-31 03 | -78 | 51.4 | -0.07 | 1.9 |
| 2903625 | 2022-08-30 23 | -80 | 52.3 | -0.22 | 7.4 |
| 2901811 | 2022-09-05 18 | -81 | 36.0 | 0.14 | — |
| 2903710 | 2022-08-29 20 | 89 | 47.2 | — | — |
| 2903686 | 2022-08-31 10 | -93 | 51.4 | — | — |
| 2903642 | 2022-09-01 18 | 73 | 46.3 | -0.53 | 8.9 |
| 2903346 | 2022-08-30 02 | -108 | 49.7 | — | — |
| 2903618 | 2022-08-28 16 | 111 | 25.7 | -0.11 | 1.8 |
| 5905847 | 2022-08-29 06 | 116 | 38.6 | -0.08 | 1.4 |
| 2901806 | 2022-09-06 01 | -119 | 33.4 | -0.12 | -0.0 |
| 2903688 | 2022-08-30 01 | -126 | 49.3 | -0.09 | 0.5 |
| 2903649 | 2022-08-30 05 | -129 | 51.0 | -0.01 | -0.5 |
| 2903709 | 2022-08-30 14 | -145 | 54.0 | -0.30 | 5.3 |
| 2901795 | 2022-09-06 04 | -153 | 32.6 | -0.10 | -0.1 |
| 2901785 | 2022-09-06 09 | 164 | 15.4 | -0.35 | -1.0 |
| 5906762 | 2022-08-27 18 | — | 0.0 | -0.04 | 0.2 |
| 2903622 | 2022-08-28 10 | 174 | 19.7 | -0.11 | 1.0 |
| 2903707 | 2022-08-30 06 | 175 | 51.4 | 0.00 | 1.5 |
| 2903645 | 2022-08-29 11 | 177 | 42.9 | -0.01 | 2.8 |
| 5904935 | 2022-08-28 20 | -181 | 30.9 | -0.09 | 0.9 |
| 2901791 | 2022-09-06 08 | -195 | 20.6 | -0.25 | -0.8 |
| 5901937 | 2022-09-01 18 | -137 | 46.3 | -0.15 | 0.0 |
| 2901801 | 2022-09-06 07 | -201 | 25.7 | -0.08 | 0.0 |
| 2903652 | 2022-08-30 15 | 203 | 54.0 | -0.05 | -1.6 |
| 2901810 | 2022-09-06 06 | 197 | 30.9 | 0.01 | 1.3 |
| 5905061 | 2022-08-30 00 | -203 | 48.9 | -0.15 | 0.9 |
| 2903650 | 2022-08-27 18 | — | 0.0 | -0.04 | 0.5 |
| 2903687 | 2022-08-31 07 | -217 | 51.4 | -0.11 | 3.3 |
| 2903690 | 2022-08-30 19 | -227 | 54.0 | -0.14 | 4.1 |
| 5906522 | 2022-08-28 21 | 232 | 32.2 | -0.06 | 0.6 |
| 2903651 | 2022-08-27 20 | 240 | 0.0 | 0.02 | -0.2 |
| 2903695 | 2022-08-30 22 | 242 | 53.2 | -0.01 | -0.3 |
| 2903425 | 2022-08-28 06 | 251 | 18.0 | -0.04 | 0.6 |
| 2903626 | 2022-08-30 05 | -287 | 51.0 | -0.04 | -0.1 |
Argo floats captured by TC Hinnamnor in the western North Pacific during 2022.
t 0 is the arrival time of TC. At t0, x0 is the cross-track coordinate, Vmax is the maximum sustain wind speed of TC, ΔSST is the SST change as referred to 1 day before, and ΔMLD is the corresponding MLD change. Only x0 ≤300 km is shown here.
For all TCs in 2022, the average number of Argo floats deployed was 36.5. However, for high-category TCs, this number dropped to 17.3. During TCs Malakas, Hinnamnor and Kulap, the number of Argo floats deployed under high-category TC conditions exceeded 40 (Figure 3B). Malakas was observed by greatest number of floats as the number of 108. During TC Aere, a significant number of Argo floats were captured within a 500 km search radius (number is 58). However, the number of Argo floats observed under high-category TCs remained limited, with only 18 floats remaining. TCs Meari and Tokage also captured a considerable number of floats, with a total of 73 and 77 floats, respectively. Notably, for high-category TCs, the number of floats during Meari and Tokage remained nearly 40. Considering Muifa, Nanmadol and Talas, there were some Argo floats around the genesis area. Similarly, 70 Argo floats were captured by Roke, and the Argo floats located at both left and right sides of TC tracks.
3.4 Integrated observation by surface drifter and Argo float
We examined the transient observations of Typhoon Hinnamnor by combining data from both surface drifters and Argo floats (Figure 7). On the initial day of the typhoon’s presence (Day 00), there were 11 surface drifters and 4 Argo floats deployed. By the following day (Day 01), the number of surface drifters had increased to 16, while the number of Argo float decreased to 1. On the subsequent day (Day 02), the count reduced to 7 surface drifters and 1 Argo float. Day 03 saw 2 Argo floats operational, with 1 surface drifter detected. Similarly, on Day 04, 3 Argo floats remained active. Moving to Day 05, 5 surface drifters were operational, with 3 of them belonging to our deployment. Additionally, 1 Argo float was operational. Notably, on this day, the typhoon moved slowly. Day 06 recorded 4 surface drifters, with 3 of them belonging to our deployment, along with 2 Argo floats. On Day 07, only 1 surface drifter was active, and by Day 08, neither surface drifters nor Argo floats were available.
Figure 7
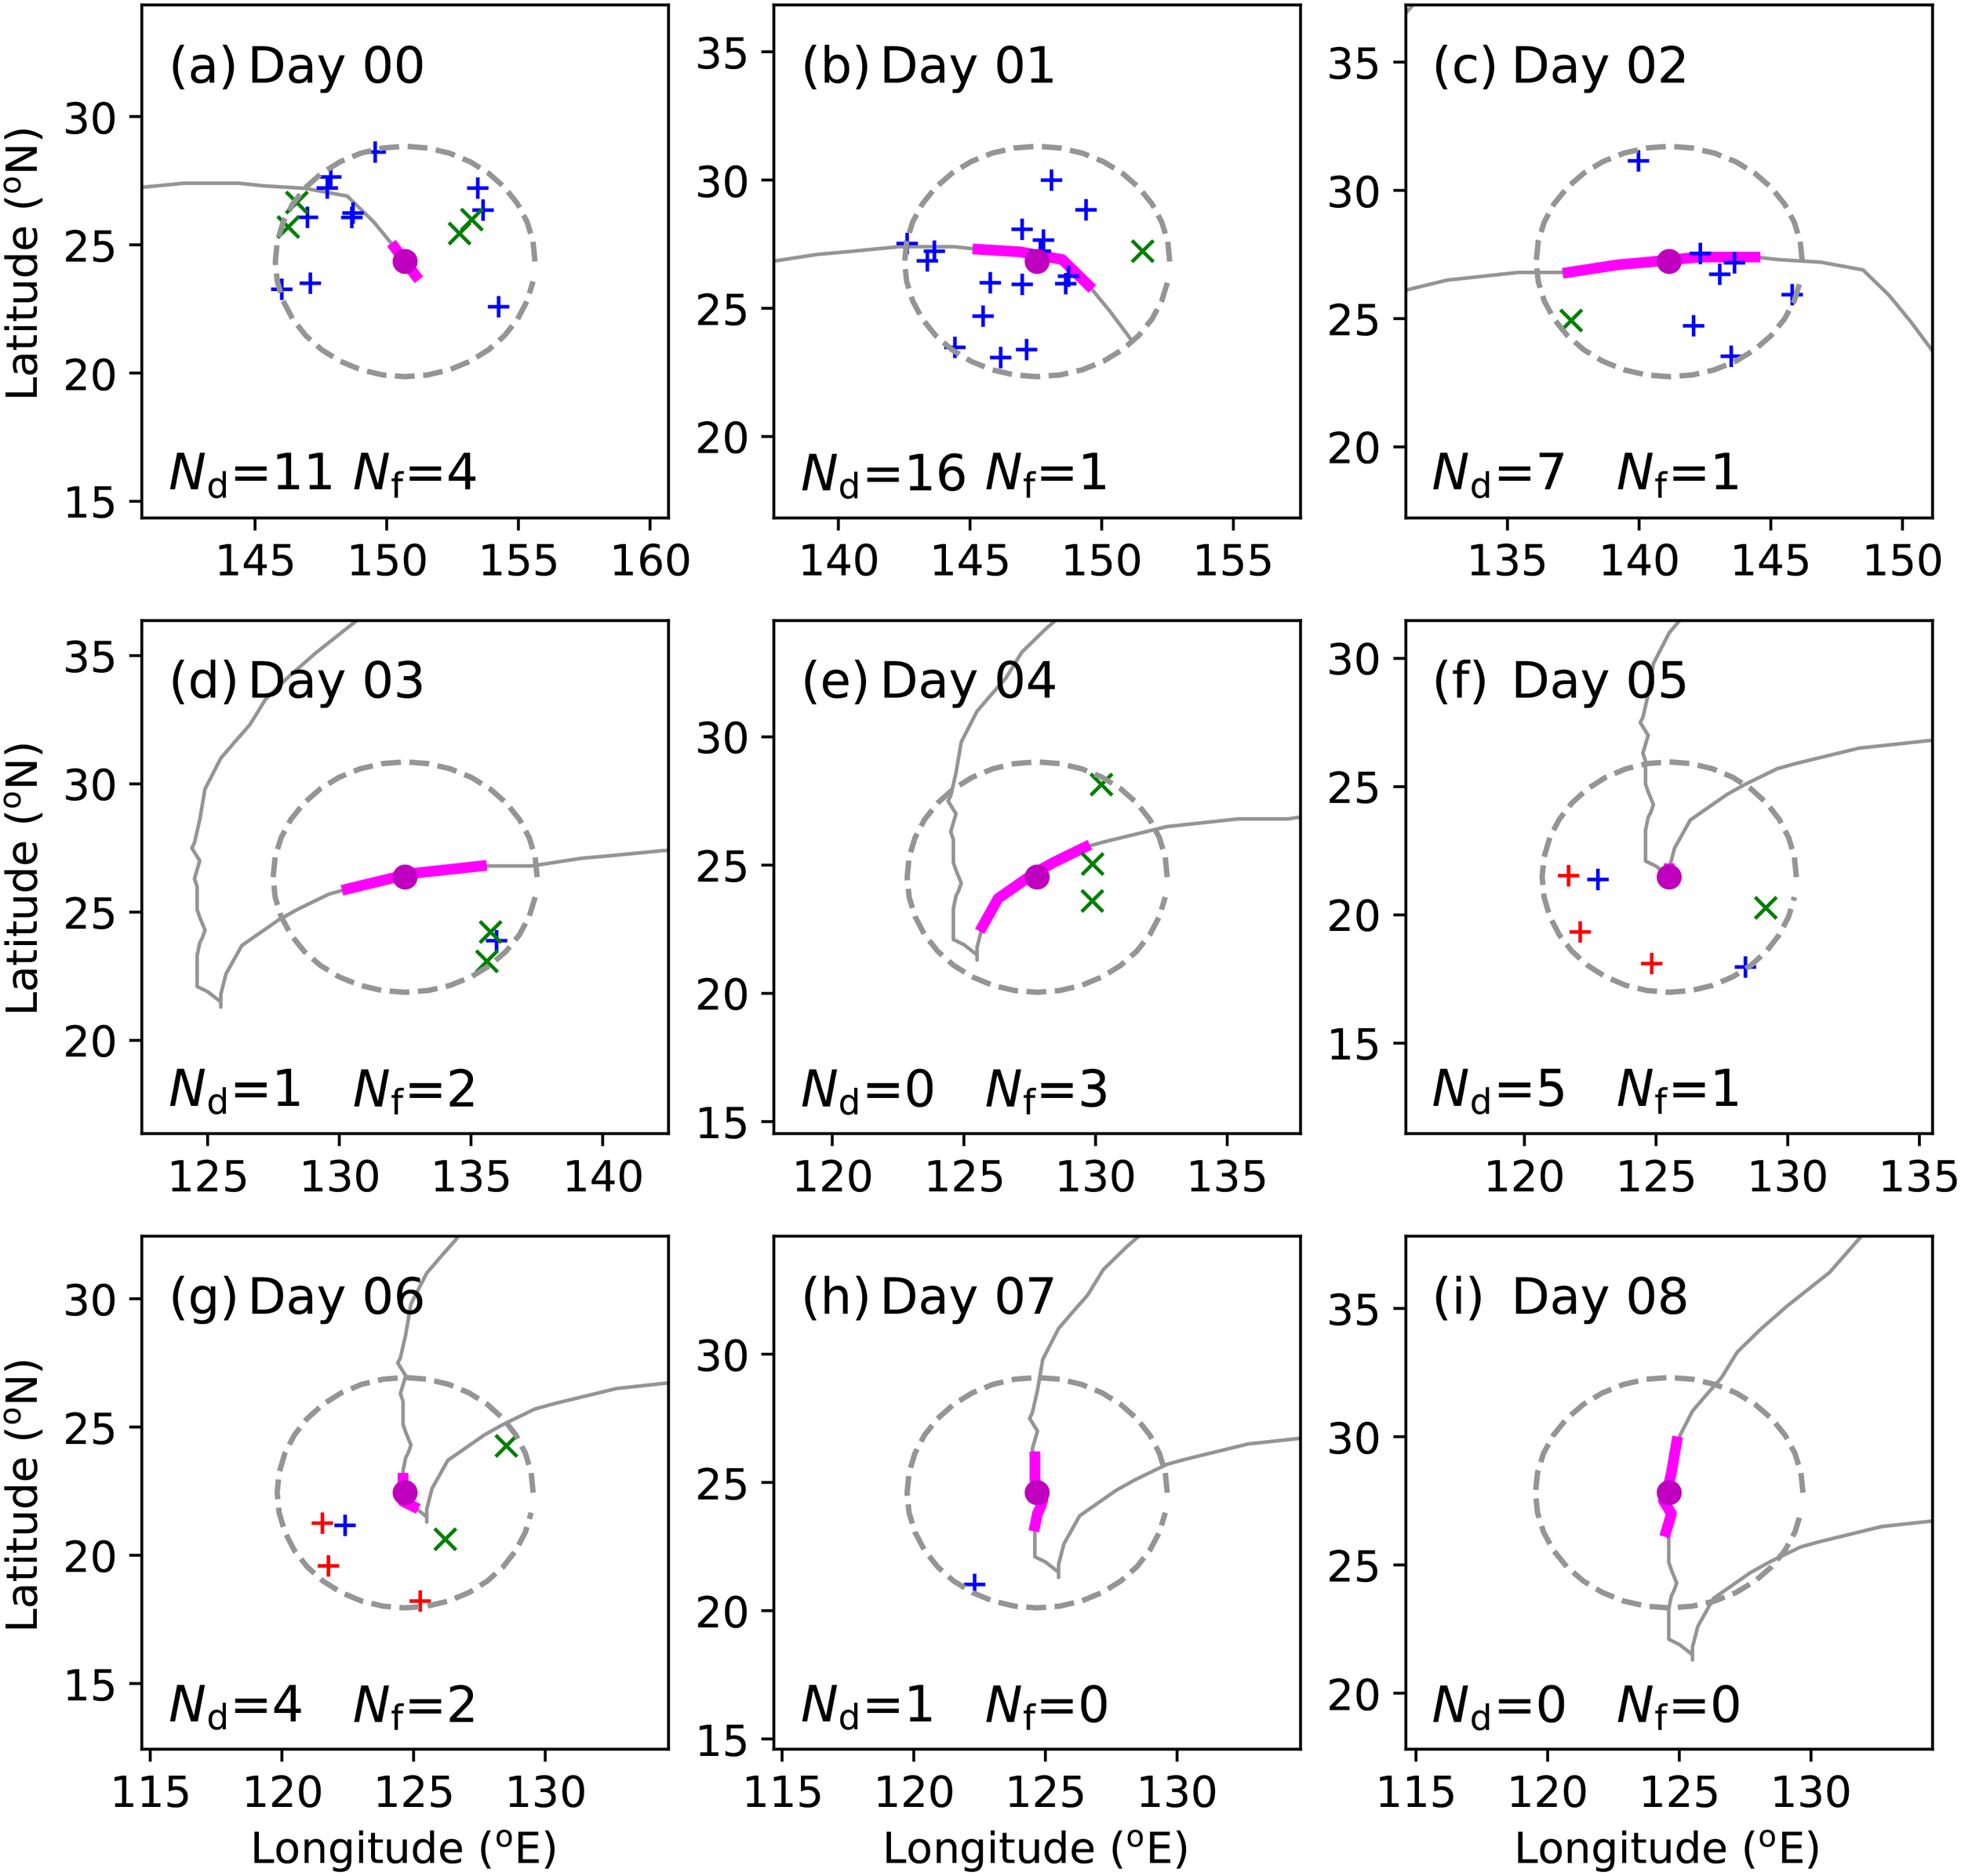
Transient integrated observations of ocean response to TC Hinnamnor. TC-following longitude-latitude coordinate is used. Gray solid line is the best track of TC. Magenta line is the TC track in the every day. Magenta circle (marker) represents the TC eye. Gray circle (dashed line) represents 500 km search radius. Blue plus (marker) indicates the surface drifter from Global Drifter Program. Red plus (marker) shows our surface drifter. Green cross (marker) represents the Argo float. Nd and Nf are the numbers of captured surface drifters and floats, respectively.
4 Discussion
We deployed 8 surface drifters in the western North Pacific, and some of them were influenced by TCs in 2022. Our surface drifter data are reliable for the following two reasons: Firstly, the spatial pattern under TC-following coordinates emphasizes the vortex distribution, with the current on the right side significantly higher than that on the left side. Secondly, the transient differences between our drifters and GDP drifters are not markedly different. The relative difference in current speed was 30.23%, and the difference in current direction was -16.42°. It is also worth noting that the distance between these two drifters was 68 km (see Table 3).
On average, there were approximately 6.1 drifters deployed during periods of relatively high-category tropical cyclones (with maximum sustained wind speeds exceeding 17.5 m/s), aimed at measuring surface currents and SST (see Figure 3). Additionally, during these high-category TC events, there were an average of 17.3 Argo floats deployed for profiling observations. Given that the typical repeat time of Argo floats is nearly 10 days, the transient observations of ocean responses to tropical cyclones are still somewhat limited in the case of TCs.
After integrating the GDP and current surface drifters, the total surface measurement count reached as high as 16 at the beginning of Typhoon Hinnamnor. Our drifters offered new observations of the ocean response to typhoon Hinnamnor, which is particularly notable for its unusual track. Our drifter’s locations were within 500 km distance to the turning point of Hinnamnor’s track, providing new data on the ocean response to this abruptly turning TC.
Overall, there remains an inadequate observation of tropical cyclone-ocean interactions in the western North Pacific. More surface drifters and Argo floats are required in future endeavors. Meanwhile, the emergence of new unmanned observation platforms presents an opportunity for advancement. Further development should encompass a holistic approach, integrating gliders, unmanned ships/boats, and drifting meteorological buoys as well as present surface drifters and Argo floats (or other Argo-like floats). While there are fewer mooring buoys in the western North Pacific, some are available and should be considered for incorporation in future observational strategies. It is imperative to expand observation methods to provide a more comprehensive understanding of the ocean’s response and feedback to TCs.
Statements
Data availability statement
The raw data supporting the conclusions of this article will be made available by the authors, without undue reservation.
Author contributions
HH: Conceptualization, Formal analysis, Investigation, Visualization, Writing – original draft. ZL: Investigation, Writing – original draft. SW: Investigation, Writing – original draft. XL: Conceptualization, Writing – review & editing. ZZ: Conceptualization, Writing – review & editing. RT: Writing – review & editing. YW: Writing – review & editing. JS: Writing – review & editing.
Funding
The author(s) declare financial support was received for the research, authorship, and/or publication of this article. This research was supported by the National Natural Science Foundation of China (Grant no. 42227901), the Oceanic Interdisciplinary Program of Shanghai Jiao Tong University (Grant no. SL2020MS030), and the Scientific Research Fund of the Second Institute of Oceanography, MNR (Grand no. JG2301).
Conflict of interest
The authors declare that the research was conducted in the absence of any commercial or financial relationships that could be construed as a potential conflict of interest.
Publisher’s note
All claims expressed in this article are solely those of the authors and do not necessarily represent those of their affiliated organizations, or those of the publisher, the editors and the reviewers. Any product that may be evaluated in this article, or claim that may be made by its manufacturer, is not guaranteed or endorsed by the publisher.
References
1
Bender M. A. Ginis I. Tuleya R. Thomas B. Marchok T. (2007). The operational GFDL coupled hurricane–ocean prediction system and a summary of its performance. Monthly Weather Rev.135, 3965–3989. doi: 10.1175/2007MWR2032.1
2
Cao Y. Wang X. Shao C. (2022). Global estimate of tropical cyclone-induced diapycnal mixing and its links to climate variability. J. Geophysical Research: Oceans127, e2021JC017950. doi: 10.1029/2021JC017950
3
Chang Y.-C. Chen G.-Y. Tseng R.-S. Centurioni L. R. Chu P. C. (2013). Observed near-surface flows under all tropical cyclone intensity levels using drifters in the northwestern Pacific. J. Geophysical Research: Oceans118, 2367–2377. doi: 10.1002/jgrc.20187
4
Chen H. Li S. He H. Song J. Ling Z. Cao A. et al . (2021). Observational study of super typhoon Meranti, (2016) using satellite, surface drifter, Argo float and reanalysis data. Acta Oceanologica Sin.40, 70–84. doi: 10.1007/s13131-021-1702-9
5
Choi J. M. Kim W. (2018). “Applications of surface velocity current derived from Geostationary Ocean Color Imager (GOCI),” in 2018 OCEANS - MTS/IEEE Kobe Techno-Oceans (OTO), IEEE1–4. doi: 10.1109/OCEANSKOBE.2018.8559174
6
Deng X. (2016). Satellite Altimetry (Cham: Springer International Publishing), 1–5. doi: 10.1007/978-3-319-02370-058-1
7
Fan S. Zhang B. Perrie W. Mouche A. Liu G. Li H. et al . (2022). Observed ocean surface winds and mixed layer currents under tropical cyclones: Asymmetric characteristics. J. Geophysical Research: Oceans127, e2021JC017991. doi: 10.1029/2021JC017991
8
Fu H. Wang X. Chu P. C. Zhang X. Han G. Li W. (2014). Tropical cyclone footprint in the ocean mixed layer observed by Argo in the northwest Pacific. J. Geophysical Research: Oceans119, 8078–8092. doi: 10.1002/2014JC010316
9
Gray W. (1998). The formation of tropical cyclones. Meteorl. Atmos. Phys.67, 37–69. doi: 10.1007/BF01277501
10
Hansen D. V. Poulain P.-M. (1996). Quality control and interpolations of WOCE-TOGA drifter data. J. Atmospheric Oceanic Technol.13, 900–909. doi: 10.1175/1520-0426(1996)013⟨0900:QCAIOW⟩2.0.CO;2
11
He H. Cao A. Wang Y. Song J. (2022). Evolution of oceanic near-inertial waves induced by typhoon Sarika, (2016) in the South China Sea. Dynamics Atmospheres Oceans100, 101332. doi: 10.1016/j.dynatmoce.2022.101332
12
He H. Tian R. Lyu X. Ling Z. Sun J. Cao A. (2024). Annual review of in situ observations of tropical cyclone–ocean interaction in the western North Pacific during 2023. Remote Sens.16, 1990. doi: 10.3390/rs16111990
13
Laurindo L. C. Mariano A. J. Lumpkin R. (2017). An improved near-surface velocity climatology for the global ocean from drifter observations. Deep Sea Res. Part I: Oceanographic Res. Papers124, 73–92. doi: 10.1016/j.dsr.2017.04.009
14
Lenain L. Melville W. K. (2014). Autonomous surface vehicle measurements of the ocean’s response to tropical cyclone Freda. J. Atmospheric Oceanic Technol.31, 2169–2190. doi: 10.1175/JTECH-D-14-00012.1
15
Li Y. Tang Y. Wang S. Li X. (2023). Rapid growth of tropical cyclone outer size over the western North Pacific. Remote Sens.15, 486. doi: 10.3390/rs15020486
16
Lumpkin R. Johnson G. C. (2013). Global ocean surface velocities from drifters: Mean, variance, El Niño–Southern Oscillation response, and seasonal cycle. J. Geophysical Research: Oceans118, 2992–3006. doi: 10.1002/jgrc.20210
17
Oey L. (2023). A simple model of sea-surface cooling under a tropical cyclone. J. Mar. Sci. Eng.11, 397. doi: 10.3390/jmse11020397
18
Oginni T. E. Li S. He H. Yang H. Ling Z. (2021). Ocean response to super-typhoon Haiyan. Water13, 2841. doi: 10.3390/w13202841
19
Prasad T. G. Hogan P. J. (2007). Upper-ocean response to hurricane Ivan in a 1/25° nested Gulf of Mexico HYCOM. J. Geophysical Research: Oceans112, C04013. doi: 10.1029/2006JC003695
20
Price J. F. (1981). Upper ocean response to a hurricane. J. Phys. Oceanography11, 153–175. doi: 10.1175/1520-0485(1981)011⟨0153:UORTAH⟩2.0.CO;2
21
Röhrs J. Sperrevik A. K. Christensen K. H. Broström G. Breivik Ø. (2015). Comparison of HF radar measurements with Eulerian and Lagrangian surface currents. Ocean Dynamics65, 679–690. doi: 10.1007/s10236-015-0828-8
22
Sanford T. B. Price J. F. Girton J. B. (2011). Upper-ocean response to hurricane Frances, (2004) observed by profiling EM-APEX floats. J. Phys. Oceanography41, 1041–1056. doi: 10.1175/2010JPO4313.1
23
Tavakoli S. Khojasteh D. Haghani M. Hirdaris S. (2023). A review on the progress and research directions of ocean engineering. Ocean Eng.272, 113617. doi: 10.1016/j.oceaneng.2023.113617
24
Wada A. Uehara T. Ishizaki S. (2014). Typhoon-induced sea surface cooling during the 2011 and 2012 typhoon seasons: observational evidence and numerical investigations of the sea surface cooling effect using typhoon simulations. Prog. Earth Planetary Sci.1, 11. doi: 10.1186/2197-4284-1-11
25
Wang H. Li J. Song J. Leng H. Wang H. Zhang Z. et al . (2023a). The abnormal track of super typhoon Hinnamnor (2022) and its interaction with the upper ocean. Deep Sea Res. Part I: Oceanographic Res. Papers201, 104160. doi: 10.1016/j.dsr.2023.104160
26
Wang Q. Zhao D. J. Duan Y. H. Guan S. D. Dong L. Xu H. X. et al . (2023b). Super typhoon Hinnamnor (2022) with a record-breaking lifespan over the western North Pacific. Adv. Atmos. Sci.40, 1558–1566. doi: 10.1007/s00376-023-2336-y
27
Wu Q. Chen D. (2012). Typhoon-induced variability of the oceanic surface mixed layer observed by Argo floats in the western North Pacific Ocean. Atmosphere-Ocean50, 4–14. doi: 10.1080/07055900.2012.712913
28
Yu C. Yang Y. Yin X. Sun M. Shi Y. (2020). Impact of enhanced wave-induced mixing on the ocean upper mixed layer during typhoon Nepartak in a regional model of the Northwest Pacific Ocean. Remote Sens.12, 2808. doi: 10.3390/rs12172808
29
Zhang H. Liu Y. Liu P. Guan S. Wang Q. Zhao W. et al . (2023). Enhanced upper ocean response within a warm eddy to typhoon Nakri (2019) during the sudden-turning stage. Deep Sea Res. Part I: Oceanographic Res. Papers199, 104112. doi: 10.1016/j.dsr.2023.104112
Summary
Keywords
surface drifter, Argo float, in situ observation, tropical cyclone, western North Pacific
Citation
He H, Ling Z, Wu S, Lyu X, Zeng Z, Tian R, Wang Y and Sun J (2024) In situ observation of ocean response to tropical cyclone in the western North Pacific during 2022. Front. Mar. Sci. 11:1445071. doi: 10.3389/fmars.2024.1445071
Received
06 June 2024
Accepted
21 August 2024
Published
12 September 2024
Volume
11 - 2024
Edited by
Xingru Feng, Chinese Academy of Sciences (CAS), China
Reviewed by
Aifeng Tao, Hohai University, China
Jian Shi, National University of Defense Technology, China
Updates
Copyright
© 2024 He, Ling, Wu, Lyu, Zeng, Tian, Wang and Sun.
This is an open-access article distributed under the terms of the Creative Commons Attribution License (CC BY). The use, distribution or reproduction in other forums is permitted, provided the original author(s) and the copyright owner(s) are credited and that the original publication in this journal is cited, in accordance with accepted academic practice. No use, distribution or reproduction is permitted which does not comply with these terms.
*Correspondence: Hailun He, hehailun@sio.org.cn
Disclaimer
All claims expressed in this article are solely those of the authors and do not necessarily represent those of their affiliated organizations, or those of the publisher, the editors and the reviewers. Any product that may be evaluated in this article or claim that may be made by its manufacturer is not guaranteed or endorsed by the publisher.