Text Correction
In the published article, there was an error. The default seawater dimethylsulfide (DMS) climatology used in the ACCESS-AM2 simulations was incorrectly named as the Lana et al. (2011) climatology and should be Kettle et al. (1999). ACCESS-AM2 uses the GA7.1 configuration, in which the seawater DMS climatology is described as being updated from Kettle et al. (1999) to Lana et al. (2011) (Walters et al., 2019). Since publication, it was found that the model was still using the Kettle et al. (1999) climatology.
In the article, the influence of coral reef-derived DMS was investigated by calculating the difference between a control and experimental simulation which respectively prescribed seawater DMS concentration using the default climatology and a climatology derived for the GBR (Jackson et al., 2021). Using Kettle et al. (1999) as the default climatology does not affect the results, as the difference between the control and experimental simulations still reflects the influence of the coral reef DMS source. Further, no new seawater DMS measurements for the GBR region have been incorporated into newer climatologies (Lana et al., 2011; Hulswar et al., 2022) since Kettle et al. (1999).
A correction has been made to section 1 Introduction, paragraph 9. This sentence previously stated:
“Global climate models typically prescribe DMSw concentrations using the Lana et al. (2011) monthly mean climatology. This climatology was derived from four decades of DMSw observations over most of the global ocean (Kettle et al., 1999). However, very few observations were included for coral reef regions and extrapolation did not account for seasonal or spatial variability across coral reef flats and lagoon waters.”
The corrected sentence appears below:
“Global climate models typically prescribe DMSw concentrations using the Kettle et al. (1999) or Lana et al. (2011) monthly mean climatologies. These climatologies were derived from more than three decades of DMSw observations over most of the global ocean (Kettle et al., 1999). However, very few observations were included for coral reef regions and extrapolation did not account for seasonal or spatial variability across coral reef flats and lagoon waters.”
A correction has been made to section 2.2 Experimental design, 2.2.1 Seawater surface DMS concentration, paragraph 1. This sentence previously stated:
“In ACCESS-AM2, DMSw is prescribed from the global Lana et al. (2011) monthly mean climatology, henceforth L11 (Figure 1A).”
The corrected sentence appears below:
“In ACCESS-AM2, DMSw is prescribed from the global Kettle et al. (1999) monthly mean climatology, henceforth K99 (Figure 1A).”
The name of the default seawater DMS climatology should be “K99” instead of “L11” throughout the remainder of the article, including in Table 1, in the legends for Table 2 and Figures 1–4 in the main article, and in the legends for SI Figures 1, 2, 4, 5 in the Supplementary Material. The corrected Table 1, Table 2, and Figures 1–4 appear below.
Table 1
| Mean | Range | ||
|---|---|---|---|
| RVI | Observed | 33 | <1 – 158 |
| (n = 456) | K99 | 86 (+ 53) | 8 – 213 |
| GBR DMS | 114 (+ 81) | 33 – 245 | |
| Mission Beach | Observed | 31 | 9 – 99 |
| (n = 296) | K99 | 80 (+ 49) | 27 – 187 |
| GBR DMS | 89 (+ 58) | 41 – 195 | |
| Heron Island | Observed | 90 | 49 – 156 |
| (n = 274) | K99 | 157 (+ 67) | 60 – 289 |
| GBR DMS | 199 (+ 109) | 74 – 316 |
Mean and range of observed and modelled DMSa (ppt or pmol mol-1) during the RVI, Mission Beach and Heron Island surveys of the R2R campaign [concentration (deviation from observed mean)].
Table 2
| Experiment 1 | Experiment 2 | |
|---|---|---|
| DMS flux (μmol m-2 d-1) | +0.6 (25.1%) | +0.6 (25.9%) |
| DMSa (ppt) | +29.4 (29.2%) | +29.5 (29.3%) |
| SO2 (ppt) | +5.6 (1.4%) | +3.0 (0.9%) |
| H2SO4 (ppt) | +5.4 x10⁻³ (3.0%) | +6.2 x10⁻³ (4.0%) |
| Nuc. sul. mass (ppt) | -5.2 x10⁻⁵ (1.0%) | -4.9 x10⁻⁶ (0.1%) |
| Ait. sul. mass (ppt) | +0.3 (0.8%) | +0.4 (1.2%) |
| Acc. sul. mass (ppt) | +0.04 (0.01%) | -14.5 (3.6%) |
| Crs. sul. mass (ppt) | +0.2 (2.4%) | +0.05 (0.7%) |
| Nuc. no. (m-3) | -1.1 x10⁻²¹ (0.6%) | -1.1 x10⁻²¹ (0.6%) |
| Ait. no. (m-3) | -1.5 x10⁻²⁰ (0.2%) | +1.1 x10⁻²⁰ (0.2%) |
| Acc. no. (m-3) | -8.4 x10⁻²¹ (0.1%) | -1.1 x10⁻²⁰ (0.1%) |
| Crs. no. (m-3) | +2.3 x10⁻²² (0.5%) | -8.6 x10⁻²³ (0.2%) |
| N3 (cm-3) | -0.3 (0.1%) | +0.3 (0.1%) |
| CCN70 (cm-3) | -0.03 (0.01%) | -0.3 (0.1%) |
| Nd (m-3) | +0.07 (0.04%) | -0.3 (0.2%) |
| SWR (W m-2) | +0.07 (0.03%) | -0.2 (0.1%) |
| Wind (m s-1) | -7.3 x10⁻³ (0.1%) | +3.9 x10⁻³ (0.1%) |
Annual mean change [actual (percentage)] between the GBR DMS and K99 simulations area-averaged over north-eastern Australia.
* Nuc., nucleation; Ait., Aitken; Acc., accumulation; Crs., coarse; sul., sulfate; no., number concentration; SWR, surface downwelling short-wave radiation; Wind, wind speed at 10 m.
Figure 1
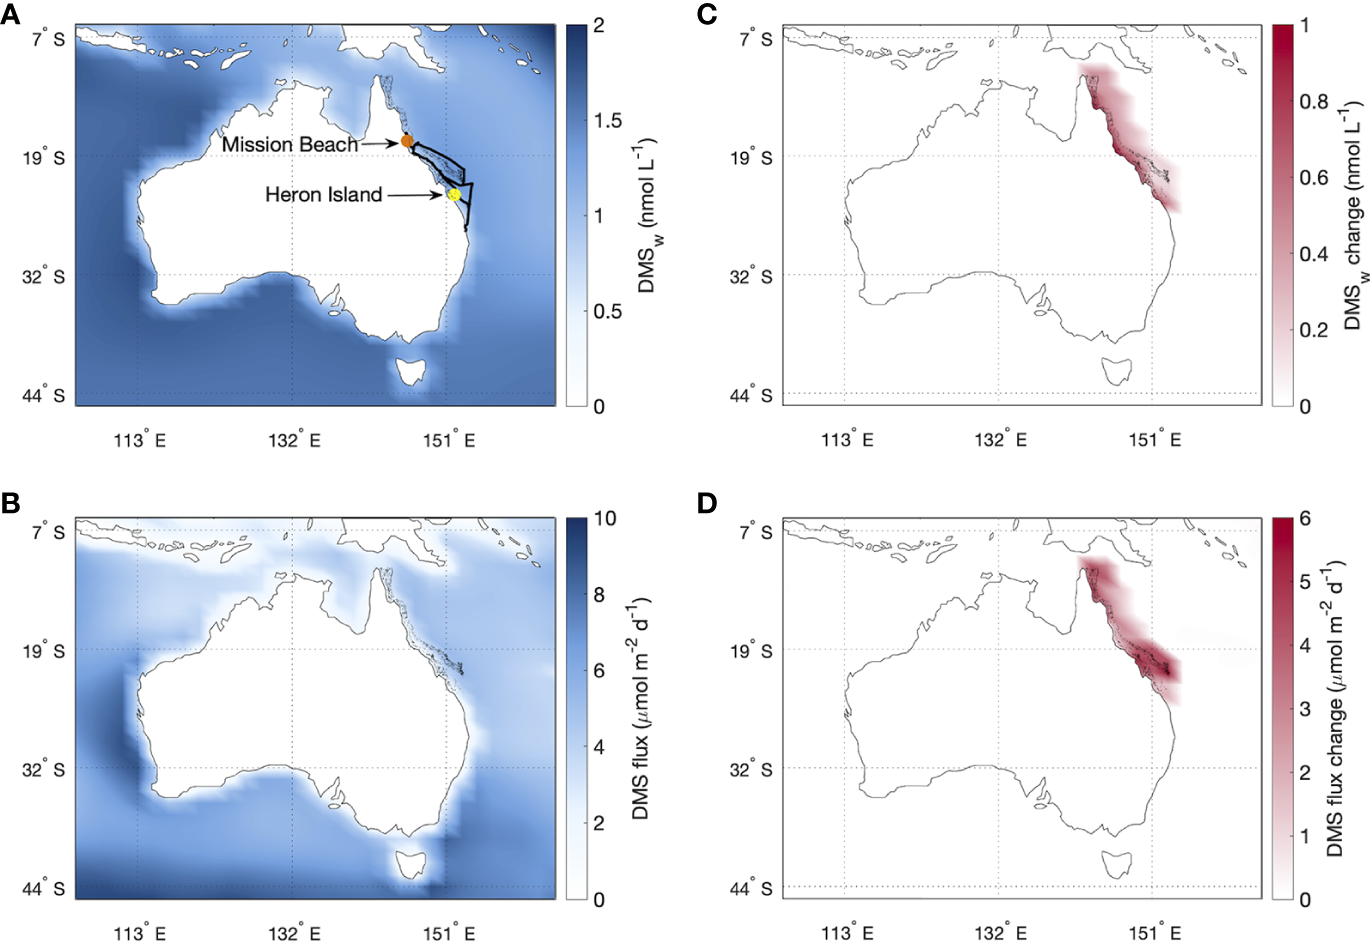
Annual mean (A) DMSw and (B) DMS sea-air flux based on the K99 climatology, and the change in each variable due to the inclusion of (C) the GBR DMS climatology and (D) the GBR DMS climatology and coral-air DMS flux. The RVI path (black), Mission Beach (orange) and Heron Island (yellow) survey locations are shown in (A).
Figure 2
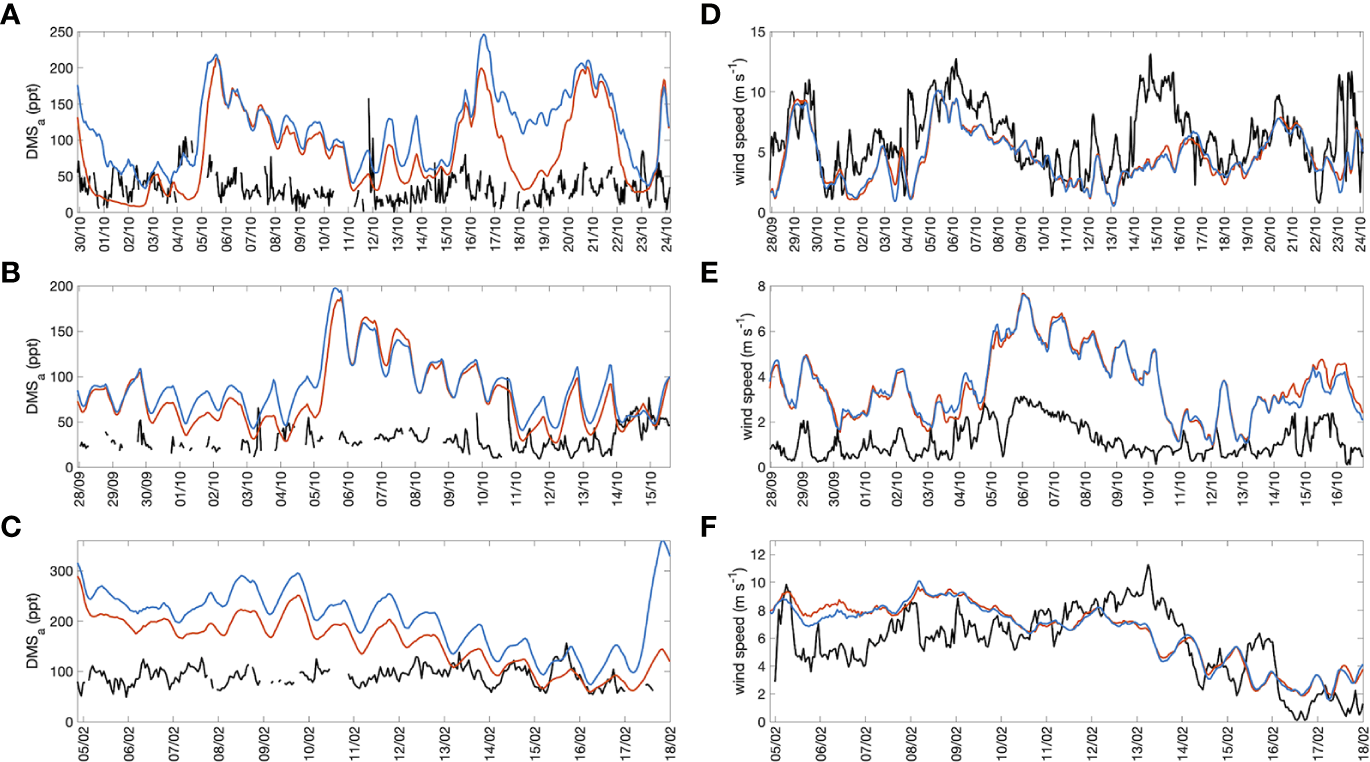
Time-series of observed (black) and modelled (left panels) DMSa and (right panels) wind speed for the K99 (orange) and GBR DMS (blue) simulations during the (A, D) RVI, (B, E) Mission Beach and (C, F) Heron Island surveys.
Figure 3
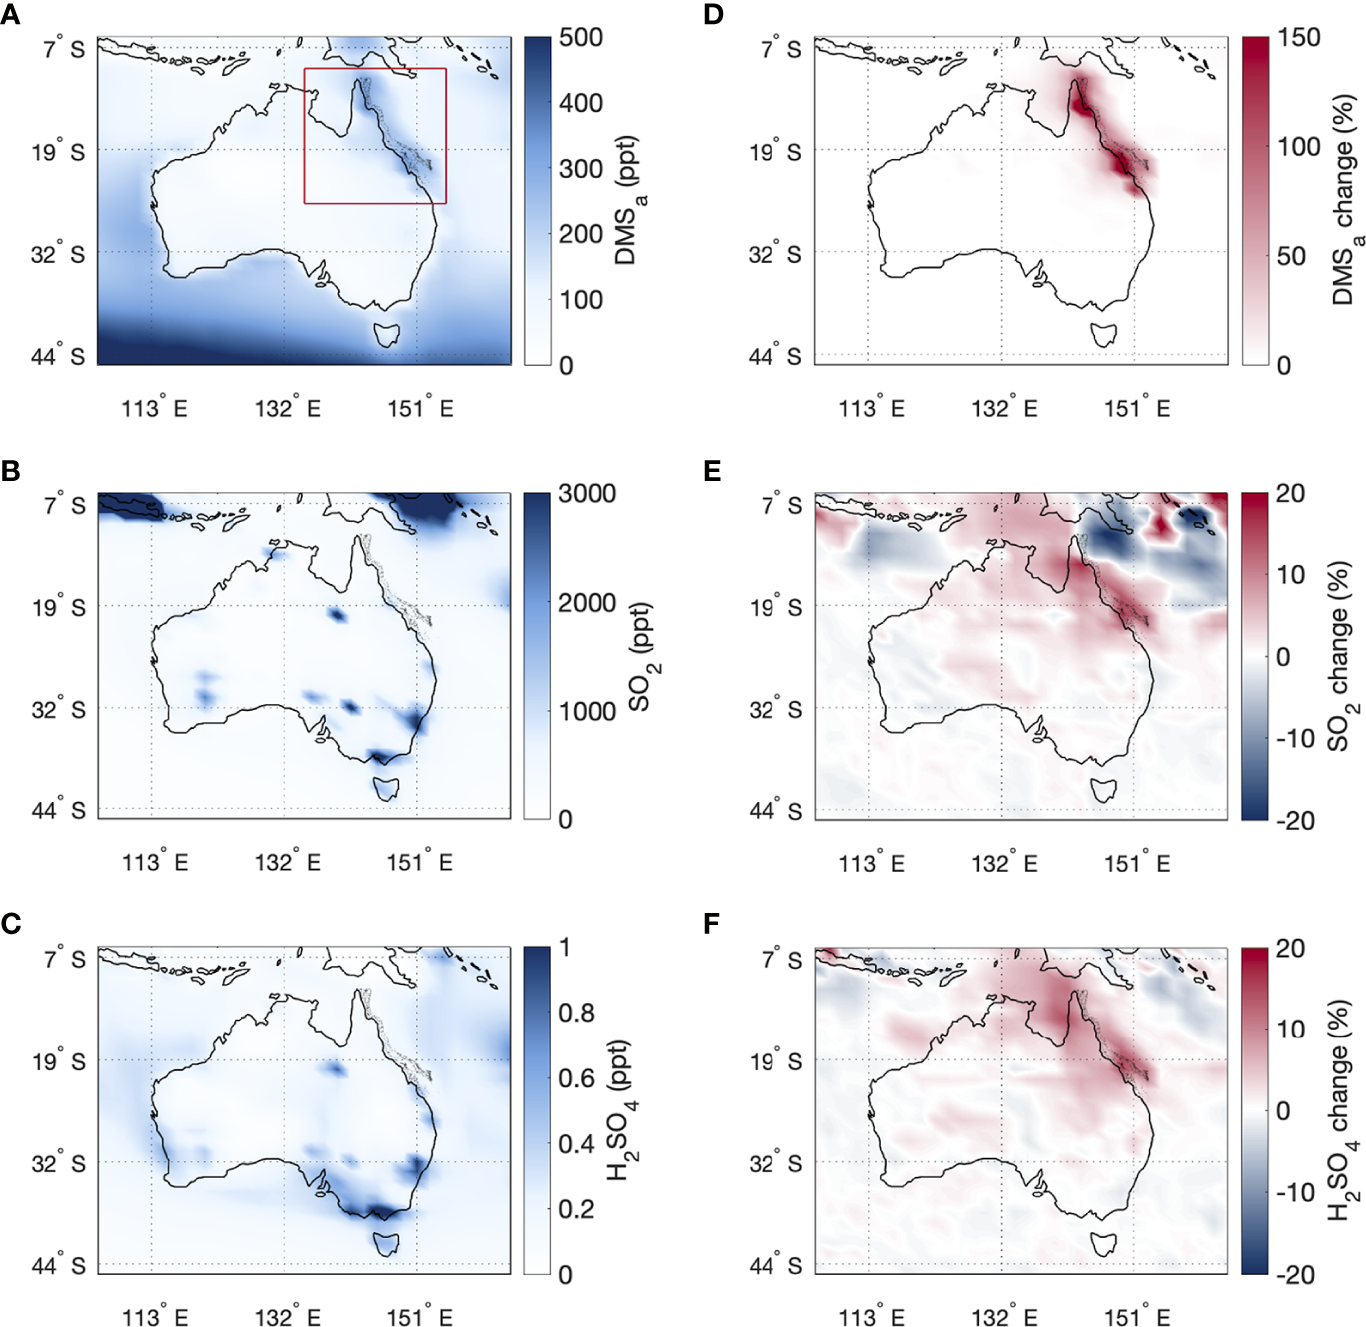
Annual mean (A) DMSa, (B) SO2 and (C) H2SO4 for the GBR DMS simulation, and (D–F) the percentage change in each variable between the GBR DMS and K99 simulations. The north-eastern Australian region (9.5-26°S; 135-155°E) for which the area-averaged changes are calculated for Table 2 is shown in red in panel (A).
Figure 4
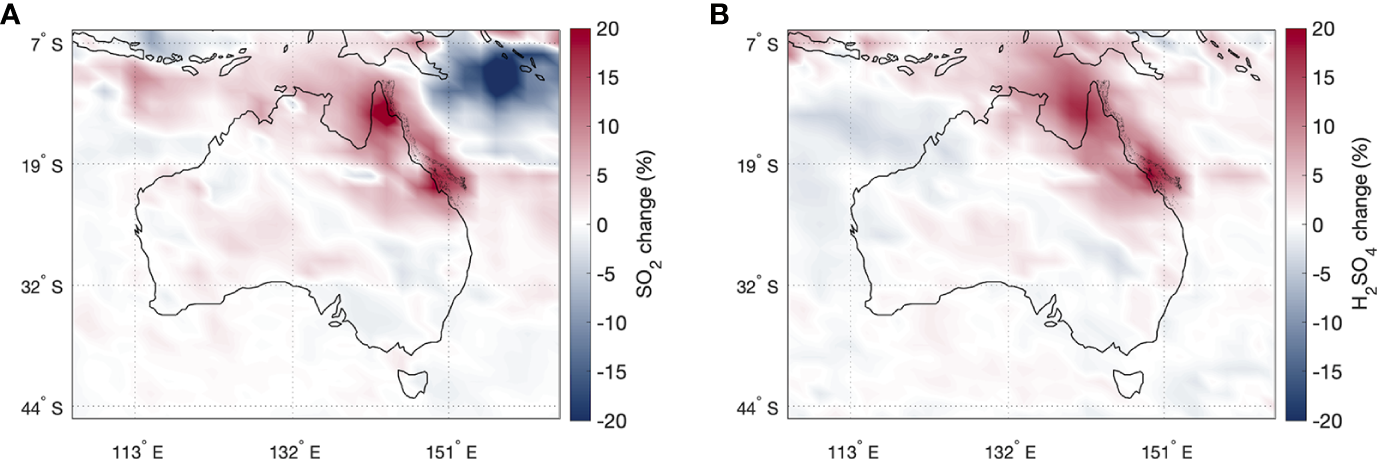
Change in annual mean (A) SO2 and (B) H2SO4 between the GBR DMS and K99 simulations, when high anthropogenic SO2 emissions from north-eastern Australia have been removed.
The authors apologize for this error and state that this does not change the scientific conclusions of the article in any way. The original article has been updated.
Statements
Publisher’s note
All claims expressed in this article are solely those of the authors and do not necessarily represent those of their affiliated organizations, or those of the publisher, the editors and the reviewers. Any product that may be evaluated in this article, or claim that may be made by its manufacturer, is not guaranteed or endorsed by the publisher.
References
1
Hulswar S. Simo R. Galí M. Bell T. G. Lana A. Inamdar S. et al . (2022). Third revision of the global surface seawater dimethyl sulfide climatology (DMS-Rev3). Earth System Sci. Data14, 2963–2987. doi: 10.5194/essd-14-2963-2022
2
Jackson R. L. Gabric A. J. Matrai P. A. Woodhouse M. T. Cropp R. A. Jones G. B. et al . (2021). Parameterizing the impact of seawater temperature and irradiance on dimethylsulfide (DMS) in the great barrier reef and the contribution of coral reefs to the global sulfur cycle. J. Geophys. Res.: Oceans126, e2020JC016783. doi: 10.1029/2020JC016783
3
Kettle A. J. Andreae M. O. Amouroux D. Andreae T. W. Bates T. S. Berresheim H. et al . (1999). A global database of sea surface dimethylsulfide (DMS) measurements and a procedure to predict sea surface DMS as a function of latitude, longitude, and month. Global Biogeochem. Cycles13 (2), 399–444. doi: 10.1029/1999GB900004
4
Lana A. Bell T. G. Simó R. Vallina S. M. Ballabrera-Poy J. Kettle A. J. et al . (2011). An updated climatology of surface dimethlysulfide concentrations and emission fluxes in the global ocean. Global Biogeochem. Cycles25 (1), GB1004. doi: 10.1029/2010GB003850
5
Walters D. Baran A. J. Boutle I. Brooks M. Earnshaw P. Edwards J. et al . (2019). The Met Office Unified Model global atmosphere 7.0/7.1 and JULES global land 7.0 configurations. Geoscientific Model. Dev.12, 1909–1963. doi: 10.5194/gmd-12-1909-2019
Summary
Keywords
coral reef, dimethylsulfide (DMS), sulfate, aerosol, ACCESS
Citation
Jackson RL, Woodhouse MT, Gabric AJ, Cropp RA, Swan HB, Deschaseaux ESM and Trounce H (2024) Corrigendum: Modelling the influence of coral-reef-derived dimethylsulfide on the atmosphere of the Great Barrier Reef, Australia. Front. Mar. Sci. 11:1445211. doi: 10.3389/fmars.2024.1445211
Received
06 June 2024
Accepted
07 June 2024
Published
17 July 2024
Approved by
Frontiers Editorial Office, Frontiers Media SA, Switzerland
Volume
11 - 2024
Updates
Copyright
© 2024 Jackson, Woodhouse, Gabric, Cropp, Swan, Deschaseaux and Trounce.
This is an open-access article distributed under the terms of the Creative Commons Attribution License (CC BY). The use, distribution or reproduction in other forums is permitted, provided the original author(s) and the copyright owner(s) are credited and that the original publication in this journal is cited, in accordance with accepted academic practice. No use, distribution or reproduction is permitted which does not comply with these terms.
*Correspondence: Rebecca L. Jackson, rebecca.jackson@csiro.au
†Present address: Rebecca L. Jackson, Coasts and Ocean Research, Oceans and Atmosphere, Commonwealth Scientific and Industrial Research Organisation, Canberra, ACT, Australia
Disclaimer
All claims expressed in this article are solely those of the authors and do not necessarily represent those of their affiliated organizations, or those of the publisher, the editors and the reviewers. Any product that may be evaluated in this article or claim that may be made by its manufacturer is not guaranteed or endorsed by the publisher.