Abstract
The eastern oyster, Crassostrea virginica, is a keystone species native to the Gulf of Mexico and Atlantic coasts of the United States and Canada. It provides habitat for other marine organisms and makes up the majority of oyster production in the United States. Despite its tolerance to hypoxic conditions, C. virginica is threatened by anthropogenic climate change, which is increasing both average temperature and the frequency and severity of hypoxic events. In this study, we explore the differences in hypoxia-transcriptional response between two populations of eastern oysters with known differences in hypoxia tolerance at three time points over the course of a 5-day hypoxia treatment. We identified sets of genes involved in the hypoxia response and found differences in both the timing and baseline expression of hypoxia-responsive genes between tolerant and sensitive populations, consistent with a scenario of local adaptation. Analysis of differential gene expression between the two populations and conditions revealed two gene modules with higher baseline expression of hypoxia-sensitive genes in the more hypoxia tolerant population. Key GO terms for genes corresponding to differences between populations include DNA repair, ribosome biogenesis, and ribonucleotide binding. Our results imply that differences in hypoxia tolerance between populations could be due to genetic frontloading of hypoxia response pathways in the more tolerant population.
1 Introduction
Eutrophication and warming due to anthropogenic climate change are increasing both the frequency and severity of hypoxic (<2 mg O2/L) and anoxic (0 mg O2/L) events globally (Lenihan and Peterson, 1998; Justić et al., 2005; Durack and Wijffels, 2010; Breitburg et al., 2018). For example, in the Gulf of Mexico, a “dead zone” characterized by low oxygen availability is formed every spring and summer on the Texas/Louisiana shelf (Dodds, 2006). Exposure to hypoxia has been shown to affect many conditions in aquatic organisms, from feeding behaviors and metabolism to growth and larval settlement (Baker and Mann, 1992; Keppel et al., 2016). Hypoxia has also caused mass declines in fishery production and an increase in mortality for marine organisms worldwide (Wu, 2002). In particular, long periods of decreased dissolved oxygen (DO) concentrations at higher temperatures can be harmful to sessile benthic invertebrates such as the eastern oyster (Crassostrea virginica), despite a documented tolerance to low DO (Baker and Mann, 1992; Lenihan and Peterson, 1998; Johnson et al., 2009). Understanding the factors that govern sensitivity to hypoxia is crucial to predicting how oysters, and the marine environments they support, may be affected by climate change in the future.
Whenever individuals or populations of a species vary in stress tolerance, there is an opportunity to investigate underlying mechanisms generating that variation (Sanford and Kelly, 2011; DeBiasse and Kelly, 2016). Preliminary studies have demonstrated differences in tolerance to hypoxic conditions between Texas and Louisiana oyster populations at elevated temperature with physiological experiments performed on F1 common-garden reared oysters showing that the Louisiana population experiences mortality sooner than the Texas population in a time course of decreasing oxygen levels (Coxe et al., 2023, Figure 1). As in other cases of local adaptation, understanding adaptations to environmental gradients across space will help us understand how populations may adapt to changes in those environments through time and avoid extinction (Blois et al., 2013; Lovell et al., 2023). Here we used comparative transcriptomics to explore the physiological response to hypoxia and identify differences in gene expression between two populations of oysters that differ in hypoxia tolerance.
Figure 1
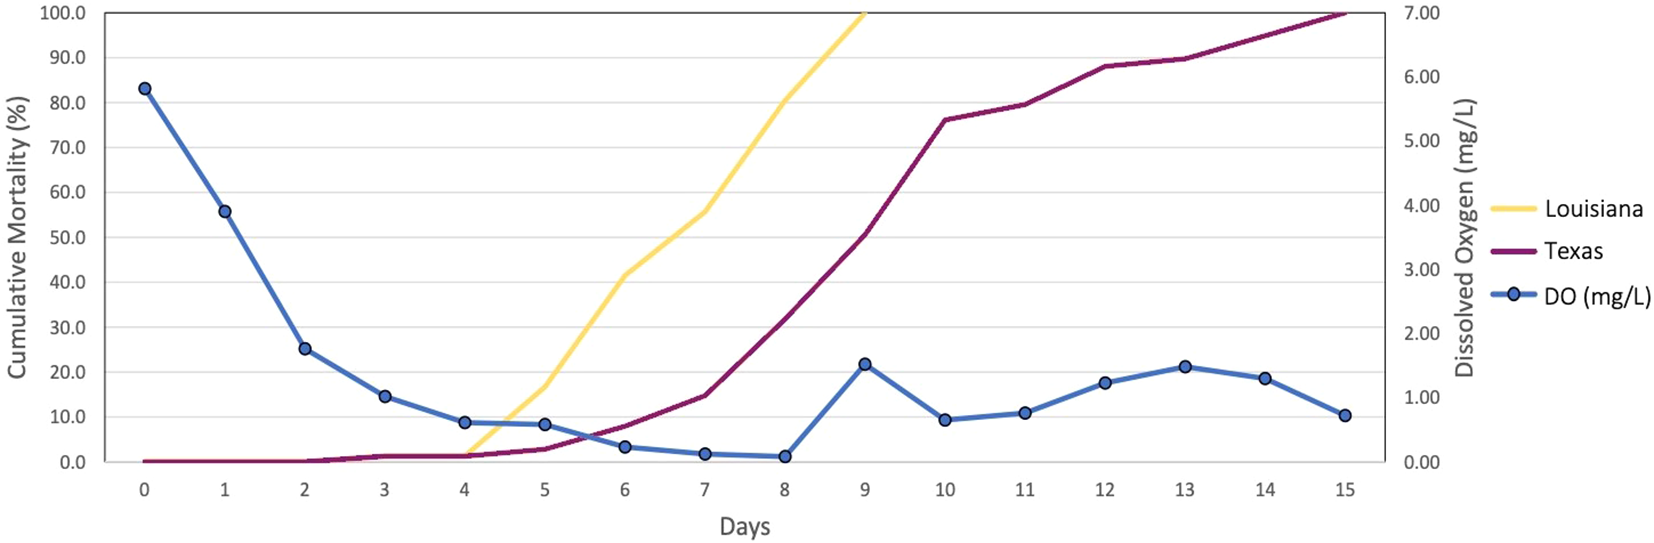
Cumulative Mortality Results at 32°C. The X-axis displays the number of days the experiment persisted, starting at day 0 and coinciding with the decline in oxygen concentrations. The Y-axis on the left shows the percent cumulative mortality. The Y-axis on the right shows the concentration of dissolved oxygen in mg/L (Adapted from Coxe et al., 2023).
Hypoxia leads to cellular damage by many different mechanisms. One major contributor to this damage is reoxygenation and the subsequent increase in the production of reactive oxygen species (ROS) (Ivanina and Sokolova, 2016; Zhang et al., 2016). When the cell undergoes the hypoxia/reoxygenation (H/R) cycle and normoxic respiration begins, ROS production is accelerated, resulting in damage to lipids, proteins, DNA, and the mitochondria (Philipp et al., 2012; Ivanina and Sokolova, 2016; Adzigbli et al., 2022). Mitochondria, the primary producer of cellular ATP, are critical in the cellular response to the H/R cycle and are responsible for processes to maintain cell function and signaling (Ivanina and Sokolova, 2016). Hypoxia has also been shown to lead to transcriptional or translational downregulation of most DNA repair pathways, including DNA double-strand break repair, mismatch repair, and nucleotide excision repair (Mihaylova et al., 2003; Scanlon and Glazer, 2015; Tang et al., 2021). Adaptations in hypoxia and anoxia tolerant organisms, such as fish and mollusks, include the ability to preserve mitochondrial function, decrease the metabolic rate, and increase ATP production through alternative fermentative pathways, resulting in more ATP produced per unit of metabolized substrate (Ivanina et al., 2011; Ivanina and Sokolova, 2016; Steffen et al., 2020). Ribosomal function and biogenesis is also highly linked to the hypoxia response, having been shown to restore translation when it is inhibited by the effects of hypoxia in C. elegans (Itani et al., 2021). Other fundamental pathways implicated in hypoxia response are the highly evolutionarily conserved Hypoxia-Inducible Factor (HIF) pathway, which signals inadequacy in oxygen supply across the animal kingdom by many mechanisms (Wang and Semenza, 1993; Bunn and Poyton, 1996; Guillemin and Krasnow, 1997; Semenza, 2012), and in particular in the hypoxia tolerant mussel Mytilus galloprovincialis (Giannetto et al., 2015).
In this study, we explore the patterns of differential expression of hypoxia-responsive genes and pathways using comparative transcriptomics. The transcriptome, or set of RNA transcripts produced by a cell, tissue, or organism, is a phenotype, and it can change in response to environmental stressors; thus, by using transcriptomic approaches, we are able to explore patterns of gene expression between organisms or environmental conditions in order to gain insights into the mechanisms that generate phenotypic variation and local adaptation to stress (DeBiasse and Kelly, 2016). While transcriptomic approaches have the complication of deciphering the interplay of downstream traits that will ultimately affect the individual’s fitness, they are a valuable tool to find potentially essential differences among populations that vary in their response to environmental changes (DeBiasse and Kelly, 2016). Sussarellu et al. (2010) used microarray data to study the transcriptomic response of the Pacific oyster, Crassostrea gigas, to hypoxic conditions. Their analysis found upregulation in genes related to antioxidant defense and detoxification of reactive oxygen species in the more tolerant populations (Sussarellu et al., 2010). Other studies examining the effects of hypoxia on other organisms have found key changes in expression in genes related to DNA repair, ribosomal biogenesis and the composition of ribosomes (Brumwell et al., 2020; Hou et al., 2021; Itani et al., 2021; Metge et al., 2021), as well as genes involved in oxygen sensing and stress response, such as COX1 (Woo et al., 2013), hypoxia-inducible factors (HIFs), Hif-prolyl hydroxylases (PHD) (Giannetto et al., 2015), heat-shock proteins (Philipp et al., 2012), and mantle mRNAs involved in extending valve closure times and reducing mortality (Maynard et al., 2018). A study investigating the transcriptomic responses of two populations of shallow-water clams (Aequiyoldia cf. eightsii) to temperature and hypoxic stress indicated that the two populations differed in overall coping strategy, with the West Antarctic Peninsula clams exhibiting a switch to a metabolic rate depression strategy, while the southern South America population showed no comparable response, and had a high prevalence of differentially expressed genes related to apoptosis, indicating that they are operating near their physiological limits already (Martínez et al., 2023). Through physiological and transcriptomic studies, we can address questions concerning individual and population level adaptations to stressors that could provide insights into organisms’ ability to withstand global change and provide suggestions on how to combat loss of biodiversity. In the current study, we use transcriptomics to compare the response of two populations of C. virginica in the Gulf of Mexico to hypoxic conditions. We expected to find population differences in the expression of genes related to known hypoxia-sensitive pathways, such as those related to stress response, mitochondrial function, ribosome biogenesis, and DNA repair.
2 Materials and methods
2.1 Sampling and experimental design
We studied F1 individuals from two populations of the eastern oyster, Crassostrea virginica, which naturally vary in their response to hypoxia stress. Wild broodstocks were collected from estuaries located in Packery Channel, Texas (PC; 27° 37’ 38” N, 97° 13’ 59” W) and Calcasieu Lake, Louisiana (CL; 29° 50’ 58” N, 93° 17’ 1” W) (Figure 2). In the summer of 2018, F1 individuals were reared at the Auburn University Shellfish Hatchery in Dauphin Island, Alabama in Bayou Sullivan (30° 21’ 52” N, 88° 12’ 57” W), as described in Marshall et al. (2021). In the spring of 2019, individuals were moved to the Grand Bay Oyster Park in Alabama (GBOP), (30° 22’ 15” N, 88° 19’ 0” W) for further growth prior to use for the hypoxia experiment.
Figure 2
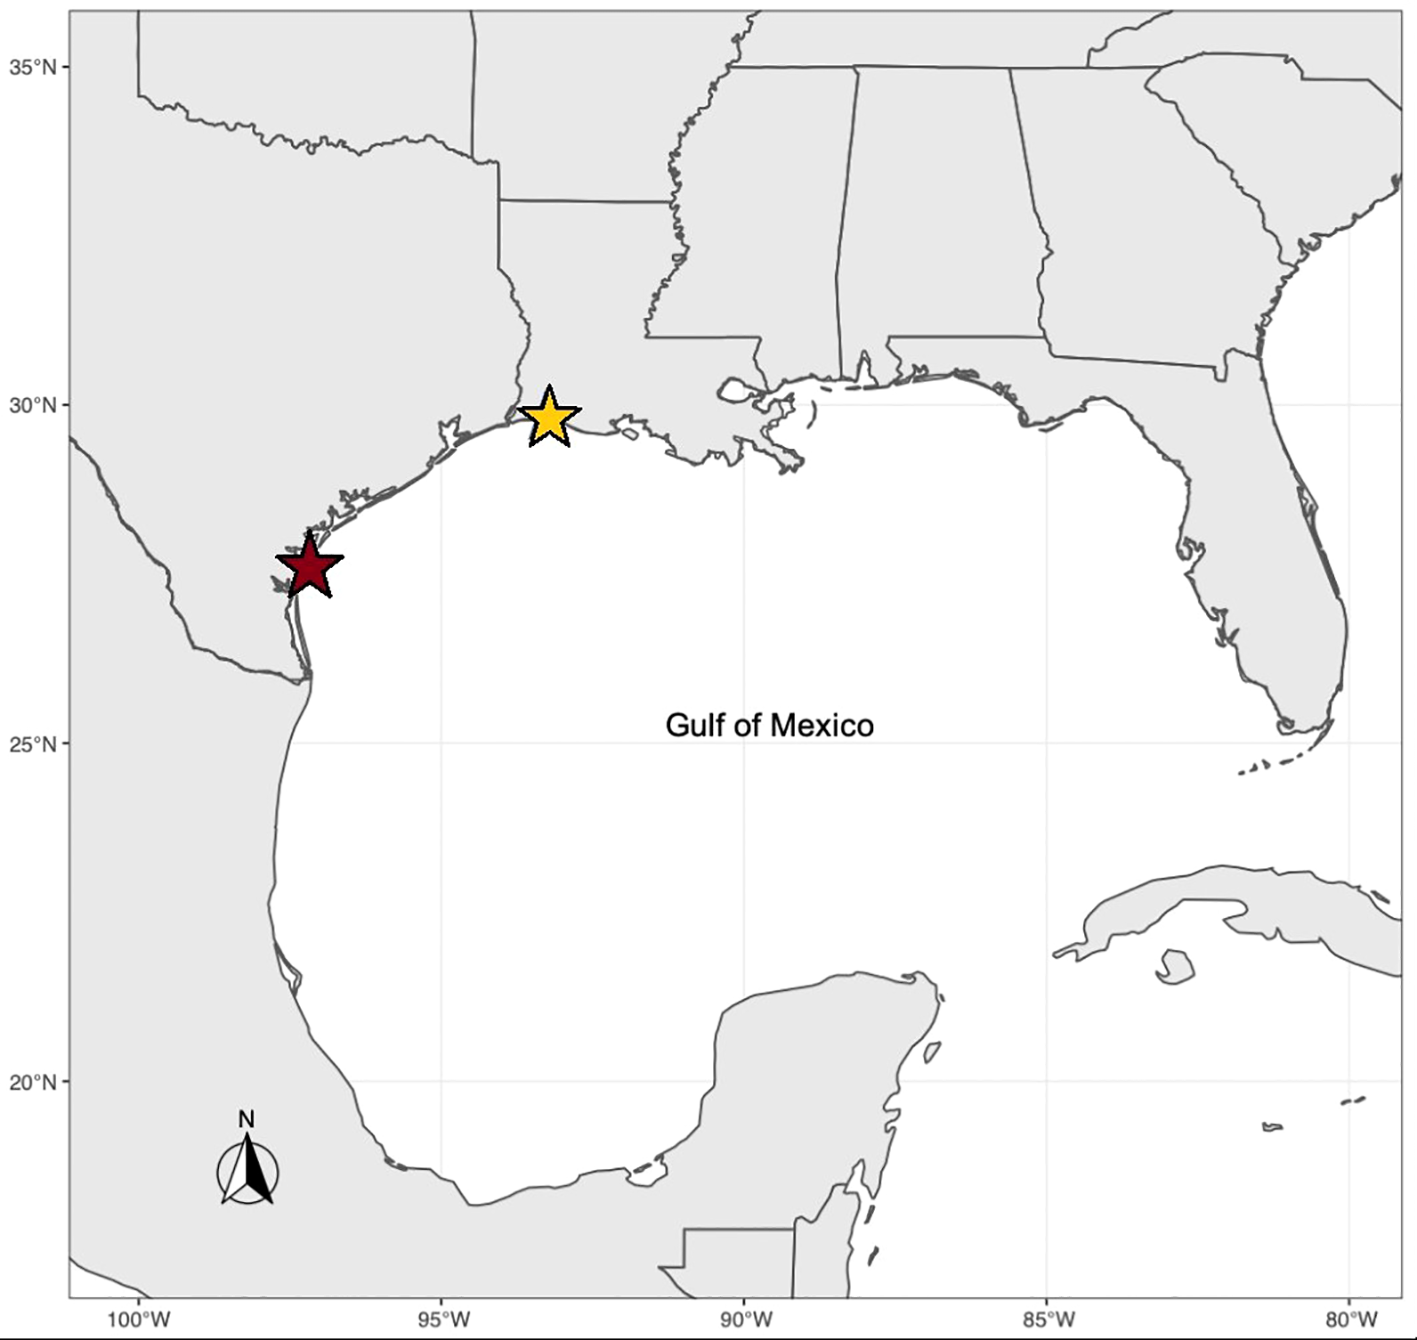
Sampling locations of eastern oyster populations sampled for transcriptomic response to hypoxia. The red star represents Packery Channel, Texas (tolerant population, 27° 37’ 38” N, 97° 13’ 59” W). The yellow star represents Calcasieu Lake, Louisiana (less tolerant population, 29° 50’ 58” N, 93° 17’ 1” W).
The hypoxia trial was conducted at the Louisiana State University Agricultural Center Animal and Food Sciences laboratory building in Baton Rouge, Louisiana. The experiment was run from the beginning of September 2019 to November 2019. Experimental setup is described in Coxe et al. (2023); briefly, we used 400-L tanks equipped with bio-filters, filled with artificial seawater (Crystal Sea Marinemix, Marine Enterprises International, Baltimore, Maryland, USA), and aerated using air stones. Salinity and temperature were adjusted to resemble that of the GBOP rearing site at the time of collection, 20 ppt and 28.9°C, respectively. The temperature was maintained using submersible heaters (Cobalt Aquatics Flat Neo-Therm 300W). Water salinity, temperature (°C), and dissolved oxygen (DO, mg/L) measurements were taken using a YSI-Pro30 handheld multimeter (YSI Incorporated, Yellow Springs, Ohio, USA).
At the beginning of the hypoxia trail, 85 F1 individuals from each population were put into two tanks, control and experimental, and acclimated to 32°C for one week. After acclimation, the number of individuals in each tank was adjusted to 80, feeding was stopped, and the air stones were removed from the experimental tank to allow for a natural decline in oxygen through the remainder of the trial. We assessed the number of live and dead individuals each day for two weeks, and dead oysters were removed. Mortality was assessed using the pinch test. Seven individuals were collected each day for three consecutive days. Of the seven collected four were used for RNA extractions (4 oyster x 2 populations x 2 tanks x 3 days = 48 total). We began collection on day 3 of the experiment as preliminary data suggested this was when the two populations would experience differences in hypoxia response and mortality rates (Coxe et al., 2023). Oysters were opened, and sections of the gill tissue were dissected and stored at -80°C for RNA extractions. Due to the removal of oysters through the course of the trial, interval and adjusted mortalities were calculated to determine the cumulative mortality rates (Ragone Calvo et al., 2003).
2.2 RNA extraction and sequencing
Gill tissue from each individual was homogenized and total RNA was extracted using an E.Z.N.A.® Total RNA Kit I (Omega BIO-TEK Inc., Norcross, GA, USA) following the manufacturer’s instructions. Initial RNA yield and quality were assessed using a NanoDrop 2000 spectrophotometer (Thermo Scientific, Plaquemine, Louisiana, USA). Total RNA for 48 samples was sent to the University of Texas at Austin’s Genomics Sequencing and Analysis Facility where RNA integrity was confirmed using a 2100 Agilent Bioanalyzer and Tag-Sequencing libraries, which sequences the 3’ end of the mRNA (Meyer et al., 2011; Lohman et al., 2016). The TruSeq libraries were sequenced on 2 lanes of an Illumina HiSeq 2500 platform producing 100bp single end reads.
2.3 Data processing and mapping
Initial read quality was assessed using Fastqc (Andrews, 2010) and polyX sequences removed with Fastp (Chen et al., 2018). Reads were then subjected to filtering and trimming with Trimmomatic (v 0.39) (Bolger et al., 2014) using default parameters. Trimmed reads were aligned to the C. virginica reference genome (Gómez-Chiarri et al., 2015) using STAR RNA-seq aligner (v 2.6.0a) (Dobin et al., 2013) with the options (–quantMode GeneCounts –outFilterScoreMinOverLread 0.5 –outFilterMatchNminOverLread 0.5).
2.4 Read counts and differential gene expression
Reads were counted using featureCounts in the SUBREAD package (v. 2.0.1) (Liao et al., 2014). The resulting data were used as input for principal component analysis (PCA) to visualize sample variation and detect outliers. The PCA showed one outlier; this sample was removed from further analysis. The count data were input into Rstudio (v 3.6.0) for gene expression analysis. Differential gene expression analysis was independently performed on each day/population resulting in a list of differentially expressed genes (DEGs) for each combination. In order to obtain a single list of DEGs that maximized the true positive rate and specificity (Costa-Silva et al., 2017), DE analysis was performed with DESeq2 (v 1.24.0) (Love et al., 2014), EdgeR (Robinson et al., 2010), and NOISeq (Tarazona et al., 2011). The resulting lists of DEGs were input into the R package VennDiagram and consensus lists of DEGs per day and population were obtained. DEGs were identified using a false discovery rate (FDR)-adjusted p-value cutoff of 0.01.
2.5 WGCNA and GO enrichment
The R package WGCNA (Langfelder and Horvath, 2008) was used to construct gene networks and identify modules of coexpressed genes. All samples residing in the expression matrix were used for the analysis, except for the removal of one outlier sample. The data were normalized with DESeq2 variance stabilizing transformation (VST) function and genes with low expression were filtered by having fewer than 15 counts in 75% samples. This resulted in the total number of 9453 genes used for the remaining WGCNA analysis. The network was constructed using a soft-threshold of 9 and a minimum module size of 30, with population and condition variables converted to a binary format. For each module of interest, the eigengene was visualized with ggplot2 (Wickham, 2016). Gene ontology enrichment analysis was conducted using topGO (Alexa and Rahnenfuhrer, 2020).
3 Results
3.1 Gene expression analysis
3.1.1 Data processing
48 Tag-seq libraries were prepared from Texas and Louisiana oyster populations using gill tissue sampled at three timepoints coinciding with decreased oxygen concentrations. Library size of all samples is shown in Supplementary Figure 1. All samples were successfully sequenced providing four biological replicates per experimental condition with an average single-end read length of 100bp. After preprocessing (adapter trimming and quality-base filtering), an average of 2.79 million reads per sample were kept for gene expression analysis. On average, 88.5% of reads from each library mapped to the reference genome, of which 53.9% mapped uniquely and 34.5% mapped to more than one location in the genome. The most updated annotation for Crassostrea virginica contained a total of 32,860 genes, which were used to estimate gene expression from read counts.
Principal component analysis was conducted to estimate the similarity among biological replicates. This analysis revealed clustering of samples based on population and experimental conditions using principal PC1 and PC2, but no clustering was evident based on hypoxic levels (experimental timepoints) (Figure 3). This analysis also revealed one outlier sample which was discarded from further analysis, reducing the data set to 47 samples for each tissue type, but still maintaining at least three biological replicates per condition (Supplementary Figure 2).
Figure 3
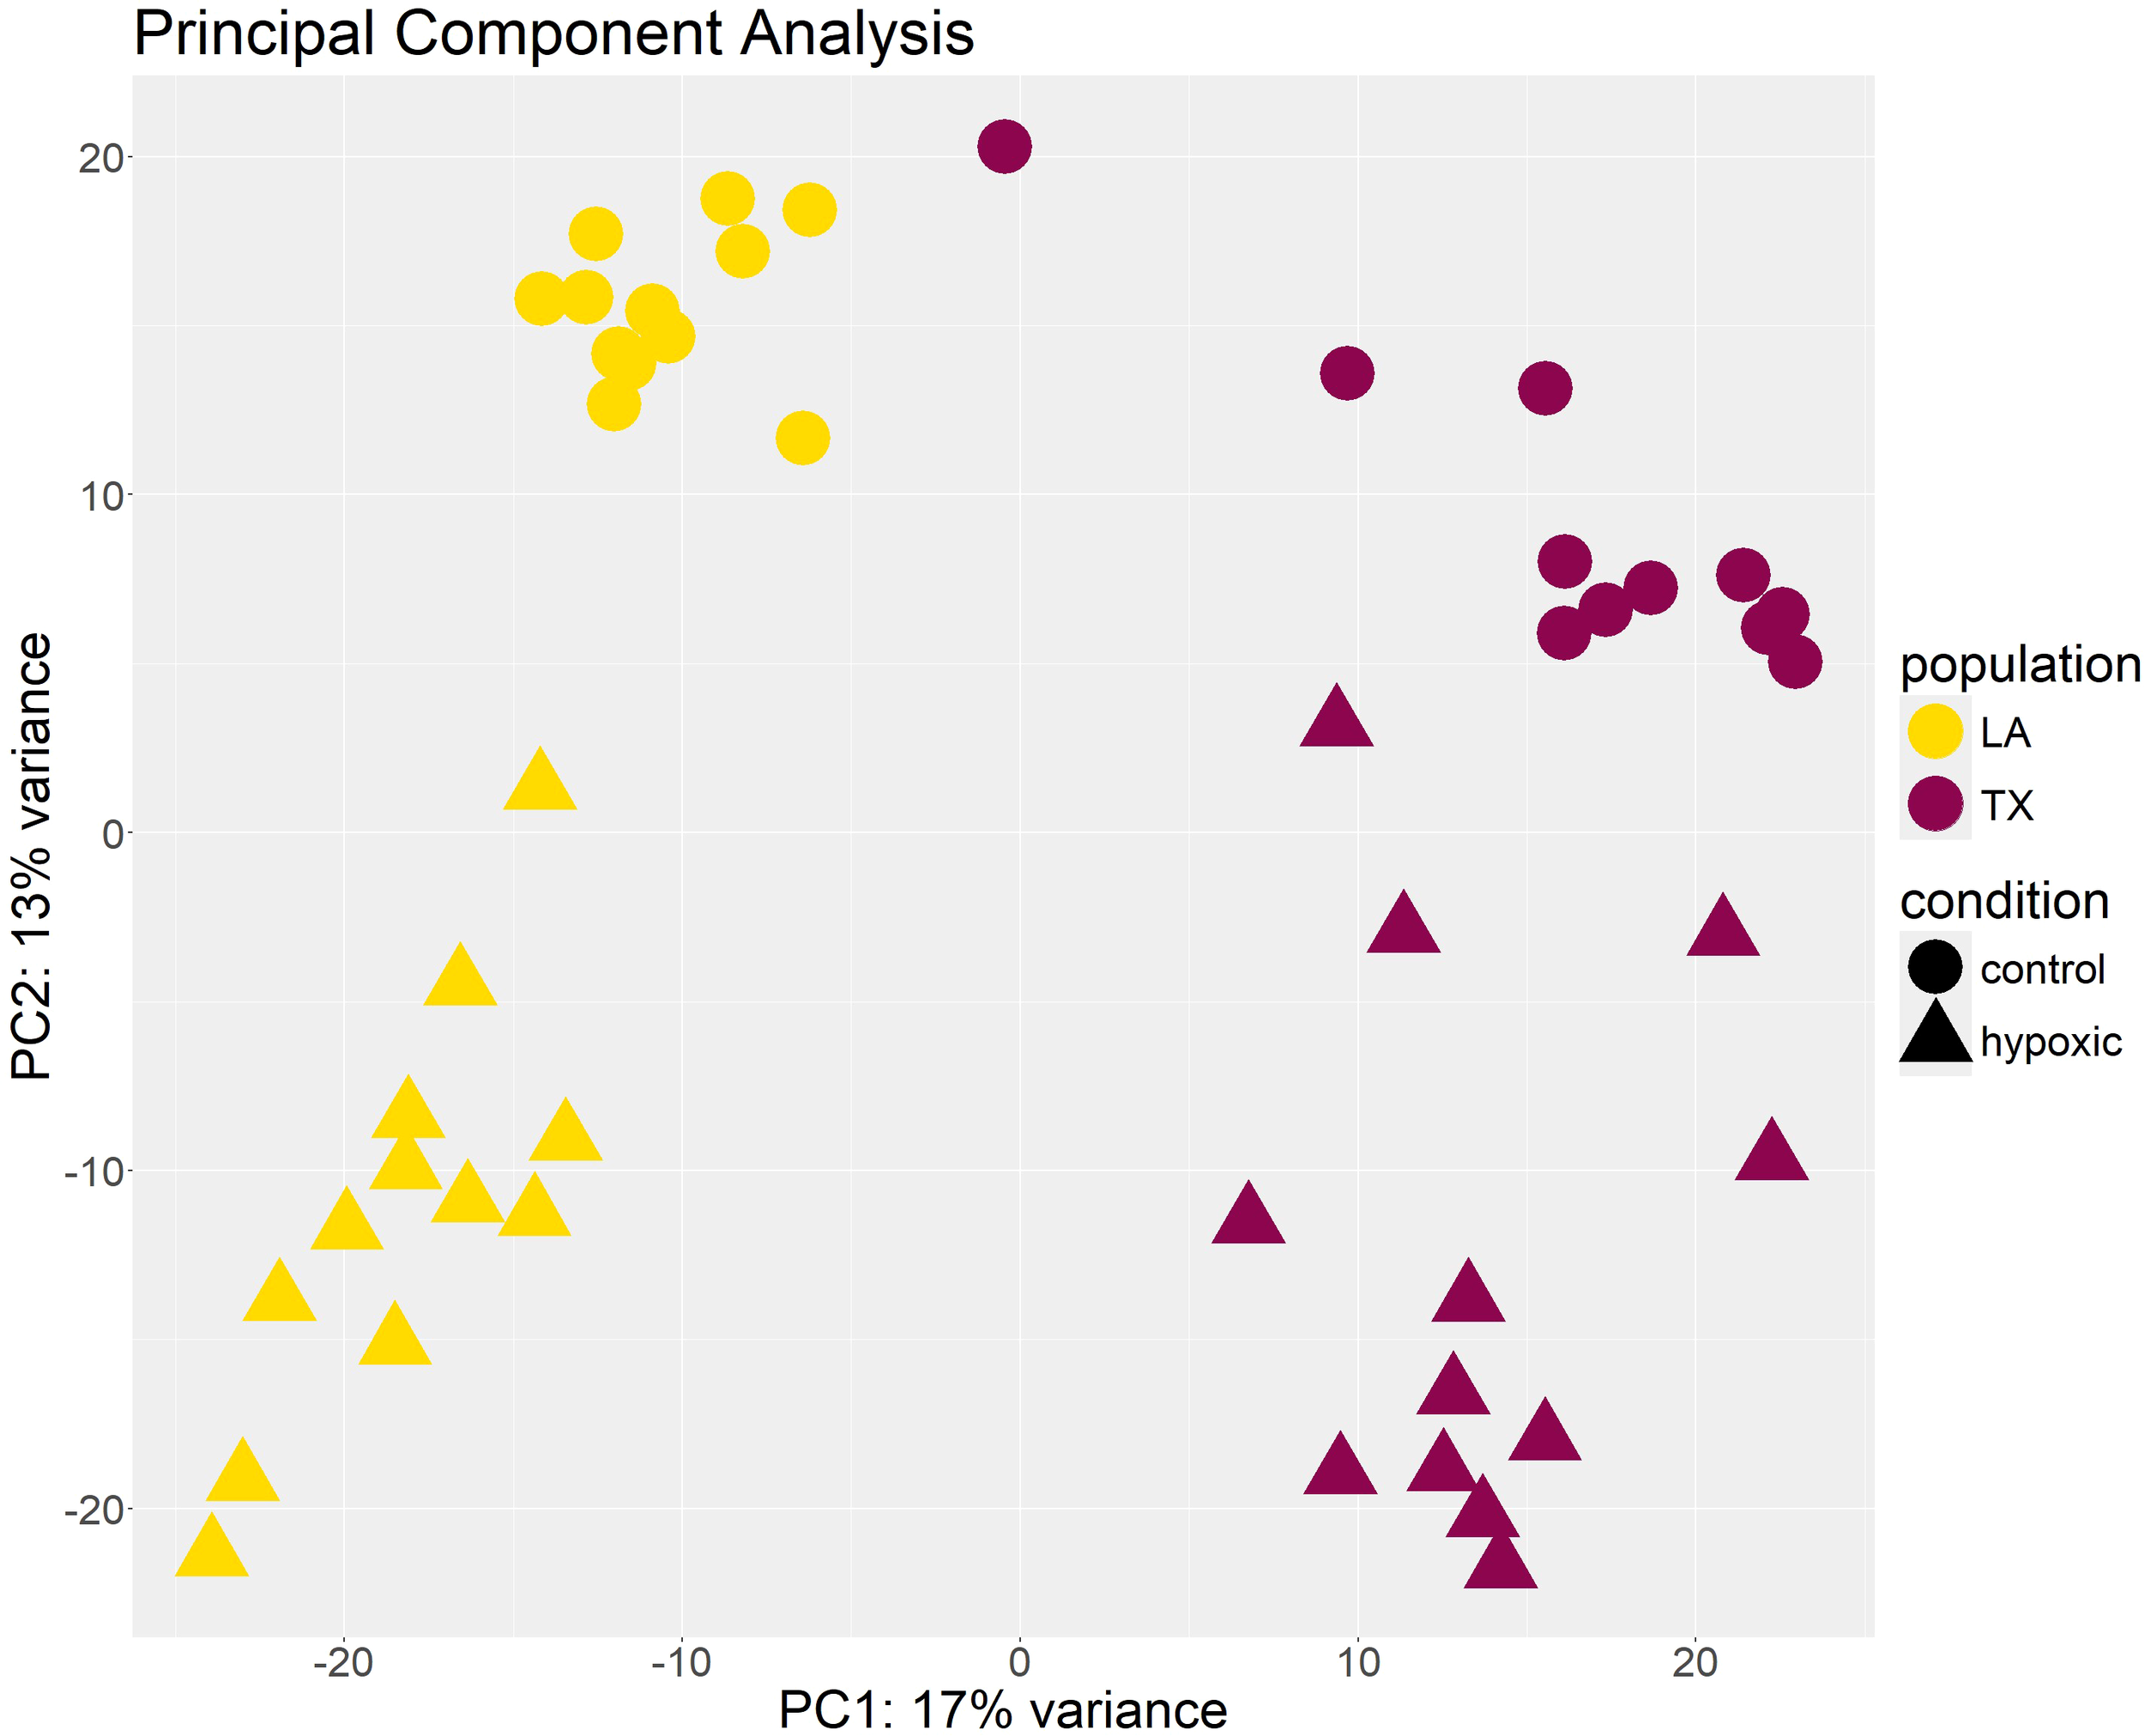
Clustering of samples based on principal component analysis (PCA). Each point represents a gill tissue sample from an individual oyster. Samples cluster by population and condition on PC1 and PC2. The X-axis shows the raw component scores and percent variance for principal component 1. The Y-axis shows the raw component scores and percent variance for principal component 2.
3.1.2 Differential expression
Differential expression tests between control and hypoxic conditions were performed at each experimental timepoint using DEseq2, EdgeR and NOISeq. The resulting sets of genes that showed significant differences between conditions were considered differentially expressed genes (DEGs). The DEGs from each of the three tests were compared and the overlapping consensus DEGs for each group were used for further analysis. Supplementary Figure 3 shows an example of the concordance between statistical tests from the DE analysis performed on the Louisiana day 6 sample. This approach provides the most conservative strategy to maximize specificity and the true positive rate (Costa-Silva et al., 2017).
In general, differential expression tests between control and hypoxic conditions revealed that the number of DEGs increased with decreasing oxygen (Figure 4). In addition, the offset of differential expression appeared to occur earlier in the Louisiana population than in Texas, with a notable increase in the number of DEGs at day 4 (0.61 mg/L DO) in Louisiana populations and day 5 (0.58 mg/L DO) in Texas populations. The upset plot, which displays the abundance and overlap of DEGs between groups, revealed that many of the genes that show differential expression in Louisiana day 4 overlap with DEGs from day 5 in the Texas population: of the 1310 DEGs of day 4 Louisiana oysters and 1461 DEGs of day 5 Texas oysters, 569 were shared between the two (Figure 4). Additionally, the upset plot shows that day 5 Texas oysters have the most unique DEGs, followed by day 4 Louisiana oysters, corresponding with rising mortality in both populations.
Figure 4
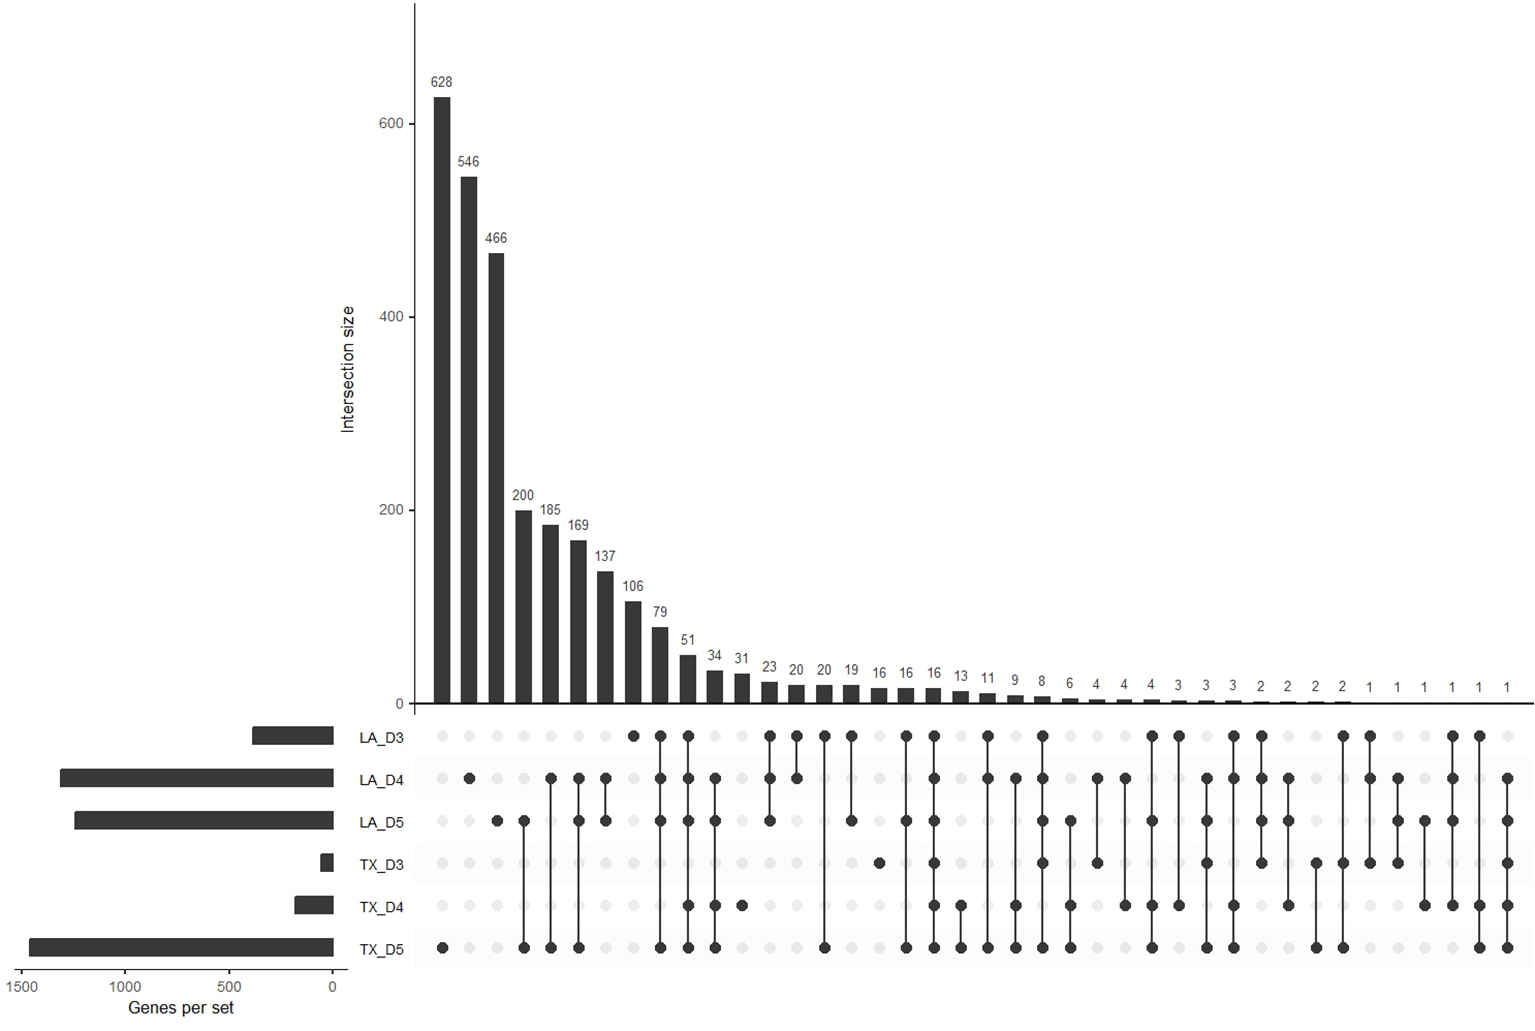
Upset plot for differentially expressed genes. The horizontal bars represent the abundance of differentially expressed genes for each population and day. The vertical bars represent the size of the intersection between sets of differentially expressed genes for all population and day comparisons (p < 0.01).
3.2 Gene network analysis
Weighted gene correlation network analysis (WGCNA) was used to find modules of coexpressed genes associated with factors of interest. The input used for the analysis was the raw expression matrix which consisted of 47 samples after removing outliers. The raw matrix was then normalized and lowly expressed genes filtered, resulting in 9453 genes. These data, along with the factors of interest (population, day, and condition) were used in the WGCNA. The analysis resulted in a total of 11 modules labeled as color names, consisting of groups of coexpressed genes and their correspondent association with factors of interest (Figure 5).
Figure 5
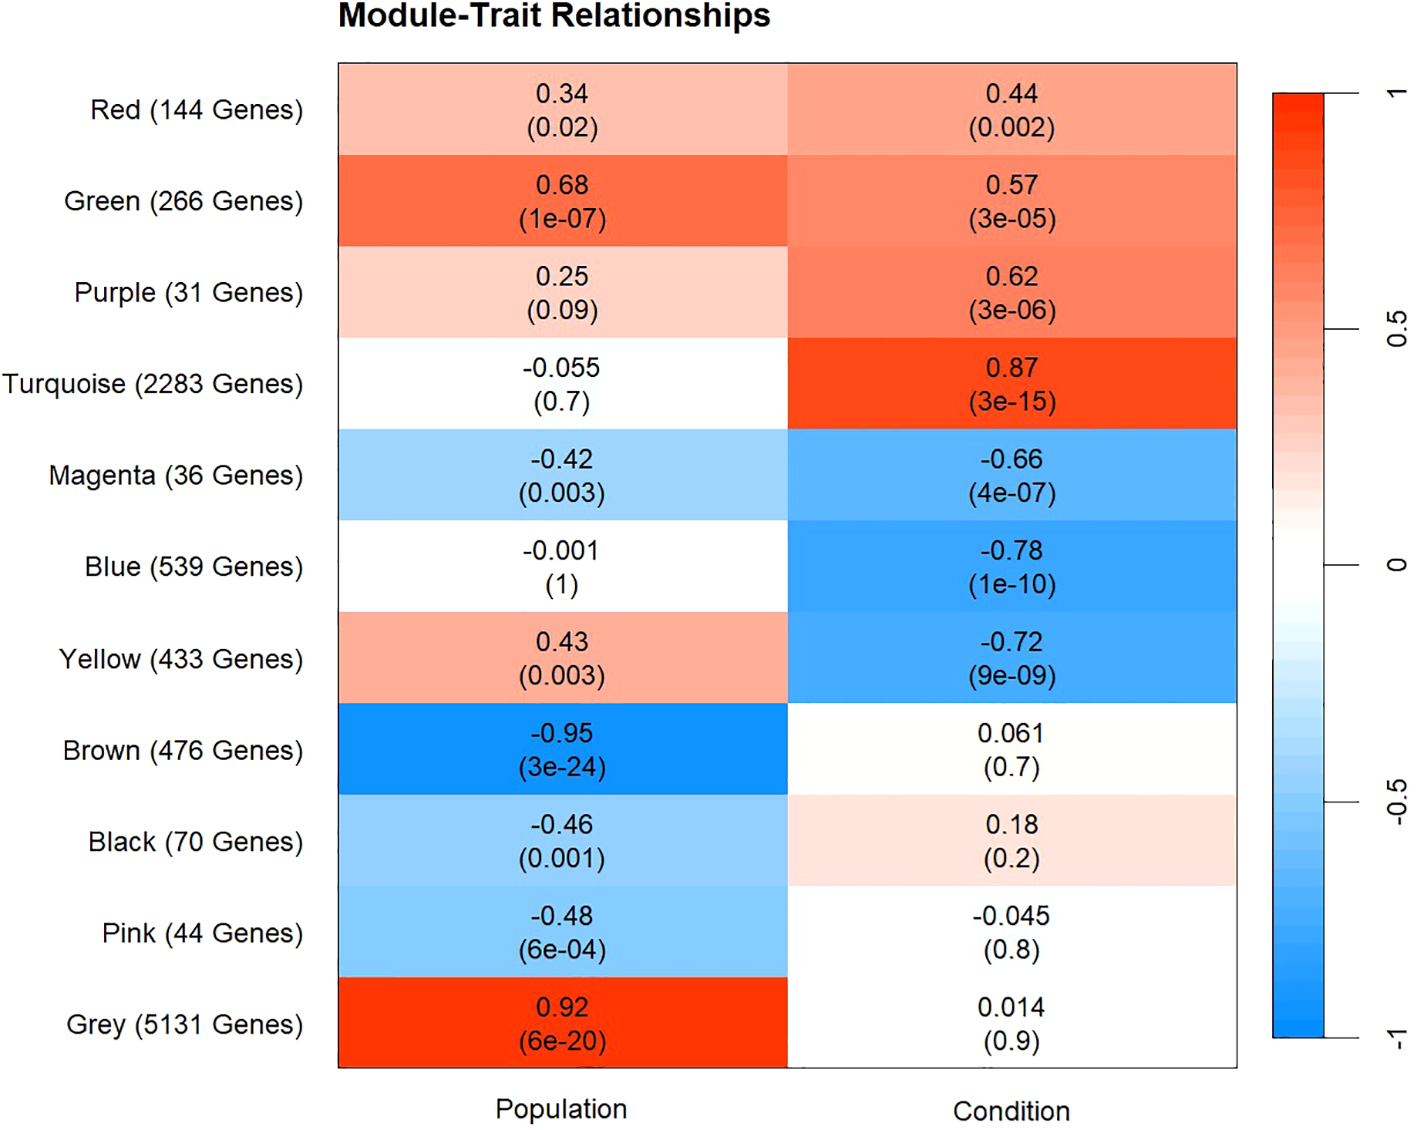
Heatmap of WGCNA module-trait relationship results. The X-axis represents the factors of interest that the correlations were based on. The Y-axis represents each color module that was produced from the analysis and the number of genes contained in each module. Each color module and factor of interest contain a correlation coefficient and p-value (in parentheses). Red represents positive correlations and blue represents negative correlations between each color module and factor of interest. Positive correlation in the population column represents a higher eigengene expression in Texas samples compared to Louisiana samples. Positive correlation in the condition column represents higher eigengene expression in hypoxic samples compared to control.
Of the 11 modules produced by WGCNA analysis, four were solely correlated with population, three with condition, and four with population and condition. No modules were significantly correlated with day, which was removed from subsequent analysis (Figure 5). The yellow, green, magenta, and red modules were significantly correlated with population and condition (Figure 5). The turquoise, blue, and purple modules were significantly correlated with condition. Further exploration of the eigengene expression and gene ontology enrichment of each module resulted in four modules of interest, and the underlying patterns of expression they represent. One pattern, present in the turquoise and blue module, showed similar gene expression in both populations under both control and hypoxic conditions. A second pattern, present in the yellow and green modules, showed higher eigengene expression in samples from the Texas population than samples from Louisiana, in both control and hypoxic conditions. In the yellow module, hypoxic samples exhibited downregulation under hypoxic conditions, while in the green module, hypoxic samples exhibited upregulation (Figure 6). The final pattern observed corresponded with the cumulative mortality results, where the Louisiana population began to accumulate mortality sooner (day 4) than the Texas population (day 5). Both the green and yellow modules followed this pattern and displayed large changes in eigengene expression corresponding with cumulative mortality, especially between days 4 and 5 in the Texas population (Figures 2, 6).
Figure 6
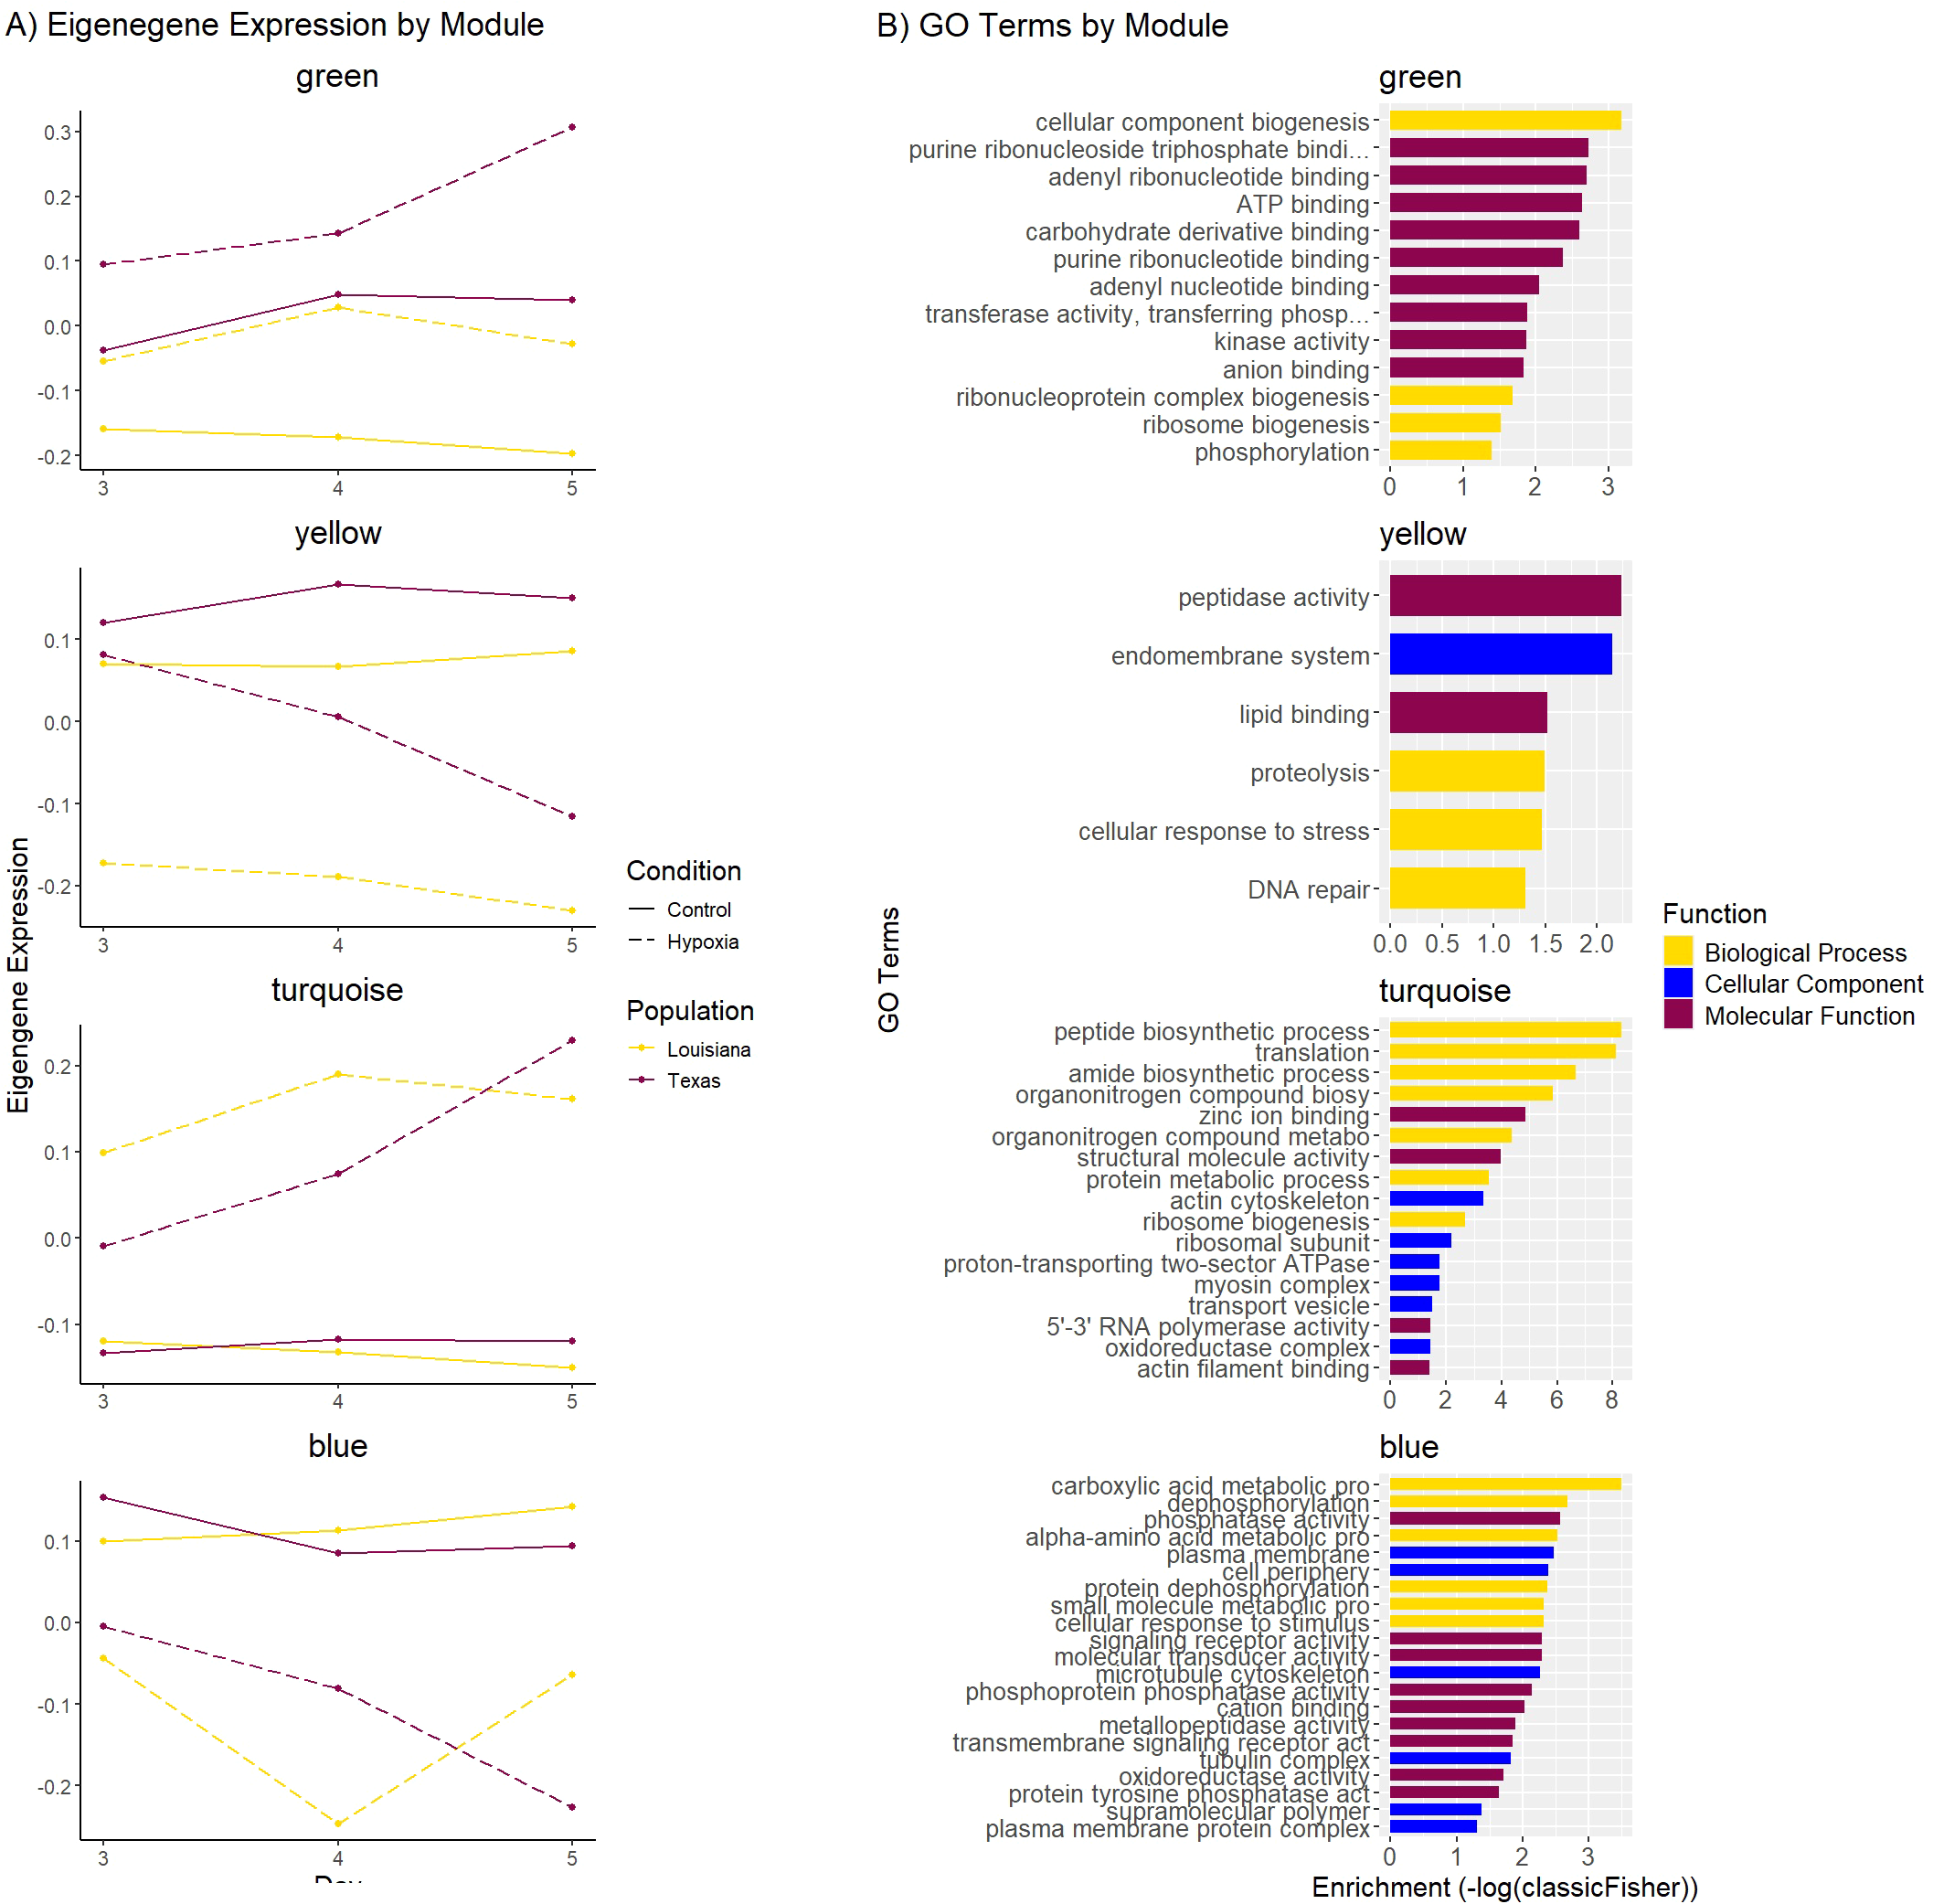
(A) Eigengene expression for selected WGCNA modules. The X-axis represents days 3, 4, and 5. The Y-axis represents the relative eigengene expression. Purple lines represent the Louisiana population, and yellow lines represent the Texas population. Solid lines represent control conditions and dotted lines represent hypoxic conditions. (B) Bar plot displaying the top 10 GO terms from each category (biological process, cellular component, molecular function) of the GO enrichment of the yellow, green, and magenta modules. The Y-axis represents the GO term, and the X-axis represents the significance of the enrichment (-log10(classicFisher)). Color represents the functional category.
The green and yellow modules showed the strongest correlation with population and condition, with the genes in these modules being more highly expressed in Texas oysters compared to Louisiana oysters in both control and hypoxic conditions (Figure 6). The green module contained 266 genes that exhibited higher expression in control and hypoxic samples from Texas compared to Louisiana samples, and were upregulated in hypoxic samples from both populations, showing a greater upregulation in Texas samples between days 4 and 5. Gene ontology enrichment for this module showed terms related to cellular component biogenesis, ribosome biogenesis, and ATP binding (Figure 6; Supplementary Table 2). The yellow module contained 433 genes that exhibited higher expression in control samples from Texas compared to Louisiana samples. Genes from this module were downregulated in hypoxic samples in both populations, though Louisiana samples showed more downregulation compared to the control population than Texas samples at day 3, and Texas samples showed greater decrease in expression, especially between days 4 and 5, corresponding with cumulative mortality. Gene ontology enrichment for this module showed an overabundance of terms related to cellular response to stress, DNA repair, and peptidase activity (Figure 6; Supplementary Table X). The turquoise and blue modules showed correlation with condition, but not population. The turquoise module contained 2283 genes that exhibited higher expression in hypoxic conditions compared to control. Gene ontology enrichment for this module showed terms related to translation, zinc ion binding, and ribosome biogenesis. The blue module contained 539 genes that exhibited lower expression in hypoxic samples compared to control. Gene ontology enrichment for this module showed terms related to carboxylic acid metabolic processes, phosphatase activity, and cation binding (Figure 6; Supplementary Table X).
4 Discussion
In this study, we aimed to explore the physiological and transcriptomic differences underlying variation in hypoxia tolerance in the eastern oyster. Three important observations emerged from our analysis: (1) a later onset of stress response in the Texas population, (2) some gene modules that exhibited similar patterns in both populations, suggesting a partly shared response to hypoxic conditions, and (3) baseline upregulation of genes associated with hypoxia tolerance in the Texas population under normoxia, suggesting a partial frontloading of the stress response.
4.1 Hypoxia triggers the onset of stress response later in the Texas population
The eastern oyster has a wide geographic distribution and is subjected to a range of salinity, temperature, and oxygen levels (Quilang et al., 2007). The Packery Channel oyster broodstock were collected in the northern part of the Upper Laguna Madre estuary, which experiences higher temperatures than the brackish Calcasieu Lake estuary. High temperature decreases water oxygen solubility, leading to greater hypoxic stress. Additionally, the Packery Channel broodstock collection site is just south of an area of Corpus Christi Bay, Texas that experiences recurrent extended hypoxic events (Applebaum et al., 2005). Due to these factors, it is likely that Packery Channel oysters are better adapted for low DO and elevated temperature than oysters collected from estuaries that do not experience these environmental conditions. Genetic differentiation between Laguna Madre and other northern Gulf of Mexico oyster populations may explain some of their phenotypic divergence (Buroker, 1983; Anderson et al., 2014). Our previous cumulative mortality experiment showed oysters from the Louisiana population experiencing mortality sooner than oysters from the Texas population, indicating that the Louisiana population has a lower tolerance to hypoxia (Figure 1). Preliminary studies of the Louisiana and Texas populations also revealed differences in valve gape behavior (i.e., the closing and opening of the oyster shell) between the two populations, with the Louisiana population closing its shell sooner than the Texas population under hypoxic conditions. This type of valve gape behavior is commonly used to assess response to adverse conditions such as hypoxia (Porter and Breitburg, 2016), and our preliminary observations support the idea that the Texas population is more tolerant to hypoxic stress.
Our cumulative mortality results show that mortality in the Louisiana samples begins to increase at day 4, and in the Texas samples at day 5. The later onset of the stress response is also present at the gene expression level. Our differential expression results show a greater change in expression in hypoxia-sensitive genes between control and hypoxic samples at day 3 for oysters from the Louisiana population, and between days 4 and 5 in oysters from the Texas population. The number of DEGs in Louisiana samples increased by 924 between days 3 and 4, when Texas samples only increased by 124. However, oysters from the Texas population displayed an increase of 1281 DEGs between days 4 and 5, corresponding with the onset of mortality (Figures 1, 4) and indicating that the Texas population’s response is triggered later than in oysters from the Louisiana population. WGCNA analysis revealed expression patterns following patterns of cumulative mortality rates in the green and yellow modules. In the green module, oysters from the Louisiana population showed an increase in expression between days 3 and 4, followed by a slight decrease between days 4 and 5, while oysters from the Texas population showed a slight increase between days 3 and 4, and a sharp increase between days 4 and 5. In the yellow module, day 3 Texas oysters had similar eigengene expression between control and hypoxic samples, but genes were downregulated at days 4 and 5. Genes in Louisiana samples were more lowly expressed at day 3 in hypoxic samples as compared to both control and Texas samples, and were further downregulated at days 4 and 5 (Figure 6). These patterns correlate with the observed onset of mortality for both populations.
4.2 Overlapping patterns of gene expression between populations reveal shared responses to hypoxic conditions
When comparing genes differentially expressed in response to hypoxia, our analysis showed 569 shared genes between Louisiana day 4 samples and Texas day 5 samples (Figure 4). This suggests that the hypoxic response in both populations shares a large proportion of the same genes, which is corroborated by the similar eigengene expression between both populations under both control and hypoxic conditions in the turquoise and blue modules (Figure 6). The turquoise module, which showed higher gene expression in hypoxic conditions compared to control, contained GO terms related to translation, ribosome biogenesis, and zinc ion binding. Studies in various organisms have shown that cells can mediate the hypoxia response through increased ribosome biogenesis. For example, in C. elegans, it has been demonstrated that enhanced ribosome biogenesis restores protein translation when it is inhibited by hypoxic conditions (Itani et al., 2021), and in human cancer cells, hypoxia has been shown to increase ribosome biogenesis as well as influencing the composition of ribosomes (Brumwell et al., 2020; Hou et al., 2021; Metge et al., 2021). Zinc has been shown to have antioxidant properties through many different mechanisms, protecting the cell from the effects of ROS, such as those produced during the H/R cycle (Powell, 2000; Jarosz et al., 2017). Additionally, the binding of some metal ions have been shown to increase the stability of proteins or protein domains (Permyakov, 2021), and in particular some zinc-binding proteins such as metallothionein are implicated in the protection of cells against hypoxia and oxidative stress through antioxidant properties (Kumari et al., 1998; He-ru et al., 2023). In the kidney cells of rats, it was shown that expression of metallothionein was upregulated in response to hypoxia (Kojima et al., 2009). The upregulation of these genes during exposure to hypoxic conditions in both populations suggests mechanisms of a shared response to hypoxia.
The blue module, which showed a lower expression of genes in hypoxic conditions, contained GO terms related to carboxylic acid metabolic processes, phosphatase activity, and cation binding. Carboxylic acids are involved in many processes within the cell, such as the tricarboxylic acid (TCA) cycle, which generates ATP as well as precursors to the electron transport chain. In many studies, hypoxia has been shown to stop the TCA cycle by HIF induction (Kim et al., 2006; Goda and Kanai, 2012), thus lowering oxygen consumption in the cell, which is a key mechanism by which many organisms respond to hypoxic conditions. Additionally, hypoxia has been shown to inhibit phosphatase activity through HIF-1α dependent and independent mechanisms (Elgenaidi and Spiers, 2019). HIF-1α, a transcription factor in the HIF pathway, is crucial to the metabolic response to hypoxia (Kim et al., 2006). Phosphatases are also able to regulate HIF-1α expression in cells under hypoxic conditions (Alig et al., 2015). The downregulation of these pathways under hypoxic conditions may represent metabolic responses to hypoxia that are shared by both populations.
4.3 Population by treatment interactions reveal patterns of gene expression associated with hypoxia tolerance in Texas oysters
Regulatory evolution can lead to the fixation of regulatory variants that alter the default levels of gene expression to levels that favor survival in the environment (Kelly, 2019). Thus, examining stress and baseline gene expression differences among populations that vary in their tolerance to a stressor can provide insights into the underlying gene networks. In the context of tolerant vs. sensitive populations, a higher baseline expression can either hinder or promote stress tolerance (Rivera et al., 2021). In a scenario where a higher baseline expression promotes stress tolerance, we would expect to see gene networks related to protective stress responses (Rivera et al., 2021). Higher baseline expression in a tolerant population may also be the result of genetic frontloading (Barshis et al., 2013). When examining the role of genetic frontloading in warming and hypoxia tolerance in amphipods, protective genes involved in the response to stress, protein synthesis, and immune response were upregulated, or frontloaded, in the control group of the tolerant population (Collins et al., 2021). In a scenario where higher baseline expression hinders stress tolerance, genes may be involved in detrimental responses to stress, or may be energetically costly to overexpress (Rivera et al., 2021).
In our experiment, WGCNA analysis revealed genes responsive to hypoxic conditions in 2 key modules (green and yellow). In these modules, the Texas population was found to exhibit a baseline upregulation of hypoxia-associated genes, showing a higher eigengene expression in oysters from the Texas population than that of the Louisiana oysters between control and hypoxic conditions and across all days.
The green module showed a higher expression in the Texas oysters under both control and hypoxic conditions, as well as a sharp increase in expression between days 4 and 5 in this population. This module contained terms related to ribosome biogenesis and ribonucleotide binding (Figure 6; Supplementary Table X). In general, ribonucleoproteins (RNPs) and RNA binding proteins (RBPs) play an integral role in processes such as transcription, translation, regulation of gene expression, and RNA metabolism. RBPs in particular are important regulators of gene expression in response to different forms of stress (Masuda et al., 2009; Gorospe et al., 2011), and many RBPs associate with mRNAs encoding known hypoxia response proteins such as HIF-1α (Osipyants et al., 2018). The higher expression of terms related to ribosome biogenesis and ribonucleotide binding indicates that the hypoxia-tolerant Texas population may exhibit important adaptations to upregulate and maintain higher expression of these genes in the face of oxygen deficiency.
The yellow module, in similar fashion, showed higher eigengene expression in Texas oysters under both control and hypoxic conditions. Expression was greatly reduced in Texas hypoxic samples on days 4 and 5, and in Louisiana hypoxic samples on days 3, 4, and 5, corresponding to the later onset of mortality in the Texas population. Exploration of the yellow module revealed key GO terms including those related to response to stress and DNA repair (Figure 6; Supplementary Table X). Chronic hypoxia is known to contribute to DNA damage through the production of ROS in the H/R cycle, making DNA repair an essential mechanism by which organisms can withstand hypoxic conditions (Philipp et al., 2012; Ivanina and Sokolova, 2016). Additionally, many studies in mammalian cancer cells have shown that hypoxic conditions affect DNA repair in other ways, including the downregulation of many genes in various DNA repair pathways (Mihaylova et al., 2003; Scanlon and Glazer, 2015; Tang et al., 2021). Eigengene expression in the yellow module indicates the Texas population has a higher baseline expression of genes related to DNA damage repair and response to stress, and is able to maintain a higher expression of these genes for longer than the Louisiana population, which corresponds with the cumulative mortality we observed. This potentially reflects adaptive changes that sustain ‘functional homeostasis’ in the Texas population for more extended periods of time under hypoxia.
Overall, these results provide evidence for adaptive changes in gene expression in response to hypoxia. The four modules mentioned here, containing GO terms related to important processes such as DNA damage response and repair, ribonucleoprotein complex biogenesis, RNA binding, and biosynthesis, show association with hypoxic conditions and exhibit different expression patterns between the two populations.
While these results are an essential approximation to understanding the physiological and genetic basis of acclimation and adaptation to climate change, it is important to note that further studies are required to corroborate our findings and further test evolutionary hypotheses. Comparative transcriptomics has a limited power to identify causal correlations between changes in gene expression and phenotypes, due to the statistical challenges associated with gene expression quantification and comparison, as well as the numerous confounding effects associated with changes in gene expression. Functional genomic approaches can be used to further corroborate the predicted relations identified in this study. Additionally, our research has limited power to distinguish adaptive vs non-adaptive change. While predictions of expected changes on gene expression values can be corroborated with gene expression data, more powerful and robust predictions about the potential role of natural selection can be tested using gene sequence analysis such as dN/dS, nucleotide diversity, as well as other populations genetic approaches. Complementary studies investigating patterns of sequence evolution in candidate genes and their regulatory regions can further corroborate that the changes observed in this study are products of adaptive evolution. Although understanding the mechanisms behind hypoxia tolerance can be useful for looking at hypoxia in tandem with other stressors that occur in nature, the combination of other factors, e.g. hypoxia and salinity, should be investigated. Future directions for this research involve analyzing whole genome low coverage for these populations. We will use the hypoxia responsive genes identified in this study to test for selection on hypoxia response in the Texas population.
5 Conclusion
The results of this study reveal differences in hypoxia tolerance between two populations of oysters from the Gulf of Mexico, providing important insights into the role of acclimation in adaptations to environmental change. The physiological differences in hypoxia tolerance were linked to differing patterns of gene expression, identifying key differences in gene regulation between these hypoxia tolerant and hypoxia sensitive populations. These findings present a scenario suggesting local adaptation to hypoxic conditions.
Our previous physiological assay identified and quantified differences in the physiological response to hypoxia between two oyster populations, with Texas oysters exhibiting lower mortality and overall greater tolerance to hypoxic conditions. WGCNA analysis identified sets of genes whose changes in expression levels are highly associated with changes in oxygen concentrations. Many of these sets of genes respond similarly in both Louisiana and Texas oysters, suggesting a shared basis for much of the hypoxia response between populations. Gene ontology enrichment suggests that these genes are likely involved in the acclimation response to hypoxia and are potential candidates for enhancing our understanding of the molecular and physiological mechanisms that underlie acclimation to hypoxia in bivalves. Notably, some genes exhibit population level differences in response to hypoxia, consistent with patterns of acclimation in adaptation to environmental change. First, the onset of expression in stress related genes occurs earlier in Louisiana oysters compared to Texas oysters. This suggests that there are population level differences in response to the same environmental cue, likely due to underlying adaptive and evolutionary processes. Second, genes whose expression is associated with a hypoxia tolerance response are more highly expressed throughout the time lapse of the experiment in oysters from Texas, in both the hypoxia and control conditions, in two key modules, and are more highly expressed in oysters from Louisiana in a third module. This pattern suggests there are fixed differences in the expression of key genes between the two populations. Together these results provide evidence in favor of a role of acclimation in adaptive evolution, highlighting the importance of conserving genetic diversity in marine populations.
In the past, not much continuous monitoring data have been collected on DO concentration in estuaries Gulf of Mexico-wide, but that is changing with the development of oyster aquaculture parks, as well as increasing concerns about decreasing DO levels due to warming and eutrophication. Determining if local oyster populations demonstrate specific adaptations (phenotypic or genotypic) is useful for the development of matched broodstock populations, ensuring that improved broodstocks best match the environmental conditions available for farming, and can withstand environmental challenges such as low DO events.
Statements
Data availability statement
The raw data supporting the conclusions of this article is available in NCBI’s SRA. The accession number is PRJNA1153018.
Author contributions
EC: Writing – original draft, Writing – review & editing, Formal analysis, Visualization. HR: Writing – original draft, Writing – review & editing, Formal analysis, Investigation, Methodology, Visualization. RV: Formal analysis, Visualization, Writing – review & editing. NC: Investigation, Writing – review & editing. JL: Conceptualization, Funding acquisition, Methodology, Resources, Writing – review & editing. MK: Conceptualization, Funding acquisition, Methodology, Writing – review & editing.
Funding
The author(s) declare financial support was received for the research, authorship, and/or publication of this article. This work was partly funded by NSF-BioOCE 1731710 with additional support provided by the National Institute of Food and Agriculture, United States Department of Agriculture (Hatch project LAB94509) and grant number NSF IOS 2154283.
Acknowledgments
We would like to thank Scott Rikard at the Auburn University Shellfish Laboratory in Dauphin Island, Alabama for spawning and rearing oysters, Sarah Spellman and Caitlin Robitaille (Auburn University) for assistance in hatchery production and Glen Chaplin (Auburn University) for field grow-out of the oysters.
Conflict of interest
The authors declare that the research was conducted in the absence of any commercial or financial relationships that could be construed as a potential conflict of interest.
Publisher’s note
All claims expressed in this article are solely those of the authors and do not necessarily represent those of their affiliated organizations, or those of the publisher, the editors and the reviewers. Any product that may be evaluated in this article, or claim that may be made by its manufacturer, is not guaranteed or endorsed by the publisher.
Supplementary material
The Supplementary Material for this article can be found online at: https://www.frontiersin.org/articles/10.3389/fmars.2024.1462905/full#supplementary-material
Supplementary Figure 1Library size of all samples after preprocessing on days 3, 4, and 5. The X-axis shows each sample. The Y-axis is the abundance (in million reads) of each sample. Orange represents the Texas population. Yellow represents the Louisiana population. H = hypoxic condition, C = control.
Supplementary Figure 2PCA of all 48 samples, showing outlier sample (C7.CO10.G) that was removed from further analyses.
Supplementary Figure 3Venn diagram displaying the concordance of differential expression analysis. The Venn diagram is composed of the differentially expressed genes output from EdgeR, NOISeq, and DESeq2 analysis. This diagram represents the samples from Louisiana day 4 and shows the number of overlapping differentially expressed genes that was used in subsequent analyses.
Supplementary Figure 4Eigengene expression plots for all modules. The X axis represents day, and the Y axis represents eigengene expression for each module.
Supplementary Table 1Summary of differential expression tests on gill tissue.
Supplementary Table 2Summary of the top 10 GO terms from each category (biological process, cellular component, molecular function) of the GO enrichment of select modules: (A) Green, (B) Yellow, (C) Turquoise, (D) Blue.
References
1
Adzigbli L. Sokolov E. P. Wimmers K. Sokolova I. M. Ponsuksili S. (2022). Effects of hypoxia and reoxygenation on mitochondrial functions and transcriptional profiles of isolated brain and muscle porcine cells. Sci. Rep.12, 19881. doi: 10.1038/s41598-022-24386-0
2
Alexa A. Rahnenfuhrer J. (2020). topGO: Enrichment Analysis for Gene Ontology. R package version 2.42.0.
3
Alig S. K. Stampnik Y. Pircher J. Rotter R. Gaitzsch E. Ribeiro A. et al . (2015). The tyrosine phosphatase SHP-1 regulates hypoxia inducible factor-1α (HIF-1α) protein levels in endothelial cells under hypoxia. PloS One10, e0121113. doi: 10.1371/journal.pone.0121113
4
Anderson J. D. Karel W. J. Mace C. E. Bartram B. L. Hare M. P. (2014). Spatial genetic features of eastern oysters (Crassostrea virginica Gmelin) in the Gulf of Mexico: Northward movement of a secondary contact zone. Ecol. Evol.4, 1671–1685. doi: 10.1002/ece3.1064
5
Andrews S. (2010). FastQC: A Quality Control Tool for High Throughput Sequence Data. Available online at: http://www.bioinformatics.babraham.ac.uk/projects/fastqc/. (Accessed August 01, 2020).
6
Applebaum S. Montagna P. A. Ritter C. (2005). Status and trends of dissolved oxygen in Corpus Christi bay, Texas, U.S.A. Environ. Monit. Assess.107, 297–311. doi: 10.1007/s10661-005-3111-5
7
Baker S. M. Mann R. (1992). Effects of hypoxia and anoxia on larval settlement, juvenile growth, and juvenile survival of the oyster crassostrea virginica. Biol. Bull.182, 265–269. doi: 10.2307/1542120
8
Barshis D. J. Ladner J. T. Oliver T. A. Seneca F. O. Traylor-Knowles N. Palumbi S. R. (2013). Genomic basis for coral resilience to climate change. Proc. Natl. Acad. Sci.110, 1387–1392. doi: 10.1073/pnas.1210224110
9
Blois J. L. Williams J. W. Fitzpatrick M. C. Jackson S. T. Ferrier S. (2013). Space can substitute for time in predicting climate-change effects on biodiversity. Proc. Natl. Acad. Sci.110, 9374–9379. doi: 10.1073/pnas.1220228110
10
Bolger A. M. Lohse M. Usadel B. (2014). Trimmomatic: A flexible trimmer for Illumina sequence data. Bioinformatics30, 2114–2120. doi: 10.1093/bioinformatics/btu170
11
Breitburg D. Levin L. A. Oschlies A. Grégoire M. Chavez F. P. Conley D. J. et al . (2018). Declining oxygen in the global ocean and coastal waters. Science359, eaam7240. doi: 10.1126/science.aam7240
12
Brumwell A. Fell L. Obress L. Uniacke J. (2020). Hypoxia influences polysome distribution of human ribosomal protein S12 and alternative splicing of ribosomal protein mRNAs. RNA26, 361–371. doi: 10.1261/rna.070318.119
13
Bunn H. F. Poyton R. O. (1996). Oxygen sensing and molecular adaptation to hypoxia. Physiol. Rev.76, 839–885. doi: 10.1152/physrev.1996.76.3.839
14
Buroker N. E. (1983). Population genetics of the American oyster Crassostrea virginica along the Atlantic coast and the Gulf of Mexico. Mar. Biol.75, 99–112. doi: 10.1007/BF00392635
15
Chen S. Zhou Y. Chen Y. Gu J. (2018). fastp: An ultra-fast all-in-one FASTQ preprocessor. Bioinformatics34, i884–i890. doi: 10.1093/bioinformatics/bty560
16
Collins M. Clark M. S. Spicer J. I. Truebano M. (2021). Transcriptional frontloading contributes to cross-tolerance between stressors. Evolution. Appl.14, 577–587. doi: 10.1111/eva.13142
17
Costa-Silva J. Domingues D. Lopes F. M. (2017). RNA-Seq differential expression analysis: An extended review and a software tool. PloS One12, e0190152. doi: 10.1371/journal.pone.0190152
18
Coxe N. Casas S. M. Marshall D. A. La Peyre M. K. Kelly M. W. La Peyre J. F. (2023). Differential hypoxia tolerance of eastern oysters from the northern Gulf of Mexico at elevated temperature. J. Exp. Mar. Biol. Ecol.559, 151840. doi: 10.1016/j.jembe.2022.151840
19
DeBiasse M. B. Kelly M. W. (2016). Plastic and evolved responses to global change: what can we learn from comparative transcriptomics? J. Hered.107, 71–81. doi: 10.1093/jhered/esv073
20
Dobin A. Davis C. A. Schlesinger F. Drenkow J. Zaleski C. Jha S. et al . (2013). STAR: Ultrafast universal RNA-seq aligner. Bioinformatics29, 15–21. doi: 10.1093/bioinformatics/bts635
21
Dodds W. K. (2006). Nutrients and the “dead zone”: The link between nutrient ratios and dissolved oxygen in the northern Gulf of Mexico. Front. Ecol. Environ.4, 211–217. doi: 10.1890/1540-9295(2006)004[0211:NATDZT]2.0.CO;2
22
Durack P. J. Wijffels S. E. (2010). Fifty-year trends in global ocean salinities and their relationship to broad-scale warming. J. Climate23, 4342–4362. doi: 10.1175/2010JCLI3377.1
23
Elgenaidi I. S. Spiers J. P. (2019). Hypoxia modulates protein phosphatase 2A through HIF-1α dependent and independent mechanisms in human aortic smooth muscle cells and ventricular cardiomyocytes. Br. J. Pharmacol.176, 1745–1763. doi: 10.1111/bph.14648
24
Giannetto A. Maisano M. Cappello T. Oliva S. Parrino V. Natalotto A. et al . (2015). Hypoxia-inducible factor α and hif-prolyl hydroxylase characterization and gene expression in short-time air-exposed mytilus galloprovincialis. Mar. Biotechnol.17, 768–781. doi: 10.1007/s10126-015-9655-7
25
Goda N. Kanai M. (2012). Hypoxia-inducible factors and their roles in energy metabolism. Int. J. Hematol.95, 457–463. doi: 10.1007/s12185-012-1069-y
26
Gómez-Chiarri M. Warren W. C. Guo X. Proestou D. (2015). Developing tools for the study of molluscan immunity: The sequencing of the genome of the eastern oyster, Crassostrea virginica. Fish Shellf. Immunol.46, 2–4. doi: 10.1016/j.fsi.2015.05.004
27
Gorospe M. Tominaga K. Wu X. Fähling M. Ivan M. (2011). Transcriptional control of the hypoxic response by RNA-binding proteins and microRNAs. Front. Mol. Neurosci.4. doi: 10.3389/fnmol.2011.00007
28
Guillemin K. Krasnow M. A. (1997). The hypoxic response: huffing and HIFing. Cell89, 9–12. doi: 10.1016/S0092-8674(00)80176-2
29
He-ru W. Xia Y. I. N. Bin-feng X. I. A. Qing-shuang Z. Ming-yue C. U. I. (2023). Protective effect and mechanism of endogenous antioxidant metallothionein on myocardial damage caused by chronic intermittent hypoxia. Zhonghua yangsheng baojian41, 14.
30
Hou Y. Ding Y. Du D. Yu T. Zhou W. Cui Y. et al . (2021). Airway basal cells mediate hypoxia-induced EMT by increasing ribosome biogenesis. Front. Pharmacol.12. doi: 10.3389/fphar.2021.783946
31
Itani O. A. Zhong X. Tang X. Scott B. A. Yan J. Y. Flibotte S. et al . (2021). Coordinate regulation of ribosome and tRNA biogenesis controls hypoxic injury and translation. Curr. Biol.31, 128–137.e5. doi: 10.1016/j.cub.2020.10.001
32
Ivanina A. V. Froelich B. Williams T. Sokolov E. P. Oliver J. D. Sokolova I. M. (2011). Interactive effects of cadmium and hypoxia on metabolic responses and bacterial loads of eastern oysters Crassostrea virginica Gmelin. Chemosphere82, 377–389. doi: 10.1016/j.chemosphere.2010.09.075
33
Ivanina A. V. Sokolova I. M. (2016). Effects of intermittent hypoxia on oxidative stress and protein degradation in molluscan mitochondria. J. Exp. Biol.219, 3794–3802. doi: 10.1242/jeb.146209
34
Jarosz M. Olbert M. Wyszogrodzka G. Młyniec K. Librowski T. (2017). Antioxidant and anti-inflammatory effects of zinc. Zinc-dependent NF-κB signaling. Inflammopharmacology25, 11–24. doi: 10.1007/s10787-017-0309-4
35
Johnson M. Powers S. Senne J. Park K. (2009). Assessing in situ tolerances of eastern oysters (Crassostrea virginica) under moderate hypoxic regimes: implications for restoration. J. Shellf. Res.28, 185–192. doi: 10.2983/035.028.0202
36
Justić D. Rabalais N. N. Turner R. E. (2005). Coupling between climate variability and coastal eutrophication: Evidence and outlook for the northern Gulf of Mexico. J. Sea Res.54, 25–35. doi: 10.1016/j.seares.2005.02.008
37
Kelly M. (2019). Adaptation to climate change through genetic accommodation and assimilation of plastic phenotypes. Philos. Trans. R. Soc. B: Biol. Sci.374, 20180176. doi: 10.1098/rstb.2018.0176
38
Keppel A. G. Breitburg D. L. Burrell R. B. (2016). Effects of Co-Varying Diel-Cycling Hypoxia and pH on Growth in the Juvenile Eastern Oyster, Crassostrea virginica. PloS One11, e0161088. doi: 10.1371/journal.pone.0161088
39
Kim J. Tchernyshyov I. Semenza G. L. Dang C. V. (2006). HIF-1-mediated expression of pyruvate dehydrogenase kinase: A metabolic switch required for cellular adaptation to hypoxia. Cell Metab.3, 177–185. doi: 10.1016/j.cmet.2006.02.002
40
Kojima I. Tanaka T. Inagi R. Nishi H. Aburatani H. Kato H. et al . (2009). Metallothionein is upregulated by hypoxia and stabilizes hypoxia-inducible factor in the kidney. Kidney Int.75, 268–277. doi: 10.1038/ki.2008.488
41
Kumari M. V. R. Hiramatsu M. Ebadi M. (1998). Free radical scavenging actions of metallothionein isoforms I and II. Free Radical Res.29, 93–101. doi: 10.1080/10715769800300111
42
Langfelder P. Horvath S. (2008). WGCNA: An R package for weighted correlation network analysis. BMC Bioinf.9, 559. doi: 10.1186/1471-2105-9-559
43
Lenihan H. S. Peterson C. H. (1998). How habitat degradation through fishery disturbance enhances impacts of hypoxia on oyster reefs. Ecol. Appl.8, 128–140. doi: 10.1890/1051-0761(1998)008[0128:HHDTFD]2.0.CO;2
44
Liao Y. Smyth G. K. Shi W. (2014). featureCounts: An efficient general purpose program for assigning sequence reads to genomic features. Bioinformatics30, 923–930. doi: 10.1093/bioinformatics/btt656
45
Lohman B. K. Weber J. N. Bolnick D. I. (2016). Evaluation of TagSeq, a reliable low-cost alternative for RNAseq. Mol. Ecol. Resour.16, 1315–1321. doi: 10.1111/1755-0998.12529
46
Love M. I. Huber W. Anders S. (2014). Moderated estimation of fold change and dispersion for RNA-seq data with DESeq2. Genome Biol.15, 550. doi: 10.1186/s13059-014-0550-8
47
Lovell R. S. L. Collins S. Martin S. H. Pigot A. L. Phillimore A. B. (2023). Space-for-time substitutions in climate change ecology and evolution. Biol. Rev.98, 2243–2270. doi: 10.1111/brv.13004
48
Marshall D. A. Coxe N. C. La Peyre M. K. Walton W. C. Rikard F. S. Pollack J. B. et al . (2021). Tolerance of northern Gulf of Mexico eastern oysters to chronic warming at extreme salinities. J. Thermal Biol.100, 103072. doi: 10.1016/j.jtherbio.2021.103072
49
Martínez M. González-Aravena M. Held C. Abele D. (2023). A molecular perspective on the invasibility of the southern ocean benthos: The impact of hypoxia and temperature on gene expression in South American and Antarctic Aequiyoldia bivalves. Front. Physiol.14. doi: 10.3389/fphys.2023.1083240
50
Masuda K. Abdelmohsen K. Gorospe M. (2009). RNA-binding proteins implicated in the hypoxic response. J. Cell. Mol. Med.13, 2759–2769. doi: 10.1111/j.1582-4934.2009.00842.x
51
Maynard A. Bible J. M. Pespeni M. H. Sanford E. Evans T. G. (2018). Transcriptomic responses to extreme low salinity among locally adapted populations of Olympia oyster (Ostrea lurida). Mol. Ecol.27, 4225–4240. doi: 10.1111/mec.14863
52
Metge B. J. Kammerud S. C. Pruitt H. C. Shevde L. A. Samant R. S. (2021). Hypoxia re-programs 2′-O-Me modifications on ribosomal RNA. iScience24, 102010. doi: 10.1016/j.isci.2020.102010
53
Meyer E. Aglyamova G. V. Matz M. V. (2011). Profiling gene expression responses of coral larvae (Acropora millepora) to elevated temperature and settlement inducers using a novel RNA-Seq procedure. Mol. Ecol.20, 3599–3616. doi: 10.1111/j.1365-294X.2011.05205.x
54
Mihaylova V. T. Bindra R. S. Yuan J. Campisi D. Narayanan L. Jensen R. et al . (2003). Decreased expression of the DNA mismatch repair gene Mlh1 under hypoxic stress in mammalian cells. Mol. Cell. Biol.23, 3265–3273. doi: 10.1128/MCB.23.9.3265-3273.2003
55
Osipyants A. I. Smirnova N. A. Yu K. A. Nikulin S. V. Zakhariants A. A. Tishkov V. I. et al . (2018). Metal ions as activators of hypoxia inducible factor. Moscow Univ. Chem. Bull.73, 13–18. doi: 10.3103/S0027131418020128
56
Permyakov E. A. (2021). Metal binding proteins. Encyclopedia1, 261–293. doi: 10.3390/encyclopedia1010024
57
Philipp E. E. R. Wessels W. Gruber H. Strahl J. Wagner A. E. Ernst I. M. A. et al . (2012). Gene Expression and Physiological Changes of Different Populations of the Long-Lived Bivalve Arctica islandica under Low Oxygen Conditions. PloS One7, e44621. doi: 10.1371/journal.pone.0044621
58
Porter E. T. Breitburg D. L. (2016). Eastern oyster, Crassostrea virginica, valve gape behavior under diel-cycling hypoxia. Mar. Biol.163, 218. doi: 10.1007/s00227-016-2980-1
59
Powell S. R. (2000). The antioxidant properties of zinc. J. Nutr.130, 1447S–1454S. doi: 10.1093/jn/130.5.1447S
60
Quilang J. Wang S. Li P. Abernathy J. Peatman E. Wang Y. et al . (2007). Generation and analysis of ESTs from the eastern oyster, Crassostrea virginica Gmelin and identification of microsatellite and SNP markers. BMC Genomics8, 157. doi: 10.1186/1471-2164-8-157
61
Ragone Calvo L. M. Calvo G. W. Burreson E. M. (2003). Dual disease resistance in a selectively bred eastern oyster, Crassostrea virginica, strain tested in Chesapeake Bay. Aquaculture220, 69–87. doi: 10.1016/S0044-8486(02)00399-X
62
Rivera H. E. Aichelman H. E. Fifer J. E. Kriefall N. G. Wuitchik D. M. Smith S. J. et al . (2021). A framework for understanding gene expression plasticity and its influence on stress tolerance. Mol. Ecol.30, 1381–1397. doi: 10.1111/mec.15820
63
Robinson M. D. McCarthy D. J. Smyth G. K. (2010). edgeR: A Bioconductor package for differential expression analysis of digital gene expression data. Bioinformatics26, 139–140. doi: 10.1093/bioinformatics/btp616
64
Sanford E. Kelly M. W. (2011). Local adaptation in marine invertebrates. Annu. Rev. Mar. Sci.3, 509–535. doi: 10.1146/annurev-marine-120709-142756
65
Scanlon S. E. Glazer P. M. (2015). Multifaceted control of DNA repair pathways by the hypoxic tumor microenvironment. DNA Repair32, 180–189. doi: 10.1016/j.dnarep.2015.04.030
66
Semenza G. L. (2012). Hypoxia-inducible factors in physiology and medicine. Cell148, 399–408. doi: 10.1016/j.cell.2012.01.021
67
Steffen J. B. M. Falfushynska H. I. Piontkivska H. Sokolova I. M. (2020). Molecular Biomarkers of the Mitochondrial Quality Control Are Differently Affected by Hypoxia-Reoxygenation Stress in Marine Bivalves Crassostrea gigas and Mytilus edulis. Front. Mar. Sci.7. doi: 10.3389/fmars.2020.604411
68
Sussarellu R. Fabioux C. Le Moullac G. Fleury E. Moraga D. (2010). Transcriptomic response of the Pacific oyster Crassostrea gigas to hypoxia. Mar. Genomics3, 133–143. doi: 10.1016/j.margen.2010.08.005
69
Tang M. Bolderson E. O’Byrne K. J. Richard D. J. (2021). Tumor hypoxia drives genomic instability. Front. Cell Dev. Biol.9. doi: 10.3389/fcell.2021.626229
70
Tarazona S. García-Alcalde F. Dopazo J. Ferrer A. Conesa A. (2011). Differential expression in RNA-seq: A matter of depth. Genome Res.21, 2213–2223. doi: 10.1101/gr.124321.111
71
Wang G. L. Semenza G. L. (1993). General involvement of hypoxia-inducible factor 1 in transcriptional response to hypoxia. Proc. Natl. Acad. Sci.90, 4304–4308. doi: 10.1073/pnas.90.9.4304
72
Wickham H. (2016). ggplot2: elegant graphics for data analysis. (New York: Springer-Verlag). Available at: https://ggplot2.tidyverse.org.
73
Woo S. Denis V. Won H. Shin K. Lee G. Lee T.-K. et al . (2013). Expressions of oxidative stress-related genes and antioxidant enzyme activities in Mytilus galloprovincialis (Bivalvia, Mollusca) exposed to hypoxia. Zool. Stud.52, 15. doi: 10.1186/1810-522X-52-15
74
Wu R. S. S. (2002). Hypoxia: From molecular responses to ecosystem responses. Mar. pollut. Bull.45, 35–45. doi: 10.1016/S0025-326X(02)00061-9
75
Zhang G. Li L. Meng J. Qi H. Qu T. Xu F. et al . (2016). Molecular basis for adaptation of oysters to stressful marine intertidal environments. Annu. Rev. Anim. Biosci.4, 357–381. doi: 10.1146/annurev-animal-022114-110903
Summary
Keywords
hypoxia, climate change, Crassostrea virginica , transcriptomics, gene expression, local adaptation
Citation
Crable EL, Rodriguez H, Vaidya RV, Coxe N, La Peyre JF and Kelly MW (2024) Transcriptomic responses to hypoxia in two populations of eastern oyster with differing tolerance. Front. Mar. Sci. 11:1462905. doi: 10.3389/fmars.2024.1462905
Received
10 July 2024
Accepted
03 September 2024
Published
23 September 2024
Volume
11 - 2024
Edited by
Tao Wang, Nanjing Normal University, China
Reviewed by
Basanta Kumar Das, Central Inland Fisheries Research Institute (ICAR), India
Vengatesen Thiyagarajan (rajan), The University of Hong Kong, Hong Kong SAR, China
Updates
Copyright
© 2024 Crable, Rodriguez, Vaidya, Coxe, La Peyre and Kelly.
This is an open-access article distributed under the terms of the Creative Commons Attribution License (CC BY). The use, distribution or reproduction in other forums is permitted, provided the original author(s) and the copyright owner(s) are credited and that the original publication in this journal is cited, in accordance with accepted academic practice. No use, distribution or reproduction is permitted which does not comply with these terms.
*Correspondence: Emma L. Crable, emma.crable@gmail.com
†These authors have contributed equally to this work
Disclaimer
All claims expressed in this article are solely those of the authors and do not necessarily represent those of their affiliated organizations, or those of the publisher, the editors and the reviewers. Any product that may be evaluated in this article or claim that may be made by its manufacturer is not guaranteed or endorsed by the publisher.