Abstract
Shallow-water bathymetric maps provide vital geographic information for various coastal and marine applications such as environmental management, engineering construction, oil and gas resource exploration, and ocean fisheries. Recently, satellite-derived bathymetry (SDB) has emerged as an alternative approach to shallow-water bathymetry, particularly in hard-to-reach areas. In this research, an innovative approach to bathymetry was introduced. This method provides a reliable approach for generating high-accuracy and high-reliability shallow water bathymetry results. By using Sentinel-2 time series imagery combined with ICESat-2 data, four bathymetry results at different time points are produced based on four traditional bathymetry methods. For the results at each location, a statistical method is applied to evaluate the bathymetry results, remove erroneous data, and generate high-confidence bathymetry results. The validation results indicated that the accuracy of the proposed bathymetric method achieved an R² range of 0.96 to 0.99 and an RMSE between 0.42 and 1.18 meters. When contrasted with traditional methods that utilize a single temporal image, a notable enhancement in bathymetric accuracy was observed.
1 Introduction
Coastal, island, and reef regions in shallow waters offer essential habitats that support biodiversity and the sustainability of marine ecosystems (Nicholls and Cazenave, 2010; Pacheco et al., 2015). Bathymetric maps of shallow-water areas provide essential geographic information for various coastal and marine applications, such as shallow-sea environmental governance, engineering construction, oil and gas resource exploration, and aquatic fishing (Kutser et al., 2020; Xu et al., 2023). Traditional techniques, including shipborne single- and multibeam echo sounding and airborne LiDAR bathymetric systems, are extensively employed for determining water depth and mapping subaqueous terrain in shallow-water areas (Wang et al., 2015; Shang et al., 2019; Wu et al., 2024). Although these techniques provide accurate and high-resolution bathymetric data, they are limited by external and environmental factors, such as complex geographical settings, diverse geological features, significant spatial variability, and geopolitical issues (Westfeld et al., 2017).
Recent advancements in satellite technology have increased the utilization of multispectral imagery captured by sensors on board satellites, such as Sentinel-2, WorldView-2, and IKONOS, for shallow-water bathymetry (Adler-Golden et al., 2005; Yunus et al., 2019; Manessa et al., 2016; Cahalane et al., 2019). Due to its ease of use, effectiveness, and affordability, satellite-derived bathymetry (SDB) has become the prevailing technique for charting shallow water areas. The extraction of bathymetric information from multispectral images can be classified into two groups: models based on physical principles and models based on empirical observations (Casal et al., 2020).
Physics-based models can be employed to acquire bathymetric results without “in situ” measurements. However, various parameters that are usually difficult to acquire (e.g., the inherent optical properties possessed by water) are required to drive the models, leading to low accuracy and reliability of physics-based models (Hedley et al., 2018). In the empirical models, the attenuation of light and the contributions of the water column were derived by regression between the band reflectance of images and in-situ water depth (Monteys et al., 2015). Due to their ease of use and reasonable accuracy, empirical models remain a widely utilized and practical method for obtaining bathymetry from spaceborne multispectral images. Popular empirical models include the dual-band ratio, linear band models, and advanced machine learning methods such as support vector regression (SVR) and random forest (RF) (Lyzenga, 1985; Stumpf et al., 2003; Lyzenga et al., 2006; Albright and Glennie, 2020; Manessa et al., 2016; Yang et al., 2022).
Although empirical SDB models using in-situ water depth and spectroscopic images offer significant advances in shallow-water bathymetry, two main challenges hinder the progress of multispectral bathymetry: 1) These models require numerous high-precision in-situ measurements uniformly distributed across the study area to capture all seabed and water characteristics. 2) External factors such as sensor performance, atmospheric and lighting conditions, sea surface foam, inherent optical properties of the water column, and bottom reflectance impact multispectral images, resulting in lower accuracy and reliability in bathymetric data from a single image.
The ATLAS instrument aboard ICESat-2 provides a valuable opportunity for global shallow-water bathymetry research by utilizing a photon-counting method to collect altimetry data. Although ICESat-2 was originally designed to observe polar glaciers, land surfaces, and vegetation, its use of 532 nm green light has shown significant promise for shallow-water bathymetry (Markus et al., 2017). According to research findings, ICESat-2 has the capability to accurately assess depths of up to 38 meters in transparent aquatic environments (Forfinski-Sarkozi et al., 2016; Parrish et al., 2019). The corresponding authors have analyzed the bathymetric errors of ICESat-2, demonstrating that its bathymetric accuracy (RMSE) is 0.6 meters (Coveney et al., 2021). Additionally, previous studies have confirmed the feasibility of using ICESat-2 data for satellite-derived bathymetry. Despite the wide spacing between beam pairs (3.3 km), limiting spatial continuity, the depth profiles obtained through ICESat-2 can still offer crucial in-situ data essential for developing satellite-derived bathymetry (SDB) models (Albright and Glennie, 2020).
Solar energy is significantly attenuated when it passes through the atmosphere and water, resulting in an extremely weak reflection of the water bottom. Therefore, the bathymetric results of a single image are easily affected by various types of noise. The preprocessing of the image (e.g., atmospheric correction and glint removal) and the selection of SDB models greatly influences the bathymetric outcomes derived from an individual image (Warren et al., 2019; Hedley et al., 2005; Caballero and Stumpf, 2019). One method to reduce the uncertainty in bathymetric results derived from a single image is the fusion of time-series images. Relative methods produce optimal images by fusing time-series images (Favoretto et al., 2017; Traganos et al., 2018; Chu et al., 2019; Xu et al., 2021). These methods typically average the bathymetric results obtained from multi-temporal data as the final result. Although these composition methods are simple, they offer new insights into shallow-water bathymetry.
This research introduces a method for shallow-water bathymetry that utilizes Sentinel-2 time-series imagery in conjunction with ICESat-2 data. In this method, the SDB results of the four traditional methods were generated for a single image, and the final results were produced by the fusion of all bathymetric results from all time-series images. The validation results suggest that this approach offers a fresh approach to minimize the ambiguity of SDB findings, improving the accuracy and reliability of depth measurements obtained through satellite technology.
2 Methodology
The framework of the proposed method is illustrated in Figure 1. Following image preprocessing, four traditional models—band ratio (BR), linear band (LB), support vector regression (SVR) and random forest (RF) techniques were utilized to derive SDB results from individual images. For each pixel, a bathymetric sequence was created by combining the SDB results from all time-series images. This sequence was then used to generate the final SDB results and assess their accuracy.
Figure 1
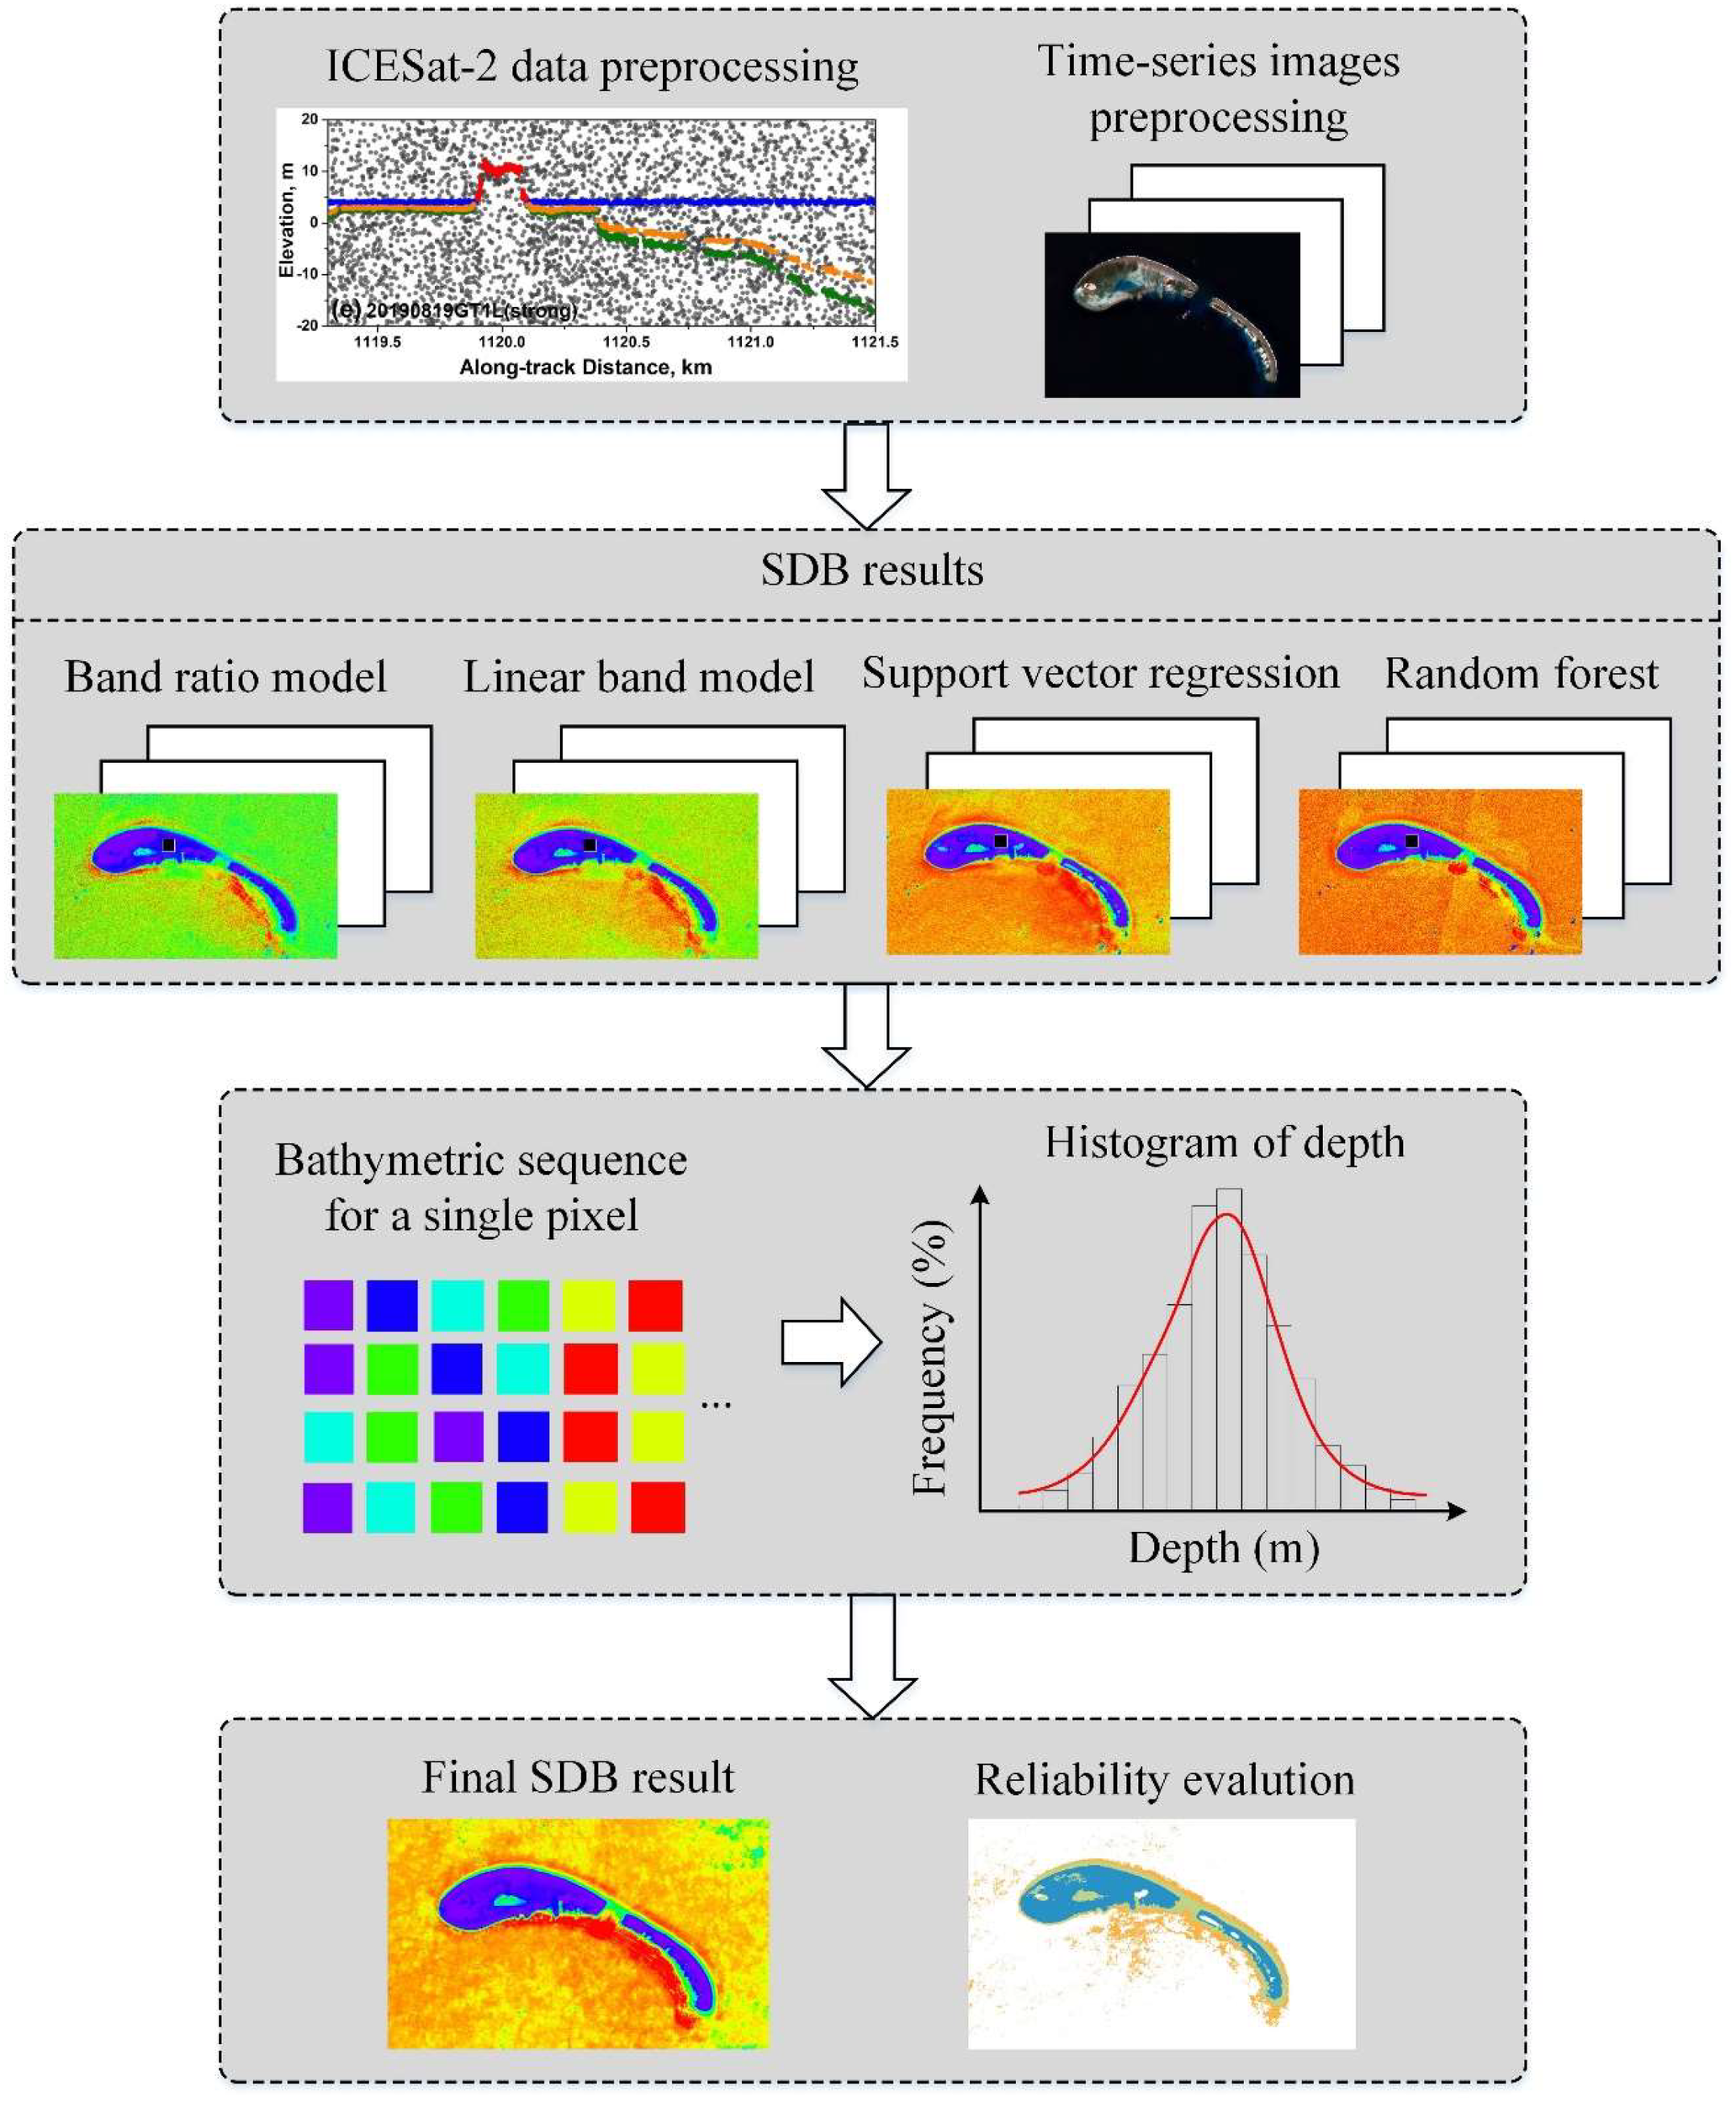
The framework of the proposed SDB method in this research.
2.1 Data preprocessing
The processing of all ICESat-2 ATL03 ground tracks involved applying filtering and refraction correction algorithms. The photons in the ATL03 product were adjusted for various geophysical effects, such as atmospheric refraction, and categorized as signal or background photons based on confidence parameters (Li et al., 2019). However, the confidence marker parameter is not suitable for underwater photons, including photons in both in the water column and at the sediment layer (Ma et al., 2020). Additionally, the displacement of bottom photons due to refraction was not accounted for in the ATL03 data. In this study, an adaptive variable ellipse filtering bathymetric method (AVEBM) was employed to accurately differentiate photons originating from the ocean surface and underwater terrain (Chen et al., 2021). With this algorithm, a density-based variable elliptical filter was employed to separate sea-surface and seafloor photons from noisy raw ATL03 photons. The filtering algorithm included the following steps: 1) the original photons were divided into segments along the height direction, and Gaussian curve fitting was applied to capture the relationship between the center elevation and the number of photons in the segments. 2) Above-water, water-surface, and water-column photons were separated based on the parameters of the fitted Gaussian curve. 3) The parameters of the elliptical filter were determined, and signal photons were detected. The detected bottom photons’ coordinates were subsequently adjusted using a refraction correction technique that relied on ray tracing and JONSWAP spectra (Joint North Sea Wave Project, JONSWAP), leading to the creation of a bathymetric profile (Zhang D. et al., 2022). With this algorithm, the air/sea intersection point was calculated, and the corresponding slope, incident angle, and refraction angle were determined for each seafloor signal photon. Furthermore, the refraction displacements in elevation and along-track and cross-track directions were corrected to improve bathymetric accuracy.
Preprocessing of the Sentinel-2 time-series images included atmospheric correction and glint removal. Sen2Cor, the official processor for Sentinel-2 Level 2A products, was employed for this purpose. It applies corrections for atmospheric interference, terrain effects, and cirrus clouds to the Top-Of-Atmosphere Level 1C data. The sunglint effect was addressed using the Deglint Operator in Sen2Cor (Ma et al., 2020). The calibration of the SDB models involved utilizing bands 2, 3, 4 and 8 of the Sentinel-2 products, which have resolutions of 10 m. The spectral response ranges of these four bands were 458-523 nm, 543-578nm, 650-680nm and 785-900nm, as well as the central wavelengths were 490.5, 560.5, 665 and 842.5nm, respectively (Le et al., 2022).
Owing to differences in tidal height among the ATL03 data, Sentinel-2 images, and reference airborne LiDAR bathymetry (ALB) data (Guo et al., 2022; Schwarz et al., 2019), tidal correction was conducted using the NAO.99 tide model (Matsumoto et al., 2000) based on the acquisition times of these data. The time resolution of the tidal data generated by the tide model was 1 hour, however, the acquisition time of the Sentinel-2 images was instantaneous. Therefore, the time resolution of the tidal data was first resampled from 1 h to 1 min using a B-spline function, and the tide heights at the acquisition time of the Sentinel-2 images, ICESat-2 data and ALB data were obtained. Furthermore, variations in the tide heights among the ICESat-2, ALB, and Sentinel-2 images were acquired. Finally, the alignment of the Sentinel-2 imagery necessitated adjustments to the water surface elevation in both the ICESat-2 and ALB data.
2.2 SDB methods for a single image
Several factors would influence the bathymetric accuracy of the SDB models, including but not limited to the radiation quality of the image, the form of the model, the utilization of the bands, and the distribution of the sample data. Therefore, four widely used SDB models with different forms, different utilization of the bands, and relatively simple structure were chosen for the subsequent processing procedures. Two empirical and two machine learning algorithms were trained on a single multispectral image to generate bathymetric maps, using ICESat-2 bathymetric data as ground truth references. The commonly utilized band ratio and linear band models were established by Stumpf et al. (1) and (2), respectively (Lyzenga, 1985; Stumpf et al., 2003; Lyzenga et al., 2006).
The bathymetry, represented as , is obtained from the multispectral image using a constant to ensure that the logarithm remains positive in all situations. This proportion results in a depth-related linear reaction (Caballero and Stumpf, 2019). and are the surface reflectance for bands i and j. is the average deep-water signal. The remaining parameters, , , and , were acquired using linear regression, which minimized the difference between the ICESat-2 and estimated depths.
SVR and RF are effective machine learning algorithms for shallow-water bathymetry (Pan et al., 2015; Tonion et al., 2020). These techniques categorize the identified pixel depths into evenly distributed training and validation sets, reconstructing bathymetric maps by analyzing the intricate correlation between remote sensing reflectance and the depth of water. SVR uses various kernel functions—such as linear, sigmoid, radial, and polynomial—to achieve effective regression fitting. In contrast, the RF model utilizes a collection of decision trees, which work together to make classifications on new data.
2.3 Fusion of SDB results of time-series images
For any given remote sensing image and inversion model, inversion errors are always present, and the distribution of these errors is not uniform. However, on a global scale, the inversion results should approach the true values because in situ water depths are used as sample data to solve for the model parameters during the inversion process. According to the Law of Large Numbers in statistics, a single measurement often carries a degree of uncertainty, and repeated measurements can mitigate the impact of random errors. In this research, water depths of a 3×3 neighborhood centered on a specific pixel were extracted, and these depths from all SDB methods and time-series images were combined to construct a bathymetric sequence , which contains a total of depth data points. Some significant outliers usually appear in the bathymetric sequence and must be removed. The 3-times standard deviation method was employed to remove outliers using Equation 3, and the processed bathymetric sequence, was generated. represents the mean value of the bathymetric sequence , and denotes the i-th depth point in the sequence .
Furthermore, a statistical histogram of the bathymetric sequence was generated, and Gaussian fitting was performed using Equation 4, with the frequency plotted on the y-axis and the water depth represented on the x-axis.
Where the symbols , , and represent the Gaussian curve’s peak amplitude, location, and standard deviation are the respective factors being considered. These values were accurately estimated through the least-squares method. The final SDB result for the pixel was the value of , while was used for the subsequent reliability assessment as described in Equation 5.
3 Materials
3.1 Study area
Two areas, indicated by solid yellow circles in Figure 2A, were chosen for this study. The initial research location is located in the southeastern region of Long Island, the Bhamas, spanning latitudes 22°48’ to 23°09’ N and longitudes 74°48’ to 75°00’ W. Long Island is a part of the Bahama Islands, which is distributed over an area of approximately 14,000 square kilometers and consists of 700 islands and 2400 reefs (Figure 2B). The second research area is the Qilianyu Islands within the Xisha Islands, covering latitudes 16°54’ to 17°00’ N and longitudes 112°11’ to 112°22’ E. The Xisha Islands, situated in the South China Sea, comprise various maritime features such as islands, reefs, and banks (Figure 2C). This group of islands is comprised of approximately 130 coral islands and reefs, which are primarily divided into the Dexuan Islands in the northeast and the Yongle Islands in the west. The total area covered by this region is estimated to be around 15,000 square kilometers, with a landmass spanning roughly 7.75 square kilometers.
Figure 2
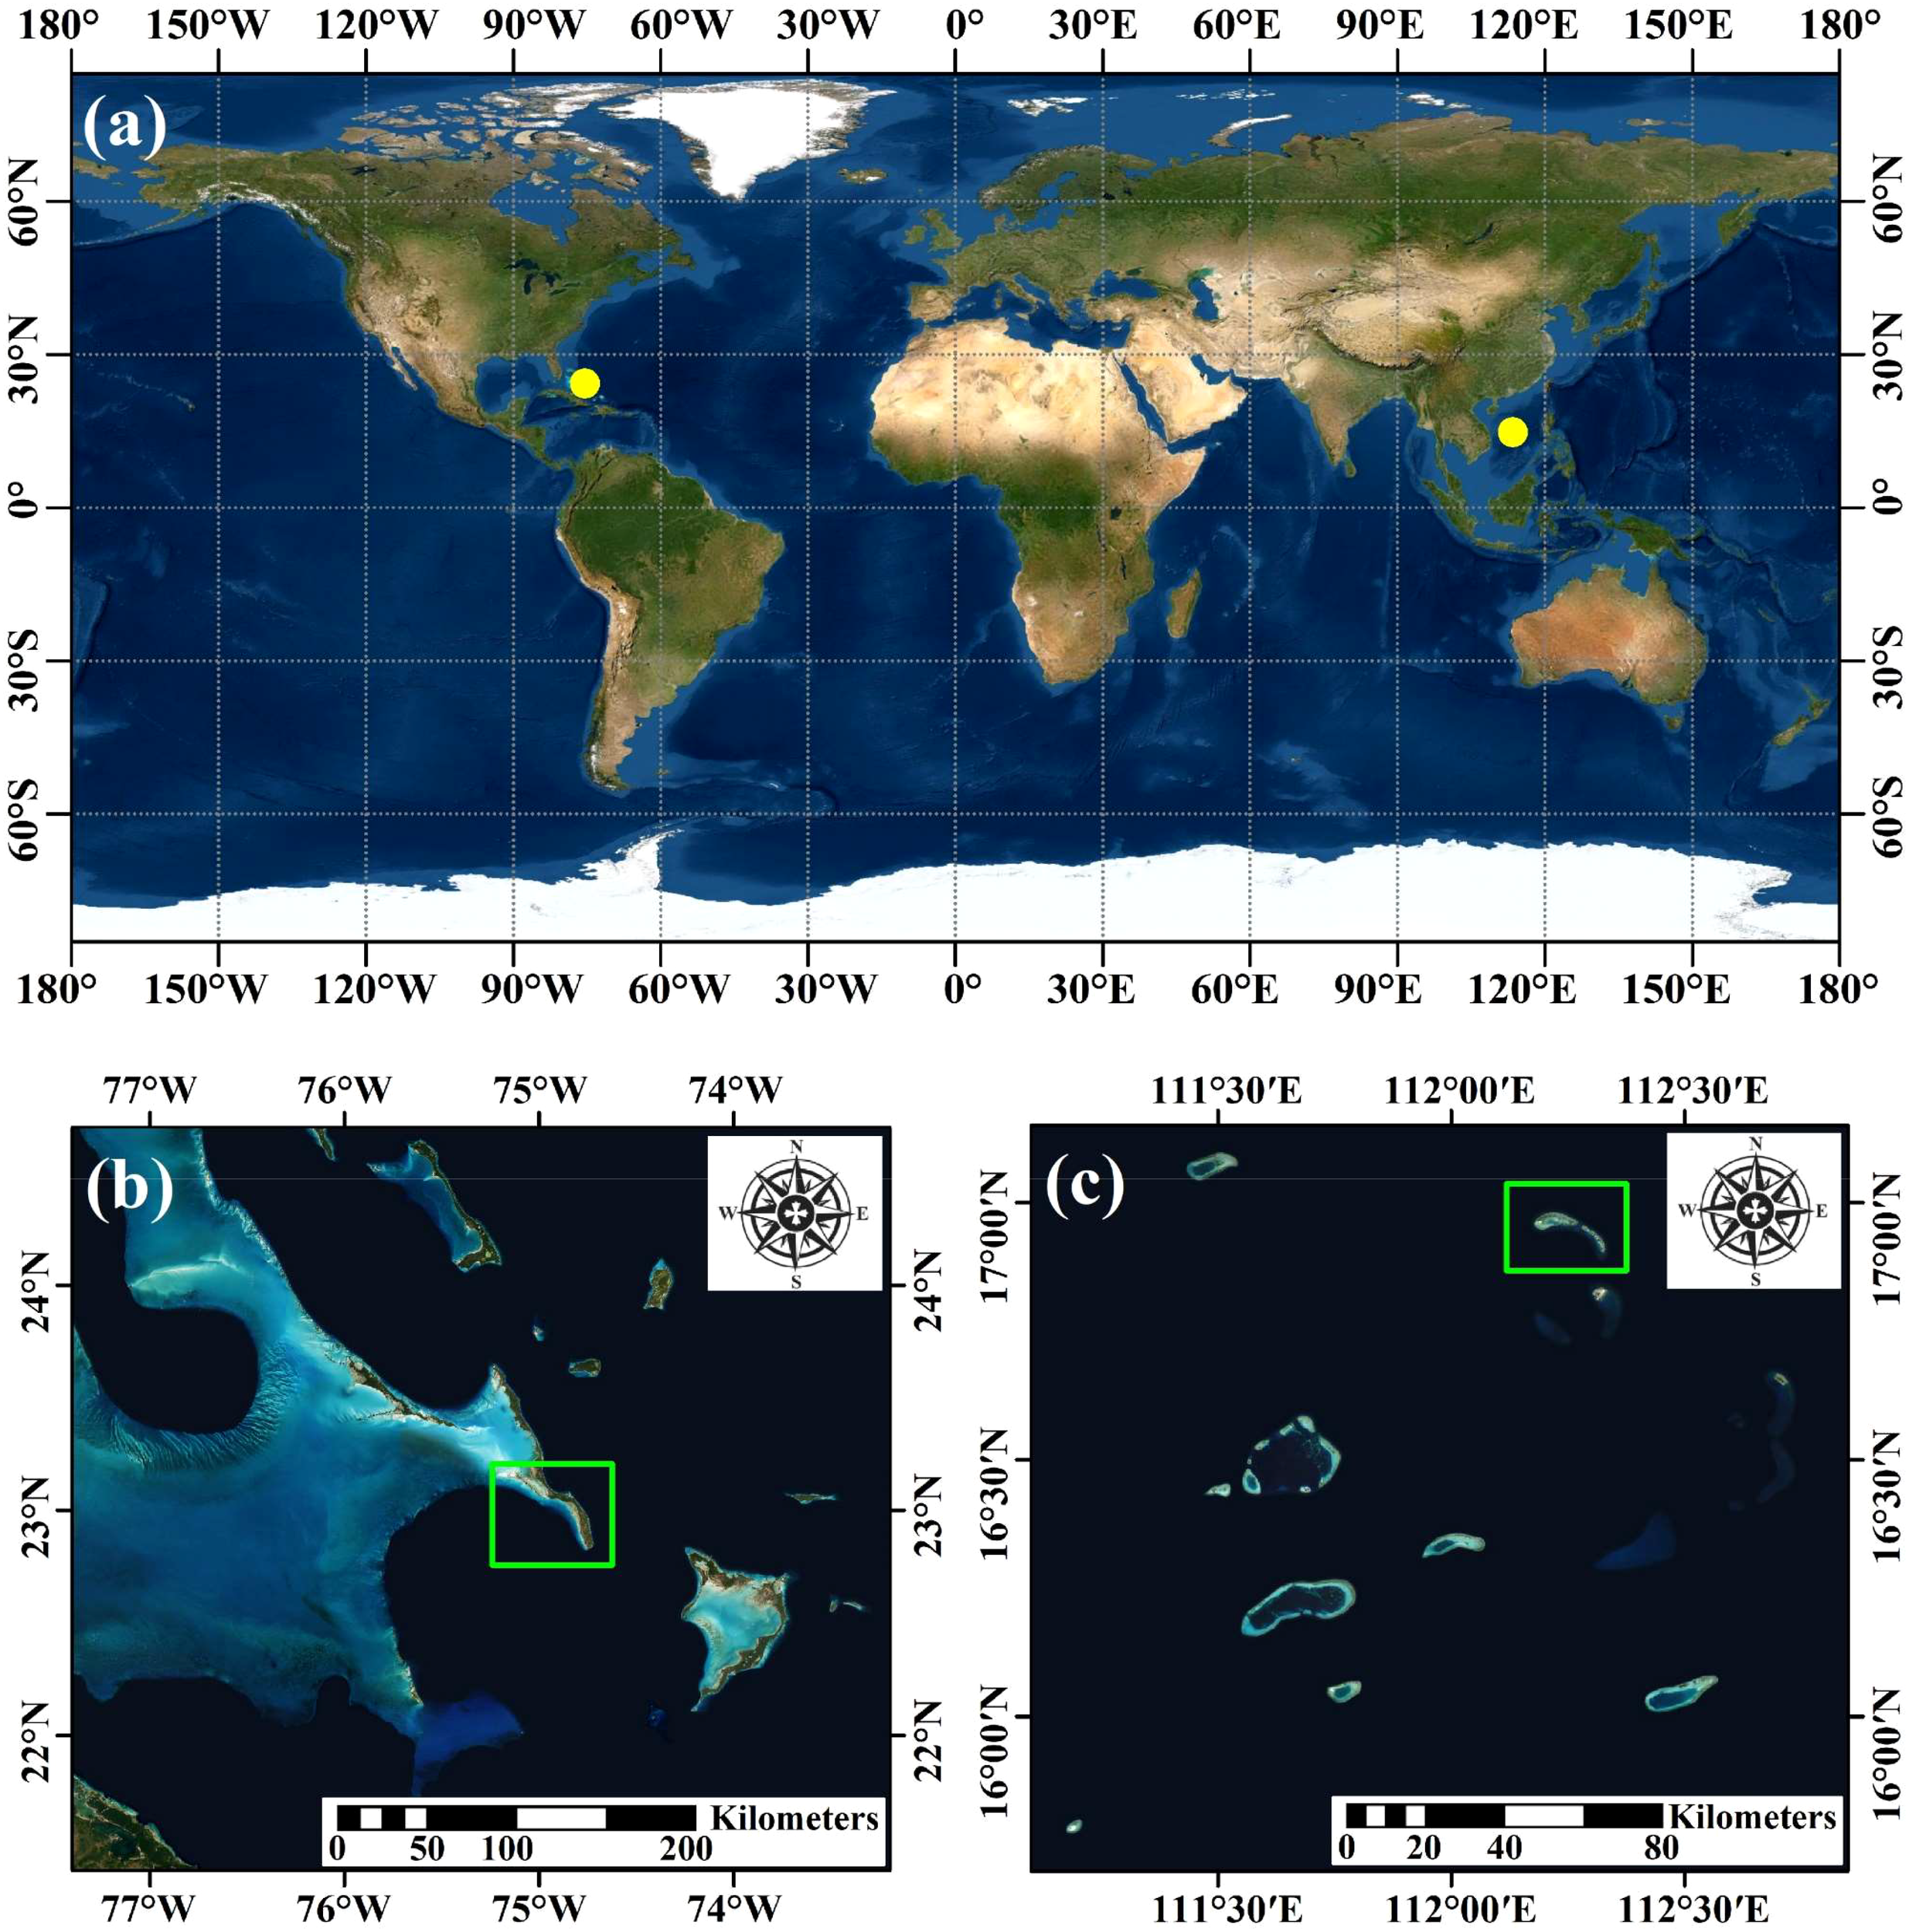
Location of the two study areas. Yellow solid circles in sub-Figure (A) illustrated the rough location, sub-figure (B, C) illustrated the distribution of islands and reefs around the two study areas. Green rectangles represent the two study areas, Long Island and Qilianyu Islands.
3.2 Sentinel-2 images
Standard Sentinel-2 Multispectral Instrument products, including Level-1C and Level-2A, were captured in both study areas. All images were selected with a cloud cover of less than 10%. The Level-2A products are images that have undergone atmospheric correction and are derived from the Level-1C products (Drusch et al., 2012; Toming et al., 2016). In this research, the conversion of All Level-1C products to Level-2A was carried out using Sen2Cor v2.10 (Xie et al., 2024), which was made available by the European Space Agency (ESA). The Deglint Operator of Sen2Cor was utilized to correct for sunglint in the visible bands by estimating and compensating for it using data from the near-infrared (NIR) band (Hedley et al., 2005). Finally, 16 images from Long Island and the Qilianyu Islands from 2016 to 2022 were selected to composite the time-series images (Table 1).
Table 1
| Long Island | Qilianyu Islands | ||||||
|---|---|---|---|---|---|---|---|
| ID | Date | ID | Date | ID | Date | ID | Date |
| 1 | 20160205 | 9 | 20210203 | 1 | 20190326 | 9 | 20210708 |
| 2 | 20170209 | 10 | 20210305 | 2 | 20190515 | 10 | 20210713 |
| 3 | 20171221 | 11 | 20210419 | 3 | 20191027 | 11 | 20210802 |
| 4 | 20180301 | 12 | 20210921 | 4 | 20210228 | 12 | 20210817 |
| 5 | 20181121 | 13 | 20211001 | 5 | 20210315 | 13 | 20210926 |
| 6 | 20190105 | 14 | 20211011 | 6 | 20210330 | 14 | 20211001 |
| 7 | 20190120 | 15 | 20211210 | 7 | 20210404 | 15 | 20211021 |
| 8 | 20201130 | 16 | 20220213 | 8 | 20210703 | 16 | 20211031 |
Time-series images of Long Island and Qilianyu Islands.
3.3 ICESat-2 trajectories
This research employed the global geolocated photon product (ATL03) from ICESat-2 (Song et al., 2024), which integrates Precision Pointing Determination (PPD) and Precision Orbit Determination (POD), and unit-converted telemetry to generate a Level-2 dataset. This collection of data comprises ellipsoidal heights with geolocation for every photon event tagged with a specific time from ATLAS (Neumann et al., 2019). ATLAS utilizes a setup consisting of three sets of laser beams, with each set positioned at an approximate distance of 3.3 km from one another. These pairs are further divided into sub-beams, consisting of both strong and weak components, resulting in a cumulative count of six distinct sets of data. Each group includes parameters for one ATLAS ground track scanned by a laser beam (strong or weak), designated as GT1L, GT1R, GT2L, GT2R, GT3L, and GT3R.For this study, 15 ground tracks from four ATL03 products were acquired for Long Island, and 12 ground tracks from seven ATL03 products were acquired for Qilianyu Islands (Figure 3; Table 2). Ground tracks were evenly distributed across the study area.
Figure 3
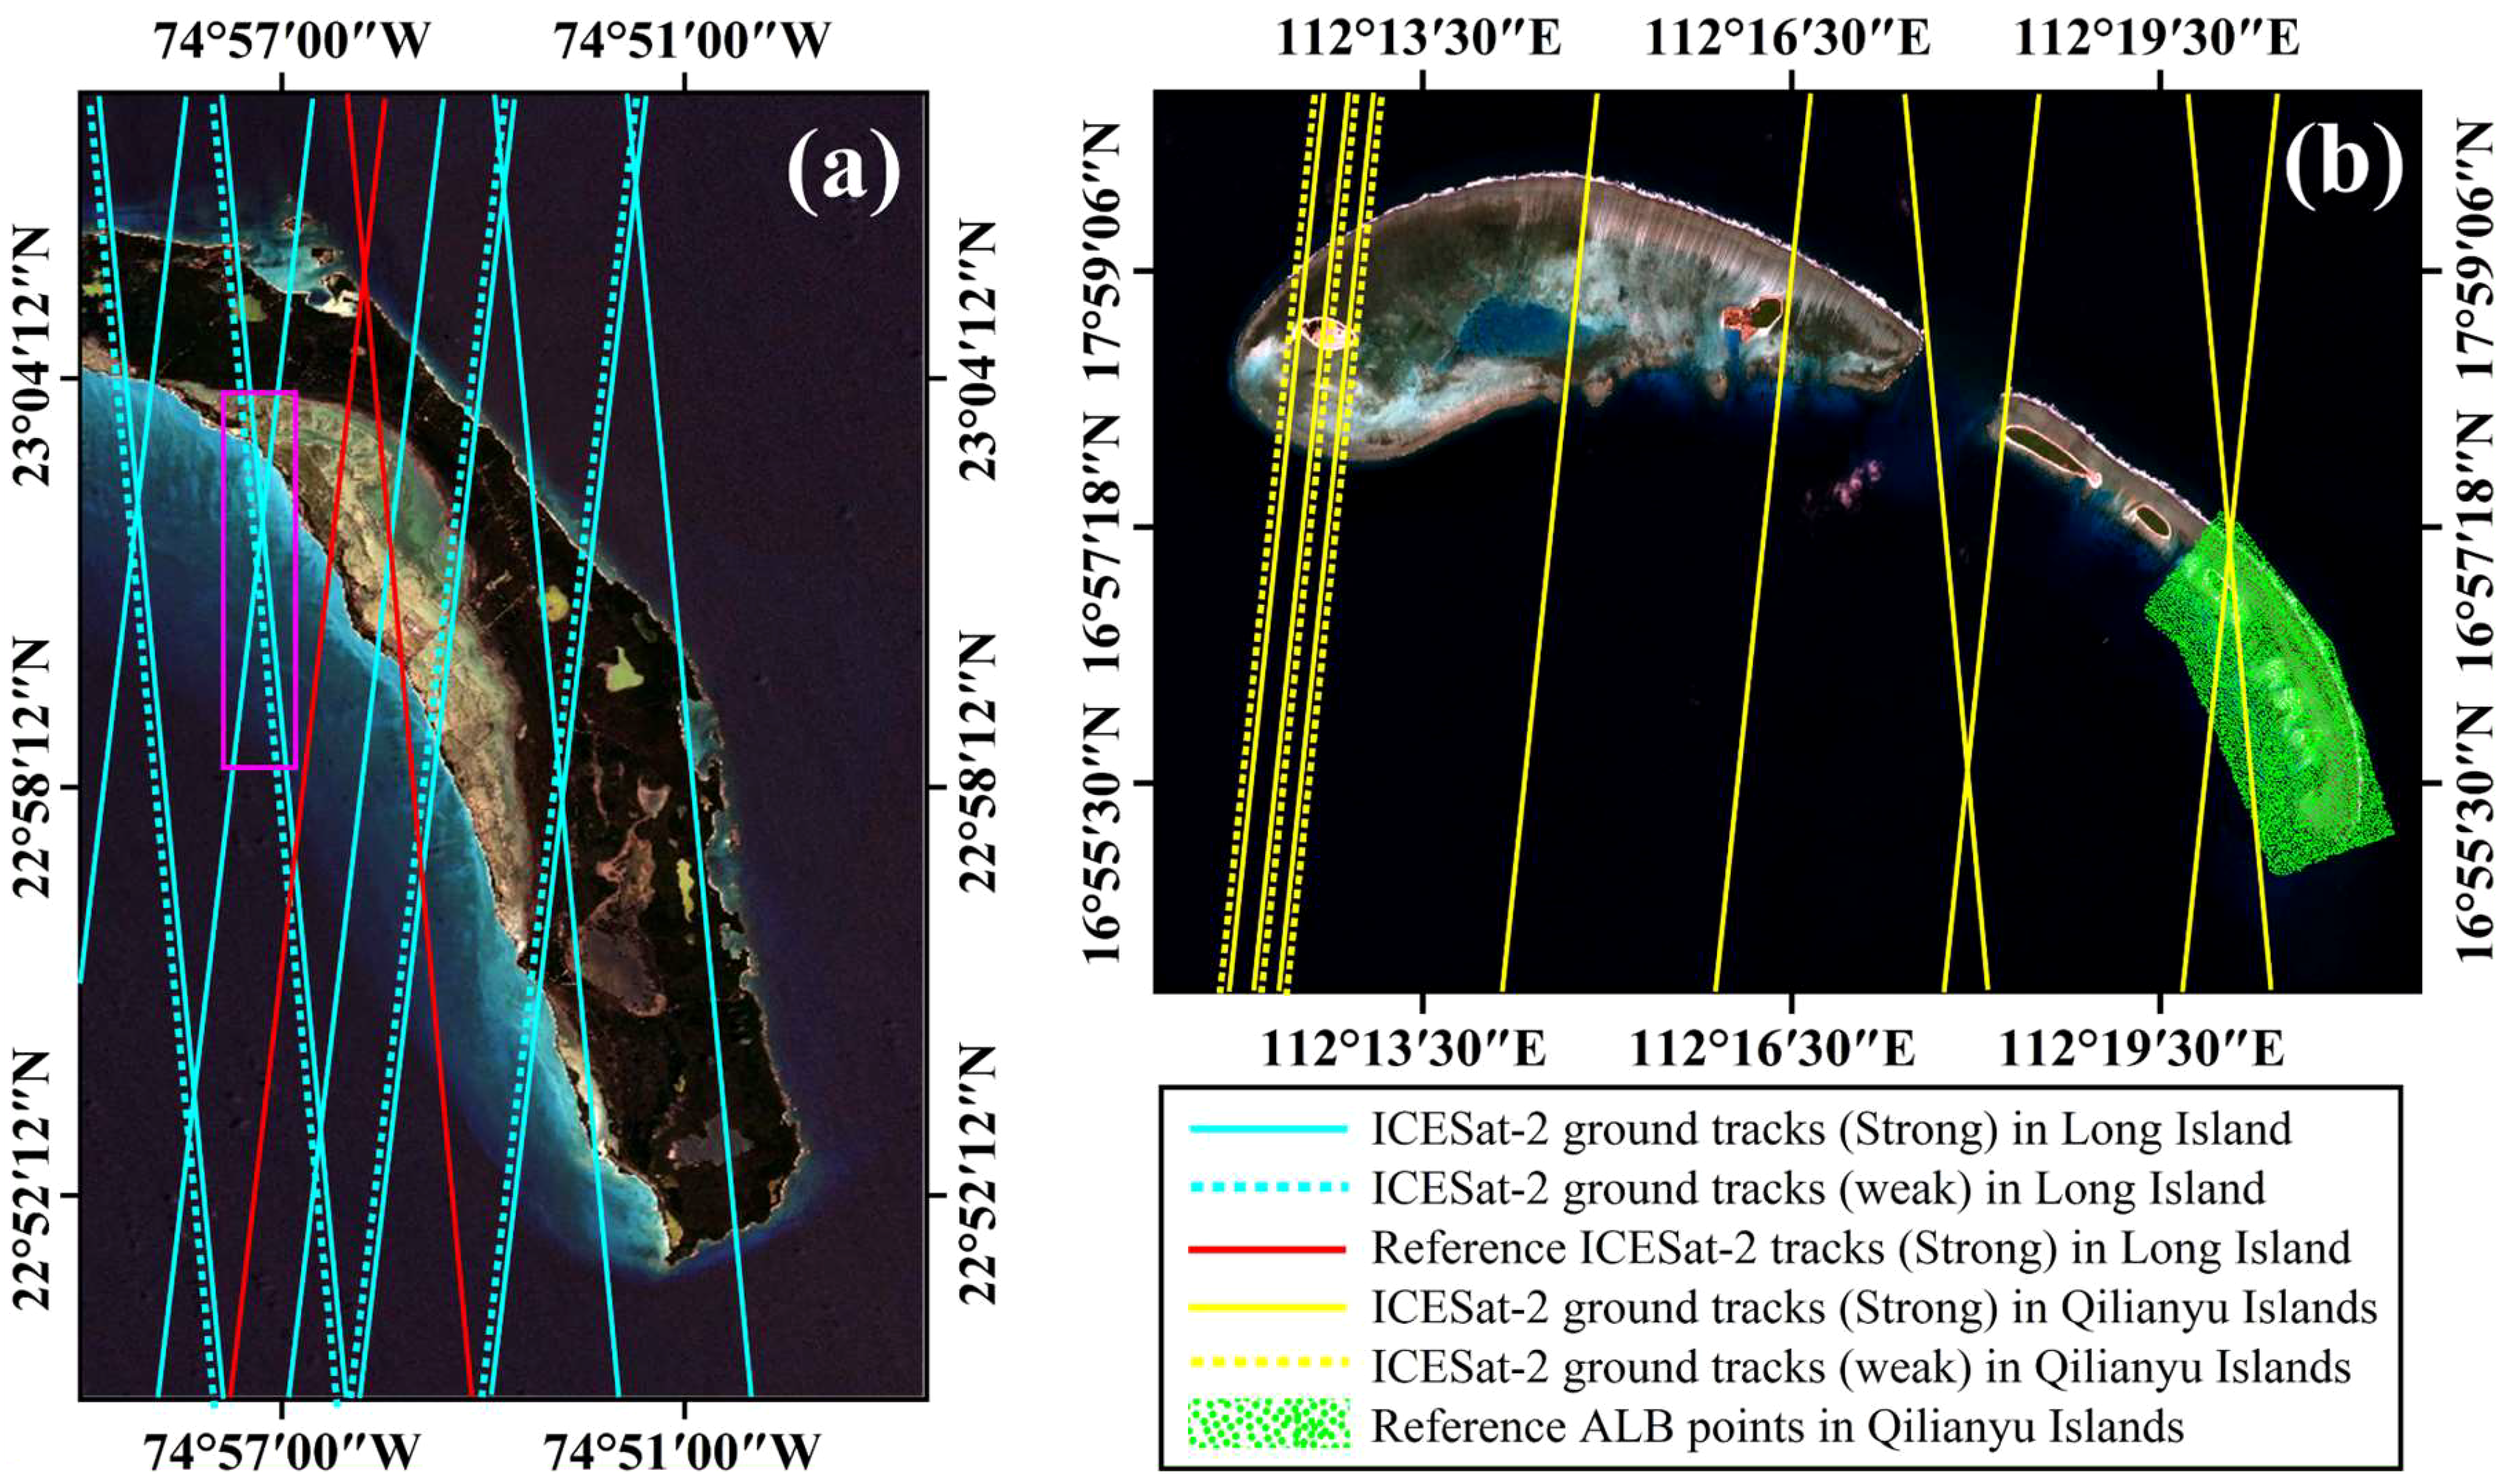
ICESat-2 laser-beam ground tracks used at (A) Long Island and (B) Qilianyu Islands. The caeruleous and yellow lines represent the ground tracks of strong laser beams, whereas the caeruleous and yellow dotted lines represent the ground tracks of weak laser beams. The red lines and the green solid circles represent the reference ICESat-2 ground tracks and ALB points used to evaluate the accuracy of the final SDB results. The purple rectangle in (A) corresponds to the sample area (to illustrate the details of the detection of signal photons and bathymetry of ICESat-2) in Figure 4.
Table 2
| Study area | ATL03 dataset | Acquisition time (UTC) | Ground track used |
|---|---|---|---|
| Long Island | 20200313 | 07:59 | GT1L (weak), GT2L (weak), GT1R, GT2R, GT3R* |
| 20200403 | 18:50 | GT1L (weak), GT2L (weak), GT1R, GT2R | |
| 20210101 | 05:50 | GT1L*, GT2L, GT3L | |
| 20211209 | 01:38 | GT1L, GT2L, GT3L | |
| Qilianyu Islands | 20181021 | 19:46 | GT1L (weak), GT1R |
| 20190117 | 03:31 | GT1L | |
| 20190421 | 11:06 | GT1L, GT1R (weak) | |
| 20190819 | 05:22 | GT1L | |
| 20200418 | 17:45 | GT3L (weak), GT3R | |
| 20210413 | 12:29 | GT3R | |
| 20210417 | 00:25 | GT1R, GT2R, GT3R |
Detailed information on the ICESat-2 laser-beam ground tracks used in this study.
*Represent the reference ATL03 ground tracks used in Long Island.
3.4 Reference data
On September 27, 2017, the Shanghai Institute of Optics and Fine Mechanics utilized the Mapper-5000’s ALB system to acquire in-situ water depth measurements for the Qilianyu Islands (He et al., 2018). This system attains a bathymetric RMSE precision of 0.23 m, functioning with a laser pulse repetition rate of 5 kHz and employing a wavelength measuring 532 nm. It collected 5056 bathymetric points from raw waveform data in the southeastern area of the Qilianyu Islands, indicated by the green points in Figure 3B. Unfortunately, no ALB data are available for Long Island. Instead, the performance evaluation of SDB derived from time-series images of Long Island was conducted using bathymetric data obtained from two ATL03 ground tracks, namely 20200313GT3R and 20210101GT1L. The ground tracks depicted in Figure 3 illustrate the spatial distribution of these locations. a. To evaluate the effectiveness of the proposed approach, various metrics were employed including coefficient of determination (R²), root mean square error (RMSE), bias, and slope analysis to compare estimated water depths with reference values.
4 Results
4.1 Detection of signal photons and bathymetry of ICESat-2
The selected sample area on Long Island, shown as a purple rectangle in Figure 3A, was used to demonstrate the bathymetric findings derived from the ATL03 datasets. Within this area, three ground tracks intersected. Specifically, two of these ground tracks (20200403GT2L and 20200403GT2R) were generated using different laser beam intensities - one strong and one weak. These acquisitions took place at 13:50 local time and exhibited some noise interference. The third ground track (20211209GT2L), acquired at 20:38 local time, had fewer noisy photons compared to the previous two tracks. By examining the Sentinel-2 image depicted in Figure 4A, it is evident that all three ground tracks traverse a coastal region with varying water depths. Significantly, a considerable quantity of signal photons were effectively detected throughout this procedure, encompassing those originating from both the uppermost and lowermost layers of the ocean. It is noteworthy that the identified photons from the ocean floor correspond remarkably well with the underwater topography observed in the Sentinel-2 image. It is notable that the bottom photons could even depict the small changes of the underwater topography, such as the peak near 23°00′10″N, which were marked by the green rectangles in Figures 4A–C.
Figure 4
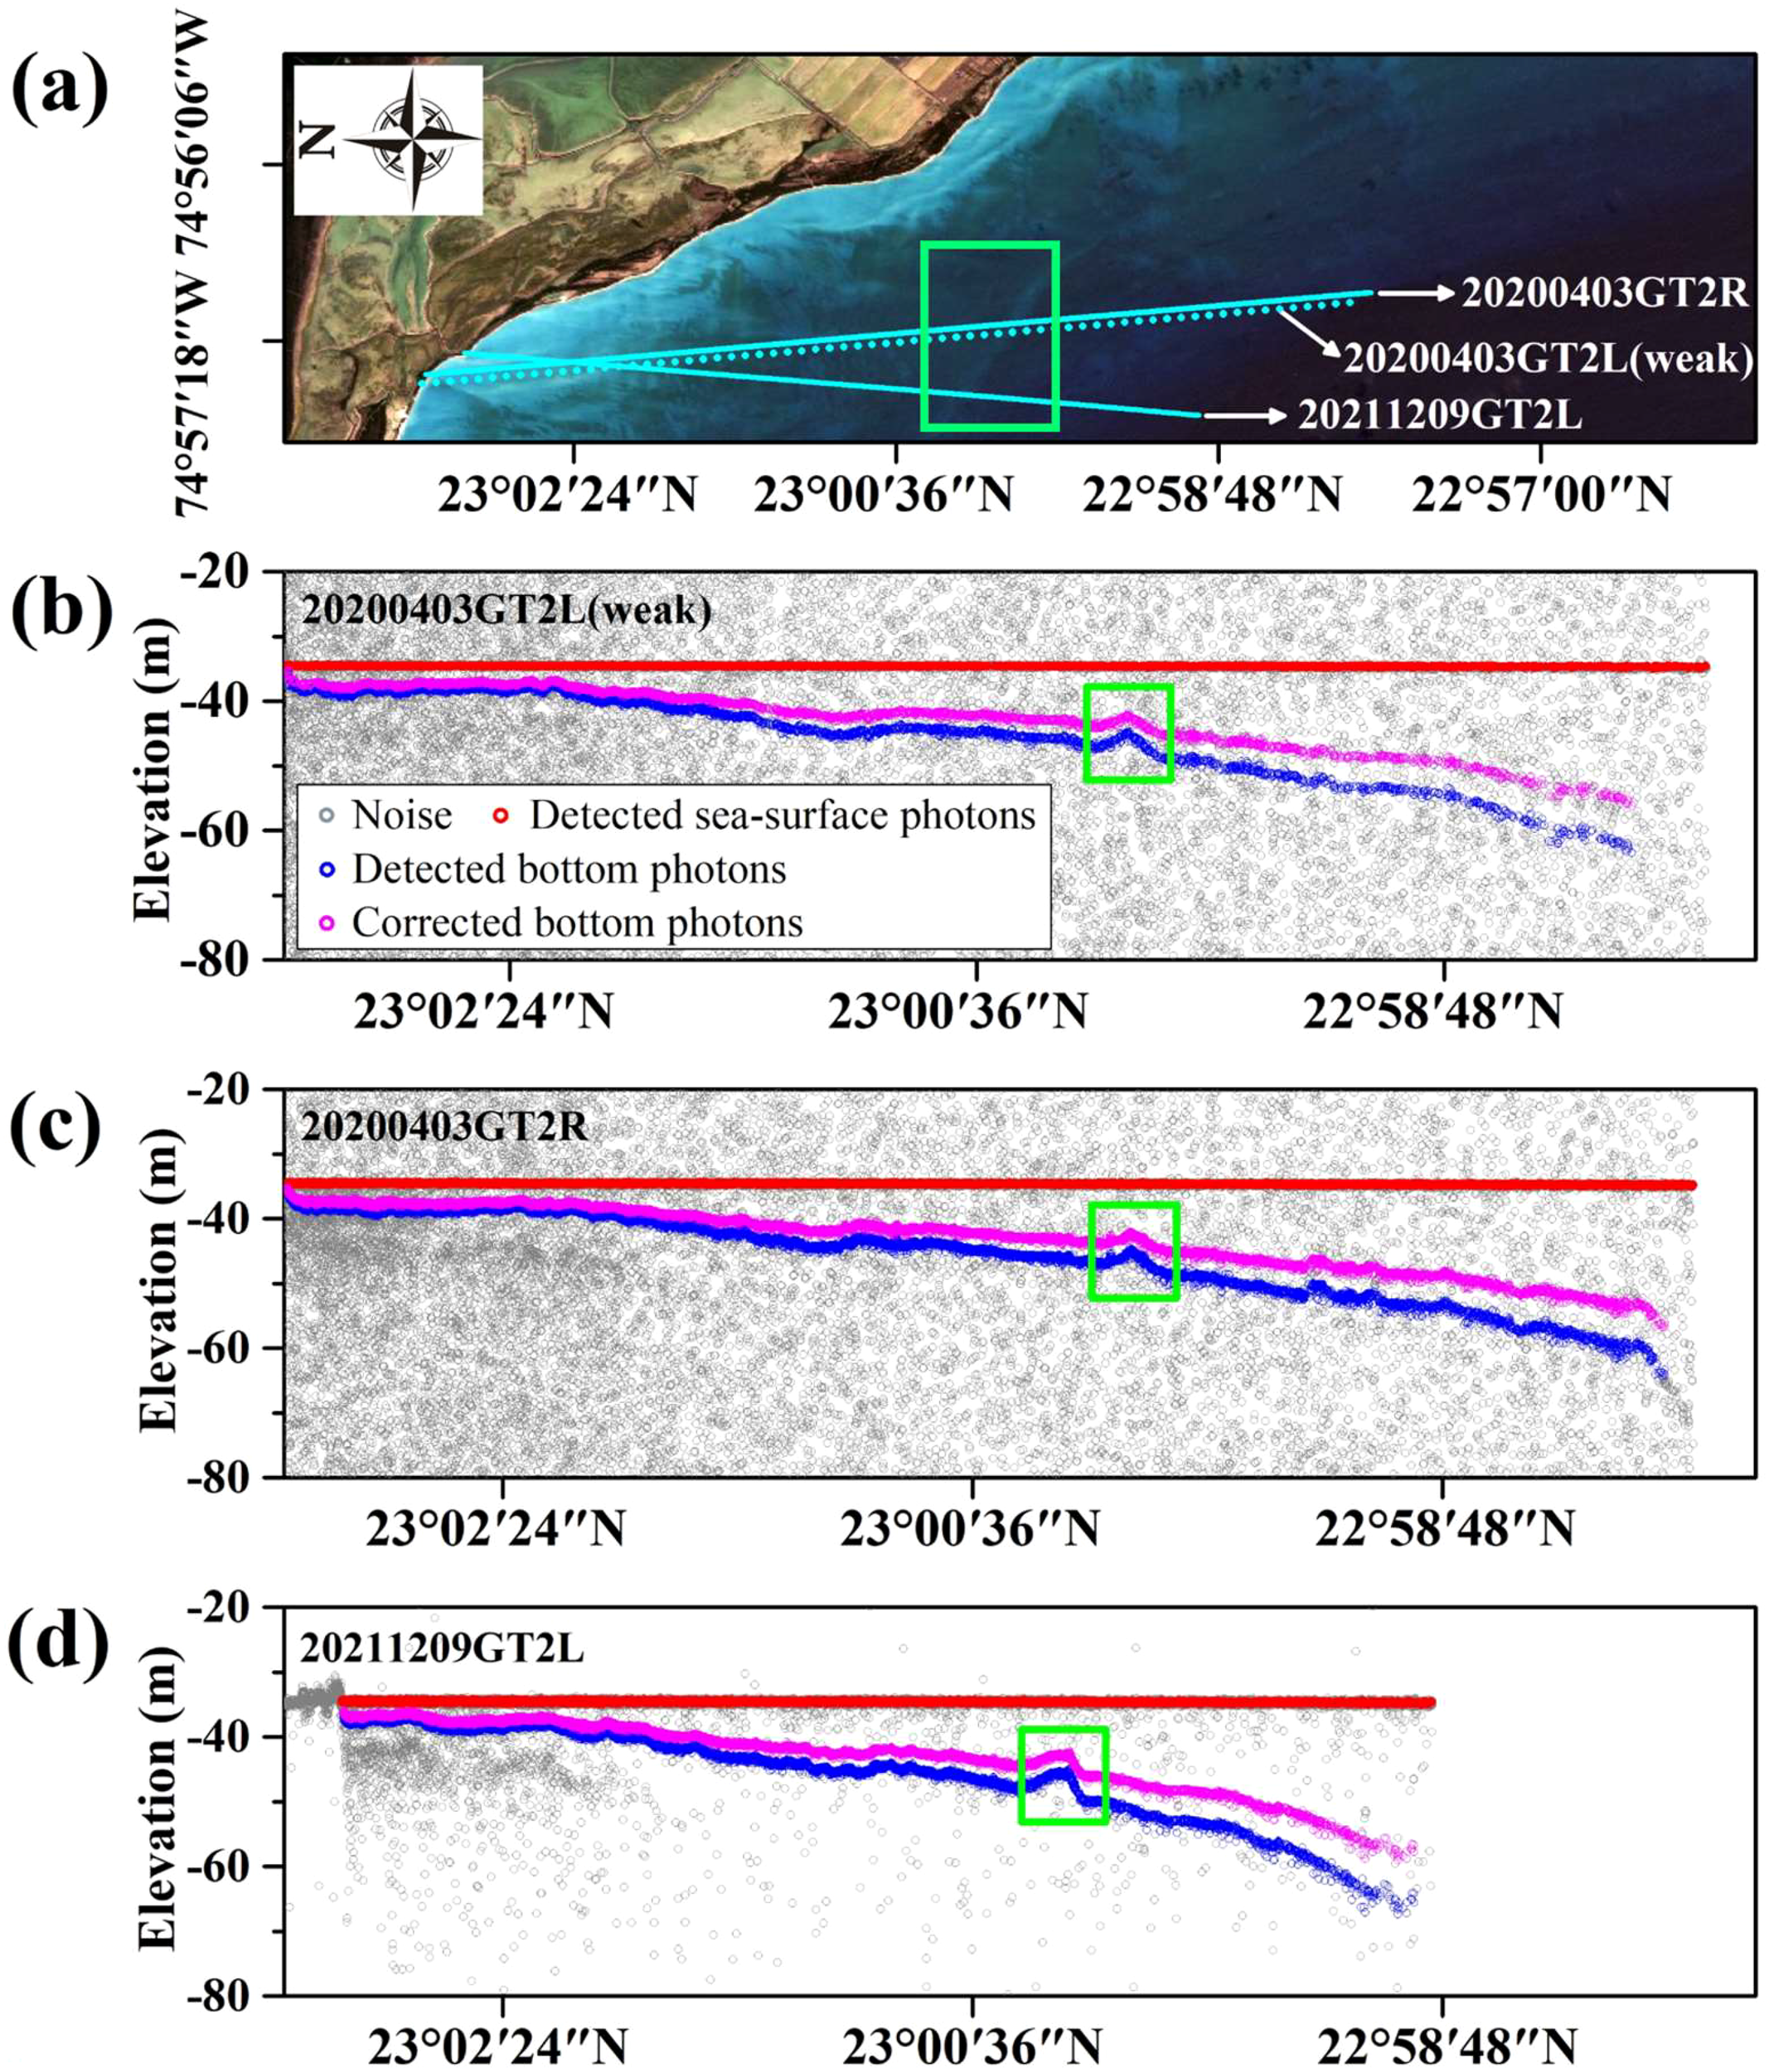
Sampled area at Long Island in the purple rectangle in Figure 3A. The enlarged Sentinel-2 image and three ATL03 ground tracks (20200403GT2L, 20200403GT2R and 20211209GT2L) were illustrated in sub-figure (A). The sub-figure (B–D) illustrated the raw photons, detected sea-surface photons, detected bottom photons and corrected bottom photons of these three ATL03 ground tracks, respectively.
Table 3 presents the bathymetric results for all ATL03 ground tracks. Due to variations in lighting conditions and the use of an adaptive filtering algorithm, significant discrepancies exist in the detected signal photon counts. On Long Island, the ground tracks ranged from 6 to 9 km in length, with sea surface photons detected between 1242 and 49273, and bottom photons ranging from 928 to 15587. The maximum water depth varied between 18.21 and 27.47 m. The Qilianyu Islands ground tracks were shorter, spanning 2 to 5 km, with fewer detected photons. Maximum water depths ranged from 7.44 to 23.08 m. Despite the weak laser beams having only 25% of the energy of the strong beams, no significant differences in bathymetric capability were observed. For instance, the maximum depth of 20200313GT1L was 25.59 m, slightly deeper than 20200313GT1R.
Table 3
| Study area | Ground Track | Number of detected sea-surface photons |
Number of detected bottom photons | Water depth (m) | |
|---|---|---|---|---|---|
| Min | max | ||||
| Long Island | 20200313GT1L(weak) | 4746 | 3635 | 0.87 | 25.59 |
| 20200313GT1R | 23782 | 15597 | 1.00 | 22.76 | |
| 20200313GT2L(weak) | 6716 | 3169 | 0.66 | 18.21 | |
| 20200313GT2R | 25890 | 10348 | 0.53 | 19.06 | |
| 20200313GT3R* | 23724 | 12290 | 2.33 | 25.88 | |
| 20200403GT1L(weak) | 3008 | 2607 | 0.51 | 22.08 | |
| 20200403GT1R | 20481 | 10814 | 1.24 | 22.76 | |
| 20200403GT2L(weak) | 4349 | 3774 | 0.67 | 21.71 | |
| 20200403GT2R | 16188 | 12937 | 0.30 | 20.83 | |
| 20210101GT1L* | 10293 | 15887 | 0.23 | 21.42 | |
| 20210101GT2L | 2418 | 4236 | 0.31 | 27.47 | |
| 20210101GT3L | 1242 | 928 | 0.22 | 24.11 | |
| 20211209GT1L | 49273 | 13278 | 1.15 | 21.99 | |
| 20211209GT2L | 31129 | 14034 | 1.25 | 24.24 | |
| 20211209GT3L | 34231 | 13671 | 0.98 | 23.72 | |
| Qilianyu Islands | 20181021GT1L(weak) | 1972 | 1964 | 0.32 | 8.71 |
| 20181021GT1R | 7981 | 8185 | 0.32 | 14.97 | |
| 20190117GT1L | 2294 | 2246 | 0.30 | 9.84 | |
| 20190421GT1L | 7227 | 4320 | 0.80 | 11.51 | |
| 20190421GT1R(weak) | 1719 | 890 | 0.84 | 15.19 | |
| 20190819GT1L | 1577 | 1382 | 0.40 | 15.72 | |
| 20200418GT3L(weak) | 2122 | 2288 | 0.58 | 7.44 | |
| 20200418GT3R | 9113 | 9085 | 0.63 | 12.81 | |
| 20210413GT3R | 7110 | 857 | 2.23 | 23.08 | |
| 20210417GT1R | 2784 | 1082 | 0.40 | 15.78 | |
| 20210417GT2R | 4825 | 3495 | 0.41 | 19.76 | |
| 20210417GT3R | 9305 | 5940 | 0.35 | 17.12 | |
The number of detected signal photons, minimum and maximum bathymetric results for 15 ground tracks used at Long Island and 12 ground tracks used at Qilianyu Islands.
*Represent the reference ATL03 ground tracks used in Long Island.
4.2 SDB results for single image
On Long Island, a total of 109028 bathymetric points were obtained from 13 ground tracks of the ICESat-2 ATL03 products to perform calibration on the SDB models. The reflectances corresponding to each bathymetric point in the Sentinel-2 images were extracted for the four bands, namely blue, green, red, and near-infrared. It is commonly advised to split the modeled data into two sets - training and testing datasets - to evaluate the machine learning models’ ability to generalize. Therefore, 70% of the ICESat-2 bathymetric points were randomly chosen for training purposes while the remaining points were used for testing. The training and testing points remained the same for the Sentinel-2 images of different dates. When multiple points corresponded to the same pixel, the mean water depth value was used for that pixel. The 41734 bathymetric points on the Qilianyu Islands were processed in the same way as those on Long Island.
Tables 4 , 5 list the detailed information on the slope, R², RMSE, and bias for each image at Long Island and Qilianyu Islands during the testing procedure, using ICESat-2 data and ALB data, respectively. The results showed that SVR and RF outperformed the two empirical models for most images. For example, for images acquired on October 11, 2021, at Long Island, the R2 and RMSEs were 0.87, 0.90, 0.97, and 0.99 while the RMSE were 1.37, 1.23, 0.63, and 0.25 m for BR, LB, SVR and RF models, respectively. For the SDB method, the bathymetric results were significantly influenced by the quality of the Sentinel-2 images, particularly for the BR and LB models. For instance, at Long Island, there was variation in R2 values ranging from 0.75 to 0.95 and RMSE values ranging from 0.87 m to 1.89 m for BR models.
Table 4
| Date/Methods | BR | LB | SVR | RF | ||||
|---|---|---|---|---|---|---|---|---|
| R2 | RMSE | R2 | RMSE | R2 | RMSE | R2 | RMSE | |
| 20160205 | 0.86 | 1.33 | 0.98 | 0.58 | 0.99 | 0.44 | 0.99 | 0.31 |
| 20170209 | 0.87 | 1.39 | 0.98 | 0.32 | 0.99 | 0.38 | 0.99 | 0.24 |
| 20171221 | 0.93 | 0.99 | 0.96 | 0.74 | 0.95 | 0.83 | 0.96 | 0.66 |
| 20180301 | 0.84 | 1.52 | 0.95 | 0.81 | 0.95 | 0.85 | 0.99 | 0.29 |
| 20181121 | 0.95 | 0.79 | 0.95 | 0.79 | 0.97 | 0.63 | 0.99 | 0.24 |
| 20190105 | 0.95 | 0.87 | 0.97 | 0.61 | 0.98 | 0.52 | 0.99 | 0.21 |
| 20190120 | 0.88 | 1.34 | 0.90 | 1.23 | 0.91 | 1.12 | 0.95 | 0.73 |
| 20201130 | 0.85 | 1.49 | 0.86 | 1.42 | 0.89 | 1.28 | 0.94 | 0.94 |
| 20210203 | 0.82 | 1.61 | 0.84 | 1.52 | 0.97 | 0.61 | 0.98 | 0.41 |
| 20210305 | 0.94 | 0.92 | 0.95 | 0.83 | 0.99 | 0.45 | 0.99 | 0.25 |
| 20210419 | 0.75 | 1.89 | 0.92 | 1.06 | 0.98 | 0.60 | 0.98 | 0.39 |
| 20210921 | 0.76 | 1.86 | 0.86 | 1.42 | 0.95 | 0.79 | 0.97 | 0.52 |
| 20211001 | 0.92 | 1.07 | 0.97 | 0.68 | 0.98 | 0.51 | 0.99 | 0.20 |
| 20211011 | 0.87 | 1.37 | 0.90 | 1.23 | 0.97 | 0.63 | 0.99 | 0.25 |
| 20211210 | 0.76 | 1.85 | 0.86 | 1.45 | 0.92 | 1.09 | 0.96 | 0.63 |
| 20220213 | 0.79 | 1.76 | 0.83 | 1.57 | 0.94 | 0.90 | 0.97 | 0.44 |
SDB models testing based on the 30% ICESat-2 bathymetric points at Long Island.
Table 5
| Date/Methods | BR | LB | SVR | RF | ||||
|---|---|---|---|---|---|---|---|---|
| R2 | RMSE | R2 | RMSE | R2 | RMSE | R2 | RMSE | |
| 20190326 | 0.88 | 1.51 | 0.88 | 1.48 | 0.92 | 1.23 | 0.96 | 0.84 |
| 20190515 | 0.81 | 1.88 | 0.84 | 1.72 | 0.90 | 1.59 | 0.95 | 0.95 |
| 20191027 | 0.92 | 1.22 | 0.92 | 1.25 | 0.94 | 1.12 | 0.95 | 0.98 |
| 20210228 | 0.93 | 1.18 | 0.90 | 1.35 | 0.90 | 1.32 | 0.97 | 0.79 |
| 20210315 | 0.76 | 2.13 | 0.76 | 2.14 | 0.83 | 1.88 | 0.85 | 1.72 |
| 20210330 | 0.88 | 1.48 | 0.87 | 1.55 | 0.92 | 1.32 | 0.95 | 1.02 |
| 20210404 | 0.88 | 1.51 | 0.88 | 1.48 | 0.90 | 0.89 | 0.92 | 0.40 |
| 20210703 | 0.83 | 1.78 | 0.88 | 1.50 | 0.92 | 1.34 | 0.96 | 0.85 |
| 20210708 | 0.76 | 2.12 | 0.81 | 1.90 | 0.83 | 1.85 | 0.89 | 1.42 |
| 20210713 | 0.85 | 1.68 | 0.89 | 1.44 | 0.89 | 1.42 | 0.94 | 1.06 |
| 20210802 | 0.85 | 1.65 | 0.89 | 1.40 | 0.92 | 1.17 | 0.96 | 0.86 |
| 20210817 | 0.85 | 1.71 | 0.90 | 1.41 | 0.91 | 1.23 | 0.95 | 0.96 |
| 20210926 | 0.77 | 2.08 | 0.84 | 1.73 | 0.86 | 1.60 | 0.90 | 1.36 |
| 20211001 | 0.79 | 1.99 | 0.81 | 1.91 | 0.83 | 1.76 | 0.90 | 1.41 |
| 20211021 | 0.91 | 1.31 | 0.94 | 1.03 | 0.95 | 0.91 | 0.98 | 0.69 |
| 20211031 | 0.88 | 1.53 | 0.90 | 1.35 | 0.89 | 1.46 | 0.96 | 0.87 |
SDB models testing based on the 30% ICESat-2 bathymetric points at Qilianyu Islands.
4.3 SDB results from the fusion of time-series images
A bathymetric map of Long Island was produced from the fusion of multi-method and time-series Sentinel-2 images, as shown in Figure 5A The underwater topography reflected by the bathymetric map was highly consistent with the Sentinel-2 images, showing steep characteristics in the north and gentle characteristics in the south of Long Island. The scatter diagrams are shown in Figures 5B, C, as well as the profiles of the SDB results and the reference ICESat-2 depths are shown in Figures 5D, E. The water depths extracted from the bathymetric map were significantly correlated with the reference depths of the ICESat-2 ground tracks, with R2 0.99 and RMSE< 0.68 m. On the Qilianyu Islands, a large area of shallow reefs and a small lagoon can be observed in the bathymetric map (Figure 6A). The underwater topography reflected by the bathymetric map is similar to that of Long Island (steep in the north and gentle in the south). As shown in Figure 6B, despite using the ALB data as a reference at the Qilianyu Islands, there was a strong correlation observed between the SDB results and the depths obtained from ALB measurements, with an R2 value of 0.96 and RMSE value of 1.18 m.The validation results, grounded in reference data from the two study areas, confirmed that the proposed method could produce high-accuracy shallow-water bathymetric maps.
Figure 5
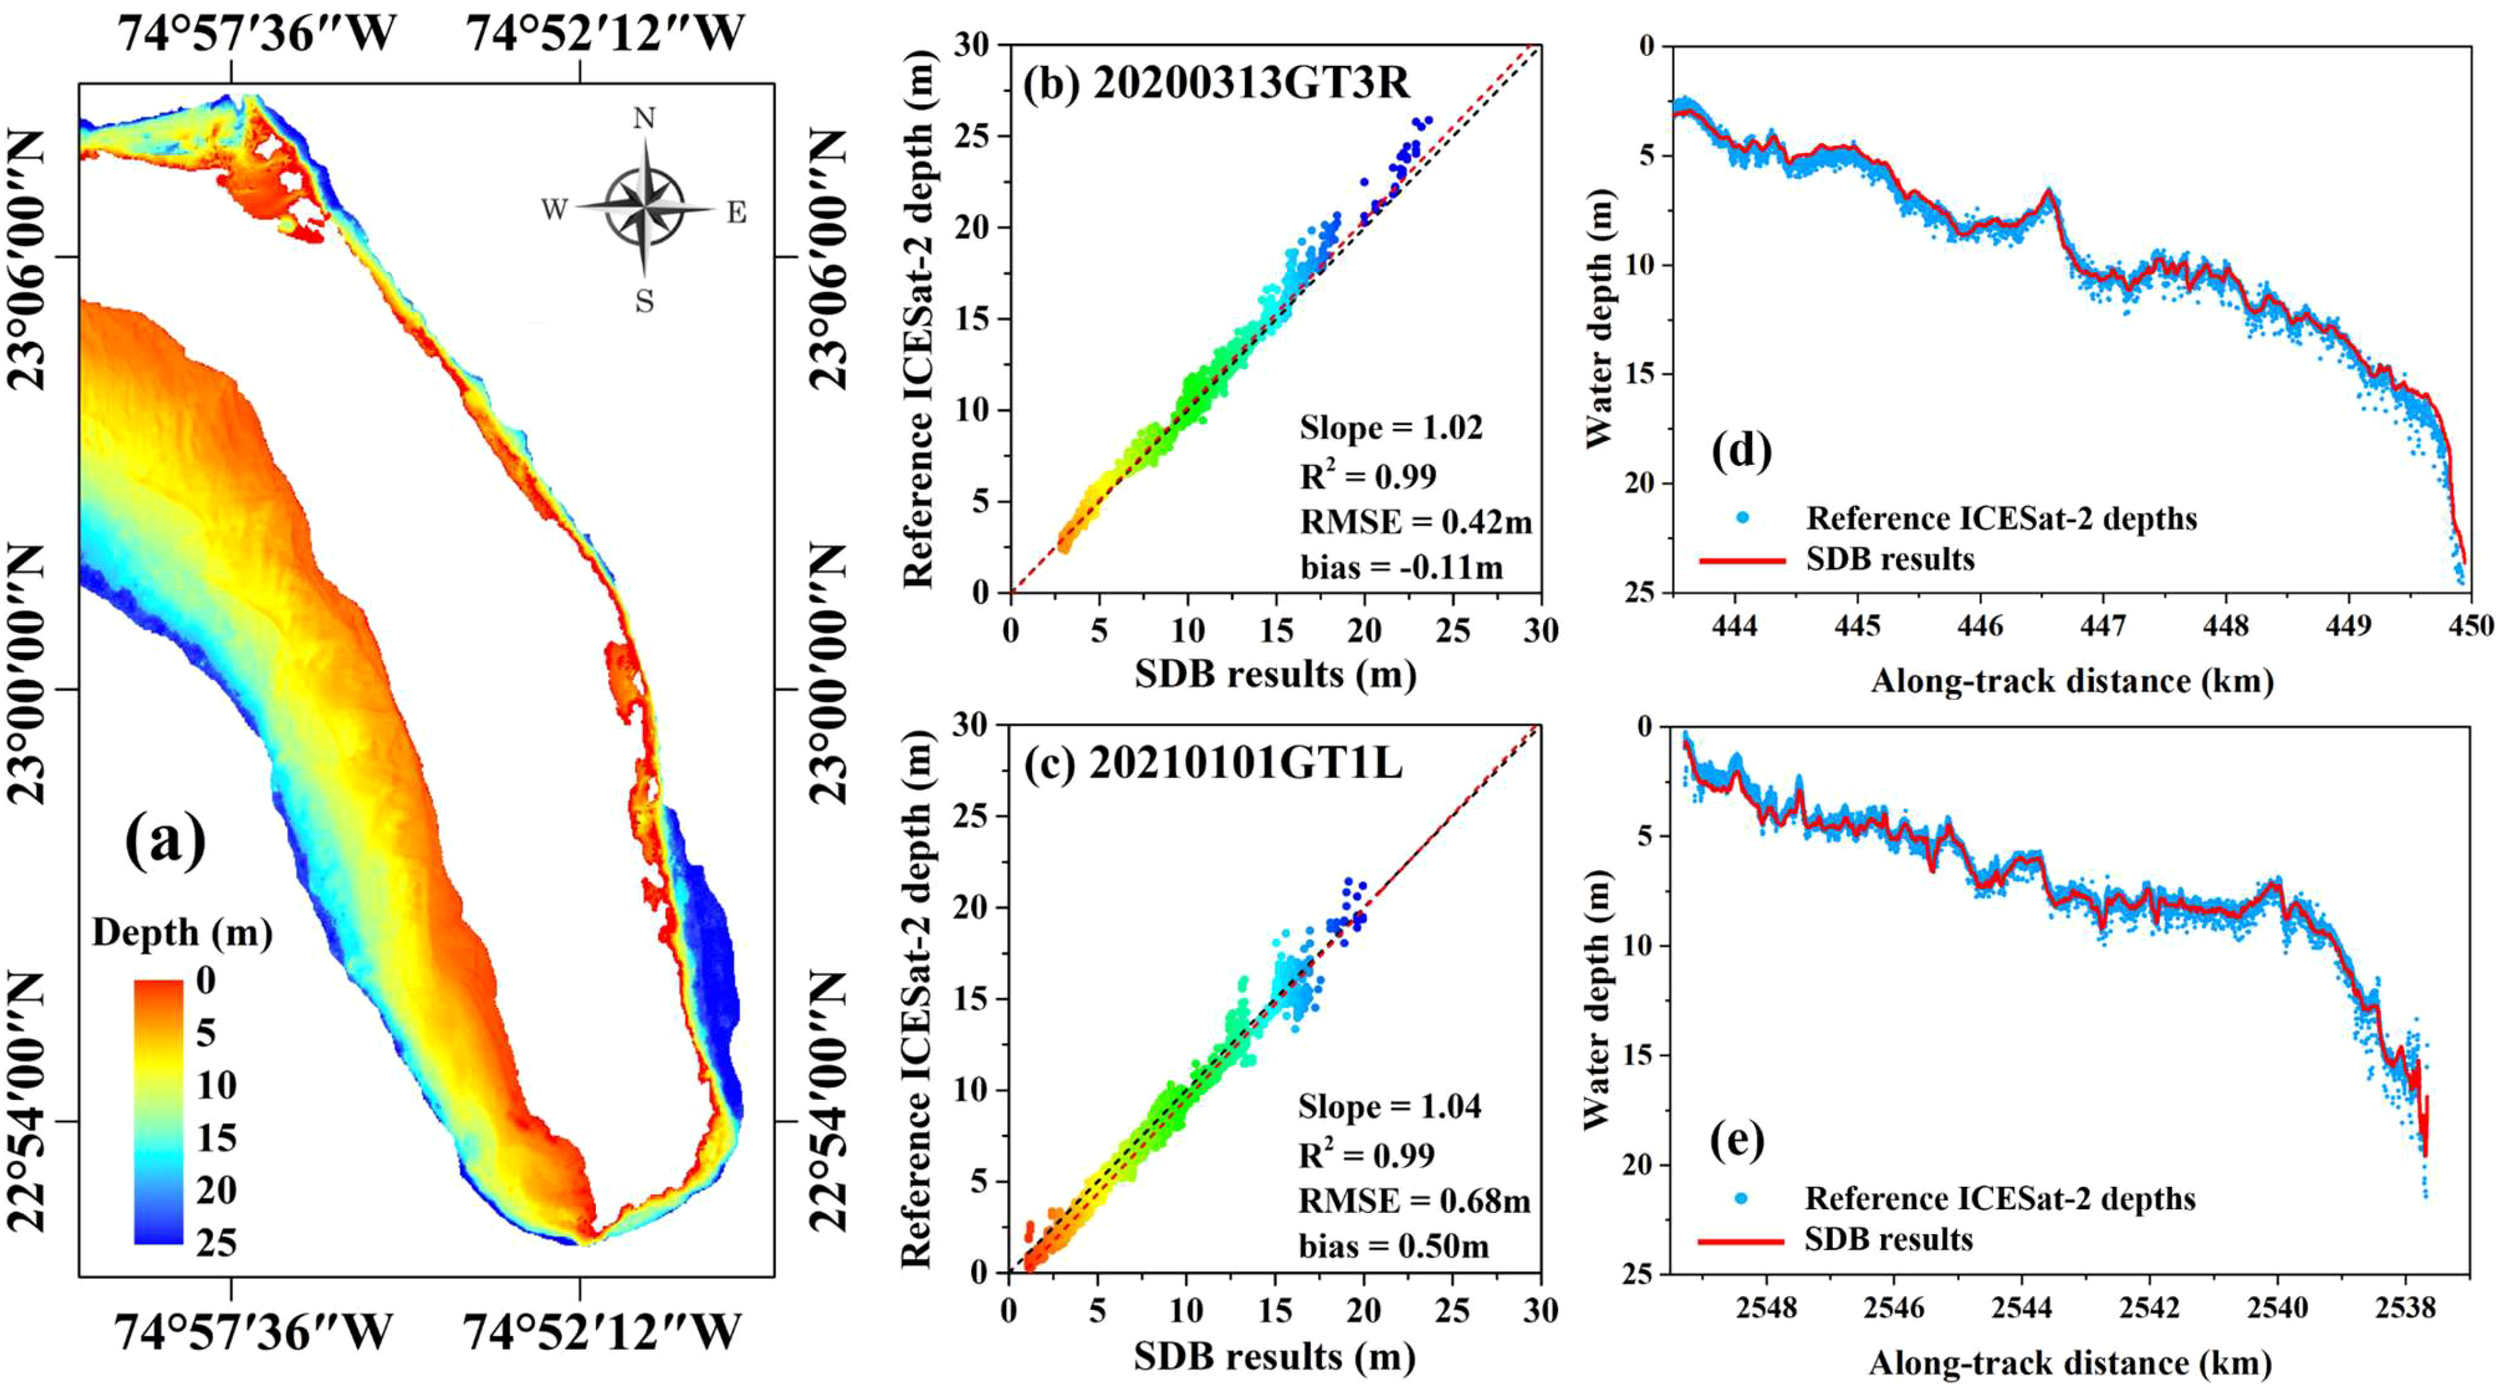
(A) Shallow-water bathymetric map derived from the fusion of the SDB results at Long Island. Relationship between the SDB results and the reference depths of ICESat-2 ground tracks (B) 20200313GT3R and (C) 20210101GT1L, respectively. The red dashed line is the regression line and the black dashed line corresponds to the regression line. Profiles of the ICESat-2 depths and SDB results of ICESat-2 ground tracks (D) 20200313GT3R and (F) 20210101GT1L, respectively.
Figure 6
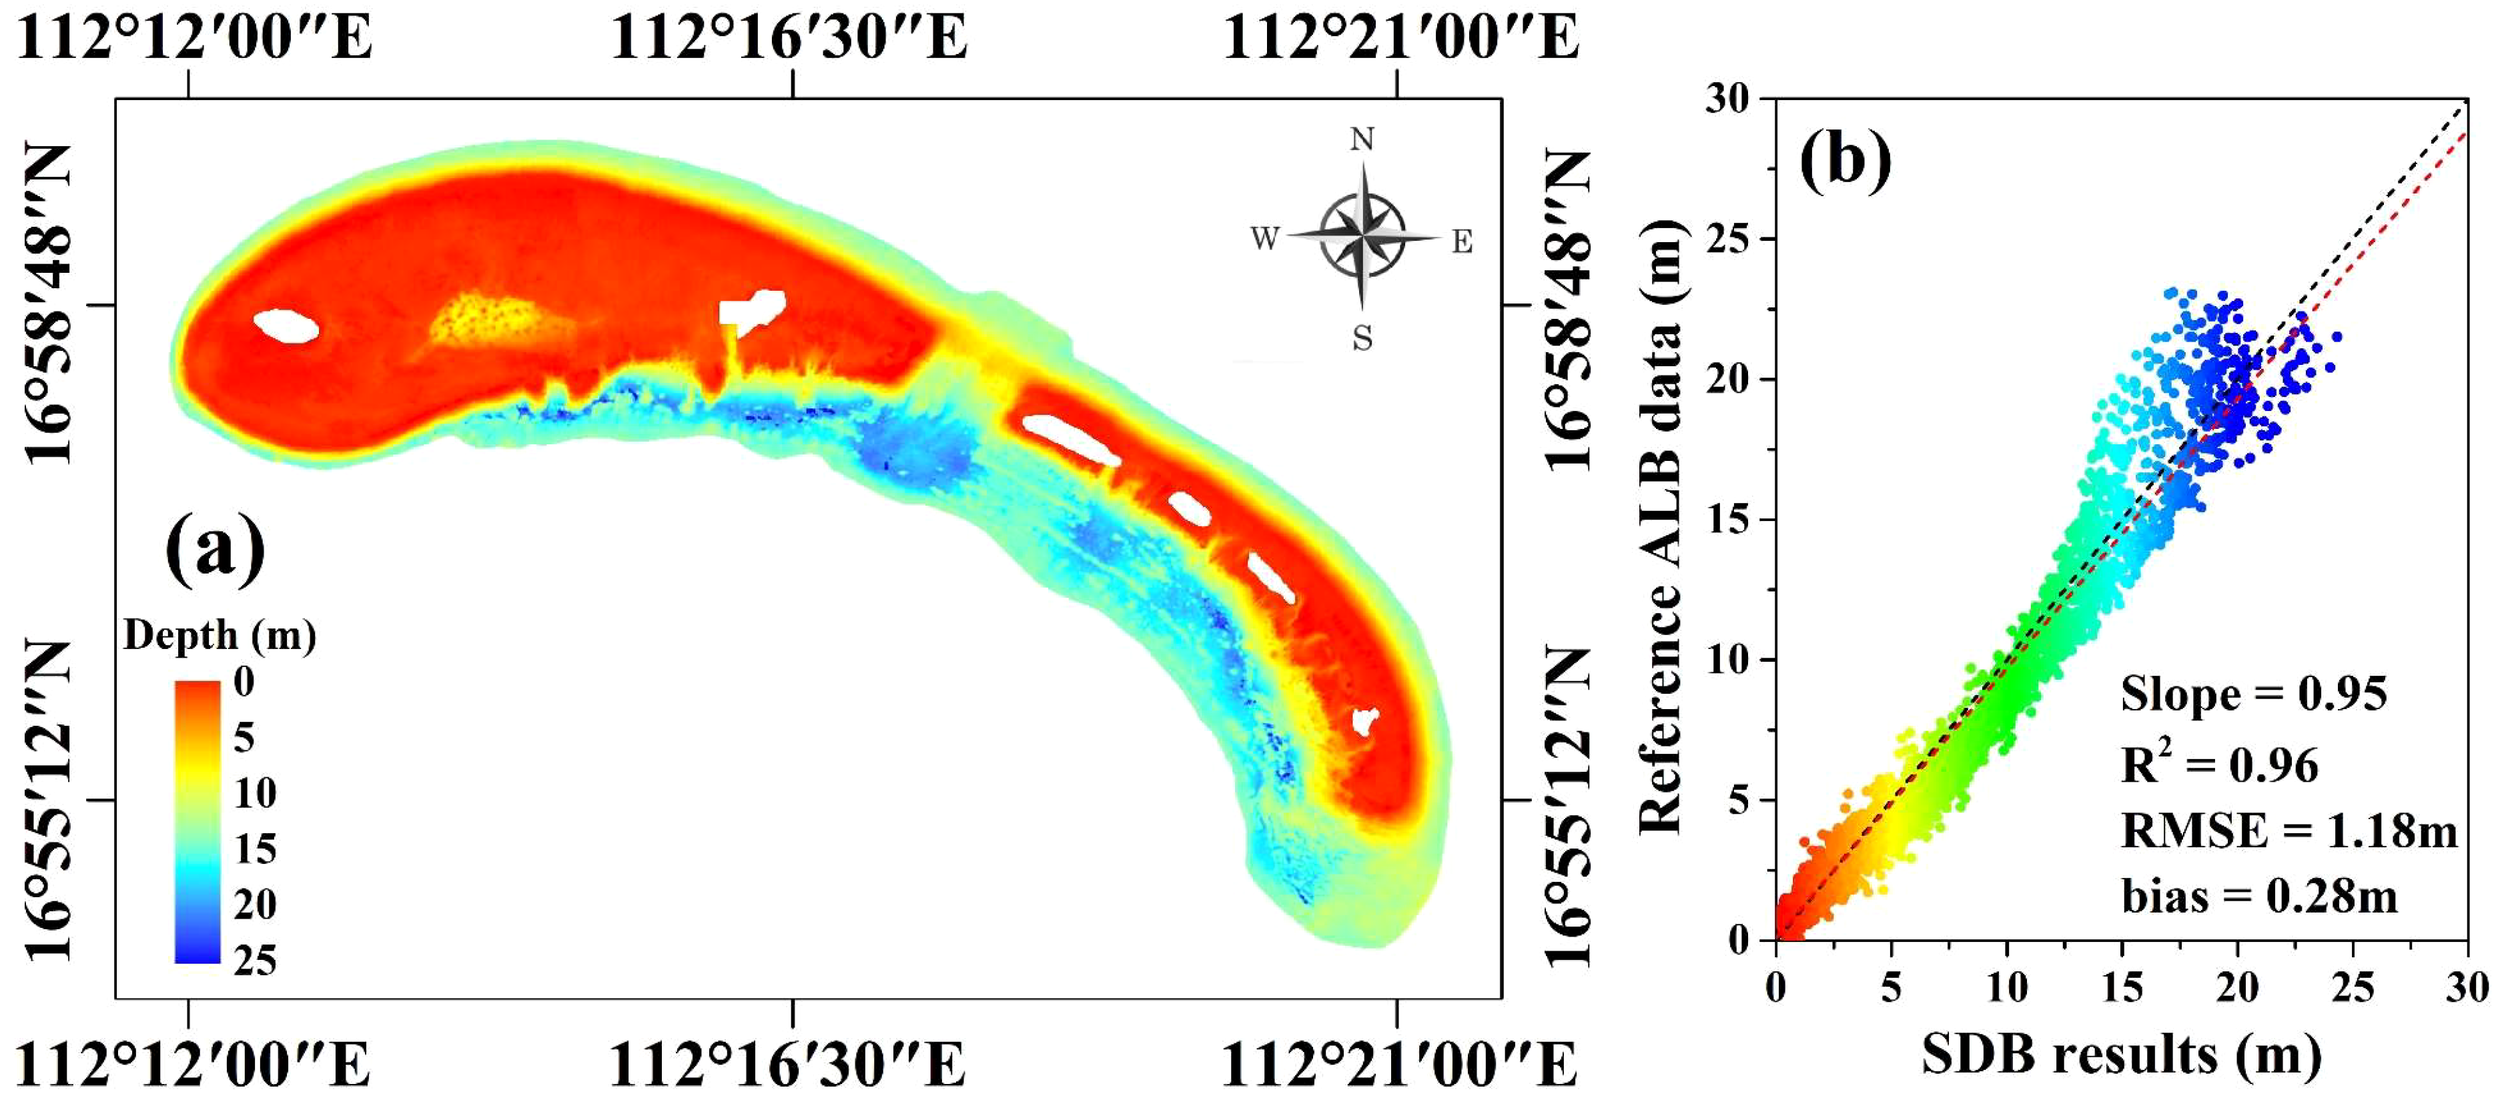
(A) Shallow-water bathymetric map derived from the fusion of the SDB results at Qilianyu Island and (B) the relationship between the SDB depths and the reference ALB data. The red dashed line is the regression line and the black dashed line corresponds to the regression line.
5 Discussion
5.1 Accuracy and reliability of ICESat-2 bathymetric points
On the Qilianyu Islands, two ATL03 ground tracks, 20190117GT1L and 20180819GT1L (Figure 7A) overlap with the point cloud of ALB data. Thus, the corrected bottom photons of the two ATL03 ground tracks were evaluated by the ALB data. The bathymetric profiles of ALB are shown in Figures 7B, C are acquired by sampling the raw point cloud based on the coordinates of the bottom photons. Results reveal that the underwater topography reflected by the corrected bottom photons is highly consistent with the ALB bathymetric profiles. As shown in Figures 8A, B, after correcting the refraction effect, the RMSE between the bottom photons and the ALB data were 0.65 and 0.39 m, as well as the bias, reduced significantly to 0.20 and 0.01 m for 20190117GT1L and 20180819GT1L, which were consistent with previous research. the bathymetric precision of the ICESat-2 data exhibited a slight deviation compared to conventional methods, it is justifiable to utilize it as an on-site measurement for the purpose of calibrating or validating the effectiveness of SDB models (Song et al., 2024; Liu et al., 2024). Additionally, the precision of ICESat-2’s bathymetry relies on various factors such as filtering techniques, fraction correction methods, and tidal correction algorithms. As a result, through the optimization of the algorithms mentioned above, additional improvements can be achieved to boost the precision of bathymetric data from ICESat-2.
Figure 7
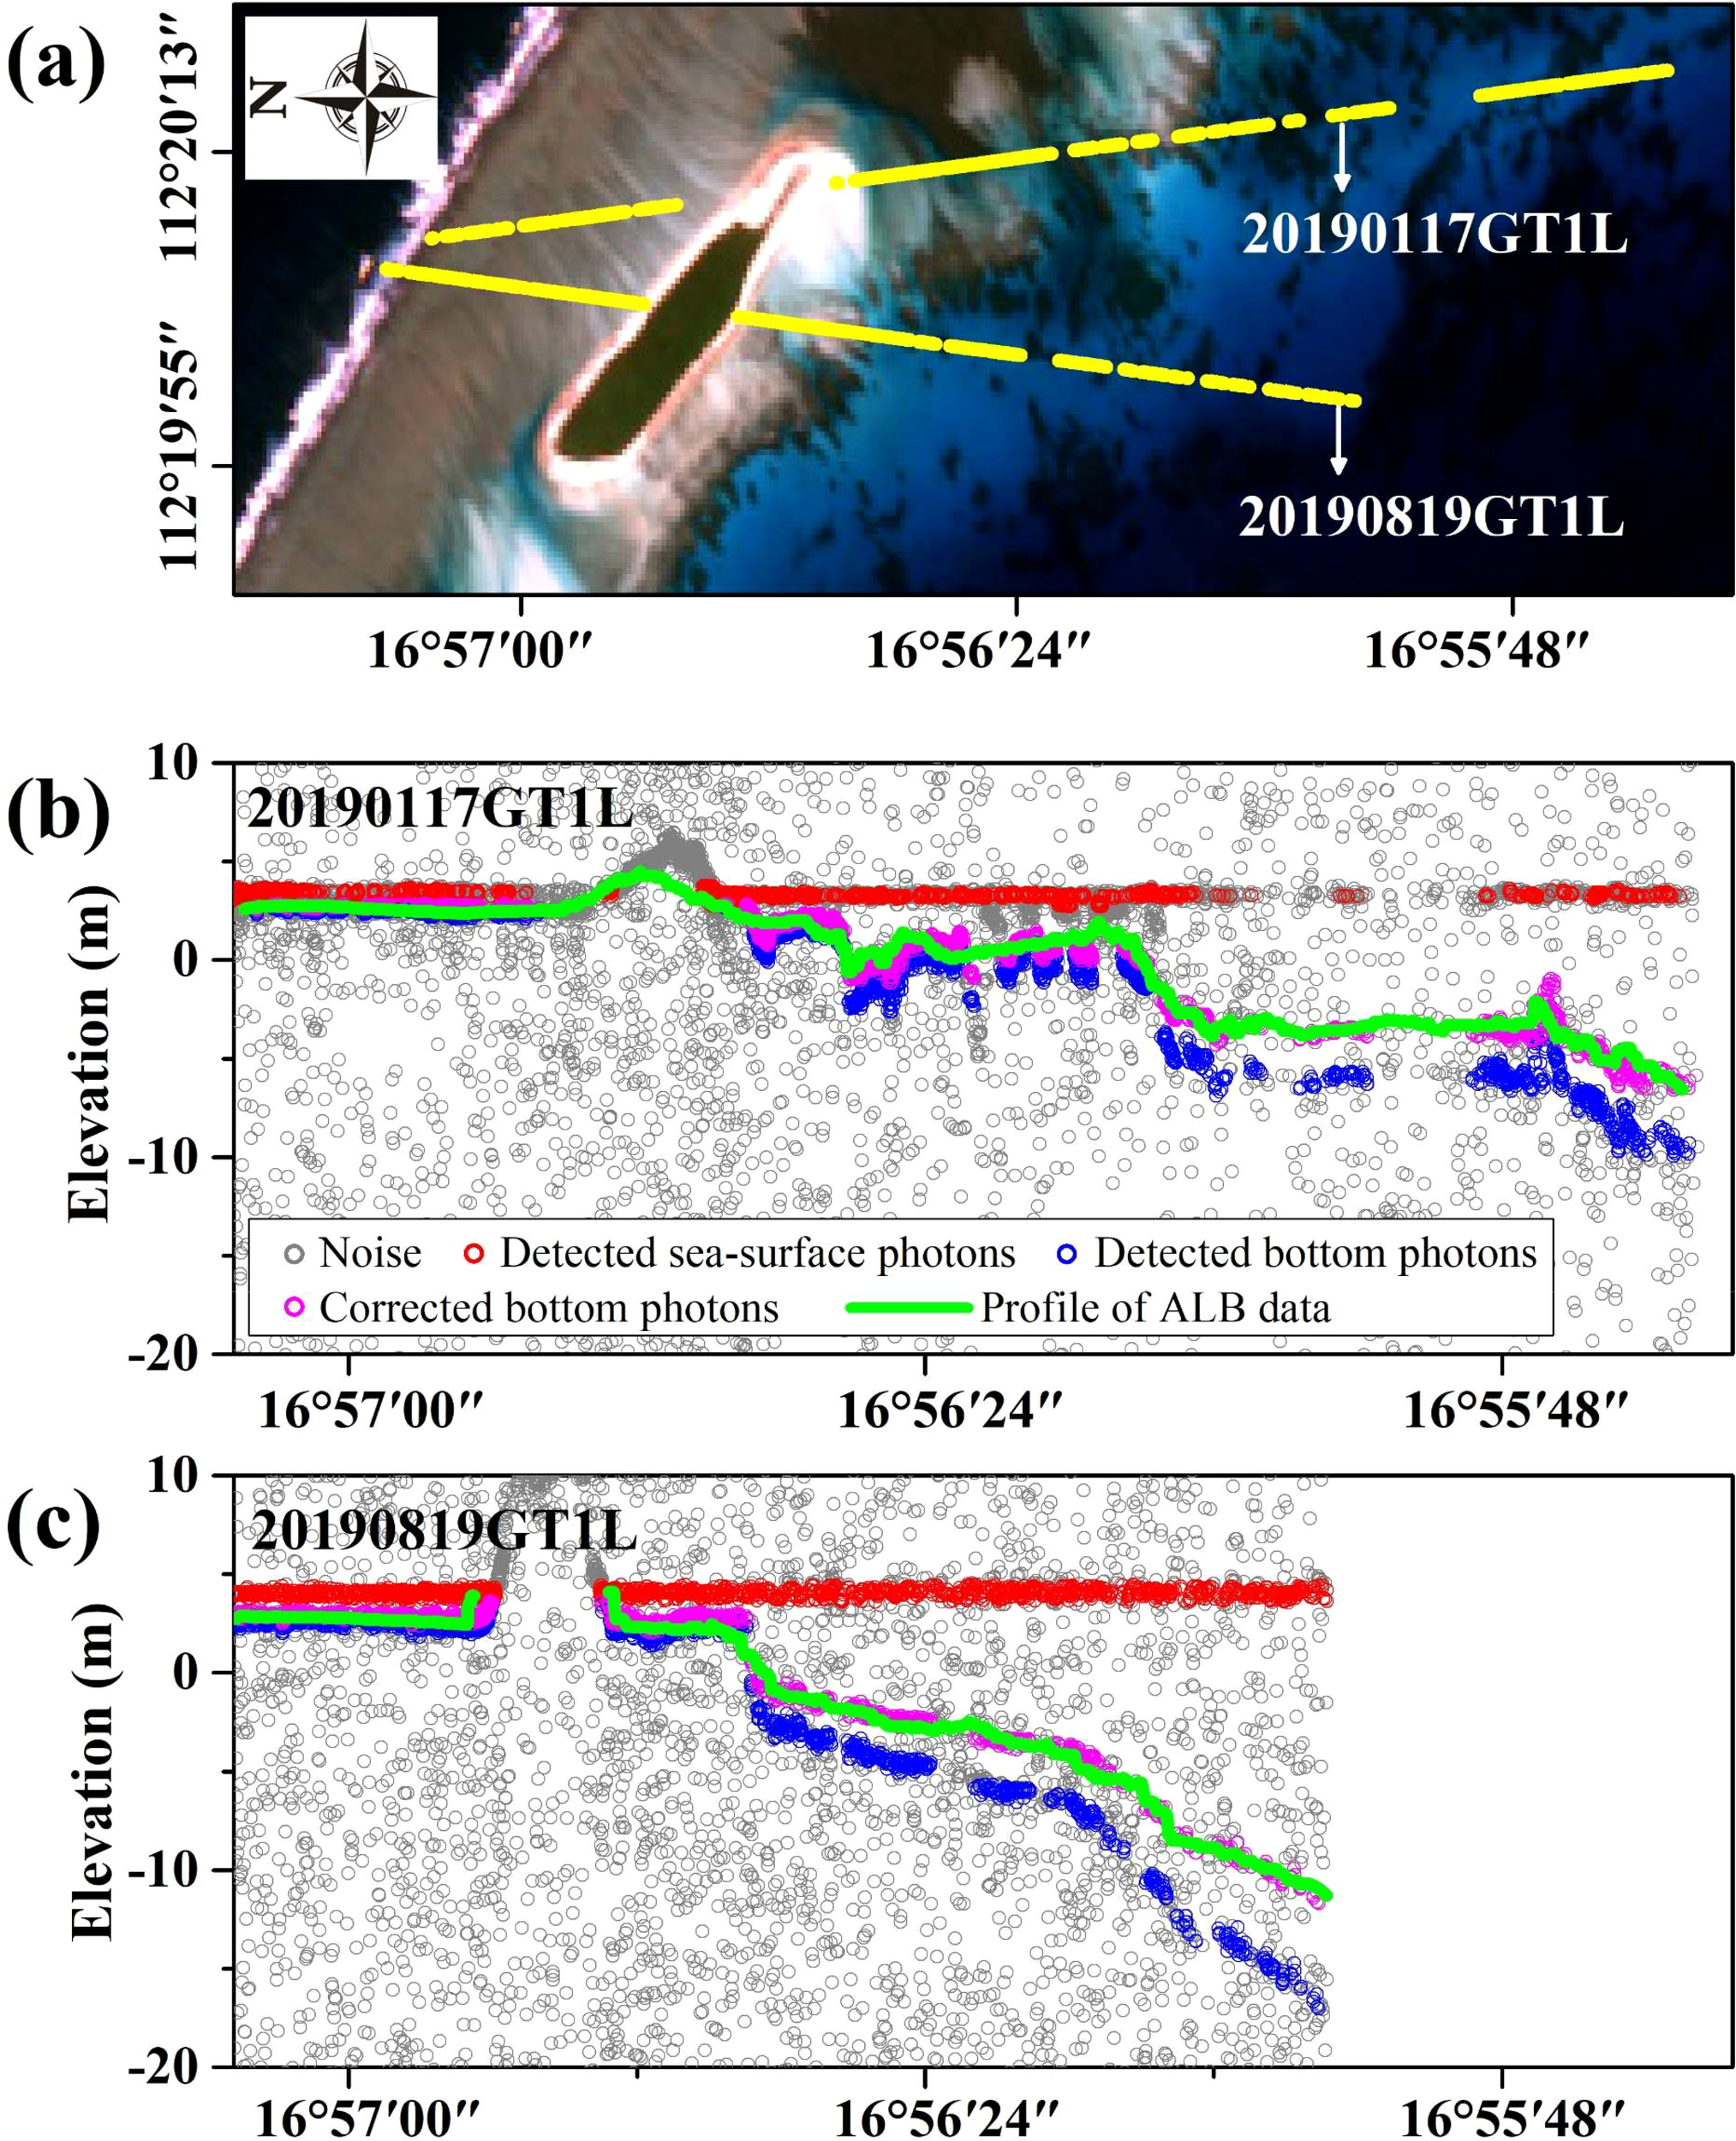
Comparison between the ICESat-2 ground tracks and the ALB data in Qilianyu Islands. The enlarged Sentinel-2 image and two ATL03 ground tracks (20190117GT1L and 20190819GT1L) were illustrated in sub-figure (A). Sub-figures (B, C) illustrated the raw photons, detected sea-surface photons, detected bottom photons, and corrected bottom photons of the ATL03 ground tracks, respectively. The green lines represent the bathymetric profiles resampled from the ALB points cloud.
Figure 8
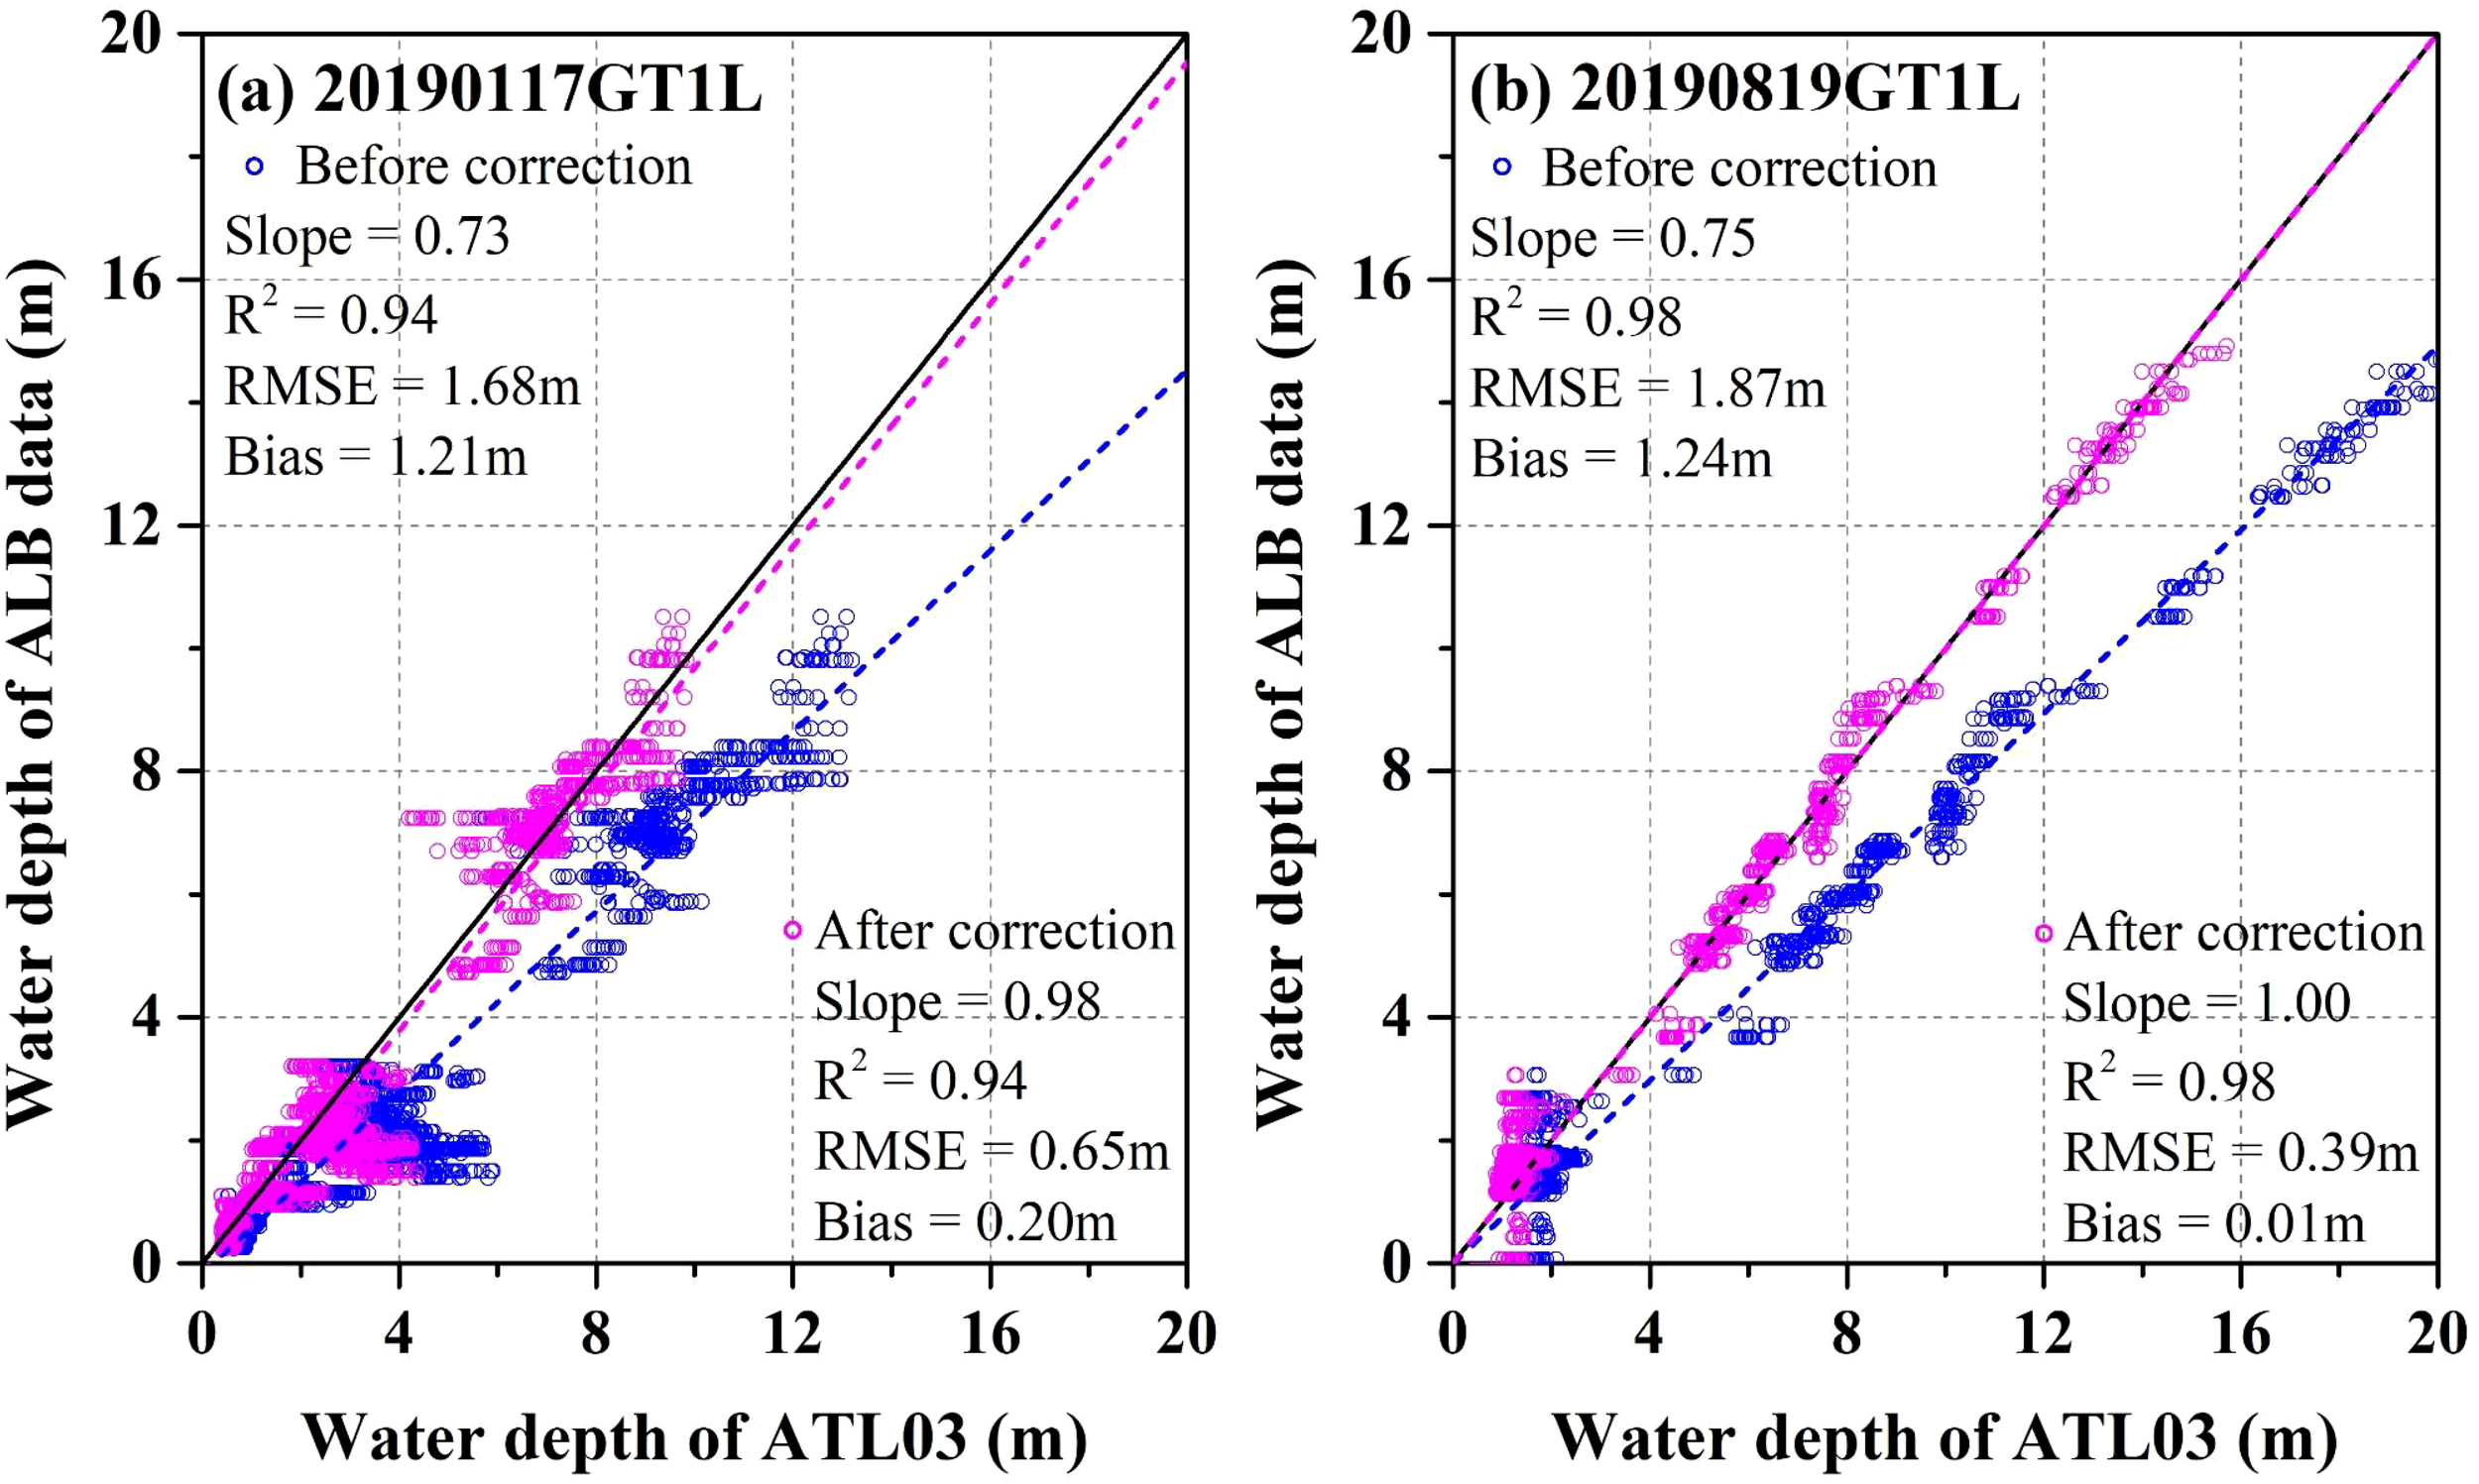
Comparison of the water depth between the ICESat-2 ground tracks and the ALB data in the Qilianyu Islands. Relationships of Water depth between the bottom photons before and after refraction correction and the ALB data was illustrated in sub-figures (A, B).
The reliability of ICESat-2 bathymetric data is considered as a fundamental prerequisite for incorporating it into SDB models. The bathymetric accuracy of traditional approaches, such as single/multibeam sounding systems and ALB systems, is usually better than 0.3m of RMSE (Cao et al., 2023). Multiple studies have assessed the accuracy of ICESat-2 data and found that the bathymetric precision exceeds an RMSE of 0.6 m (Parrish et al., 2019; Ma et al., 2020). However, related studies need to be conducted more widely, such as in areas of variable lighting environments, optically complex water, and precipitous underwater topography.
5.2 Consistency analysis of the SDB methods and the time-series images
In the two study areas, the images with the highest and lowest average bathymetric accuracies (from the R2 and RMSE of the calibration models) of the four SDB methods were selected to investigate the spatial consistency of the SDB methods (Figures 9, 10). For instance, images acquired on 05/01/2019 (highest average accuracy) and 10/12/2021 (lowest average accuracy) on Long Island were selected, and the bathymetric outcomes obtained from a particular technique were contrasted with the average values derived from all four SDB techniques. Figure 9A illustrates the disparity between the bathymetric findings of the BR model and the collective mean of all four models. Moreover, the R2, RMSE, and Bias in Figure 9A represent the correlation between the bathymetric results of the BR model and the means of all four models. High correlations were observed between the single SDB method and the mean of the four SDB methods. For the image acquired on 05/01/2019 (Figures 9A–D) and 10/12/2021 (Figures 9E–H), the R2 of the four-method spatial difference distributions were ranging from 0.96 to 0.99 and 0.91 to 0.95, as well as the RMSE were ranging from 0.68 to 1.17m and 1.06 to 1.52 m, respectively. The bathymetric differences are primarily distributed in three areas: (1) deep-water areas east and west of Long Island (red rectangles in Figure 9), (2) an extremely shallow area north of Long Island (green rectangles in Figure 9), and (3) an area covered by thick clouds (violet rectangles in Figure 9). Moreover, the bathymetric differences for the specific SDB method seem stable; for example, a similar distribution of differences for the BR model in images acquired on 05/01/2019 and 10/12/2021.
Figure 9
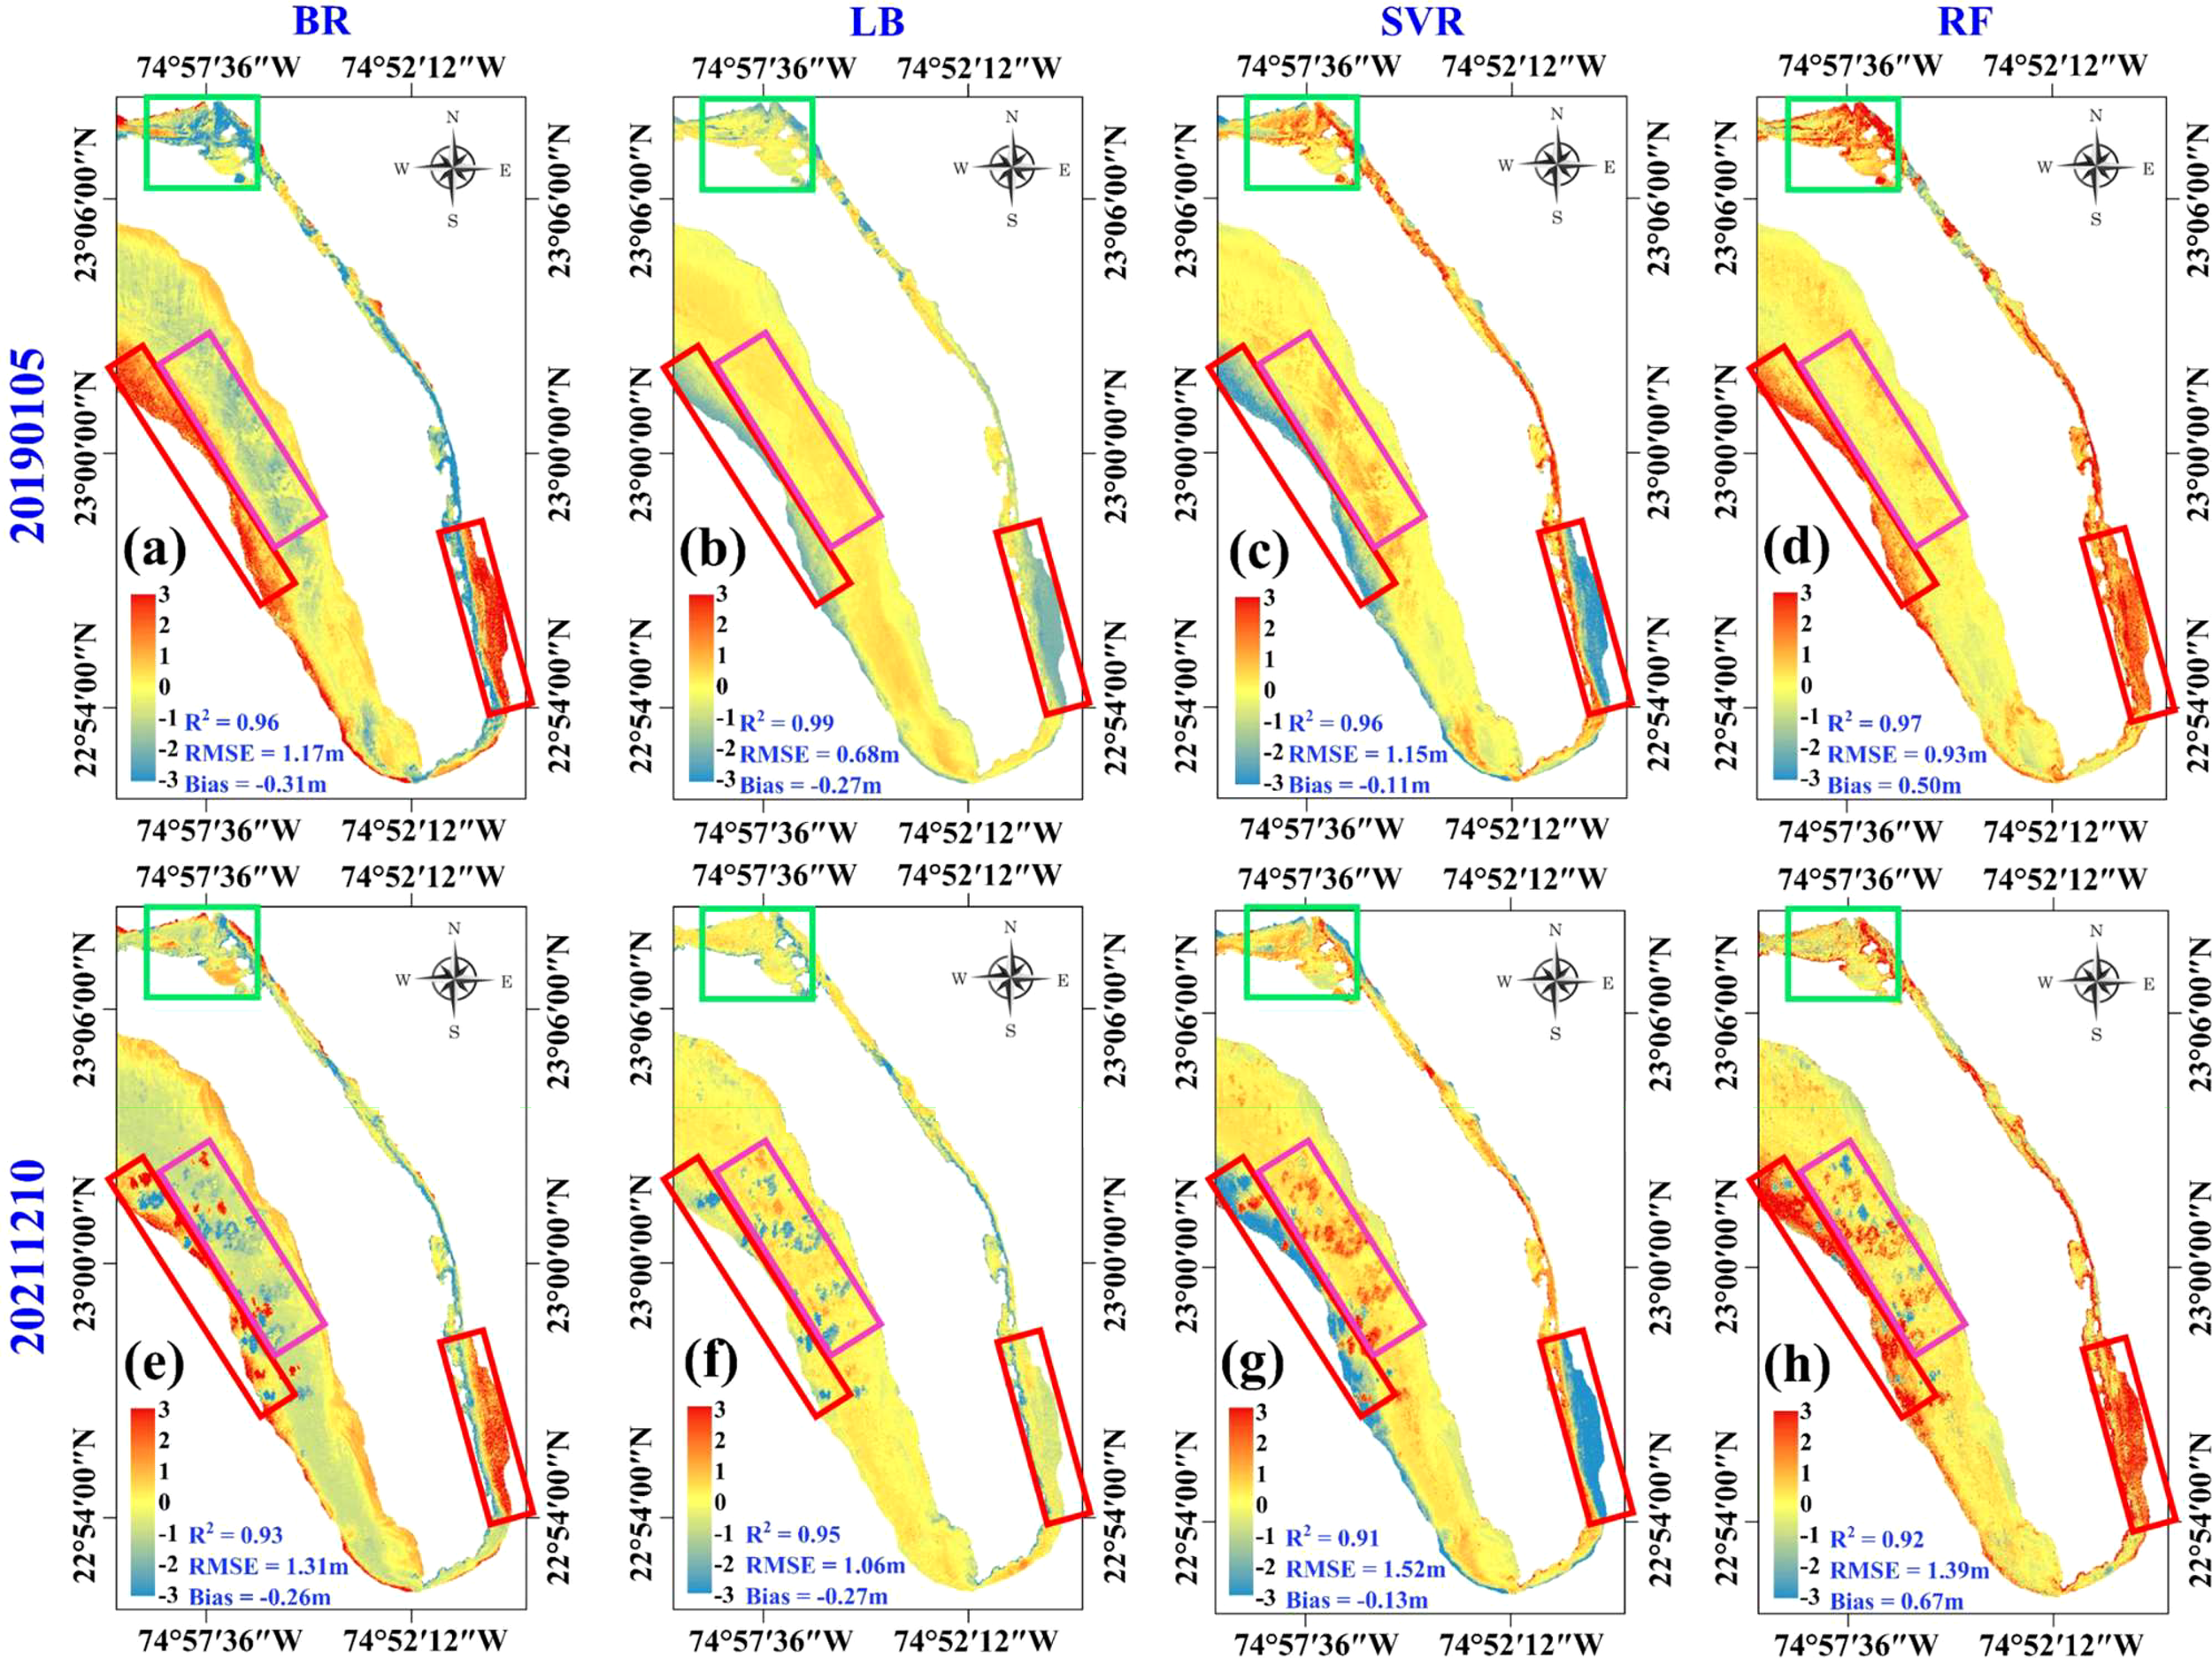
Difference of spatial distribution between the bathymetric map of single SDB method and mean of the four SDB methods at Long Island. (A) BR model, (B) LB model, (C) SVR model, and (D) RF model for Sentinel-2 image acquired on January 5, 2019, and (E) BR model, (F) LB model, (G) SVR model and (H) RF model for Sentinel-2 image acquired on December 1, 2021. The red, green and violet rectangles illustrated the area with significant differences in bathymetric results.
Figure 10
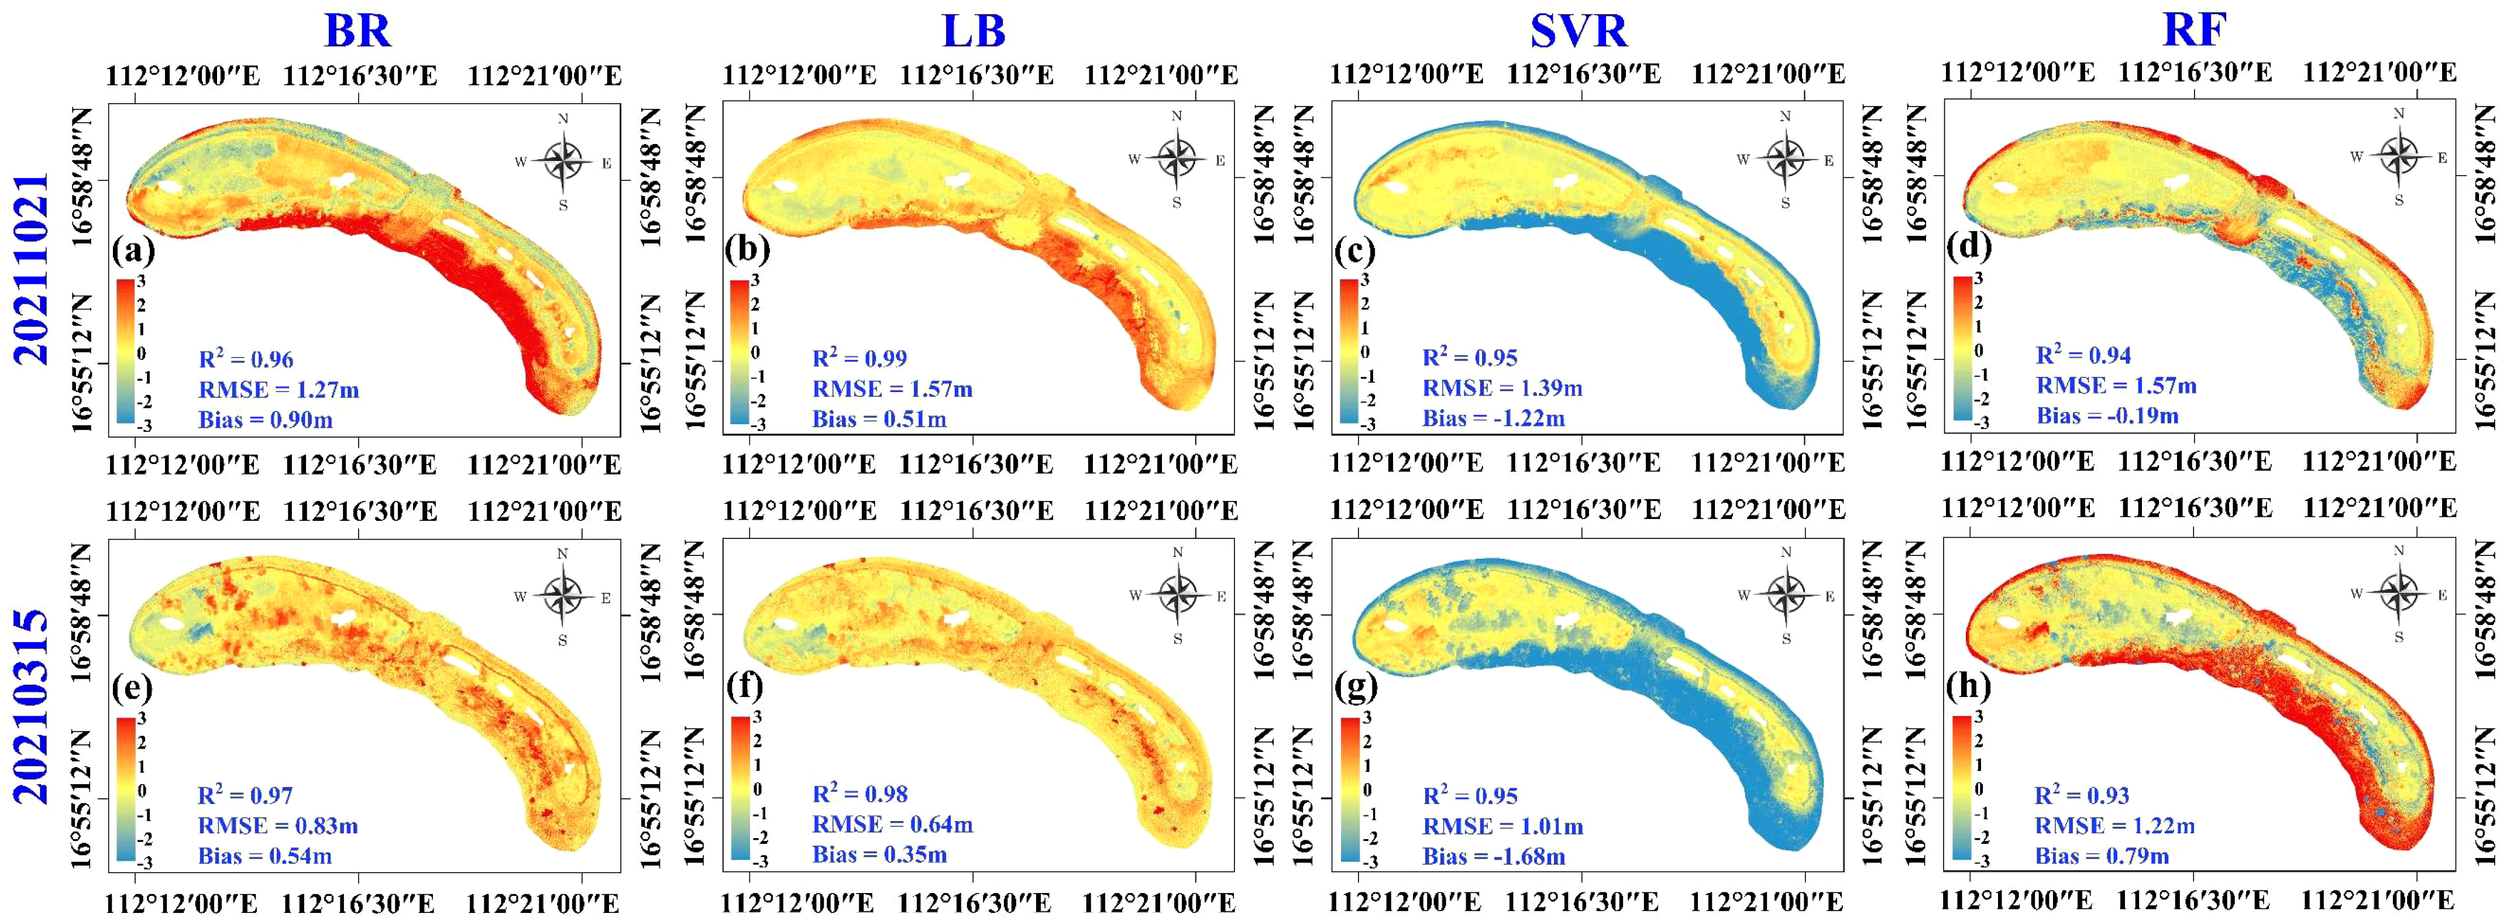
Difference of spatial distribution between the bathymetric map of a single SDB method and the mean of the four SDB methods at Qilianyu Island. (A) BR model, (B) LB model, (C) SVR model and (D) RF model for Sentinel-2 image acquired on October 21, 2021, and (E) BR model, (F) LB model, (G) SVR model and (H) RF model for Sentinel-2 image acquired on March 15, 2021.
Similar patterns were observed on Qilianyu Island. For the image acquired on 21/10/2021 (Figures 10A–D) and 15/03/2021 (Figures 10E–H), The R2 values for the spatial difference distributions using four different methods ranged from 0.94 to 0.99 and 0.93 to 0.98, while the RMSE values varied between 1.27 and 1.57 m and between 0.64 and 1.22 m, respectively. The bathymetric differences on Qilianyu Island were mainly distributed in the deep-water areas around the reef flat. However, the bathymetric differences for the SDB method were less stable than those that appeared on Long Island, for example, the significant differences south of Qilianyu Island for the BR and RF models.
Previous studies have demonstrated that the uncertainty in bathymetric results generated by different SDB methods is mainly distributed in extremely shallow (depth< 2 m) and deep areas (depth>10 m) (Caballero and Stumpf, 2020; Hsu et al., 2021; Zhang X. et al., 2022). This uncertainty was also observed in Figures 9, 10 in this study, with the maximum bias reaching 0.50 m and 0.67 m at Long Island and Qilianyu Island when using RF models. It is impractical and infeasible for a single method to produce optimal bathymetric results in all situations (Dekker et al., 2011). One method to reduce bathymetric uncertainty is to fuse the results of different SDB methods to produce optimized bathymetric results, similar to the method proposed in this study (Daly et al., 2022).
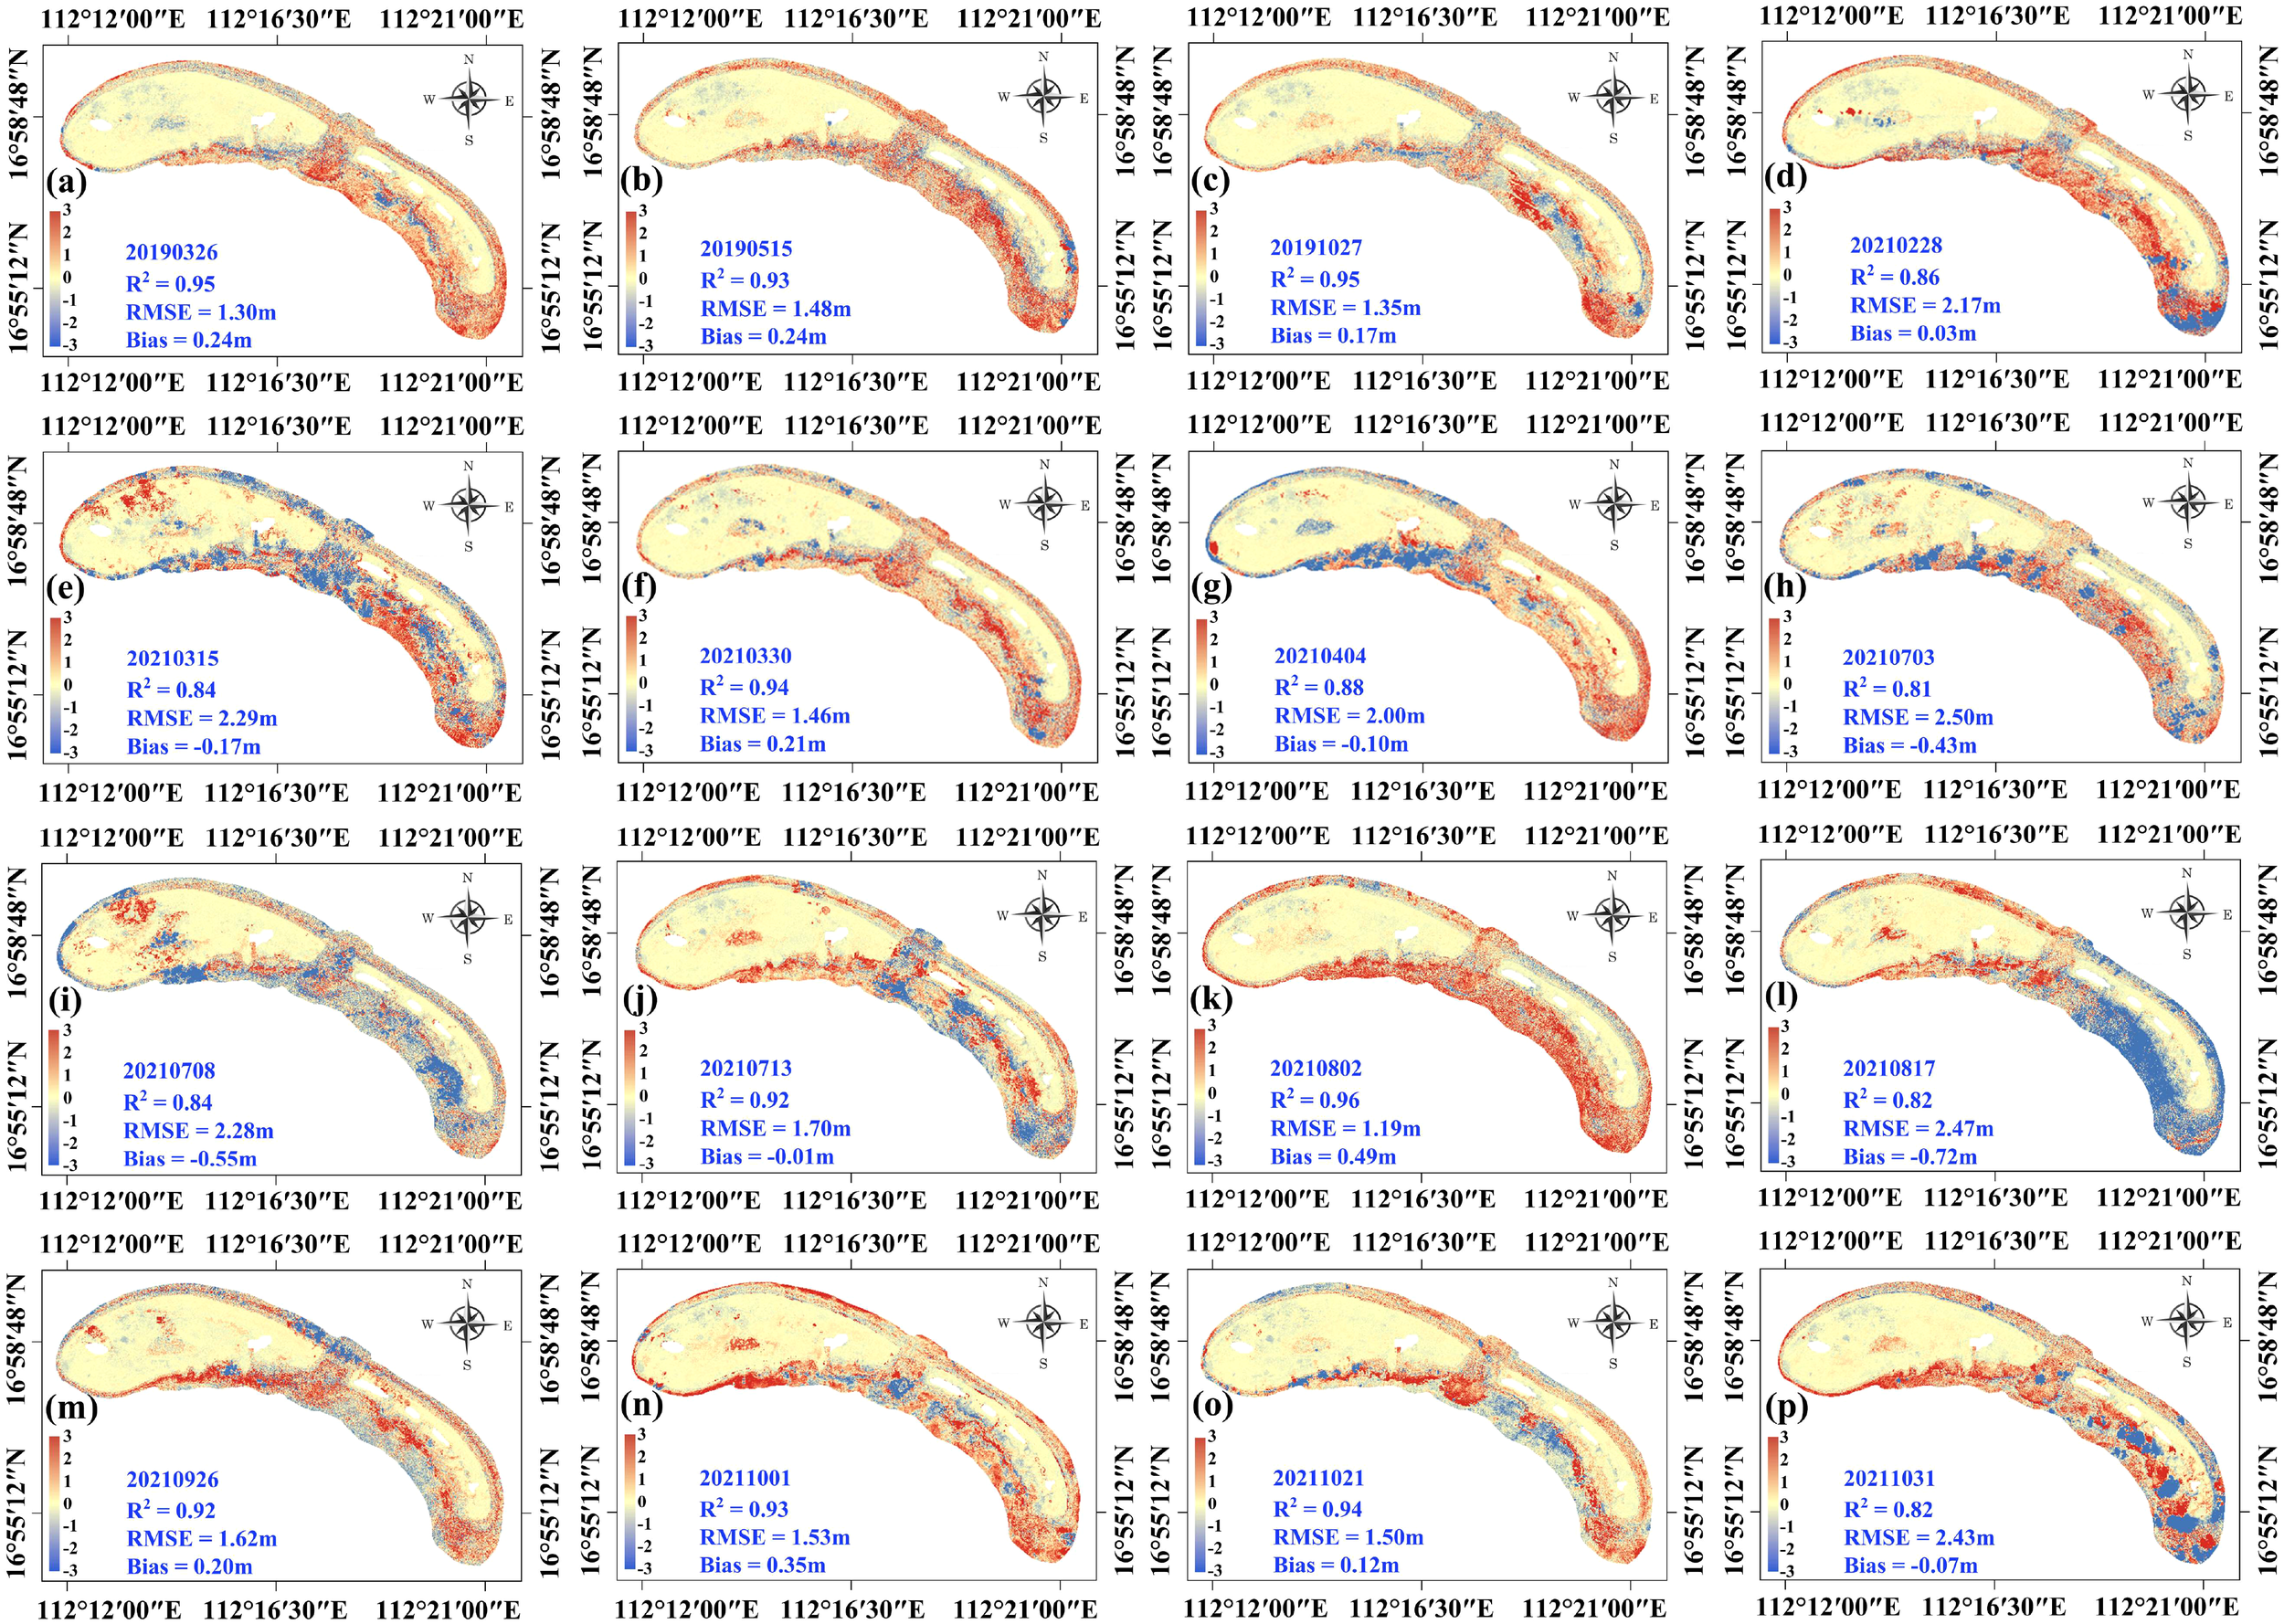
The spatial consistency of the time-series images was also investigated by comparing the single-date bathymetric results (RF model) with the mean results. Specifically, Figures 11A–P represent the spatial difference between the bathymetric result of the image acquired from 05/02/2016 to 13/02/2022 and the mean of all the dates on Long Island. The R2 of the multi-date spatial difference distributions ranged from 0.74 to 0.96, as well as the RMSE ranged from 1.12 to 2.86 m, respectively. Similarly, for the Qilianyu Islands, the R2 values of the multi-date spatial difference distributions ranged from 0.81 to 0.96, as well as the RMSE ranged from 1.19 to 2.50 m (Figure 12).
Figure 11
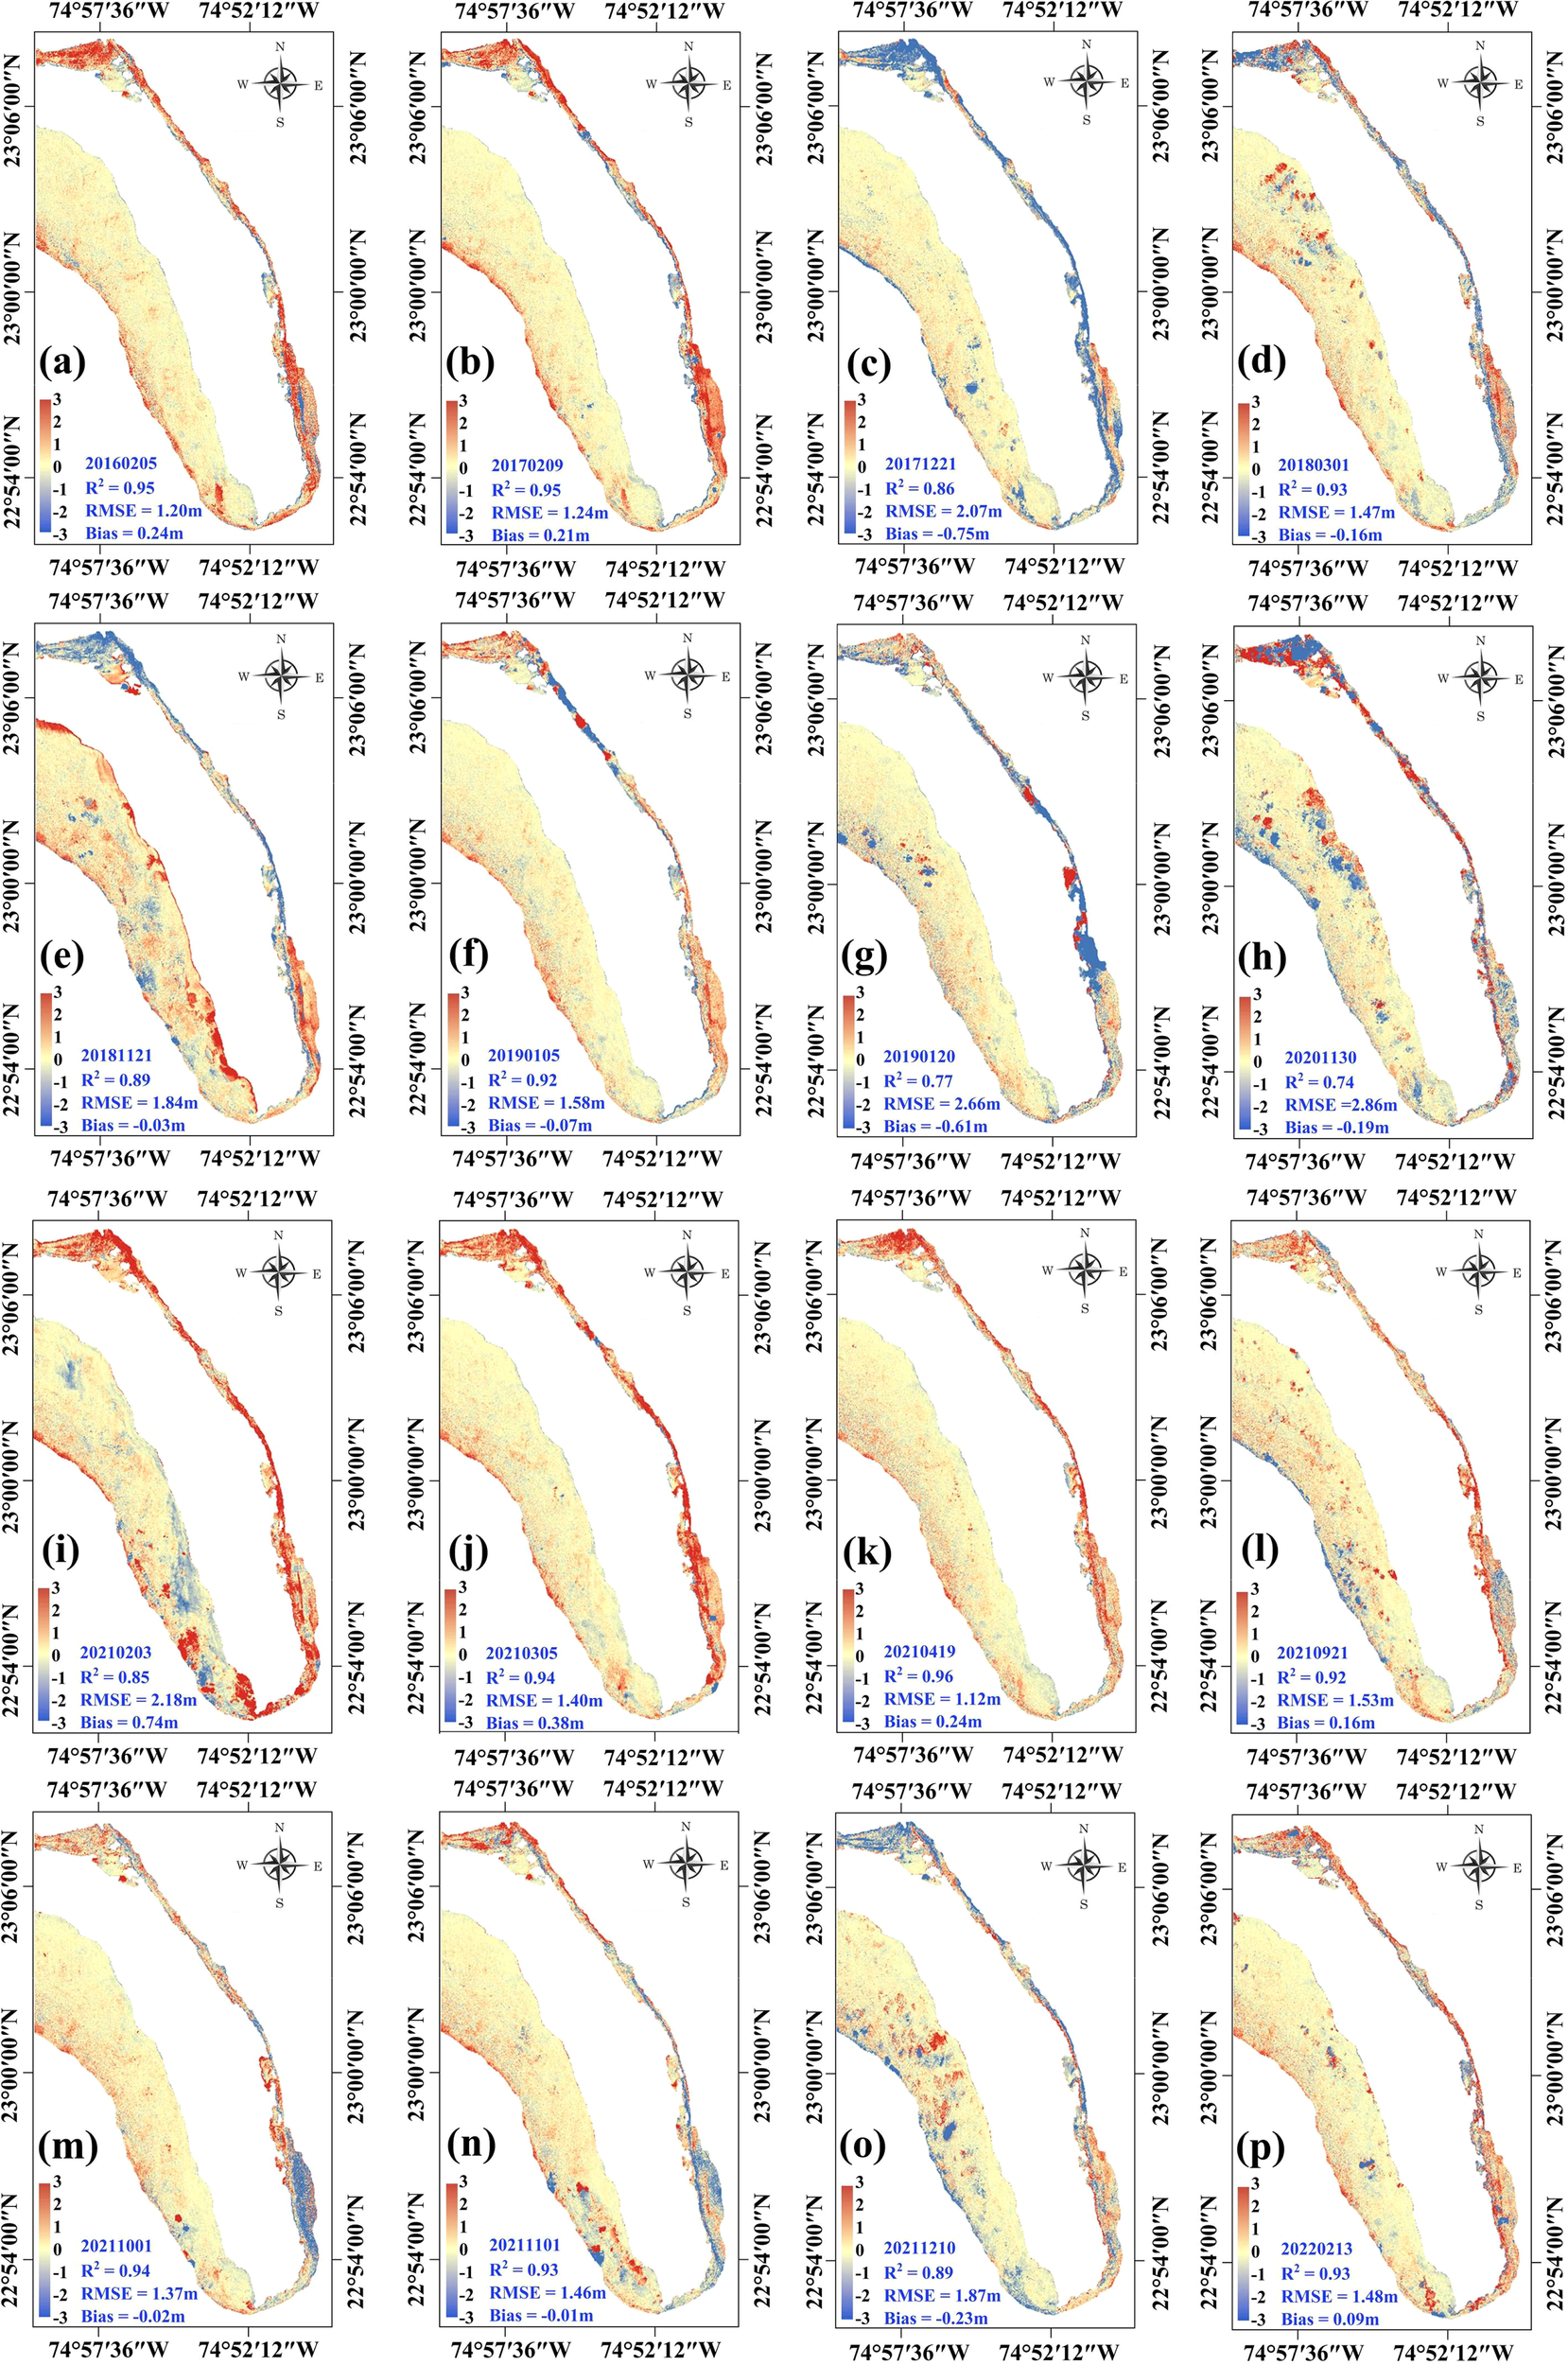
Difference of spatial distribution between the bathymetric map (RF) of a single date and the mean of all the dates at Long Island. Sub-figures (A–P) represent the difference between the bathymetric map (RF) acquired on 20160205 to 20220213 and the mean of all the dates at Long Island.
Figure 12
Difference of spatial distribution between the bathymetric map (RF) of a single date and the mean of all the dates at Qilianyu Island. Sub-figures (A–P) represent the difference between the bathymetric map (RF) acquired on 20190326 to 20211031 and the mean of all the dates at Long Island.
While it was expected that there would be temporal variations in the underwater topography due to gaps in the data, significant correlations were found between the bathymetric findings from images captured on different dates in both study regions. However, this consistency seems to be slightly lower than that between different SDB methods. Therefore, the main factor influencing bathymetric accuracy is the quality of the selected image, which is related to the radiation performance of the sensors, atmospheric conditions during image acquisition, inherent optical properties of the water column, and sediment type of the seafloor (Hedley et al., 2018; Caballero and Stumpf, 2019; Lumban-Gaol et al., 2022).
5.3 Reliability evaluation of the fusion bathymetric results
One additional benefit of the suggested approach is its capability to assess the precision of SDB accuracy for individual pixels using a series of images over time. The fusion result for bathymetry was illustrated in Figure 13A. Figure 13B represents the standard deviation σ of the processed bathymetric sequence DP’j for each pixel at Long Island, and Figure 13C represents the confidence level produced by the fusion depth μ and the standard deviation σ. Although the number of remaining values in the processed bathymetric sequence DP’j was different for the pixels, the standard deviation gradually increased with increasing water depth, which was consistent with our previous analysis. As shown in Figure 13C, the confidence levels of the fusion bathymetric results were almost “low” in the extremely shallow area on the north of Long Island. However, the confidence levels were “medium” to “superior” at the gentle slope area on the south of Long Island, and large areas with the confidence level of “superior” were observed when the water depth varied between around 8 and 12 meters. To illustrate the details of the confidence evaluation results for individual pixels, a straight line from east to west was selected, and the distribution of the processed bathymetric sequence DP’j for the five pixels on the line is illustrated in Figures 13D–H. As the water depth increased, the light reflected by the seafloor was weakened by the water column, leading to increased absolute error in the SDB results for different images and models. Therefore, significant outliers must be removed when fusing the SDB results of time-series images (Ma et al., 2020; Zhang X. et al., 2022).
Figure 13
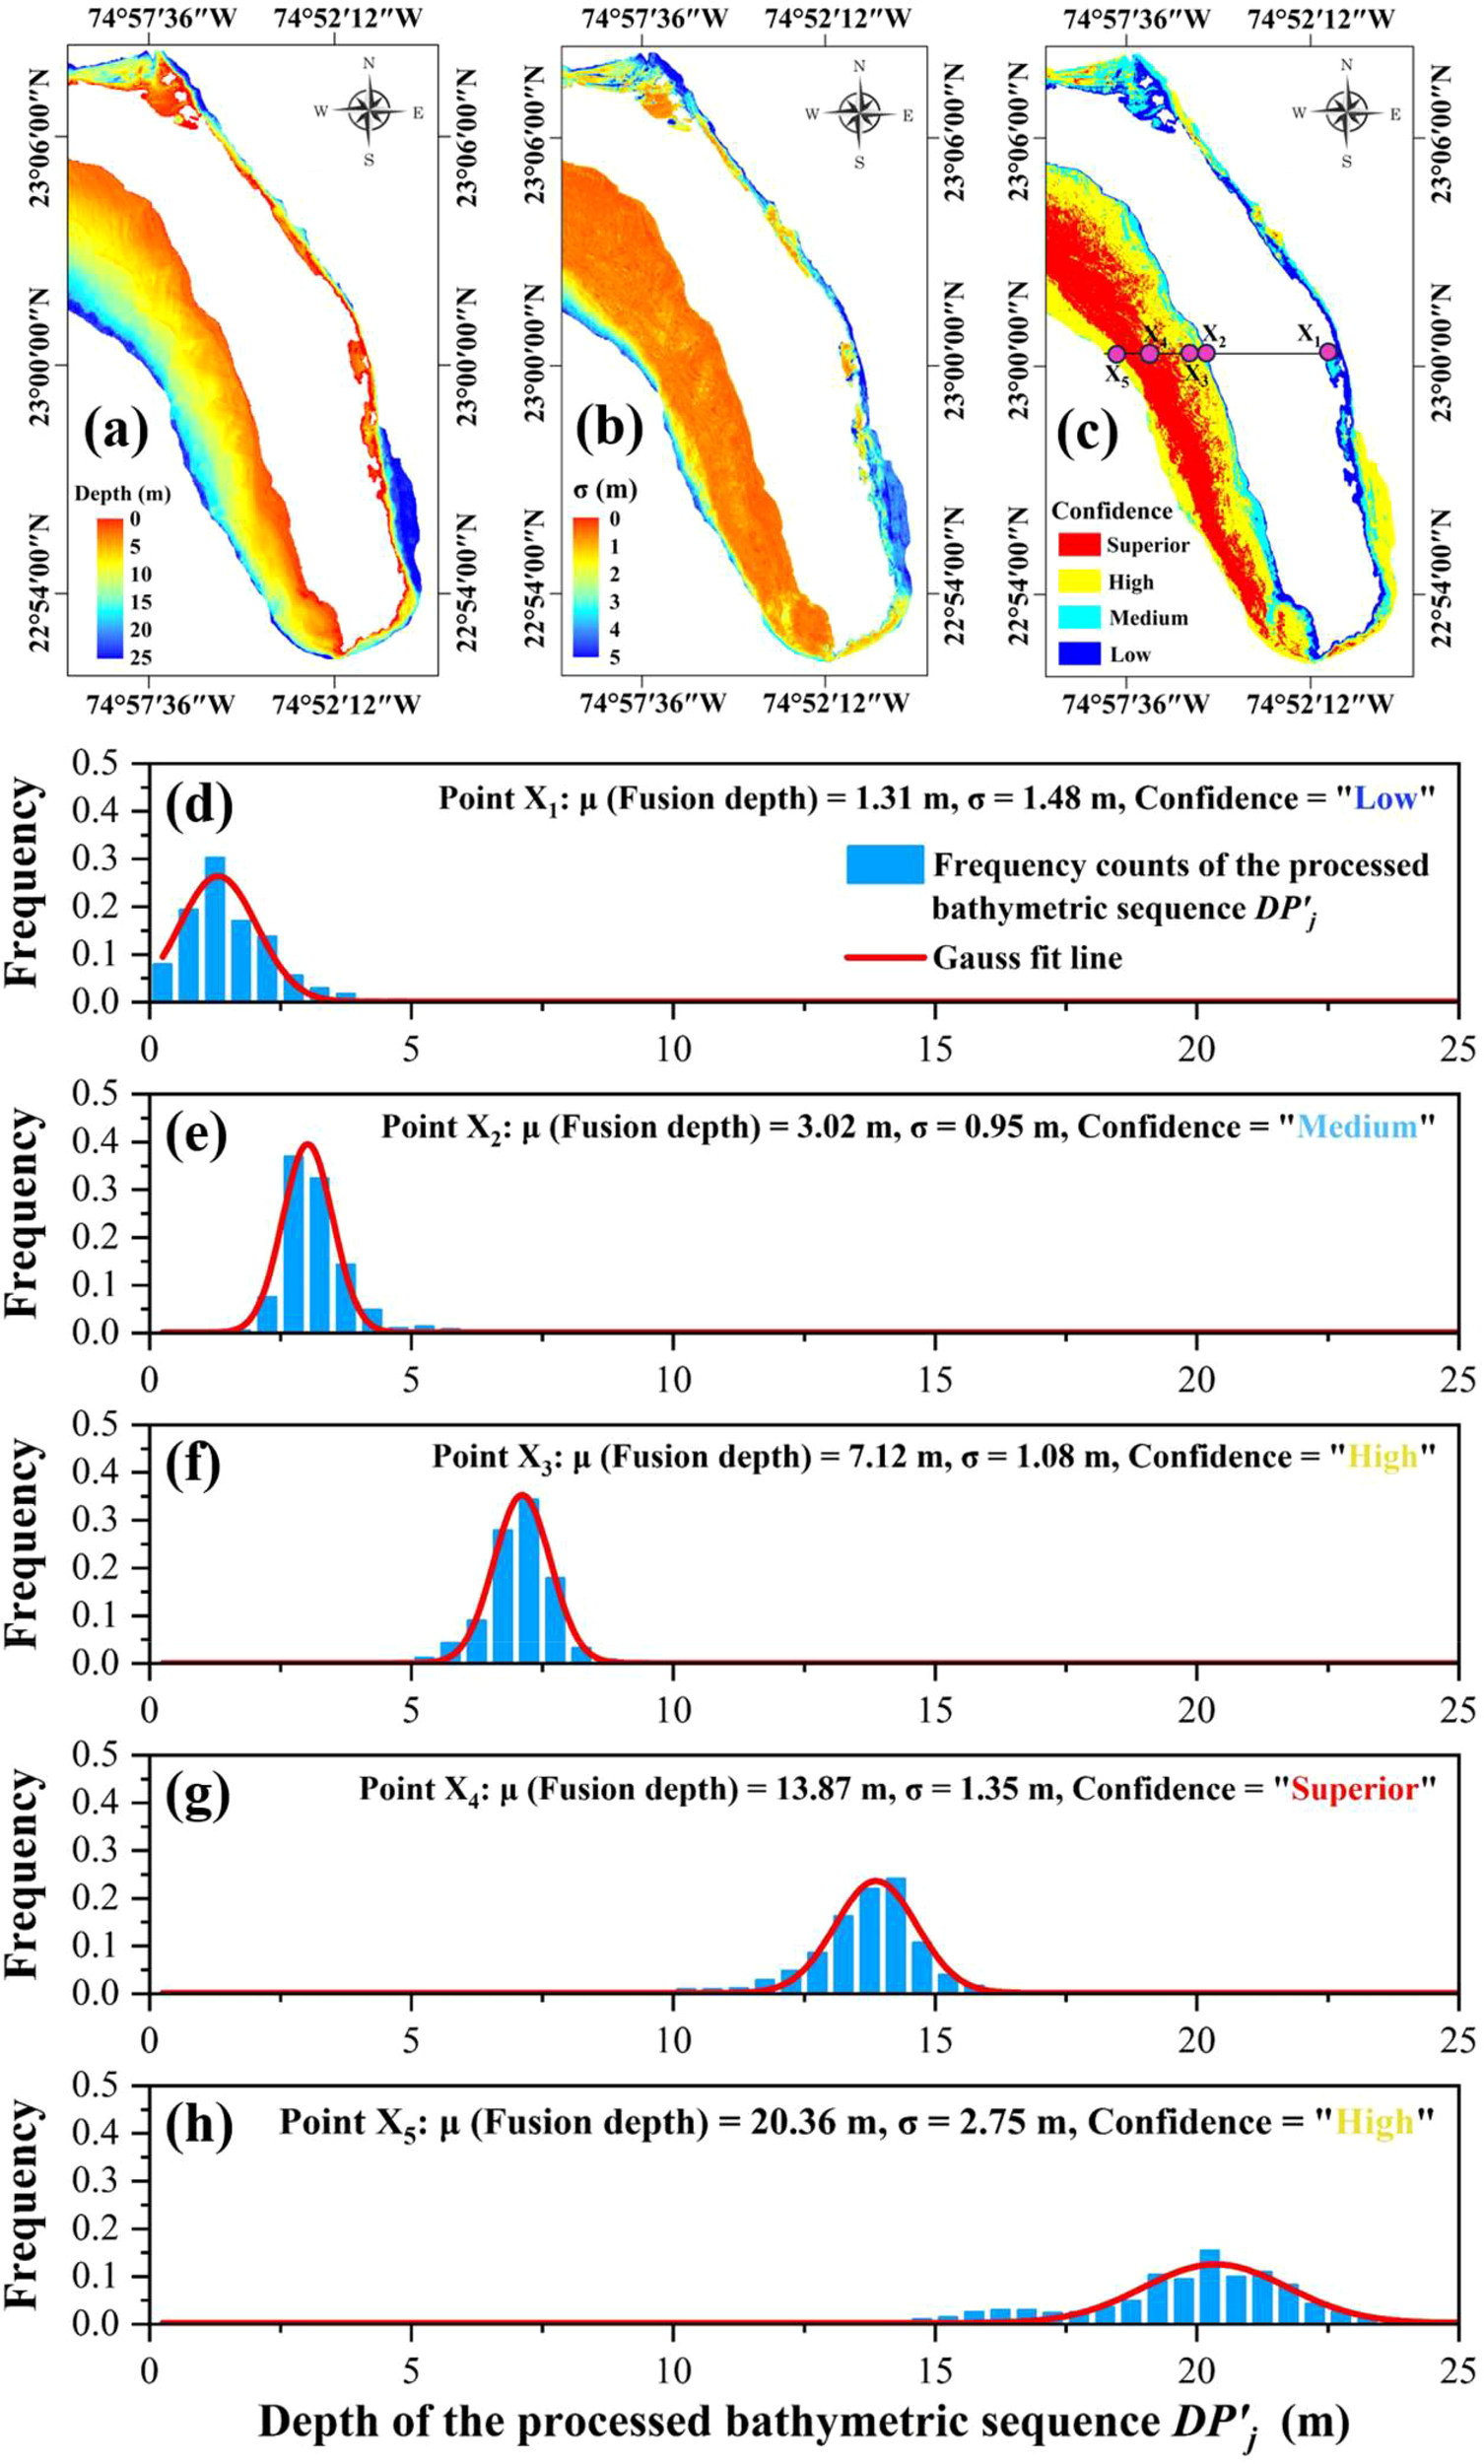
The water depth (A), standard deviation σ (B) and the confidence level (C) maps for each pixel at Long Island, as well as the distribution of σ and the produced confidence level at (D) points X1, (E) points X2, (F) points X3, (G) points X4, and (H) points X5 with different water depths.
There is a large reef flat of extremely shallow water at the Qilianyu Islands, resulting in the confidence level of “low” and “medium” for most of this region (Figure 14). To illustrate the details of the confidence evaluation results for individual pixels, a straight line from north to south was selected, and the distribution of the processed bathymetric sequence for the four pixels on the line is illustrated in Figures 14D, G. Compared to the Long Island, another significant difference at the Qilianyu Islands was that there are only a few small regions located in the central have the confidence level of “superior,” which may be due to the complex underwater terrain and faster water-depth decline in the Qilianyu Islands, as well as the large amount of cloud coverage in the central and southern regions of Qilianyu Island for time-series images.
Figure 14
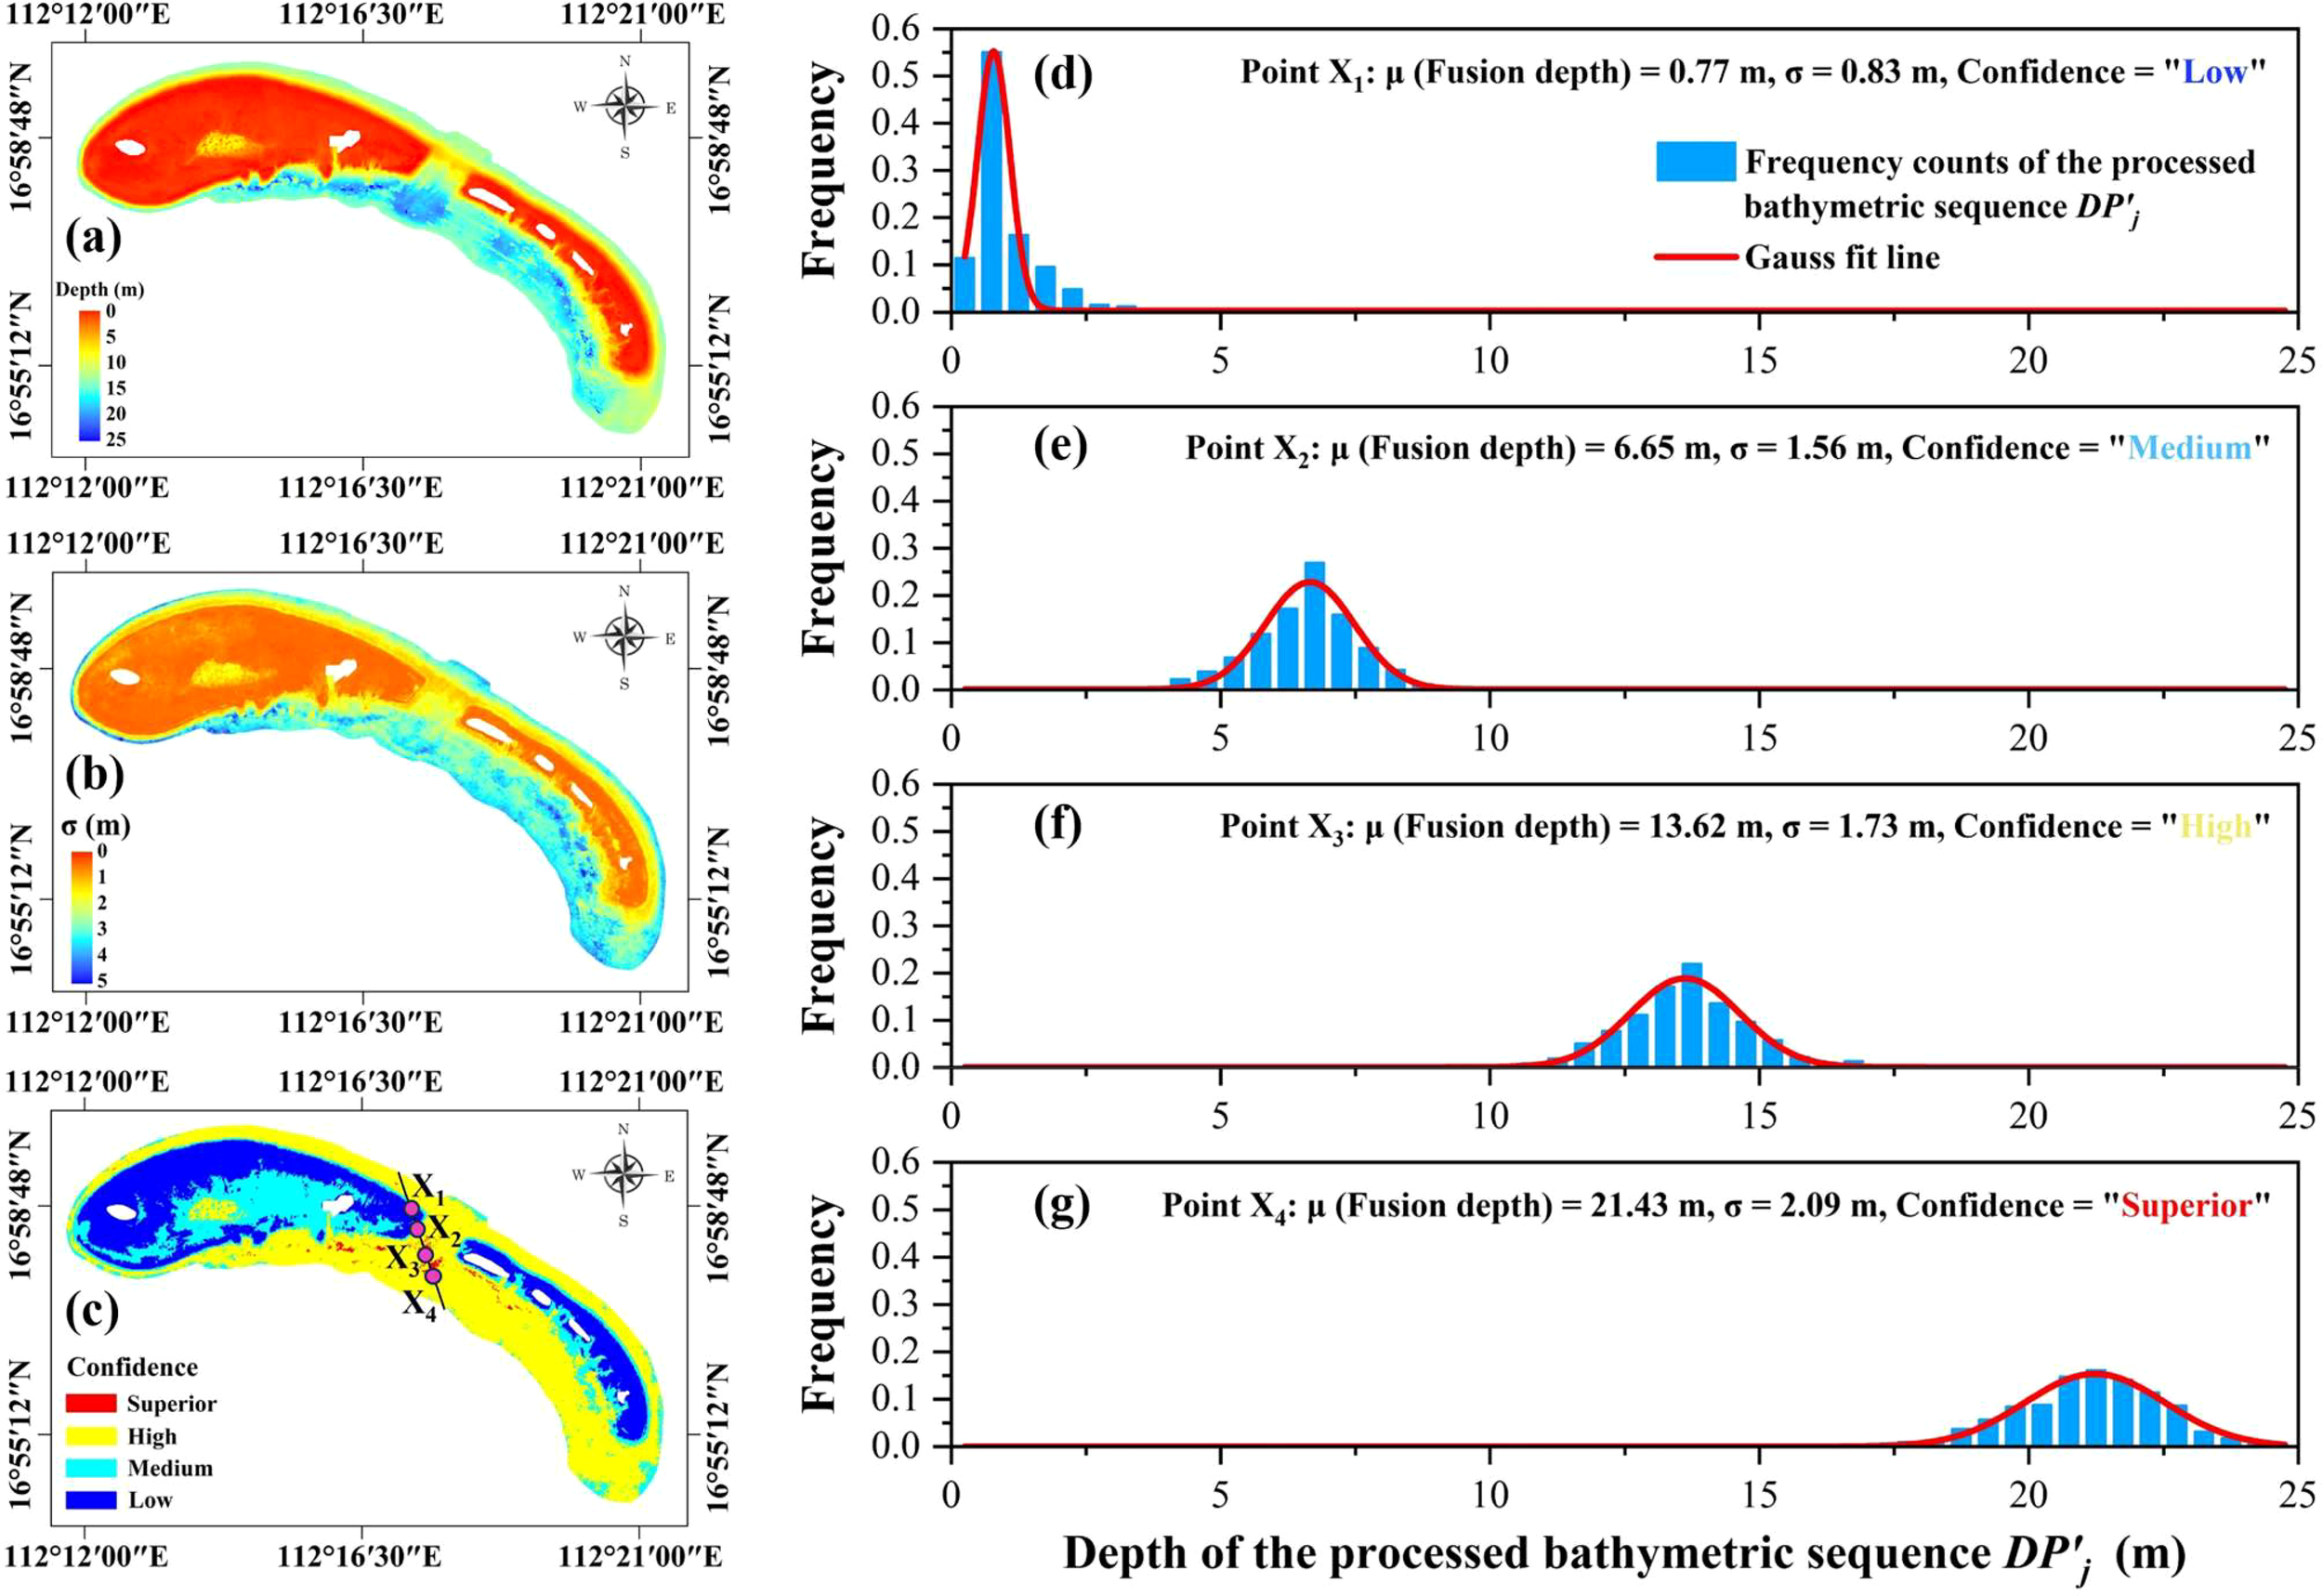
The water depth (A), standard deviation σ (B) and the confidence level (C) maps for each pixel at Qilianyu Islands, as well as the distribution of σ and the produced confidence level at (D) points X1, (E) points X2, (F) points X3, and (G) points X4 with different water depths.
5.4 Comparison of bathymetric results in two study areas
In this study, the key parameters that represent bathymetric accuracy (R2 and RMSE between the SDB results and the reference water depths) at Long Island were slightly better than those at the Qilianyu Islands. The possible explanations for this can be outlined as follows. (1) The bathymetric points used to calibrate the SDB models on Long Island were significantly higher than those on the Qilianyu Islands and the distribution of these points was more even (Thomas et al., 2021). (2) The bathymetric points on Long Island from ICESat-2 were utilized as calibration data, while the ALB points served as reference data for the Qilianyu Islands. Although reference data from two different sensors have been confirmed to exhibit credible bathymetric accuracy, their variations should not be ignored (Babbel et al., 2021). (3) The image quality of Long Island was better than that of Qilianyu Island, especially for the cloud cover of the images. (4) There is a large area of medium water depth (2–15 m) on Long Island, as well as a large reef flat of extremely shallow water (<2 m) on the Qilianyu Islands, and previous research has demonstrated the relatively low bathymetric accuracy of SDB models in extremely shallow and deep water (Caballero and Stumpf, 2020; Le et al., 2022).
6 Conclusion
In this study, a new approach for accurately and reliably measuring shallow water depths was proposed. This method involved evaluating the reliability of bathymetric data using Sentinel-2 time-series images and ICESat-2 data. To generate precise results, we utilized depth samples obtained from ICESat-2 ATL03 products to construct four SDB models. These models were then applied to long-term Sentinel-2 multispectral images in order to derive the final bathymetric information. Furthermore, based on the SDB results of the pixel and its 3×3 neighborhoods, a bathymetric sequence was built for each pixel, and outliers in the sequence were removed using a 3-times standard deviation method. Finally, the water depth and reliability of each pixel were evaluated using a Gaussian fit model based on the processed bathymetric sequence. To verify the precision of this approach, a comparison was made between the SDB results and the reference ICESat-2 as well as in-situ ALB data. The experimental findings have indicated that at Long Island, the proposed method achieved a bathymetric accuracy with an R2 value of 0.99 and an RMSE below 0.68 m. Similarly, at Qilianyu Islands, the method demonstrated an R2 value of 0.96 and an RMSE of 1.18 m. Compared with the traditional method using a single temporal image, the bathymetric accuracy was significantly improved. The reliability assessment results further demonstrated that the uncertainty of SDB was mainly distributed in areas with both shallow and deep depths. Future efforts should be made to improve the accuracy of fusion results from the following aspects: adding high-quality images from other sources, integrating more SDB methods, and optimizing various details of the fusion process, such as the selection of the pixel neighborhood and fitting model.
Statements
Data availability statement
The ICESat-2 datasets are available from https://search.earthdata.nasa.gov/search. The Sentinel-2 image is available from https://scihub.copernicus.eu/dhus/#/home. Further inquiries can be directed to the corresponding author.
Author contributions
YL: Funding acquisition, Conceptualization, Writing – review & editing, Writing – original draft, Methodology. XS: Writing – original draft, Supervision, Data curation. YC: Writing – review & editing, Conceptualization, Writing – original draft, Resources, Funding acquisition. DZ: Formal analysis, Writing – review & editing, Validation. LW: Software, Formal analysis, Writing – review & editing, Validation. HL: Visualization, Software, Writing – review & editing, Validation, Data curation. MH: Validation, Software, Investigation, Writing – review & editing.
Funding
The author(s) declare financial support was received for the research, authorship, and/or publication of this article. This work was supported by the National Key R&D Program of China (Grant No. 2023YFB3907705-3), Geological Survey Project of China (Grant No. DD20191011), the National Natural Science Foundation of China (Grant No. 42171373), the Special Fund of Hubei Luojia Laboratory (Grant No. 220100035), Key Laboratory of Geological Survey and Evaluation of Ministry of Education (Grant No. GLAB2023ZR09), Open Research Project of the Hubei Key Laboratory of Intelligent Geo-Information Processing (Grant No.KLIGIP-2022-B04, KLIGIP-2022-C01), the Open Research Program of the International Research Center of Big Data for Sustainable Development Goals (Grant No. CBAS2023ORP03), and Postdoctoral Fellowship Program of CPSF (Grant No. GZC20232463).
Conflict of interest
The authors declare that the research was conducted in the absence of any commercial or financial relationships that could be construed as a potential conflict of interest.
Publisher’s note
All claims expressed in this article are solely those of the authors and do not necessarily represent those of their affiliated organizations, or those of the publisher, the editors and the reviewers. Any product that may be evaluated in this article, or claim that may be made by its manufacturer, is not guaranteed or endorsed by the publisher.
References
1
Adler-Golden S. M. Acharya P. K. Berk A. Matthew M. W. Gorodetzky D. (2005). Remote bathymetry of the littoral zone from AVIRIS, LASH, and QuickBird imagery. IEEE Trans. Geosci. Remote Sens.43, 337–347. doi: 10.1109/TGRS.2004.841246
2
Albright A. Glennie C. (2020). Nearshore bathymetry from fusion of Sentinel-2 and ICESat-2 observations. IEEE Geosci. Remote Sens. Lett.18, 900–904. doi: 10.1109/LGRS.2020.2987778
3
Babbel B. J. Parrish C. E. Magruder L. A. (2021). ICESat-2 elevation retrievals in support of satellite-derived bathymetry for global science applications. Geophys. Res. Lett.48(5), 1–9. doi: 10.1029/2020GL090629
4
Caballero I. Stumpf R. P. (2019). Retrieval of nearshore bathymetry from Sentinel-2A and 2B satellites in South Florida coastal waters. Estuar. Coast. Shelf Sci.226, 106277. doi: 10.1016/j.ecss.2019.106277
5
Caballero I. Stumpf R. P. (2020). Towards routine mapping of shallow bathymetry in environments with variable turbidity: contribution of sentinel-2A/B satellites mission. Remote Sens.12, 451. doi: 10.3390/rs12030451
6
Cahalane C. Magee A. Monteys X. Casal G. Hanafin J. Harris P. (2019). A comparison of Landsat 8, RapidEye and Pleiades products for improving empirical predictions of satellite-derived bathymetry. Remote Sens. Environ.233, 111414. doi: 10.1016/j.rse.2019.111414
7
Cao B. Wang J. Hu Y. Lv Y. Yang X. Gong H. et al . (2023). ICESAT-2 shallow bathymetric mapping based on a size and direction adaptive filtering algorithm. IEEE J. Selected Topics Appl. Earth Observations Remote Sensing.16, 6279–6295. doi: 10.1109/JSTARS.2023.3290672
8
Casal G. Harris P. Monteys X. Hedley J. Cahalane C. McCarthy T. (2020). Understanding satellite-derived bathymetry using Sentinel-2 imagery and spatial prediction models. GIScience Remote Sens.57, 271–286. doi: 10.1080/15481603.2019.1685198
9
Chen Y. Le Y. Zhang D. Wang Y. Qiu Z. Wang L. (2021). A photon-counting LiDAR bathymetric method based on adaptive variable ellipse filtering. Remote Sens. Environ.256, 112326. doi: 10.1016/j.rse.2021.112326
10
Chu S. Cheng L. Ruan X. Zhuang Q. Zhou X. Li M. et al . (2019). Technical framework for shallow-water bathymetry with high reliability and no missing data based on time-series Sentinel-2 images. IEEE Trans. Geosci. Remote Sens.57, 8745–8763. doi: 10.1109/TGRS.36
11
Coveney S. Monteys X. Hedley J. D. Castillo-Campo Y. Kelleher B. (2021). Icesat-2 marine bathymetry: Extraction, refraction adjustment and vertical accuracy as a function of depth in mid-latitude temperate contexts. Remote Sens.13, 4352. doi: 10.3390/rs13214352
12
Daly C. Baba W. Bergsma E. Thoumyre G. Rafael Almar R. Garlan T. (2022). The new era of regional coastal bathymetry from space: A showcase for West Africa using optical Sentinel-2 imagery. Remote Sens. Environ.278, 113084. doi: 10.1016/j.rse.2022.113084
13
Dekker A. G. Phinn S. Anstee J. M. Bissett W. P. Brando V. E. Casey B. et al . (2011). Intercomparison of shallow water bathymetry, hydro-optics, and benthos mapping techniques in Australian and Caribbean coastal environments. Limnology Oceanography: Methods9, 396–425. doi: 10.4319/lom.2011.9.396
14
Drusch M. Del Bello U. Carlier S. Colin O. Fernandez V. Gascon F. et al . (2012). Sentinel-2: ESA’s optical high-resolution mission for GMES operational services. Remote Sens. Environ.120, 25–36. doi: 10.1016/j.rse.2011.11.026
15
Favoretto F. Morel Y. Waddington A. Lopez-Calderon J. Cadena-Roa M. Blanco-Jarvio A. (2017). Testing of the 4SM method in the gulf of California suggests field data are not needed to derive satellite bathymetry. Sensors17, 2248. doi: 10.3390/s17102248
16
Forfinski-Sarkozi N. A. Parrish C. E. (2016). Analysis of MABEL bathymetry in Keweenaw Bay and implications for ICESat-2 ATLAS. Remote Sens8, 772–793. doi: 10.3390/rs8090772
17
Guo K. Li Q. Wang C. Mao Q. Liu Y. Zhu J. et al . (2022). Development of a single-wavelength airborne bathymetric LiDAR: system design and data processing. ISPRS J. Photogramm. Remote. Sens185, 62–84. doi: 10.1016/j.isprsjprs.2022.01.011
18
He Y. Hu S. J. Chen W. B. Zhu X. L. Wang Y. X. Yang Z. et al . (2018). Research Progress of domestic airborne dual-frequency LiDAR detection technology. Laser Optoelectron. Progr.55, 082801. doi: 10.3788/LOP55.082801
19
Hedley J. D. Harborne A. R. Mumby P. J. (2005). Technical note: Simple and robust removal of sun glint for mapping shallow-water benthos. Int. J. Remote Sens.26, 2107–2112. doi: 10.1080/01431160500034086
20
Hedley J. D. Roelfsema C. Brando V. Giardino C. Kutser T. Phinn S. et al . (2018). Coral reef applications of Sentinel-2: Coverage, characteristics, bathymetry and benthic mapping with comparison to Landsat 8. Remote Sens. Environ.216, 598–614. doi: 10.1016/j.rse.2018.07.014
21
Hsu H. Huang C. Jasinski M. Li Y. Gao H. Yamanokuchi T. et al . (2021). A semi-empirical scheme for bathymetric mapping in shallow water by ICESat-2 and Sentinel-2: A case study in the South China Sea. ISPRS J. Photogrammetry Remote Sens.178, 1–19. doi: 10.1016/j.isprsjprs.2021.05.012
22
Kutser T. Hedley J. Giardino C. Roelfsema C. Brando V. E. (2020). Remote sensing of shallow waters–A 50 year retrospective and future directions. Remote Sens. Environ.240, 111619. doi: 10.1016/j.rse.2019.111619
23
Le Y. Hu M. Chen Y. Yan Q. Zhang D. Li S. et al . (2022). Investigating the shallow-water bathymetric capability of Zhuhai-1 spaceborne hyperspectral images based on ICESat-2 data and empirical approaches: A case study in the south China sea. Remote Sensing.14, 3406. doi: 10.3390/rs14143406
24
Li Y. Gao H. Jasinski M. F. Zhang S. Stoll J. D. (2019). Deriving high-resolution reservoir bathymetry from ICESat-2 prototype photon-counting lidar and Landsat imagery. IEEE Trans. Geosci. Remote Sens.57, 7883–7893. doi: 10.1109/TGRS.36
25
Liu Y. Zhou Y. Yang X. (2024). Bathymetry derivation and slope-assisted benthic mapping using optical satellite imagery in combination with ICESat-2. Int. J. Appl. Earth Observation Geoinformation127, 103700. doi: 10.1016/j.jag.2024.103700
26
Lumban-Gaol Y. Ohori K. A. Peters R. (2022). Extracting coastal water depths from multi-temporal sentinel-2 images using convolutional neural networks. Mar. Geodesy45, 2091696. doi: 10.1080/01490419.2022.2091696
27
Lyzenga D. R. (1985). Shallow-water bathymetry using combined lidar and passive multispectral scanner data. Int. J. Remote Sens.6, 115–125. doi: 10.1080/01431168508948428
28
Lyzenga D. R. Malinas N. P. Tanis F. J. (2006). Multispectral bathymetry using a simple physically based algorithm. IEEE Trans. Geosci. Remote Sens.44, 2251–2259. doi: 10.1109/TGRS.2006.872909
29
Ma Y. Xu N. Liu Z. Yang B. Li S. (2020). Satellite-derived bathymetry using the icesat-2 lidar and sentinel-2 imagery datasets. Remote Sens. Environ.250, 112047. doi: 10.1016/j.rse.2020.112047
30
Manessa M. D. M. Kanno A. Sekine M. Haidar M. Yamamoto K. Imai T. et al . (2016). Satellite-derived bathymetry using random forest algorithm and worldview-2 Imagery. Geoplanning J. Geomatics Plan3, 117–126. doi: 10.14710/geoplanning.3.2.117-126
31
Markus T. Neumann T. Martino A. Abdalati W. Brunt K. Csatho B. et al . (2017). The ice, cloud, and land elevation satellite-2 (ICESat-2): science requirements, concept, and implementation, Remote Sens. Environ.190, 260–273. doi: 10.1016/j.rse.2016.12.029
32
Matsumoto K. Takanezawa T. Ooe M. (2000). Ocean tide models developed by assimilating TOPEX/POSEIDON altimeter data into Hydrodynamical model: a global model and a regional model around Japan. J. Oceanogr.56, 567–581. doi: 10.1023/A:1011157212596
33
Monteys X. Harris P. Caloca S. Cahalane C. (2015). Spatial prediction of coastal bathymetry based on multispectral satellite imagery and multibeam data. Remote Sens7, 13782–13806. doi: 10.3390/rs71013782
34
Neumann T. Brenner A. Hancock D. Robbins J. Saba J. Harbeck K. et al . (2019). Ice, Cloud, and Land Elevation Satellite - 2 (ICESat-2) Project, Algorithm Theoretical Basis Document (ATBD) for Global Geolocated Photons ATL03 (Maryland: Goddard Space Flight Center).
35
Nicholls R. J. Cazenave A. (2010). Sea-level rise and its impact on coastal zones. Science328, 1517–1520. doi: 10.1126/science.1185782
36
Pacheco A. Horta J. Loureiro C. Ferreira Ó. (2015). Retrieval of nearshore bathymetry from Landsat 8 images: A tool for coastal monitoring in shallow waters. Remote Sens. Environ.159, 102–116. doi: 10.1016/j.rse.2014.12.004
37
Pan Z. Glennie C. Legleiter C. Overstreet B. (2015). Estimation of water depths and turbidity from hyperspectral imagery using support vector regression. IEEE Geosci. Remote. Sens. Lett.12, 2165–2169. doi: 10.1109/LGRS.2015.2453636
38
Parrish C. E. Magruder L. A. Neuenschwander A. L. Forfinski-Sarkozi N. A. Jasinski M. (2019). Validation of ICESat-2 ATLAS bathymetry and analysis of ATLAS’s bathymetric mapping performance. Remote Sens.11, 1634. doi: 10.3390/rs11141634
39
Schwarz R. Mandlburger G. Pfennigbauer M. Pfeifer N. (2019). Design and evaluation of a full-wave surface and bottom-detection algorithm for LiDAR bathymetry of very shallow waters. ISPRS J. Photogramm. Remote. Sens150, 1–10. doi: 10.1016/j.isprsjprs.2019.02.002
40
Shang X. Zhao J. Zhang H. (2019). Obtaining high-resolution seabed topography and surface details by co-registration of side-scan sonar and multibeam echo sounder images. Remote Sens.11, 1496. doi: 10.3390/rs11121496
41
Song Y. Ma Y. Zhou Z. Yang J. Li S. (2024). Signal photon extraction and classification for ICESat-2 photon-counting lidar in Coastal areas. Remote Sens.16, 1127. doi: 10.3390/rs16071127
42
Stumpf R. P. Holderied K. Sinclair M. (2003). Determination of water depth with high-resolution satellite imagery over variable bottom types. Limnology Oceanography48, 547–556. doi: 10.4319/lo.2003.48.1_part_2.0547
43
Thomas N. Pertiwi A. P. Traganos D. Lagomasino D. Poursanidis D. Moreno S. et al . (2021). Space-borne cloud-native satellite-derived bathymetry (SDB) models using ICESat-2 and sentinel-2. Geophys. Res. Lett.48(6), 1–11. doi: 10.1029/2020GL092170
44
Toming K. Kutser T. Laas A. Sepp M. Paavel B. Nõges T. (2016). First experiences in mapping lake water quality parameters with sentinel-2 MSI imagery. Remote Sens8, 640. doi: 10.3390/rs8080640
45
Tonion F. Pirotti F. Faina G. Paltrinieri D. (2020). a machine learning approach to multispectral satellite derived bathymetry, ISPRS Annals of the Photogrammetry. Remote Sens. Spatial Inf. Sci.V-3-2020, 565–570. doi: 10.5194/isprs-annals-V-3-2020-565-2020
46
Traganos D. Poursanidis D. Aggarwal B. Chrysoulakis N. Reinartz P. (2018). Estimating satellite-derived bathymetry (SDB) with the google earth engine and sentinel-2. Remote Sens.10, 859. doi: 10.3390/rs10060859
47
Wang C. Li Q. Liu Y. Wu G. Liu P. Ding X. (2015). A comparison of waveform processing algorithms for single-wavelength LiDAR bathymetry. ISPRS J. Photogrammetry Remote Sens.101, 22–35. doi: 10.1016/j.isprsjprs.2014.11.005
48
Warren M. A. Simis S. G. H. Martinez-Vicente V. Poser K. Bresciani M. Alikas K. et al . (2019). Assessment of atmospheric correction algorithms for the Sentinel-2a multispectral imager over coastal and inland waters. Remote Sens. Environ.225, 267–289. doi: 10.1016/j.rse.2019.03.018
49
Westfeld P. Maas H. G. Richter K. Weiß R. (2017). Analysis and correction of ocean wave pattern induced systematic coordinate errors in airborne LiDAR bathymetry. ISPRS J. Photogrammetry Remote Sens.128, 314–325. doi: 10.1016/j.isprsjprs.2017.04.008
50
Wu L. Chen Y. Le Y. Qian Y. Zhang D. Wang L. (2024). A high-precision fusion bathymetry of multi-channel waveform curvature for bathymetric LiDAR systems. Int. J. Appl. Earth Observation Geoinformation127, 103700. doi: 10.1016/j.jag.2024.103770
51
Xie C. Chen P. Zhang S. Huang H. (2024). Nearshore bathymetry from ICESat-2 liDAR and sentinel-2 imagery datasets using physics-informed CNN. Remote Sens.16, 511. doi: 10.3390/rs16030511
52
Xu G. Wu Y. Liu S. Cheng S. Zhang Y. Pan Y. et al . (20232024). How 2022 extreme drought influences the spatiotemporal variations of terrestrial water storage in the Yangtze River Catchment: Insights from GRACE-based drought severity index and in-situ measurements. J. Hydrology626, 130245. doi: 10.1016/j.jhydrol.2023.130245
53
Xu N. Ma X. Ma Y. Zhao P. Yang J. Wang X. H. (2021). Deriving highly accurate shallow water bathymetry from Sentinel-2 and ICESat-2 datasets by a multitemporal stacking method. IEEE J. Selected Topics Appl. Earth Observations Remote Sens.14, 6677–6685. doi: 10.1109/JSTARS.2021.3090792
54
Yang H. Ju J. Guo H. Qiao B. Nie B. Zhu L. (2022). Bathymetric inversion and mapping of two shallow lakes using sentinel-2 imagery and bathymetry data in the central Tibetan Plateau. IEEE J. Selected Topics Appl. Earth Observations Remote Sensing.15, 4279–4296. doi: 10.1109/JSTARS.2022.3177227
55
Yunus A. P. Dou J. Song X. Avtar R. (2019). Improved bathymetric mapping of coastal and lake environments using Sentinel-2 and Landsat-8 images. Sensors19, 2788. doi: 10.3390/s19122788
56
Zhang D. Chen Y. Le Y. Dong Y. Dai G. Wang L. (2022). Refraction and coordinate correction with the JONSWAP model for ICESat-2 bathymetry. ISPRS J. Photogrammetry Remote Sens.186, 285–300. doi: 10.1016/j.isprsjprs.2022.02.020
57
Zhang X. Chen Y. Le Y. Zhang D. Yan Q. Dong Y. et al . (2022). Nearshore bathymetry based on ICESat-2 and multispectral images: comparison between sentinel-2, landsat-8, and testing gaofen-2. IEEE J. Selected Topics Appl. Earth Observations Remote Sensing.15, 2449–2462. doi: 10.1109/JSTARS.2022.3153681
Summary
Keywords
satellite-derived bathymetry, ICESat-2, shallow water, time-series images, reliability assessment
Citation
Le Y, Sun X, Chen Y, Zhang D, Wu L, Liu H and Hu M (2024) High-accuracy shallow-water bathymetric method including reliability evaluation based on Sentinel-2 time-series images and ICESat-2 data. Front. Mar. Sci. 11:1470859. doi: 10.3389/fmars.2024.1470859
Received
29 July 2024
Accepted
29 October 2024
Published
21 November 2024
Volume
11 - 2024
Edited by
Pierre Yves Le Traon, Mercator Ocean, France
Reviewed by
Srinivas Kolluru, University of Georgia, United States
Peng Chen, Ministry of Natural Resources, China
Updates
Copyright
© 2024 Le, Sun, Chen, Zhang, Wu, Liu and Hu.
This is an open-access article distributed under the terms of the Creative Commons Attribution License (CC BY). The use, distribution or reproduction in other forums is permitted, provided the original author(s) and the copyright owner(s) are credited and that the original publication in this journal is cited, in accordance with accepted academic practice. No use, distribution or reproduction is permitted which does not comply with these terms.
*Correspondence: Yifu Chen, yifuchen.cug@foxmail.com
Disclaimer
All claims expressed in this article are solely those of the authors and do not necessarily represent those of their affiliated organizations, or those of the publisher, the editors and the reviewers. Any product that may be evaluated in this article or claim that may be made by its manufacturer is not guaranteed or endorsed by the publisher.