Abstract
In the Arabian Gulf, baroclinic tides significantly impact physical and biological phenomena, shaping the region’s marine ecosystem. This study provides the first high-resolution investigation of the baroclinic tides using the three-dimensional, nonhydrostatic MIT general circulation model (MITgcm). The simulation outputs were validated against data from Oregon State University’s Tidal Inversion Software (OTIS), tidal stations, and mooring observations, showing high agreement and confirming the model’s accuracy. We further examined the characteristics of baroclinic and barotropic tides, identifying four key regions with high-intensity baroclinic tides based on energy budget analysis: 1) the narrow Strait of Hormuz; 2) the strait’s entrance along the trough, including the islands Farur, Siri, Abumusa, and Greater Tunb; 3) the central axial trough area with sea-bottom ridges; and 4) the northern area following a secondary ridge. Most baroclinic tides dissipate quickly due to interactions with complex bottom topography and do not propagate far from their sources. Significant seasonal variation shows that in winter, only the Strait of Hormuz and the area around the four islands showed significant baroclinic tidal energy, likely due to well-mixed upper layer seawater that hinders thermocline disturbances. The strong correlation between the simulation results and satellite images of internal waves suggests that intense baroclinic tides generate internal solitary waves in the Gulf.
1 Introduction
Baroclinic tides, commonly occurring ocean phenomena globally, primarily arise from barotropic tides flowing over topographic features in a stratified ocean (Simmons et al., 2004; Garrett and Kunze, 2007). They induce oscillations and vertical mixing across the pycnocline, significantly affecting ocean circulation, climate change, and ecosystem dynamics (Munk and Wunsch, 1998; Wunsch and Ferrari, 2004). The associated breaking and dissipation processes are particularly important for diapycnal mixing, affecting the transport of nutrients and neustonic larvae (Pineda, 1994).
The Arabian Gulf, connects the Gulf of Oman at the norhtern part of the Indian Ocean through the narrow Strait of Hormuz, and has been identified as a hotspot of internal wave activity, as revealed from satellite and in-situ observations (Andi et al., 2021; Rashidi Ebrahim Hesari et al., 2019; Al Senafi and Anis, 2020; Farjami and Andi, 2021). Andi et al. (2021) used field measurements and satellite remote sensing data to detect all internal waves in the Gulf from 2000 to 2015. They created a comprehensive map of internal wave occurrences and their spatiotemporal analysis revealed that more internal waves are generated in the eastern part of the Gulf than that in the west. Besides, most internal waves appear in the summer, when the stratification is strong, and disappear in winter. Strong winds and tidal currents are suggested to be the main reasons for the generation of these internal waves. Rashidi Ebrahim Hesari et al. (2019) also detected internal wave activity in the Arabian Gulf using Landsat and Synthetic Aperture Radar (SAR) satellite images, combined with temperature and salinity fields analysis from observational cruise data. They consistently showed that most internal waves are detected in the warm season and in the eastern part of the Gulf. Based on the satellite imagery, they estimated that the length of the internal wave crest detected in the northeastern part of Al-Zhahirah (Qatar) was more than 120 km, whereas it was in the range of 5–20 km to the south and east of Larak Island, 15–40 km to the northeast of Abumusa Island, and 3–65 km to the southeast and south of Hondurabi Island. Moreover, internal waves with shorter crests were observed near Lavan, Siri, Farur, Halul, Khark Islands, and Bandar Lengeh. However, the authors suggested that the movement of tidal currents over the sea bottom with variable slopes did not play a significant role in the formation of internal waves. Al Senafi and Anis (2020) examined the characteristics of internal waves on the continental shelf of the northwestern Arabian Gulf and the associated energy cascade from internal waves to turbulence, based on collected spatial transects and time series measurements at five moorings. Temperature, salinity, current, turbidity, chlorophyll, and turbulence measurements revealed that internal wave activity was consistent with the diurnal and semi-diurnal tidal cycles, suggesting that these internal waves are generated by the interaction of barotropic tides with bottom topography.
The Arabian Gulf features relatively shallow bottom topography compared with the other similar-sized gulf basins, with an average water depth of 36 m and a maximum depth of 90 m at the strait (Emery, 1956). Along the basin axis, a deep trough extends from the narrow strait at the southeast, gradually widening and becoming gentle toward the central and northern parts of the Gulf. The trough is characterized by various small islands and underwater ridges (as shown in Figure 1), which provide potential topographic features for the generation of baroclinic tides. The rest of the Gulf, including the areas along the coast of the United Arab Emirates (UAE) and Bahrain and the northern head of the Gulf, is characterized by extensive shallow shelves with water depths less than 20 meters (Kämpf and Sadrinasab, 2006). The Arabian Gulf is situated in an arid, sub-tropical climate and is surrounded by some of the largest deserts in the world. The Shamal, a northwesterly wind that occurs throughout the year, is the most well-known weather phenomenon in the area (Kämpf and Sadrinasab, 2006; Langodan et al., 2023). During winter, the Shamal is intermittent and associated with synoptic weather systems and rarely exceeds 10 m/s. However, the summer Shamal is continuous from early June through to July. The strength of the Indian and Arabian thermal lows determine the seasonal variations in the Shamal (Emery, 1956; Langodan et al., 2023). Because of the Shamal and excessive evaporation, the Arabian Gulf displays a reverse estuarine circulation pattern. The dense bottom outflow follows the coastline of the United Arab Emirates, whereas the inflow of Indian Ocean surface water follows the Iranian coastline (Sugden, 1963; Hunter, 1983; Johns et al., 2003; Vasou et al., 2024). The seasonal variation in the circulation of the Arabian Gulf cause a significant difference in the water stratification between summer and winter, potentially affecting the generation and characteristics of baroclinic tides in the basin.
Figure 1
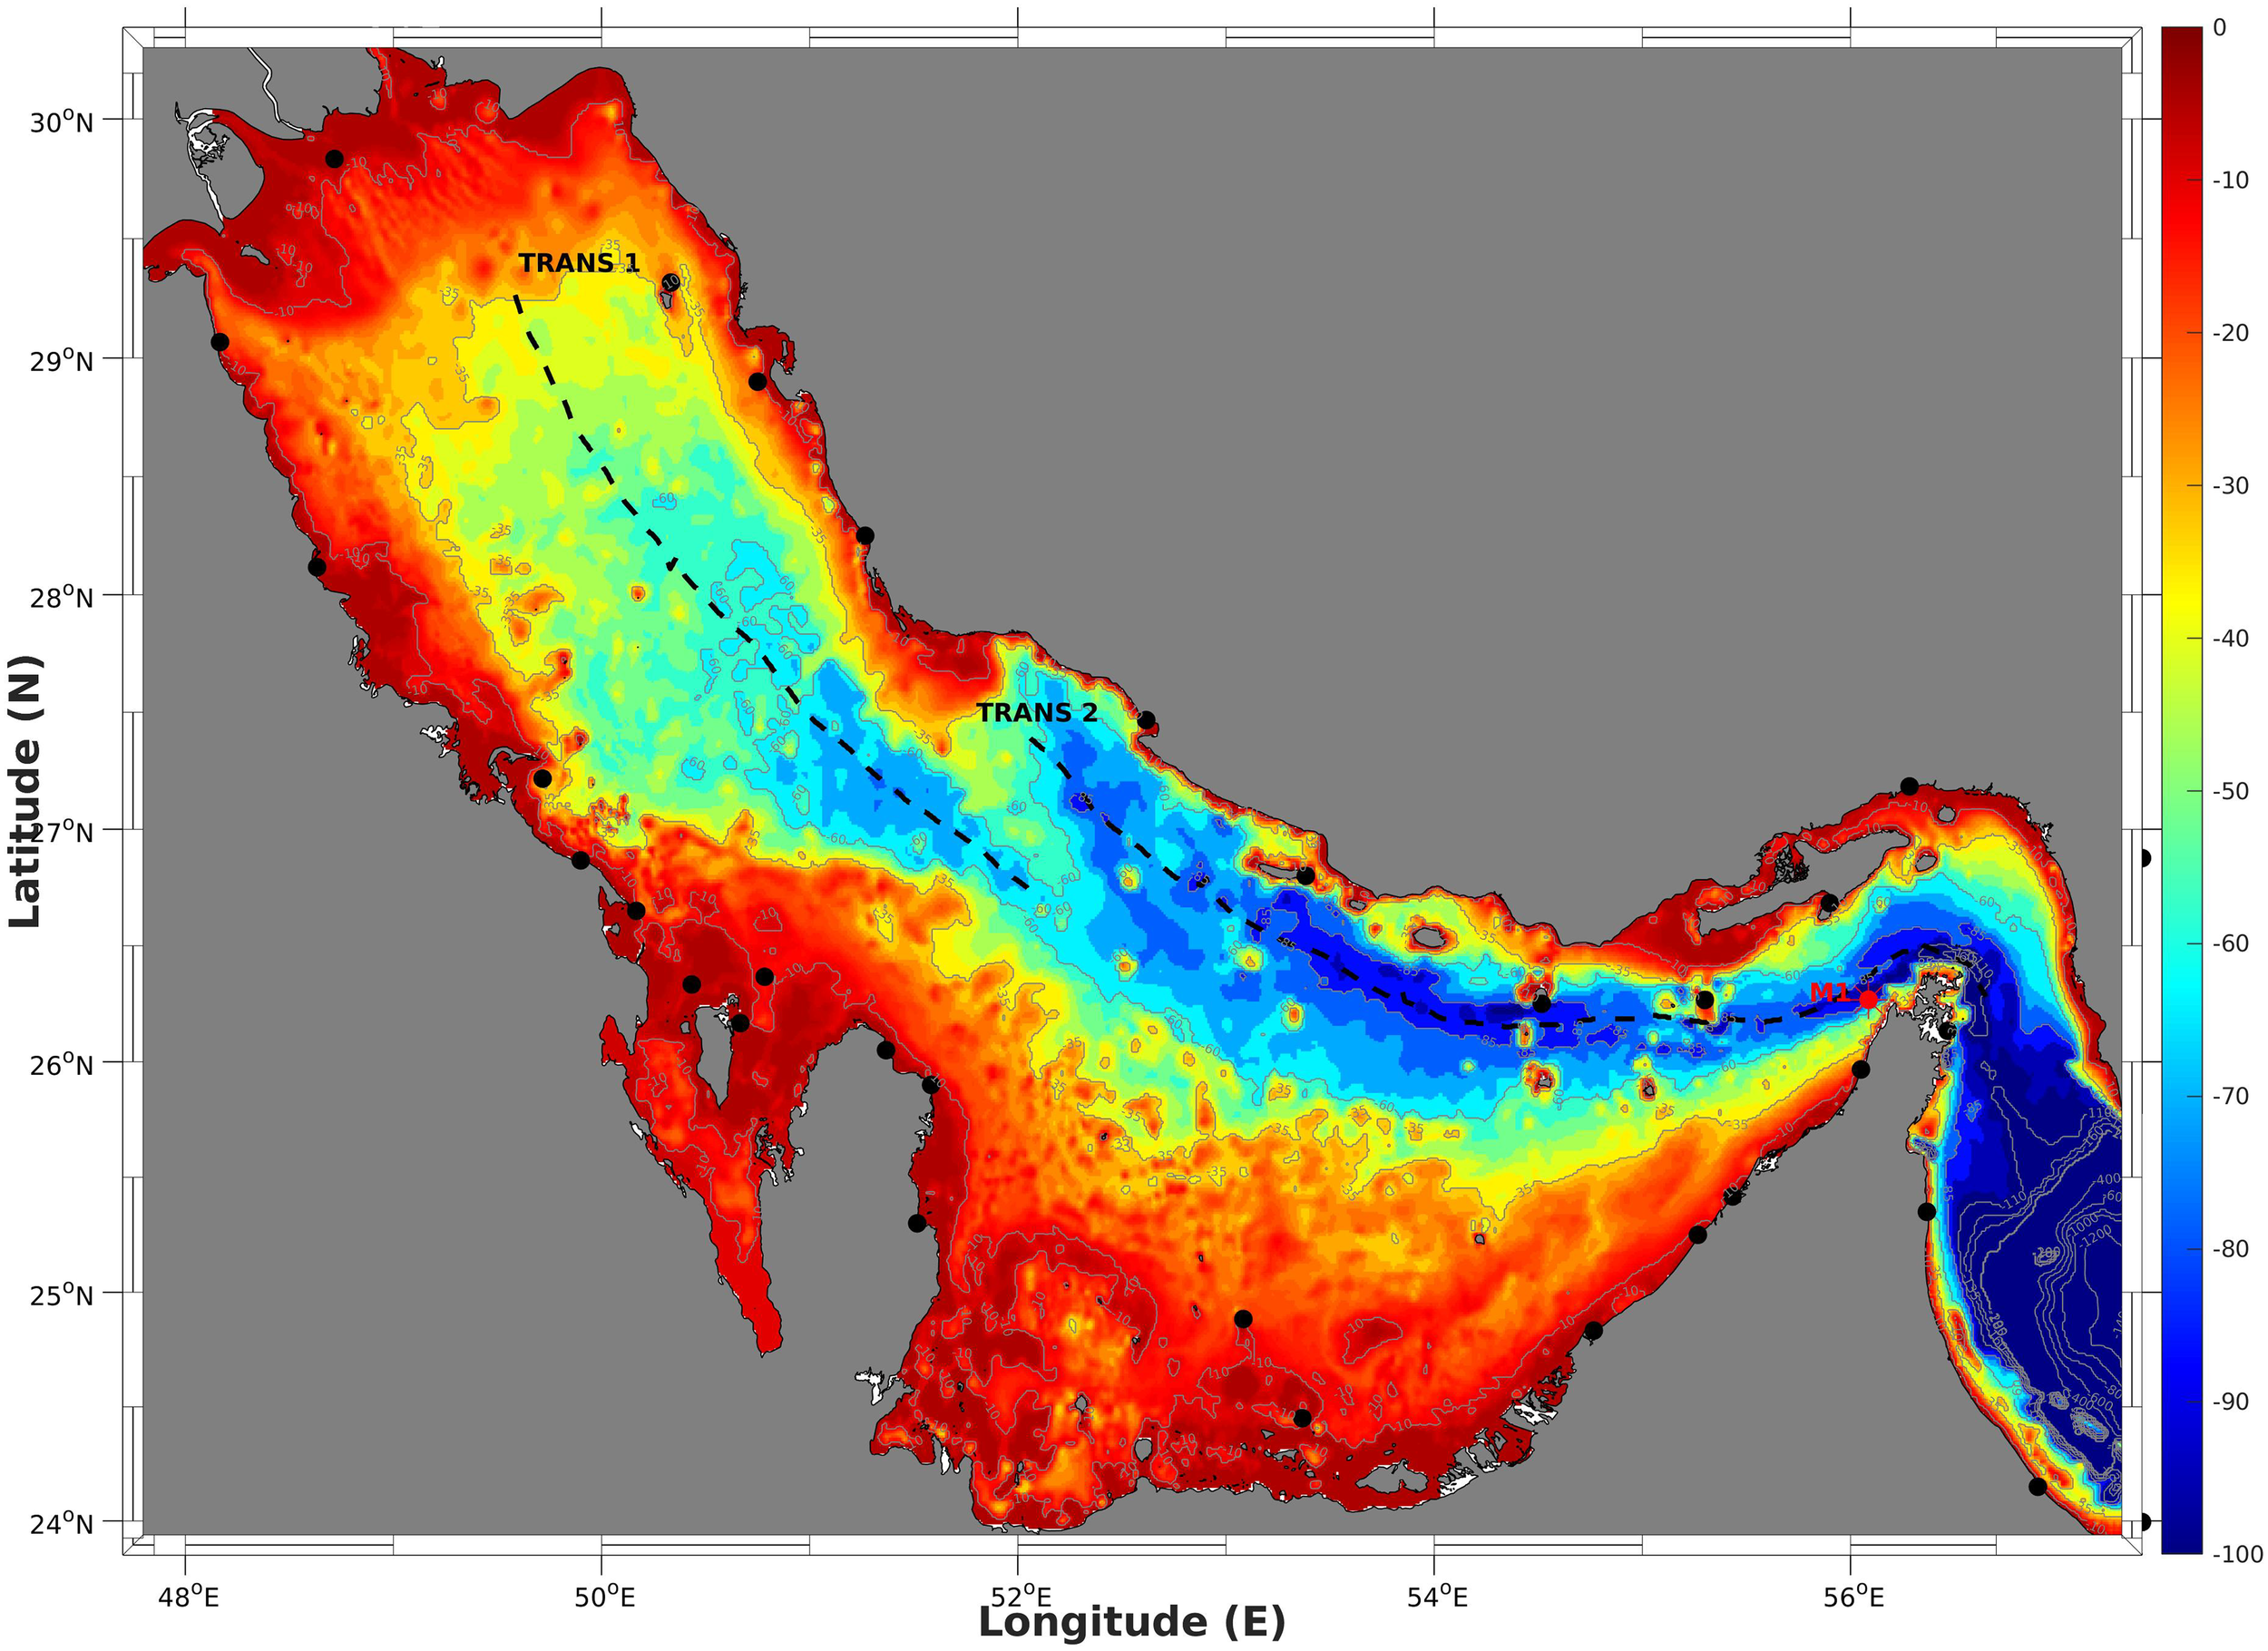
Topography of the Arabian Gulf. Black solid circles show the locations of 26 tidal stations, and the red solid circle indicates the location of mooring observation.
Tides in the Arabian Gulf have been studied mainly based on observations and two-dimensional (2D) barotropic models. Elahi and Ashrafi (1992) developed a two-dimensional numerical model to analyze the dynamics of the four major tidal constituents M2, S2, K1, and O1 in the Arabian Gulf. Reynolds (1993) revealed that tides in the Arabian Gulf co-oscillate with those in the narrow Strait of Hormuz, which opens into the deep Gulf of Oman, where the tides co-oscillate with those in the Arabian Gulf. The dimensions of the Arabian Gulf allow the occurrence of resonance amplification. Thus, two amphidromic points of semidiurnal constituents generate in the northwestern and southeastern ends and a single amphidromic points of diurnal constituents presents in the central region near Bahrain. Teubner et al. (1999) modeled the tides of the Arabian Gulf and reported the contour charts of tidal amplitudes and phases for the major tidal constituents, tidal current ellipses, depth-averaged velocities, and residual tidal currents. Sabbagh-Yazdi and Zounemat-Kermani (2009) applied the water level data of admiralty tide tables at the open boundary of the Strait of Hormuz in their model to extract the co-tidal charts of the Arabian Gulf. Pous et al. (2012) applied a 2D shallow water model over the northwestern Indian Ocean under the forcing of seven tidal components at the southern boundary, to derive the co-tidal/co-range charts of harmonic constituents of the Arabian Gulf. Akbari et al. (2016) applied the Finite Volume Community Ocean Model (Chen et al., 2003), forced by eight tidal constituents at its southern boundary to study tidal amplitudes in an extended domain comprising of the Arabian Gulf, Gulf of Oman, and the Arabian Sea and presented the co-tidal/co-range charts. By implementing the 2D shallow-water model of VOMSW2d, Mashayekh Poul et al. (2016) obtained the co-tidal/co-range charts, maximum velocities, tidal ellipses, and kinetic power energy for the Gulf using 13 tidal constituents at the open boundary in the Gulf of Oman. Using a 2D hydrodynamic model, Sohrabi Athar et al. (2019) presented a tidal model for the Arabian Gulf with spatially variable bed friction coefficients, forced by satellite altimetry sea level data.
Despite previous efforts, a notable gap exists in studies focusing on the modeling of high-resolution three dimensional (3D) baroclinic tides in the Arabian Gulf, and the mechanisms behind internal wave generation are still poorly understood. To bridge this gap, we employed a 3D Massachusetts Institute of Technology general circulation model (MITgcm) with exceptionally high resolution (approximately 500 m) to investigate the fundamental characteristics of baroclinic tides in the Arabian Gulf. We notably revealed the spatial distribution and seasonal variation of the baroclinic tides based on a thorough energy budget analysis. In Section 2 we describe the model configuration, and Section 3 elaborates on the validation process. Section 4 presents an analysis of the general characteristics of barotropic and baroclinic tides in the Arabian Gulf based on energy budget analysis. Section 5 explores the seasonal variations of these tides and the mechanisms underlying the generation of internal solitary waves. Finally, the conclusions of this study and its implications are discussed in Section 6.
2 Model configuration
The MITgcm is a powerful tool designed to simulate ocean circulation and fluid dynamics. Owing to its non-hydrostatic formulation, this model can accurately represent various fluid phenomena across various spatial scales (http://mitgcm.org/) (Marshall et al., 1997). Herein, we utilized version c65x of the MITgcm to simulate the baroclinic tides in the Arabian Gulf. The model domain covers the entire Gulf of Oman and Arabian Gulf, with only one open boundary set from the east at 57.4°E (Figure 1). The model topography was derived from the General Bathymetric Chart of the Oceans (GEBCO) digital atlas, at 30 arc-second intervals, while the coastline was improved using the Global Self-consistent, Hierarchical, High resolution Geography Database (GSHHGD). The model is implemented on a horizontal resolution grid of 0.005° (approximately 500 m), with 60 vertical layers. The minimum thickness of the layers is set at 0.5 m near the surface and exponentially increases to a maximum thickness of 500 m outside the Gulf near the bottom. A non-slip condition is set at the bottom boundary, with a spatially constant, quadratic drag coefficient of 0.002.
To implement tidal forcing, we imported barotropic currents from the open boundary. The amplitudes and phases of tidal currents were obtained from the inverse barotropic tidal model TPXO (the Arabian Sea regional model) (Egbert and Erofeeva, 2002), which has a horizontal resolution of 1/60°. We included eight major tidal components with semi-diurnal and diurnal frequencies (M2, S2, N2, K2, K1, O1, P1, and Q1), ordered according to their amplitudes in the Arabian Gulf. To account for the 18.6-year cycle of astronomical tide-generating potential, a nodal correction was applied to derive the barotropic current amplitudes and phases. This correction is essential for obtaining accurate barotropic tidal simulations (Pawlowicz et al., 2002).
The initial conditions of the potential temperature and salinity fields used in the simulations were extrapolated from prior general circulation model simulation, which have undergone approximately 30 years of validation against various in-situ and satellite observations (Vasou et al., 2024). For both the summer and winter scenarios, we derived climatological monthly averages for July and December, respectively, based on the long-term circulation results (Figure 2). Notably, water stratification is considerably stronger in summer than in winter owing to intensified mixing processes, which may impede the generation of baroclinic tides, during the winter. Subsequently, we conducted continuous runs for both cases for one month, analyzing the hourly output for the final 25 days.
Figure 2
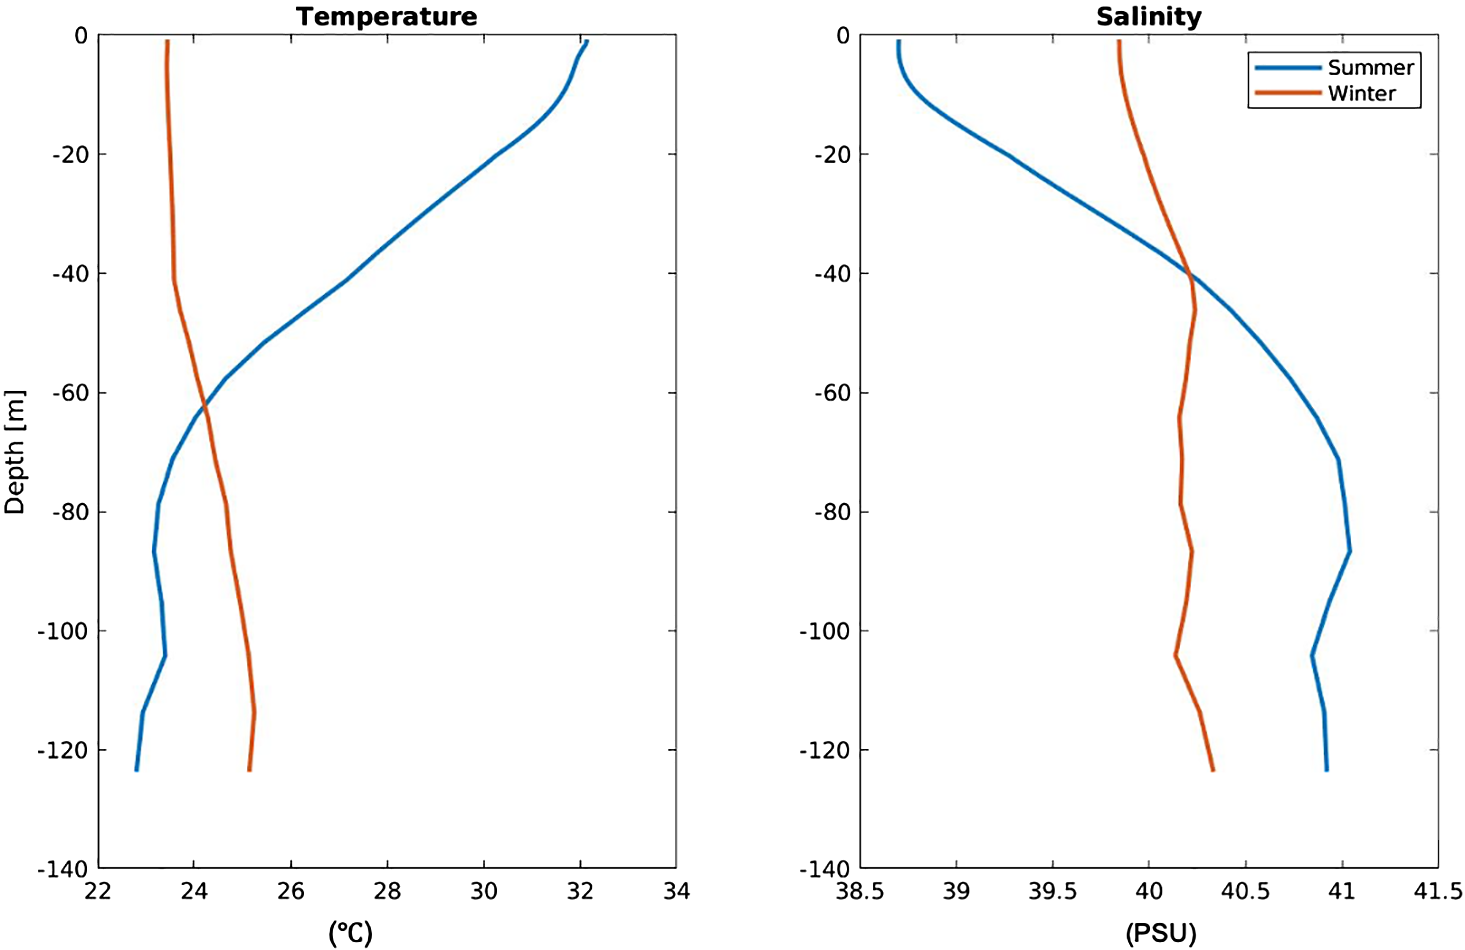
Model initial conditions (up to 125 m) of temperature and salinity in the summer (blue curves) and winter (red curves).
3 Comparisons with observations
To validate the model results, we gathered diverse datasets for comparison. These include tidal elevation amplitudes and phases obtained from tidal stations, spatial distributions of barotropic tide elevation parameters from the OTIS, and tidal currents data derived from mooring observations. The subsequent subsections outline the comparisons between the model results and the observations, revealing generally favorable agreements.
3.1 Tidal elevation amplitudes and phases from sea level stations
First, we collected tidal elevation parameters of amplitude and phase from 26 sea level elevation stations along the Arabian Gulf coast (Pous et al., 2012). The locations of tidal stations are indicated by blue solid circles in Figure 1. The amplitudes and phases for the four primary tidal components of (M2, S2, K1 and O1) at all tidal stations are listed in Table 1. To assess the agreement between our model results and the observations, we examined the correlation coefficients of the amplitudes and phases. We also computed the parameter H, which provides a measure of the overall performance by averaging the difference between the observations and the model solution. This parameter is estimated from the following expression (Davies et al., 1997):
Table 1
| M2 | S2 | K1 | O1 | |||||||||||||||
|---|---|---|---|---|---|---|---|---|---|---|---|---|---|---|---|---|---|---|
| Amp (cm) | Pha (°) | Amp (cm) | Pha (°) | Amp (cm) | Pha (°) | Amp (cm) | Pha (°) | |||||||||||
| Name | Latitude | Longitude | Obs | Mod | Obs | Mod | Obs | Mod | Obs | Mod | Obs | Mod | Obs | Mod | Obs | Mod | Obs | Mod |
| Ras Dillah | 26°08’ | 56°28’ | 72 | 71 | 174 | 174 | 27 | 27 | 202 | 207 | 31 | 30 | 341 | 345 | 19 | 18 | 353 | 353 |
| Khor Khwair | 25°58’ | 56°03’ | 62 | 59 | 210 | 207 | 20 | 21 | 250 | 242 | 21 | 12 | 29 | 60 | 16 | 15 | 28 | 30 |
| Ajman | 25°25’ | 55°26’ | 43 | 45 | 248 | 228 | 13 | 18 | 301 | 272 | 17 | 20 | 103 | 89 | 15 | 17 | 50 | 39 |
| Dubai | 25°15’ | 55°16’ | 44 | 43 | 237 | 237 | 16 | 18 | 281 | 281 | 23 | 23 | 91 | 92 | 16 | 17 | 42 | 41 |
| Khor Ghanada | 24°50’ | 54°46’ | 42 | 41 | 263 | 261 | 15 | 14 | 318 | 304 | 27 | 25 | 105 | 104 | 15 | 16 | 56 | 53 |
| Zarqa | 24°53’ | 53°05’ | 11 | 12 | 266 | 259 | 4 | 4 | 337 | 299 | 36 | 37 | 95 | 94 | 16 | 19 | 62 | 46 |
| Ad Dawhah | 25°18’ | 51°31’ | 32 | 37 | 51 | 52 | 11 | 14 | 82 | 76 | 36 | 36 | 72 | 71 | 16 | 16 | 28 | 27 |
| Ras Laffan | 25°54’ | 51°35’ | 38 | 36 | 37 | 28 | 11 | 13 | 76 | 62 | 25 | 23 | 53 | 65 | 12 | 10 | 0 | 20 |
| Jabal Fuwairat | 26°03’ | 51°22’ | 42 | 45 | 44 | 34 | 13 | 15 | 88 | 77 | 20 | 18 | 54 | 58 | 9 | 7 | 0 | 8 |
| Sitra | 26°10’ | 50°40’ | 66 | 48 | 58 | 73 | 19 | 11 | 120 | 153 | 10 | 8 | 347 | 28 | 6 | 4 | 264 | 276 |
| Bharain | 26°22’ | 50°47’ | 63 | 53 | 54 | 59 | 20 | 13 | 102 | 127 | 9 | 7 | 10 | 14 | 7 | 5 | 268 | 263 |
| Khwar Fasht | 26°20’ | 50°26’ | 55 | 42 | 62 | 82 | 20 | 12 | 114 | 192 | 8 | 9 | 343 | 352 | 8 | 7 | 256 | 251 |
| Ras Tannurah | 26°39’ | 50°10’ | 60 | 53 | 42 | 70 | 20 | 16 | 98 | 175 | 14 | 14 | 294 | 318 | 12 | 11 | 238 | 227 |
| Ras al Qulay’ah | 26°52’ | 49°54’ | 48 | 45 | 36 | 61 | 16 | 15 | 93 | 155 | 18 | 17 | 274 | 298 | 10 | 13 | 218 | 221 |
| Berri | 27°13’ | 49°43’ | 44 | 41 | 37 | 59 | 16 | 13 | 107 | 146 | 17 | 18 | 273 | 287 | 14 | 14 | 227 | 217 |
| Ras al Mishaab | 28°07’ | 48°38’ | 25 | 25 | 276 | 266 | 8 | 7 | 335 | 317 | 38 | 37 | 259 | 264 | 21 | 21 | 221 | 222 |
| Jazh yeKhark | 29°19’ | 50°20’ | 36 | 39 | 149 | 153 | 13 | 14 | 196 | 206 | 39 | 39 | 233 | 232 | 26 | 24 | 192 | 192 |
| Bushehr | 28°54’ | 50°45’ | 34 | 37 | 110 | 111 | 12 | 13 | 160 | 162 | 31 | 33 | 227 | 222 | 20 | 21 | 189 | 184 |
| Lavar | 28°15’ | 51°16’ | 50 | 45 | 68 | 65 | 18 | 17 | 117 | 114 | 25 | 24 | 209 | 206 | 18 | 16 | 171 | 171 |
| Asalu | 27°28’ | 52°28’ | 51 | 44 | 19 | 18 | 17 | 17 | 57 | 59 | 24 | 19 | 115 | 108 | 12 | 9 | 89 | 78 |
| Jerirat Lavan | 26°48’ | 53°23’ | 30 | 33 | 335 | 331 | 12 | 12 | 10 | 8 | 29 | 30 | 94 | 95 | 15 | 16 | 55 | 57 |
| Jezirat Forur | 26°15’ | 54°31’ | 45 | 44 | 259 | 256 | 15 | 18 | 295 | 297 | 38 | 31 | 86 | 79 | 22 | 21 | 42 | 41 |
| Bandar Lengeh | 26°44’ | 54°53’ | 60 | 60 | 230 | 251 | 23 | 22 | 267 | 292 | 33 | 31 | 67 | 70 | 22 | 22 | 33 | 38 |
| Jezirat Tunbh | 26°16’ | 55°18’ | 59 | 60 | 232 | 226 | 20 | 21 | 269 | 266 | 29 | 26 | 66 | 62 | 19 | 20 | 39 | 31 |
| Henjam | 26°41’ | 55°54’ | 74 | 77 | 204 | 202 | 25 | 28 | 247 | 237 | 29 | 27 | 28 | 28 | 20 | 20 | 14 | 14 |
| Bandar Abbas | 27°11’ | 56°11’ | 100 | 88 | 197 | 203 | 36 | 32 | 229 | 238 | 34 | 31 | 11 | 18 | 21 | 21 | 3 | 10 |
Comparison of the modeled (Mod) and observed (Obs) tidal components (M2, S2, K1, and O1) amplitudes (Amp) and phases (Pha, GMT) at the coastal stations.
The equation includes the number of sea level stations (N) and the amplitudes and phases (A and g, respectively). The subscripts and indicate the modeled and observed harmonic constants. In general, the value of H quantifies the overall discrepancy between the model outputs and the observations; a higher H indicating poorer simulation results.
Table 2 lists the amplitude and phase correlations, their standard deviations, which indicate the discrepancies between simulated and observed values, and H values. Our model demonstrates a remarkable level of accuracy in replicating the semi-diurnal components M2 and S2. This is evident from the high correlation coefficients of the amplitudes and phases of M2, albeit a slightly lower value for the phase of S2. In addition, we note the relatively low values of H: 9.3 cm and 3.6 cm for M2 and S2, respectively. The standard deviations for amplitudes are 5.7 and 2.6, whereas for the phases, they are 12° and 64°. Similar comparisons were performed for the diurnal constituents K1 and O1, and most correlation coefficients exceeded 0.95, except for the amplitudes of K1. The H parameters for K1 and O1 are 6.1 and 2.1 cm, respectively, indicating a reasonably good reproduction of tidal signals. However, notably, the standard deviation of K1 is relatively high (29°). Some areas with relatively poor results are observed in the phases of S2 and the amplitude of K1, as detailed in Table 1, which provides a comprehensive breakdown of each value. Specifically, two stations, Ras Tannurah and Ras al Qulay’ah, exhibit phase differences of 80°for S2, and Khor Khwair shows a 12 cm deviation in the model results compared with a 21 cm deviation in the observation. These discrepancies contribute to relatively low correlation coefficients and high standard deviations in these cases.
Table 2
| M2 | S2 | K1 | O1 | ||
|---|---|---|---|---|---|
| Amplitude |
Corr
SD |
0.953 5.69 |
0.9651 2.57 |
0.865 3.88 |
0.963 1.53 |
| Phase |
Corr
SD |
0.993 12.14 |
0.836 64.04 |
0.957 29.34 |
0.997 7.83 |
| H (cm) | 9.322 | 3.678 | 6.106 | 2.067 | |
Correlation coefficient (Corr) and standard deviation (SD) values of the modeled and measured tidal amplitudes and phases at the coastal stations.
3.2 OTIS barotropic model data
The OTIS is a widely used tool for generating tidal forcing data for numerical studies on tides. It uses an efficient representative calculation scheme that serves as the basis for a practical and relocatable tidal data inversion package (Egbert et al., 1994; Egbert and Erofeeva, 2002). Herein, we compared the model results with barotropic tidal elevation data obtained from a high-resolution (1/60°) OTIS product for the Arabian Gulf and further explored the spatial distribution of tidal elevations in the region.
Figures 3 and 4 show comparisons of tidal elevation amplitudes (colored gradient) and phases (white curves) for the dominant semi-diurnal tidal components (M2, S2) and diurnal tidal components (K1, O1) between the OTIS (top panels) and the Arabian Gulf barotropic (middle panels) and baroclinic (bottom panels) models. A consistent pattern is shown for both barotropic and baroclinic models and OTIS data: both semi-diurnal (M2, S2) and diurnal (K1, O1) tidal components are represented by anti-clockwise amphidromic systems. For M2 and S2, two amphidromic points are seen, with one in the middle of the northern Arabian Gulf, around 28.2°N, and the other at the coast of the southern shallow area. For K1 and O1, because of the relatively longer wavelength, only one amphidromic point is observed in the middle of the Gulf, near 27°N. For K1, the amplitude is also small near the southern coast at the entrance of the Gulf where it belongs to the other amphidromic system. Regarding the performance of the simulations, for M2 and S2, models reproduce the two amphidromic systems well, as seen from the comparison with the OTIS results, but the southern one is less consistent. The reason for the low consistency in the southern region could be the very shallow and complex bottom topography in this area, which makes the process in this area sensitive and difficult to simulate. The baroclinic model reproduces the results better than that of the barotropic model, especially in terms of the amplitude in the areas near both amphidromic points possibly because of the lack of mixing process caused by baroclinic tides. For the diurnal tidal components, both models show similar comparison results regarding the pattern of the amphidromic system and the tidal amplitudes. In a previous study of barotropic tide simulations in the Arabian Gulf using a 2D modeling system (Figure 2 in Pous et al. (2012)), the reported locations of amphidromic points that were more consistent with our model results, implying that high-resolution bottom topography is crucial for tide simulation in the Arabian Gulf.
Figure 3
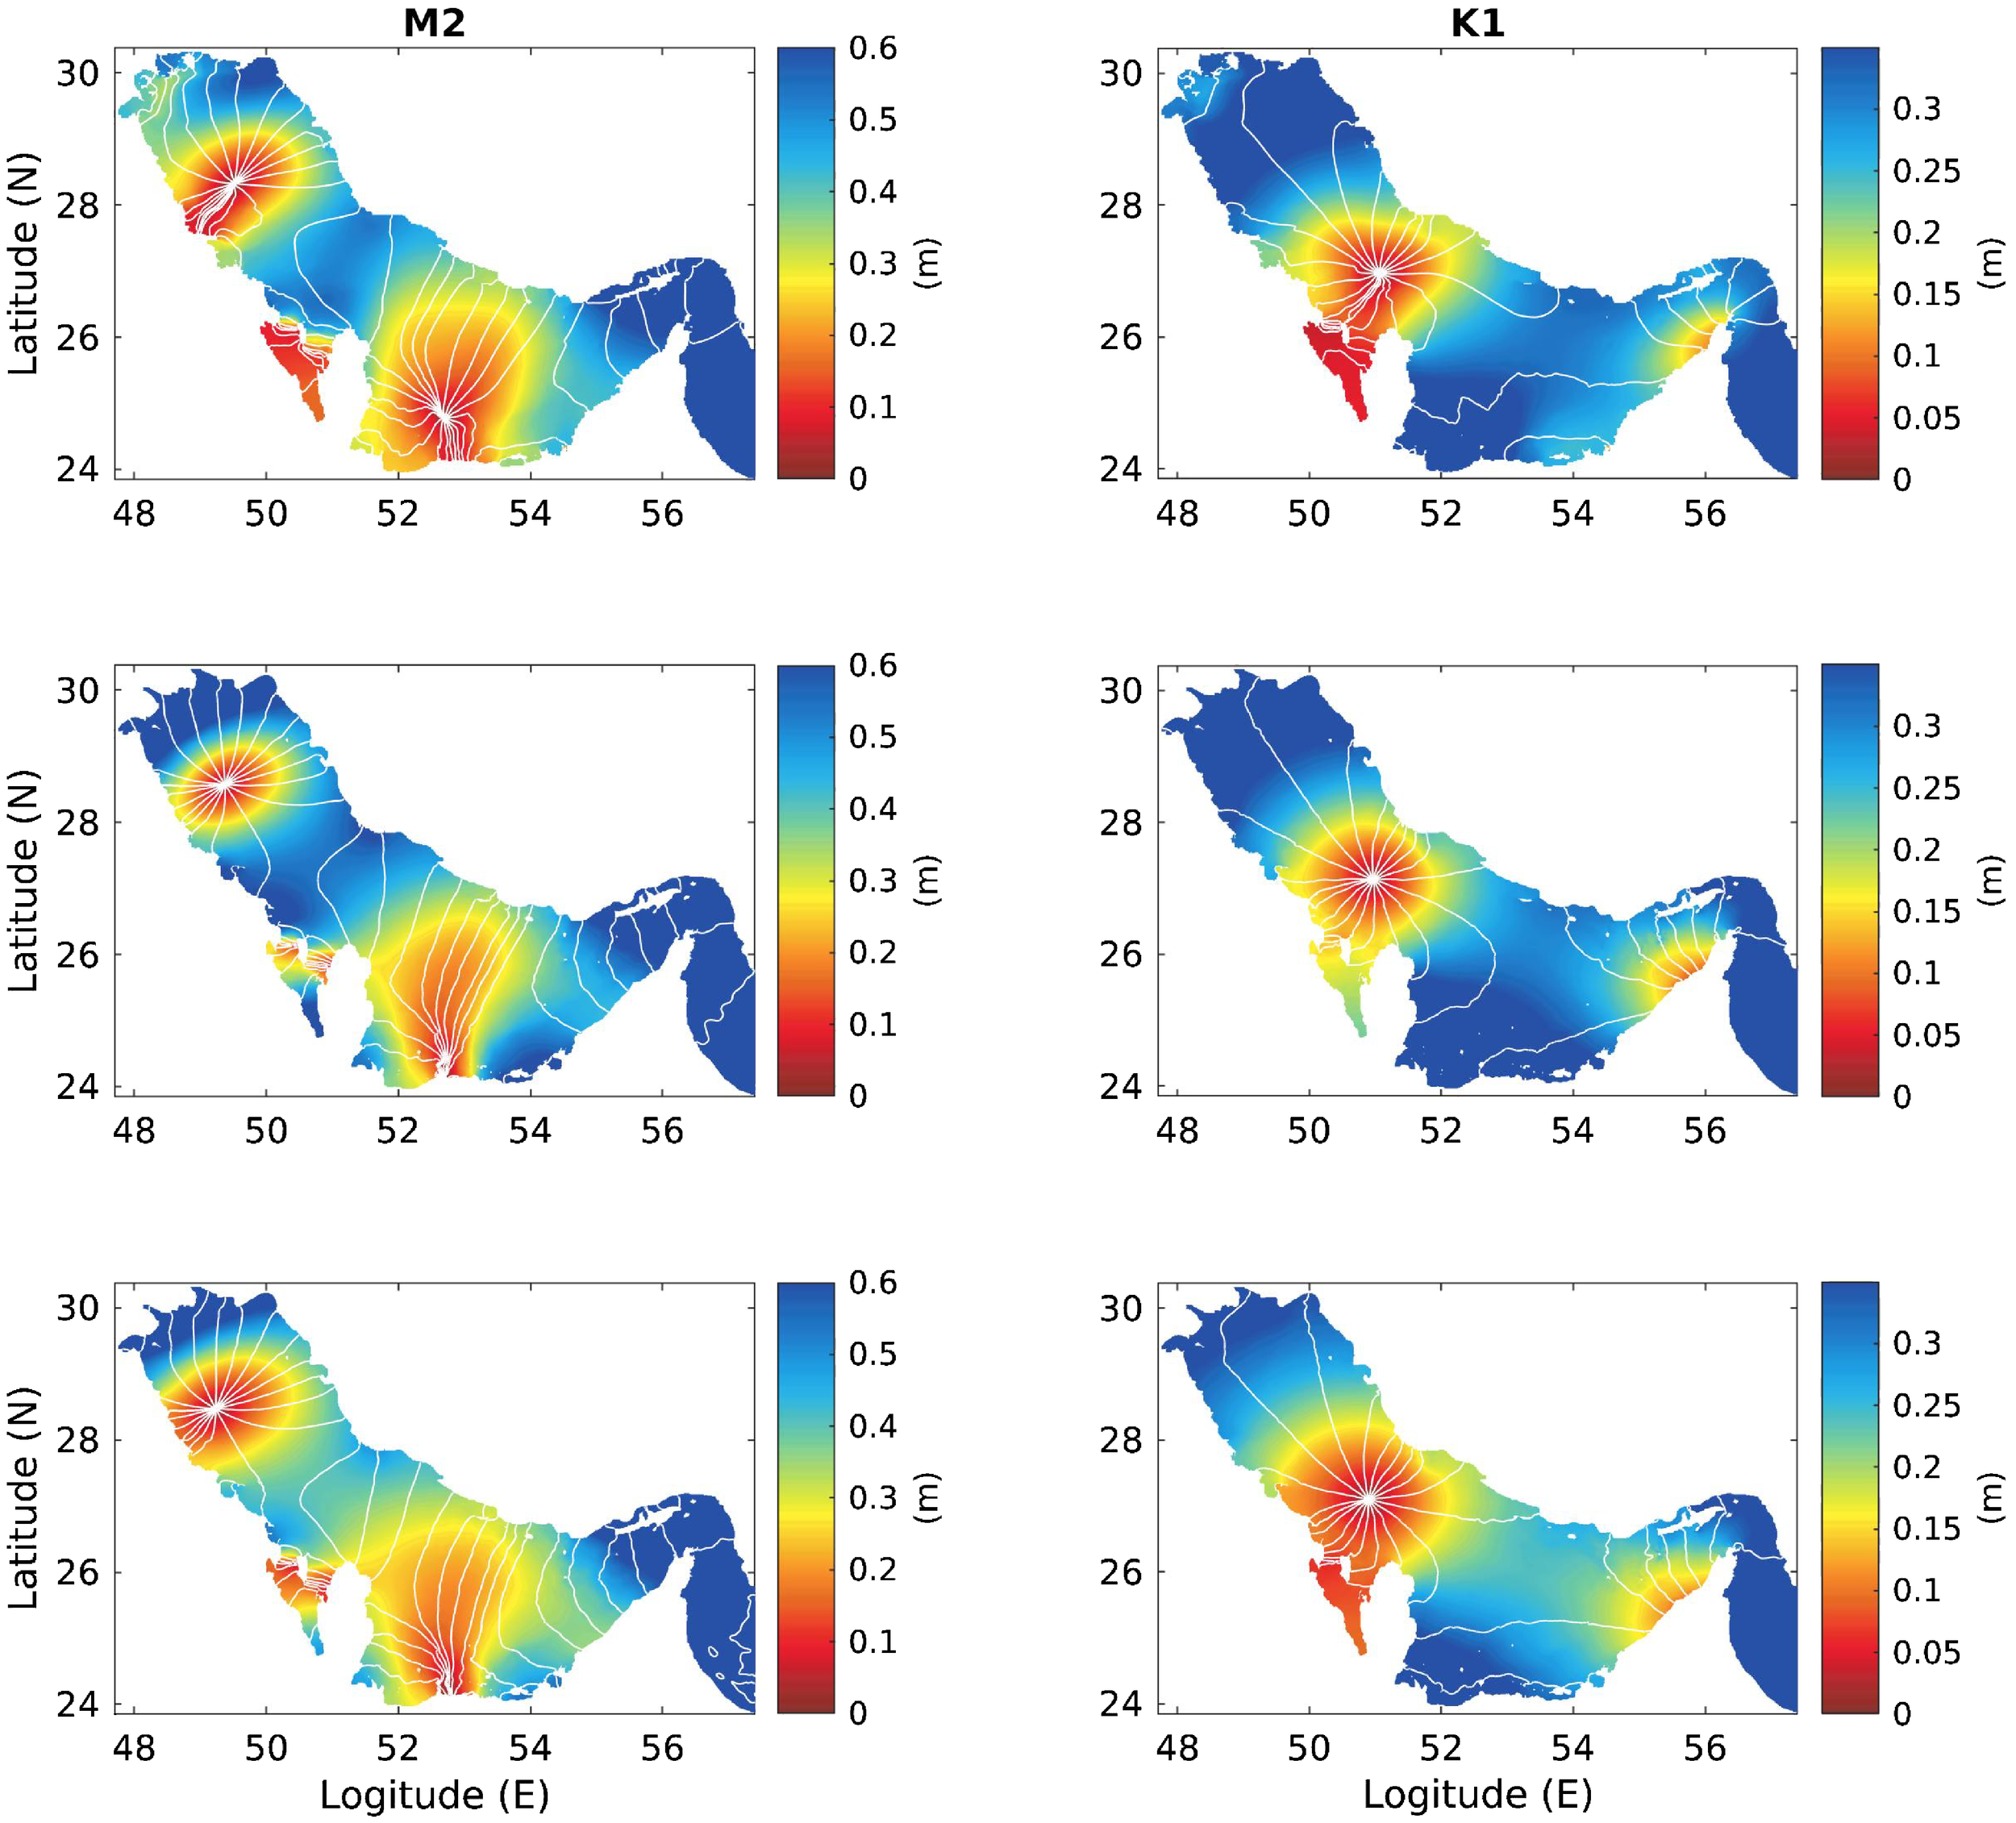
Comparisons of the co-amplitudes (colored gradient) and co-phases (white curves) for tidal components M2 and K1, from the top to the bottom, OTIS, barotropic model, and baroclinic model.
Figure 4
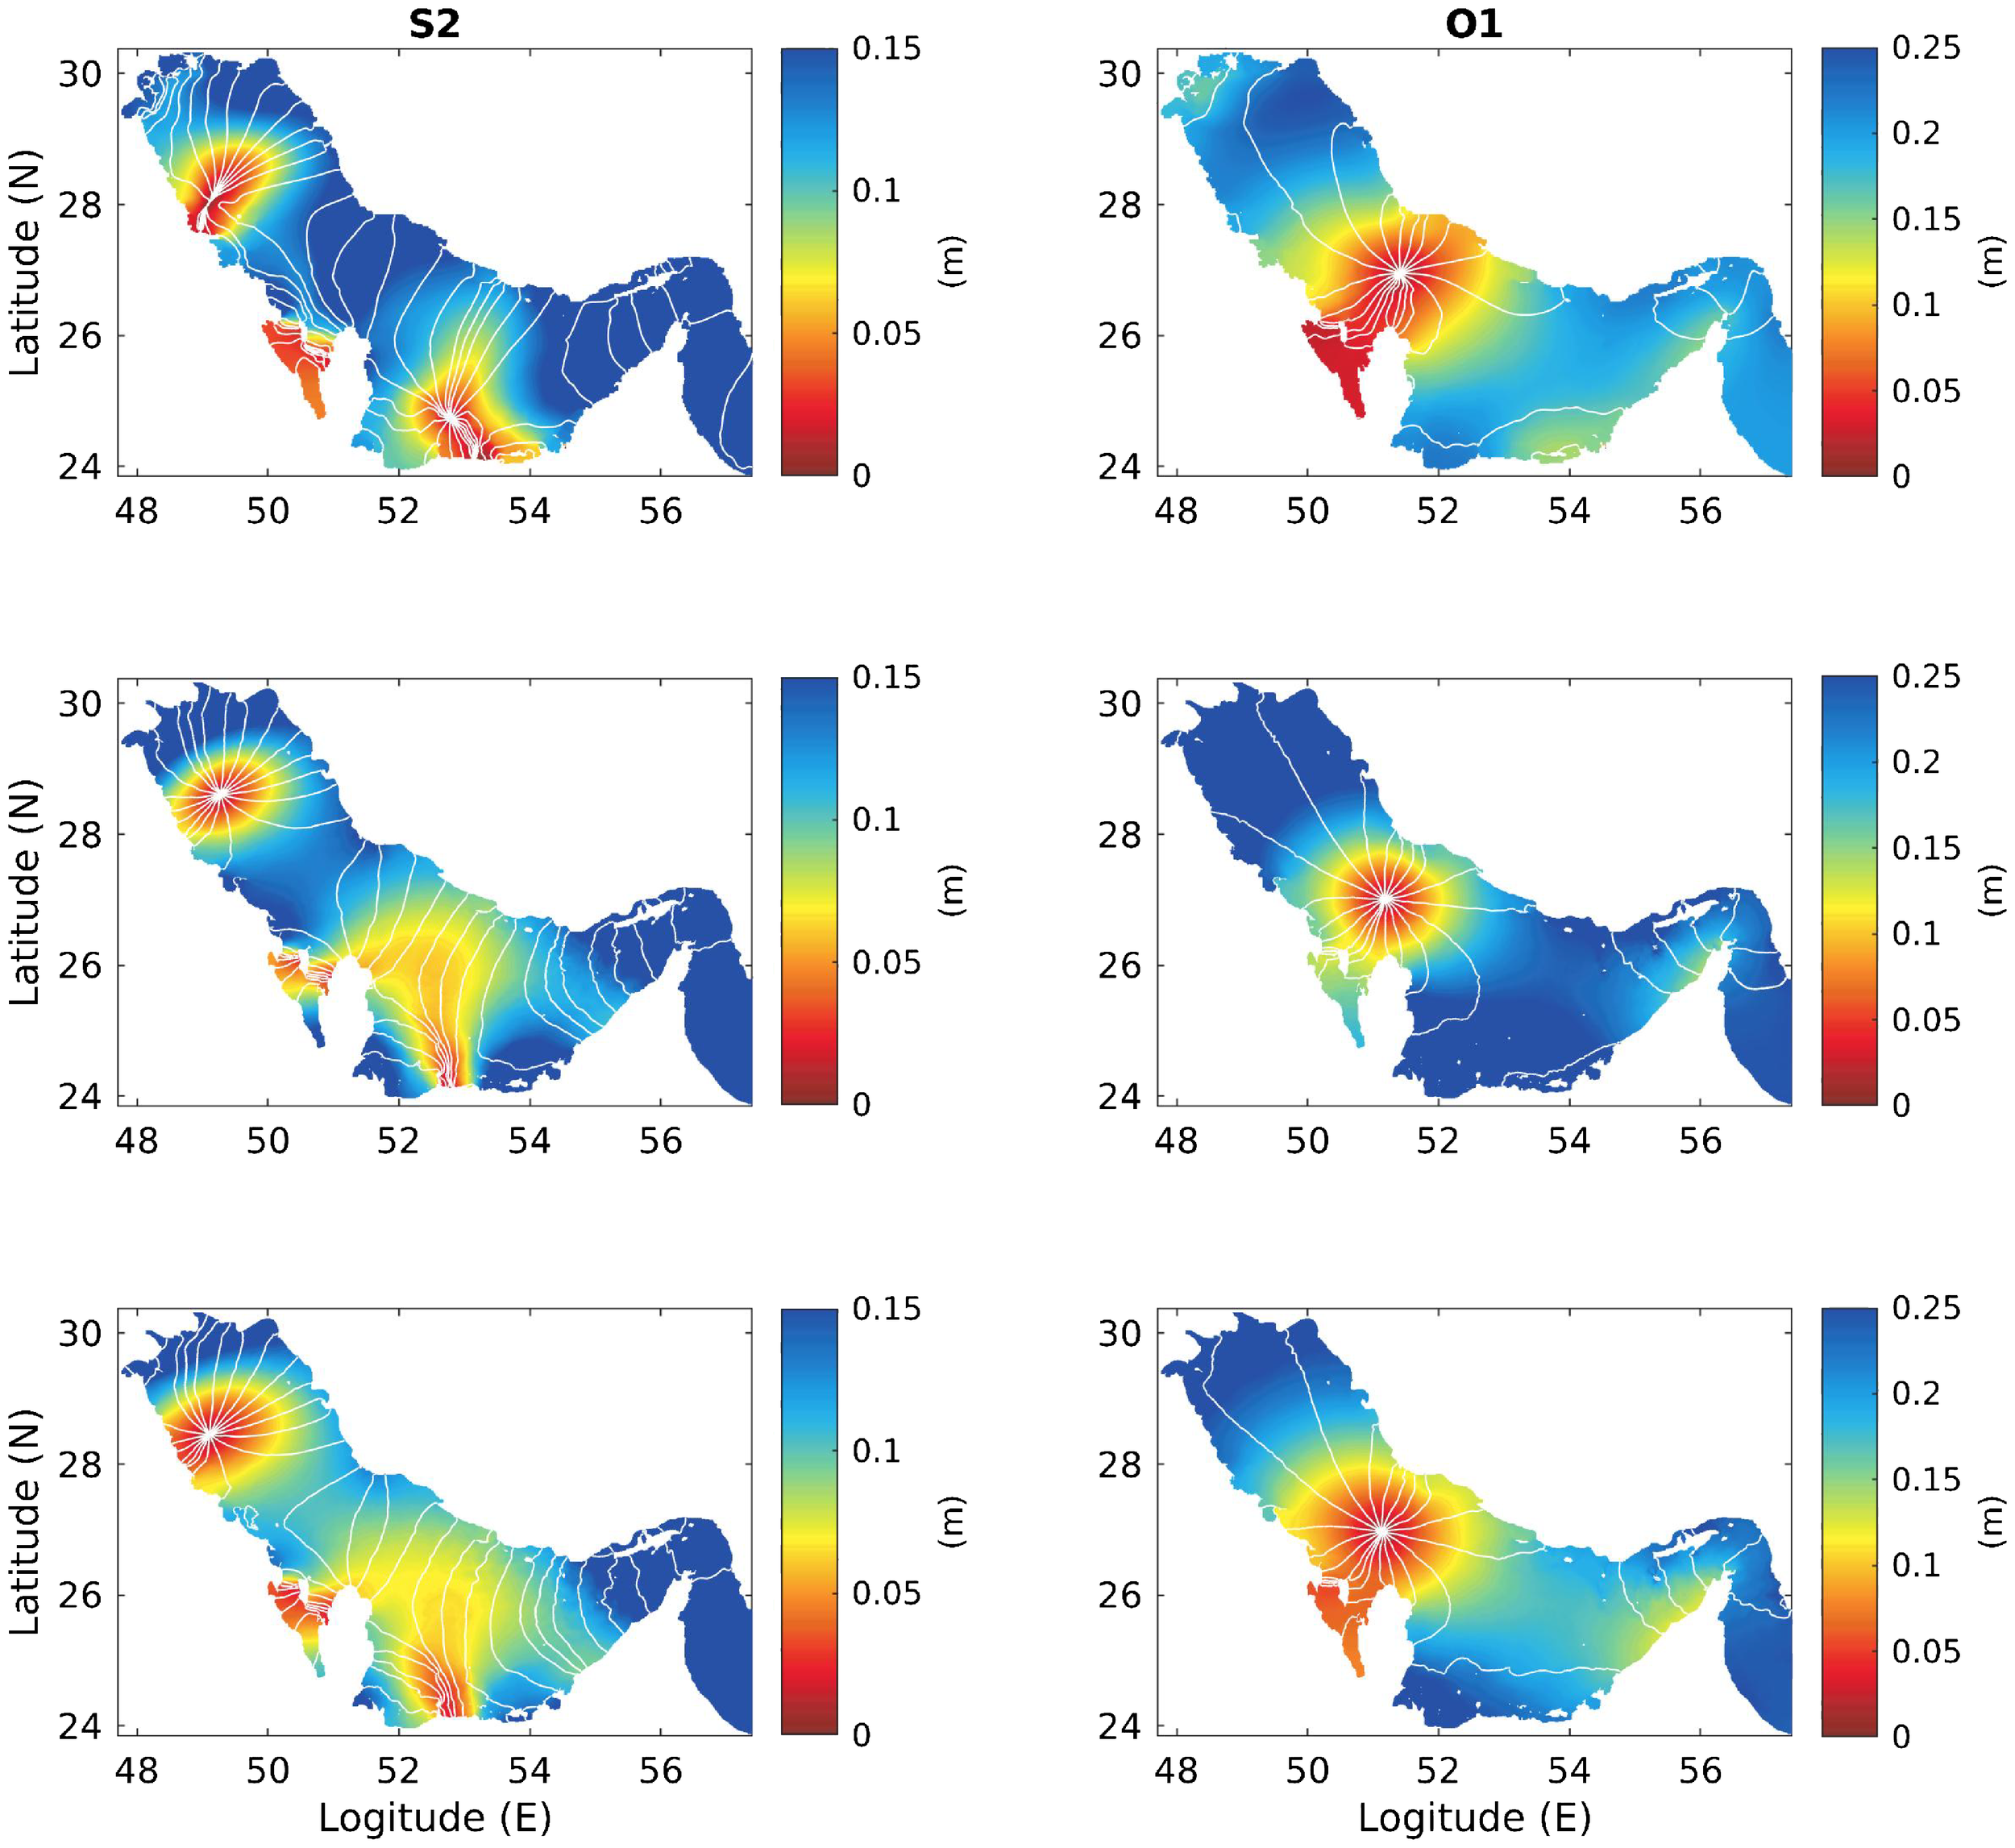
Comparisons of the co-amplitudes (colored gradient) and co-phases (white curves) for tidal components S2 and O1, from top to bottom, OTIS, barotropic model and baroclinic model results.
3.3 Tidal currents from mooring data
For a tidal model, accuracy in sea level elevation with respect to the observational data does not guarantee the accuracy of velocity data. Hence, velocity data were collected from the mooring observations to reveal the features of tidal velocities and to validate the model.
Figure 5 compares the tidal velocity ellipses corresponding to different depth levels in the model results and the mooring acoustic Doppler current profiler (ADCP) observations. The location of the mooring station is indicated with the solid red circle in Figure 1; the station is located in the Strait of Hormuz (Johns et al., 2003). These comparisons show good consistency between our model results and observations, featuring a pattern with the main direction along the strait and first two tidal components of M2 and K1 being dominant. For semi-diurnal tidal components M2 and S2, the comparisons are highly consistent in both modeled and observation-based tidal current directions and amplitudes are consistent, while the model overestimates the amplitudes of diurnal tidal components K1 and O1, especially at the surface (10 m) and near the bottom (70 m) compared with the observations. The orientation of tidal currents also varies more than that of the semi-diurnal tidal components, possibly because of its location close to the diurnal amphidromic point.
Figure 5
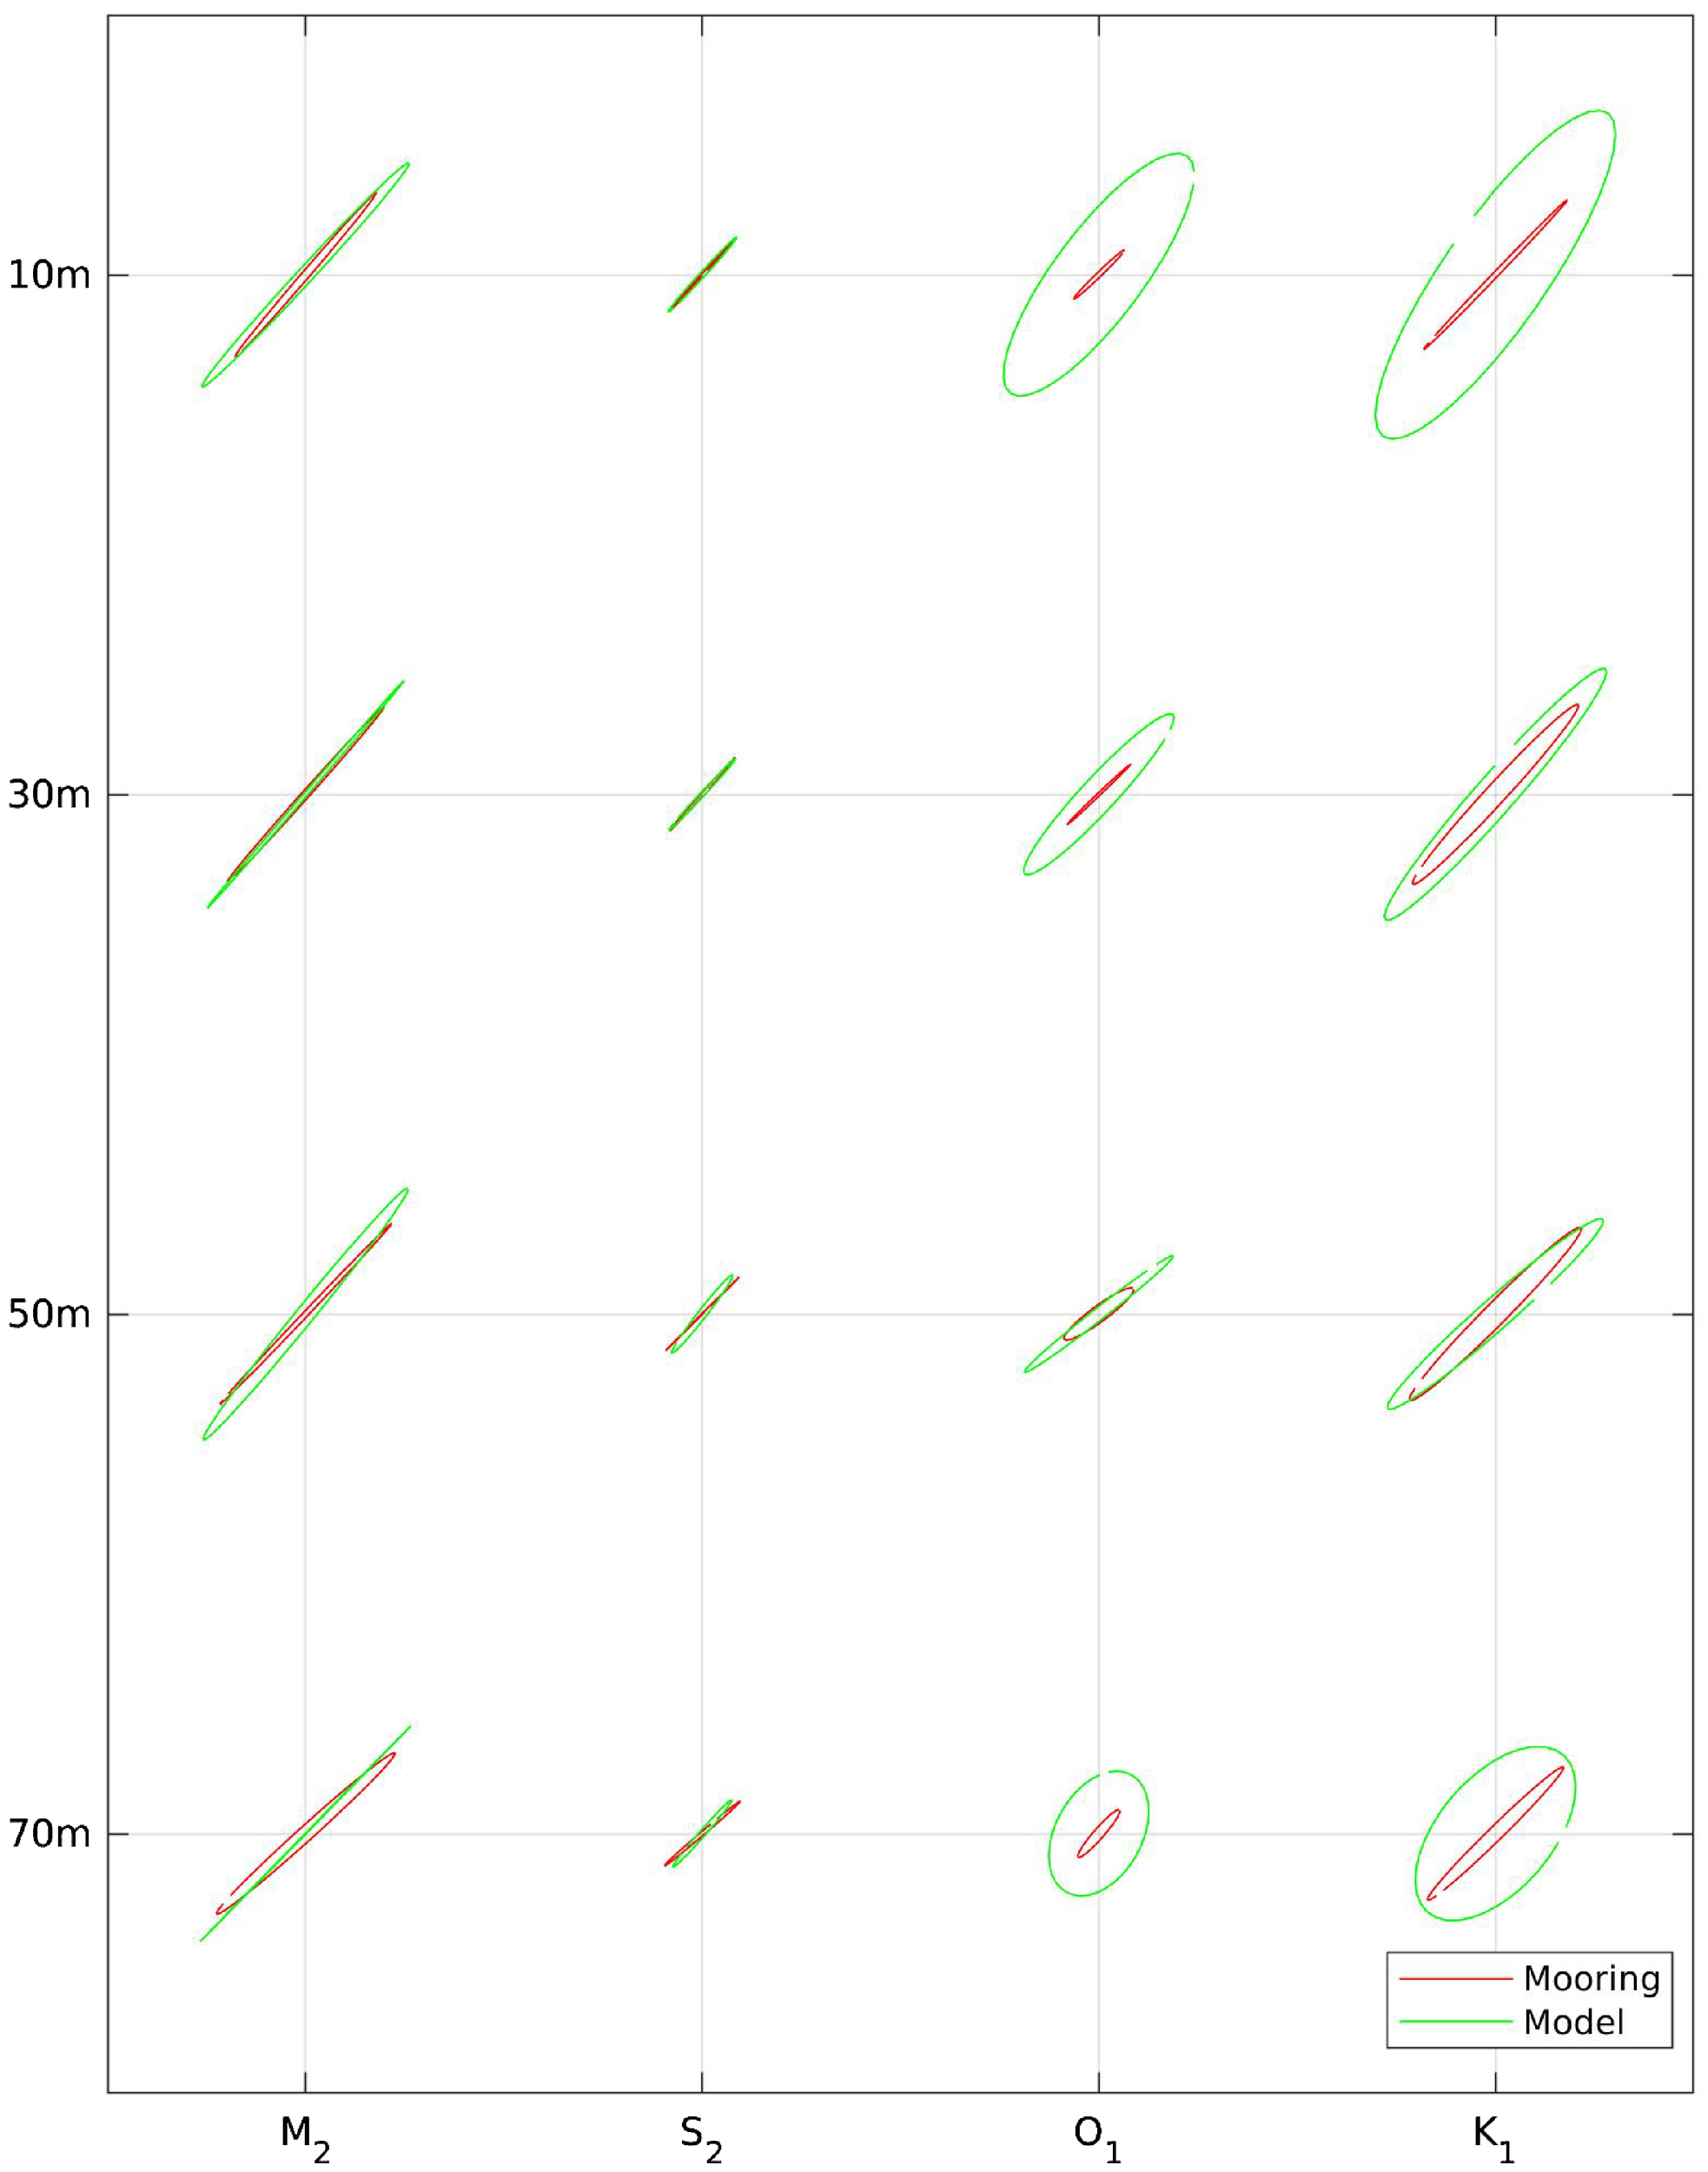
Comparisons of tidal velocity ellipses between the model results and moorings data.
4 Basic characteristics of tides in the Arabian Gulf
Based on the high-resolution model simulation results, the basic characteristics of the baroclinic tides based on the energy budget analysis and the associated properties of barotropic tides, including the spatial distribution of tidal form factors and tidal currents patterns, in the Arabian Gulf were investigated. The results are presented in the following subsections.
4.1 Barotropic tides
Based on the model results and the comparisons described in Section 3, a general structure can be observed of the barotropic tides in the Arabian Gulf: they feature anti-clockwise amphidromic systems as they enter the Gulf through the Strait of Hormuz, and then propagate northward along the right-hand coast and rotate anti-clockwise back when they reach the northern coastal boundary. The locations of amphidromic points vary according to the wavelengths of the different tidal components. In general, two amphidromic points are located in the middle northern gulf and southern coast area for semi-diurnal components such as M2, S2, N2 and K2, and only one amphidromic point at the central part of the Gulf for diurnal components such as K1, O1, Q1 and P1 (see Figures 3, 4). The spatial distributions of amphidromic systems are consistent with a previous study (Pous et al., 2012).
The relative importance of the diurnal and semi-diurnal tidal components is estimated by calculating the form factor, as follows (Pugh, 2004):
where , , and are the elevation amplitude for the main four tidal components. In terms of form factor (FF), the tides are classified as follows:
Figure 6 depicts the spatial distribution of these tidal components according to the FF based on the model results. It shows that in areas near the two amphidromic points of semi-diurnal tidal components, the diurnal tide (in yellow) dominates; in the outer rings, they are dominated by the mixed tides (light blue), mainly diurnal tidal components. The rest of the central gulf, most parts in the north, and the Strait of Hormuz show mixed tides of mainly semi-diurnal components (light blue). In the central part of the Gulf, near the amphidromic system of diurnal components, the semi-diurnal components are dominant. These results are also consistent with those of a previous study (Pous et al., 2012).
Figure 6
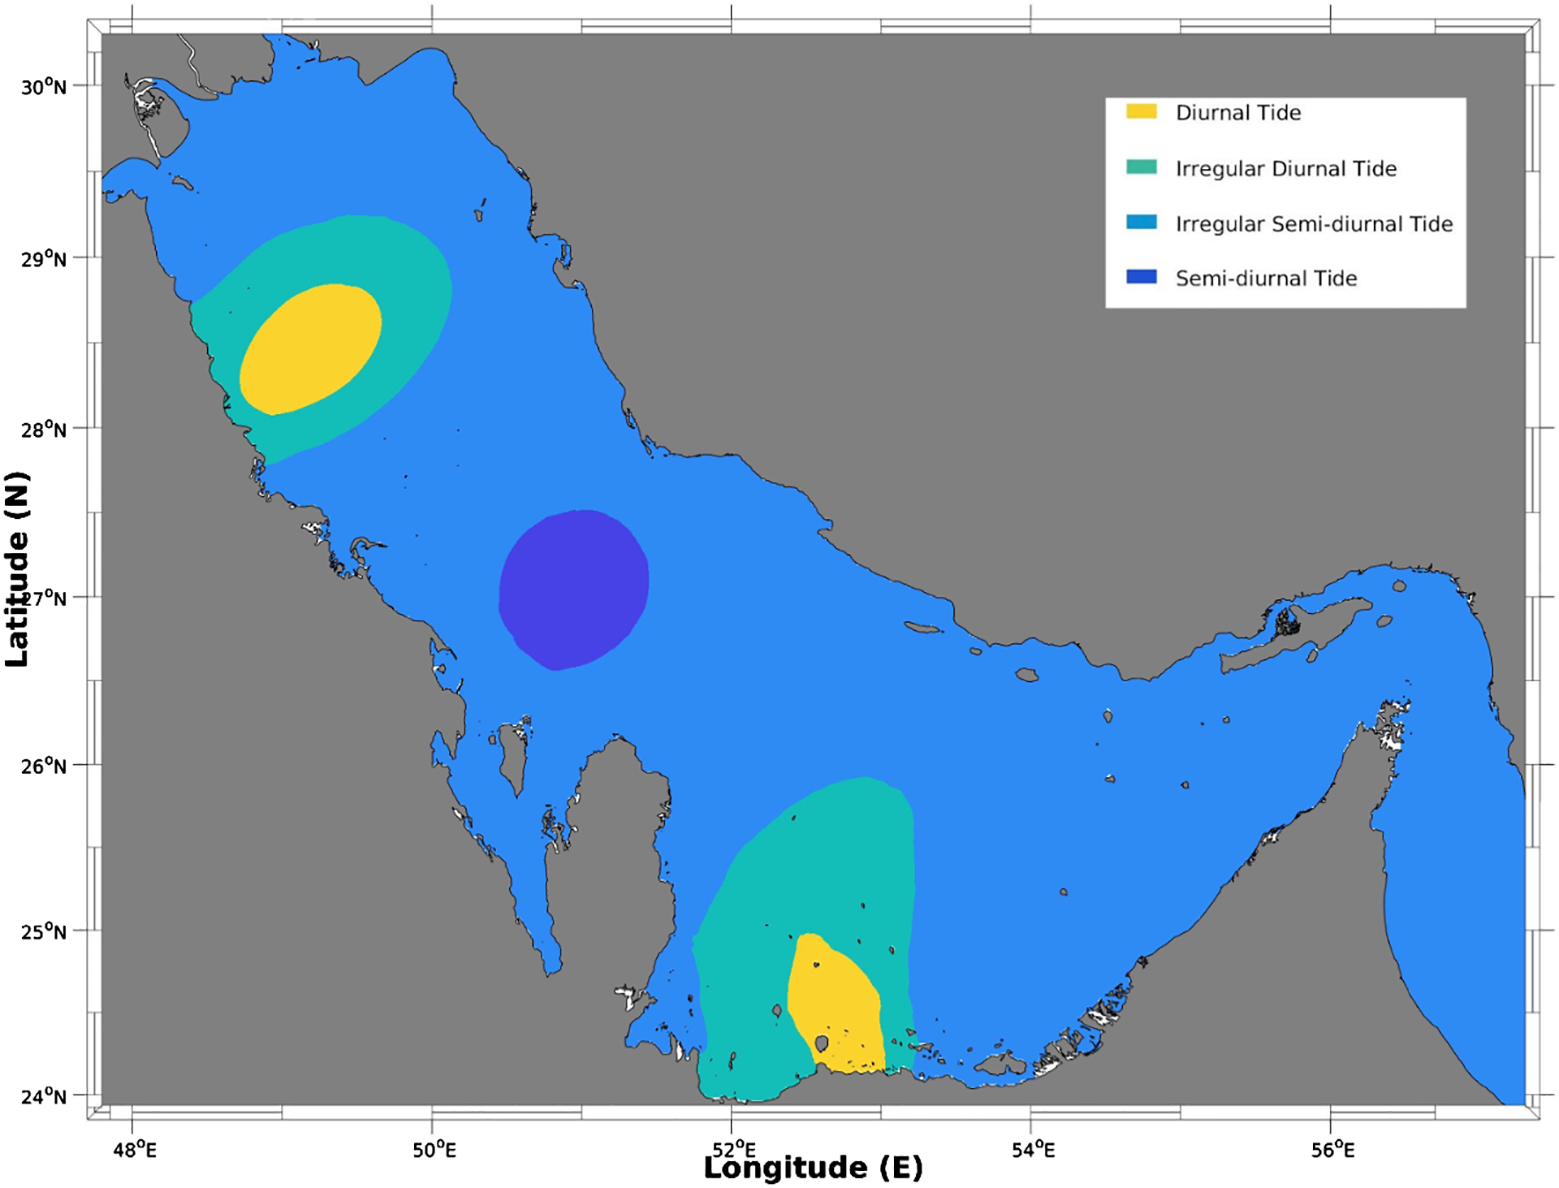
Spatial distribution of the tidal form factors (FF ≤ 0.25, Semi-diurnal tide; 0.25 < FF ≤ 1.50, Irregular semi-diurnal tide; 1.5 < FF ≤ 3.0, Irregular diurnal tide; FF > 3.0, Diurnal tide).
The properties of barotropic tidal velocity are crucial to explore the formation of baroclinic tides. The tidal velocity is more complex than the elevation as it not only follows the tidal elevation, but also is affected by the bottom topography, featuring more intensified velocities in the shallow areas. Figure 7 shows nine snapshots of barotropic tidal velocities in the Arabian Gulf in approximately one diurnal tidal period. Generally, large barotropic tidal velocities are observed in most parts of the Gulf in different snapshots as the average water depth is quite low and the bottom floor is relatively flat. The Strait of Hormuz remains the area featuring the most intensified tidal currents. Their periodic appearances are consistent with the local dominant tide form (Figure 6): mixed semi-diurnal for most of the Gulf, diurnal in the northern and southern areas and semi-diurnal in the central part. By examining the intensity distribution of the velocity, we analyzed the potential spots for the generation of baroclinic tides by introducing the forcing function (Baines, 1982):
Figure 7
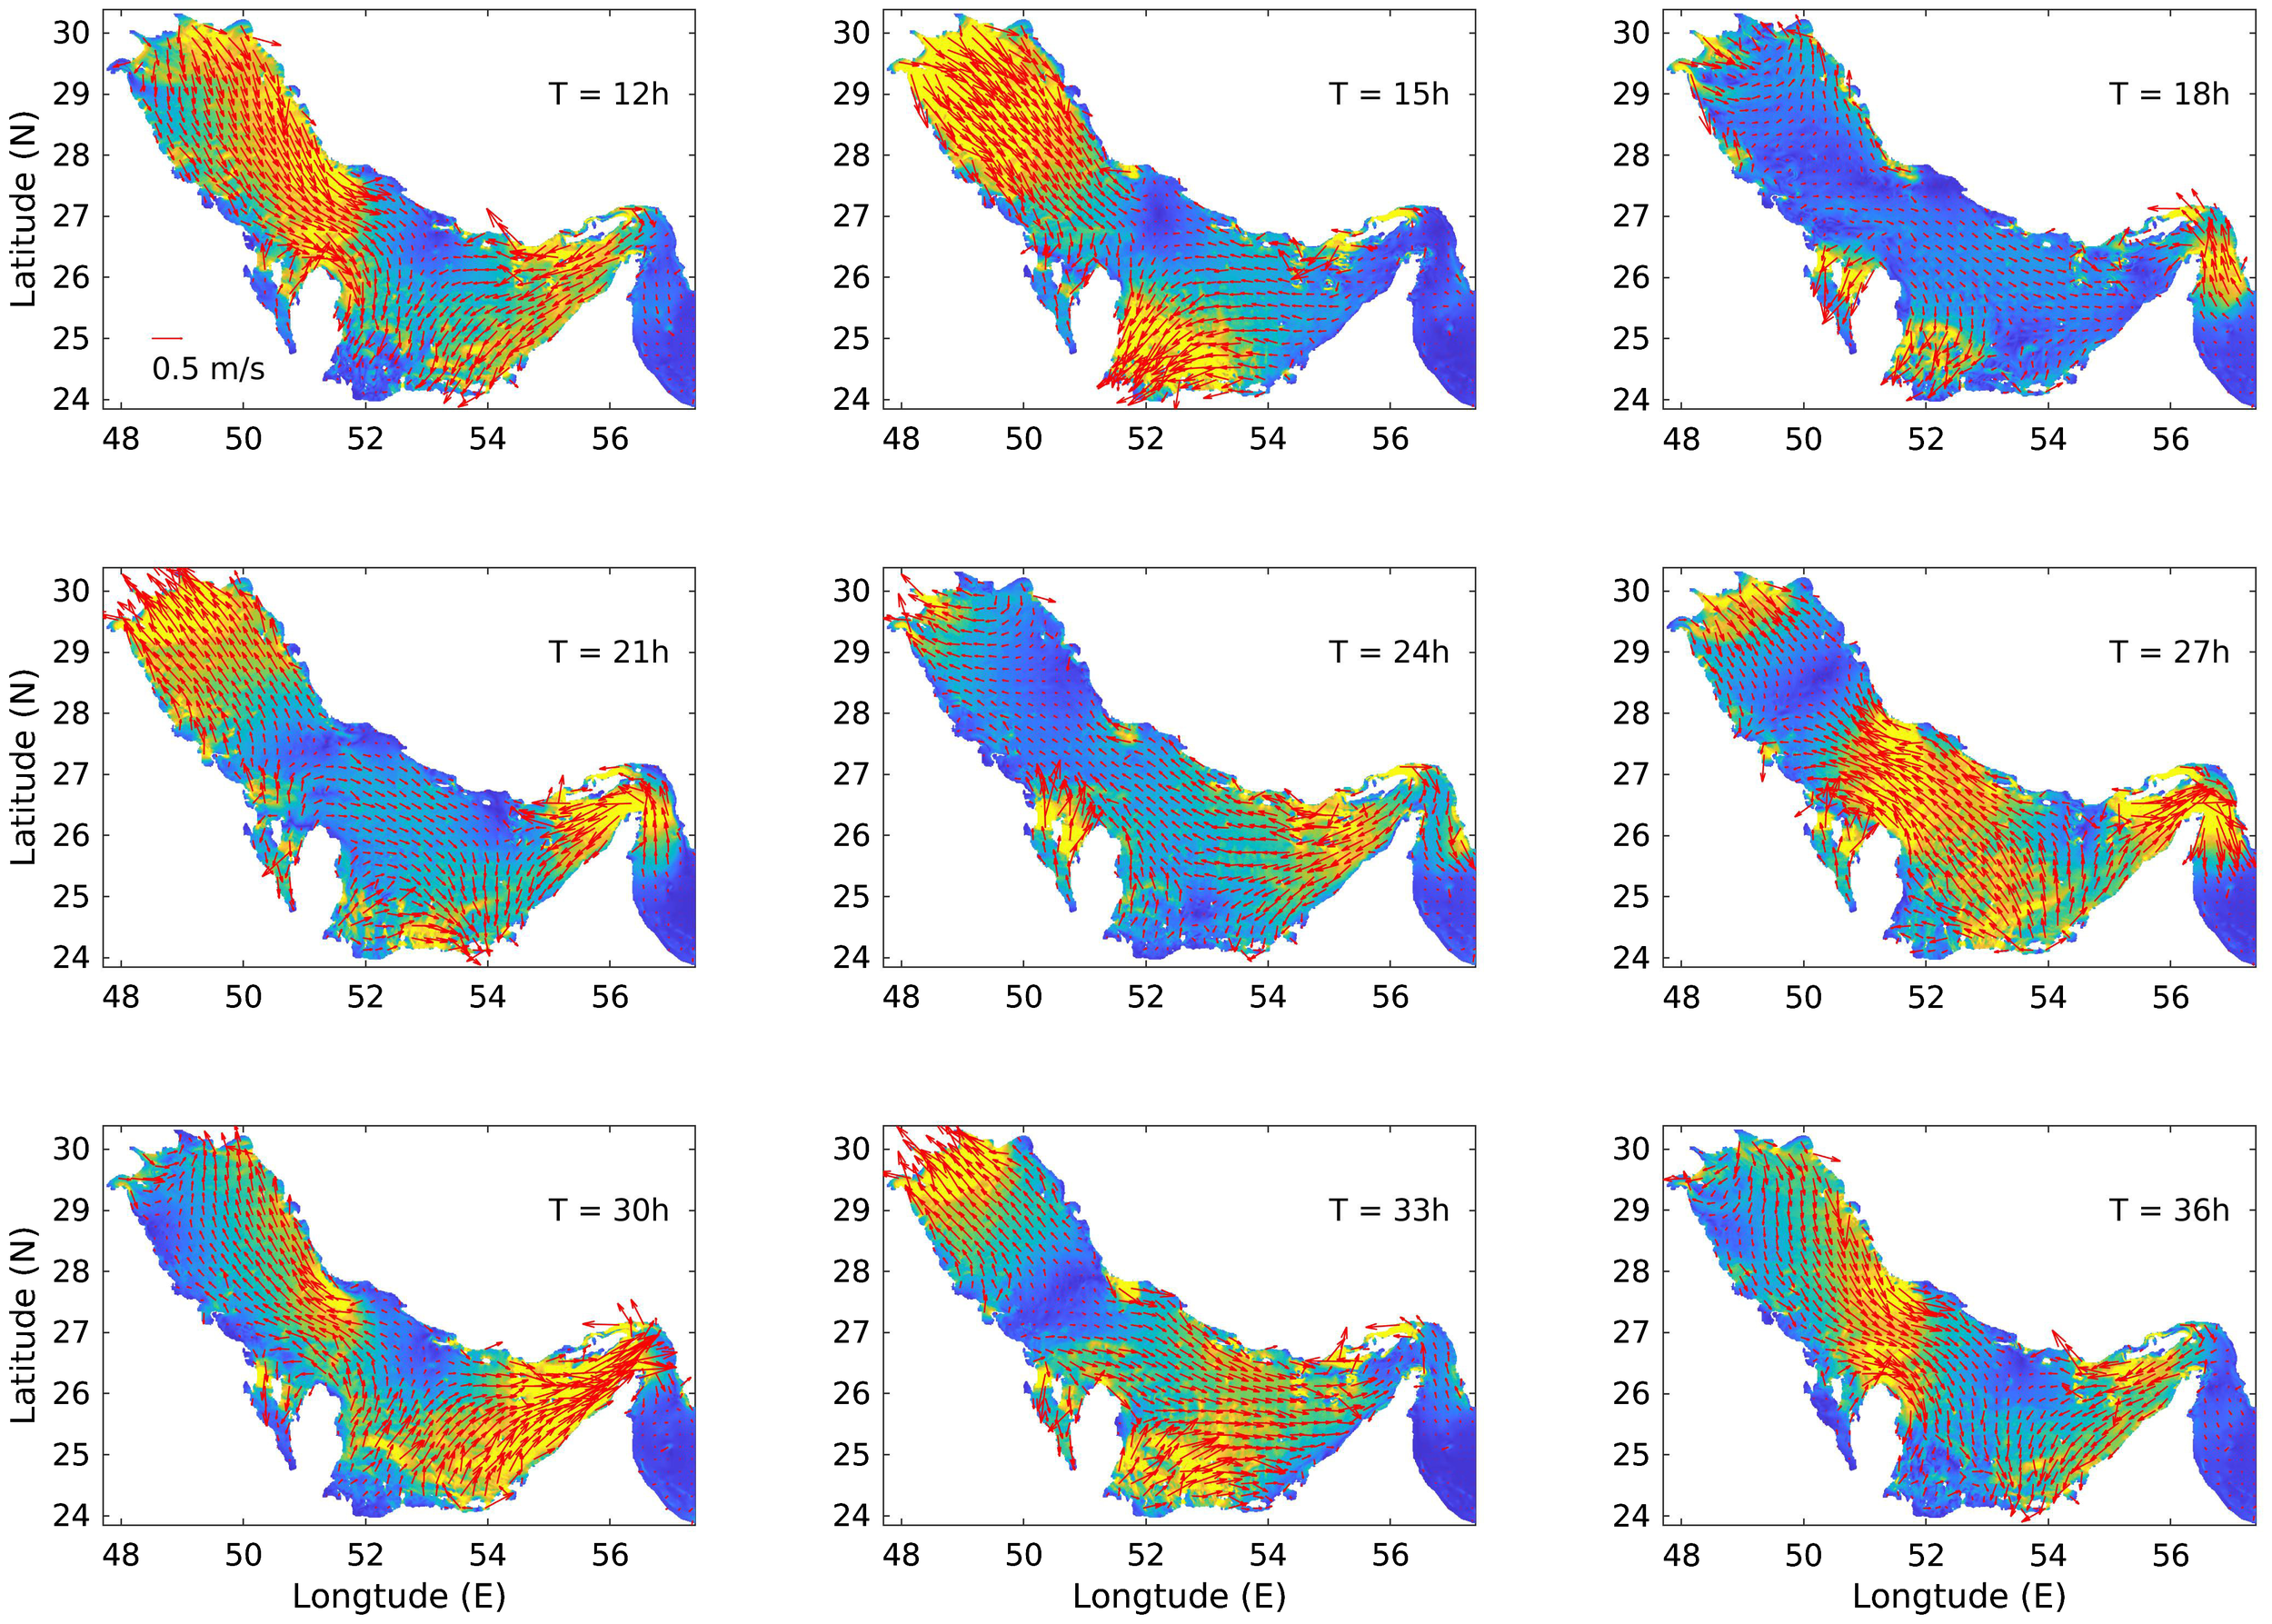
Barotropic tidal velocities in the Arabian Gulf at nice snapshots during one diurnal tidal period. The shading indicates the current intensity. The red arrows show the directions, and length of the arrows indicates amplitude.
where and are the bottom slopes in the x and y directions, respectively. The spatial distribution of the magnitude (absolute value) of the depth-integrated forcing function is shown in Figure 8. Large values appear along the entrance of the Gulf and are concentrated around the edges of slopes and several islands and sea ridges. These values reveal the areas in the Arabian Gulf with the most potential to generate baroclinic tides.
Figure 8
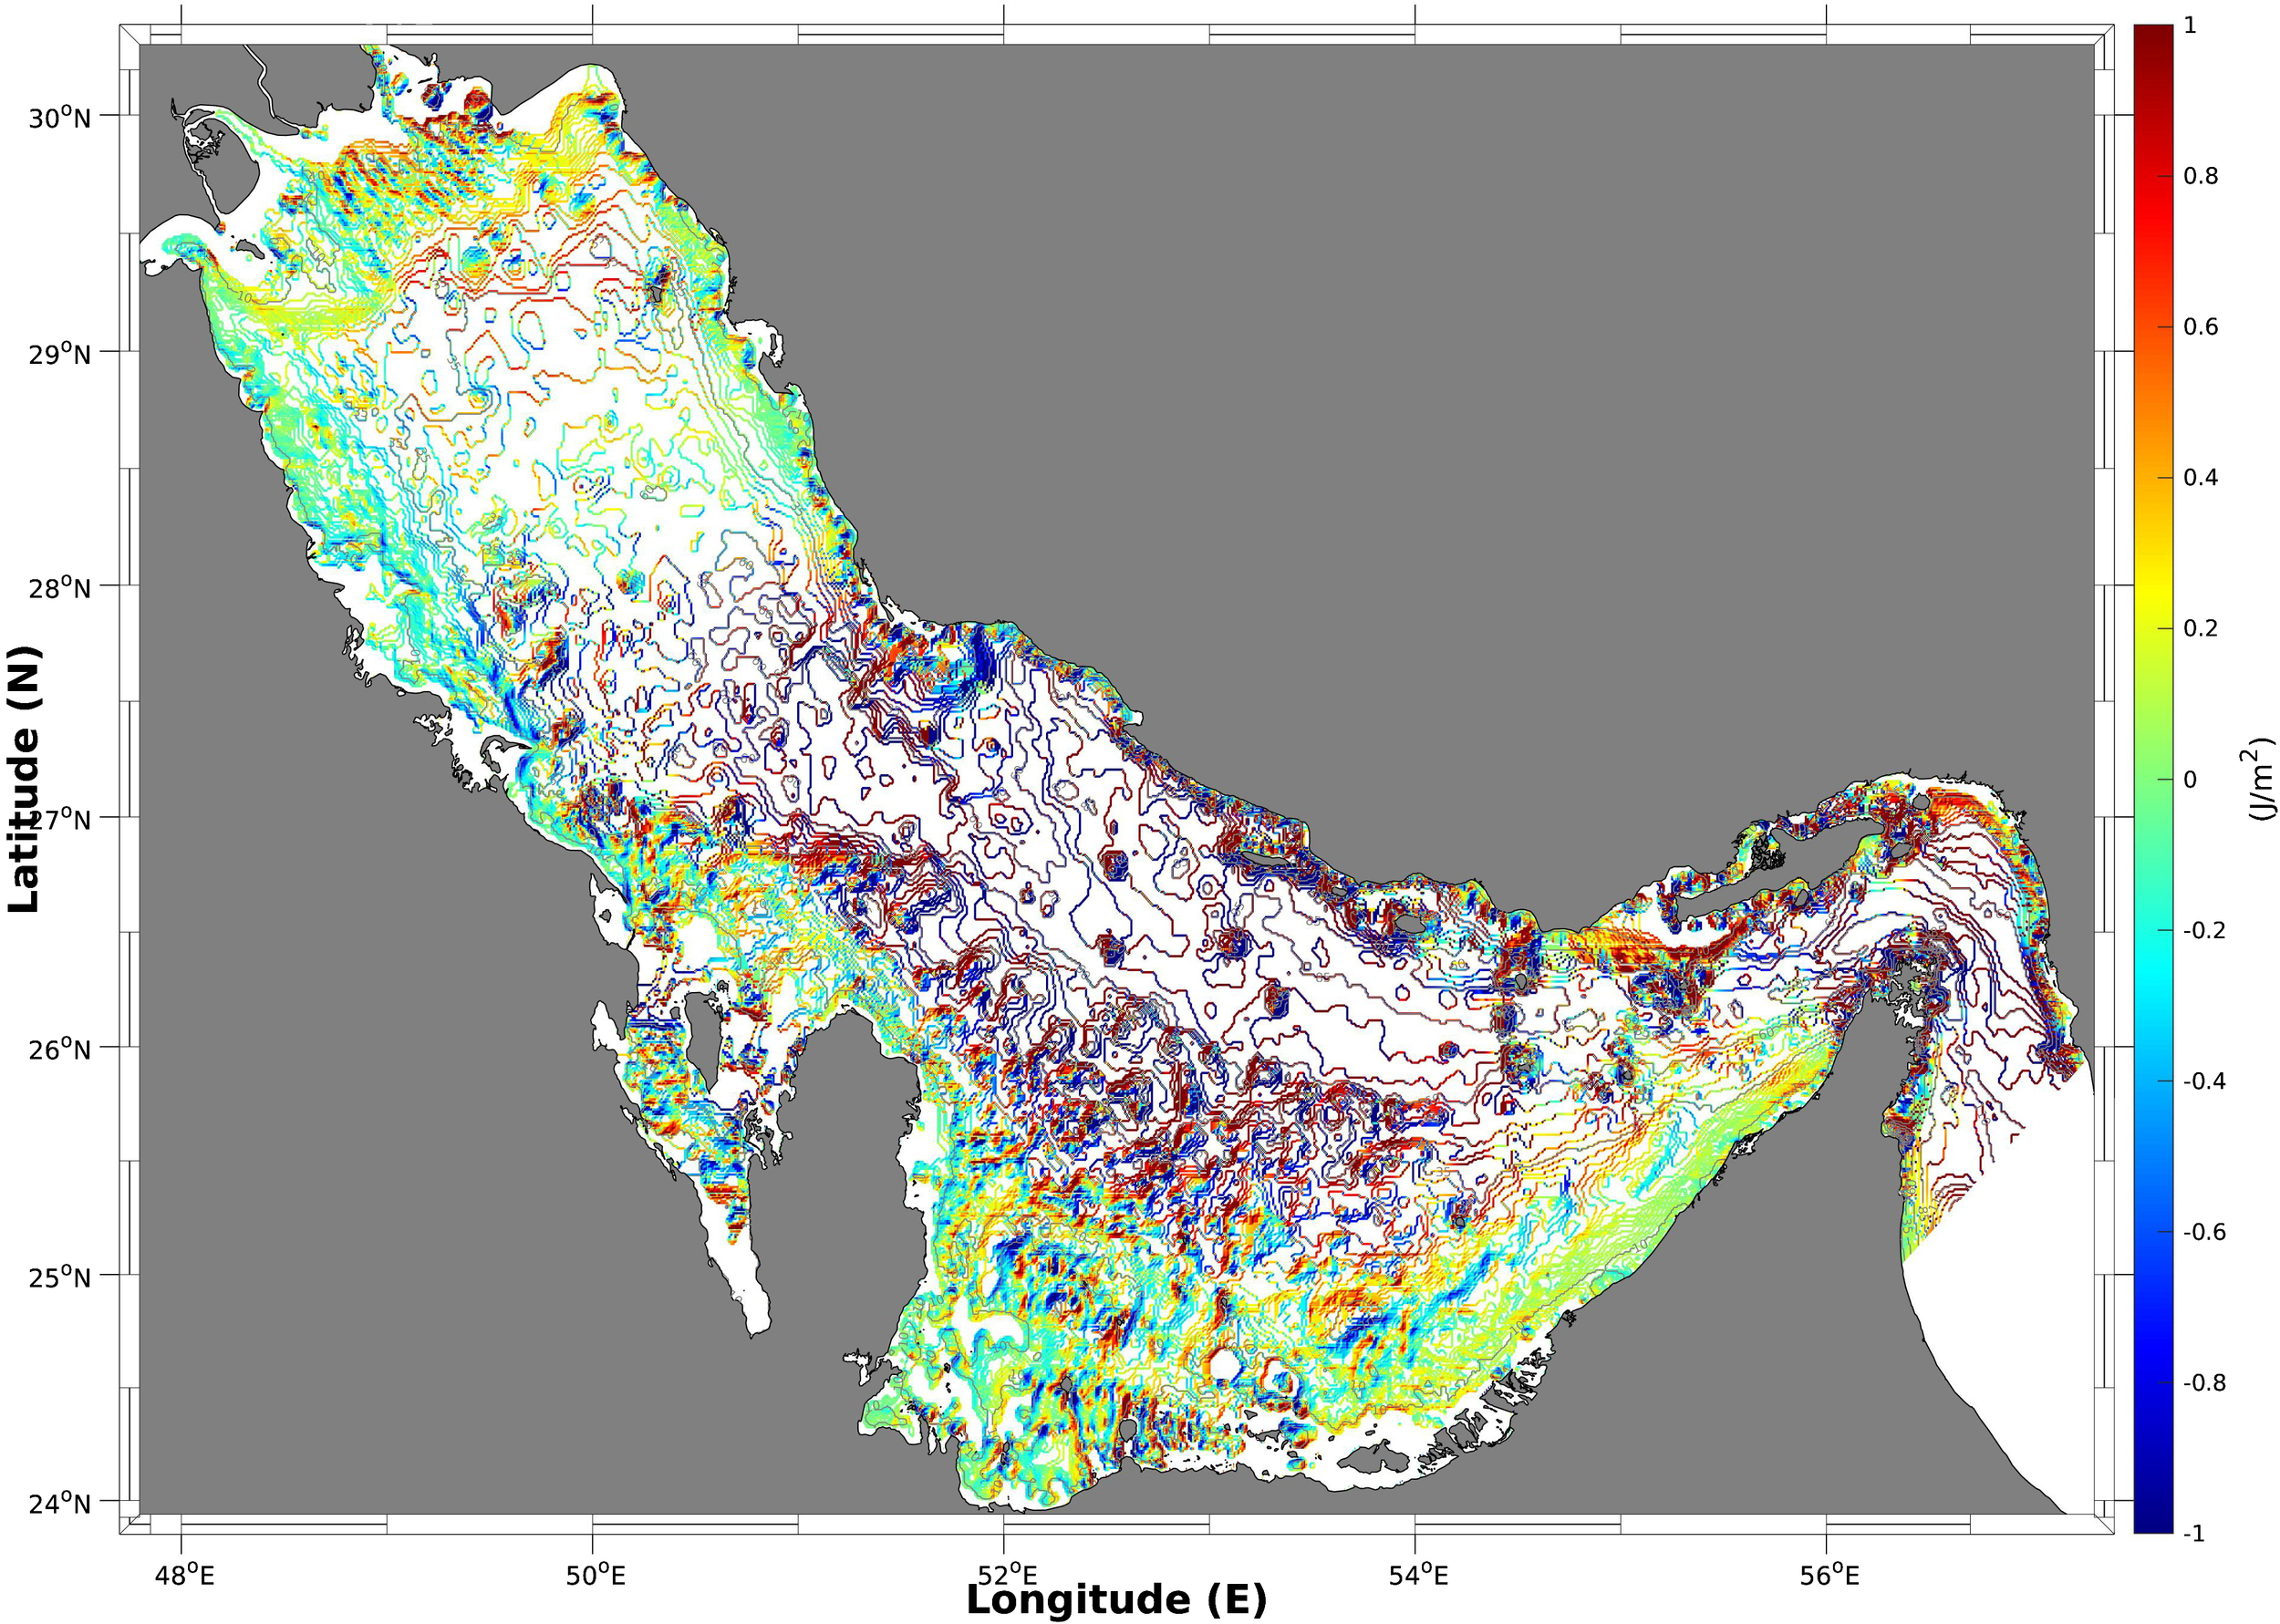
Spatial distribution of the magnitude (absolute value) of the depth-integrated forcing function .
4.2 Baroclinic tides
Given the constraints on accurately reproducing small-scale baroclinic processes, such as the nonlinear steepening and breaking of small-scale internal solitary waves, in the simulation, even with the current horizontal resolution set at 500 m, the analysis is directed toward revealing the broader perspective of baroclinic tides in the Arabian Gulf. This approach primarily relies on examining the energetics of the process. Following Niwa and Hibiya (2004) and Guo et al. (2018), the governing equation for depth-integrated baroclinic energy is
where the prime variables are baroclinic components; the overbar denotes the average over the entire water column; is the baroclinic energy density; is the displacement of the isopycnal surface; is the Cartesian vertical velocity associated with the barotropic flow; and denote the dissipation and advection of the baroclinic energy, respectively; D represents total depth, and P, the pressure; is the divergence of the depth-integrated baroclinic energy flux; and represents the rate of conversion from barotropic to baroclinic energy integrated over the entire water column. Here, the baroclinic tidal velocity and are defined as the difference between the total tidal velocity and the barotropic tidal velocity.
4.2.1 Baroclinic tidal kinetic energy
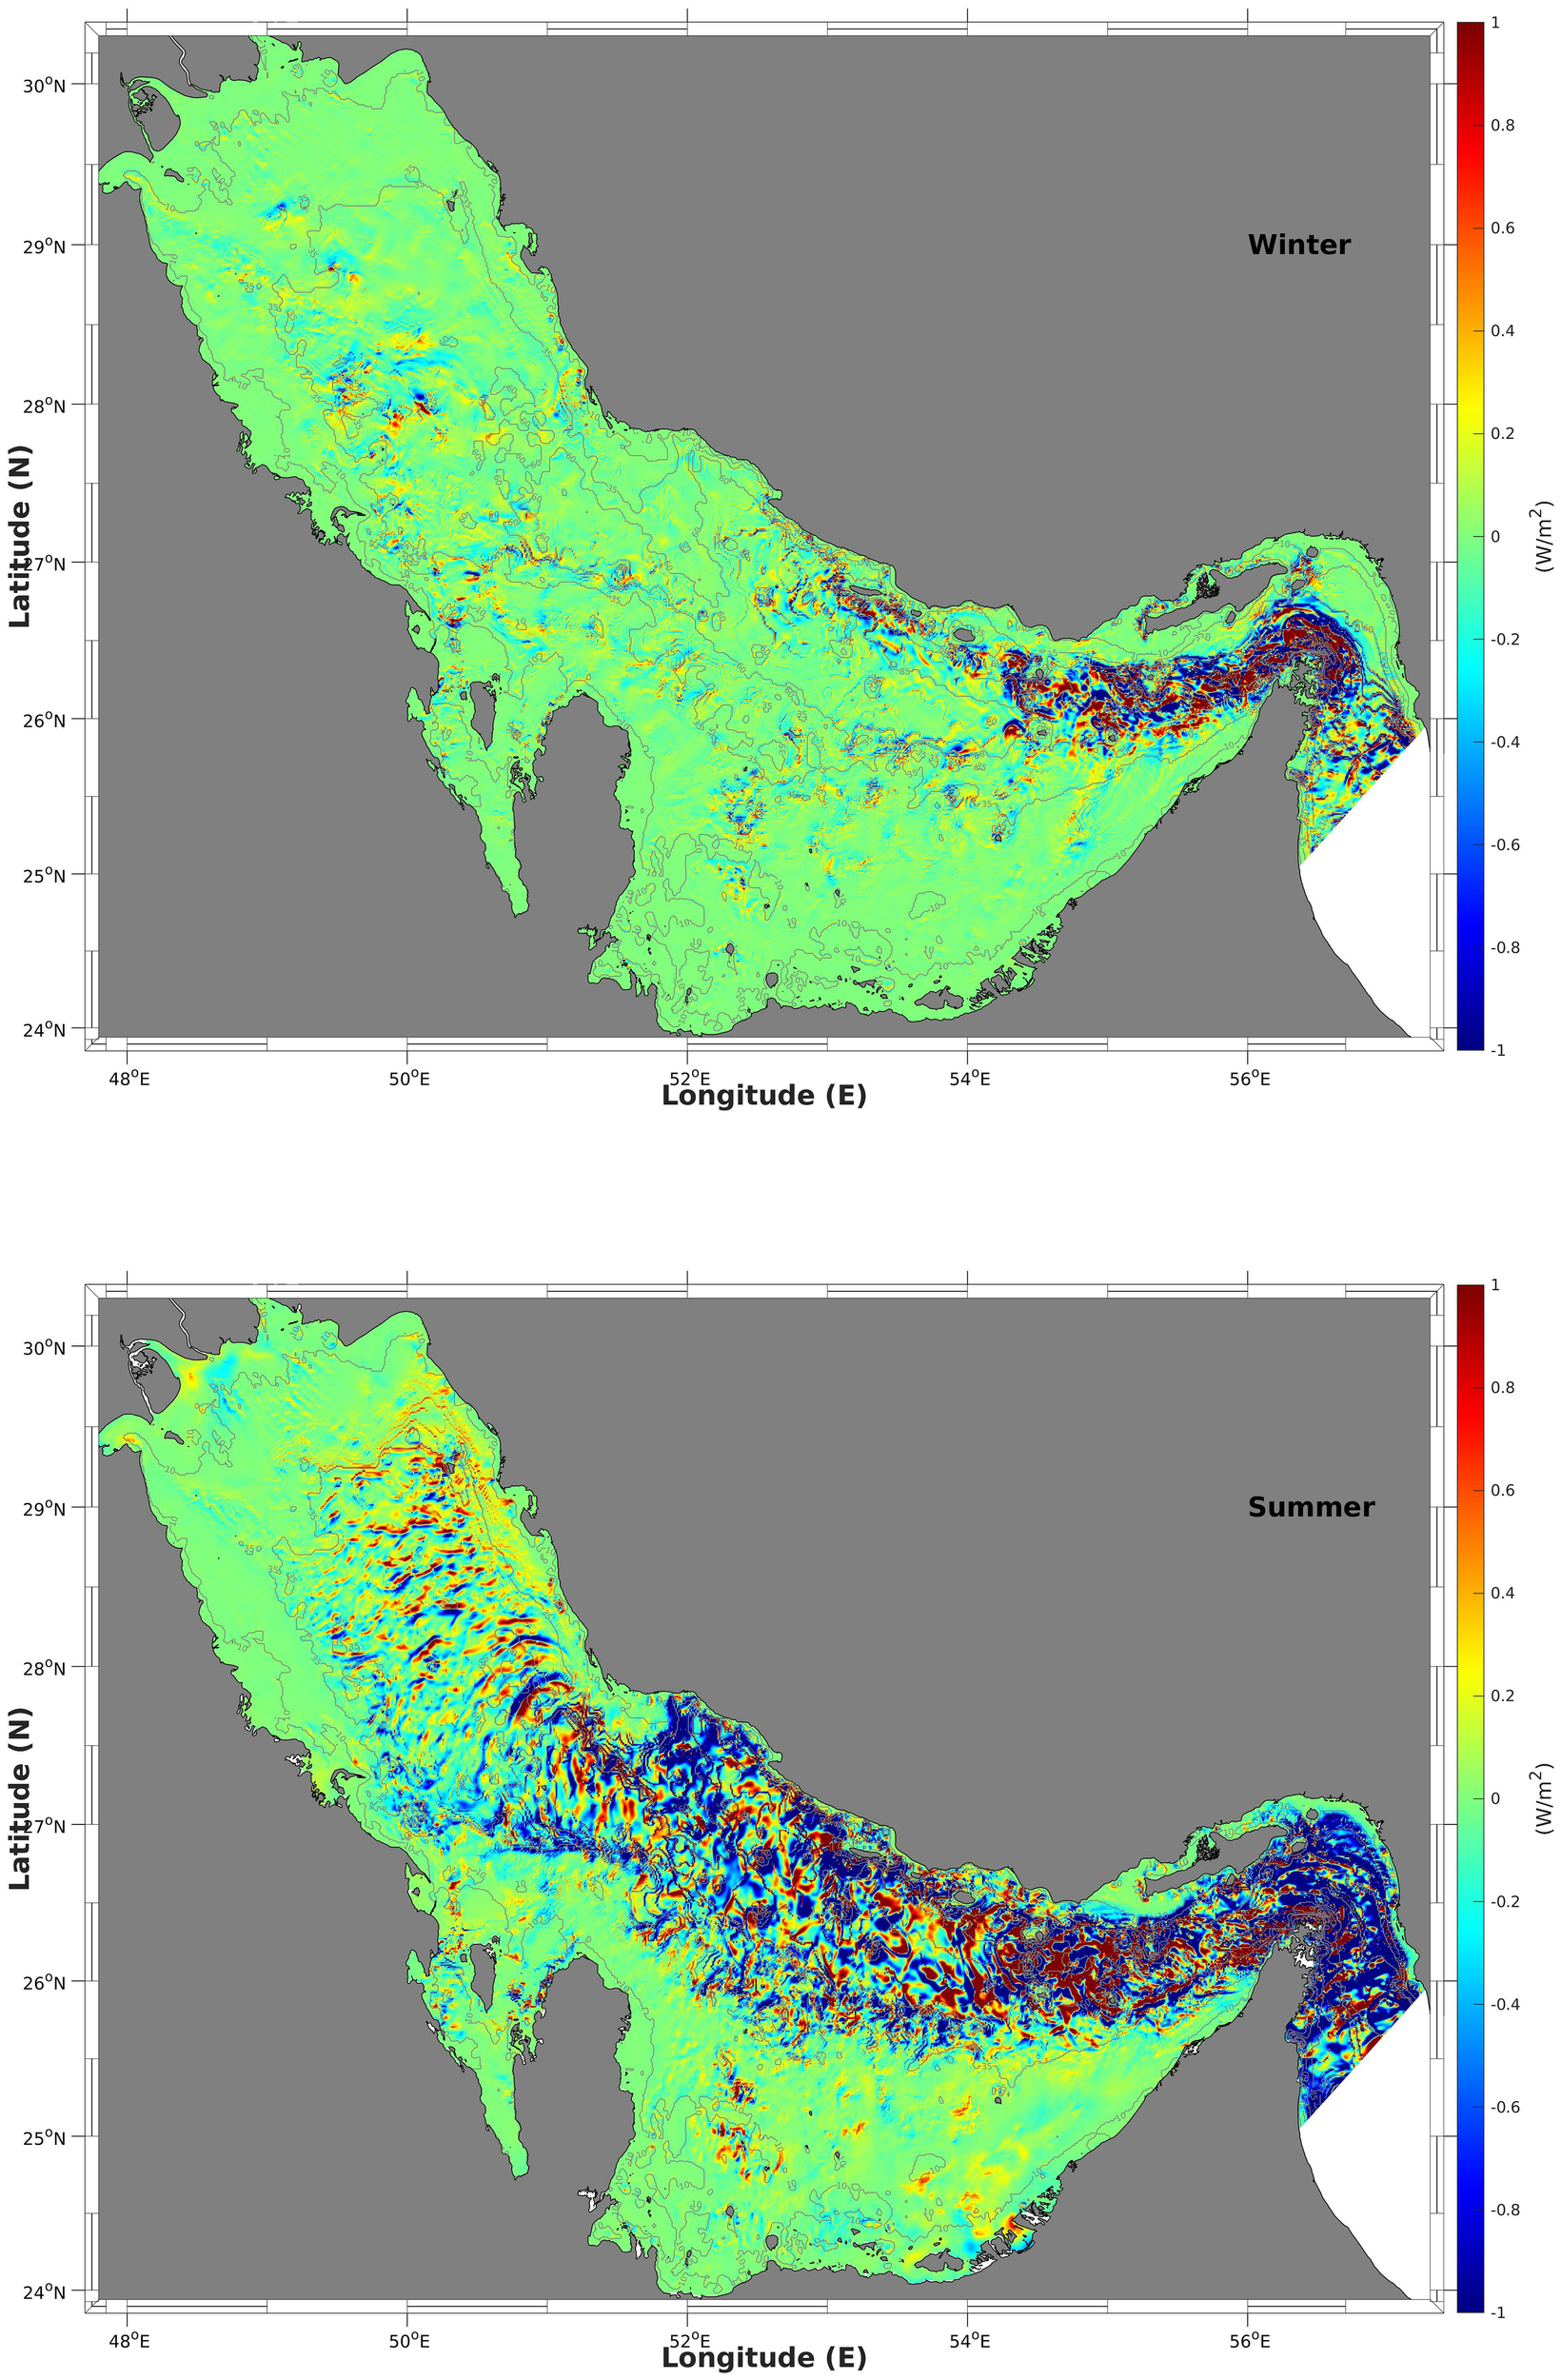
First, the depth-integrated baroclinic tidal kinetic energy (KE), represented as , was calculated using the simulation results. The spatial distribution of KE and the depth-average of KE for winter (top panels) and summer (bottom panels) are depicted in Figures 9 and 10, respectively. Hereafter, angle brackets refer to the time averaged value within 25 days. It consistently presents high values of KE within areas of potential barolinic tide generation indicated by the forcing function. For summer, four high intensity KE areas are revealed and indicated by solid rectangular boxes in Figure 9: (a) the narrow Strait of Hormuz; (b) the entrance along the trough with four main islands - Farur, Siri, Abumusa and Greater Tunb; (c) the central area along the trough with a few sea bottom ridges, and (d) the northern area after the secondary narrow part of the axial trough. These four main areas are also clearly depicted after depth-averaging in the panel depicting the summer conditions in Figure 10, with the large values closer to the complex bottom topography such as islands and sea ridges. This is reasonable as these large-gradient topographic features can create large disturbances of seawater stratification when interacting with intensified barotropic tidal currents. Among the four areas, the narrow entrance at the Strait of Hormuz features the highest KE values, with a maximum value of 5.2 kJ/m2 at the corner of the strait indicated by a solid red point. With regard to the seasonal comparison, in winter, only (a) the Strait of Hormuz and half of (b) the islands area present high values of baroclinic tidal KE, whereas the other two areas do not show any obvious baroclinic tides generated. The absence of these tides can be attributed to the well-mixed upper layer seawater in winter time (Figure 2), preventing the formation of disturbances along the thermocline plate. In a recent study on internal waves in the Arabian Gulf using satellite images by Andi et al. (2021), four areas of high occurrence of internal waves are revealed (Figure 4 of Andi et al. (2021)); these areas are consistent with the four areas revealed in our simulation results. Further, the seasonal occurrence of internal waves - high in summer but very low in winter - as reported in Andi et al. (2021) also matches our model outputs well.
Figure 9
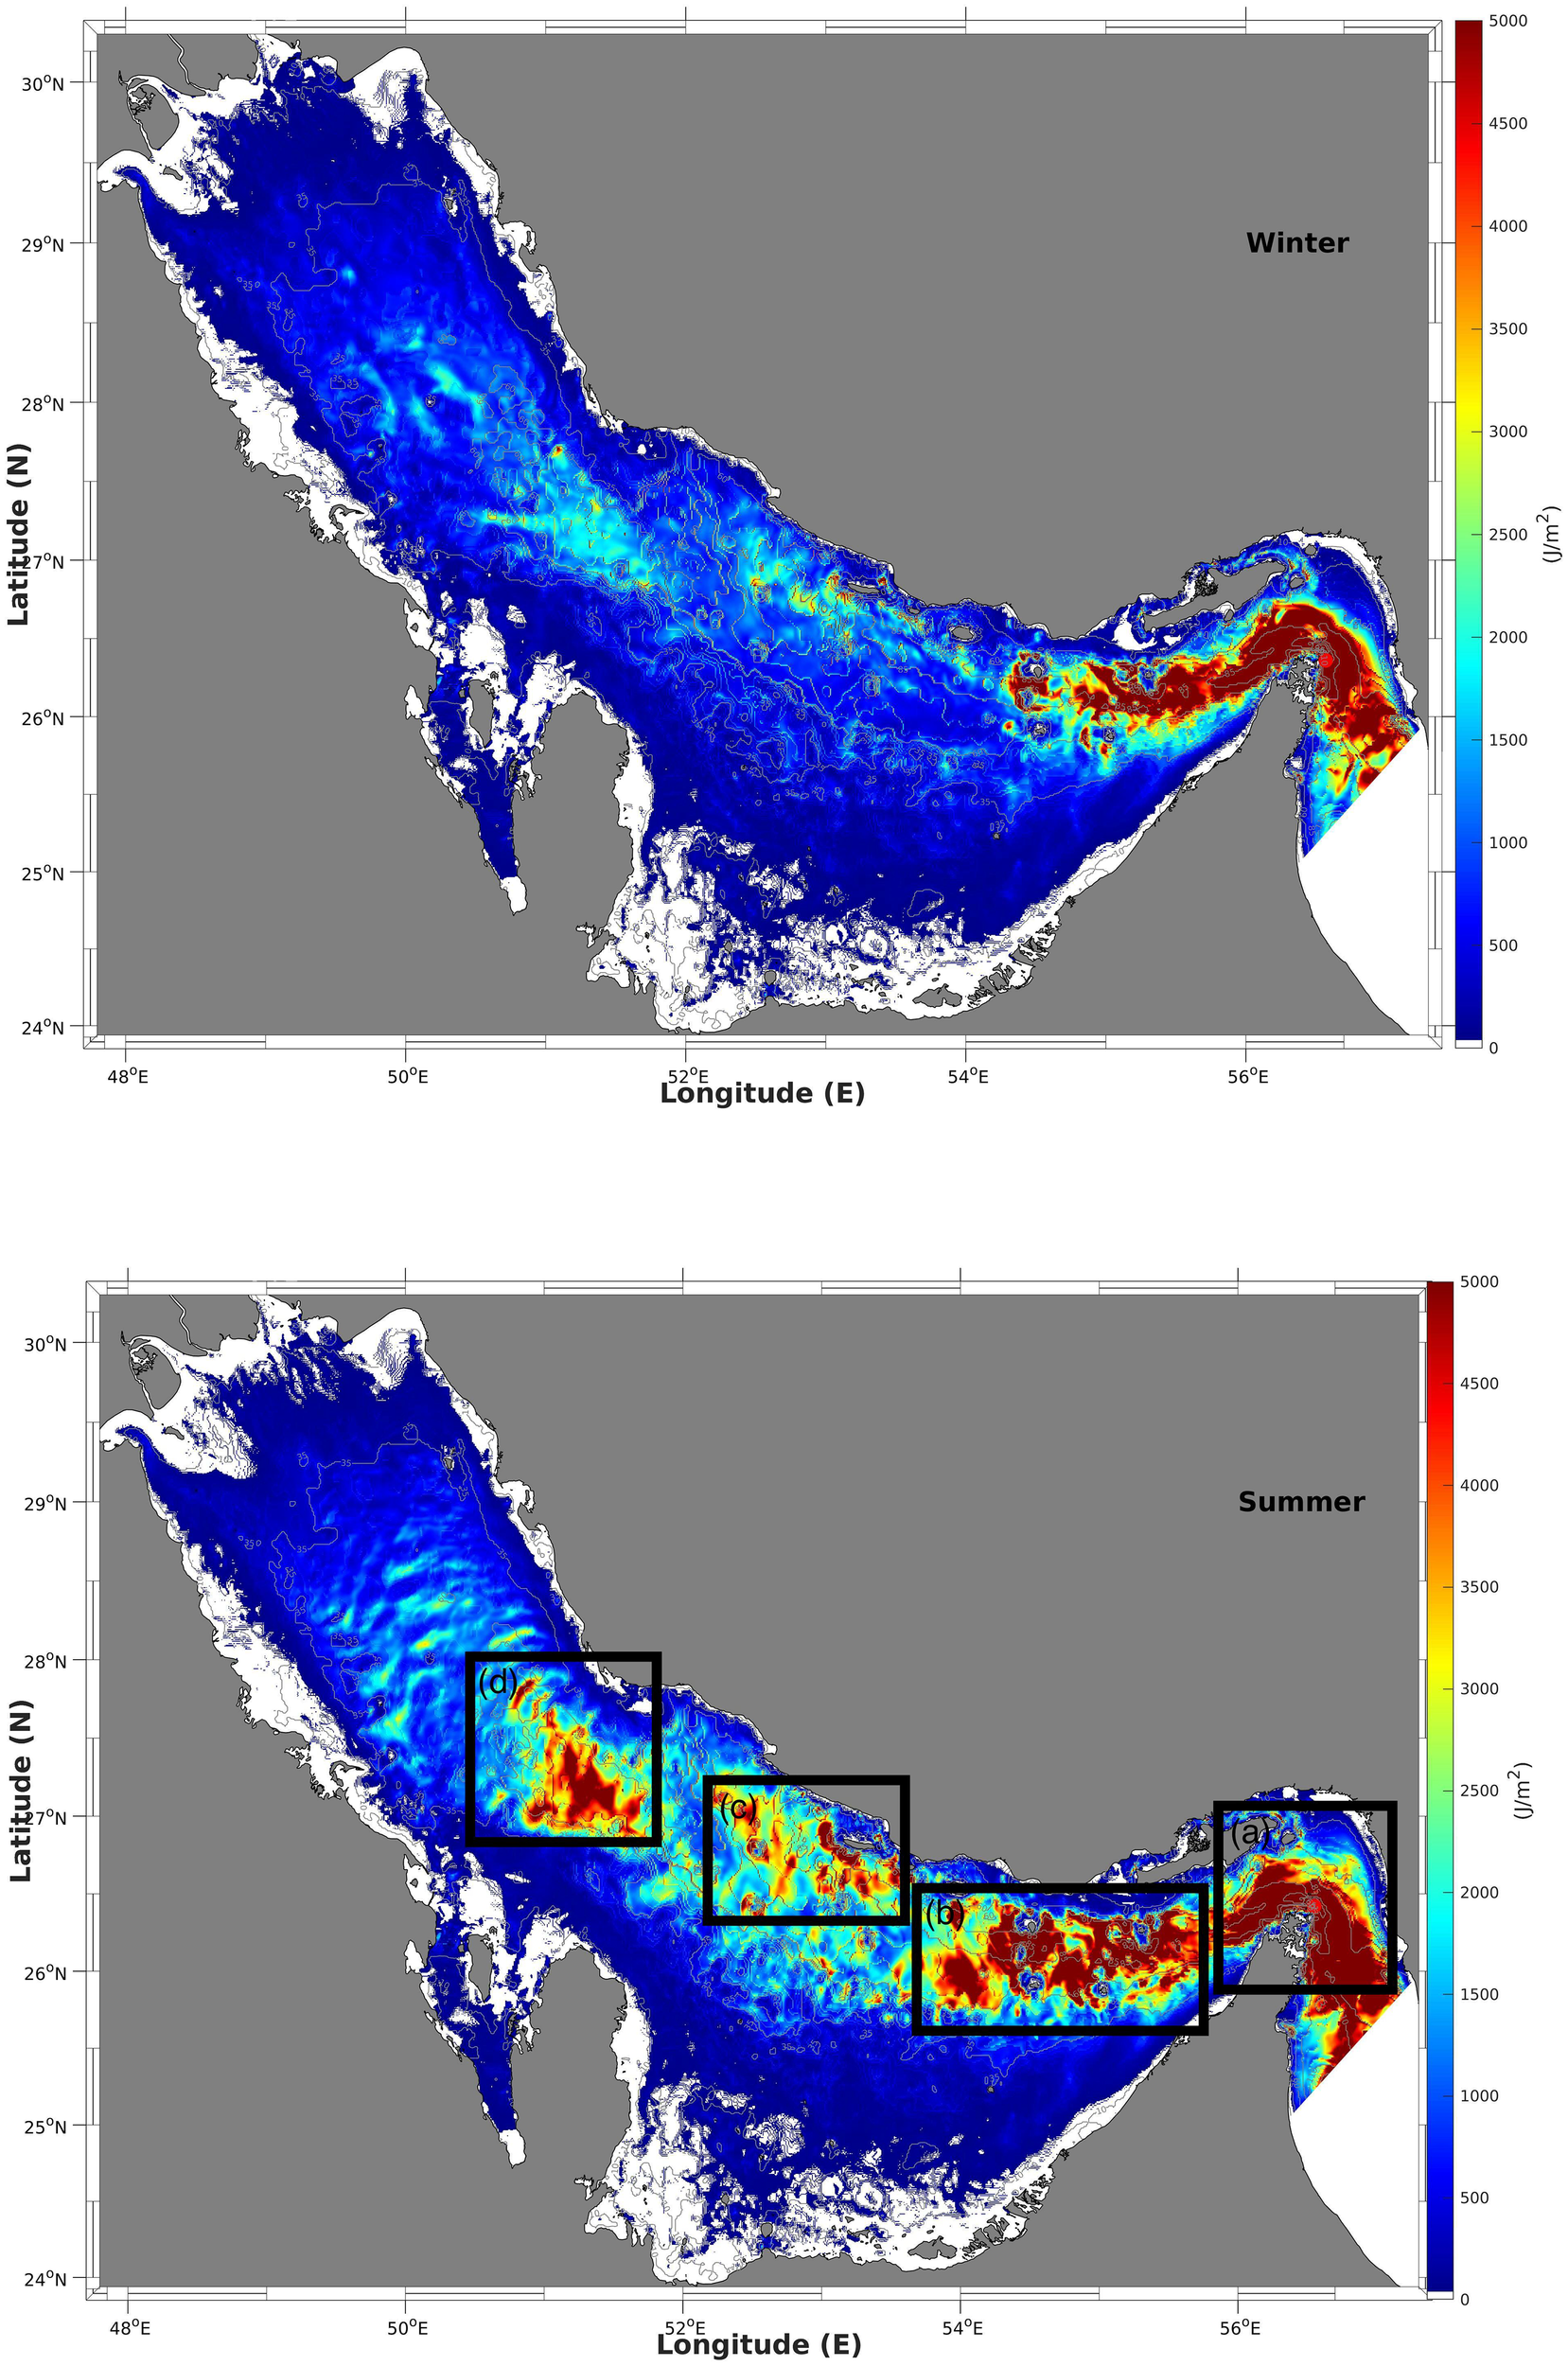
Spatial distribution of the depth-integrated baroclinic tidal kinetic energy in the winter (top) and summer (bottom) based on the equation .
Figure 10
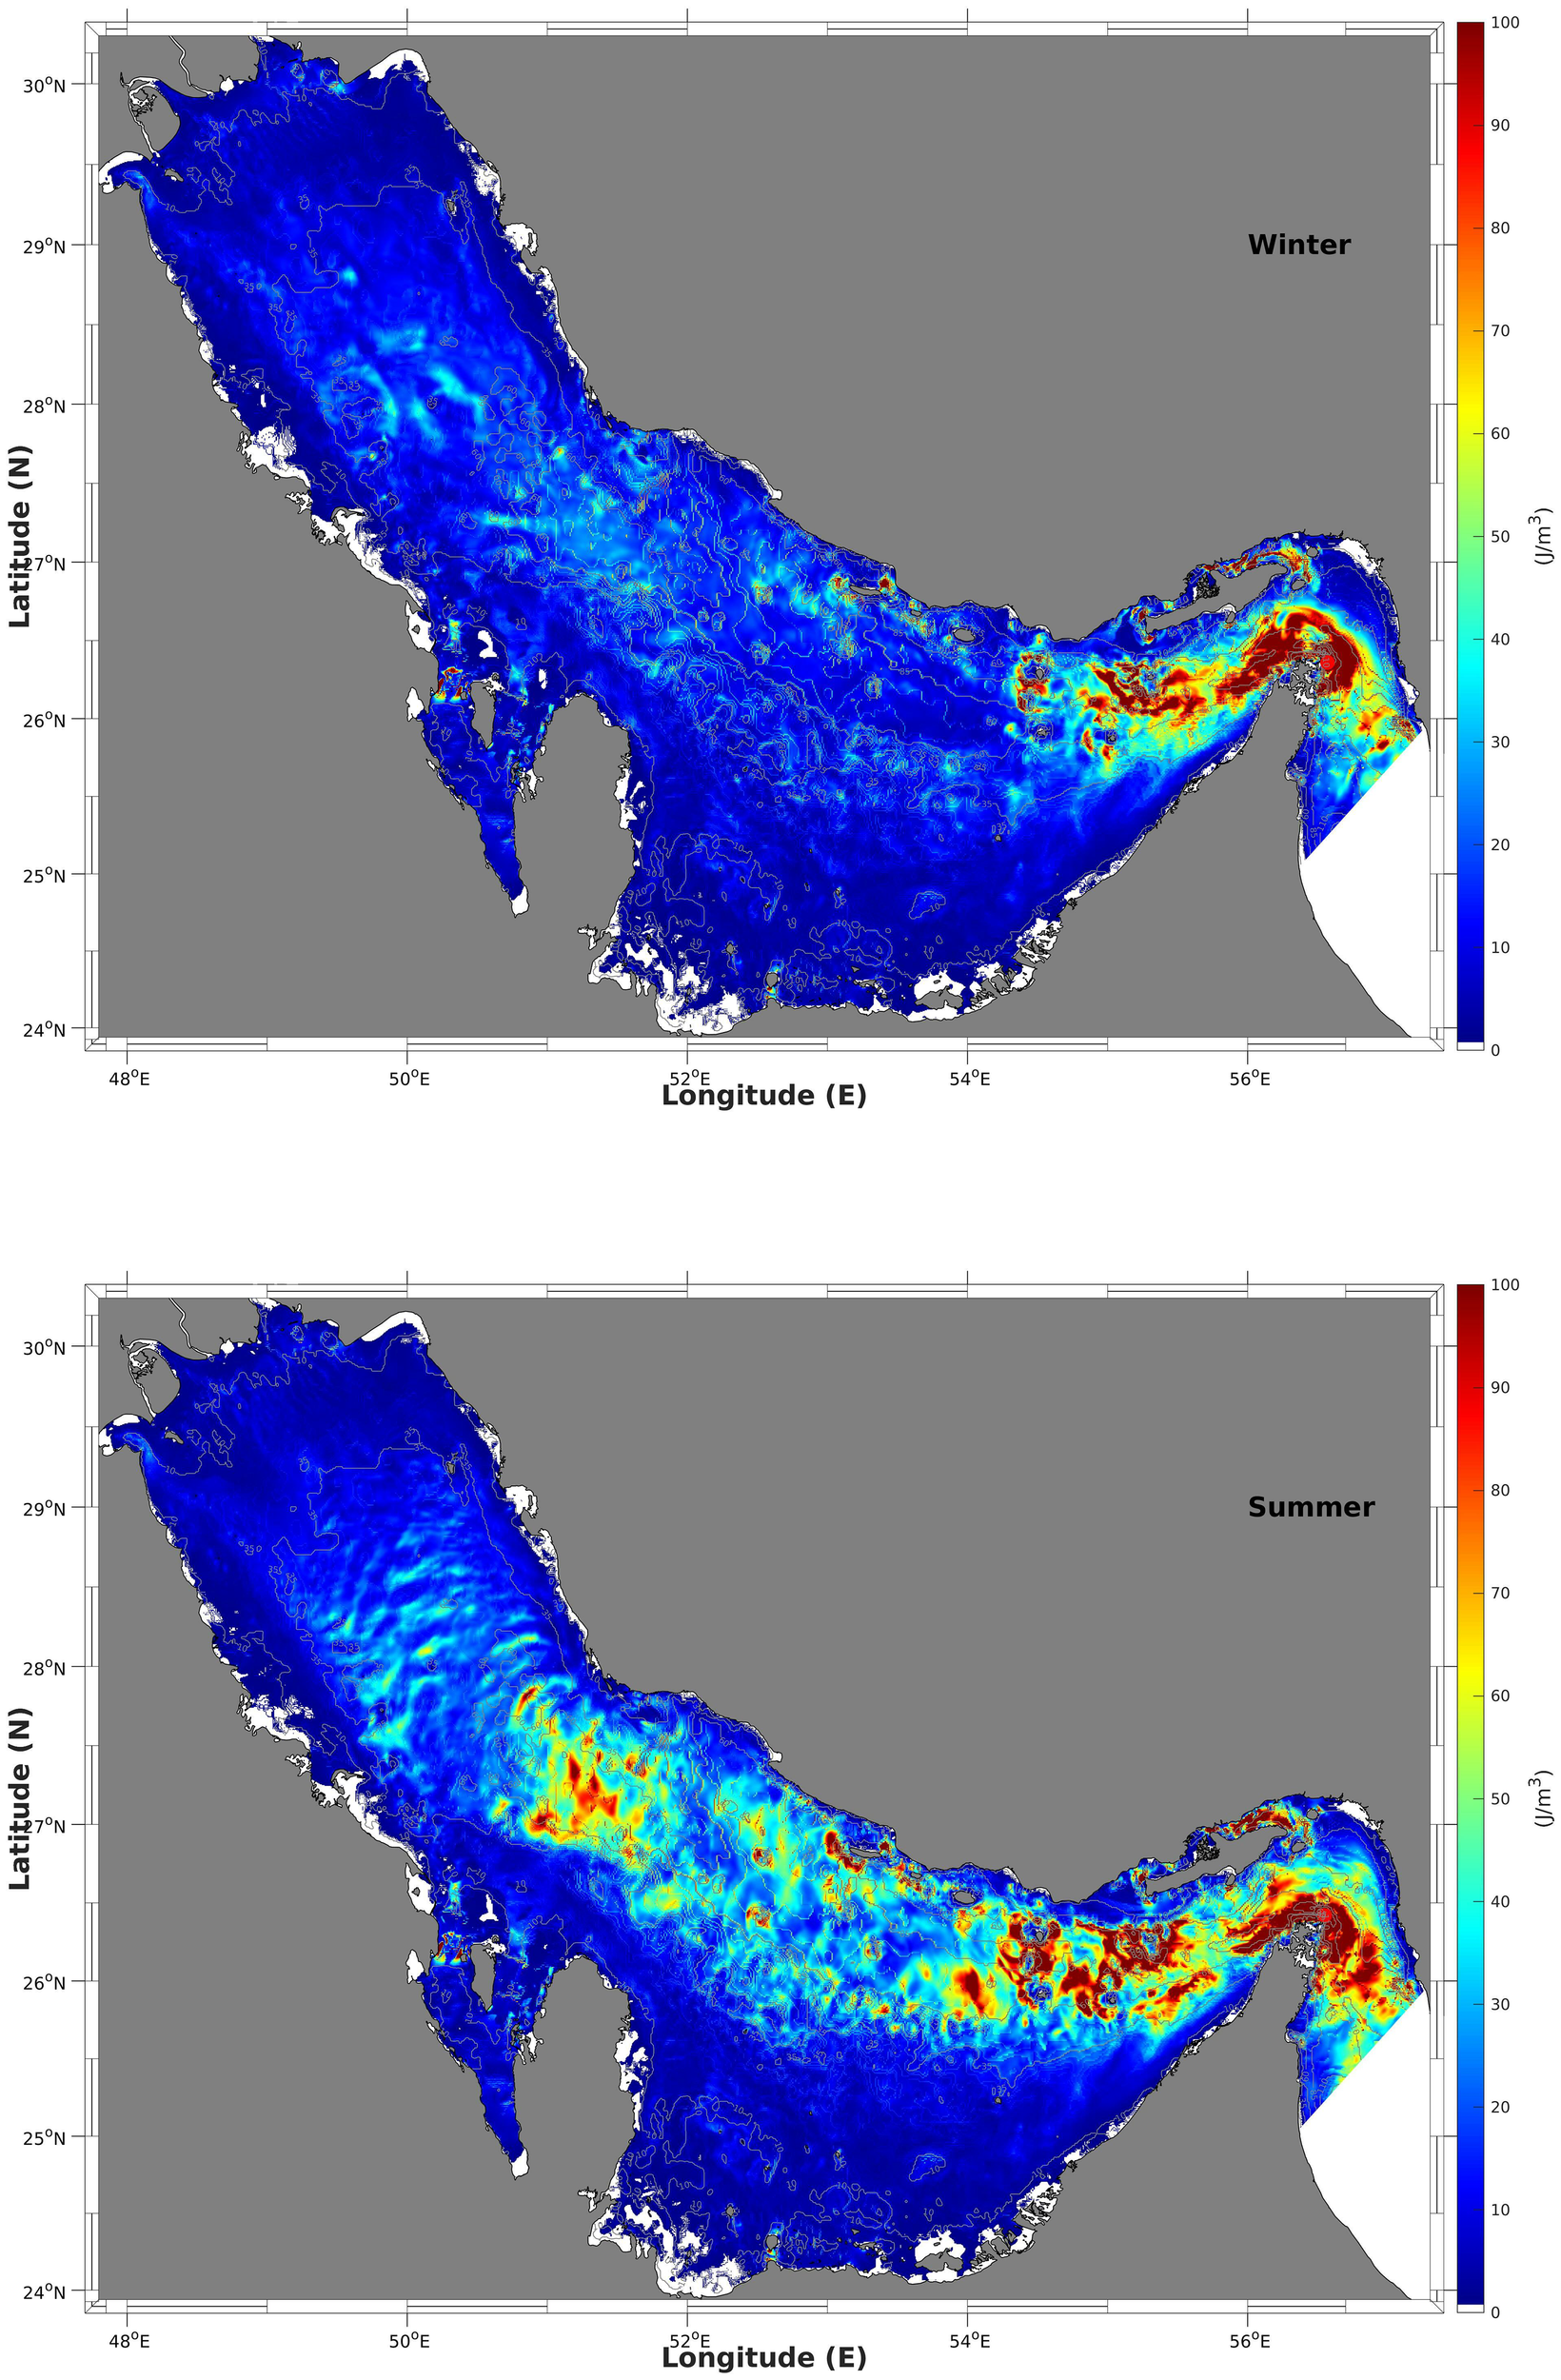
Depth-averaged of baroclinic tidal kinetic energy in the winter (top) and summer (bottom).
4.2.2 Baroclinic tidal energy flux
Figure 11 shows the spatial distribution of the depth-integrated baroclinic energy flux in the winter (top panels) and summer (bottom panels) in the Arabian Gulf. The colors indicate the density of the baroclinic energy flux, and the arrows show the propagation directions. Compared to the KE, the baroclinic energy flux includes the potential energy attributed to oscillation of the isopycnals. In general, the spatial distribution of baroclinic energy flux intensity shows a spatial coverage similar to that of the baroclinic tidal KE, with high values in the main four areas in summer and areas of (a) and (b) in winter. The arrows depicting baroclinic tidal energy flux directions indicate that the generation and propagation of these baroclinic tides in these areas present with complex structures. In the narrow strait, the baroclinic tides are mainly generated along the trough, either propagating in or out of the Gulf, with few large arrows perpendicular to the corner of the southern coastline; these tides are generated by the reflection of the strong barotropic currents. The islands area shows a more complex direction pattern, with the four islands as the main generation spots and the propagation directions toward all orientations. This finding is reasonable as this area features not only a complex bottom topography but also a mixed semi-diurnal barotropic tide type as revealed from the tidal FF map shown in Figure 6. Area (c) shows baroclinic tides with a relatively constant direction, from the coastal area to the middle of the Gulf, while in area (d), the baroclinic tides propagate in two opposite directions along the trough axis.
Figure 11
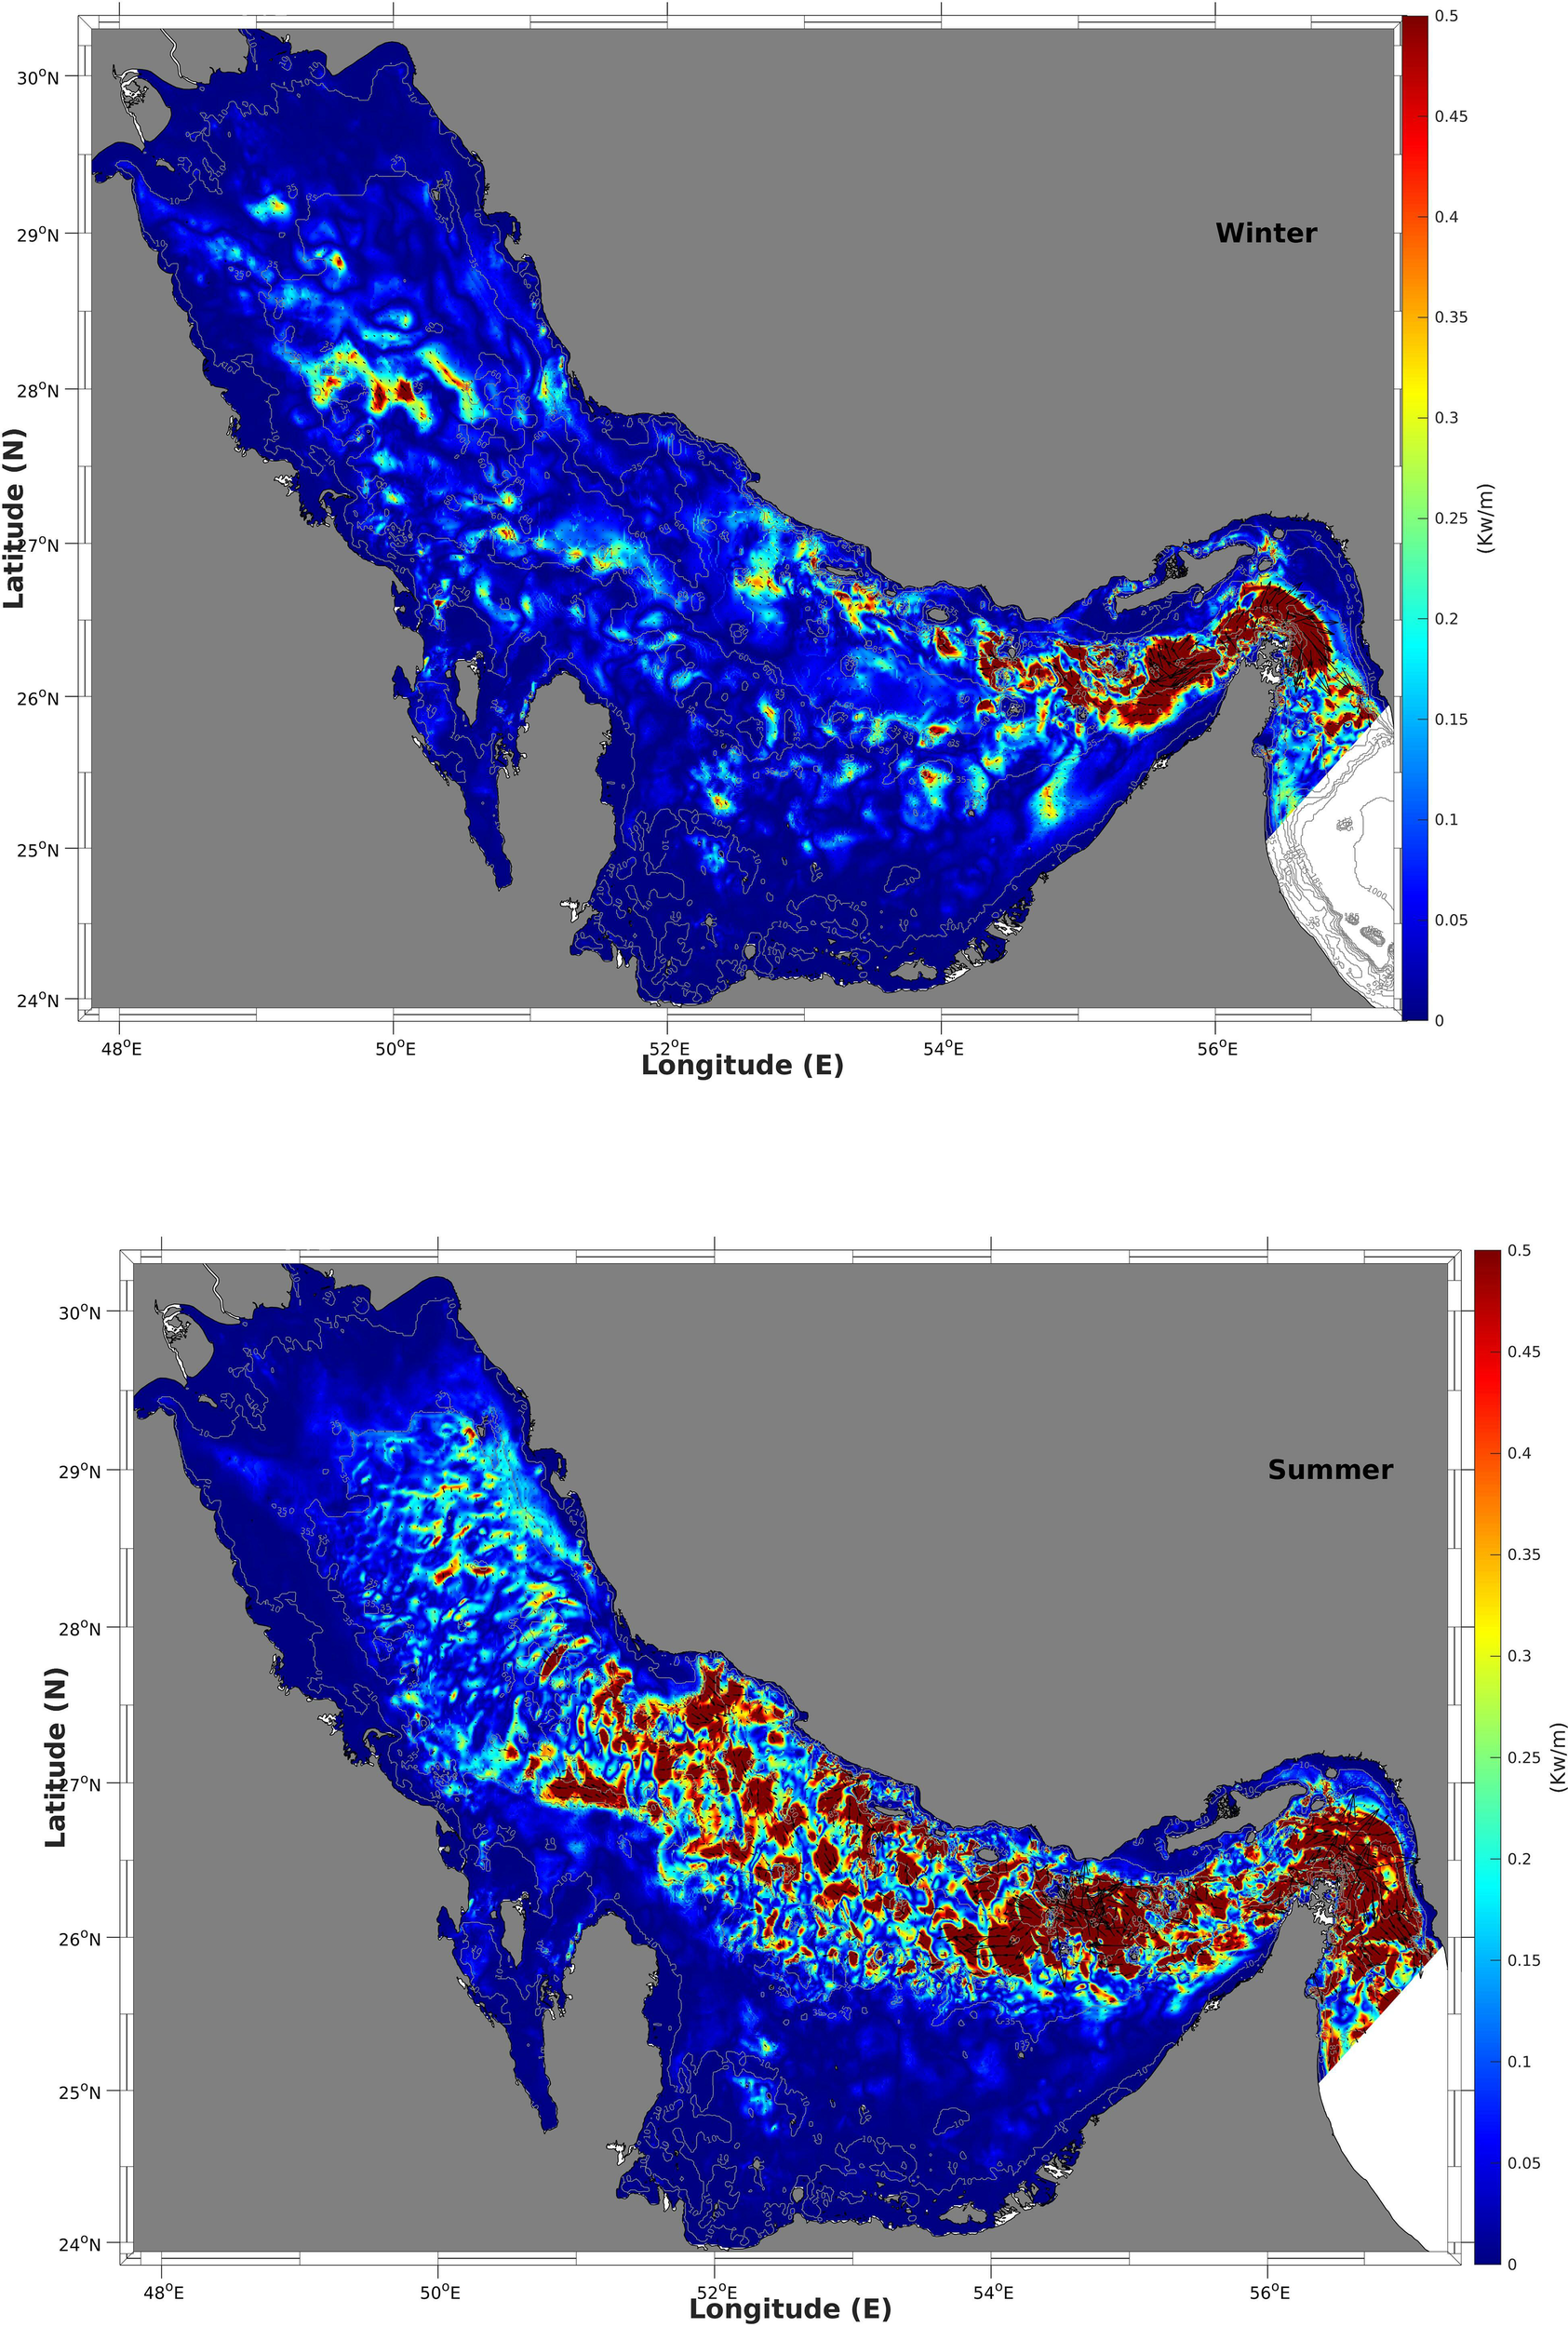
The depth-integrated baroclinic energy flux in the winter (top) and summer (bottom).
4.2.3 Sources and sinks
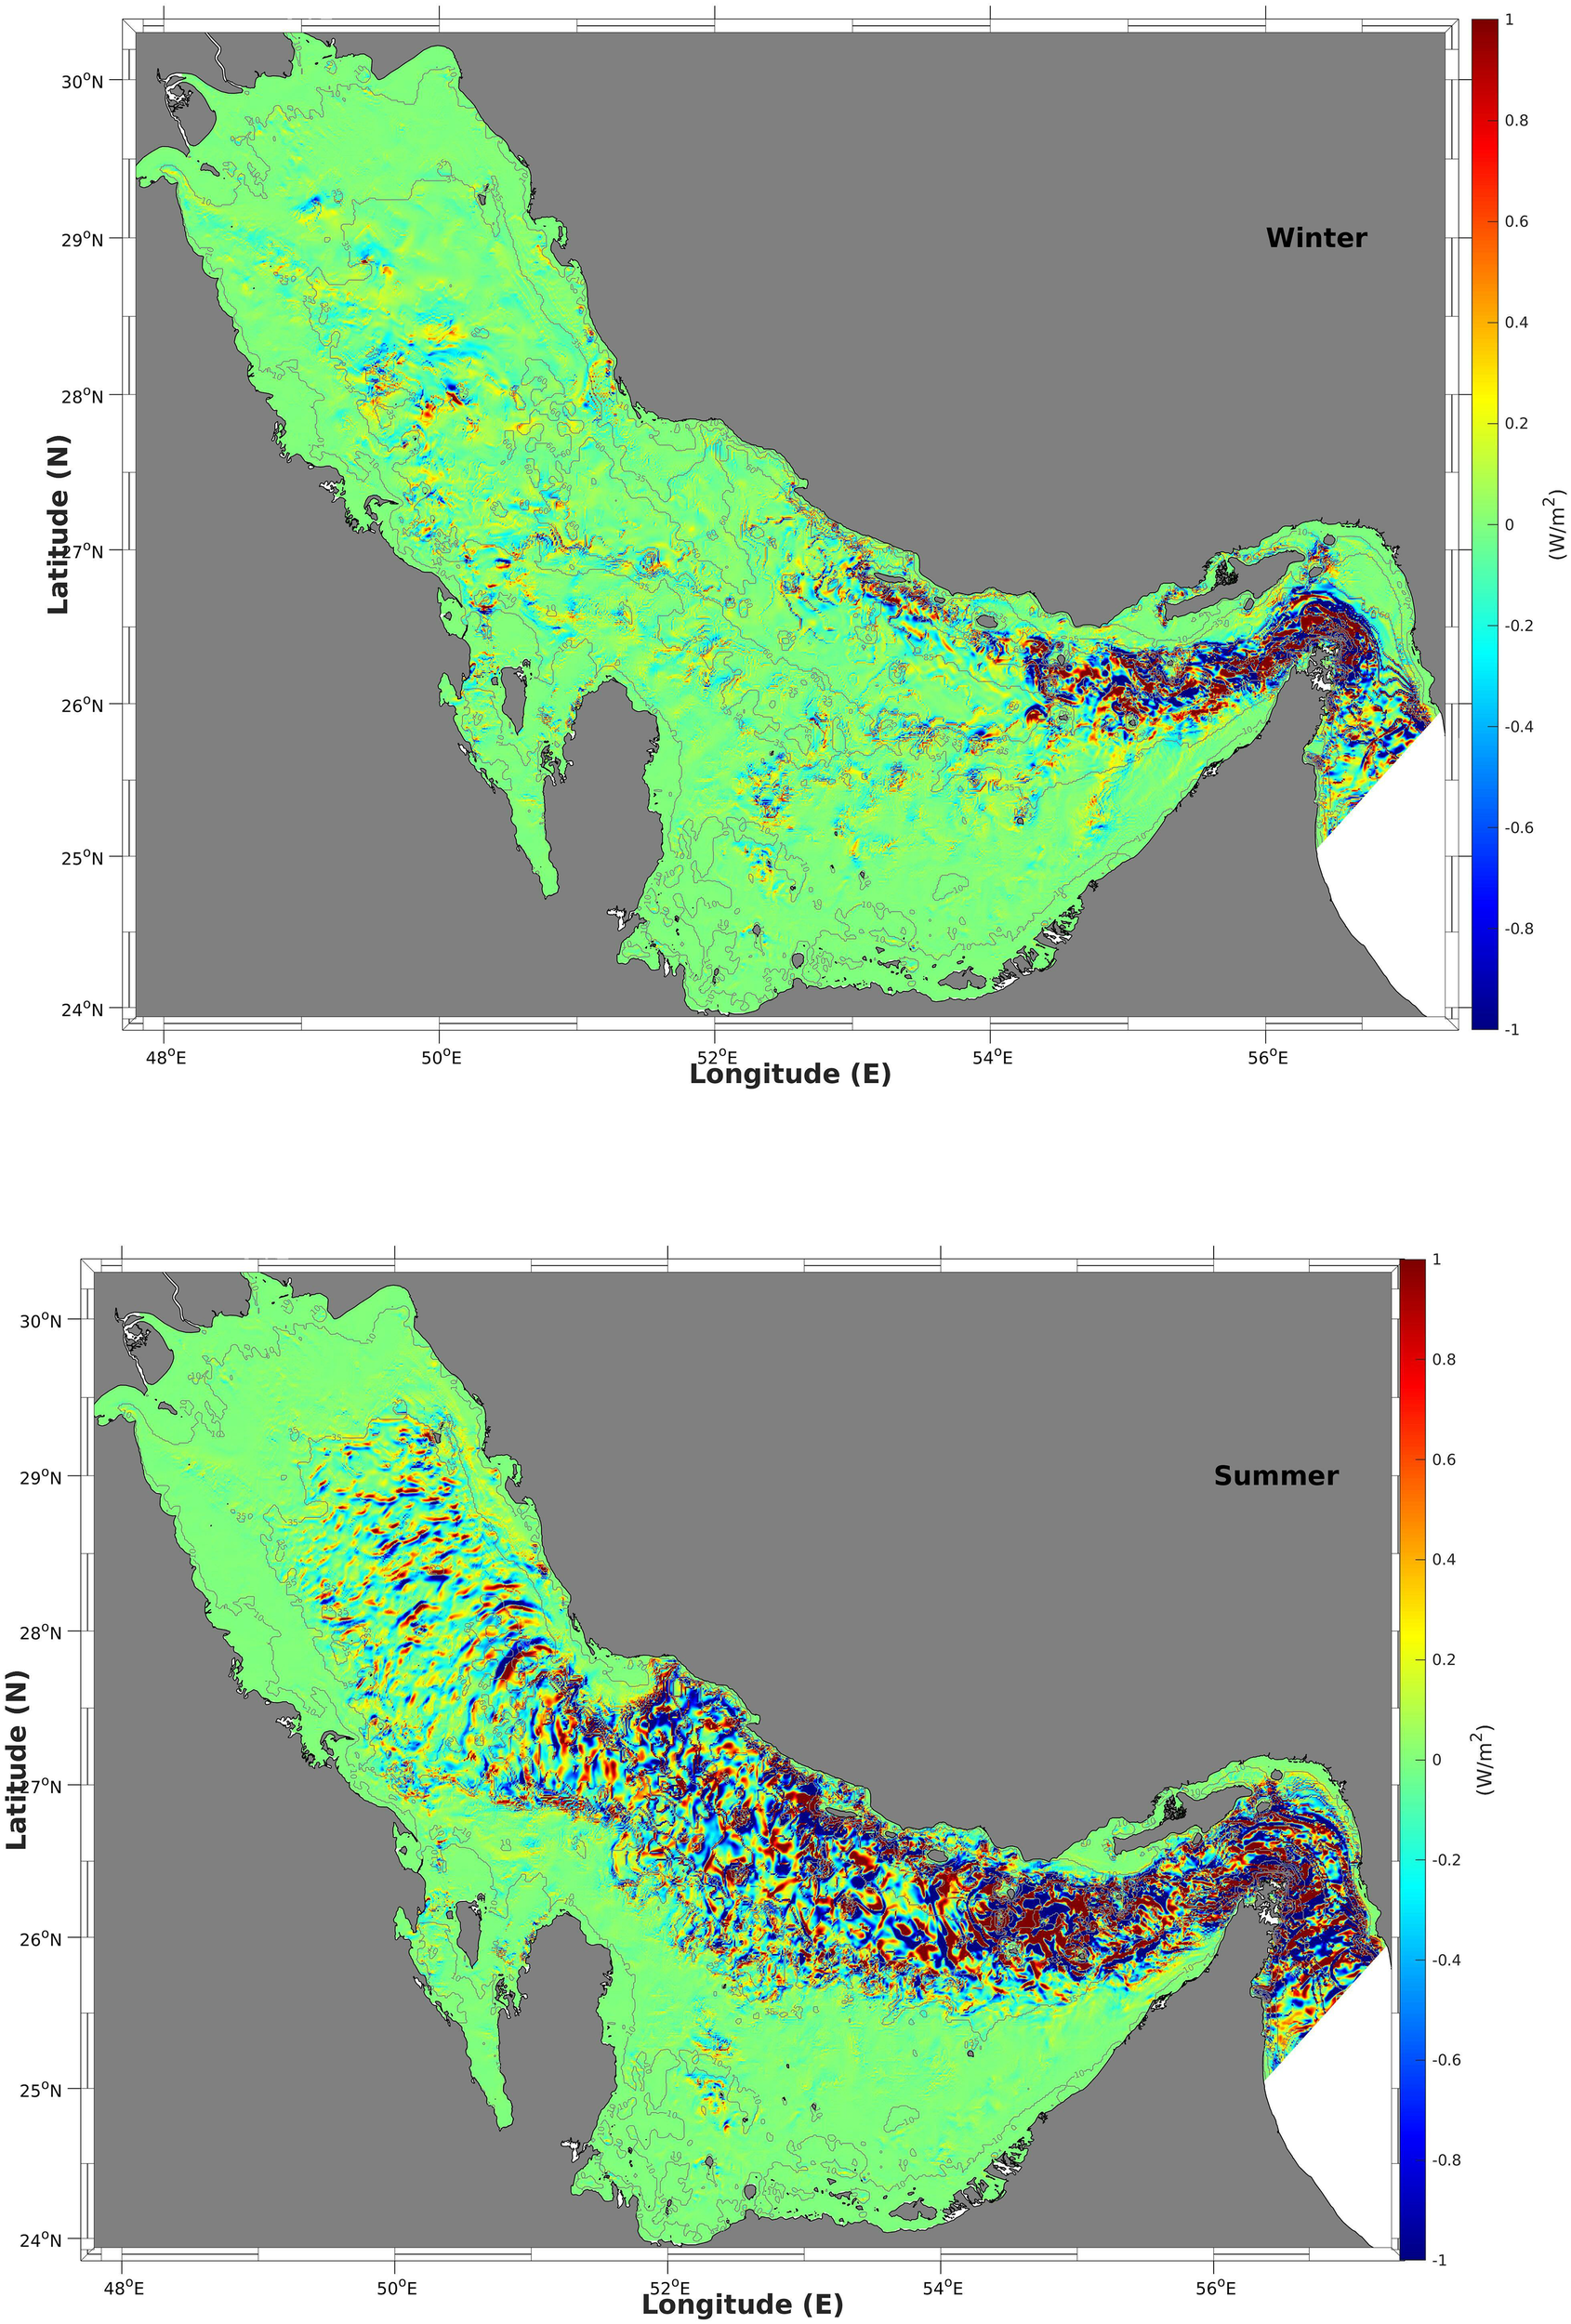
The conversion rate from barotropic tides to baroclinic tides , the divergence of baroclinic tide energy flux , and the difference between the two iterms, considered as the dissipation rate assuming that the advection of baroclinic energy is negligible (Niwa and Hibiya, 2004), are shown in Figures 12–14, respectively.
Figure 12

The conversion rate from the barotropic tide to baroclinic tide in the winter (top) and summer (bottom).
Figure 13
The divergence of baroclinic tide energy flux in the winter (top) and summer (bottom).
Figure 14
The dissipation rate (based on the difference of Figures 12 and 13) in the winter (top) and summer (bottom).
The spatial distribution of the positive conversion rates indicates areas where the barotropic currents interact with the steep bottom topography occurs. This interaction is the main source of the baroclinic tides and is quite consistent with the results of the forcing function (Figure 8), as well as the positive values of the divergence of the baroclinic energy flux (Figure 11). The negative values of conversion rates do not correspond to turbulent energy dissipation; instead, they indicate the energy, which is transferred from the baroclinic tides to the barotropic tides due to pressure work (Niwa and Hibiya, 2004; Zilberman et al., 2009). The total values of the conversion rates from barotropic tides to baroclinic tides for the four main areas in summer in the Gulf, namely, (a) the Strait of Hormuz, (b) the entrance islands area, (c) the central coastal area and (d) the northern area are 0.102, 0.089, 0.032, and 0.034 GW, respectively; from baroclinic to barotropic tides, these values are 0.059, 0.057, 0.016, and 0.023 GW; the net values are 0.043, 0.032, 0.016 and 0.011 GW. These values were calculated after spatial integration within the four areas indicated by dashed boxes in Figure 9. The distribution of the divergence of the baroclinic energy flux indicates areas where the baroclinic tide was generated (positive values) and dissipated (negative values). These areas are consistent with the areas of positive values on the conversion rate map as the main source of baroclinic tides is the interaction between barotropic currents and bottom topography. The negative values are widely spread because the baroclinic energy sink originates partly from energy dissipation. The positive values of the divergence of the baroclinic energy flux for the four areas are 0.098, 0.085, 0.028, and 0.031 GW, respectively, whereas the negative values are 0.095, 0.078, 0.027, and 0.030 GW, respectively, and the net values are 0.003, 0.007, 0.001, and 0.001 GW, respectively. Most of the baroclinic energy disappears within the four areas either via transformation into barotropic energy because of pressure or via dissipation owing to friction and bottom drag.
5 Discussion
Previous studies based on satellite observations (Andi et al., 2021) revealed that in the Arabian Gulf, the internal solitary waves are more likely generated in the eastern basin, and most of them occur in summer. They also suggested that winds stress and tidal currents are the main two causes of the generation of these internal waves. However, in Rashidi Ebrahim Hesari et al. (2019), though they revealed similar spatial and temporal properties of internal waves in the Arabian Gulf by analyzing satellite images, they concluded that the movement of tidal currents over the sea bottom with variable slope does not play a significant role in the formation of internal waves. We addressed these two contradicting hypothesis by examining our simulation results.
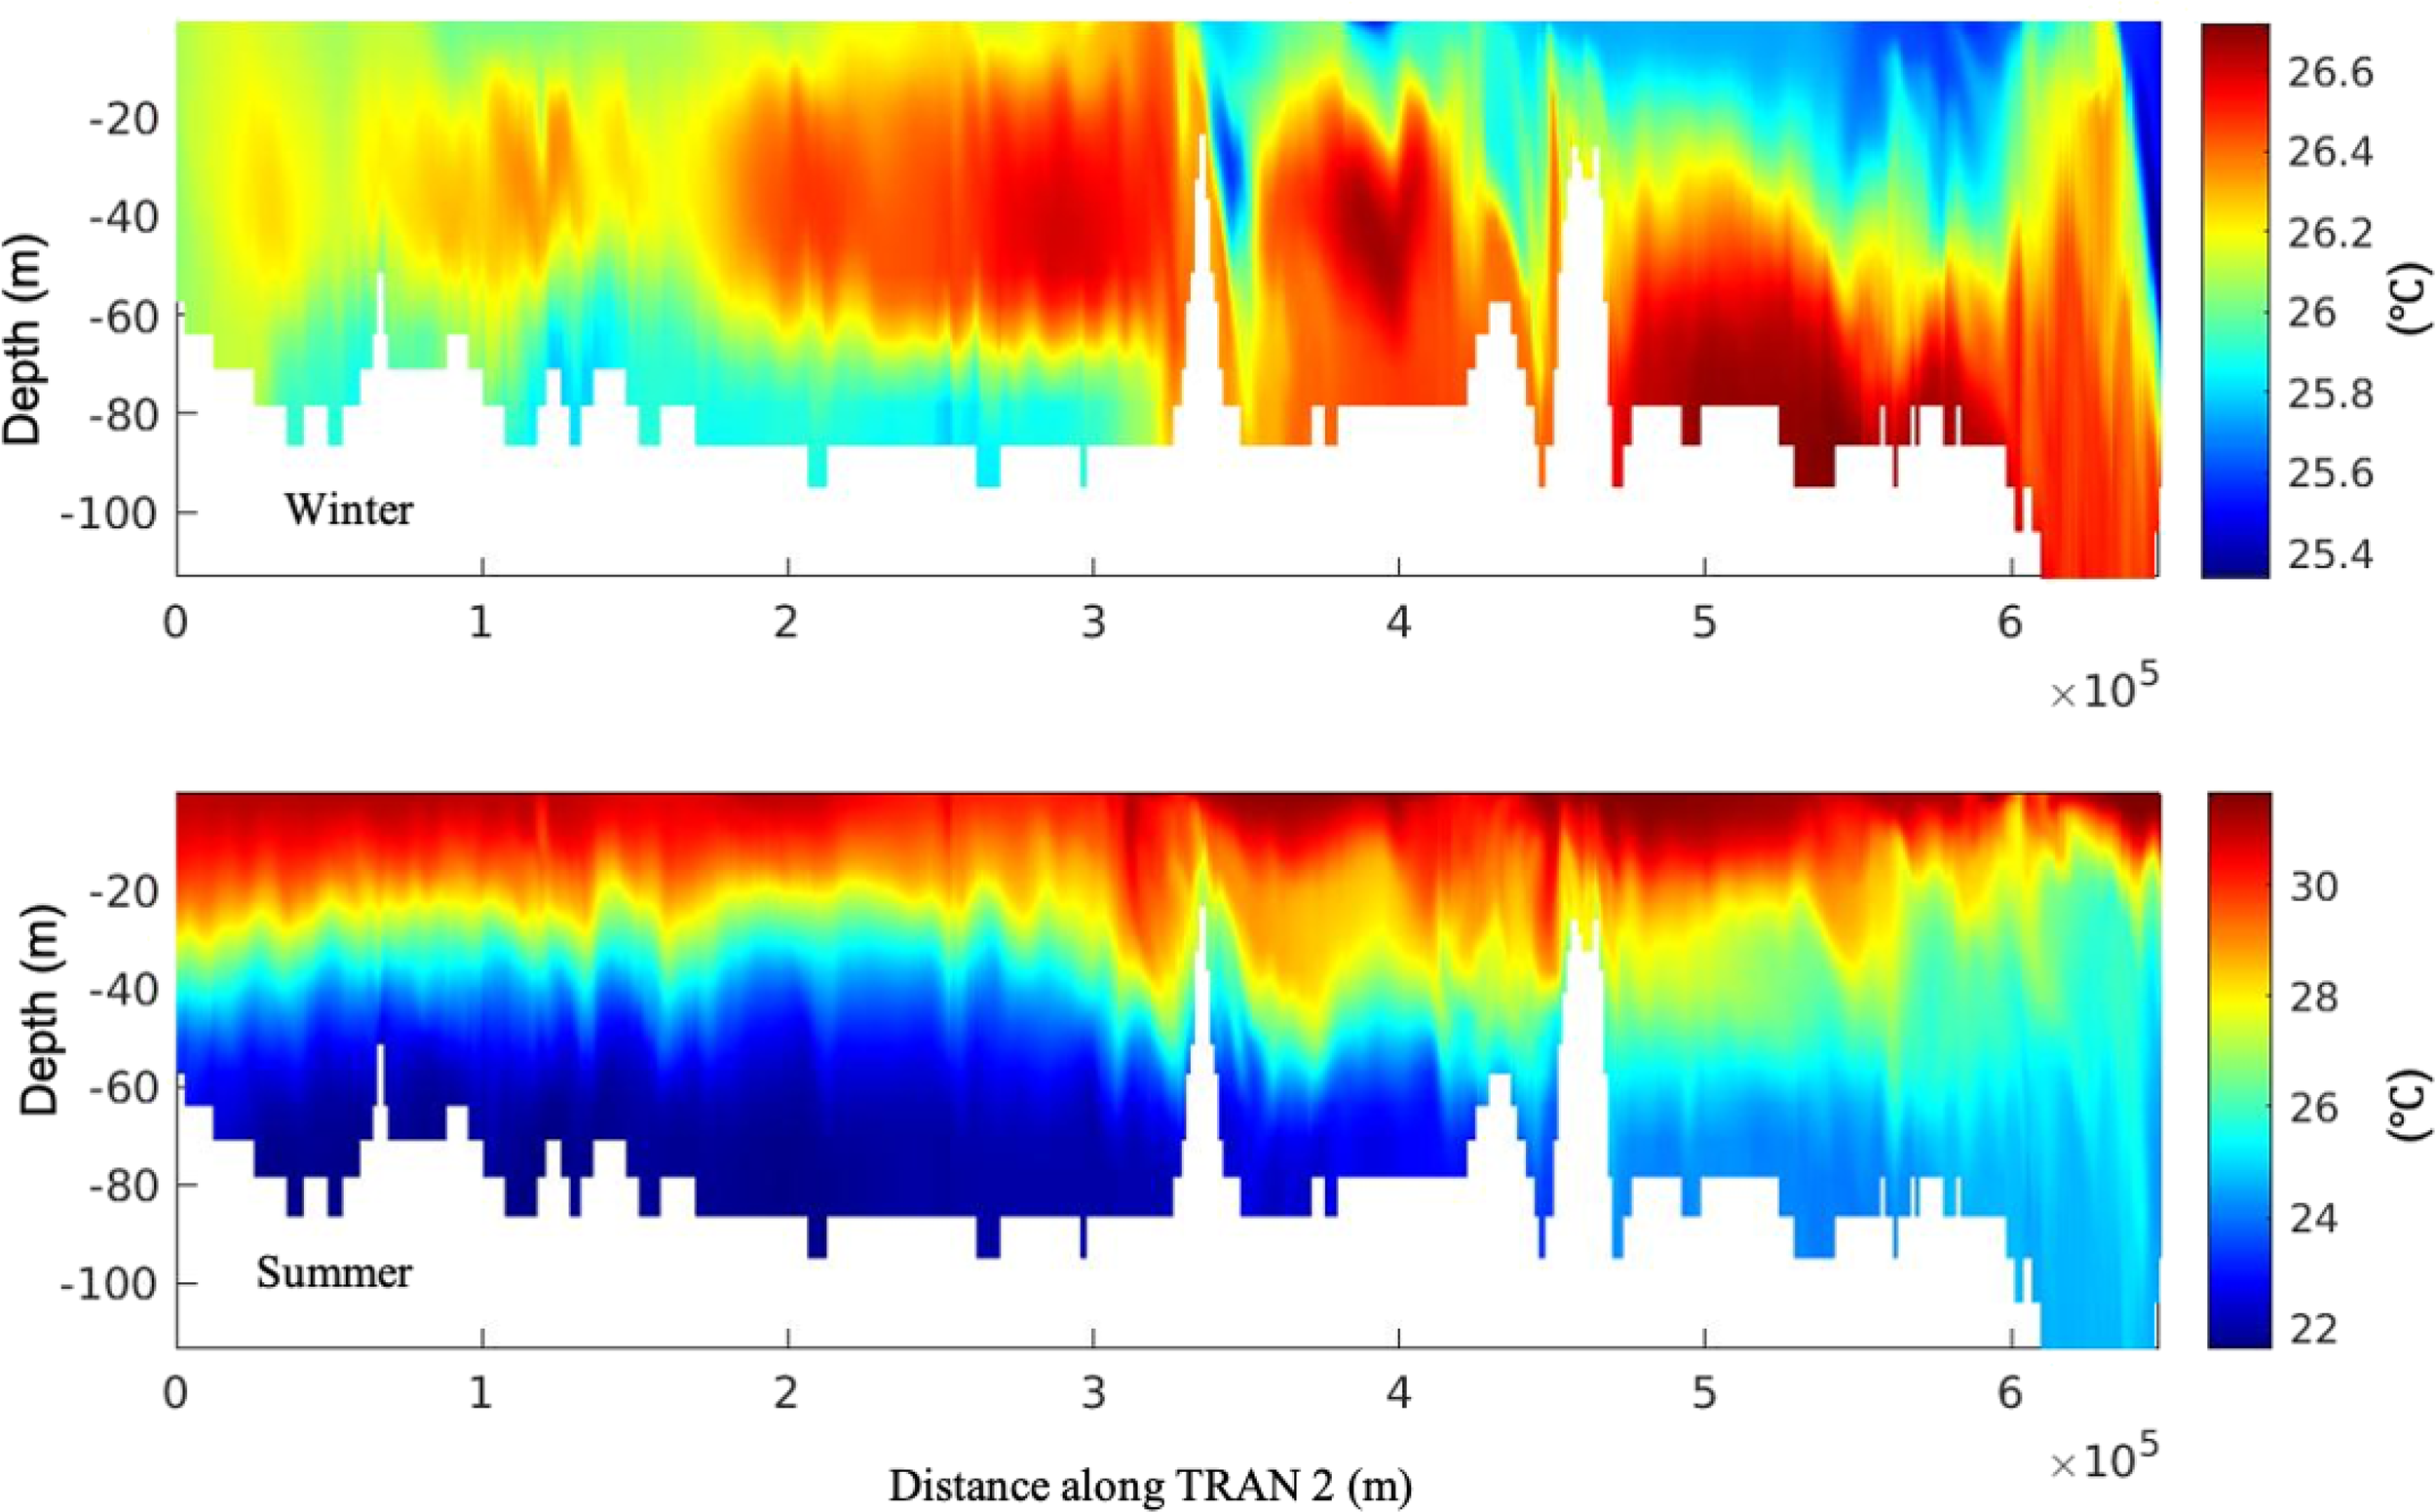
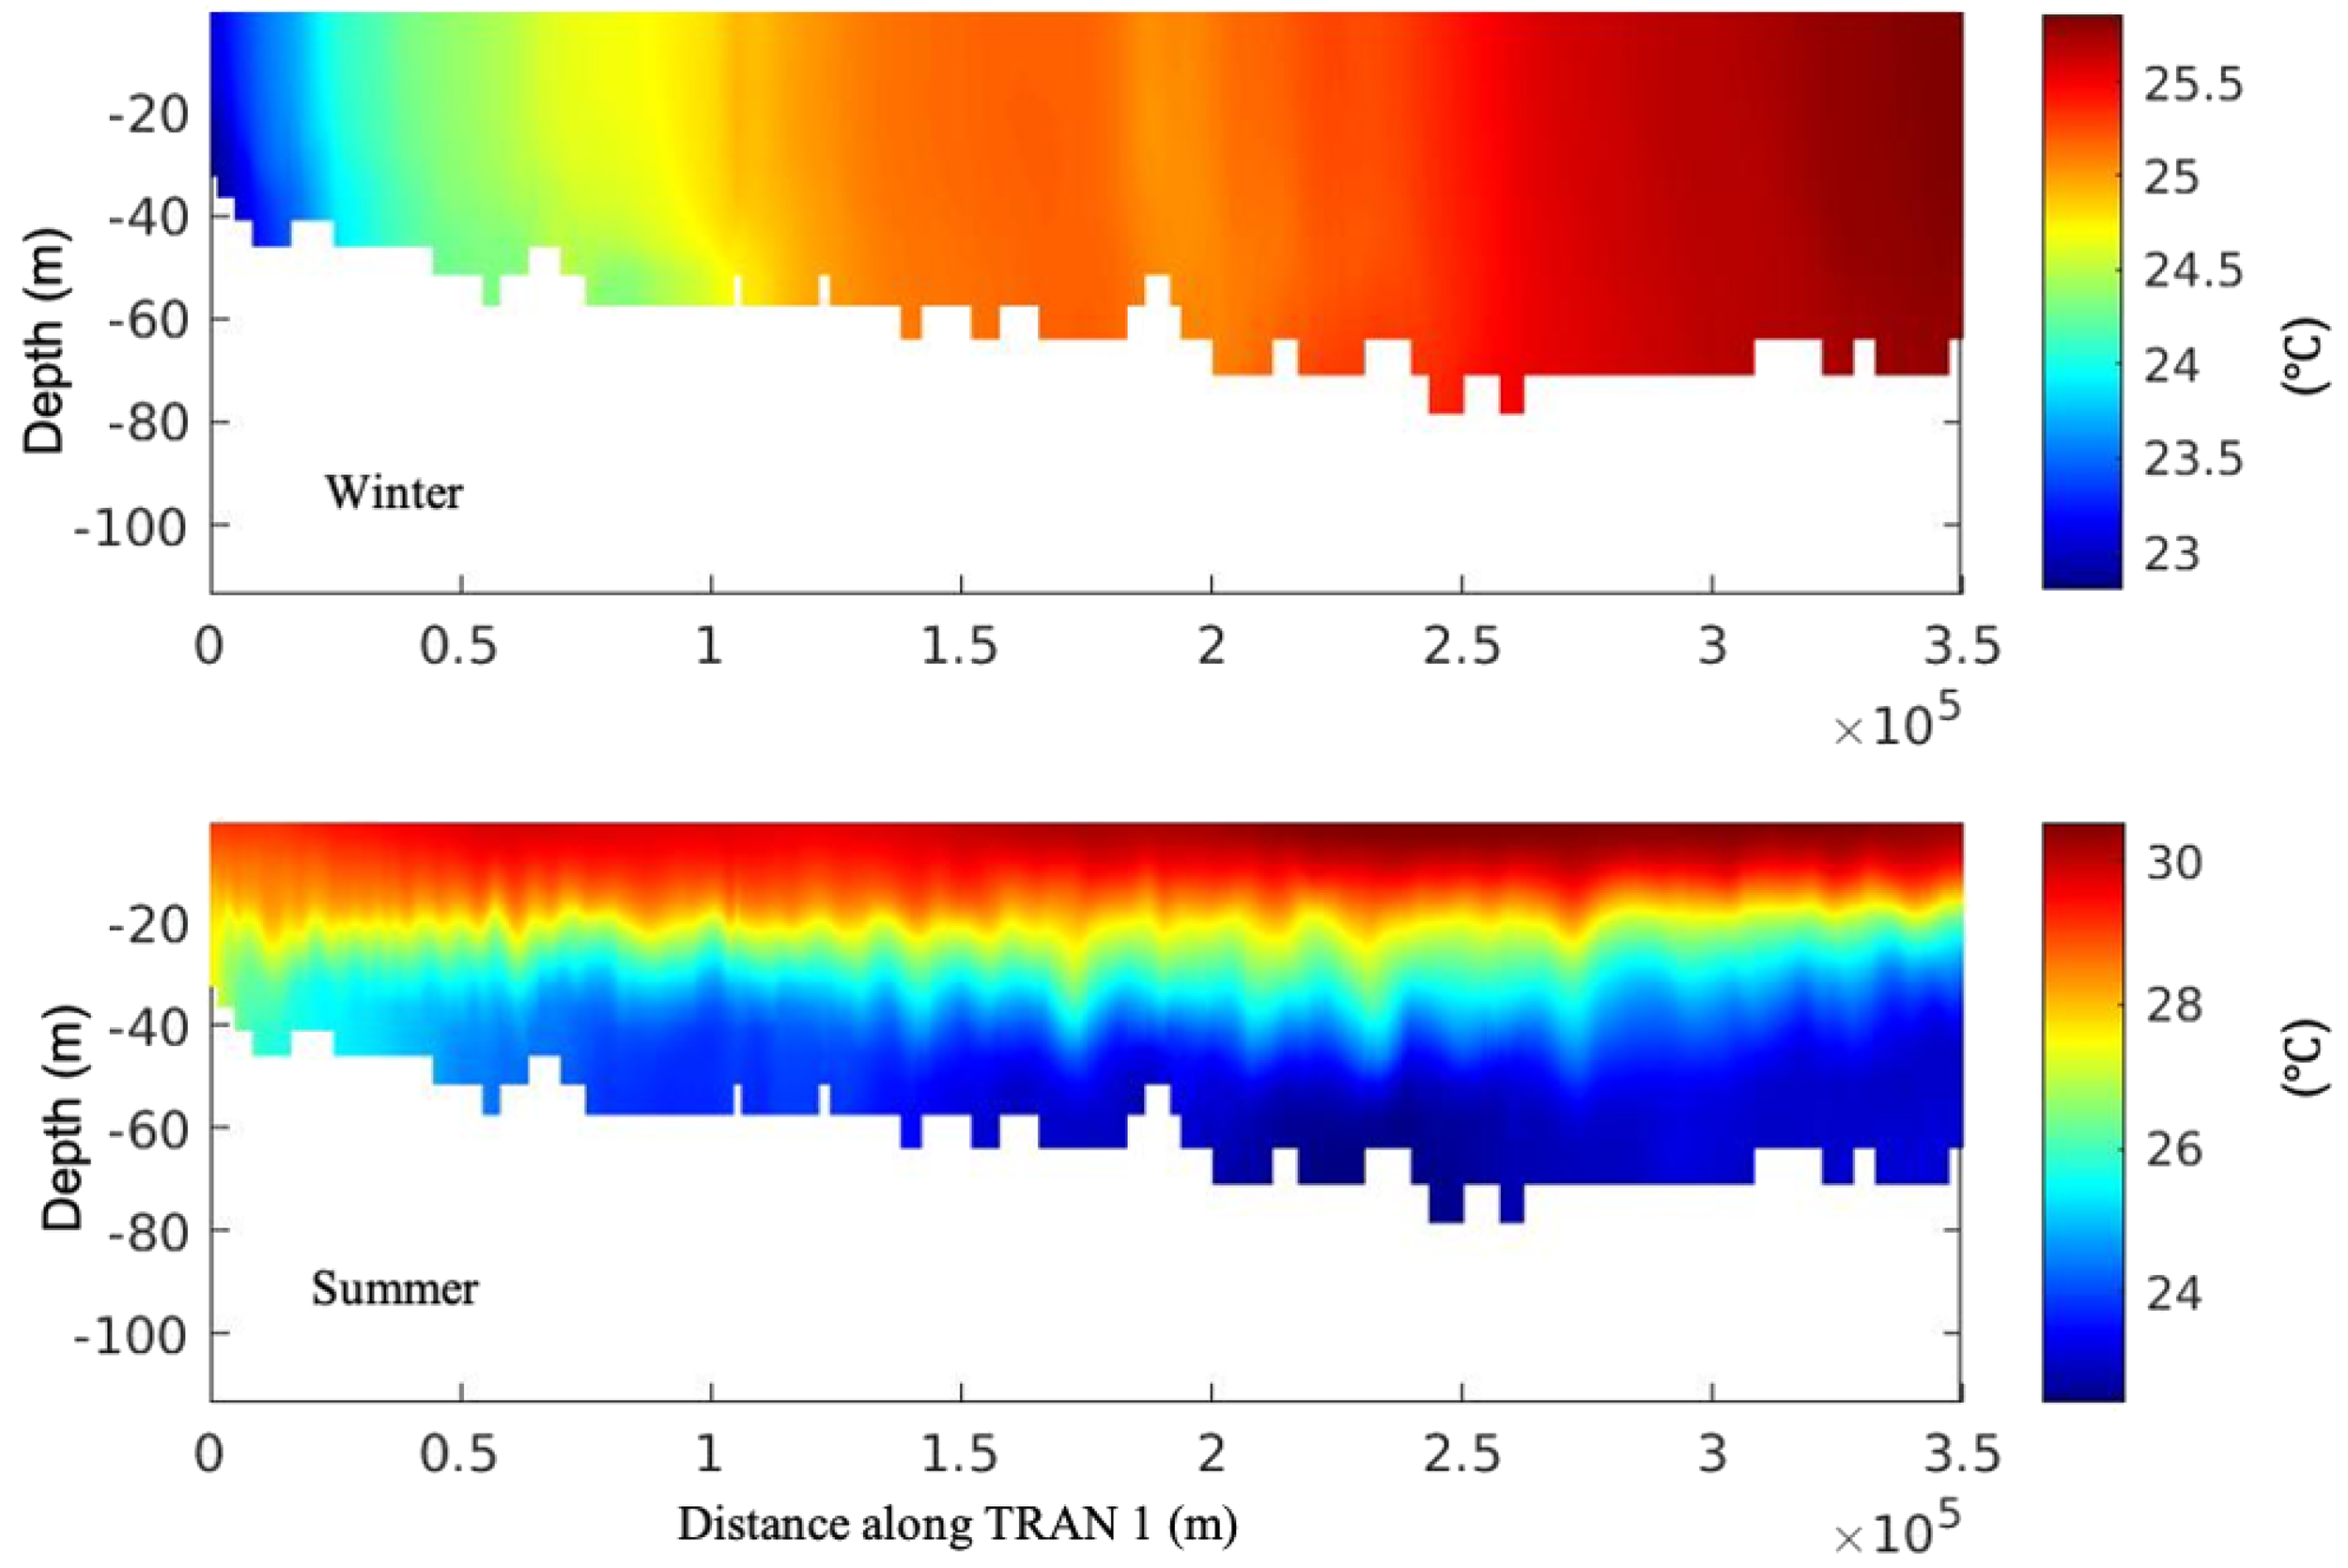
First, the simulated spatial distribution of strong baroclinic tides in the Gulf shows good agreement with the locations where the internal solitary waves are detected from satellite images (Andi et al., 2021; Farjami and Andi, 2021). Figures 15a, b present the sea surface velocity gradient calculated based on the summer simulation results, with the locations indicated in two boxes in the left panel. As a comparison to the distribution of internal solitary waves observed by satellite images (Figure 3 in Farjami and Andi (2021)), the modulation of back-scattered radar power, and consequently the SAR image intensity is proportional to the surface current gradient in the look direction of the SAR antenna Alpers (1985). Thus, the map depicted in Panel (a) and (b) can be viewed as a SAR image of internal wave fields. In panel (a), a long crest solitary wave is seen propagating to the southwest. In panel (b), a more complex map shows several groups of internal solitary waves propagating in different directions, likely excited by the four islands and subsequently developing. Though our model resolution limited the detailed reproduction process of the generation of internal solitary waves, the presence and their locations of these waves are consistent with the satellite observations. What is more, the generation of internal solitary waves by evolving from strong internal tides through a nonlinear process is a common mechanism as studied in several marginal seas (Alford et al., 2015; Guo et al., 2016). Second, the seasonal variability of these internal solitary waves, as revealed from satellite images, matches well with our simulation results. This agreement is evident not only from the energy budget analysis provided in the previous sections but also from the direct observation of seasonality through oscillations along the thermocline. As depicted in Figures 16 and 17, a comparison of potential temperature fields along two transects (as indicated with dashed lines in Figure 1) during winter and summer showcases a notable difference in the presence of internal waves. During winter, minimal vertical stratification is observed in the central and northern parts of the Gulf primarily due to the dominance of the mixing process. Consequently, no internal waves are observed along transect TRANS 1 during winter - this finding is consistent with satellite observations. The situation in the strait is intricate because of the stratification resulting from water exchange and the presence of cold water masses at the surface. This scenario leads to obvious oscillations along the interface, as illustrated in Figure 17 (top). In summer, the situation is relatively straightforward, with stratification maintained throughout the northern and central parts of the Gulf and the strait. Internal waves are observed along both transects TRANS 1 and TRANS 2, with amplitudes in the strait being significantly larger than those in the central and northern part of the Gulf. The results are consistent with the observational conclusions drawn from satellite images, indicating that the generation of these internal solitary waves is likely attributed to tidetopography interactions facilitated by strong stratification. Lastly, the relationship between strong wind and the occurrence of internal waves warrants further investigation.
Figure 15
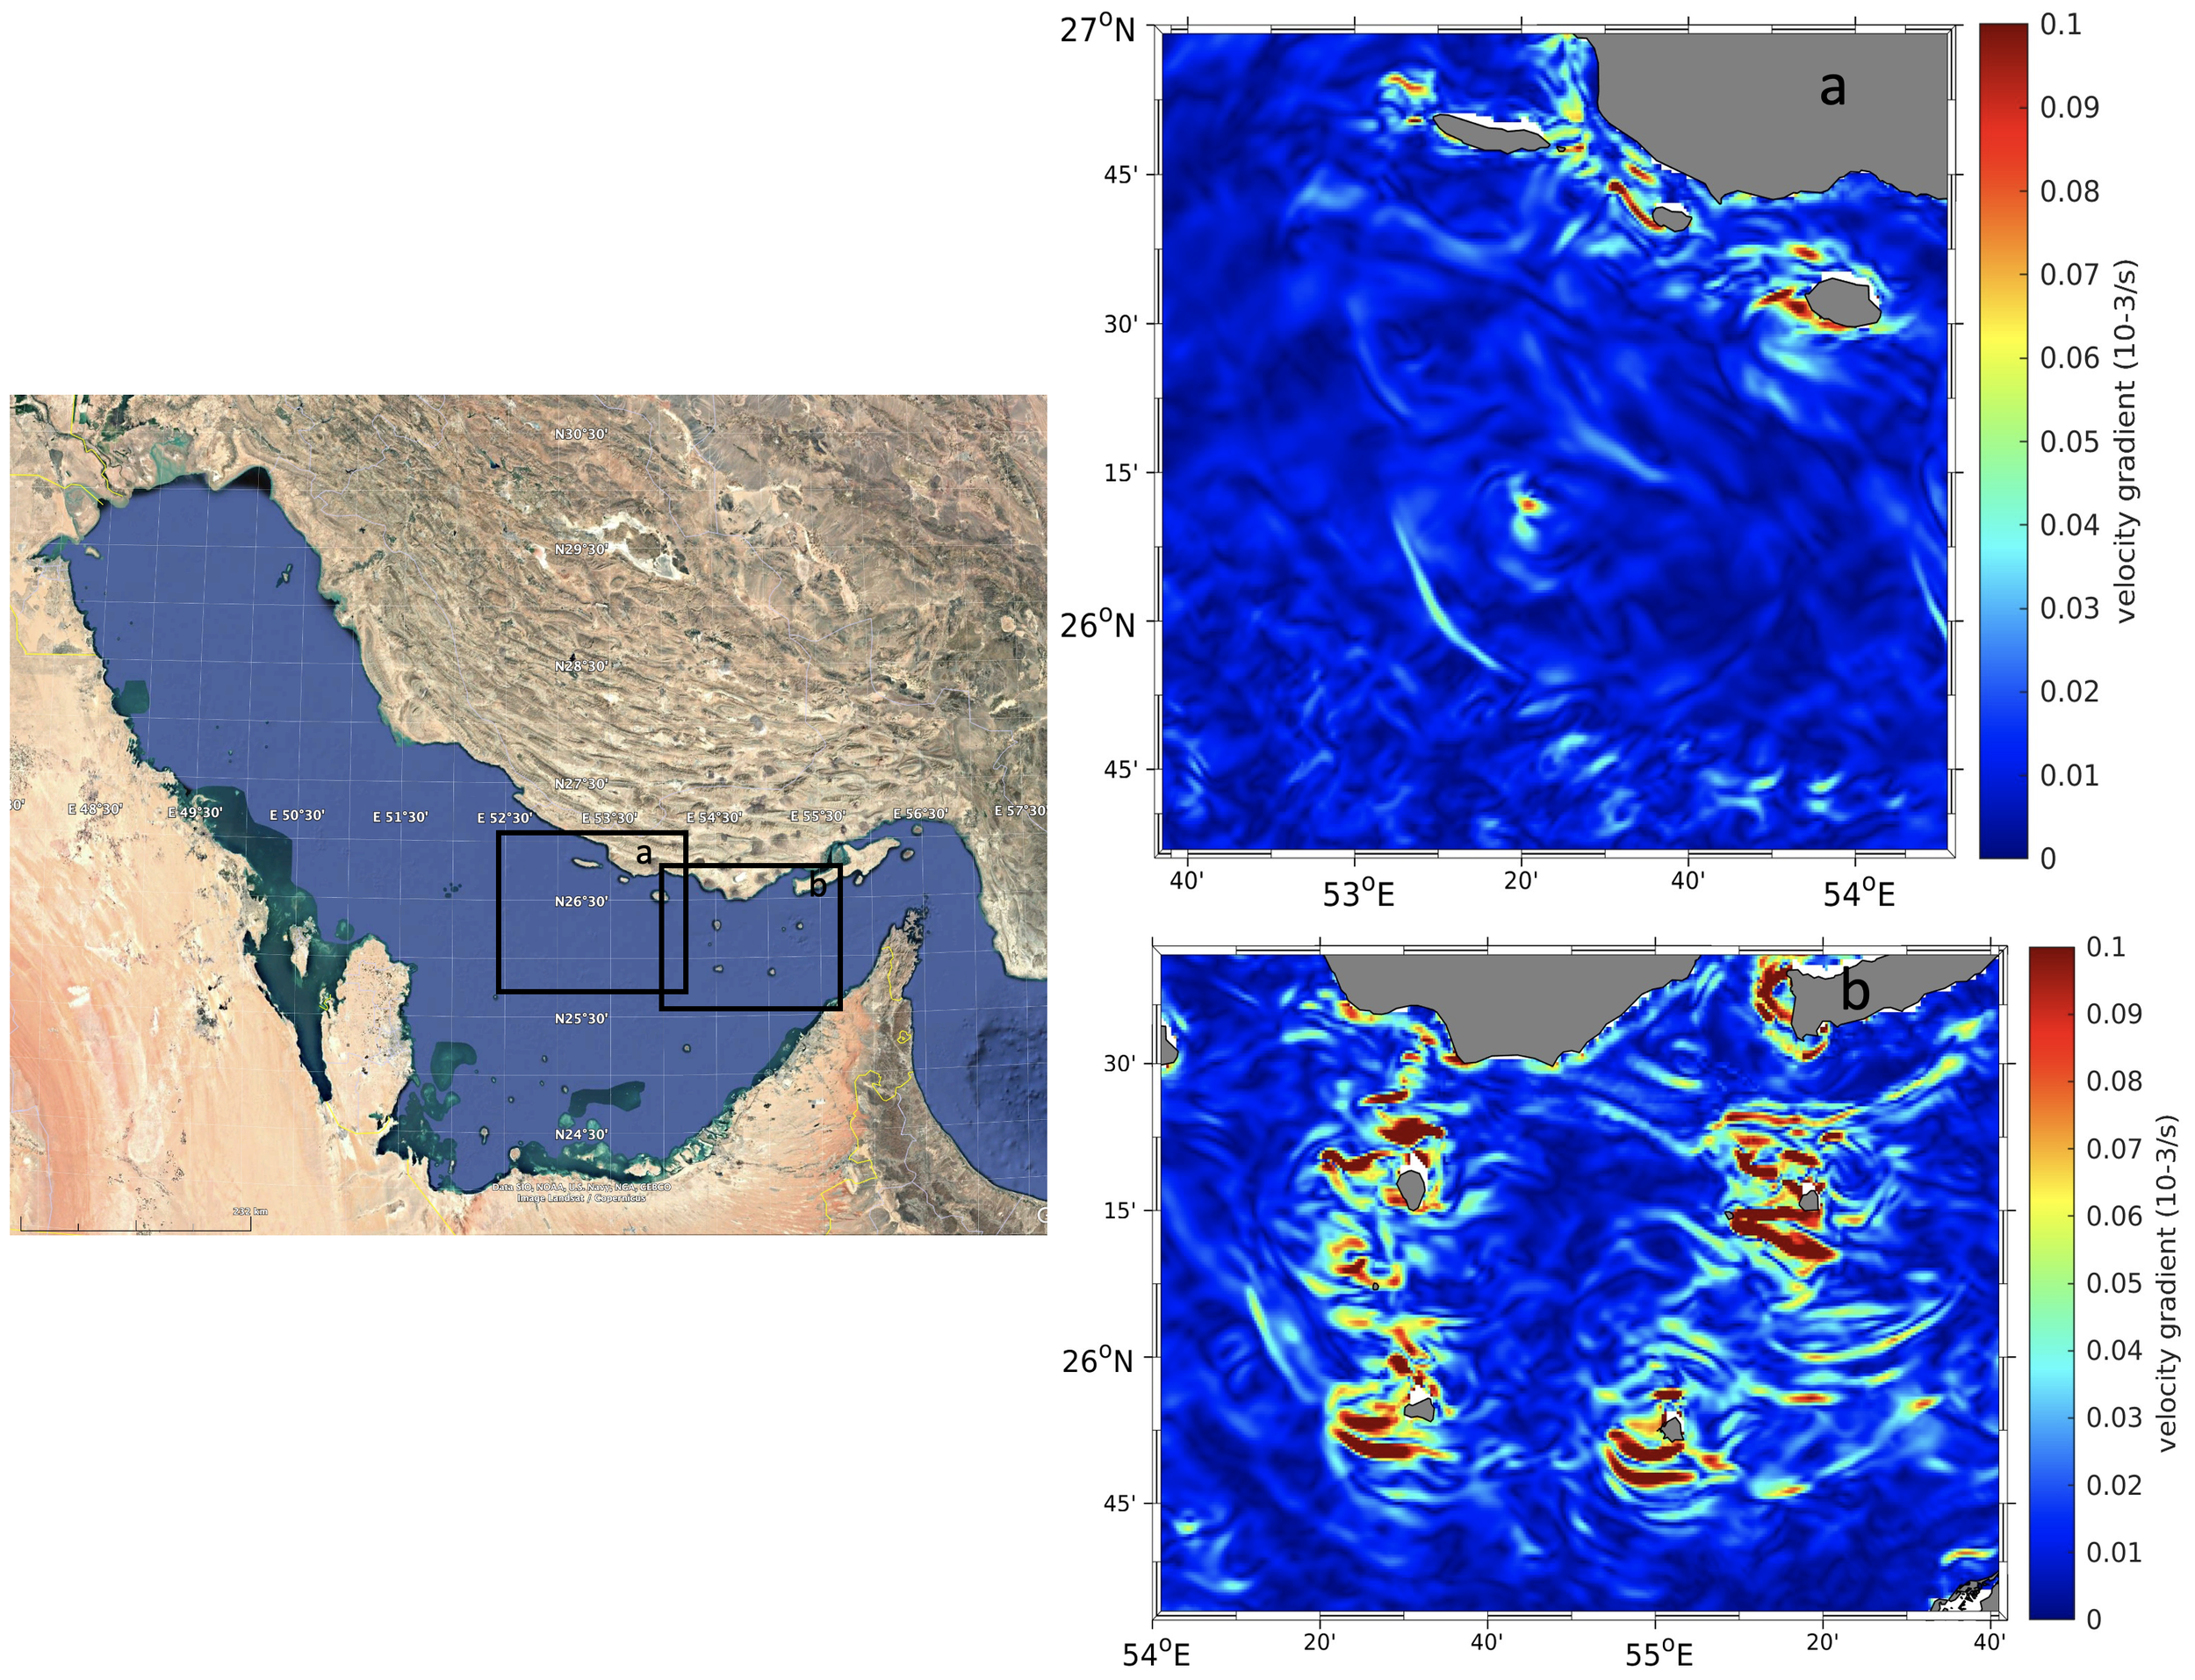
(a) and (b) show sea surface velocity gradient calculated from the simulation results in summer, with locations indicated in the white dashed boxes in panel left panel.
Figure 16
Potential temperature field along the TRANS 1 as indicated in Figure 1 in the winter (top) and summer (bottom).
Figure 17
Potential temperature filed along TRANS 2 as indicated in Figure 1 in the winter (top) and summer (bottom).
6 Summary
Baroclinic tides and their associated processes play a significant role in the Arabian Gulf, which is characterized by its unique and expansive marine ecological system. Despite this importance, information regarding tide circulation in the Arabian Gulf, particularly the characteristics of baroclinic tides, is scarce. For the first time, to the best of our knowledge, baroclinic tides in the Arabian Gulf were numerically simulated using a 3D, non-hydrostatic and high-resolution MITgcm.
Several available observations were used to validate the simulated results. Overall, a strong correlation was observed between the model outputs and the available tidal elevation amplitudes and phases at 26 coastal stations. The correlation coefficients were notably high, and the standard deviations for diurnal components were low; the simulation results of the dominant semi-diurnal tidal components were reasonably accurate. The model outputs demonstrated good agreement with OTIS data, with minor disparities mainly around the amphidromic points. The results highlight the importance of high-resolution bottom topography for precise tidal simulation in the Arabian Gulf. The comparison of tidal currents from mooring data in the strait revealed an overall satisfactory agreement with the simulation results.
The characteristics of baroclinic tides and the associated barotropic tides were analyzed and discussed based on the model outputs. The properties of barotropic velocities combined with the forcing function revealed four potential areas for the generation of baroclinic tides in the Arabian Gulf: (a) the narrow Strait of Hormuz; (b) the entrance along the trough with four main islands of Farur, Siri, Abumusa, and Greater Tunb; (c) the central area along the trough with a few sea-bottom ridges and (d) the northern area after the secondary narrow part of the axial trough. These areas were then confirmed by the spatial distribution of baroclinic tidal KE and energy fluxes. The conversion rate and the divergence of baroclinic energy fluxes further show quantitatively that the majority of this baroclinic energy disappears within the four areas, either via dissipation owing to friction and bottom drag or via conversion back into barotropic energy owing to pressure. With regard to the seasonal variation, in winter, only the (a) the Strait of Hormuz and half of (b) islands area present high values of baroclinic tidal KE values, whereas the other two areas not showing obvious baroclinic tides generated; the reason may be that in winter, a well-mixed upper layer of seawater exists, which prevents the formation of the disturbances along the thermocline plate. The good agreement in terms of the spatial distribution and seasonality between the simulation results and the occurrence of internal waves as revealed from satellite images indicates that the internal solitary waves in the Arabian Gulf are likely to be generated by the evolution of strong baroclinic tides. However, because of the limited model resolution, the direct simulation of the generation, propagation, and dissipation of these internal solitary waves warrants further investigation.
Statements
Data availability statement
The original contributions presented in the study are included in the article/supplementary material. Further inquiries can be directed to the corresponding author.
Author contributions
DG: Writing – original draft, Methodology, Investigation, Conceptualization. PZ: Writing – review & editing, Methodology, Investigation, Formal analysis, Conceptualization. JM: Writing – review & editing, Methodology, Investigation, Conceptualization. PV: Writing – review & editing, Methodology, Investigation, Conceptualization. GK: Writing – review & editing, Methodology, Conceptualization. HA: Writing – review & editing, Resources, Investigation, Funding acquisition, Conceptualization. IH: Writing – review & editing, Supervision, Project administration, Methodology, Investigation, Conceptualization.
Funding
The author(s) declare financial support was received for the research, authorship, and/or publication of this article. The reported research was supported by Saudi Aramco and the Office of Sponsored Research (OSR) at King Abdullah University of Science and Technology (KAUST) (Grant #RGC/3/5185-01-01).
Acknowledgments
This research made use of the resources from the Supercomputing Laboratory and/or computer clusters at King Abdullah University of Science and Technology.
Conflict of interest
The authors declare that the research was conducted in the absence of any commercial or financial relationships that could be construed as a potential conflict of interest.
Publisher’s note
All claims expressed in this article are solely those of the authors and do not necessarily represent those of their affiliated organizations, or those of the publisher, the editors and the reviewers. Any product that may be evaluated in this article, or claim that may be made by its manufacturer, is not guaranteed or endorsed by the publisher.
References
1
Akbari P. Sadrinasab M. Chegini V. Siadatmousavi M . (2016). Tidal constituents in the Persian Gulf, Gulf of Oman and Arabian Sea: a numerical study. Indian J. Geo-Mar. Sci. 45 (8), 1010–1016.
2
Alford M. H. Peacock T. MacKinnon J. A. Nash J. D. Buijsman M. C. Centurioni L. R. et al . (2015). The formation and fate of internal waves in the South China Sea. Nature521, 65–69. doi: 10.1038/nature14399
3
Alpers W. (1985). Theory of radar imaging of internal waves. Nature314, 245–247. doi: 10.1038/314245a0
4
Al Senafi F. Anis A. (2020). Internal waves on the continental shelf of the northwestern Arabian Gulf. Front. Mar. Sci.805. doi: 10.3389/fmars.2019.00805
5
Andi S. Rashidi Ebrahim Hesari A. Farjami H. (2021). Detection of internal waves in the Persian Gulf. Remote Sens. Lett.12, 190–198. doi: 10.1080/2150704X.2020.1847349
6
Baines P. G. (1982). On internal tide generation models. Deep Sea Res. Part A. Oceanographic Res. Papers29, 307–338. doi: 10.1016/0198-0149(82)90098-X
7
Chen C. Liu H. Beardsley R. C. (2003). An unstructured grid, finite-volume, three-dimensional, primitive equations ocean model: application to coastal ocean and estuaries. J. atmospheric oceanic Technol.20, 159–186. doi: 10.1175/1520-0426(2003)020<0159:AUGFVT>2.0.CO;2
8
Davies A. M. Kwong S. Flather R. A. (1997). A three-dimensional model of diurnal and semidiurnal tides on the European shelf. J. Geophysical Res.: Oceans102, 8625–8656. doi: 10.1029/96JC03854
9
Egbert G. D. Bennett A. F. Foreman M. G. (1994). Topex/poseidon tides estimated using a global inverse model. J. Geophysical Res.: Oceans99, 24821–24852. doi: 10.1029/94JC01894
10
Egbert G. D. Erofeeva S. Y. (2002). Efficient inverse modeling of Barotropic Ocean tides. J. Atmospheric Oceanic Technol.19, 183–204. doi: 10.1175/1520-0426(2002)019<0183:EIMOBO>2.0.CO;2
11
Elahi K. Z. Ashrafi R. A. (1992). “Computer Modelling of the Tides of the Arabian Gulf,” in Computer Modelling of the Tides of the Arabian Gulf (Springer Netherlands, Dordrecht), 161–173. doi: 10.1007/978-94-011-2878-013
12
Emery K. O. (1956). Sediments and water of Persian Gulf. AAPG Bull.40, 2354–2383.
13
Farjami H. Andi S. (2021). Satellite image dataset of internal waves in the Persian Gulf. Int. J. Maritime Technol.16, 107–110.
14
Garrett C. Kunze E. (2007). Internal tide generation in the deep ocean. Annu. Rev. Fluid Mech.39, 57–87. doi: 10.1146/annurev.fluid.39.050905.110227
15
Guo D. Akylas T. Zhan P. Kartadikaria A. Hoteit I. (2016). On the generation and evolution of internal solitary waves in the southern red sea. J. Geophysical Res.: Oceans121, 8566–8584. doi: 10.1002/2016JC012221
16
Guo D. Kartadikaria A. Zhan P. Xie J. Li M. Hoteit I. (2018). Baroclinic tides simulation in the red sea: Comparison to observations and basic characteristics. J. Geophysical Res.: Oceans123, 9389–9404.
17
Hunter J. R. (1983). Aspects of the dynamics of the residual circulation of the Arabian Gulf. In: Coastal Oceanography. NATO Conference Series. GadeH. G.EdwardsA.SvendsenH. (eds). vol 11. (Boston, MA: Springer). doi: 10.1007/978-1-4615-6648-9_3
18
Johns W. E. Yao F. Olson D. B. Josey S. A. Grist J. P. Smeed D. A. (2003). Observations of seasonal exchange through the straits of hormuz and the inferred heat and freshwater budgets of the Persian Gulf. J. Geophysical Res.: Oceans108 (C12), 108.
19
Kämpf J. Sadrinasab M. (2006). The circulation of the Persian Gulf: a numerical study. Ocean Sci.2, 27–41. doi: 10.5194/os-2-27-2006
20
Langodan S. Cavaleri L. Benetazzo A. Bertotti L. Dasari H. P. Hoteit I. (2023). The peculiar wind and wave climatology of the Arabian Gulf. Ocean Eng.290, 116158. doi: 10.1016/j.oceaneng.2023.116158
21
Marshall J. Hill C. Perelman L. Adcroft A. (1997). Hydrostatic, quasi-hydrostatic, and nonhydrostatic ocean modeling. J. Geophysical Res.: Oceans102, 5733–5752. doi: 10.1029/96JC02776
22
Mashayekh Poul H. Backhaus J. Huebner U. (2016). A description of the tides and effect of qeshm canal on that in the Persian Gulf using two-dimensional numerical model. Arabian J. Geosciences9, 1–11.
23
Munk W. Wunsch C. (1998). Abyssal recipes ii: energetics of tidal and wind mixing. Deep Sea Res. Part I: Oceanographic Res. Papers45, 1977–2010.
24
Niwa Y. Hibiya T. (2004). Three-dimensional numerical simulation of m2 internal tides in the East China Sea. J. Geophysical Res.: Oceans109 (C4), 109.
25
Pawlowicz R. Beardsley B. Lentz S. (2002). Classical tidal harmonic analysis including error estimates in matlab using t tide. Comput. Geosciences28, 929–937. doi: 10.1016/S0098-3004(02)00013-4
26
Pineda J. (1994). Spatial and temporal patterns in barnacle settlement rate along a southern California rocky shore. Mar. Ecol. Prog. Ser.107, 125–138. doi: 10.3354/meps107125
27
Pous S. Carton X. Lazure P. (2012). A process study of the tidal circulation in the Persian Gulf. Open J. Mar. Sci.2, 131–140. doi: 10.4236/ojms.2012.24016
28
Pugh D. (2004). Changing sea levels: effects of tides, weather and climate (Cambridge, England: Cambridge University Press).
29
Rashidi Ebrahim Hesari A. Andi S. Farjami H. (2019). Study of internal waves in the Persian Gulf using field data and satellite images. Int. J. Coast. Offshore Eng.2, 9–16. doi: 10.29252/ijcoe.2.4.9
30
Reynolds R. M. (1993). Physical oceanography of the gulf, strait of hormuz, and the gulf of Oman—results from the mt mitchell expedition. Mar. pollut. Bull.27, 35–59.
31
Sabbagh-Yazdi S.-R. Zounemat-Kermani M. (2009). Numerical solution of tidal currents at marine waterways using wet and dry technique on galerkin finite volume algorithm. Comput. fluids38, 1876–1886. doi: 10.1016/j.compfluid.2009.04.010
32
Simmons H. L. Jayne S. R. Laurent L. C. S. Weaver A. J. (2004). Tidally driven mixing in a numerical model of the ocean general circulation. Ocean Model.6, 245–263. doi: 10.1016/S1463-5003(03)00011-8
33
Sohrabi Athar M. Ardalan A. A. Karimi R. (2019). Hydrodynamic tidal model of the Persian Gulf based on spatially variable bed friction coefficient. Mar. Geodesy42, 25–45. doi: 10.1080/01490419.2018.1527799
34
Sugden W. (1963). Some aspects of sedimentation in the Persian Gulf. J. Sedimentary Res.33, 355–364. doi: 10.1306/74D70E57-2B21-11D7-8648000102C1865D
35
Teubner M. D. Najafi H. S. Noye B. J. Rasser P. E. (1999). “Modelling tides in the persian gulf using dynamic nesting,” in Modelling Coastal Sea Processes (World Scientific), 57–80.
36
Vasou P. Krokos G. Langodan S. Sofianos S. Hoteit I. (2024). Contribution of surface and lateral forcing to the Arabian Gulf warming trend. Front. Mar. Sci.10, 1260058. doi: 10.3389/fmars.2023.1260058
37
Wunsch C. Ferrari R. (2004). Vertical mixing, energy, and the general circulation of the oceans. Annu. Rev. Fluid Mech.36, 281–314. doi: 10.1146/annurev.fluid.36.050802.122121
38
Zilberman N. Becker J. Merrifield M. Carter G. (2009). Model estimates of m2 internal tide generation over mid-Atlantic ridge topography. J. Phys. Oceanogr.39, 2635–2651. doi: 10.1175/2008JPO4136.1
Summary
Keywords
baroclinic tides, mixing, The Arabian Gulf, internal solitary waves, stratification
Citation
Guo D, Zhan P, Ma J, Vasou P, Krokos G, Alghamdi H and Hoteit I (2024) Seasonal variation and fundamental characteristics of baroclinic tides in the Arabian Gulf. Front. Mar. Sci. 11:1475593. doi: 10.3389/fmars.2024.1475593
Received
04 August 2024
Accepted
07 October 2024
Published
18 November 2024
Volume
11 - 2024
Edited by
Kyung-Ae Park, Seoul National University, Republic of Korea
Reviewed by
Zhongxiang Zhao, University of Washington, United States
Xianqing Lv, Ocean University of China, China
Updates
Copyright
© 2024 Guo, Zhan, Ma, Vasou, Krokos, Alghamdi and Hoteit.
This is an open-access article distributed under the terms of the Creative Commons Attribution License (CC BY). The use, distribution or reproduction in other forums is permitted, provided the original author(s) and the copyright owner(s) are credited and that the original publication in this journal is cited, in accordance with accepted academic practice. No use, distribution or reproduction is permitted which does not comply with these terms.
*Correspondence: Ibrahim Hoteit, Ibrahim.hoteit@kaust.edu.sa
Disclaimer
All claims expressed in this article are solely those of the authors and do not necessarily represent those of their affiliated organizations, or those of the publisher, the editors and the reviewers. Any product that may be evaluated in this article or claim that may be made by its manufacturer is not guaranteed or endorsed by the publisher.