 Xiangyu Chen
 Yunlin Ni1,2*
- 1School of Marine Engineering Equipment, Zhejiang Ocean University, Zhoushan, China
- 2Key Laboratory of Nearshore Engineering Environment and Ecological Security, Second Institute of Oceanography, Hangzhou, China
- 3Zhoushan Natural Resource Surveying and Mapping Design Center, Zhoushan, China
- 4Zhoushan Marine Environment Monitoring and Forecasting Center, Zhoushan, China
Typhoon waves possess significant destructive potential, and their numerical simulation relies on accurate sea surface wind fields. An evaluation of different combinations of the radial air pressure distribution coefficient B and the radius of maximum wind speed (Rmax) in the Holland wind field (HWF) model was conducted to determine the optimal configuration. The HWF and the ERA5 wind field (EWF) were used as input wind fields to drive the typhoon wave model for China’s coastal waters. Validation results indicated that neither wind field accurately reflected real conditions; therefore, a hybrid wind field (HBWF) was created by combining HWF and EWF using weighting coefficients that vary with the radius of wind speed to enhance accuracy. Simulation results showed that the HBWF improved the accuracy of significant wave heights (SWHs), with a mean relative error of 25.29%, compared to 32.48% for HWF and 27.94% for EWF. Additionally, HBWF also demonstrated the best performance in terms of root mean square error (RMSE) and consistency index. Overall, the HBWF enhances the simulation accuracy of typhoon waves in China's coastal waters.
1 Introduction
The typhoon wind field is the way in which wind speed and direction are distributed around the typhoon. Typically, the wind field of a typhoon is in the shape of a spiral, with the strongest winds near the center and gradually weakening winds in the outlying areas. Meteorological studies have highlighted two primary characteristics of the typhoon wind field: the eyewall, which is the strongest wind region near the center of the typhoon, and the storm region, which is the area beyond the eyewall where wind speeds gradually decrease (Emanuel, 2003). Studies on simulating typhoon wind fields can be categorized into three types. The first is the parameterized wind field models, which derive the distribution of typhoon characteristics parameters from observed data such as central pressure difference, typhoon movement direction, typhoon center movement speed, and maximum wind speed radius (Rmax), and use mathematical and physical equations to characterize the wind field of typhoons (Fang et al., 2021). parameterized wind field models (Myers, 1957; Jelesnianski, 1965; Holland, 1980; Wang et al., 1991) depend significantly on parameter selection, and varying parameter selections might produce varying simulation outcomes, thus increasing model uncertainty. The Rmax and parameter B are key factors in constructing the wind field, which exhibits different properties in different oceans and also fluctuates with latitude in specific oceans (Fang et al., 2020). Consequently, empirical formulas for the parameter B and the Rmax have been proposed and investigated for different sea areas (Love and Murphy, 1984; Hubbert et al., 1991; Harper and Holland, 1999; Vickery et al., 2000; Jakobsen and Madsen, 2004; Willoughby and Rahn, 2004; Powell et al., 2005; Xie et al., 2006; Holland, 2008; Vickery and Wadhera, 2008). The second type involves reanalyzing wind field data by utilizing meteorological data and sophisticated numerical modeling techniques. This process aims to examine historical meteorological data, establish statistical correlations to describe the wind field properties of typhoons and generate meteorological field data with high spatiotemporal resolution. Frequently used reanalyzed wind field data include the ERA series wind field data from the European Centre for Medium-Range Weather Forecasts (ECMWF), the CFS series wind field data from the Climate Forecast System of the U.S. National Weather Service, and the Cross-Calibrated MultiPlatform (CCMP) data from the Physical Oceanography Distributed Active Archive Center (PO.DAAC) of NASA (Moeini et al., 2010; Carvalho et al., 2013; Miao et al., 2020). These models are more significant in representing patterns and characteristics in historical observational data. However, generating reanalysis data necessitates a substantial amount of observational data for validation. In certain regions or time periods, there may be missing or incomplete observational data, which can impact the spatial coverage and temporal consistency of the data. The third type entails superimposing parameterized wind fields onto reanalysis data to enhance the accuracy of the wind field.
Typhoon waves have enormous destructive potential and can cause marine accidents, coastal erosion, structural damage, and various other disasters (Wang et al., 2019; Gong et al., 2022) The accuracy of typhoon wave numerical simulations is intricately linked to the accuracy of the sea surface wind fields (Torres et al., 2019). Currently, reanalysis data and parameterized wind fields have been used by many scholars for typhoon wave hindcasting, examining the impact of various wind field models on the accuracy of typhoon wave simulations. Various reanalysis data and parameterized wind fields behave differently in typhoon wave simulations. The ERA5 wind field (EWF) can provide higher accuracy for the Simulating Waves Nearshore (SWAN) model in the Black and Azov Seas compared to the CFSR wind field (Amarouche et al., 2021). Li et al. (2023) based on measured data from different coastal observation points in China, compared the wind speeds in ERA5 and ERA-Interim reanalysis data, as well as the wave models driven by these two reanalysis data sets calculate the significant wave heights (SWHs). They found that the accuracy of the wind field data is one of the main reasons for errors in wave simulation in the near seas of China, and ERA5 data is more accurate than ERA-Interim in simulating typhoon waves. The performance of typhoon wave simulation using the ERA5 wind field model is better than that using the ERAI, CCMP, and CFSv2 wind field models (Aydoğan and Ayat, 2021; Li et al., 2021). Among the four different parameterized wind field models, Fujita, nested Fujita + outer domain Takahashi, corrected outer domain Fujita, Jelesnianski, and HWF models, the HWF model has the advantage of allowing the adjustment of typhoon structure-related parameter B, which is able to adapt to various typhoon field structures (Zhang et al., 2015). By controlling the background wind field consistently and changing the parameterized wind field to compare the performance difference between different parameterized wind fields used to construct the hybrid wind field, from the results of the typhoon wave simulation of the four sets of combining methods, namely, CCMP+Fujita, CCMP+Myers, CCMP+Jelesnianski, and CCMP+Holland, the HWF model performs the best in the parameterized models with the best performance among them (Tang et al., 2013). Several studies integrate wind fields to construct hybrid wind fields (HBWFs) in order to enhance the precision of wind fields and improve the accuracy of numerical simulations of typhoon waves. For example, Improving the wind field by combining the Holland+Miyazaki wind field with the EWF can improve the accuracy of the Hainan Island sea area in China in the numerical simulation of typhoon waves (Jiang et al., 2023). Hybrid wind field (HBWF) created using the WRF wind field model and HWF model also improves the accuracy of typhoon wave simulation in the southeastern coastal region of Iran (Mazyak and Shafieefar, 2022). The Myers wind field model yields wave height values that are more accurate compared to the observed values when located near the center of the typhoon. Conversely, the CCMP wind field model demonstrates better alignment with the measured values when situated farther away from the typhoon’s center. The HBWF, which integrates the strengths of both the Myers wind field model and the CCMP wind field model, produced accurate numerical simulations of typhoon waves that closely matched the measured values (Jin et al., 2015).
In comparing the suitability of different reanalysis data, studies generally suggest that ERA5 reanalysis data is more accurate (Amarouche et al., 2021; Aydoğan and Ayat, 2021; Li et al., 2021, 2023). The HWF model is widely recognized for its ability to facilitate more precise typhoon wave simulations in parameterized wind field models (Tang et al., 2013; Zhang et al., 2015). Currently, the use of the HWF is relatively cumbersome, often requiring reconstruction or adjustment for practical application, and it has significant geographic limitations. For example, the parameters Rmax and B are highly sensitive to the azimuth angle prior to typhoon landfall. In China’s coastal waters, researchers have utilized ERA5 as the driving wind field in model construction, and the overall performance of these models has been relatively good. However, some validation efforts have revealed that there is a certain discrepancy between the maximum surge results obtained from the model and the observed values (Yang et al., 2022). In recent years, many researchers have applied HBWF for the simulation of waves or surges. For instance, HBWF can be effectively used to study the impact of wave-current interaction on sediment dynamics (Li et al., 2022), and to analyze their effects on wave heights and storm surges in coastal waters (Wu et al., 2021), as well as the calculation of maximum SWH (Yi et al., 2023). Overall, in the numerical simulation of typhoon waves in China’s coastal waters, reconstructed HWF or EWF are typically used as input wind fields for typhoons. Alternatively, parameterized wind fields are superimposed on reanalysis data to form the HBWF for input. However, there is currently a deficiency in comprehensive and systematic studies regarding the spatial suitability and comparison between the HWF and the EWF, as well as the enhancement effects of the HBWF created by integrating these two wind fields. Furthermore, there is inadequate validation of these methodologies.
In this study, 14 typhoons affecting China’s coastal waters were selected to determine the optimal combination of parameters B and Rmax applicable to the study area of this study to construct the Holland wind field, and the HWF and EWF were selected as the input wind fields of the MIKE21 SW typhoon wave model, respectively, to perform numerical simulations and error analyses in order to evaluate the performance of the different wind fields. Subsequently, the HWF is merged with the EWF to create the HBWF that varies with wind speed and radius. Similarly, the numerical simulation of typhoon waves is carried out to evaluate the enhancement in wind field performance and ascertain the suitability and accuracy of the HBWF in simulating typhoon waves in China’s coastal waters.
2 Model description
2.1 Wave mode
The numerical simulation of waves in this study is conducted using the MIKE21 SW model developed by the Danish Hydraulic Institute. This model is extensively utilized in the fields of ocean engineering and wave forecasting (Anton et al., 2019). The MIKE21 SW model operates on the idea of energy conservation and ensures equilibrium through the use of balanced equations. Furthermore, it incorporates a range of criteria for simulating shallow water, in addition to addressing the attributes of third-generation wave models. The wave source/sink term accounts for wind input, wave-wave interaction, and energy dissipation due to whitecapping, bottom friction, and depth-induced breaking, among other factors. The form of the control equation is as follows
Where t represents time, N is the spectral energy density, σ is the relative wave frequency, θ is the wave direction, Cx and Cyare the speeds at which the waves propagate along x and y directions, respectively. Cσ and Cθ represent the propagation speeds of the waves in the coordinate systems of σ and θ, respectively. S is the source-sink term and is expressed as follows
Where Sin represents the wind energy input term, Snl represents the energy transfer due to nonlinear interactions between waves, Sds represents the energy loss caused by wave whitecap dissipation, Sbot represents the energy loss due to wave bottom friction, and Ssurf represents the energy loss caused by wave breaking (Moeini and Etemad-Shahidi, 2007).
2.2 Water depth data and observation station locations
The accuracy of mathematical models relies heavily on water depth data. To satisfy the conditions for regional computations, water depth data is selected using the U.S. National Geophysical Data Center (NGDC) resolution of 1’×1’ from ETOPO1 data, with additional electronic nautical chart data near the observation stations. Figure 1 displays the dispersion of the observation stations, encompassing a total of 16 stations. Table 1 records the details of the observation stations. The dataset includes the significant wave height (SWH) at 10 m above sea level at the time of the typhoon, in addition to the wind speed data at Haiyang, Penglai, Binghaigang, Zhoushan, Xiazhi, Wenzhou, and Zhujiang stations. In this study, wind speed and SWH are verified for the stations with complete data, and SWH is verified for the stations without collected wind speed data.
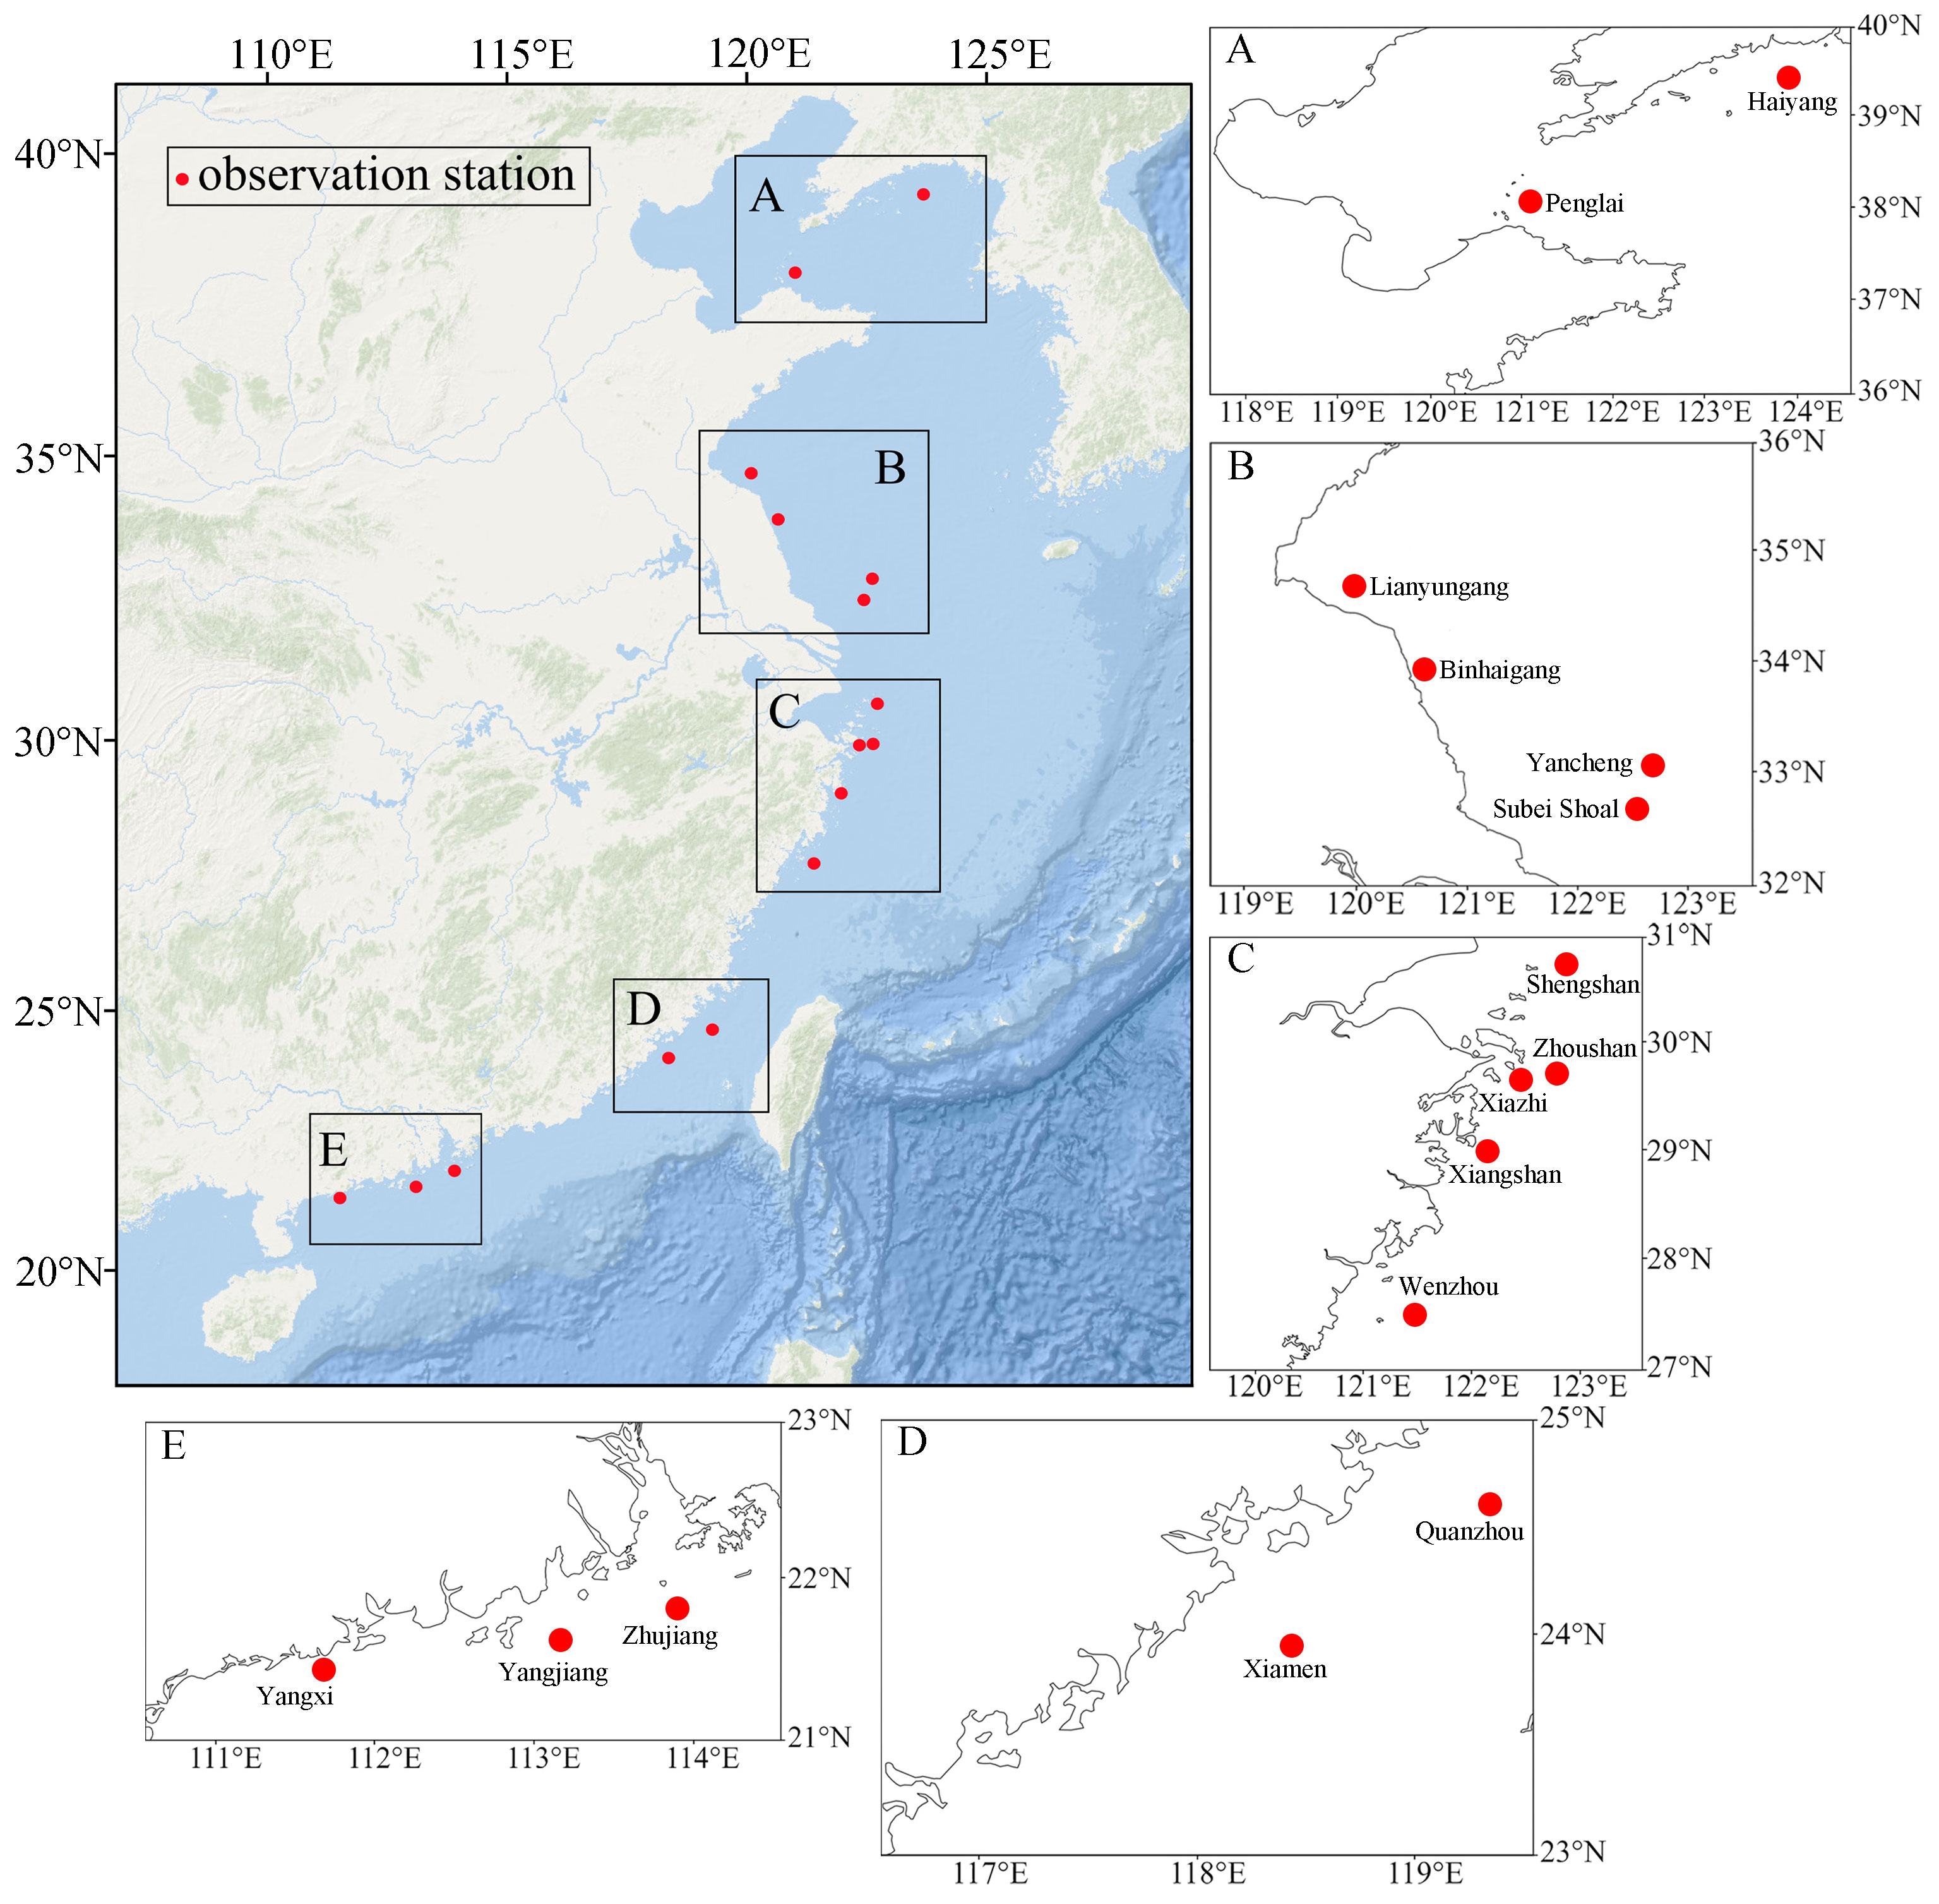
Figure 1. Location of the observation stations. The observation stations are located in the Bohai Sea and the Yellow Sea (A, B), the East China Sea (C, D), and the northern South China Sea (E).
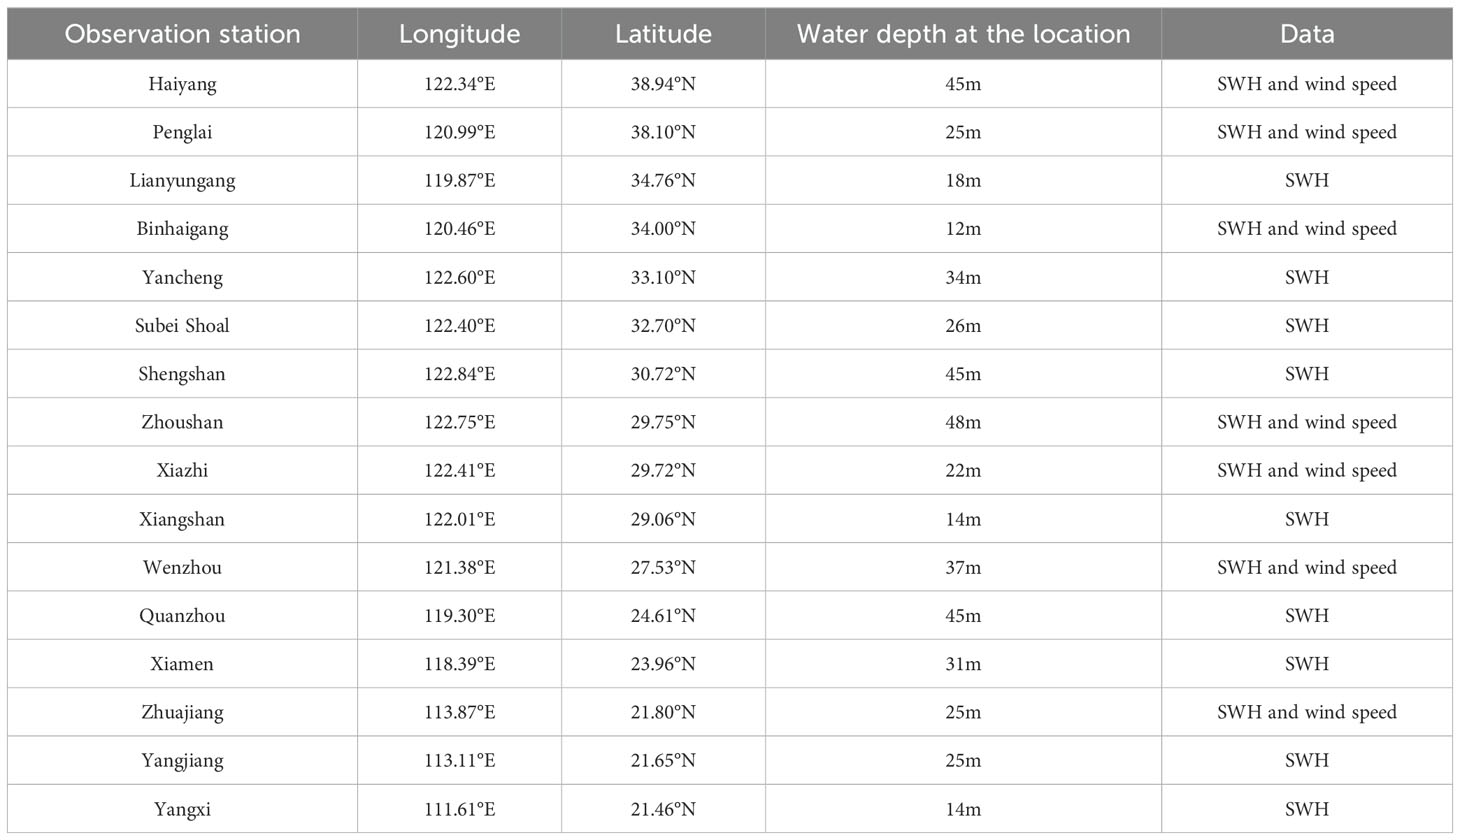
Table 1. Observation station locations, water depths and data.
2.3 Model configurations
Shoreline data was obtained from high-precision data provided by the National Geophysical Data Center (NGDC) (https://www.ngdc.noaa.gov/mgg/shorelines/gshhs.html). The model domain ranges from 105.7°E in the west, 128.3°E in the east, 17.5°N in the south, and 40.9°N in the north. The model includes the Bohai Sea, the Yellow Sea, the East China Sea, and the northern part of the South China Sea (Figure 2A). The model (Figure 2B) uses an unstructured triangular grid consisting of 246465 grids with 128134 nodes. The resolution of the model grid is set to 60 km at the open ocean boundary to improve computational efficiency and accuracy (Li et al., 2022). The resolution of the grid in the coastal area was refined to 50 m because of the complex shoreline and island structure. The time step of the model is 0.01-600 s to ensure that the model computation always meets the convergence condition of CFL<1. The wave breaking equation uses the model of Battjes and Janssen (Battjes and Janssen, 1978), and the model was debugged the final breaking parameter was chosen to be 0.79; the whitecap dissipation coefficient Cdis was taken to be 4.5; and the rest of the parameters were taken to be the defaults according to the recommendations.
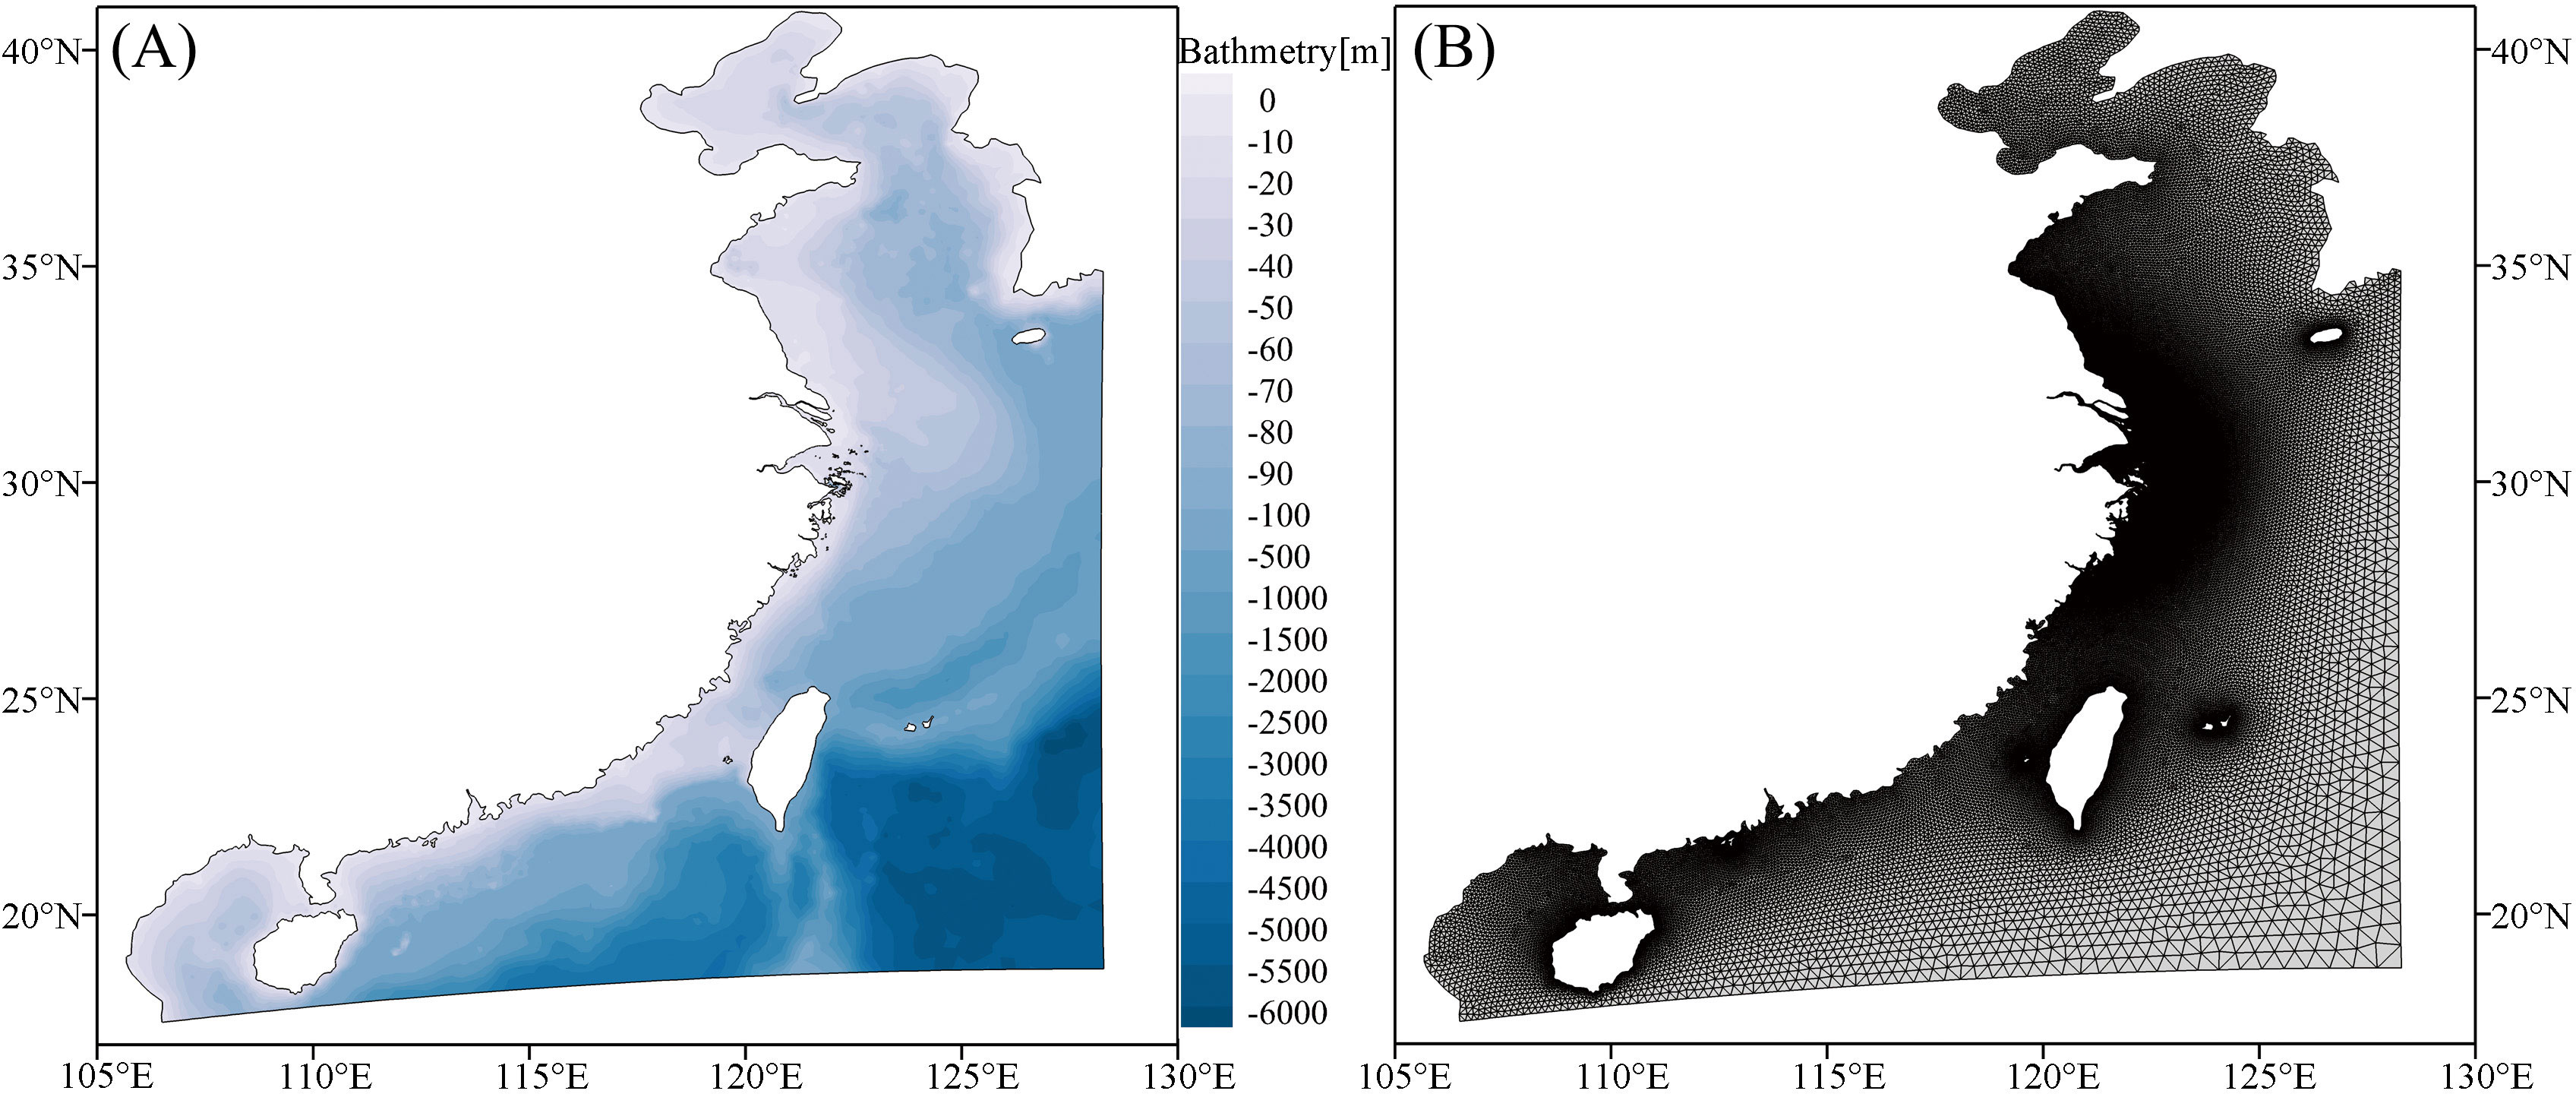
Figure 2. (A) Water depth of the model. (B) Mesh grids of the model.
2.4 Typhoon selection
Based on the typhoon time, track, and intensity data from the China Typhoon Network (http://www.typhoon.org.cn/) and current observational station data, 14 typhoons that have affected the Chinese coastal waters were chosen for statistical analysis to confirm the general applicability of the HBWF in China’s coastal waters. Figure 3 shows the tracks of the selected typhoons. The typhoon times on this website are in Beijing time, while this study standardizes them to Coordinated Universal Time (UTC).
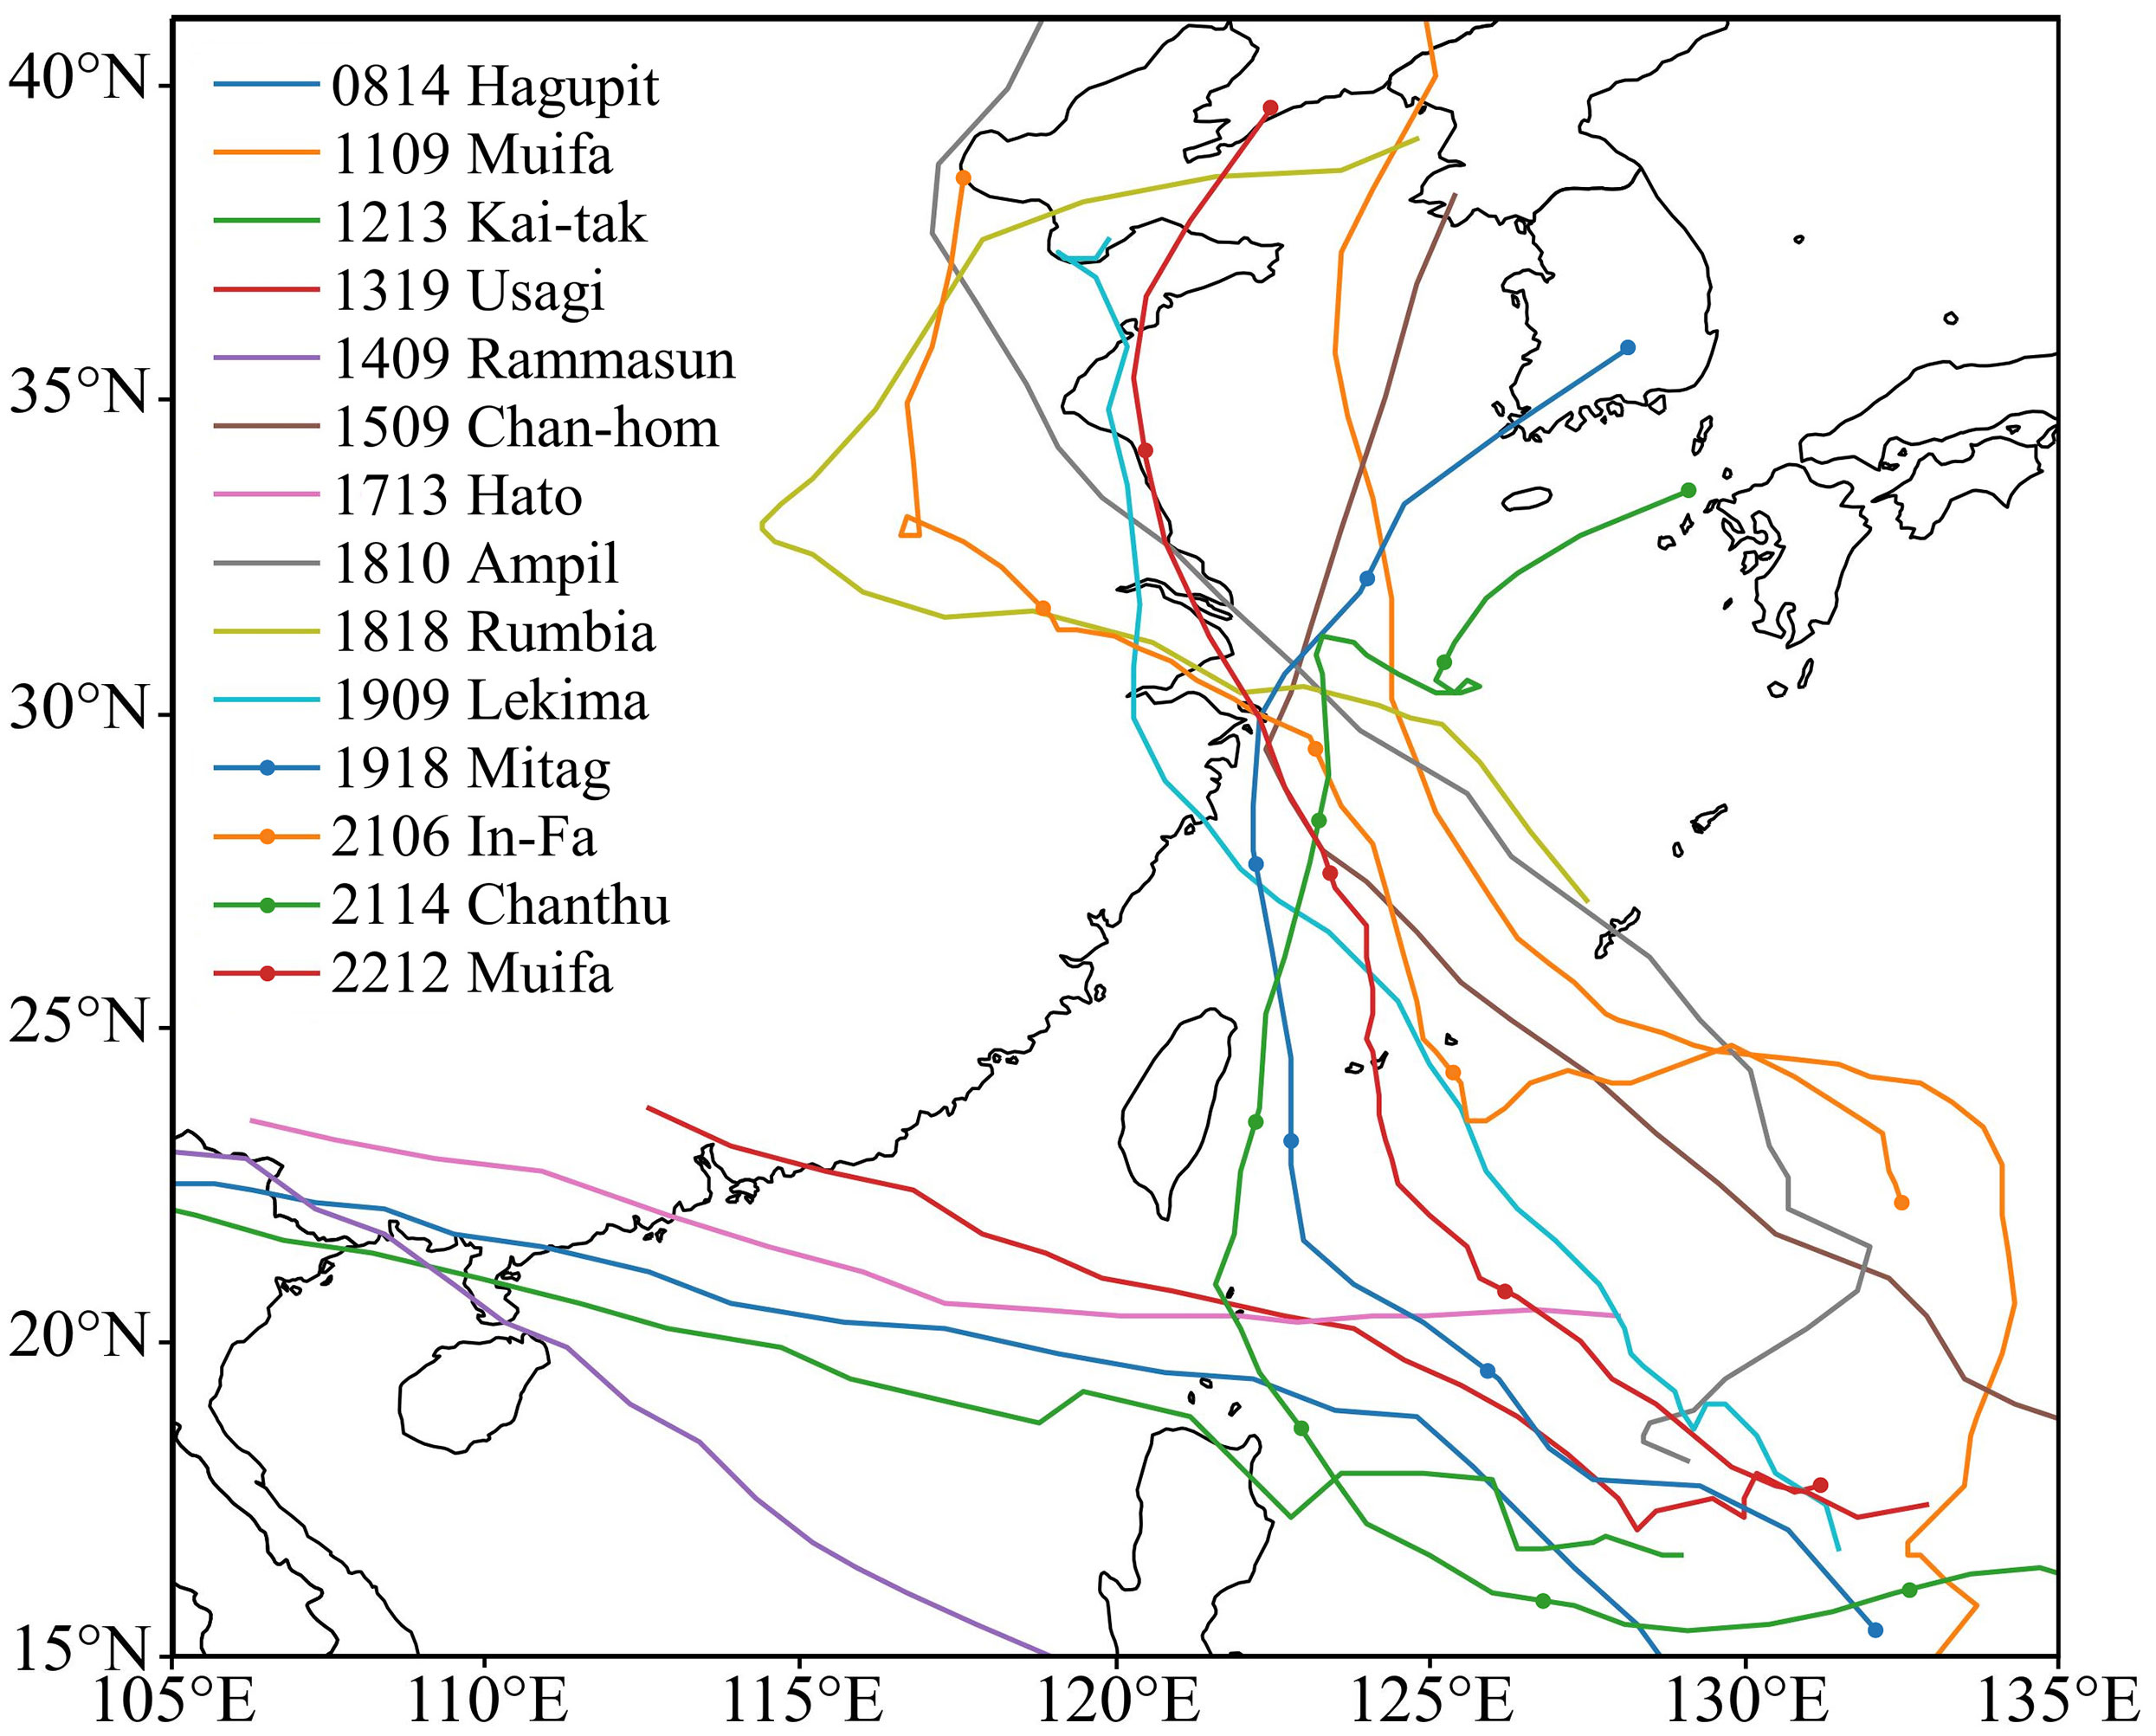
Figure 3. Tracks of fourteen typhoons selected in this study.
2.5 Selection of ERA5 wind field data
Developed by the European Centre for Medium-Range Weather Forecasts (ECMWF), EWF is a reanalysis dataset comprising 28 atmospheric assimilation systems that combine numerical simulation results with historical data from global climate data observations to provide global atmospheric data since 1940. ERA5 has made significant progress compared to the previous ERA-Interim (Feng and Chen, 2021). Currently, ERA5 data are updated in a timely manner, with the latest data typically released within 5 days, providing up to 240 variables. ERA5 utilizes a horizontal resolution of 0.25 degrees and an hourly temporal resolution, which is finer than the previous dataset and provides more accurate and detailed meteorological information. In this study, ERA5 was selected to reanalyze the meridional and zonal wind velocity fields at 10 m above sea level of the dataset. The spatial resolution of the wind field is 0.25°× 0.25°.
3 Research methods
3.1 Construction of the wind field
3.1.1 Holland wind field
The calculation methods of this parameterized wind field are usually divided into two main categories. One method is to utilize the typhoon elements such as Wmax and Rmax, and directly use the empirical formula to establish the typhoon wind field. The other method is to derive the typhoon pressure field from the typhoon elements and then calculate the typhoon wind field using the gradient wind relationship. Compared with other models, the HWF model adds a parameter B to adjust the pressure contour distribution, which can show the differences in the shape of the pressure contours of different typhoons, with fewer control parameters, higher accuracy, and better applicability (Holland, 1980). Therefore, the HWF model is used for simulation in this study. The pressure equation and wind field equation of the HWF model are as follows
And
Where p(r) is the calculated pressure field, pc is the central pressure of the typhoon, pn is the peripheral pressure (taken as 1013 hPa), Vg(r) is the gradient wind speed, Rmax is the maximum wind speed radius, r represents the distance from the center of the typhoon, f is the Coriolis parameter, ρa is the air density; parameter B affects the kurtosis and intensity of the typhoon. As parameter B increases, the wind speed at the Rmax increases, and the wind speed at positions further from the center of the typhoon weakens.
Due to the influence of ground friction, it is necessary to convert the upper-level wind speed to surface wind speed. Using the formula proposed by Harper (2001). The formula for obtaining the surface wind speed is as follows:
Where Vm is the surface wind speed, Vg is the upper-level wind speed and Km is the conversion coefficient, which has different values. If Vg is less than 45 m/s, Km is 0.80; if Vg is greater than or equal to 45 m/s, Km is 0.67 (Xiong et al., 2022).
Parameter B will affect the kurtosis and intensity of the typhoon; as parameter B increases, the wind speed at the Rmax increases, while the wind speed at positions further from the center of the typhoon weakens. According to previous studies on parameter B (Willoughby and Rahn, 2004; Powell et al., 2005; Vickery and Wadhera, 2008; Fu et al., 2013; Lin and Fang, 2013; Wu et al., 2020; Wei et al., 2023). In this study, three parameters were selected for comparison, and the B1 (Hubbert et al., 1991), B2 (Wu et al., 2020), and B3 (Vickery and Wadhera, 2008) formula is as follows
Where Wmax represents the maximum wind speed, Lat represents the geographical latitude, ρ represents the air density, and e represents the natural logarithm, it is taken as 2.7183.
The Rmax is compared and studied using the formula Rmax1 obtained by Graham and Nunn (1959) for the Atlantic Ocean region and the formula Rmax2 obtained by Willoughby and Rahn (2004) for the Northwest Pacific Ocean region
3.1.2 Hybrid wind field
For wind fields far from the center of a typhoon, the reanalysis data is superior to the parameterized wind field models (Pan et al., 2016). However, compared to the reanalysis wind field, parameterized wind field models typically offer higher accuracy in generating wind fields near the center of a typhoon (Roldán et al., 2023). Therefore, combining the reanalysis wind field models and the parameterized wind field models can generate a better and more complete typhoon wind field (Tian and Zhang, 2021). This study combines the EWF and the HWF model in a better way. Unlike Shao et al. (2018) who exclusively used the HWF model for the typhoon center (r<2Rmax), this study improves the HBWF by introducing a weight coefficient that varies with the wind speed radius, which guarantees a seamless transition between the two wind fields. When r>7Rmax, the HWF model is deemed incapable of reflecting the real wind field, in which case the EWF can be used directly to describe this part of the wind field. The representation of the HBWF is as follows
Where VD represents the wind speed of the HBWF, VH represents the wind speed of the HWF, and VE represents the wind speed of the EWF, ec is the weight coefficient, where ec=C4/(1+C4), and C is a coefficient considering the typhoon impact range, taking C=r/(9Rmax), α is the wind speed correction parameter, taking α=(7-r/Rmax)/5 (Xiong et al., 2022).
3.2 Calculation formula for statistical parameters
To compare the performance of different combinations of parameters B and Rmax, the Wmax obtained from the HWF model constructed under different combinations is compared to the observed data for statistical analysis of errors, calculating the root mean square error (RMSE). Additionally, to compare the performance of different wind field models in simulating 14 typhoons, the error statistical analysis is conducted on the simulated SWH and wind speed using the HWF, EWF, and HBWF as input, calculating the mean relative error (MRE), RMSE, Correlation coefficient(CC), and the consistency index (I) proposed by Willmott (1981), which are calculated as follows
Where Mi represents the simulated value, Di represents the observed value, represents the simulated mean value, and represents the observed mean value, and N is the sample size. The closer the I value is to 1, the better the simulation results.
4 Numerical model validation and analysis
4.1 Combined validation of Rmax and parameter B
In the calculation of typhoon waves, researchers have studied the performance differences between the Rmax+B combinations in the Holland wind field, comparing the SWHs from different combinations at observation stations and conducting error analysis (Wang et al., 2019). However, from the perspective of the superposition principle of HBWFs, the accuracy of the peak wave results in the HWF is crucial, as Wmax determines the peak height of the waves. Therefore, when constructing the HWF, the error between Wmax and the observed values should be taken into account. In the Holland model, Rmax and parameter B largely determine the accuracy of Wmax. The expressions for Rmax and parameter B are mostly based on fitting results from actual measurements or numerical simulations. In this study, the combination of Rmax and parameter B selected is calculated and compared with the Wmax samples of 14 typhoons discussed in this study. The Wmax samples were selected from the China Typhoon Network, comprising a total of 356 samples. The comparison results are shown in Figure 4, where the horizontal offset is applied to overlapping points. From the statistical results and error analysis, it can be seen that the Rmax2+B2 combination has the smallest RMSE and the correlation coefficient closest to 1. Therefore, this study adopts the combination of Rmax2+B2 for constructing the HWF.
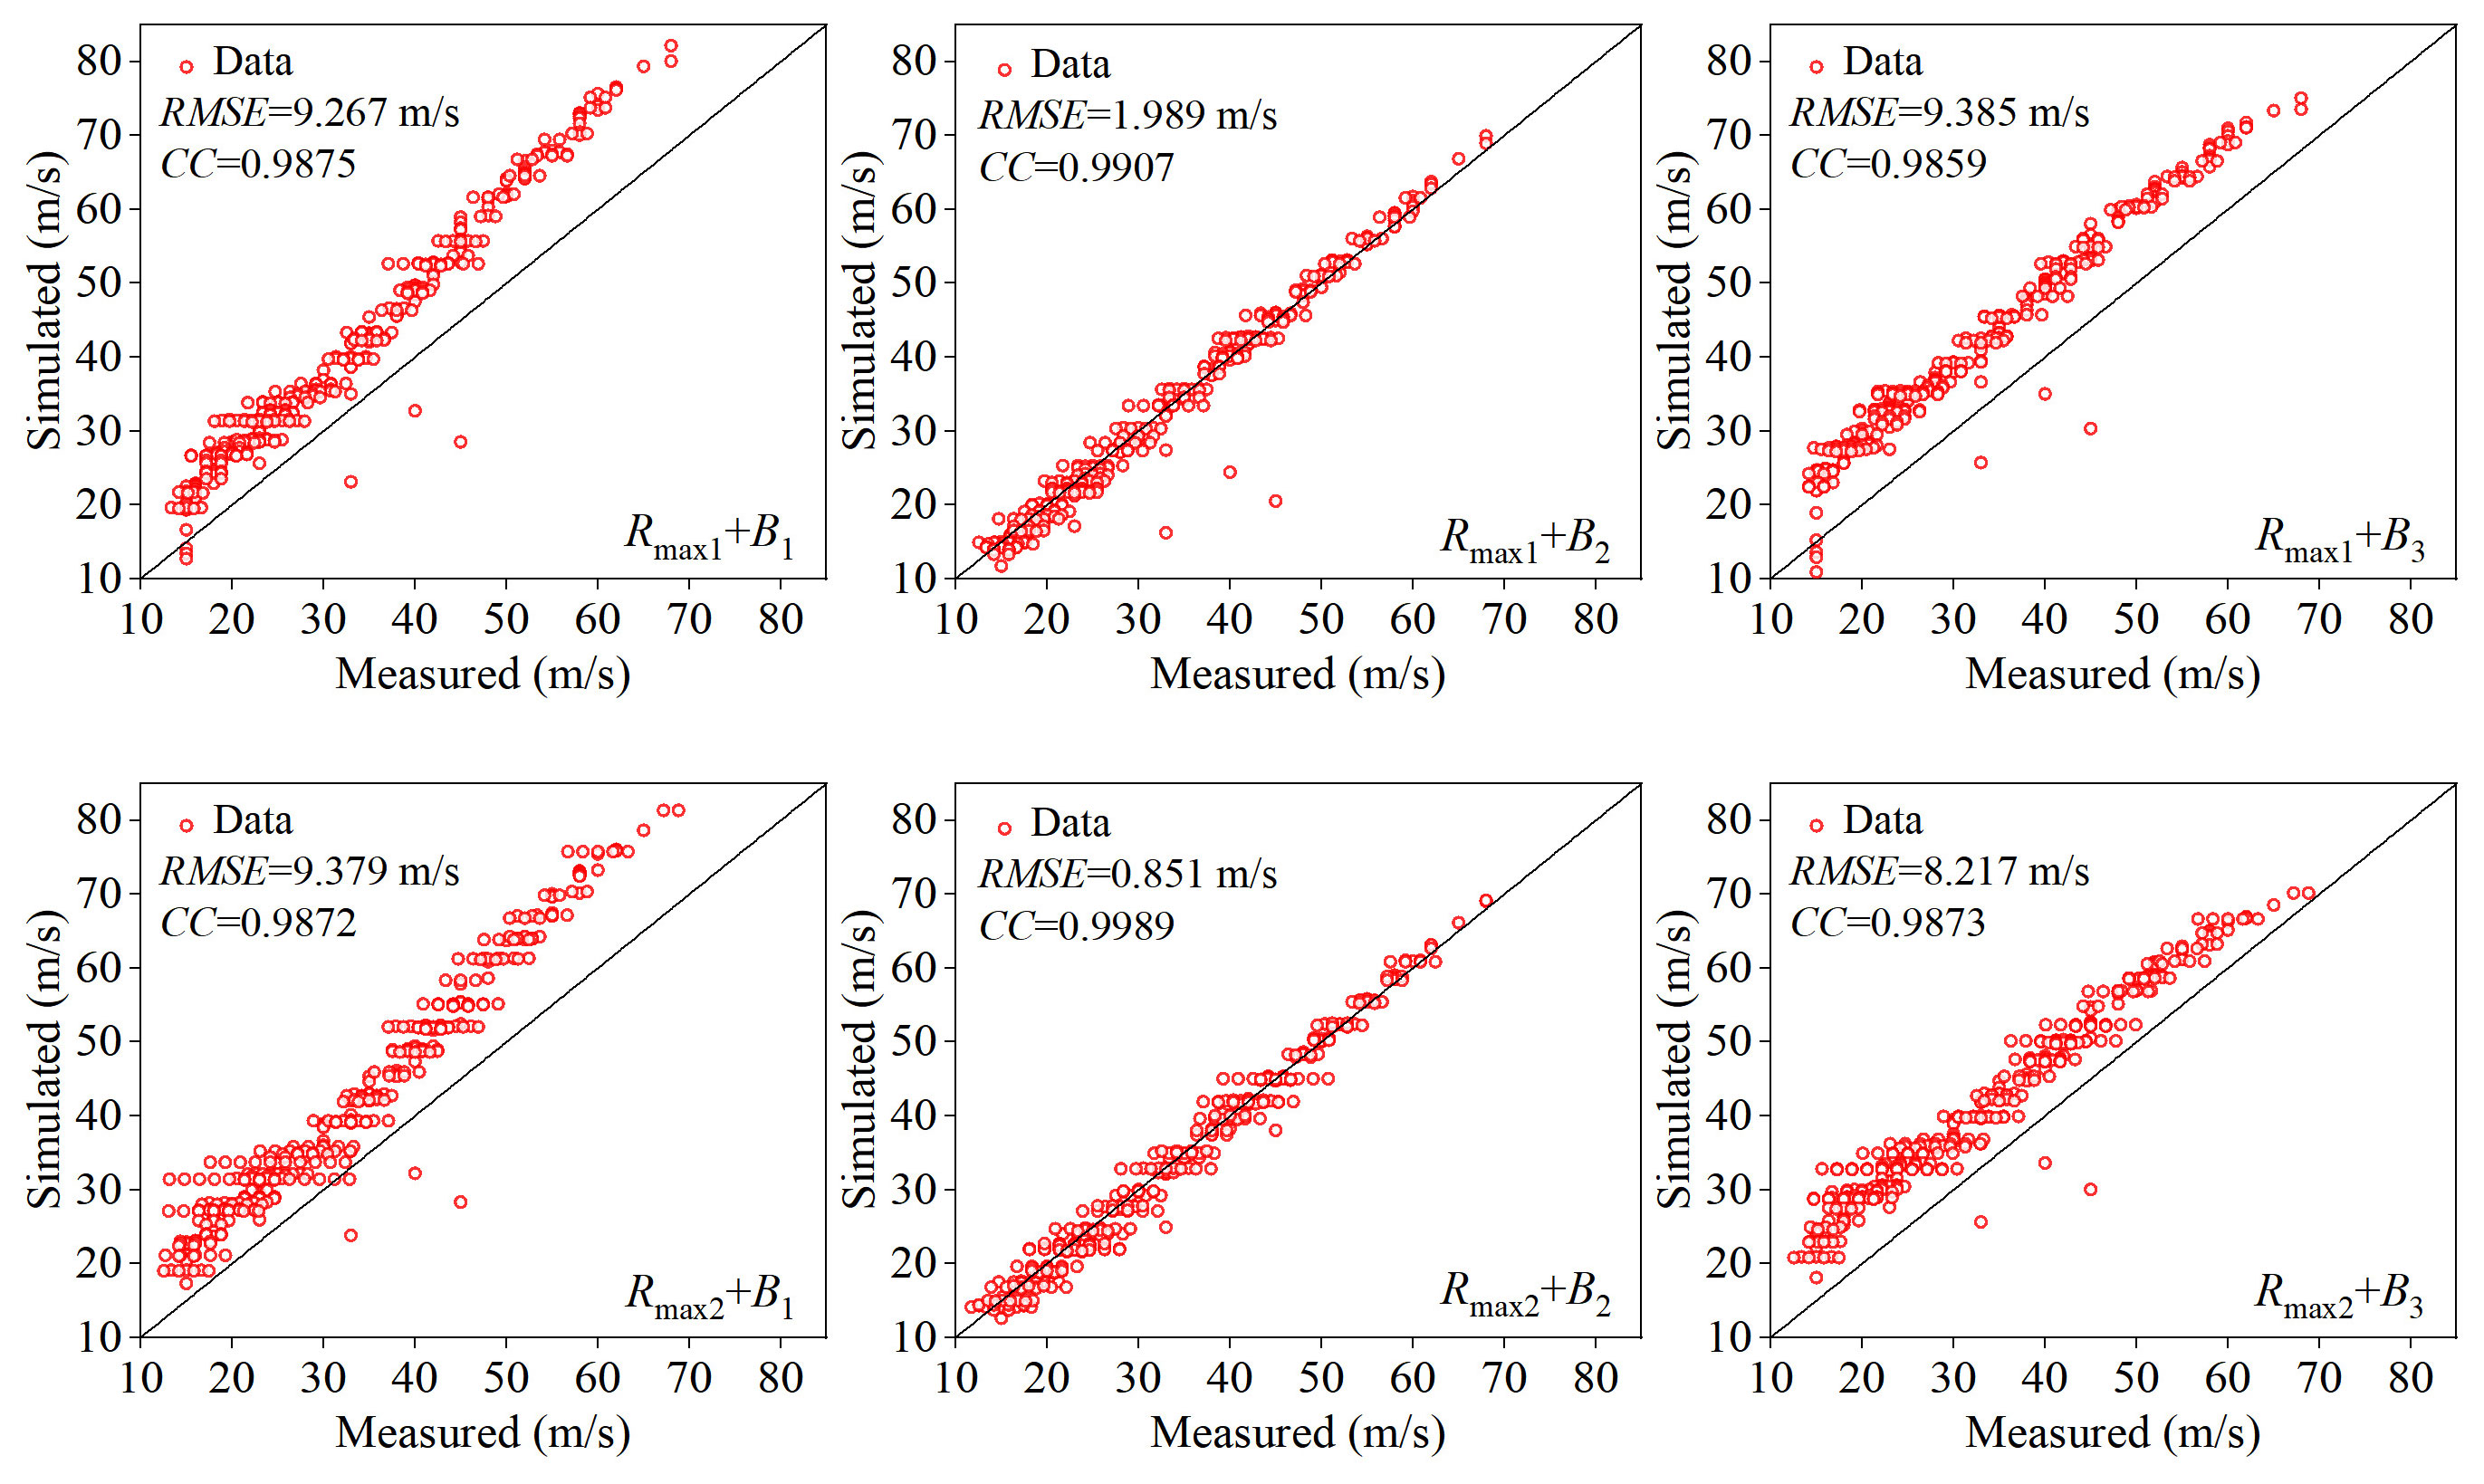
Figure 4. Comparisons between simulated and measured wind speeds under different empirical formulas of parameter B and Rmax.
4.2 Verification of typhoon wave model
To verify the reliability of the typhoon wave model, the observed values during Typhoon Mitag, Typhoon Rumbia, and Typhoon Hagupit will be compared with the wind speeds and SWHs simulated using HWF and EWF. The large latitude span between different observation stations allows for a more effective confirmation of the typhoon wave model’s validity in China’s coastal waters (Figure 5). The results indicate that the maximum wind speed and SWH obtained from the HWF simulations constructed in this study are relatively close to the observed values. For instance, the Wmax at the Zhoushan Station has a relative error of 9.66%, while the Wenzhou Station has a relative error of 10.19%. Similarly, the maximum SWH has a relative error of 1.19% at the Zhoushan Station and 1.44% at the Wenzhou Station. These findings suggest that the typhoon wave model, which incorporates the HWF, can accurately simulate the maximum SWH and Wmax observed during typhoon wave events. Nevertheless, the HWF ‘s ability to simulate wind speed and SWH is less efficient than that of the EWF when wind speeds are low. When the wind speed at the Wenzhou station is less than 10 m/s, the average relative inaccuracy of the wind speed is 32.00%. The EWF exhibits low wind speeds in the vicinity of the typhoon center, and the simulated maximum SWH is much lower than the observed values. As an example, the predicted maximum SWH at the Zhoushan Station has a relative error of 31.97%, whereas the Wenzhou Station has a relative error of 28.10%.
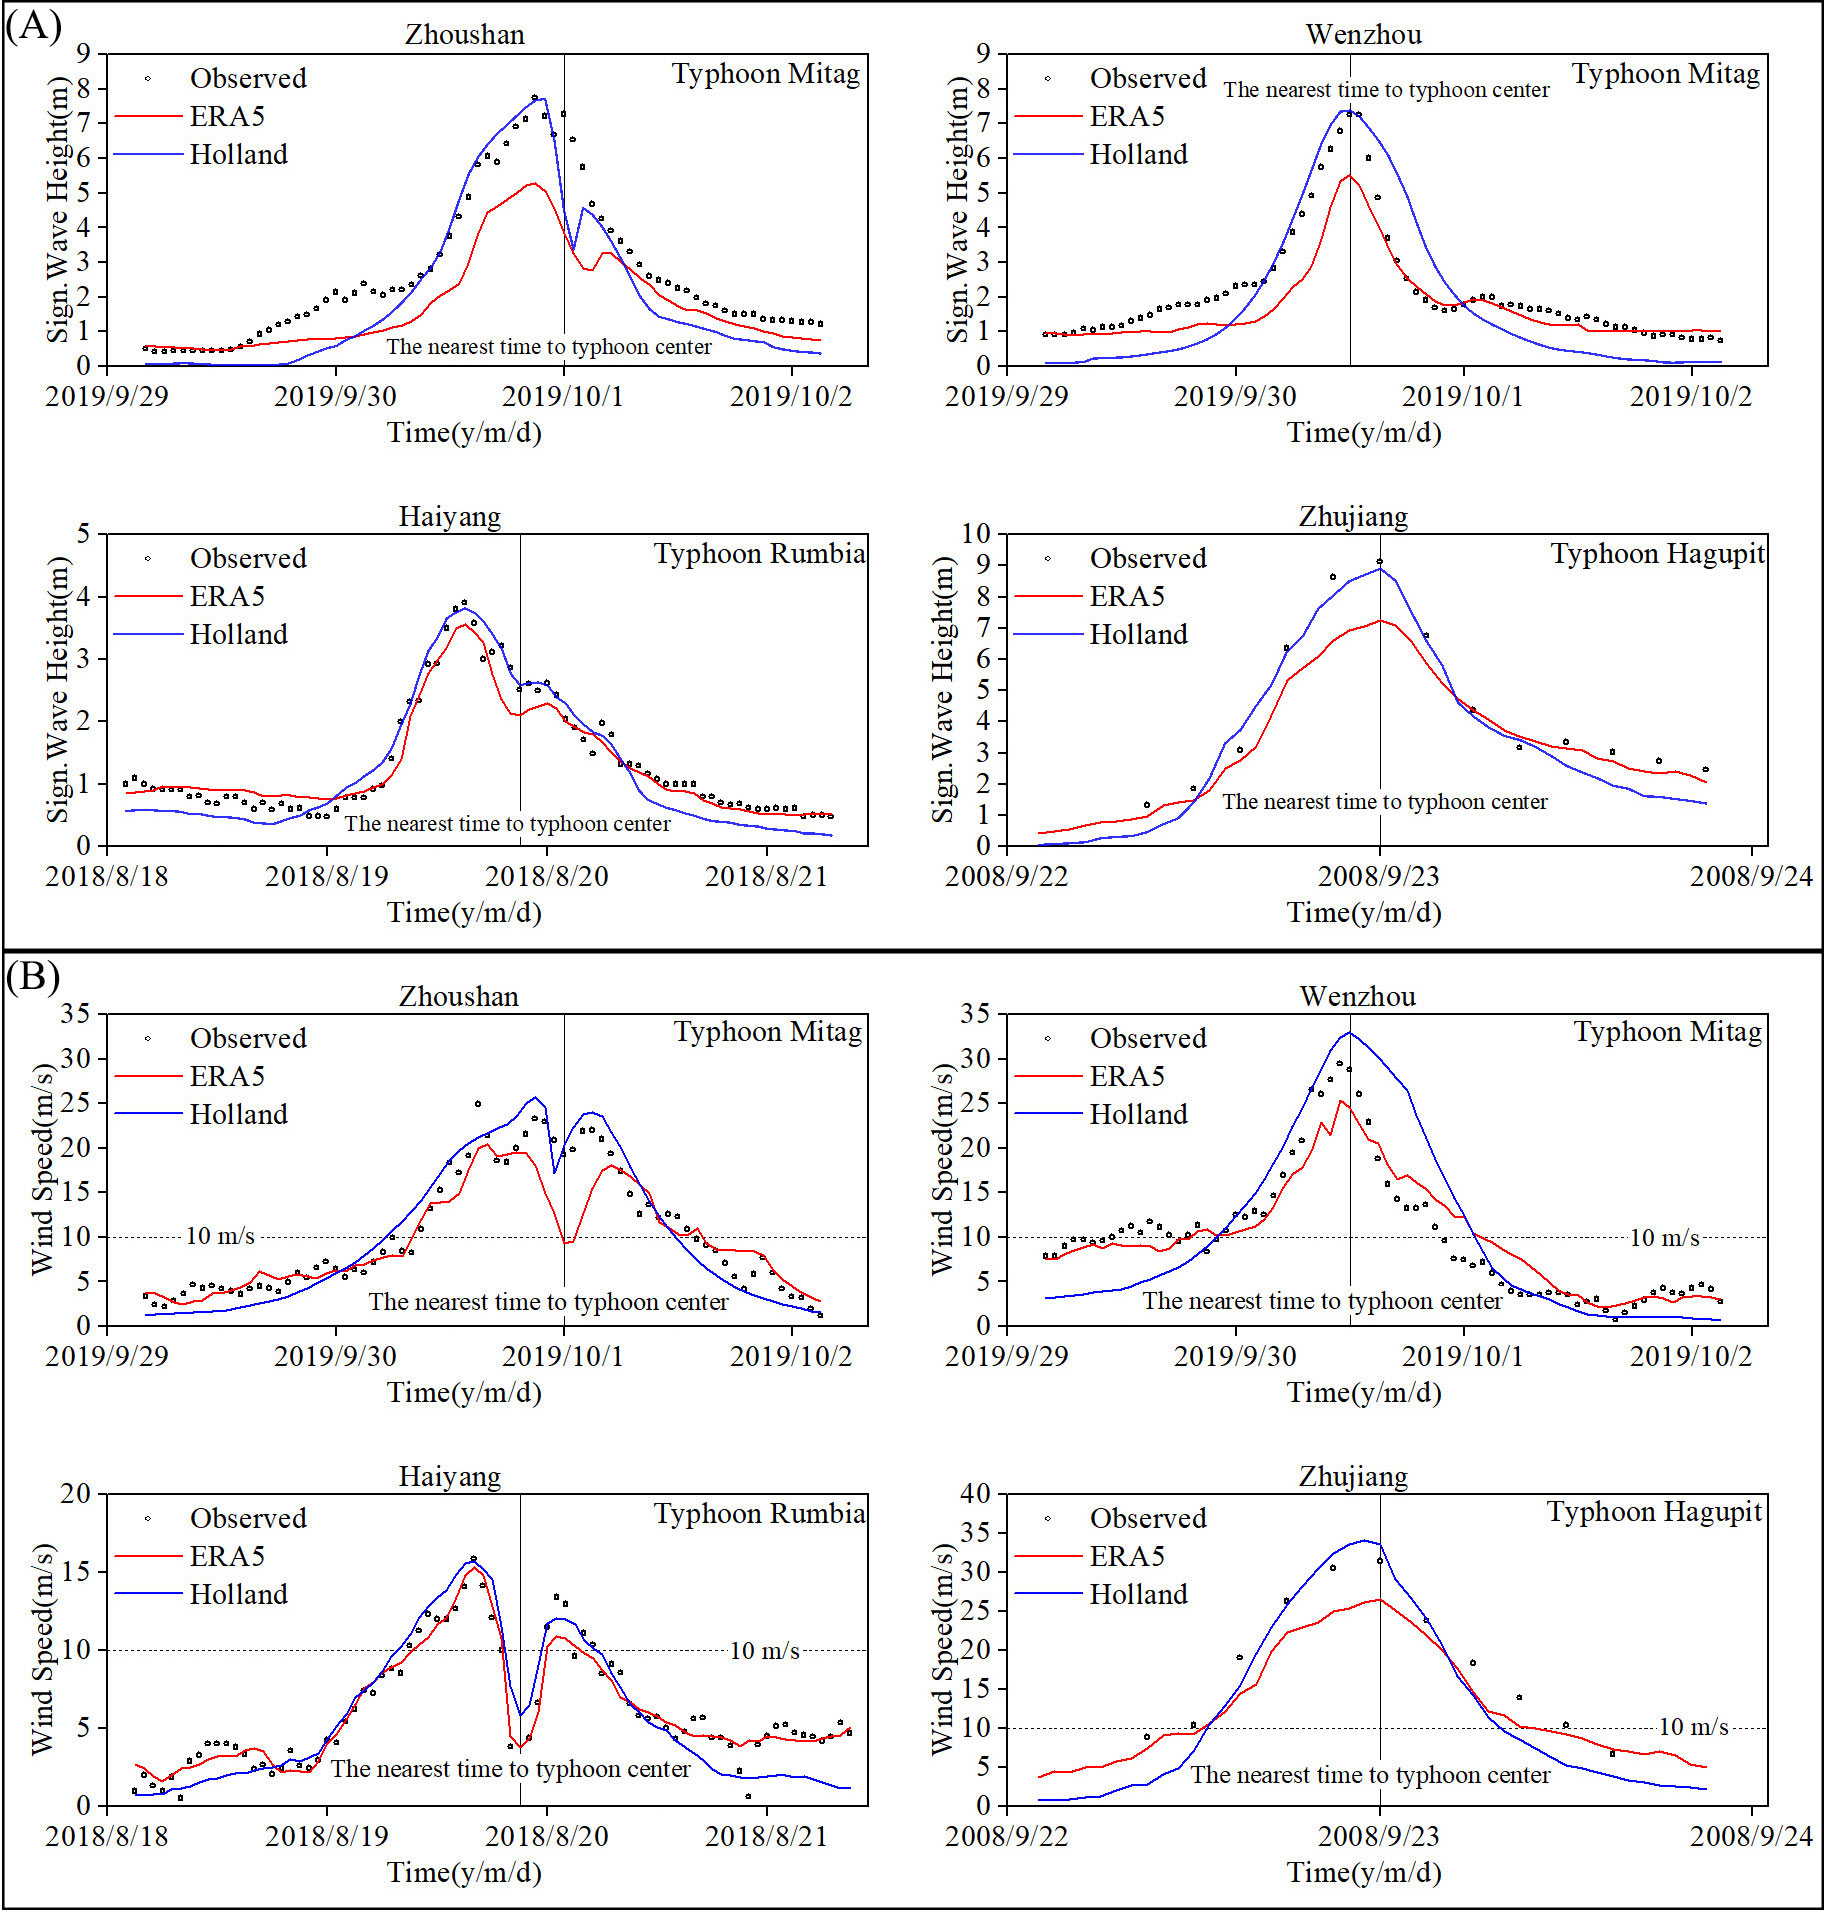
Figure 5. (A) Comparison of simulated and observed SWH. (B) Comparison of simulated and observed wind speed.
4.3 Simulation results and error analysis of the HWF and EWF models
Figure 6 illustrates the distribution of the maximum SWH and Wmax observed during two typhoons, utilizing both the HWF and EWF. Throughout the course of the typhoons, the HWF model predicts higher maximum SWH and wind speeds compared to the EWF model for locations near the path of the typhoon. When considering the findings in Figure 5, it is clear that the HWF model is better at representing the maximum SWH and Wmax near the typhoon center as the typhoon progresses. In contrast, the EWF model underestimates these values in this region, particularly when the actual typhoon winds exceed 30 m/s. The EWF model significantly underestimates the peak wind speed and SWH compared to the actual values.
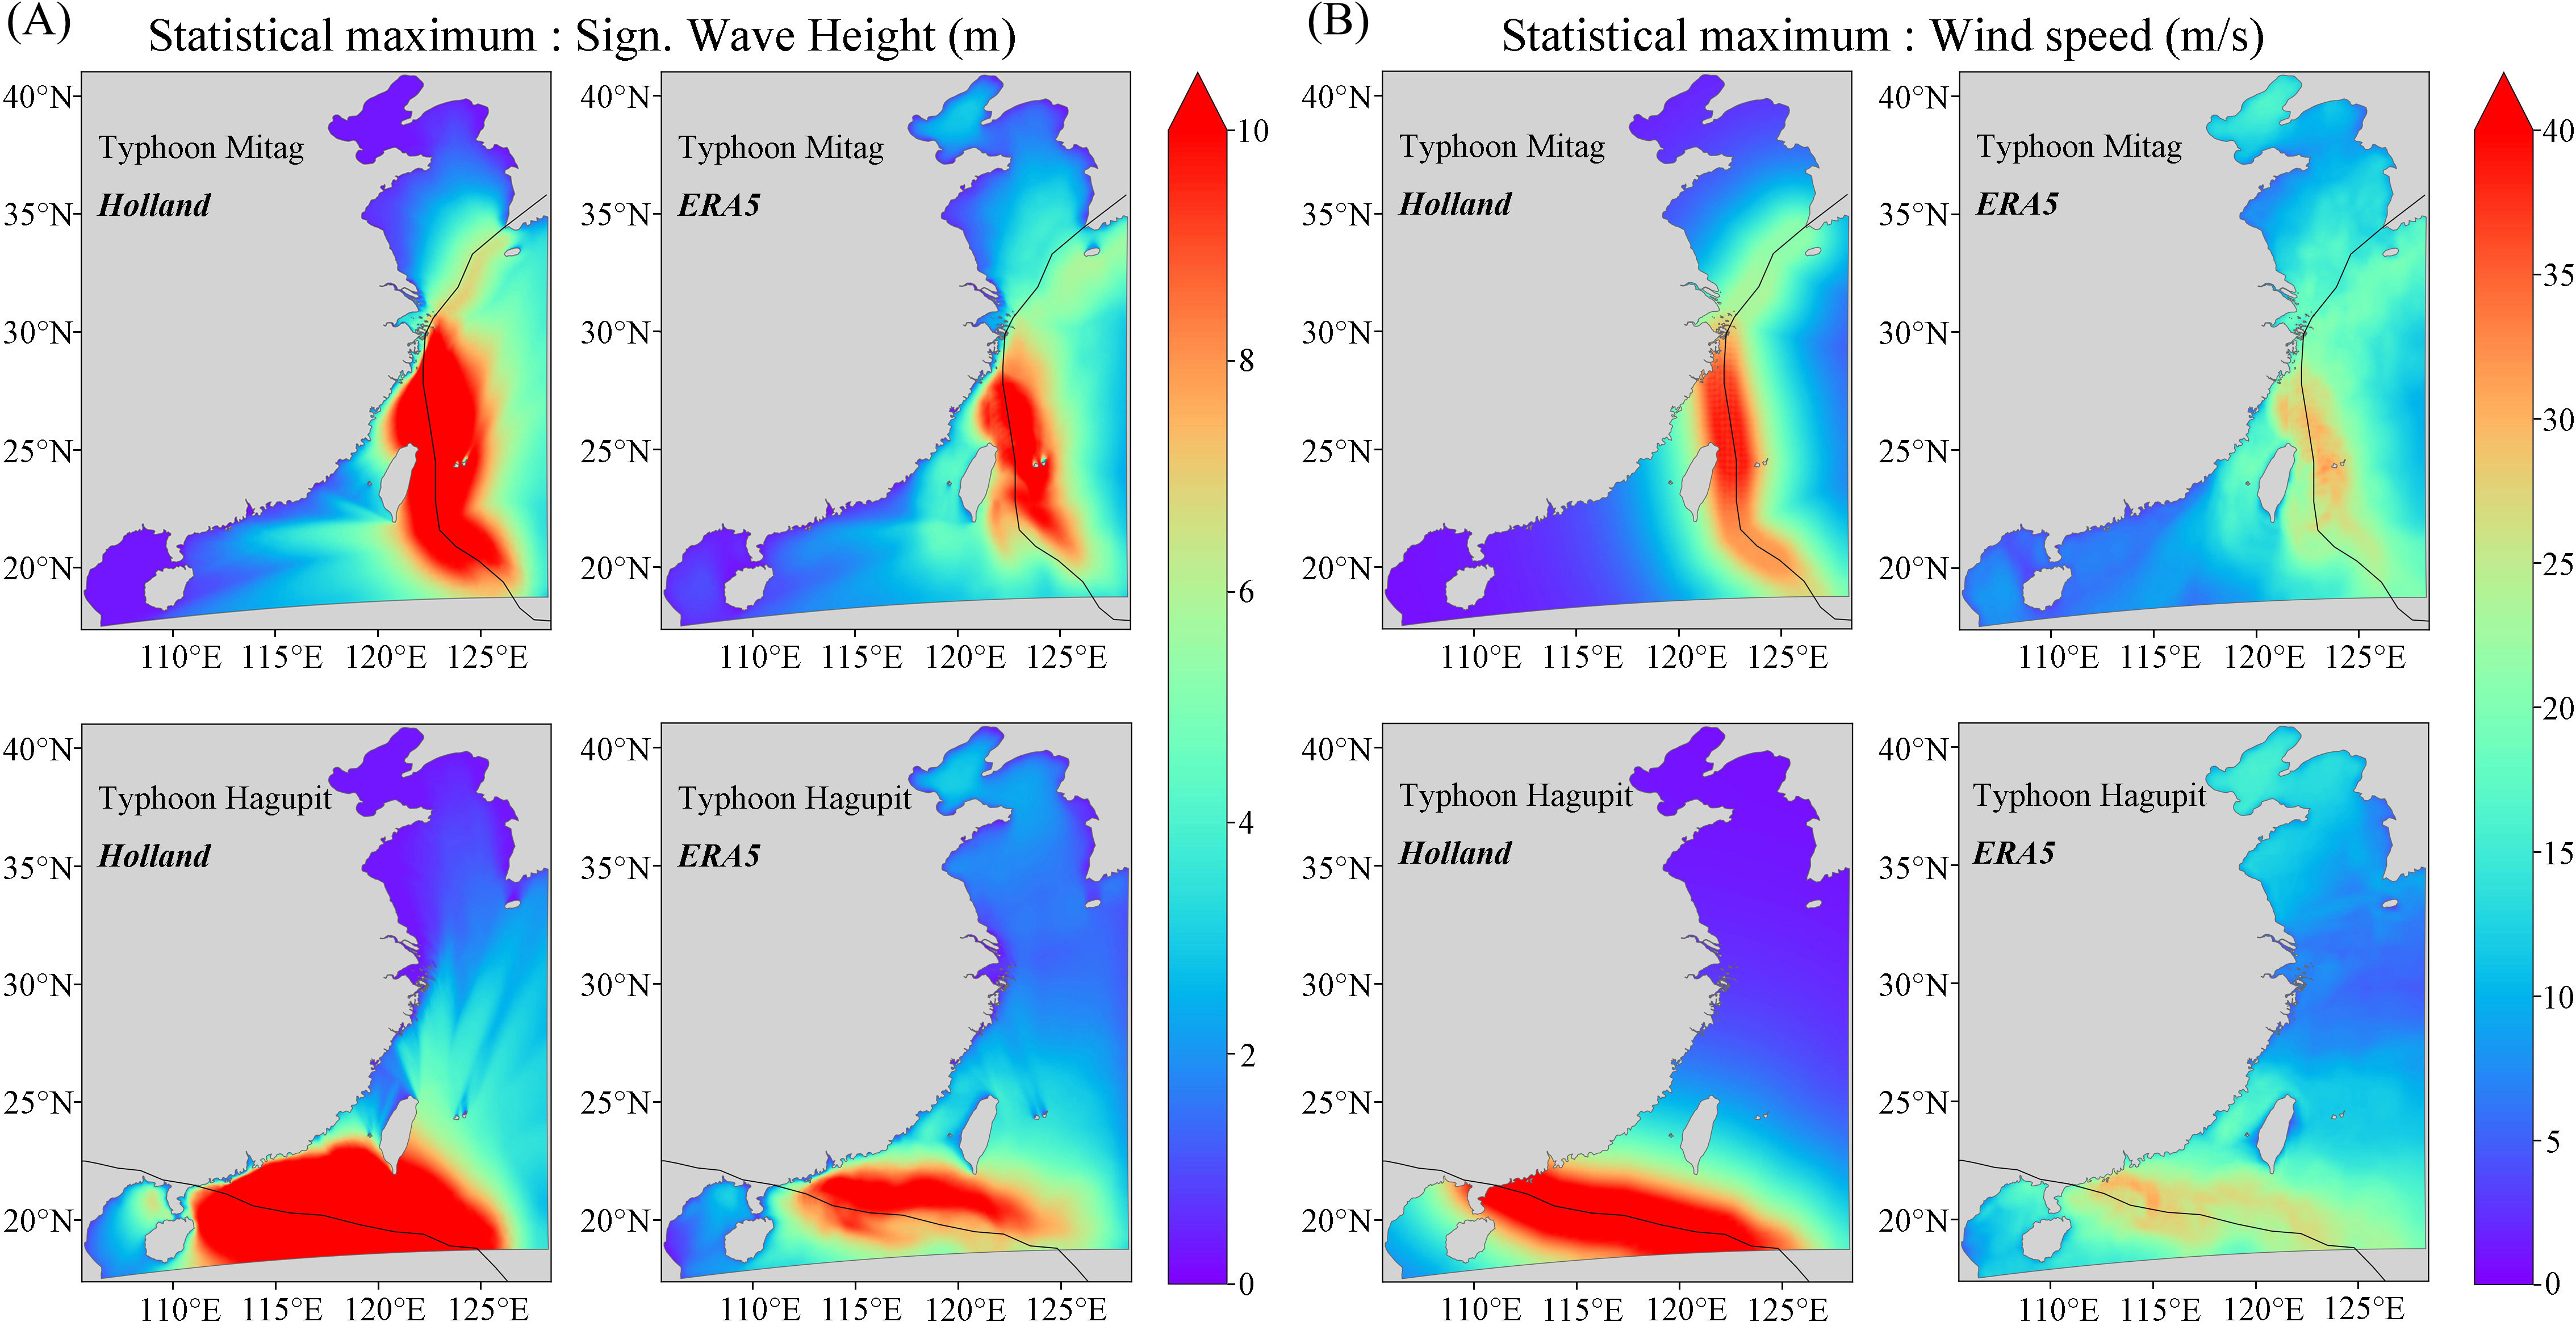
Figure 6. The maximum value of SWH (A) and the maximum wind speed (B) distribution are simulated by HWF and EWF models.
Table 2 lists the relative error statistics of outer wind speed in the strong wind region, Wmax, and maximum SWH simulated by the HWF model and EWF model, and compares them with the observed values from 14 typhoons influencing China’s coastal waters. The results show that, for the greatest wind speed simulated using the HWF during these typhoons, the average relative error ranges from 8.62% to 10.19%; the average relative error for the maximum SWH ranges from 1.01% to 1.52%. Outside the strong wind region defined with a wind speed of 10 m/s, the average relative error for wind speed simulated using the HWF ranges from 29.76% to 44.29%. A possible reason for this is that the actual typhoon wind field is irregular, while the HWF is a parameterized wind field, resulting in an inaccurate simulation of wind speeds in the outer periphery of the wind circle (Pan et al., 2016).
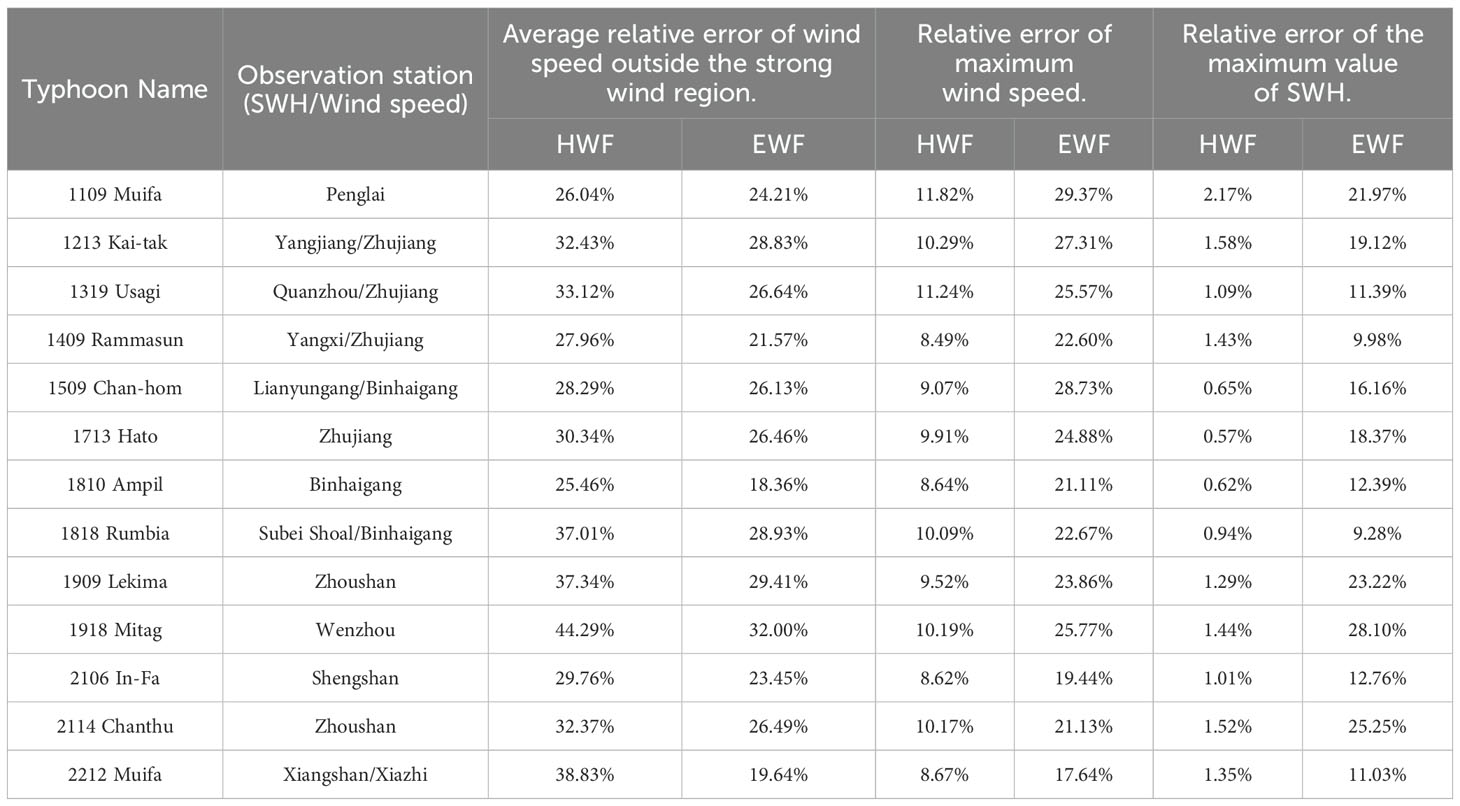
Table 2. Error statistics of the simulated results using the HWF and the EWF.
The EWF performs relatively well outside the strong wind region, with the average relative error for wind speeds below 10 m/s being better than that of the HWF. However, as the wind speed increases, the relative error also increases. For example, during Typhoon Mitag, the relative error of the Wmax simulated by the EWF compared to the observed station reached 25.77%, and the relative error of the maximum SWH was 28.10%. The reason for this situation is that when the typhoon’s wind speed is high, it is difficult to accurately measure the wind speed during the typhoon’s progression, resulting in an underestimation of the remote sensing values of wind speed around the typhoon’s center (Xiong et al., 2022). Therefore, the wind speed simulated by the ERA5 wind field model has the defect of being small near the center of the typhoon, which is not applicable to the strong wind region and cannot accurately reflect the real wind field in this region.
4.4 Wind speed distribution characteristics of different wind fields
Taking three of the typhoons covered in this study as examples, the wind speed distributions of the HWF, EWF, and HBWF are given (Figure 7). In the HWF, the Wmax at the center of the typhoon can reach around 40 m/s. Referring to the data from the China Typhoon Network, at this time, the Wmax of Typhoon Hato was recorded as 42 m/s. The wind speed at the center of the typhoon in the HWF is quite consistent with the actual values, but the shape of the field is regular and does not change according to variations in coastal terrain. When the distance from the typhoon center is sufficiently far, the model’s wind field approaches zero, indicating that the further one is from the typhoon center, the less accurately the wind field is reflected. In the EWF, the Wmax at the center of the typhoon is difficult to reach beyond 35 m/s, which is lower than the HWF. However, it is evident that the wind field near the land changes based on the coastal terrain. In comparison, the HBWF compensates for the limitations of the two other wind fields, possessing not only the advantages of the center region wind speed in the HWF but also the advantages of the wind speed in the peripheral region of the typhoon in the EWF.
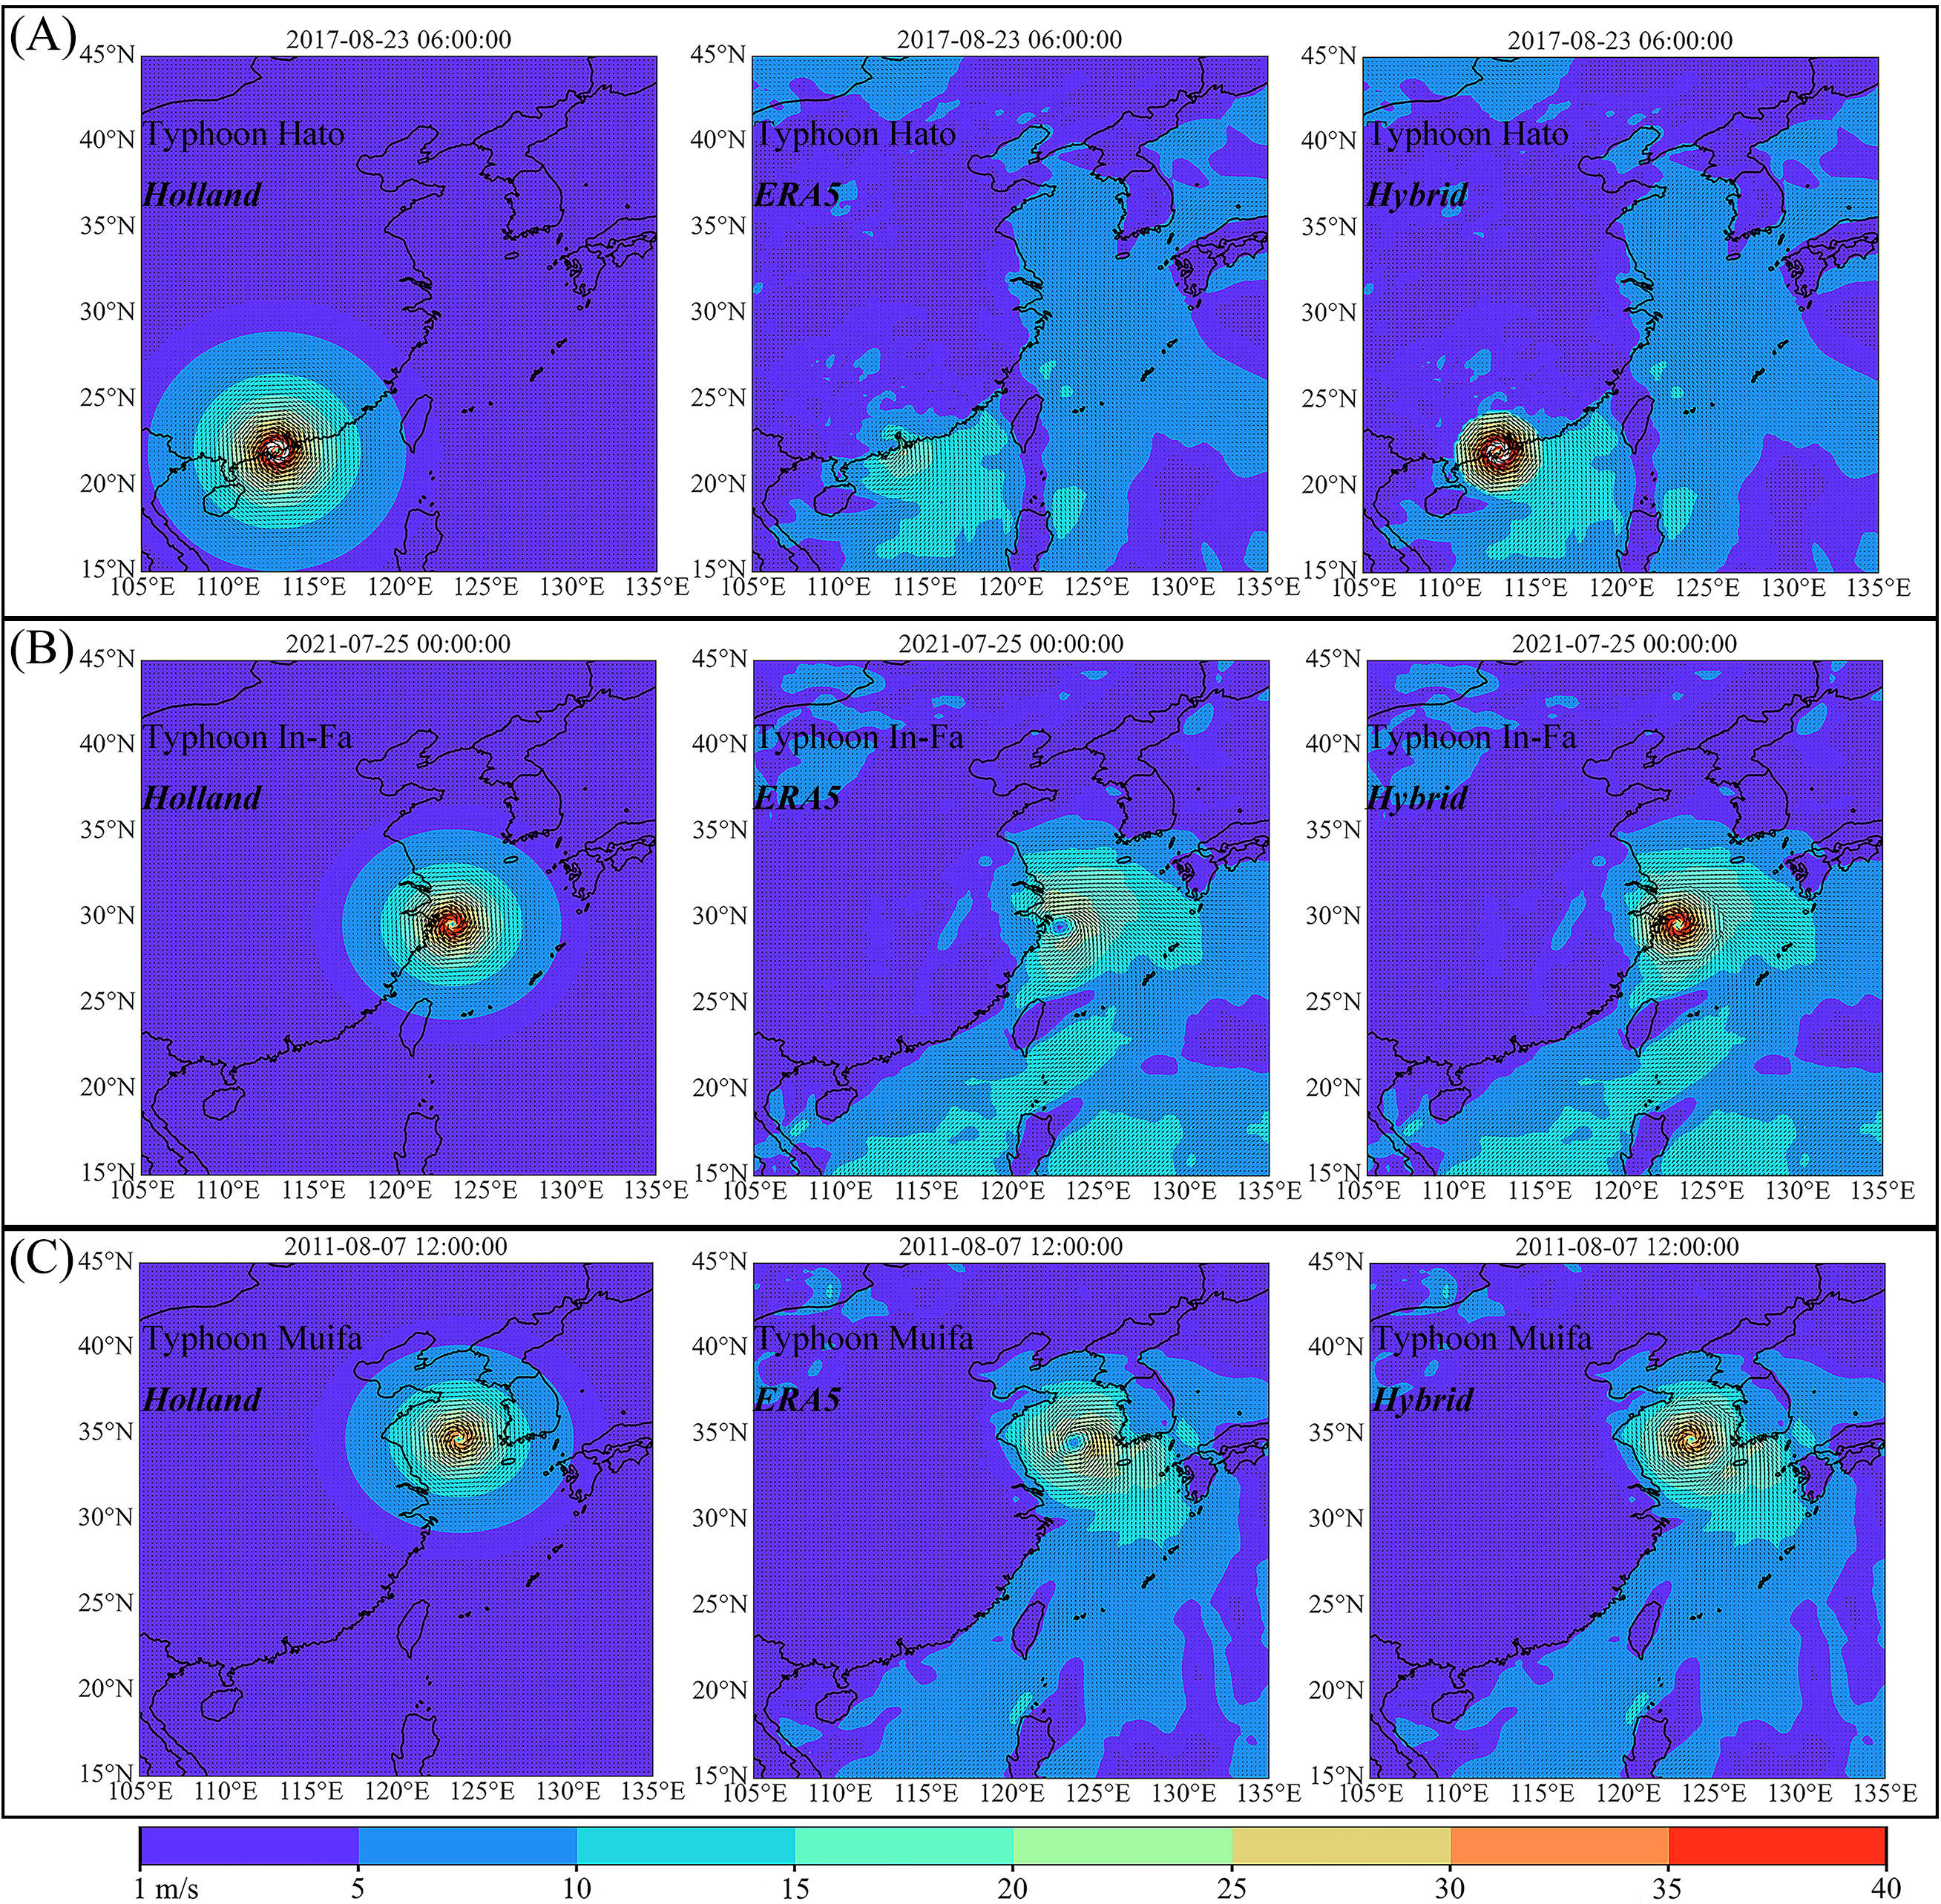
Figure 7. Wind speed distributions from the HWF model, the EWF model, and the HBWF model during Typhoon Hoto (A), Typhoon In-Fa (B), and Typhoon Muifa (C).
4.5 Simulation results and error analysis of the HBWF model
To verify the simulation effectiveness of the HBWF model and its applicability in China’s coastal waters, a comparative analysis of the model results at 16 observation stations in the vicinity of China was conducted for the 14 typhoons mentioned in this study (Figure 8). It is evident that near the center of the typhoon, the SWH simulated by the HBWF is basically consistent with that simulated by the HWF, with both approaching the observed values. However, at greater distances from the typhoon center, the SWH simulated by the HBWF is essentially consistent with that simulated by the EWF, and the simulation accuracy is superior to that of the HWF. As the HBWF complements the wind field beyond the strong wind region and adds the high-accuracy EWF at greater distances from the typhoon center, it is capable of more realistically simulating the magnitude of each level of wind speed during a typhoon, thereby improving the overall accuracy of typhoon wave simulation. Additionally, the simulation accuracy of the EWF model for SWH decreases with increasing wave heights, especially when the SWH exceeds 5m, the simulation accuracy for the maximum SWH by the EWF model is lower than that of the HWF model.
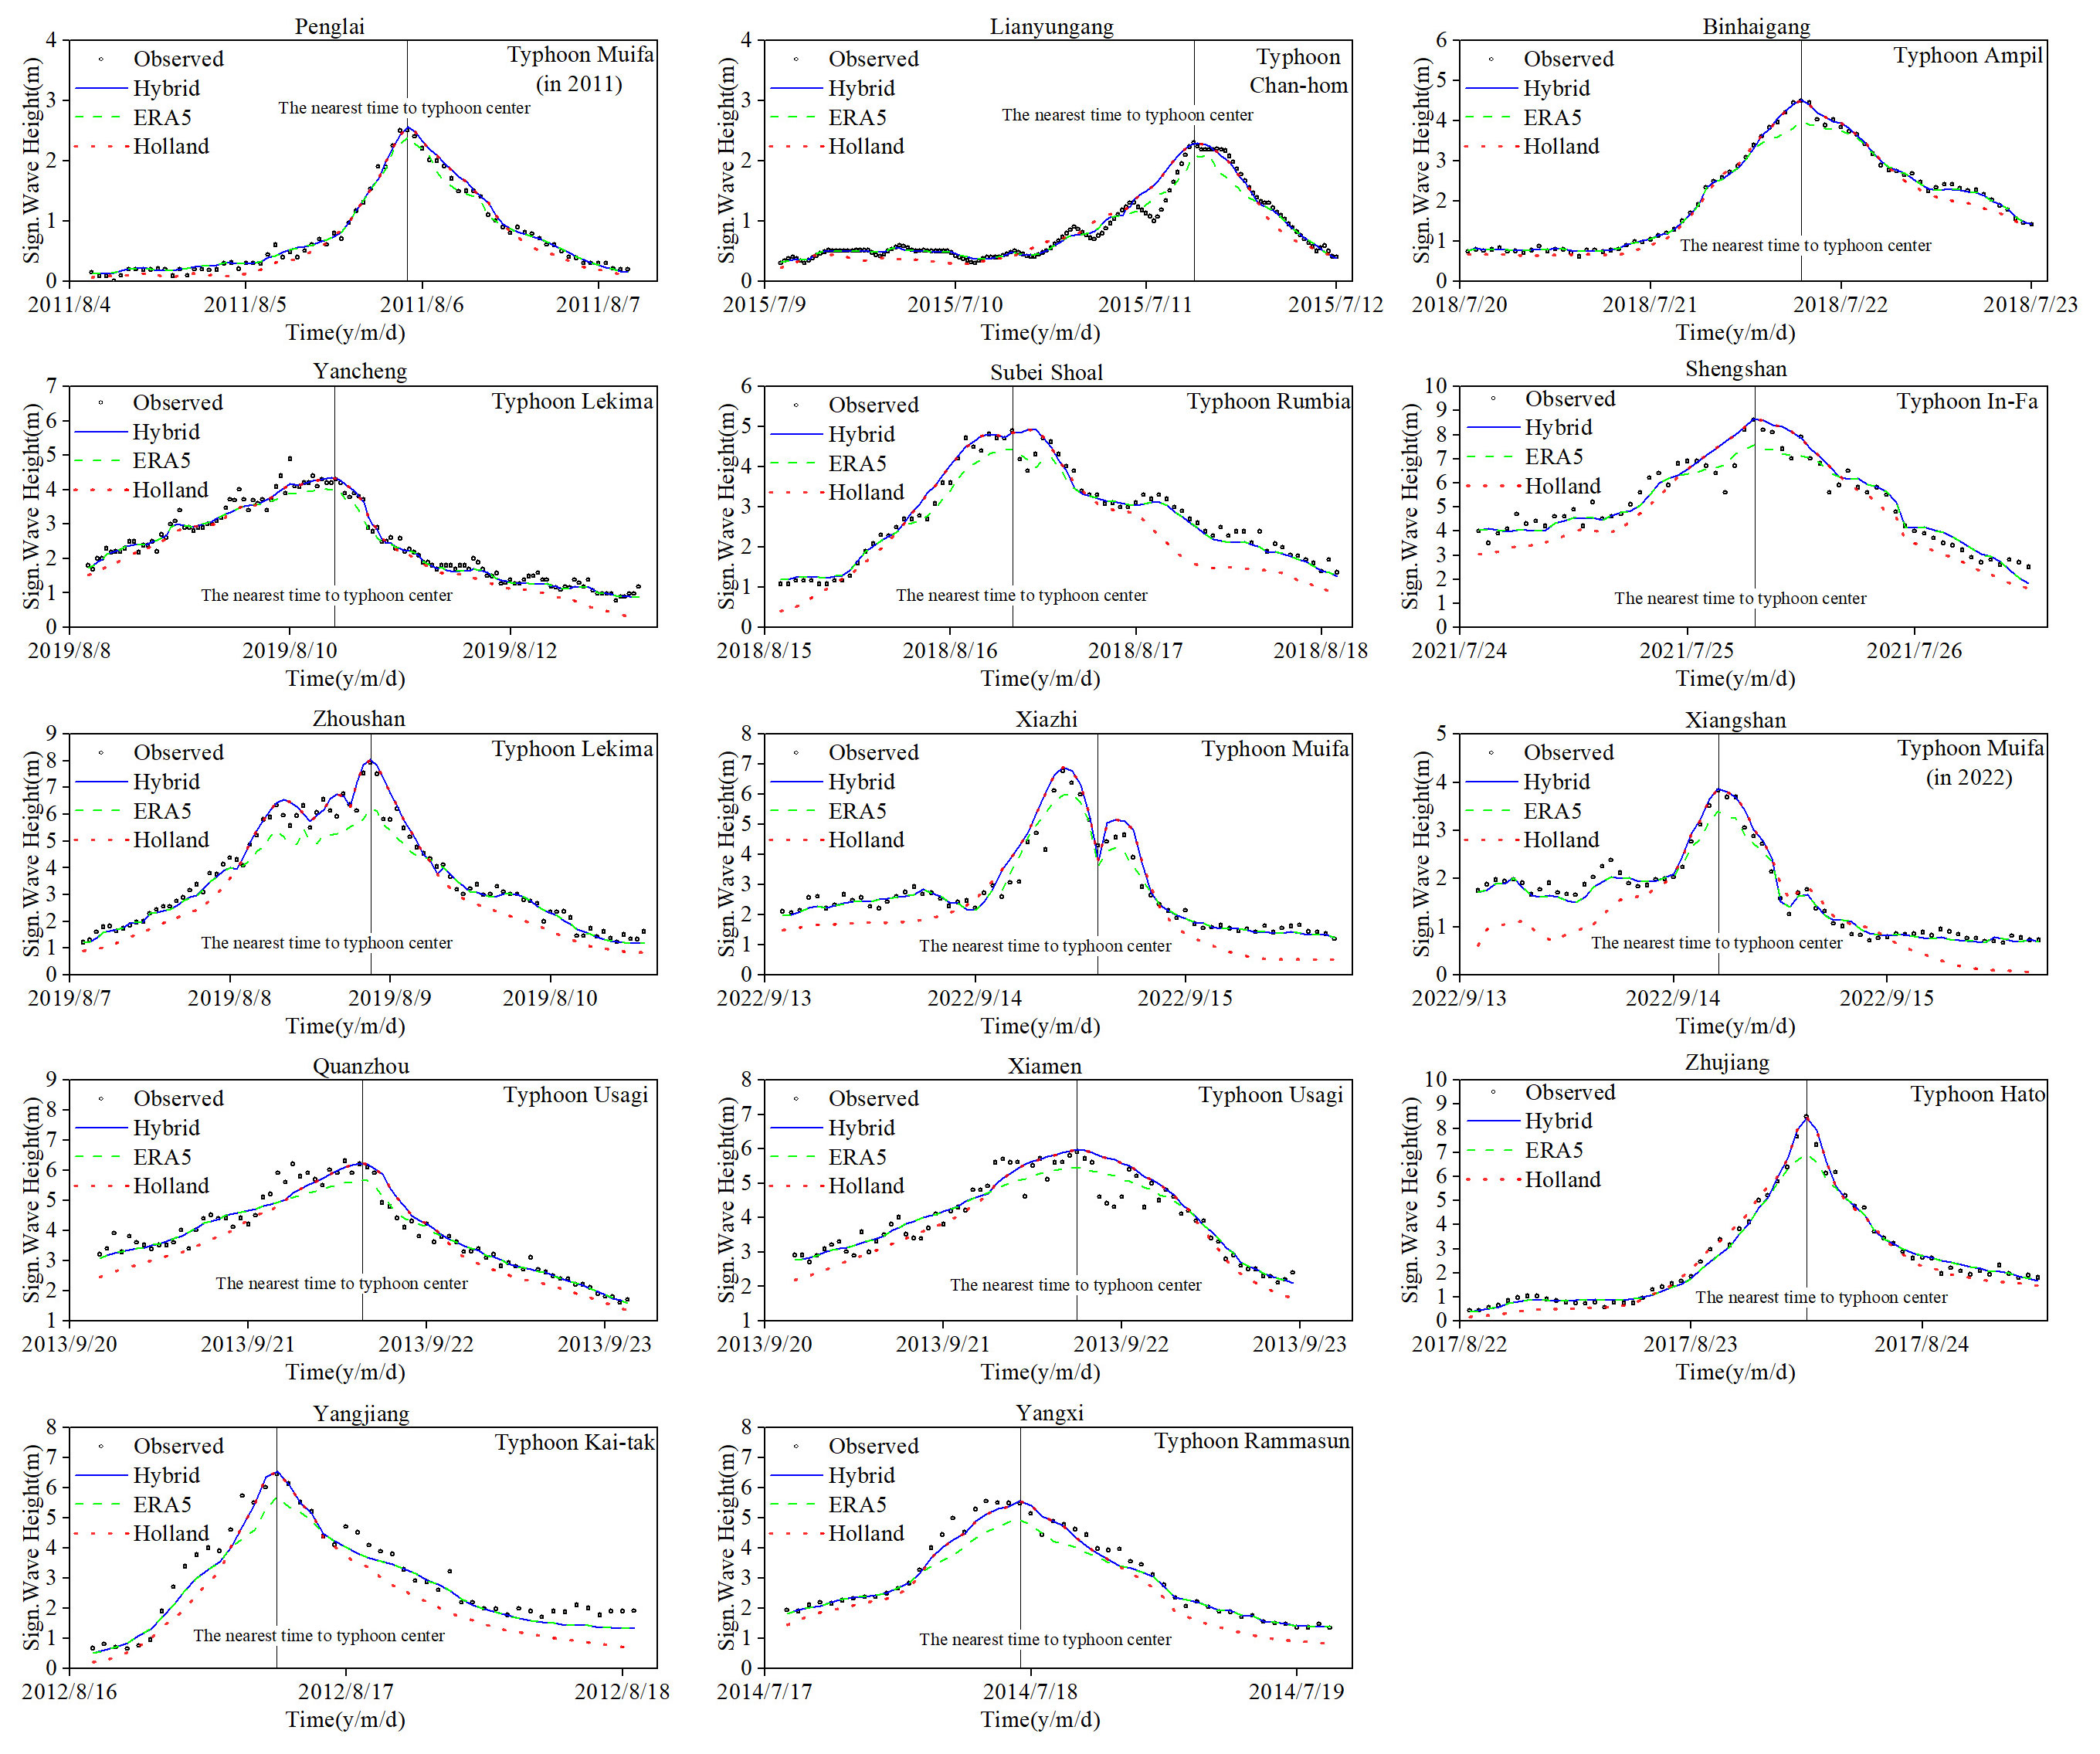
Figure 8. Comparison of the simulated SWH and the measured data during different typhoons.
It can be seen that the accuracy of typhoon wave simulation using HBWF is relatively high. The average value of the MRE decreases from 29.92% for the HWF and 25.62% for the EWF to 22.82%. The average value of the RMSE is 0.39 m, which is less than 0.46 m for the HWF and 0.42 m for the EWF. The average consistency index is 0.96, which is greater than 0.94 for the HWF and 0.95 for the EWF (Table 3).
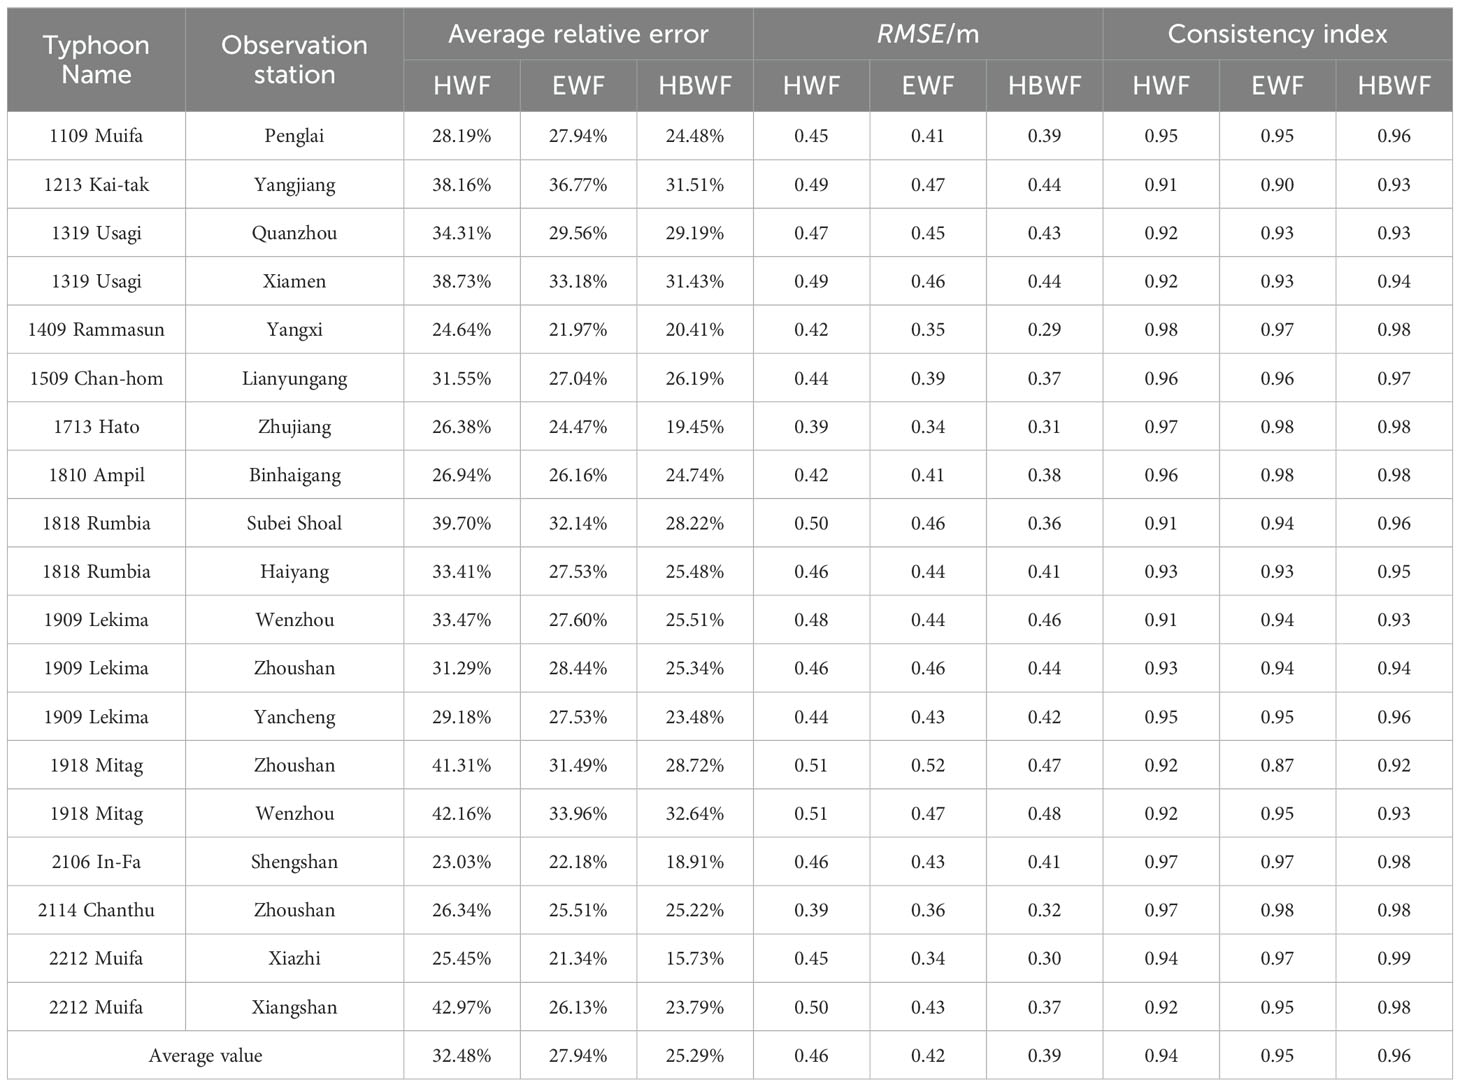
Table 3. Error statistics of the simulated SWH using the HWF, the EWF, and the HBWF.
5 Discussion
5.1 Sensitivity analysis of grid resolution
Due to the grid resolution of ERA5 being 0.25° × 0.25°, this study set the grid resolution to 0.25° × 0.25° when constructing the HWF to better overlay the two wind fields in the HBWF. To better understand the impact of grid resolution on the simulation results, a total of four different grid resolutions were set for calculations. Figure 9 shows a comparison of the SWHs calculated from the HWF using different resolutions. The higher the grid resolution, the more ideal the simulation results; thus, the simulation performed best at a grid resolution of 0.10°, although the differences between the various values were not significant. To better overlay the HWF with EWF, both the grid resolution and the temporal resolution need to be aligned. Therefore, selecting a grid resolution of 0.25° × 0.25°for the HWF is the best choice.
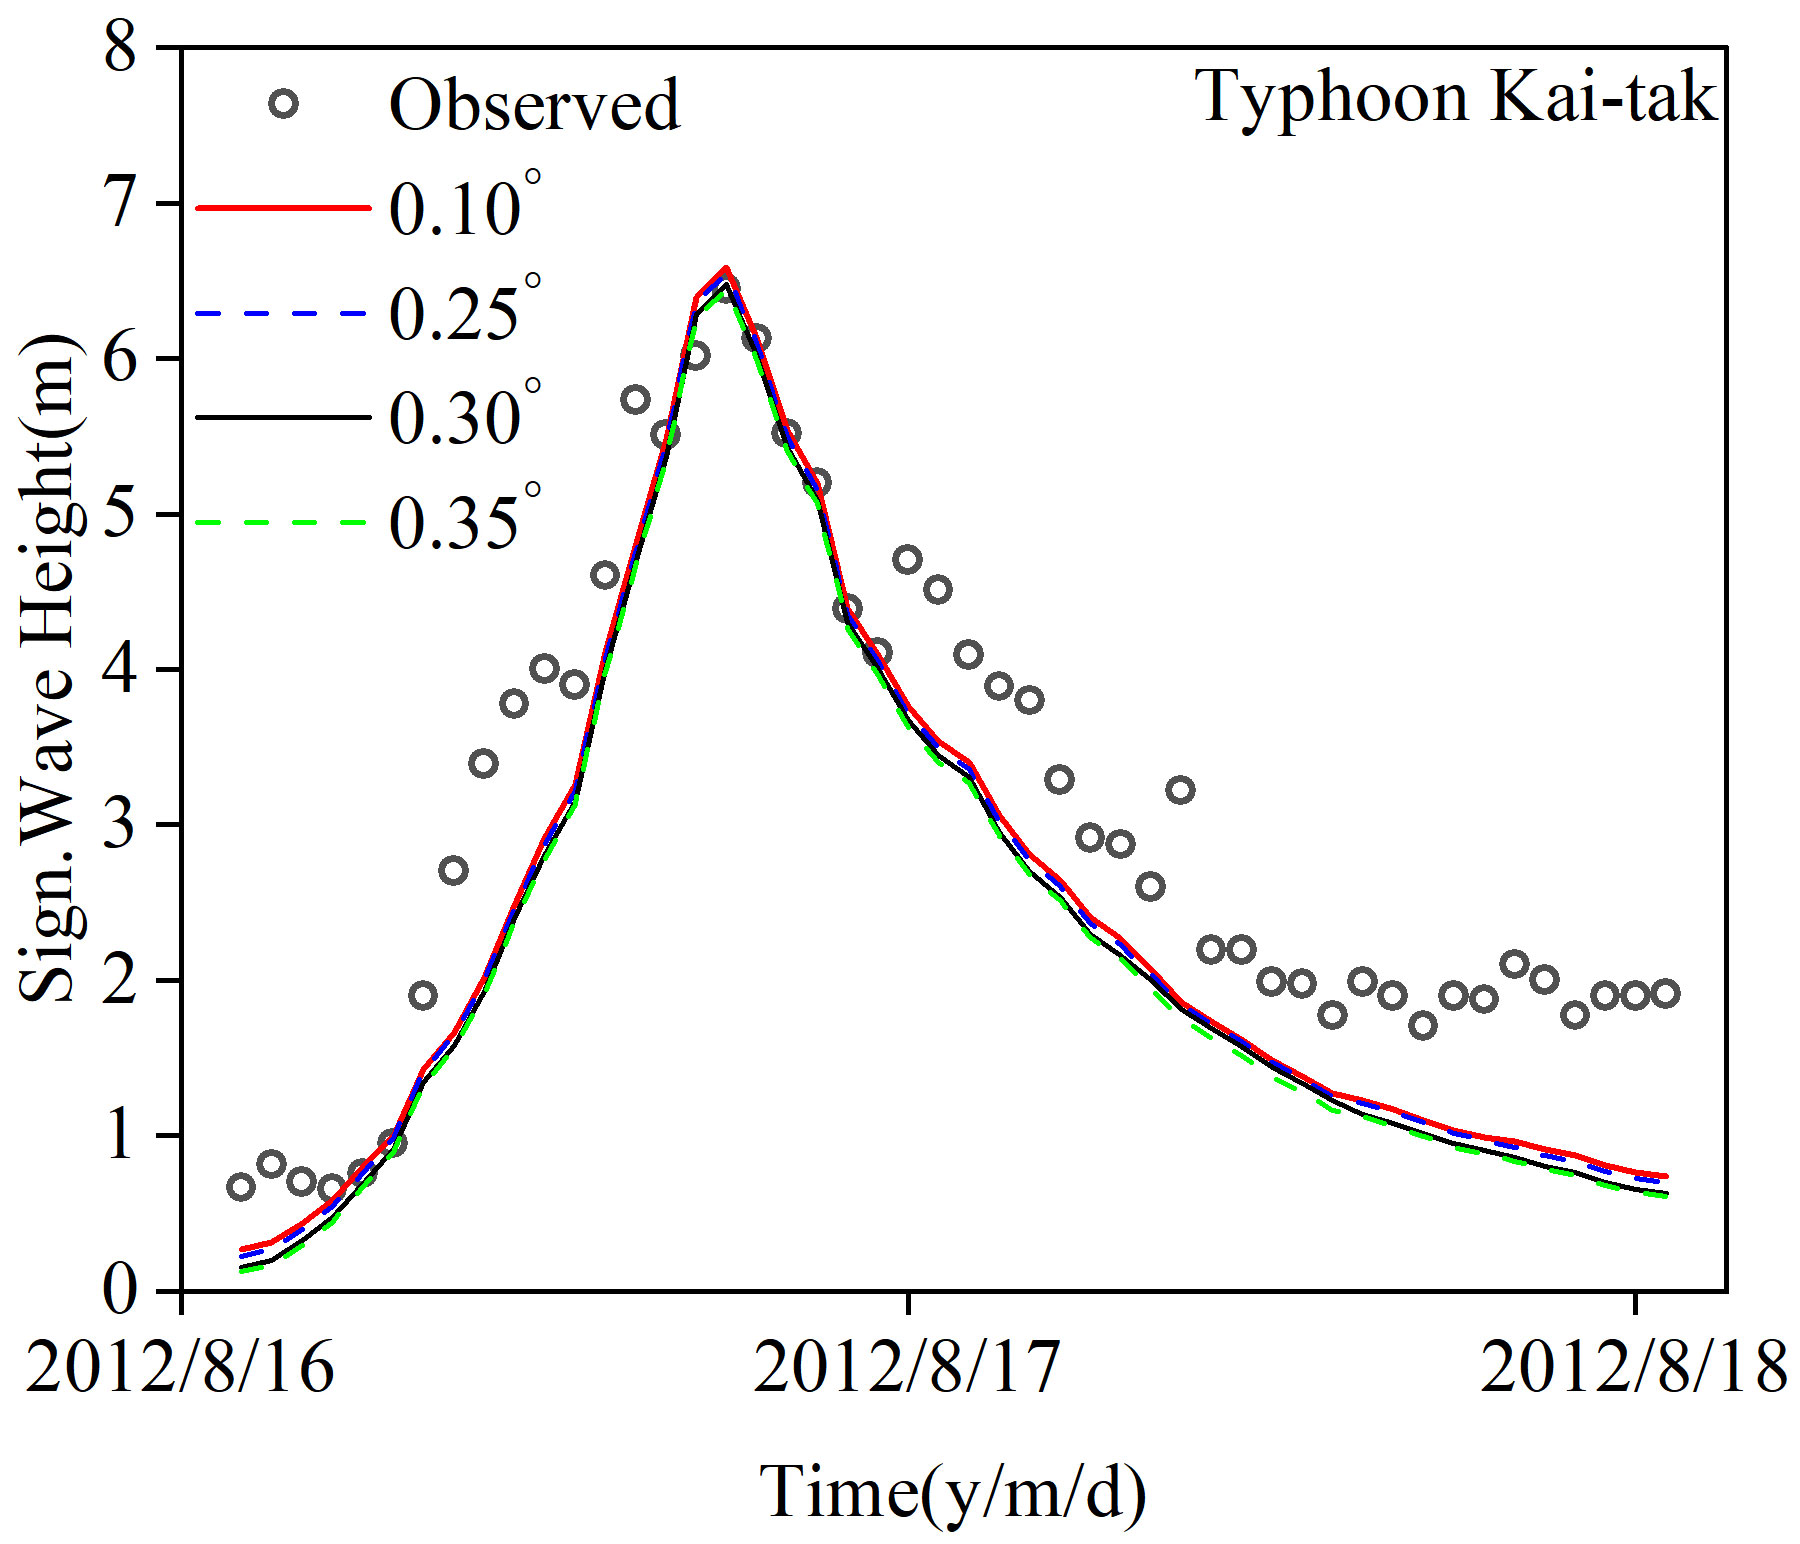
Figure 9. Comparison of SWHs in the HWF under the influence of different grid resolutions.
5.2 Sensitivity analysis for time step
Before studying the 14 typhoons, one typhoon was selected to conduct a sensitivity analysis of the time step using the HBWF model to simulate the typhoon waves. Three conditions were set: 0.01–600 seconds, 600–1800 seconds, and 3600 seconds (Figure 10). When the time step was 3600s, the error between the SWHs and the observed values was more obvious, which indicated that the use of the larger and fixed time steps would have an impact on the simulation results. The accuracy of the simulation is best when the time step is dynamically adjusted between 0.01 and 600s. The effect of the time step on the model is much larger compared to the grid resolution. Therefore, the method of 0.01~600s was chosen for the subsequent calculations.
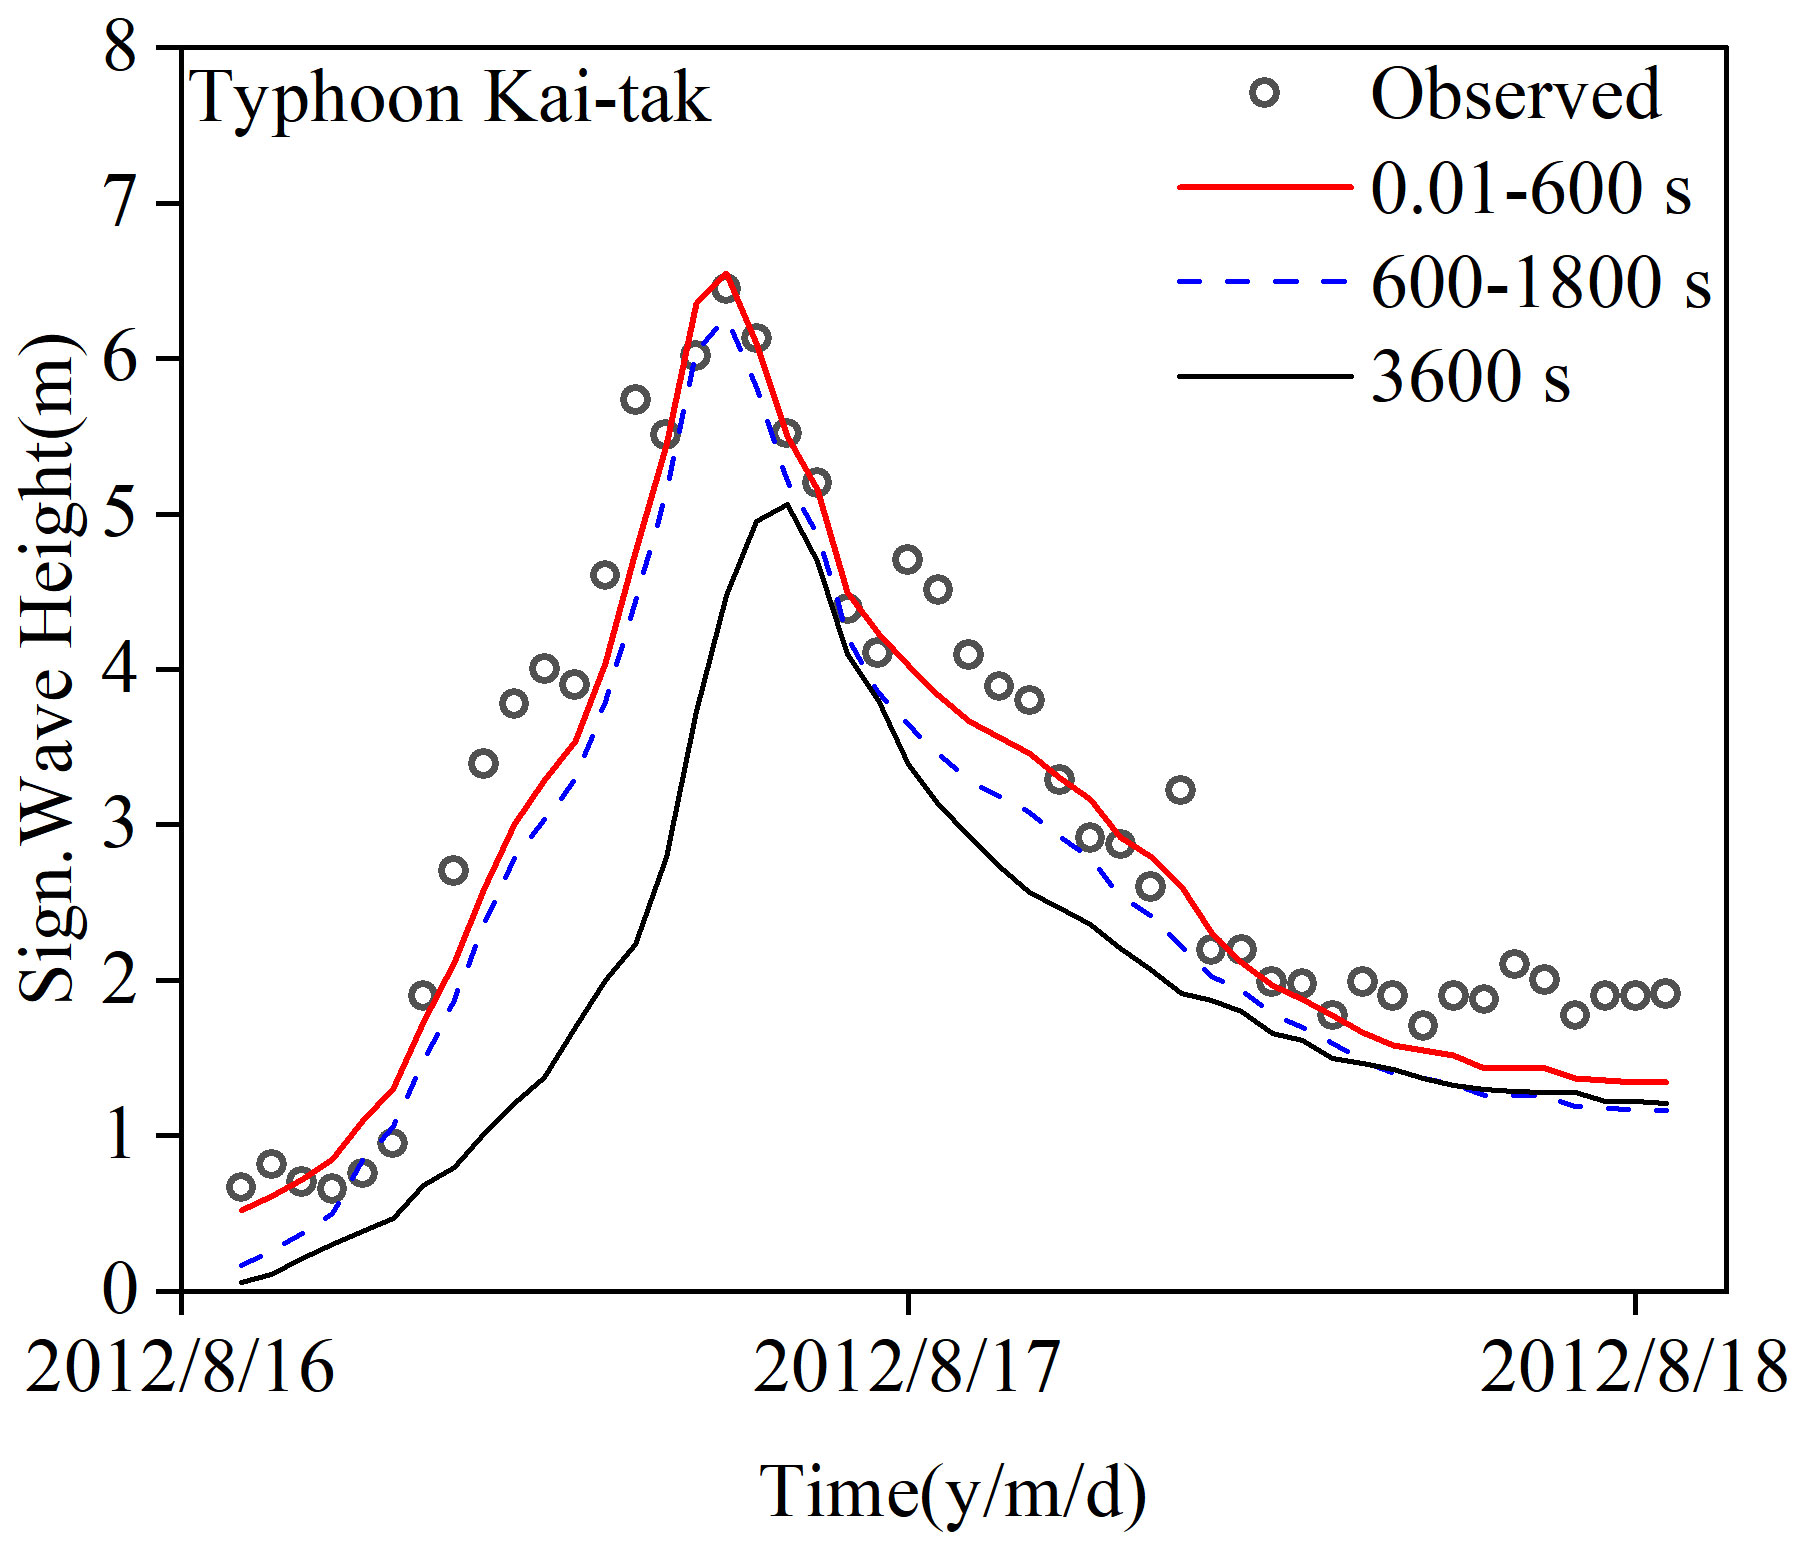
Figure 10. Comparison of SWHs in the HBWF under the influence of different time steps.
5.3 Comparison with similar studies
To further assess the superiority of the HBWF constructed in this study and the reliability of the typhoon wave model, the simulation results of this study are compared with other similar studies.
5.3.1 Comparison with the simulation results of Li et al.
The SWHs simulated during Typhoon In-Fa at Shengshan Station by Li et al. (2021) using three different wind fields were 7.9 m, 8.8 m, and 9.6 m for ERA5, CCMP, and CFSv2, respectively. In this study, the maximum SWHs obtained using the EWF and the HBWF were 7.56 m and 8.76 m, respectively (Table 4). Under the same conditions utilizing the EWF, the results obtained in this study are quite consistent with those of Li et al., with a consistency index of 0.97. In terms of maximum SWH, the simulated result using the HBWF in this study is closer to the measured value of 8.6 m.

Table 4. The present and Li et al. (2021) simulated SWH and the error statistics.
5.3.2 Comparison with the simulation results of Jiang et al.
Figure 11 shows the wind speed and SWH at Zhoushan Station during Typhoon Mitag, based on the HBWF in this study and the ECMWF simulations by Jiang et al. (2021) By comparison, the measured maximum wind speed was 25 m/s and the maximum SWH was 7.2 m, while Jiang et al. calculated a maximum wind speed of about 18 m/s and a maximum SWH of approximately 5.2 m. The results of this study show a clear advantage in comparison.
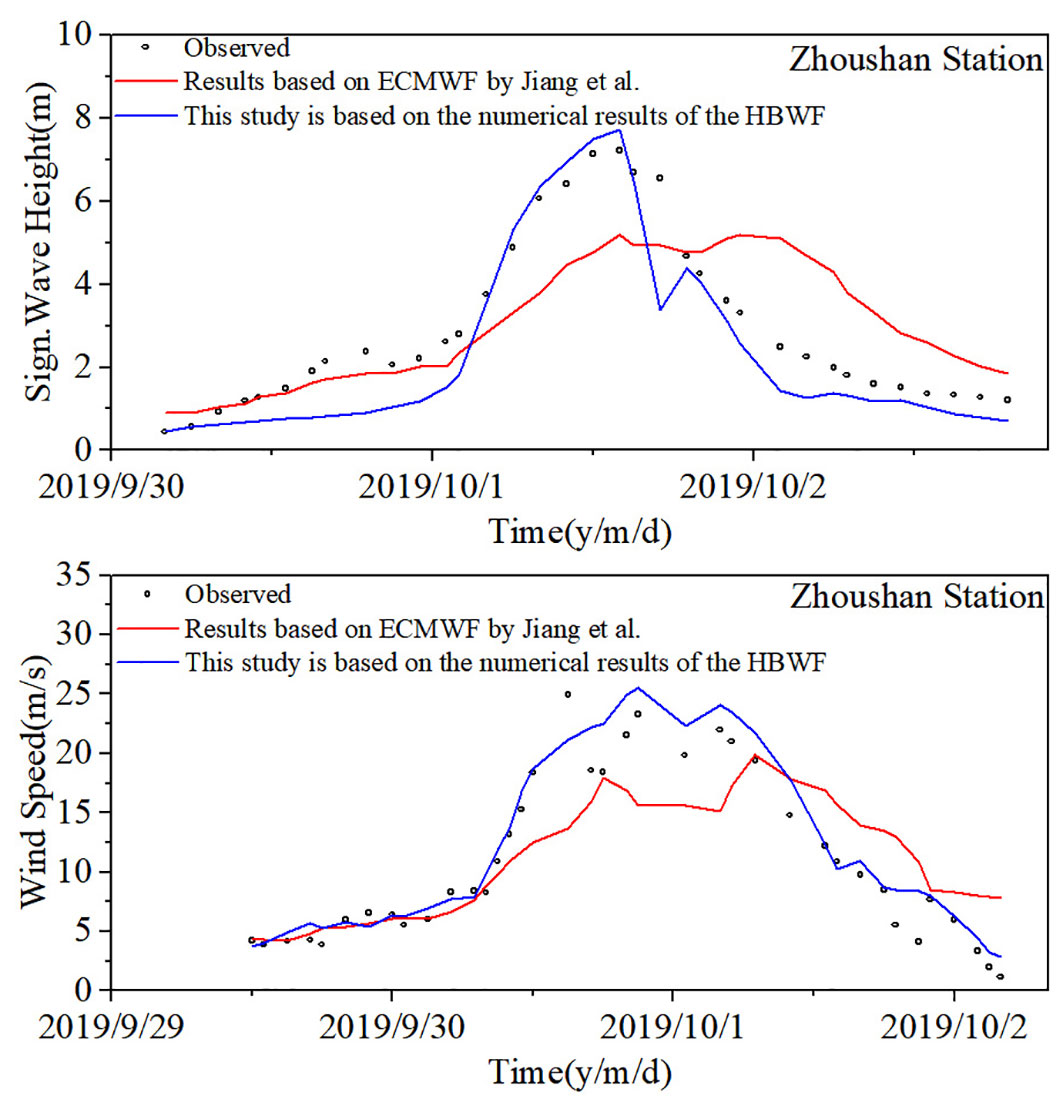
Figure 11. Comparison of the simulated wind speed and SWH between the present and Jiang et al.
From the above comparison, it can be concluded that the HBWF constructed in this study is applicable in China’s coastal waters, and the typhoon wave model is reliable, resulting in high accuracy for simulating typhoon waves.
5.4 Effect of time interpolation on the wind field
By using finer spatial resolution in the wind field, the accuracy of model simulations can be improved. However, further increasing the resolution of a wind field that already has a relatively high spatial resolution does not provide significant improvements to the model (Cavaleri and Bertotti, 2006; Van Vledder and Akpınar, 2015). As shown in the comparison in Figure 9, it cannot significantly enhance the accuracy of the SWH predictions. A finer temporal resolution in the wind field also does not significantly improve the accuracy of SWH predictions (Van Vledder and Akpınar, 2015). Typhoons typically move large distances within an hour, making reanalysis data crucial for capturing their true dynamics. Therefore, temporal interpolation is often required to apply these wind speed data to high-resolution grids. However, some simple temporal interpolation methods lead to issues in correctly interpreting the movement of typhoons both spatially and temporally (Manaster et al., 2021). For instance, when a typhoon weakens at one grid point while strengthening at an adjacent grid point, temporal interpolation may cause the wind field to inaccurately represent the situation as if two typhoons exist simultaneously (Gorman, 2009), which could mislead subsequent numerical models. Consequently, Hisaki (2018) conducted research on the impact of temporal interpolation methods on SWH predictions, proposing a wind temporal interpolation method that considers surface disturbance propagation, which outperformed linear interpolation methods. Currently, interpolation techniques continue to evolve, and besides traditional linear interpolation, interpolation using Fourier transforms (Gorman, 2009) and the methods developed by Hisaki (2018) and others can better capture the details of wind speed variations. Therefore, further studies should select superior temporal interpolation methods to enhance the accuracy of SWH predictions.
5.5 Analysis of factors affecting SWH
Under the intensity of a strong typhoon, if the wind field approaches the true values, the accuracy of wave simulation will be high (Torres et al., 2019). The EWF holds significant importance in studying typhoon waves; however, the simulation results from this study indicate that the typhoon waves driven by EWF are significantly underestimated near the typhoon’s landfall, and the HWF is unable to accurately simulate the typhoon waves far from the landfall location. To better tackle disastrous wave events caused by typhoons, this study proposes the HBWF. The typhoon wave model established in this study does not consider factors such as ocean currents and water levels. Although the primary expression of SWH is controlled by the wind field, changes in ocean currents and water levels can also affect SWH. The study conducted by Feng et al. (2016) shows that the SWH simulated using a wave-current coupled model displays greater fluctuations, closely resembling observational data. Considering that the focus of this study is on the impact of the wind field on waves, and due to the large model scope, incorporating a coupled wave model would increase time costs and computational resources. Therefore, the effects of changes in ocean currents and water levels on wave height are not considered in this study. However, a wave-current coupled model is of great significance for calculating SWH during typhoons.
6 Conclusions
This study uses the MIKE21 SW model to establish a typhoon wave model in China’s coastal waters. It selects 14 typhoons that affect China’s coastal waters for numerical simulations and error analysis to evaluate the performance of different wind fields and their applicability in typhoon wave simulations in China’s coastal waters. The specific conclusions are as follows
By combining the Rmax and parameters B, a total of 6 combination forms are obtained. The RMSE is the smallest when using the combination of Rmax2+B2 compared to the Wmax values of the 14 selected typhoons in this study.
The HWF performs well in terms of wind speeds around the typhoon center, with a small average relative error of Wmax, ranging from 8.49% to 11.82%. However, outside the strong wind area, the average relative error of wind speeds below 10 m/s is larger, ranging from 25.46% to 44.29%. The EWF shows lower wind speeds around the typhoon center, with a noticeable average relative error of Wmax, ranging from 17.64% to 29.37%. However, the average relative error of wind speeds below 10 m/s is smaller, ranging from 18.36% to 32.00%.
The HBWF is constructed by combining the HWF and the EWF. By introducing a weight coefficient that varies with the wind speed radius, the HBWF is improved to ensure a smooth transition between the two wind fields. The typhoon wave simulation results obtained using the HBWF as the input wind field show an average relative error of SWH reduced from 32.48% and 27.94% (from the HWF and EWF, respectively) to 25.29%, the average value of RMSE reduced from 0.46 m and 0.42 m to 0.39 m, and the consistency index improved from 0.94 and 0.95 (from the HWF and EWF, respectively) to 0.96.
The combination of the parameter B and Rmax in the HWF model is related to the typhoon’s location. The empirical formulas and wave-breaking parameters utilized in this study are derived from research findings in China’s coastal waters and may not be applicable to other waters.
Data availability statement
The original contributions presented in the study are included in the article/supplementary material. Further inquiries can be directed to the corresponding author/s.
Author contributions
XC: Methodology, Software, Validation, Writing – original draft, Writing – review & editing. YN: Methodology, Software, Supervision, Writing – original draft, Writing – review & editing. YS: Formal analysis, Investigation, Resources, Validation, Writing – review & editing. YY: Data curation, Investigation, Resources, Writing – review & editing. JW: Data curation, Investigation, Resources, Writing – review & editing.
Funding
The author(s) declare financial support was received for the research, authorship, and/or publication of this article. The research is supported by the Open Research Fund of the Key Laboratory of Nearshore Engineering Environment and Ecological Security of Zhejiang Province (No.CEEES202305), and the National Natural Science Foundation of China (No. 42106211).
Conflict of interest
The reviewer HL declared a shared affiliation with the authors XC, YN and YS.
The remaining authors declare that the research was conducted in the absence of any commercial or financial relationships that could be construed as a potential conflict of interest.
Publisher’s note
All claims expressed in this article are solely those of the authors and do not necessarily represent those of their affiliated organizations, or those of the publisher, the editors and the reviewers. Any product that may be evaluated in this article, or claim that may be made by its manufacturer, is not guaranteed or endorsed by the publisher.
References
Amarouche K., Akpınar A., Soran M. B., Myslenkov S., Majidi A. G., Kankal M., et al. (2021). Spatial calibration of an unstructured SWAN model forced with CFSR and ERA5 winds for the Black and Azov Seas. Appl. Ocean Res. 117, 102962. doi: 10.1016/j.apor.2021.102962
Anton I. A., Rusu L., Anton C. (2019). Nearshore wave dynamics at Mangalia beach simulated by spectral models. J. Mar. Sci. Eng. 7, 206. doi: 10.3390/jmse7070206
Aydoğan B., Ayat B. (2021). Performance evaluation of SWAN ST6 physics forced by ERA5 wind fields for wave prediction in an enclosed basin. Ocean Eng. 240, 109936. doi: 10.1016/j.oceaneng.2021.109936
Battjes J. A., Janssen J. (1978). “Energy loss and set-up due to breaking of random waves,” in Proceedings of the 16th international conference on coastal engineering, vol. 1. (American Society of Civil Engineers, New York, NY), 569–587. doi: 10.9753/icce.v16.32
Carvalho D., Rocha A., Gómez-Gesteira M., Alvarez I., Santos C. S. (2013). Comparison between CCMP, QuikSCAT and buoy winds along the Iberian Peninsula coast. Remote Sens. Environ. 137, 173–183. doi: 10.1016/j.rse.2013.06.005
Cavaleri L., Bertotti A. (2006). The improvement of modelled wind and wave fields with increasing resolution. Ocean Eng. 33, 553–565. doi: 10.1016/j.oceaneng.2005.07.004
Emanuel K. (2003). Tropical cyclones. Annu. Rev. Earth Pl. Sc. 31, 75–104. doi: 10.1146/annurev.earth.31.100901.141259
Fang G., Pang W., Zhao L., Rawal P., Cao S., Ge Y. (2021). Toward a refined estimation of typhoon wind hazards: Parametric modeling and upstream terrain effects. J. Wind Eng. Ind. Aerod. 209, 104460. doi: 10.1016/j.jweia.2020.104460
Fang P., Ye G., Yu H. (2020). A parametric wind field model and its application in simulating historical typhoons in the western North Pacific Ocean. J. Wind Eng. Ind. Aerod. 199, 104131. doi: 10.1016/j.jweia.2020.104131
Feng X., Chen X. (2021). Feasibility of ERA5 reanalysis wind dataset on wave simulation for the western inner-shelf of Yellow Sea. Ocean Eng. 236, 109413. doi: 10.1016/j.oceaneng.2021.109413
Feng X., Yin B., Yang D. (2016). Development of an unstructured-grid wave-current coupled model and its application. Ocean Model. 104, 213–225. doi: 10.1016/j.ocemod.2016.06.007
Fu C., Yu F., Liu Q., Li T. (2013). An improved study on the storm surge with four-quadrant asymmetric wind model. Mar. Sci. Bull. 32, 626–632. doi: 10.11840/j.issn.1001-6392.2013.06.004
Gong Y., Dong S., Wang Z. (2022). Forecasting of typhoon wave based on hybrid machine learning models. Ocean Eng. 266, 112934. doi: 10.1016/j.oceaneng.2022.112934
Gorman R. M. (2009). Intercomparison of methods for the temporal interpolation of synoptic wind fields. J. Atmos. Ocean. Tech. 26, 828–837. doi: 10.1175/2008JTECHO588.1
Graham H. E., Nunn D. E. (1959). “Meteorological conditions pertinent to standard project hurricane,” in Atlantic and Gulf Coasts of United States, national hurricane research project (Weather Bureau, US Department of Commerce, Washington, DC).
Harper B. A. (2001). Queensland climate change and community vulnerability to tropical cyclones, ocean hazards assessment - stage 1, report (Queensland, Brisbane, Australia: Department of Natural Resources and Mines), 368.
Harper B. A., Holland G. J. (1999). “An updated parametric model of the tropical cyclone,” in Proc. 23rd conf. Hurricanes and tropical meteorology, vol. 1999. (Dallas, TX: American Meteorological Society), 893–896.
Hisaki Y. (2018). Wave hindcast in the North Pacific area considering the propagation of surface disturbances. Prog. Oceanogr. 165, 332–347. doi: 10.1016/j.pocean.2018.06.003
Holland G. J. (1980). An analytic model of the wind and pressure profiles in hurricanes. Mon. Weather Rev. 108, 1212–1218. doi: 10.1175/1520-0493(1980)108<1212:aamotw>2.0.co;2
Holland G. J. (2008). A revised hurricane pressure–wind model. Mon. Weather Rev. 136, 3432–3445. doi: 10.1175/2008MWR2395.1
Hubbert G. D., Holland G. J., Leslie L. M., Manton M. J. (1991). A real-time system for forecasting tropical cyclone storm surges. Weather Forecast. 6, 86–97. doi: 10.1175/1520-0434(1991)006<0086:artsff>2.0.co;2
Jakobsen F., Madsen H. (2004). Comparison and further development of parametric tropical cyclone models for storm surge modelling. J. Wind Eng. Ind. Aerod. 92, 375–391. doi: 10.1016/j.jweia.2004.01.003
Jelesnianski C. P. (1965). A numerical calculation of storm tides induced by a tropical storm impinging on a continental shelf. Mon. Weather Rev. 93, 343–358. doi: 10.1175/1520-0493(1993)093<0343:ANCOS>2.3.CO;2
Jiang L., Tu X., Wang Y., Shen H., Xu D. (2021). Characteristics of typhoon-induced wave by Mitag(1918) and their differences with that induced by typhoon Lekima(1909). Mar. Forecasts. 38, 53–60. doi: 10.11737/j.issn.1003-0239.2021.04.007
Jiang F. C., Zhenshiyi T., Zhang Y., Keiko U. (2023). Risk map of typhoon induced wave fields around Hainan Island. Appl. Ocean Res. 137, 103603. doi: 10.1016/j.apor.2023.103603
Jin L., Chen G., Zhao H., Yan S., Nie X. (2015). Study of combined wind in simulating storm waves in the South China Sea. J. Waterway Harb. 36, 12–20. doi: 10.3969/j.issn.1005-8443.2015.01.003
Li X., Ding J., Huang J., Yuan P., Xie D. (2021). Performance assessment of different wind forcing datasets for simulation of wind wave during typhoon. Hydro Sci. Eng. 06), 34–42. doi: 10.12170/20210928001
Li L., Li Z., He Z., Yu Z., Ren Y. (2022). Investigation of storm tides induced by super typhoon in macro-tidal Hangzhou Bay. Front. Mar. Sci. 9. doi: 10.3389/fmars.2022.890285
Li J., Zhu J., Xu J., Yao Y. (2023). A comparative study on the applicability of ERA-Interim and ERA5 reanalysis wind data in the coastal waters of China. Mar. Sci. Bull. 42, 260–271. doi: 10.11840/j.issn.1001-6392.2023.03.003
Lin W., Fang W. (2013). Regional characteristics of holland B parameter in typhoon wind field model for northwest pacific. Trop. Geogr. 33, 124–132. doi: 10.13284/j.cnki.rddl.002331
Love G., Murphy K. (1984). The operational analysis of tropical cyclone wind fields in the Australian northern region. NT Reg. Res. Pap. 85, 44–51.
Manaster A., Ricciardulli L., Meissner T. (2021). Tropical cyclone winds from windSat, AMSR2, and SMAP: comparison with the HWRF model. Remote Sens. 13, 2347. doi: 10.3390/rs13122347
Mazyak A. R., Shafieefar M. (2022). Development of a hybrid wind field for modeling the tropical cyclone wave field. Cont. Shelf Res. 245, 104788. doi: 10.1016/j.csr.2022.104788
Miao H., Dong D., Huang G., Hu K., Tian Q., Gong Y. (2020). Evaluation of Northern Hemisphere surface wind speed and wind power density in multiple reanalysis datasets. Energy 200, 117382. doi: 10.1016/j.energy.2020.117382
Moeini M. H., Etemad-Shahidi A. (2007). Application of two numerical models for wave hindcasting in Lake Erie. Appl. Ocean Res. 29, 137–145. doi: 10.1016/j.apor.2007.10.001
Moeini M. H., Etemad-Shahidi A., Chegini V. (2010). Wave modeling and extreme value analysis off the northern coast of the Persian Gulf. Appl. Ocean Res. 32, 209–218. doi: 10.1016/j.apor.2009.10.005
Pan Y., Chen Y., Li J., Ding X. (2016). Improvement of wind field hindcasts for tropical cyclones. Water Sci. Eng. 9, 58–66. doi: 10.1016/j.wse.2016.02.002
Powell M., Soukup G., Cocke S., Gulati S., Morisseau-Leroy N., Hamid S., et al. (2005). State of Florida hurricane loss projection model: Atmospheric science component. J. Wind Eng. Ind. Aerod. 93, 651–674. doi: 10.1016/j.jweia.2005.05.008
Roldán M., Montoya R. D., Rios J. D., Osorio A. F. (2023). Modified parametric hurricane wind model to improve the asymmetry in the region of maximum winds. Ocean Eng. 280, 114508. doi: 10.1016/j.oceaneng.2023.114508
Shao Z., Liang B., Li H., Wu G., Wu Z. (2018). Blended wind fields for wave modeling of tropical cyclones in the South China Sea and East China Sea. Appl. Ocean Res. 71, 20–33. doi: 10.1016/j.apor.2017.11.012
Tang J., Shi J., Li X., Deng B., Jin M. (2013). Numerical simulation of typhoon waves with typhoon wind model. Trans. Oceanol. Limnol. 02), 24–30. doi: 10.13984/j.cnki.cn37-1141.2013.02.022
Tian Z., Zhang Y. (2021). Numerical estimation of the typhoon-induced wind and wave fields in Taiwan Strait. Ocean Eng. 239, 109803. doi: 10.1016/j.oceaneng.2021.109803
Torres M. J., Reza Hashemi M., Hayward S., Spaulding M., Ginis I., Grilli S. T. (2019). Role of hurricane wind models in accurate simulation of storm surge and waves. J. Waterw. Port Coast. 145, 04018039. doi: 10.1061/(asce)ww.1943-5460.0000496
Van Vledder G. P., Akpınar A. (2015). Wave model predictions in the Black Sea: Sensitivity to wind fields. Appl. Ocean Res. 53, 161–178. doi: 10.1016/j.apor.2015.08.006
Vickery P. J., Skerlj P., Steckley A., Twisdale L. (2000). Hurricane wind field model for use in hurricane simulations. J. Struct. Eng. 126, 1203–1221. doi: 10.1061/(asce)0733-9445(2000)126:10(1203
Vickery P. J., Wadhera D. (2008). Statistical models of Holland pressure profile parameter and radius to maximum winds of hurricanes from flight-level pressure and H* Wind data. J. Appl. Meteorol. Clim. 47, 2497–2517. doi: 10.1175/2008jamc1837.1
Wang N., Hou Y., Li S., Li R. (2019). Numerical simulation and preliminary analysis of typhoon waves during three typhoons in the Yellow Sea and East China Sea. J. Oceanol. Limnol. 37, 1805–1816. doi: 10.1007/s00343-019-8260-4
Wang X., Yin Q., Zhang B. (1991). Research and applications of a forecasting model of typhoon surges in China seas. Adv. Water Sci. 2, 1–10.
Wei M., Fang G., Zhao L., Wang Z., Wang J., Cao S., et al. (2023). Comparative study of typhoon wind hazard estimation in coastal region of China using different wind field parameter models. J. Wind Eng. Ind. Aerod. 236, 105398. doi: 10.1016/j.jweia.2023.105398
Willmott C. J. (1981). On the validation of models. Phys. Geogr. 2, 184–194. doi: 10.1080/02723646.1981.10642213
Willoughby H. E., Rahn M. E. (2004). Parametric representation of the primary hurricane vortex. Part I: Observations and evaluation of the Holland, (1980) model. Mon. Weather Rev. 132, 3033–3048. doi: 10.1175/mwr2831.1
Wu R., Wu S., Chen T., Yang Q., Han B., Zhang H. (2021). Effects of wave–current interaction on the eastern China coastal waters during super typhoon lekima, (2019). J. Phys. Oceanogr. 51, 1611–1636. doi: 10.1175/JPO-D-20-0224.1
Wu Y., Zhao H., Ye R., Sun J., Kong J. (2020). A comparative study of the effects of asymmetric wind field on typhoon wave simulation. Mar. Forecasts. 37, 55–61. doi: 10.11737/j.issn.1003-0239.2020.01.008
Xie L., Bao S., Pietrafesa L. J., Foley K., Fuentes M. (2006). A real-time hurricane surface wind forecasting model: Formulation and verification. Mon. Weather Rev. 134, 1355–1370. doi: 10.1175/mwr3126.1
Xiong J., Yu F., Fu C., Dong J., Liu Q. (2022). Evaluation and improvement of the ERA5 wind field in typhoon storm surge simulations. Appl. Ocean Res. 118, 103000. doi: 10.1016/j.apor.2021.103000
Yang Y., Guan W., Deleersnijder E., He Z. (2022). Hydrodynamic and sediment transport modelling in the Pearl River Estuary and adjacent Chinese coastal zone during Typhoon Mangkhut. Cont. Shelf Res. 233, 104645. doi: 10.1016/j.csr.2022.104645
Yi J., Zhang X., Zou G., Zhang K., Wang J. (2023). A numerical simulation study on the probable maximum typhoon wave in the south China Sea. Sustainability. 15, 10254. doi: 10.3390/su151310254
Keywords: holland wind field, ERA5 wind field, hybrid wind field, China’s coastal waters, significant wave height, typhoon waves
Citation: Chen X, Ni Y, Shen Y, Ying Y and Wang J (2024) The research on the applicability of different typhoon wind fields in the simulation of typhoon waves in China’s coastal waters. Front. Mar. Sci. 11:1492521. doi: 10.3389/fmars.2024.1492521
Received: 07 September 2024; Accepted: 22 October 2024;
Published: 08 November 2024.
Edited by:
Li Li, Zhejiang University, ChinaReviewed by:
Yukiharu Hisaki, University of the Ryukyus, JapanZili Dai, Shanghai University, China
Huidi Liang, Ministry of Natural Resources, China
Copyright © 2024 Chen, Ni, Shen, Ying and Wang. This is an open-access article distributed under the terms of the Creative Commons Attribution License (CC BY). The use, distribution or reproduction in other forums is permitted, provided the original author(s) and the copyright owner(s) are credited and that the original publication in this journal is cited, in accordance with accepted academic practice. No use, distribution or reproduction is permitted which does not comply with these terms.
*Correspondence: Yunlin Ni, b2NlYW5ueWxAempvdS5lZHUuY24=