 Zheng Zhou
 Xingdong Wang
 Zehao Sun
 Yanchuang Zhao
- 1State Key Laboratory of Spatial Datum, College of Remote Sensing and Geoinformatics Engineering, Faculty of Geographical Science and Engineering, Henan University, Zhengzhou, China
- 2College of Information Science and Engineering, Henan University of Technology, Zhengzhou, China
Background: Traditional water indices often misclassify shadows as water, especially in polar regions. This study aims to improve water extraction accuracy by analyzing the spectral characteristics of water and shadows.
Methods: A statistical analysis of the reflectance curves between red and green bands was conducted using Landsat 8 and Sentinel-2 imagery. Based on the steepness of decline in reflectance, a new water index, WI2023, was proposed. The index was validated using 10 Landsat 8 and 10 Sentinel-2 images from the Amery Ice Shelf.
Results: The WI2023 index showed significantly improved discrimination between meltwater and shadows. Compared to NDWI and other indices, WI2023 achieved the highest accuracy when benchmarked against high-resolution Sentinel-2 data (extraction accuracy of 95.02%).
Conclusion: The WI2023 index provides a robust approach for meltwater extraction in polar environments, particularly in low-latitude and low-altitude areas. It offers potential improvements in polar hydrological studies and remote sensing applications.
1 Introduction
The Antarctic ice sheet and the Greenland ice sheet together account for approximately 96.6% of the total global ice sheet, but they are experiencing increasingly severe ice mass losses (Yang et al., 2023; Rignot et al., 2019; Mouginot et al., 2019). Among them, the Antarctic ice sheet is the largest land ice sheet, and its ice reserves account for about 90% of the global glaciers and 70% of the global freshwater resources, and the small changes in its mass balance have a significant impact on the changes in global sea level and climate change (Ding, 2013). The ablation of the Antarctic ice sheet surface will affect the mass balance of the ice sheet (Abram et al., 2020). Specifically, the meltwater formed by the melting of the ice sheet surface mainly affects the mass balance of the ice sheet through the following three pathways (Bell et al., 2018, 2017), Meltwater gathers and flows directly out from the edge of the ice sheet (Zhao et al., 2022). After the meltwater flows into the ice crevasses, the expansion of the crevasses will be further intensified. With the passage of time, the continuous expansion of the crevasses and the continuous weakening of the ice shelf may lead to the large-scale collapse of the ice shelf (Bett, 2021); After the meltwater penetrates into the inside of the ice sheet, it will cause the ablation of the inside of the ice sheet and promote the formation of internal channels of the ice sheet. When the meltwater reaches the bottom of the ice sheet, it will reduce the friction resistance between the bottom of the ice sheet and the base, leading to the sliding of the bottom of the ice sheet (Van Den Broeke et al., 2004). In addition, some meltwater on the ice surface, under the influence of topography and its own drainage system, forms hydrological features such as supraglacial lakes and rivers (Yang et al., 2015). This meltwater freezes when the temperature decreases and then melts again when the temperature rises, creating a cycle of “melting-freezing-melting” (Kashiwase et al., 2020; Munneke et al., 2018). The formation and change of these hydrological characteristics are the main manifestation of ice sheet surface ablation and an important indicator of ice sheet response to climate change (Yin et al., 2015; Li et al., 2020). Therefore, extracting ice sheet surface meltwater extent and monitoring the dynamic changes of ice lakes are of great significance in studying the polar environment and material changes (Li et al., 2023).
Due to the unique geographical location and environment of the polar regions, satellite remote sensing technology has become an important means of extracting polar meltwater. At present, researchers have done many studies on the extraction method of meltwater information based on remote sensing images and have achieved better results. Stokes et al. (2019) successfully generated a high-resolution dataset by combining Landsat 8 and Sentinel-1 data and extracted surface lakes and subglacial lakes on the Greenland ice sheet. This method significantly improves the monitoring of polar meltwater. Similarly, Kingslake et al. (2017) explored the movement of meltwater on the ice surface by analyzing the Greenland and Antarctic ice shelves, addressing the long-standing issue of ice flow. Other studies, such as Lenaerts et al. (2017), have found that wind plays an important role in accelerating the melting of exposed blue ice and snow-covered areas, further revealing the impact of changes in ice surface reflectance on meltwater. Williamson et al. (2017) proposed a method for monitoring changes in ice sheet lake surface area and volume with MODIS imagery and validated it on the West Greenland ice sheet. Meanwhile, Halberstadt et al. (2020) developed a trained supervised classifier that combines K-means clustering results to quantify ice lake areas, which helps to more accurately map and analyze lake areas. Miles et al. (2017) proposed a semi-automatic algorithm similar to Stokes et al. (2019), which combined Landsat 8 and Sentinel-1 data to further improve the accuracy of lake extraction from the Greenland ice sheet. Niu et al. (2021) improved the accuracy of meltwater extraction, particularly in the case of the Amery Ice Shelf, by combining U-Net network with an attention mechanism. Tuckett et al. (2021) solved the problem of limited visibility in optical satellite images on the Antarctic ice sheet, proposed a method for calculating the visibility index, and further improved the meltwater extraction algorithm. Moreover, Dirscherl et al. (2003) used machine learning algorithms trained on Sentinel-2 and auxiliary TanDEM-X terrain data to extract surface meltwater in polar regions, driving advances in polar monitoring technology. In terms of utilizing spectral features, McFeeters (1996) proposed the Normalized Difference Water Index (NDWI) based on the Normalized Vegetation Index (NDVI), which provides a new approach for extracting meltwater. Meanwhile, research based on NDWI, Yang (2013) proposed the NDWIice, which improved the ability to distinguish between meltwater and melting ice, while Qu et al. (2020) effectively extracted seasonal melting information in the Dalk Glacier through the modified normalized difference water index ice (MNDWIice). Among the above methods, the water index method is widely used for water body information extraction in remote sensing images because of its simple form, easy calculation and use, and it shows good water body extraction effect in different environments, but they are unable to effectively suppress shadows, and the shadows are often mis-extracted as water bodies. WI2023 is normalized by the reflectance difference between the green and red bands, combined with the wavelength difference, and enhances the ability to distinguish between shadows and meltwater.
In order to improve the extraction accuracy of water bodies, this paper proposed a novel water index that can effectively suppress shadows based on Landsat8 optical remote sensing images. Firstly, we analyse the application environment of the traditional water index and the reason why it is easy to mistakenly extract shadows as water bodies. Secondly, we analyse the high-resolution remote sensing images under a glacier environment, explore the spectral characteristics of ice surface water bodies and shadows under the glacier environment by collecting typical feature samples, and combine the concept of slope in mathematics, and then we propose the WI2023 for the water bodies on the ice surface. Finally, the spatial distribution results of surface meltwater of the ice shelf were obtained, and comparative analysis and accuracy evaluation were conducted.
2 Study area and data
2.1 Study area
The Amery Ice Shelf is the third largest ice shelf in Antarctica, located between the Prince Charles Mountains and the Larsemann hills in North Antarctica (66°-76° E and 68°-74° S). The Amery Ice Shelf has a relatively elevated terrain, with an average elevation of about 2500 m (Passchier et al., 2003; Roberts et al., 2007; Wen et al., 2014). The ice shelf is about 500 km long and 50–100 km wide, with an area of about 71260 km2 and a thickness of about 300–2500 m, and together with the Lambert Glacier, it forms Lambert Glacier—Amery Ice Shelf system (the largest glacier system in the Southeast Antarctic ice sheet) with an area of approximately 1.4 × 10⁶km2 (He et al., 2016; Yang and Kang, 2016). This study aims to mitigate the impact of shadows and extract meltwater on the polar surface. According to the literature (Zhou et al., 2019; He, 2016; Zhang, 2020), it is known that there is a significant amount of meltwater at the end of the Amery Ice Shelf during the summer, and due to the topography, there are abundant mountain shadows surrounding the end of the Amery Ice Shelf. Therefore, this paper chooses the study area from the end of the Amery Ice Shelf, as indicated by the purple box in Figure 1.
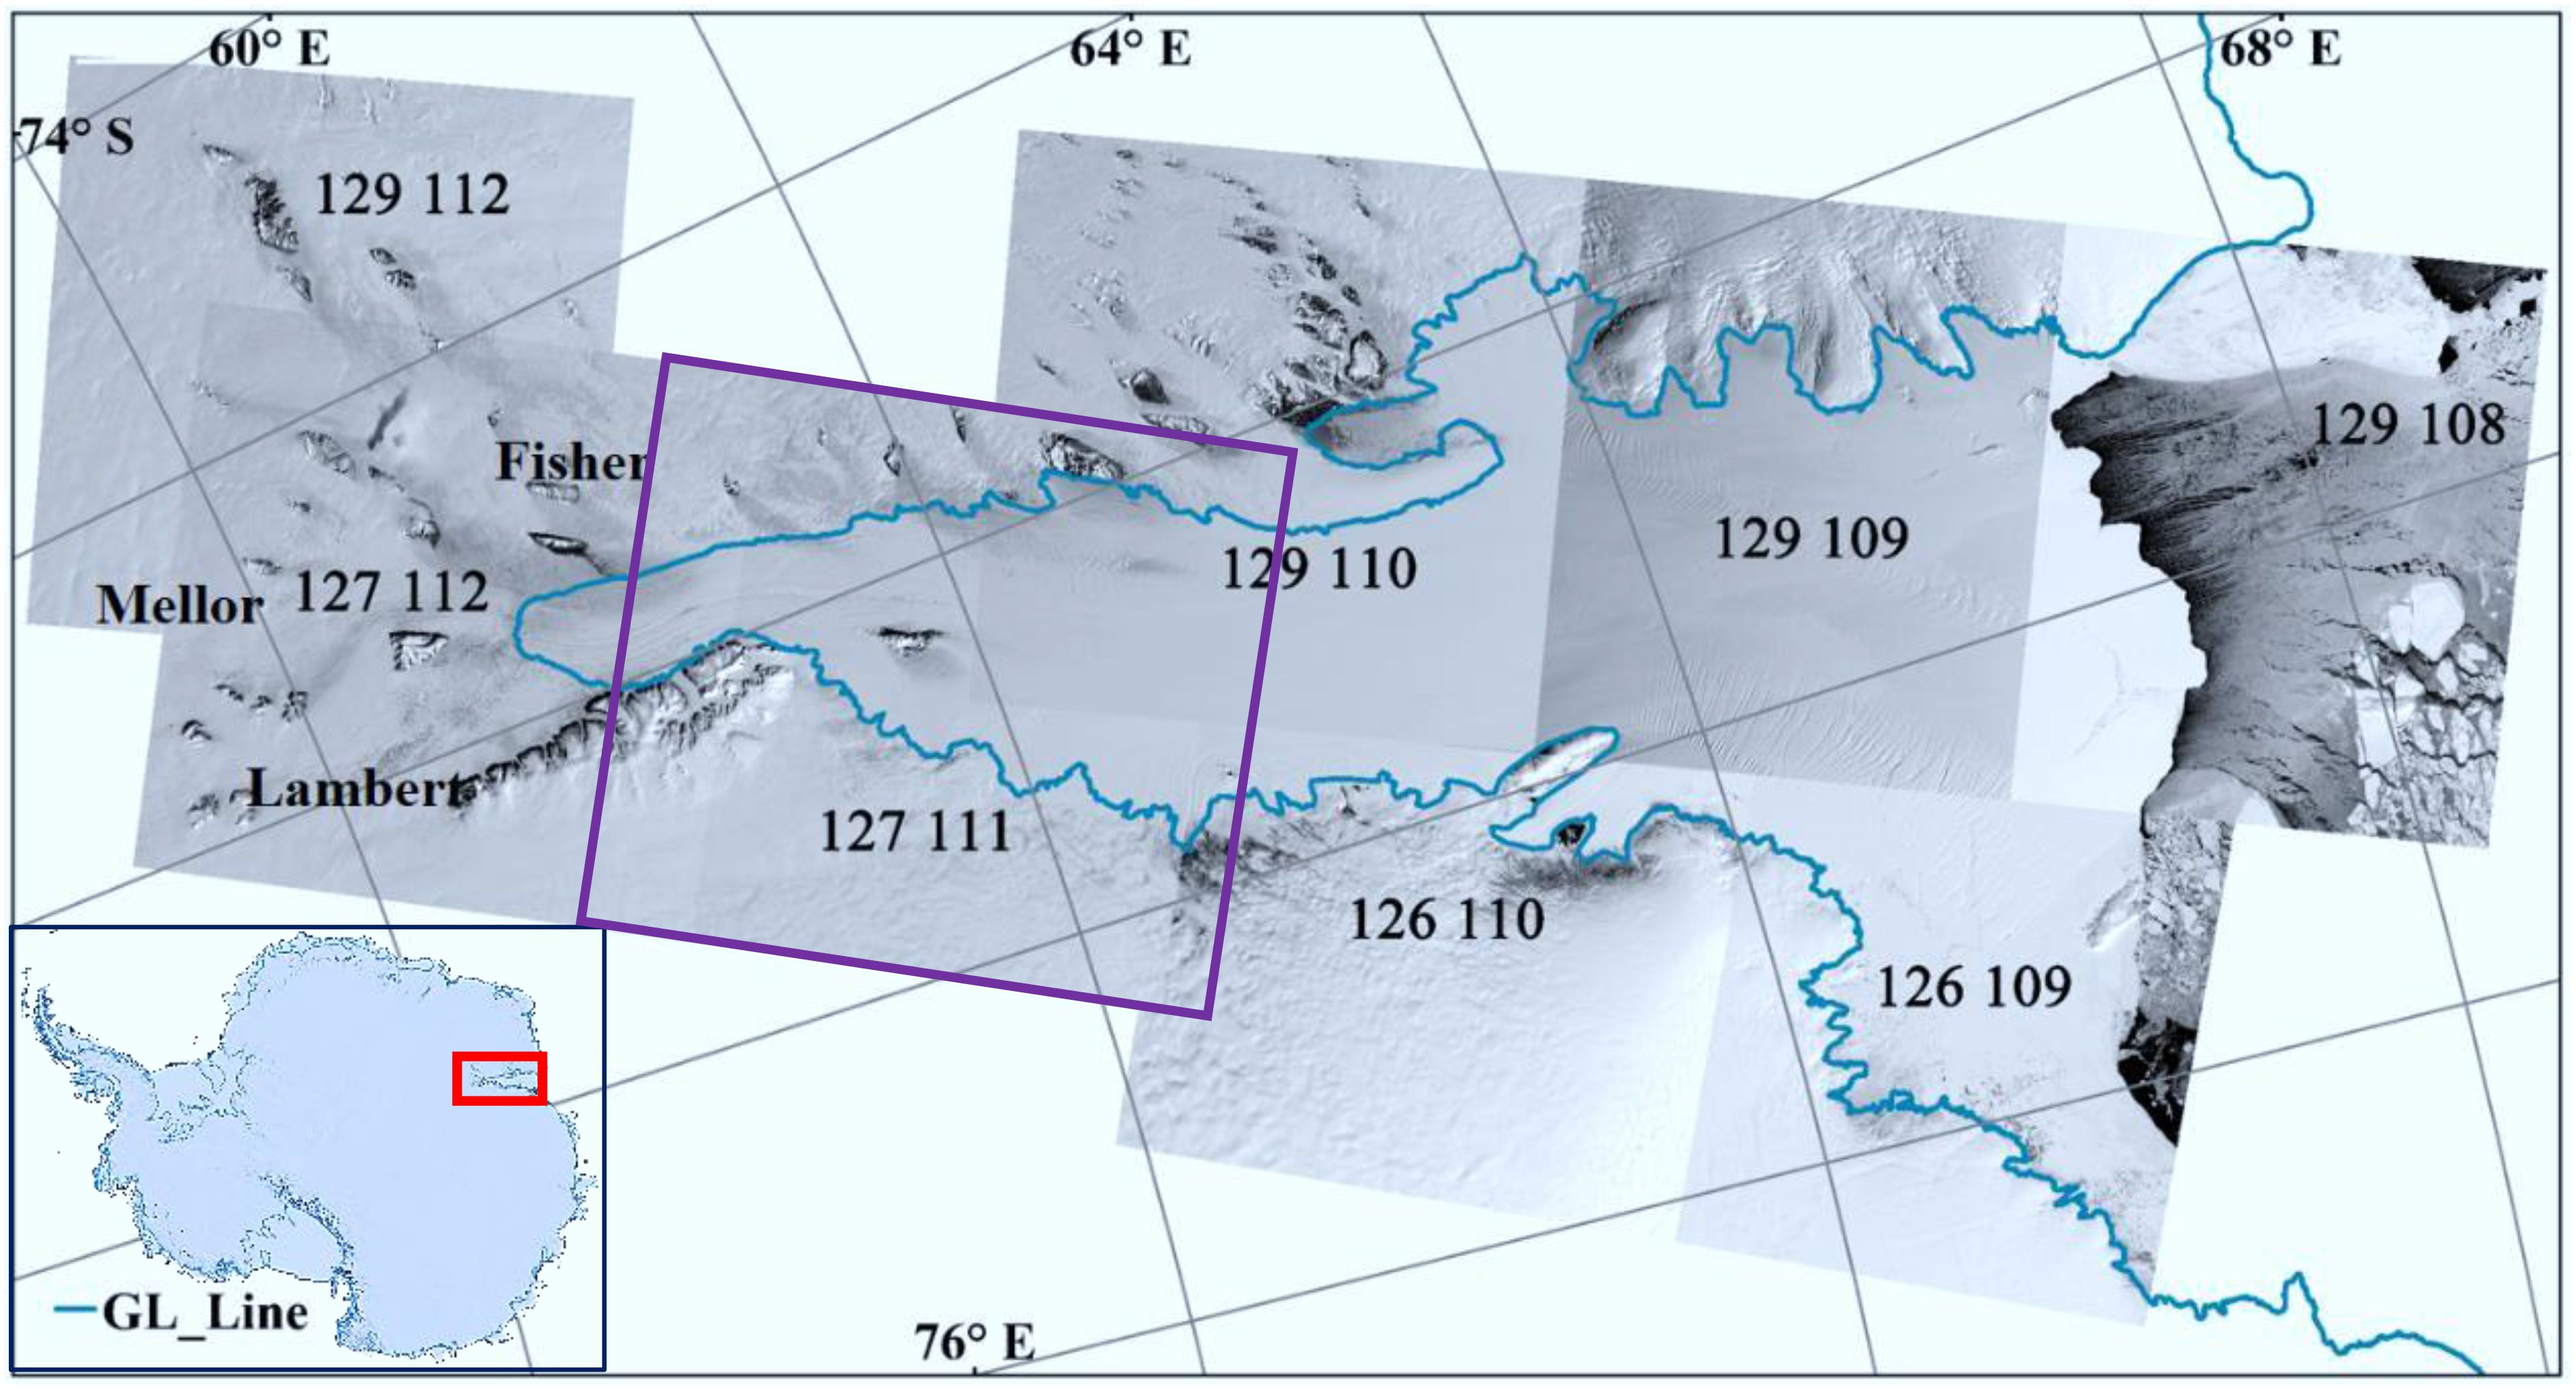
Figure 1. Study region.
2.2 Data
The Landsat 8 satellite was successfully launched on 11 February 2013, carrying two sensors, the Operational Land Imager (OLI) and the Thermal Infrared Sensor (TIRS), with a revisit cycle of 16 days. All data from the Landsat series of satellites are openly shared and can be downloaded from the USGS website (http://earthexplorer.gov/). The band information of the Landsat8 satellite used in this study is shown in Table 1.
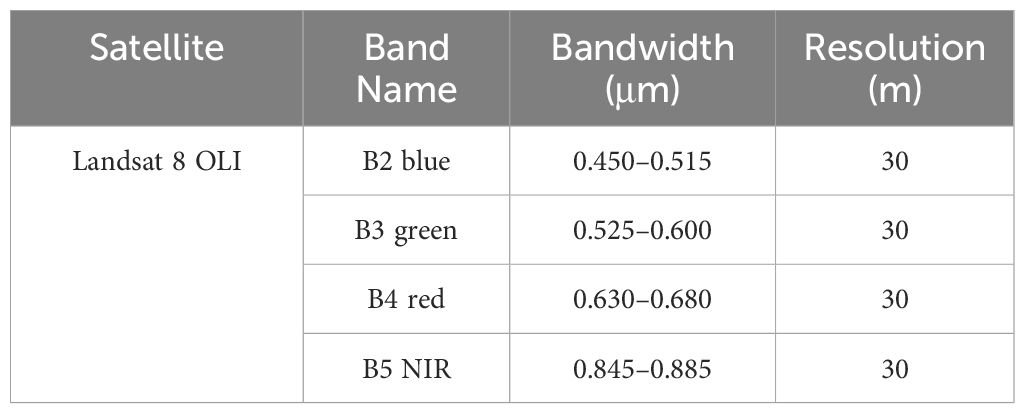
Table 1. Band information used in this study.
In this study, the results of meltwater extraction were validated using 10m-resolution Sentinel-2 image data. The Sentinel-2 series satellites are high-resolution multispectral imaging satellites launched by the European Space Agency (ESA). The series includes two satellites, Sentinel-2A and Sentinel-2B, which were successfully launched on 23 June 2015 and 17 March 2017, respectively. The single satellite has a revisit cycle of 10 days, while the two satellites complement each other with a revisit cycle of 5 days. ESA has only released L1C level multispectral data (MSI) for Sentinel-2. Sentinel-2 L1C is an atmospheric apparent reflectance product that has undergone orthorectified and geometric precision correction and has not undergone atmospheric correction. At the same time, ESA has defined S2 L2A level data, which mainly includes bottom of atmosphere corrected reflectance data. However, this L2A data needs to be produced by users according to their needs. Therefore, ESA has released a plugin called Sen2cor, which specializes in producing L2A level data. Data from the Sentinel-2 series of satellites are all openly shared and can be downloaded from the European Space Agency website (http://scihub.copernicus.eu/dhus/#home). The band information of the Sentinel-2 satellite used in this study is shown in Table 2.
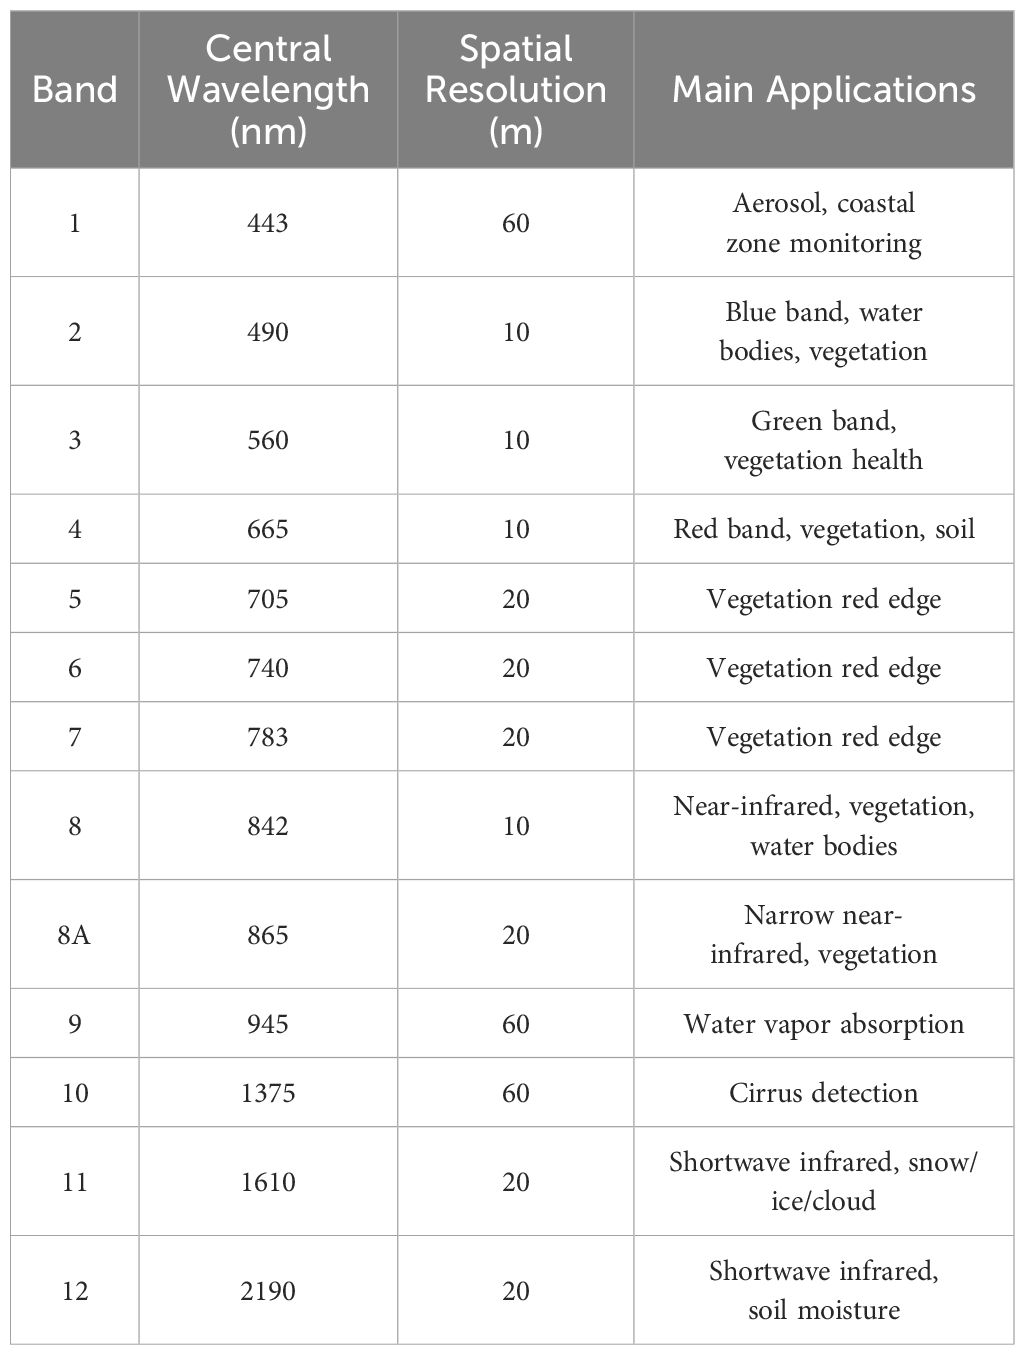
Table 2. Band information used in this study.
3 Methods
The traditional water indices method selects the bands with the strongest and weakest reflectance of the water body for normalization ratio calculation, which requires selecting different bands based on different terrain environments to construct a water index and is prone to mistakenly extract terrain shadows and cloud shadows as water bodies. For example, McFeeters found that water exhibits lower reflectance in the near-infrared(NIR) band, contrasting with the higher reflectance of land (McFeeters, 1996). Conversely, in the green band(Green), water demonstrates higher reflectance while land displays lower reflectance. Based on this, McFeeters selected the NIR and the Green bands to construct the NDWI for extracting open water body information. The Equation 1 is as follows:
where Bgreen and Bnir represent the reflectance of the Landsat-8 green band (Band 3) and near-infrared band (Band 5), respectively.
Polar land cover types are simple and the surface is open, so NDWI extracts polar meltwater better than the modified normalized difference water index (MNDWI) (Xu, 2005). However, there is a large amount of melting ice and snow in the polar regions during the ablation period, so these features have mixed characteristics of ice, snow, and water. In the NIR band, due to the low reflectivity of both meltwater and melting ice and snow, the NDWI does not distinguish well between water and melting ice and snow (Yang and Smith, 2013). In order to solve this deficiency of NDWI applied to the extraction of lake water bodies on the ice surface, Yang proposed an improved normalised water index (NDWIice) for the extraction of water bodies in the ice-covered environment by studying the spectral characteristics of the objects all over the ice-covered surface (Yang, 2013). The Equation 2 is as follows:
where Bblue and Bnir represent the reflectance of the Landsat-8 blue band (Band 2) and red band (Band 4), respectively.
Qu studied the spectral characteristics of six types of features (meltwater, blue ice, wet snow, dry snow, clouds and shadows) and proposed the MNDWIice (Qu et al., 2020). The Equation 3 is as follows:
where Bblue and Bnir represent the reflectance of the Landsat-8 blue band (Band 3) and near-infrared band (Band 5), respectively.
Although these methods can extract water bodies better in different surface environments, they can mistakenly extract terrain shadows and cloud shadows as water bodies, which affects the extraction accuracy.
To address this issue, the spectral characteristics of six features, namely, meltwater, wet snow, dry snow, bare rock, mountain shadows and cloud shadows, were selected for this study, as shown in Figure 2. As can be seen from Figure 2, meltwater has highly absorptive properties for incident energy (e.g., sunlight) and exhibit low reflectance in most of the wavelength range used in remote sensing. In addition, as the wavelength increases, the reflectivity of the meltwater further decreases. Dry snow appears white or nearly white in the visible wavelength range, and it has high reflectance for most visible light. In the NIR wavelength range, the reflectance decreases rapidly due to the crystalline structure in dry snow that scatters NIR light, and it reaches a minimum in the short-wave infrared (SWIR) wavelength range. Wet snow is slightly different from dry snow in that it has a lower reflectance and a darker appearance in the visible range due to the absorption of visible light by the water in the wet snow. Bare rock has a reflectance that increases with wavelength. Shadows are a common phenomenon in optical remote sensing images. They can interfere with the amount of information reflected by the target objects, leading to phenomena such as spectral confusion and misclassification. In Figure 2, the reflectance of bare rocks should increase with wavelength, but due to the influence of the shadows, the reflectance decreases gradually instead. Cloud shadows and mountain shadows, respectively, refer to the projection of clouds in the air and the self-projection of ground objects caused by factors such as terrain, altitude, and solar incidence angle. Due to occlusion, objects affected by shadows receive less light, resulting in lower reflectivity. Under the influence of cloud or mountain shadows, the reflectance characteristics of certain ground features are similar to those of water bodies, and the traditional water indices values of ground features and water bodies are very close, which makes it difficult to accurately extract water body information. Therefore, this paper does not use the selection of the strongest and weakest reflection bands of water bodies to construct water index but rather the characteristics of the reflectance curves of each surface feature. As shown in Figure 2, it is found that although the reflectance characteristics of both meltwater and shadows are in a decreasing trend, there are differences in their decreasing rates. The reflectivity curve of cloud shadows in Figure 2 steadily decreases without significant change. On the other hand, the reflectance of the meltwater starts to decrease abruptly in the blue light band, and then it levels off the reflectance of the cloud shadow at a certain point in the red light band and continues to decrease sharply, and then it tends to flatten out in the near-infrared band, and there is the greatest difference in the decreasing rate in the reflectance curves of meltwater and cloud shadows of the blue and red light bands, but the reflectivity curves of dry snow and mountain shadows have a very similar decreasing rate in the blue and green light bands. If the blue and red light bands are chosen to construct the water index, it will be difficult to distinguish between dry snow and mountain shadows, as show in Figure 3, so the blue light band is not considered, and the green and red light bands are chosen to construct the water index, which can maximize the difference among meltwater, shadows, and other features.
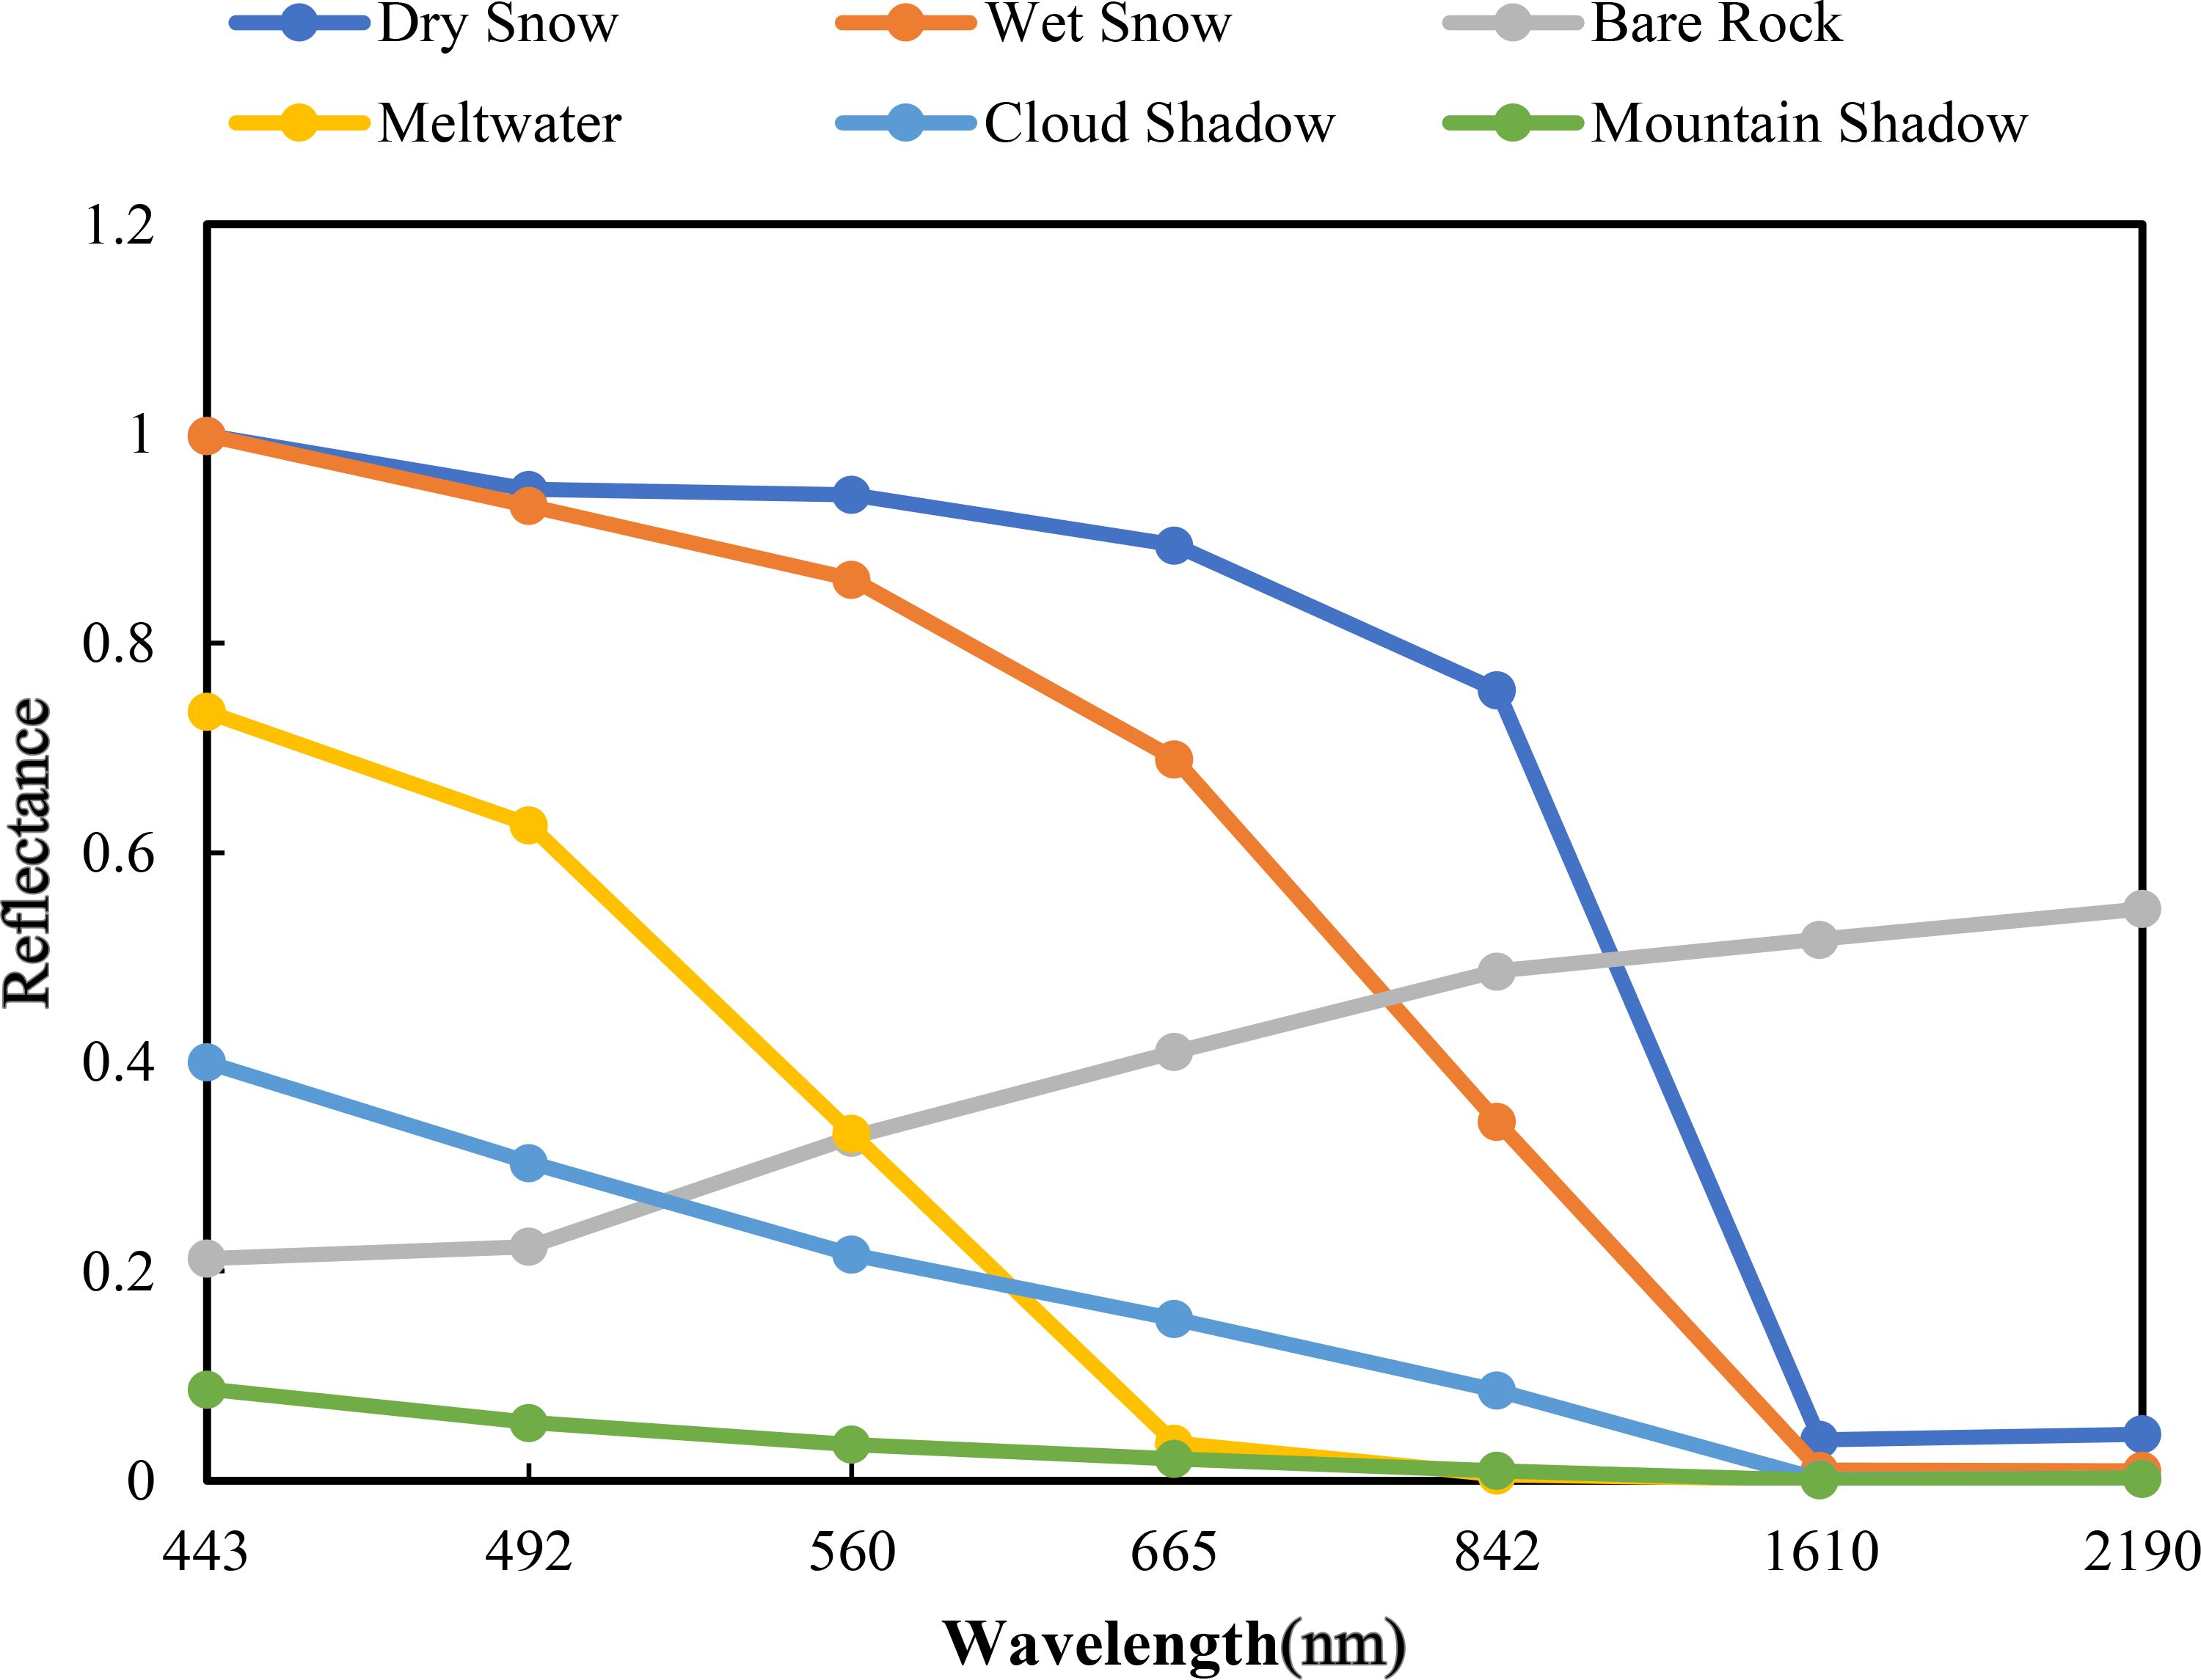
Figure 2. Reflectivity curves of polar features.
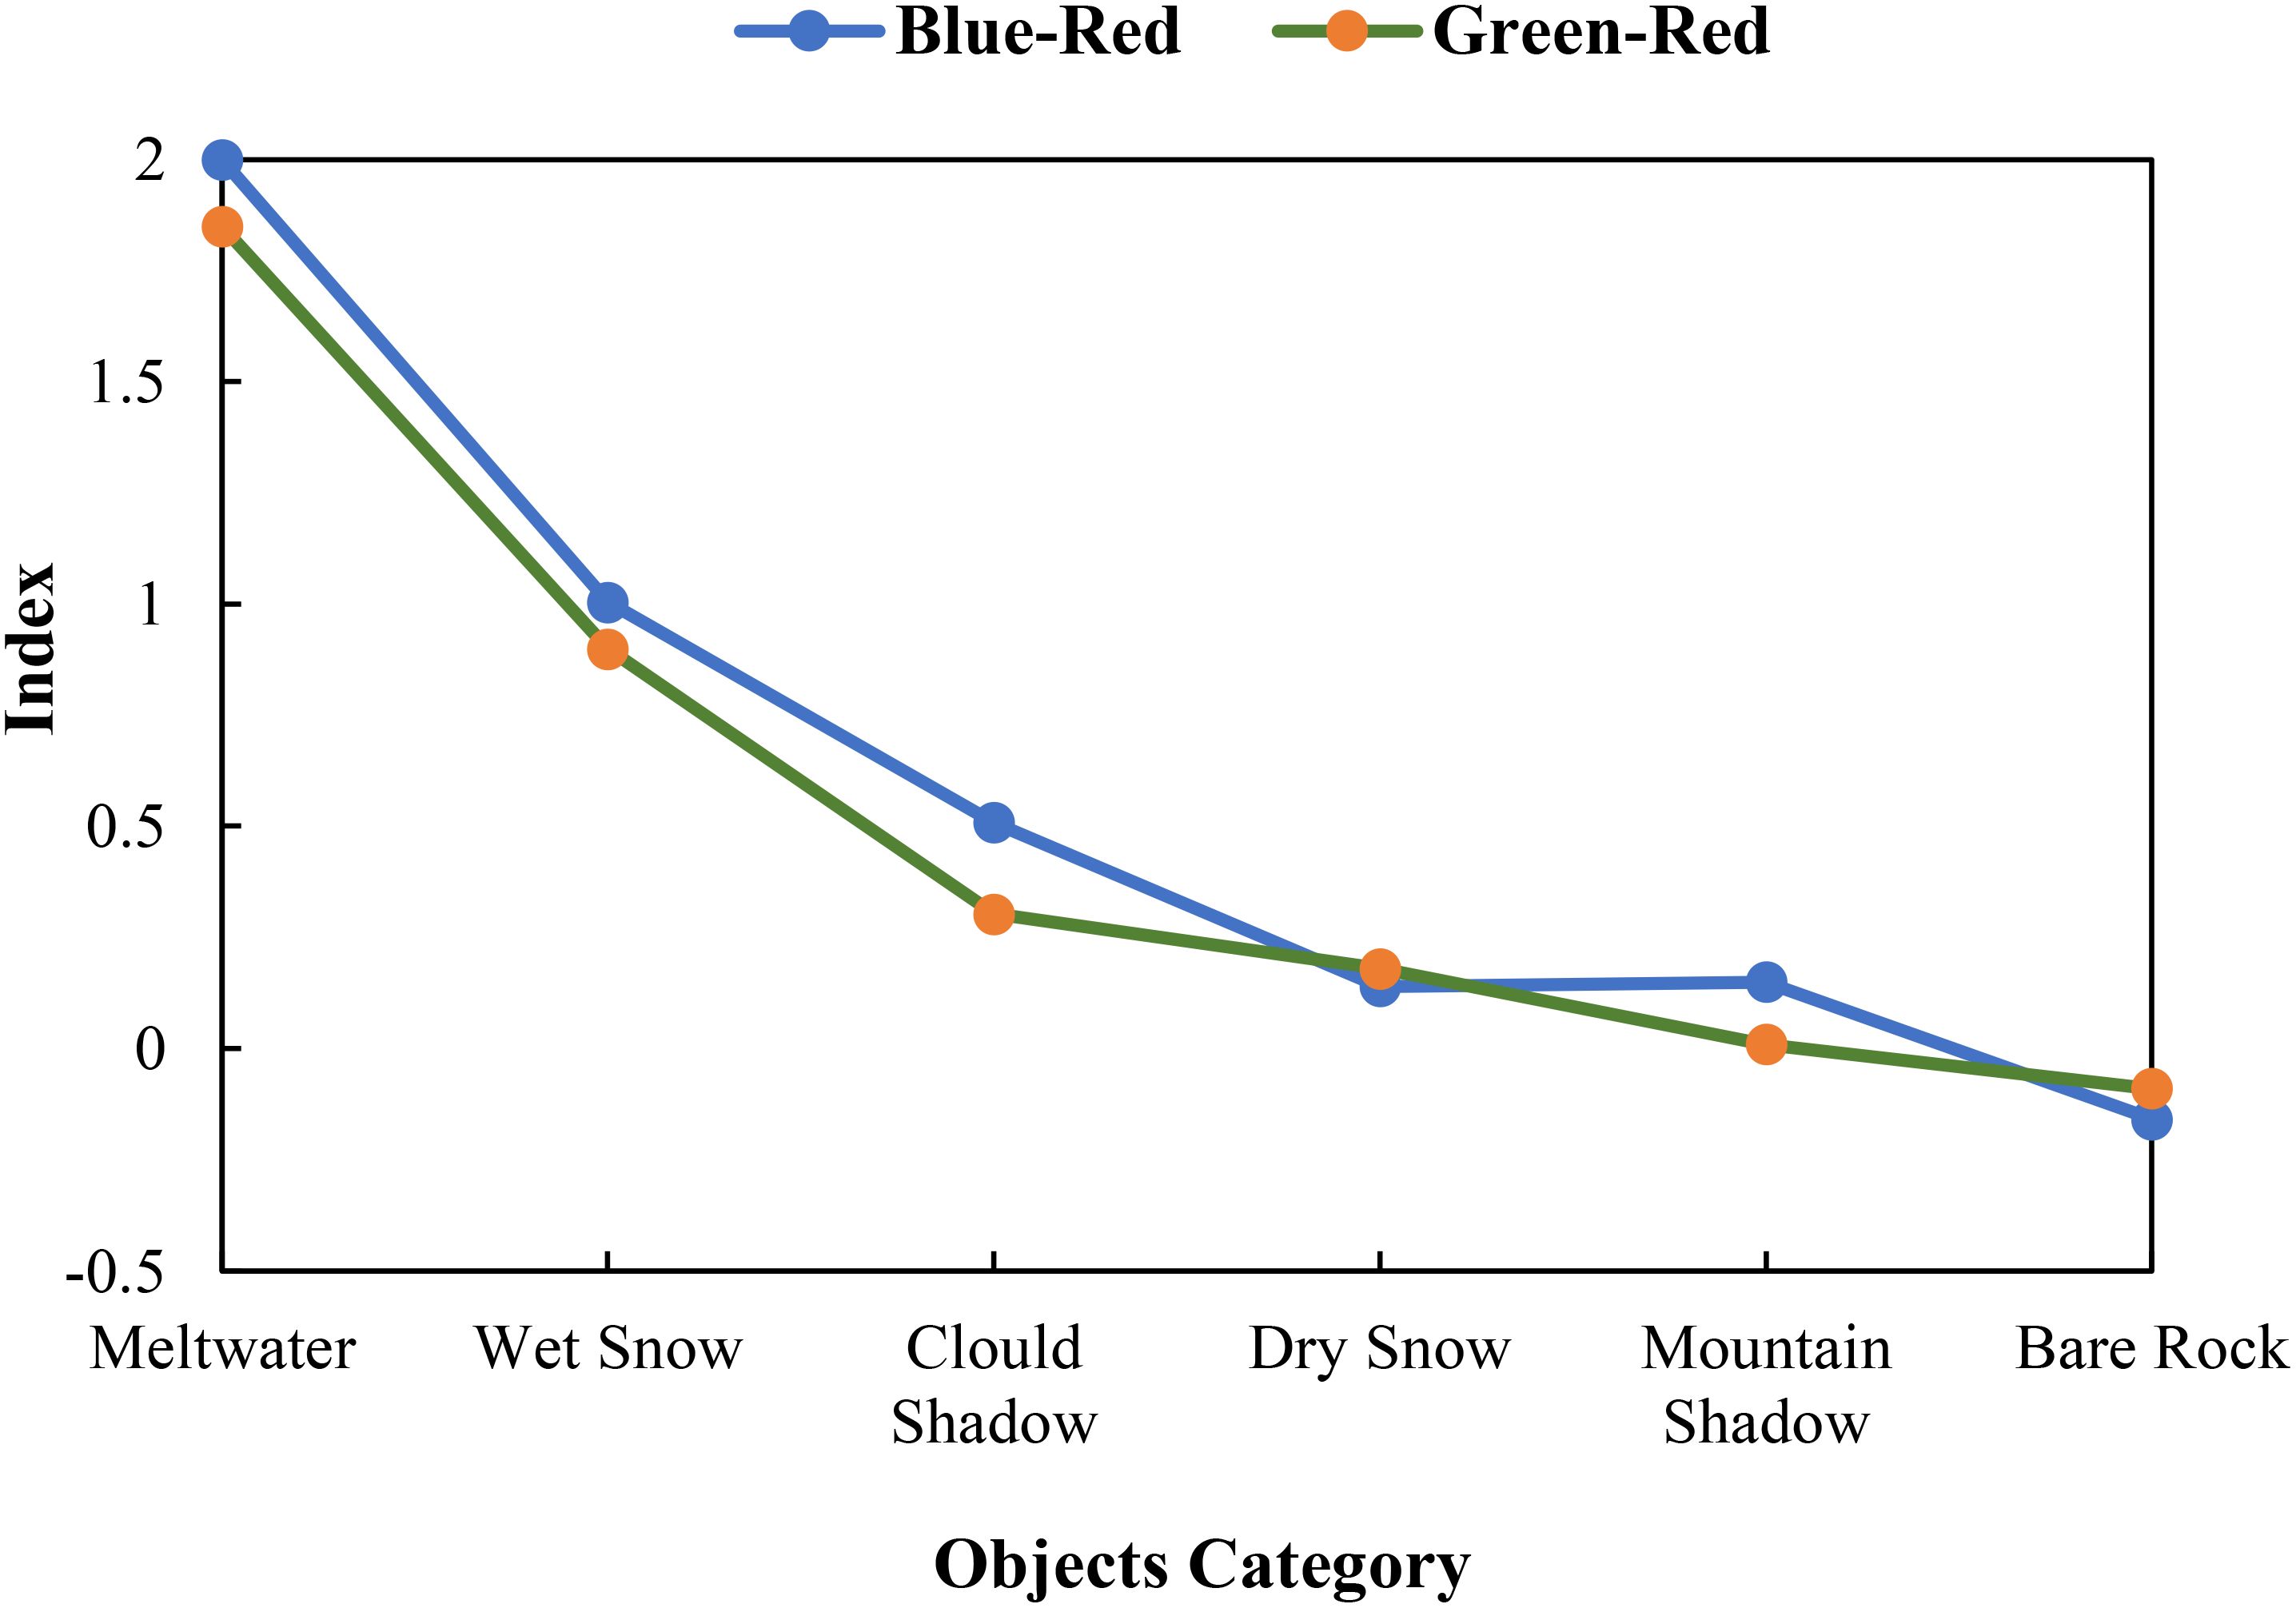
Figure 3. Green-Red Slope and Blue-Red Slope.
Select pure pixel samples of six types of ground features, including meltwater, wet snow, dry snow, bare rock, mountain shadow, and cloud shadow, and calculate the decreasing rate of their reflectance curves between the green and red light bands. Meanwhile, the NDWI, NDWIice, and MNDWice values of these six types of features are compared, and the results are shown in Figure 4. As can be seen from Figure 4, WI2023 has a good discrimination ability for various ground features, especially for shadows and meltwater. NDWI, NDWIice, and MNDWice, which use normalized ratio operations, can distinguish between meltwater and several other ground features except for shadows, but it is difficult to distinguish between meltwater and shadows. So this study proposes a novel water index WI2023 with the following Equation 4:
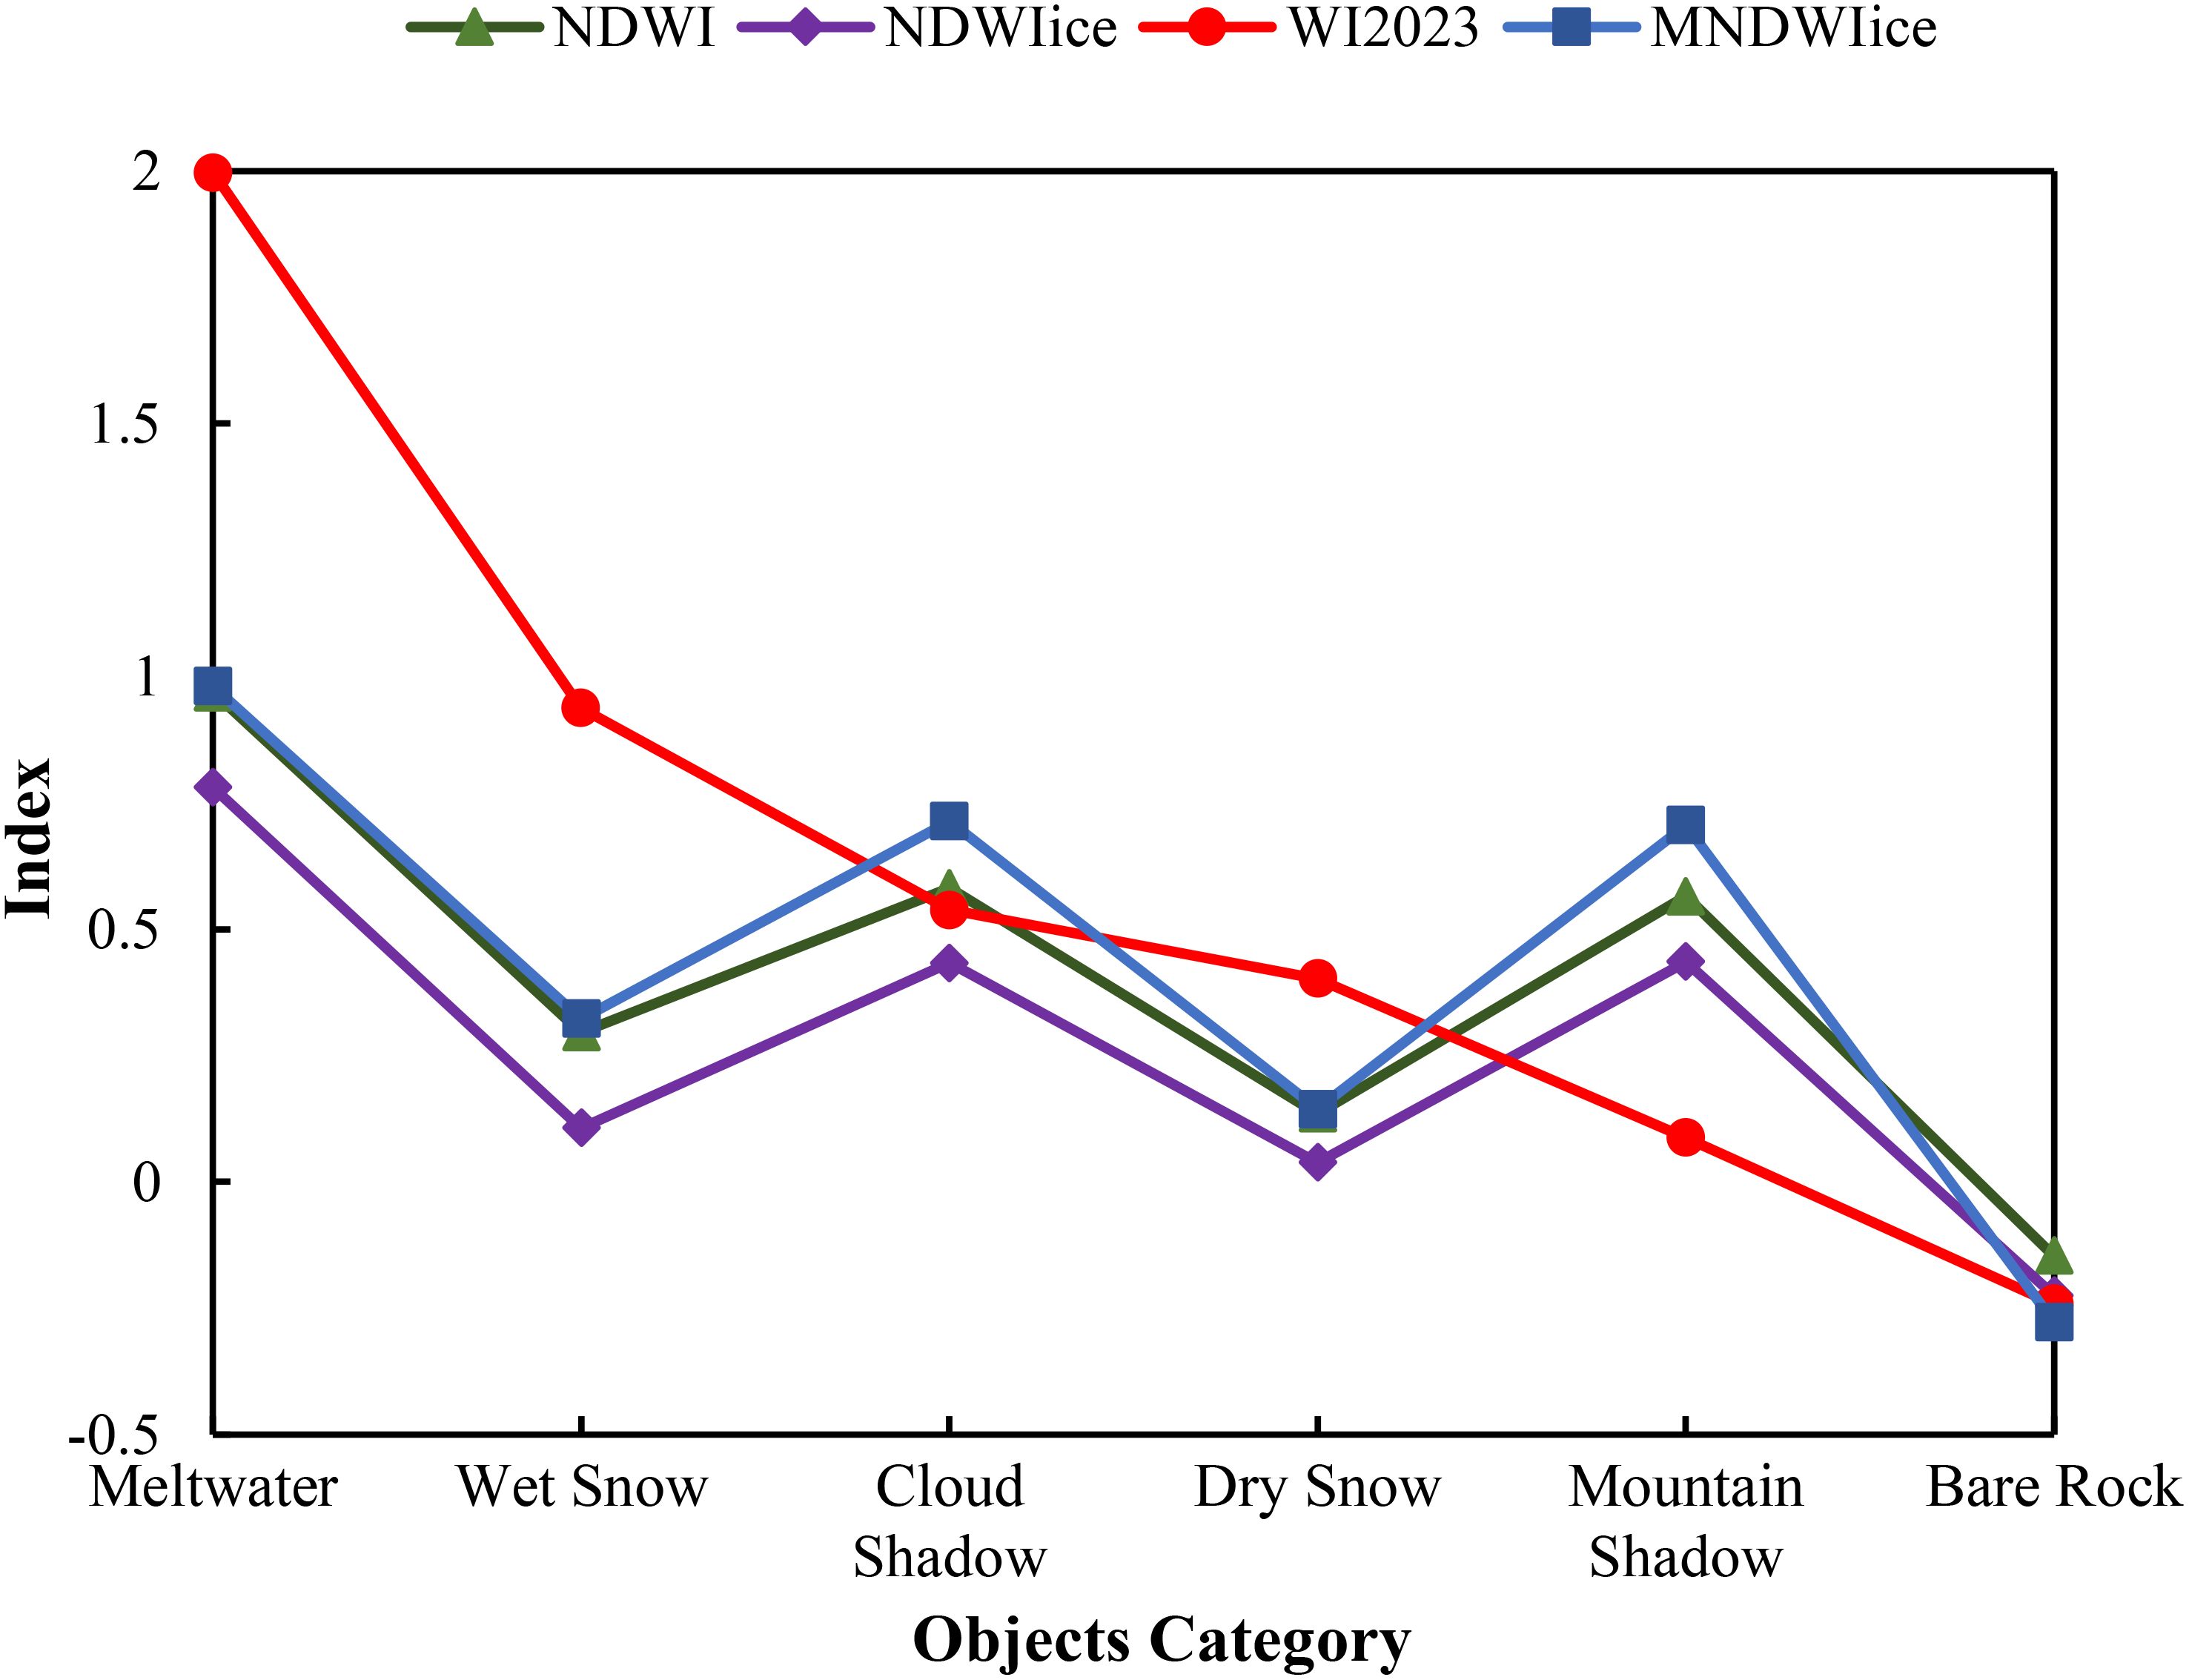
Figure 4. Index value curve of various features.
where Bgreen and Bred are the reflectivity in the green and red light bands, respectively. λred, λgreen is the maximum value of the Bandwidth of the red light band and the minimum value of the Bandwidth of the green light band, respectively.
The specific implementation process of extracting meltwater from the ice shelf surface is shown in Figure 5:
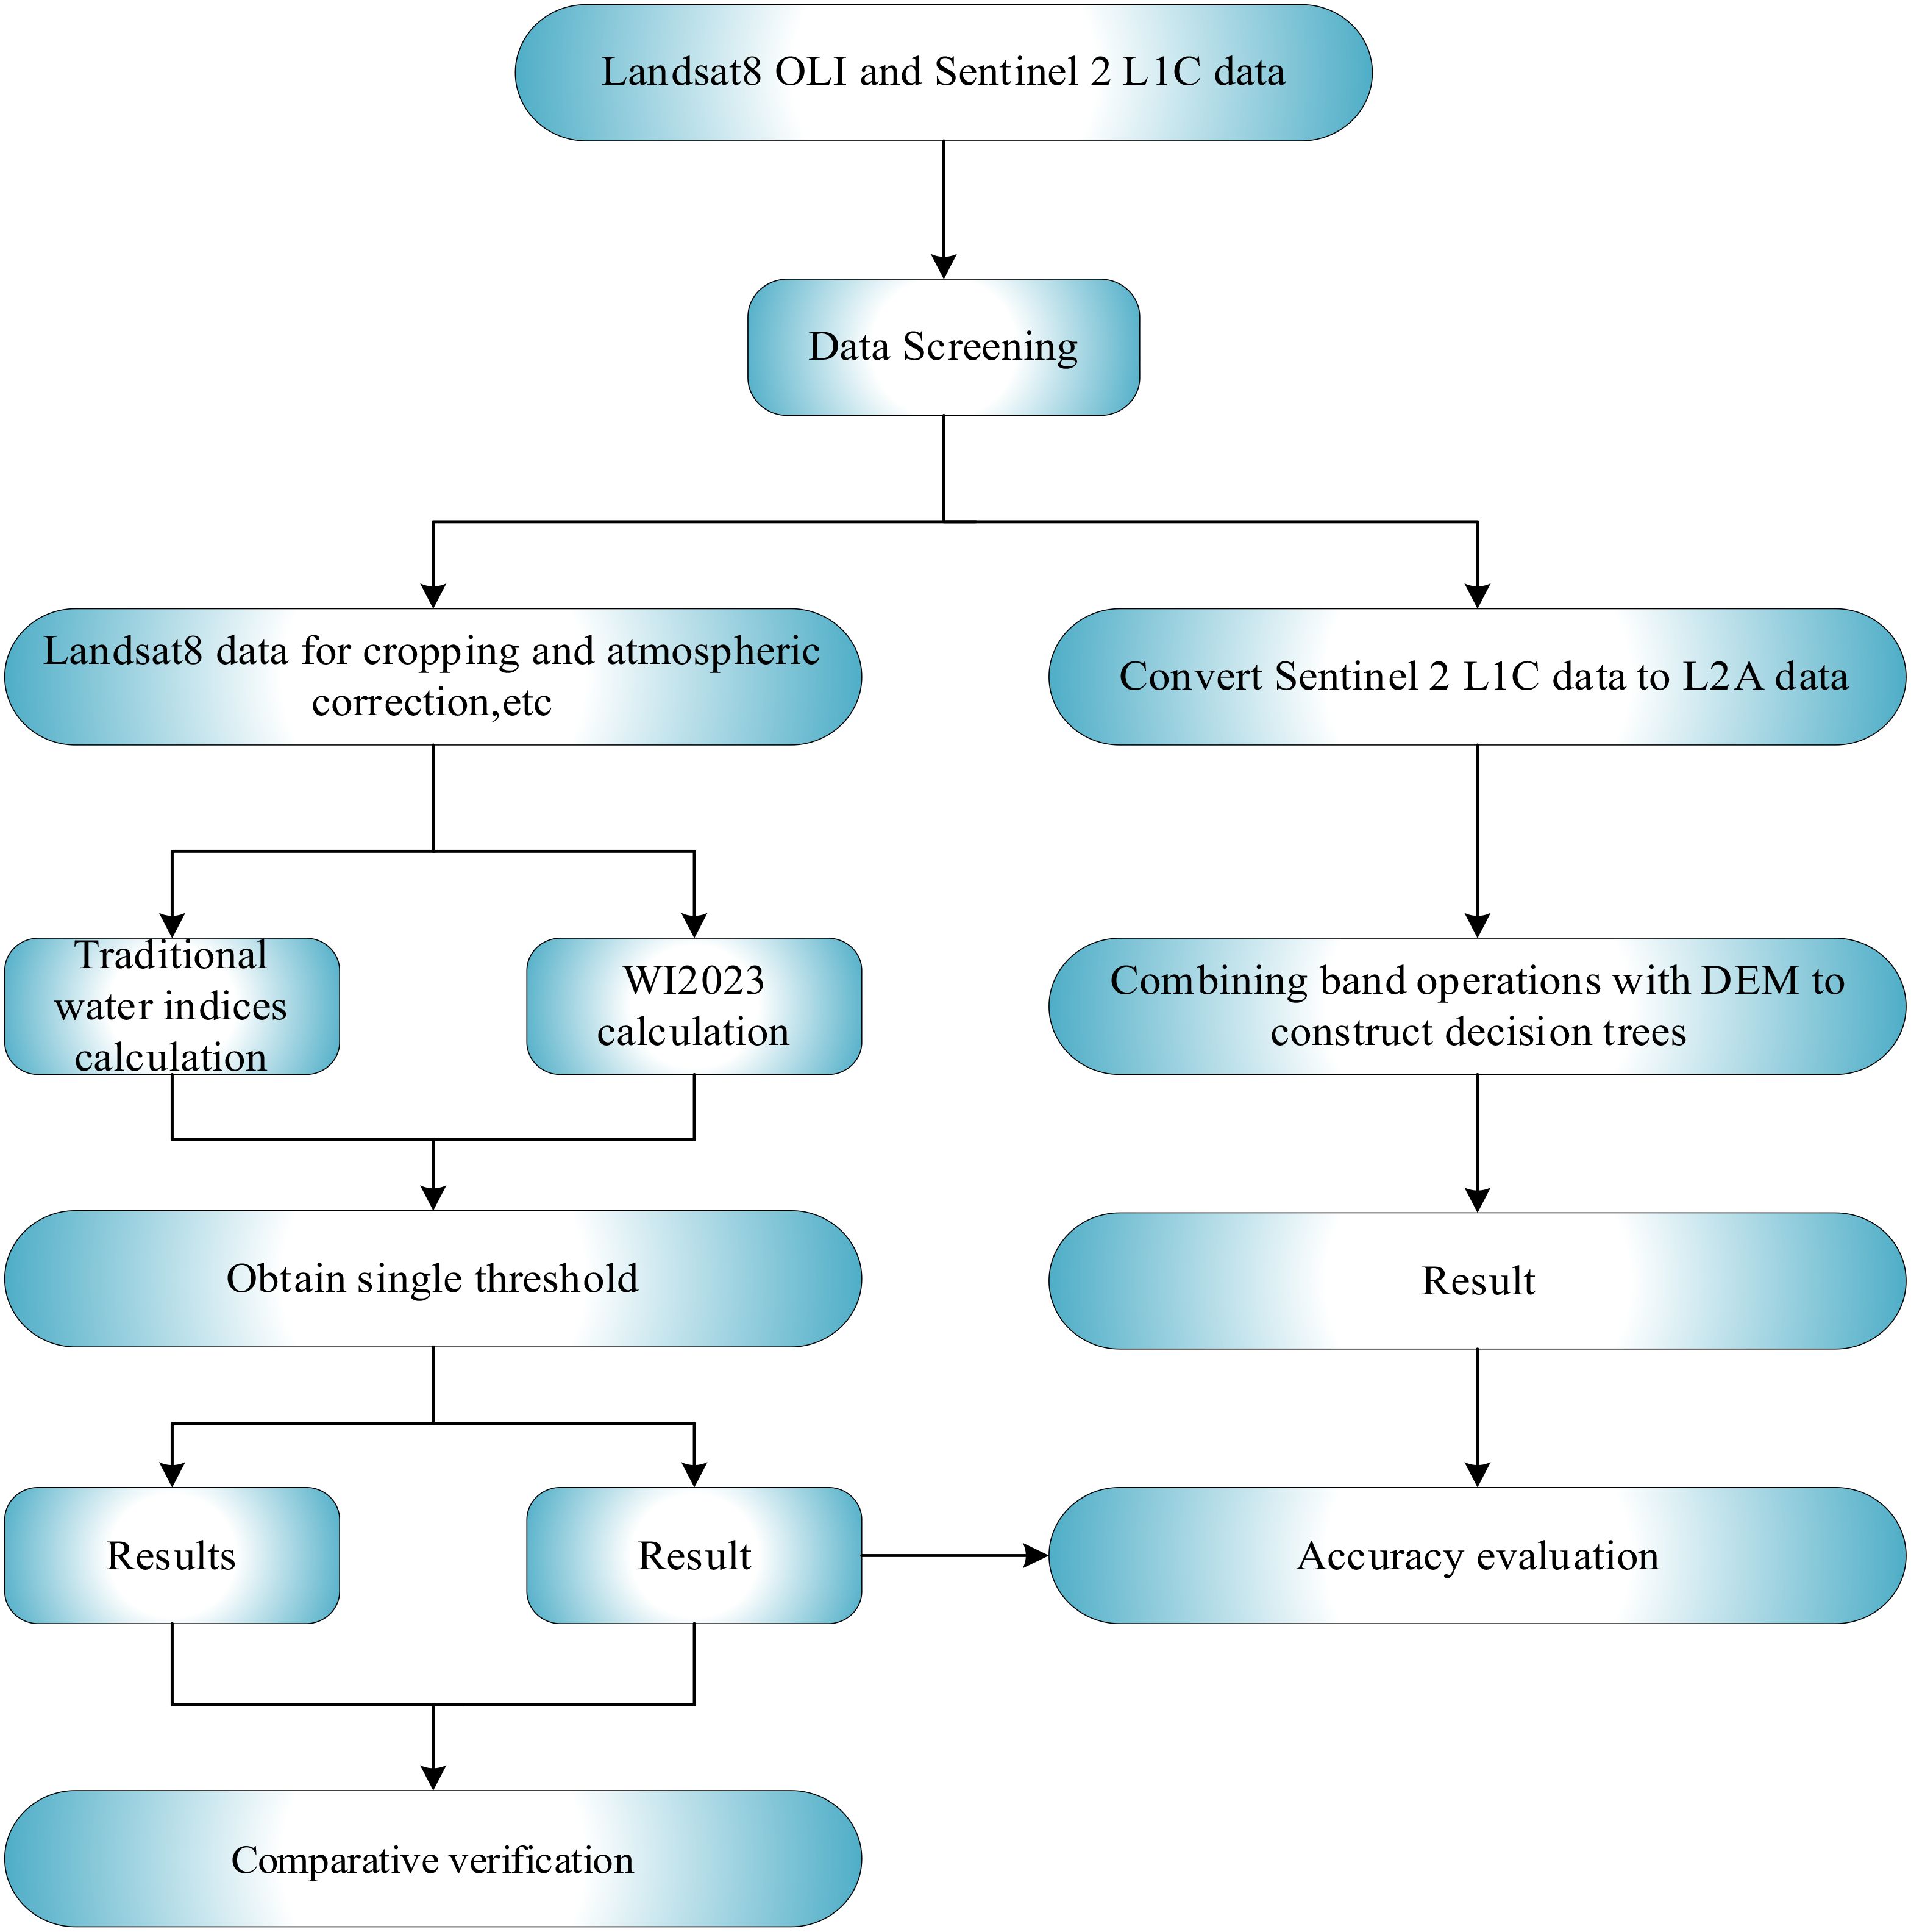
Figure 5. Flow chart of extracting meltwater from the ice shelf surface.
3.1 Screening
This study aims to address the issue of mistakenly extracting cloud and terrain shadows as water bodies using water index methods based on traditional optical remote sensing images in polar environments. Therefore, the screening data in this paper should meet the following conditions.
1. In terms of time, the image has a wide distribution of melting water in summer.
2. In space, the image has mountain shadows at different altitudes and terrains.
3. There are clouds that shade the ground, creating shadows.
3.2 Pre-processing
The L1C data from Sentinel-2 without radiometric calibration and atmospheric correction are converted into L2A data with atmospheric and geometric correction, and then selected high-resolution band images are fused and converted into Geo TIFF format. Landsat8 data also requires radiometric calibration and atmospheric correction processing to eliminate errors and atmospheric effects caused by the sensor itself. Radiometric calibration is the conversion of the brightness grayscale value of an image to absolute radiance, with the aim of eliminating errors in the sensor itself and determining the exact radiometric value at the sensor inlet. Atmospheric correction converts radiant brightness or surface reflectance into actual surface reflectance to eliminate errors caused by atmospheric scattering, absorption, and reflection. Both can be done on different modules in the Toolbox on the ENVI software platform. To facilitate subsequent calculations and analyses, the atmospherically corrected data are normalised by dividing by 10000, which reduces the range of the data to a more appropriate range. Considering the difference in width between the Sentinel-2 and Landsat 8 imaging, it is necessary to crop the two types of images so that they have the same spatial size in order to ensure accuracy in comparison and analysis.
3.3 Calculation of water index
The image after data preprocessing is taken as input, and it is brought into equation (5) for wave operation, and the output is obtained as the enhanced image of the water body.
3.4 Determination of threshold value
In this study, the Otsu adaptive thresholding method is chosen to determine the threshold value of WI2023 (Otsu, 2007). The Otsu method is a commonly used image binarization technique, and the implementation process is as follows.
1. Calculate the histogram of the image and count the number of pixels for each grayscale level.
2. Iterate through all possible thresholds (from 0 to the maximum grayscale level) to separate the image into background and foreground regions.
3. For each threshold value, calculate the proportions of pixels below and equal to or above the threshold (w1(t) and w2(t)), as well as the average grayscale values below and equal to or above the threshold (μ1(t) and μ2(t)).
4. Calculate the inter-class variance: σ2(t) = w1(t) * w2(t) * (μ1(t) - μ2(t))2.
5. Select the threshold value that maximizes the inter-class variance σ2(t) among all possible thresholds in the image and use it as the final threshold (1.1).
3.5 Results and validation
After determining the optimal threshold value, threshold segmentation is performed on the image after band operations to obtain the spatial distribution of surface meltwater of ice shelf. Afterwards, to validate WI2023 we compared its extraction results with those of several other common water indices, and finally verified its extraction accuracy using Sentinel-2 satellite high-resolution images on the same day.
4 Results and validation
This study selected Landsat8 images (Partial image of Path/Row 127/111) at the Amery Ice Shelf on January 2, 2017, for water body information extraction, and the results are shown in Figure 6. From Figure 6, it can be seen that a large number of melt water existed on the surface of the ice shelf on January 2, 2017 (Antarctic summer), and most of the meltwater was concentrated in the low-latitude region, which may be caused by the fact that the Amery Ice Shelf has a large north-south span and is located in the low-latitude region where the temperatures are higher. These meltwater pools are narrow and river-like in width and small in area, but large in number. Large areas of meltwater are mainly distributed in low-elevation regions, and the reason for this may be that the terrain in low-altitude regions is generally relatively flat, direct sunlight radiation, without mountain cover and meltwater from high-altitude regions will flow to low-altitude regions. In addition, some meltwater pools are located in low-lying regions on the ice shelf and at the intersection of water flows.
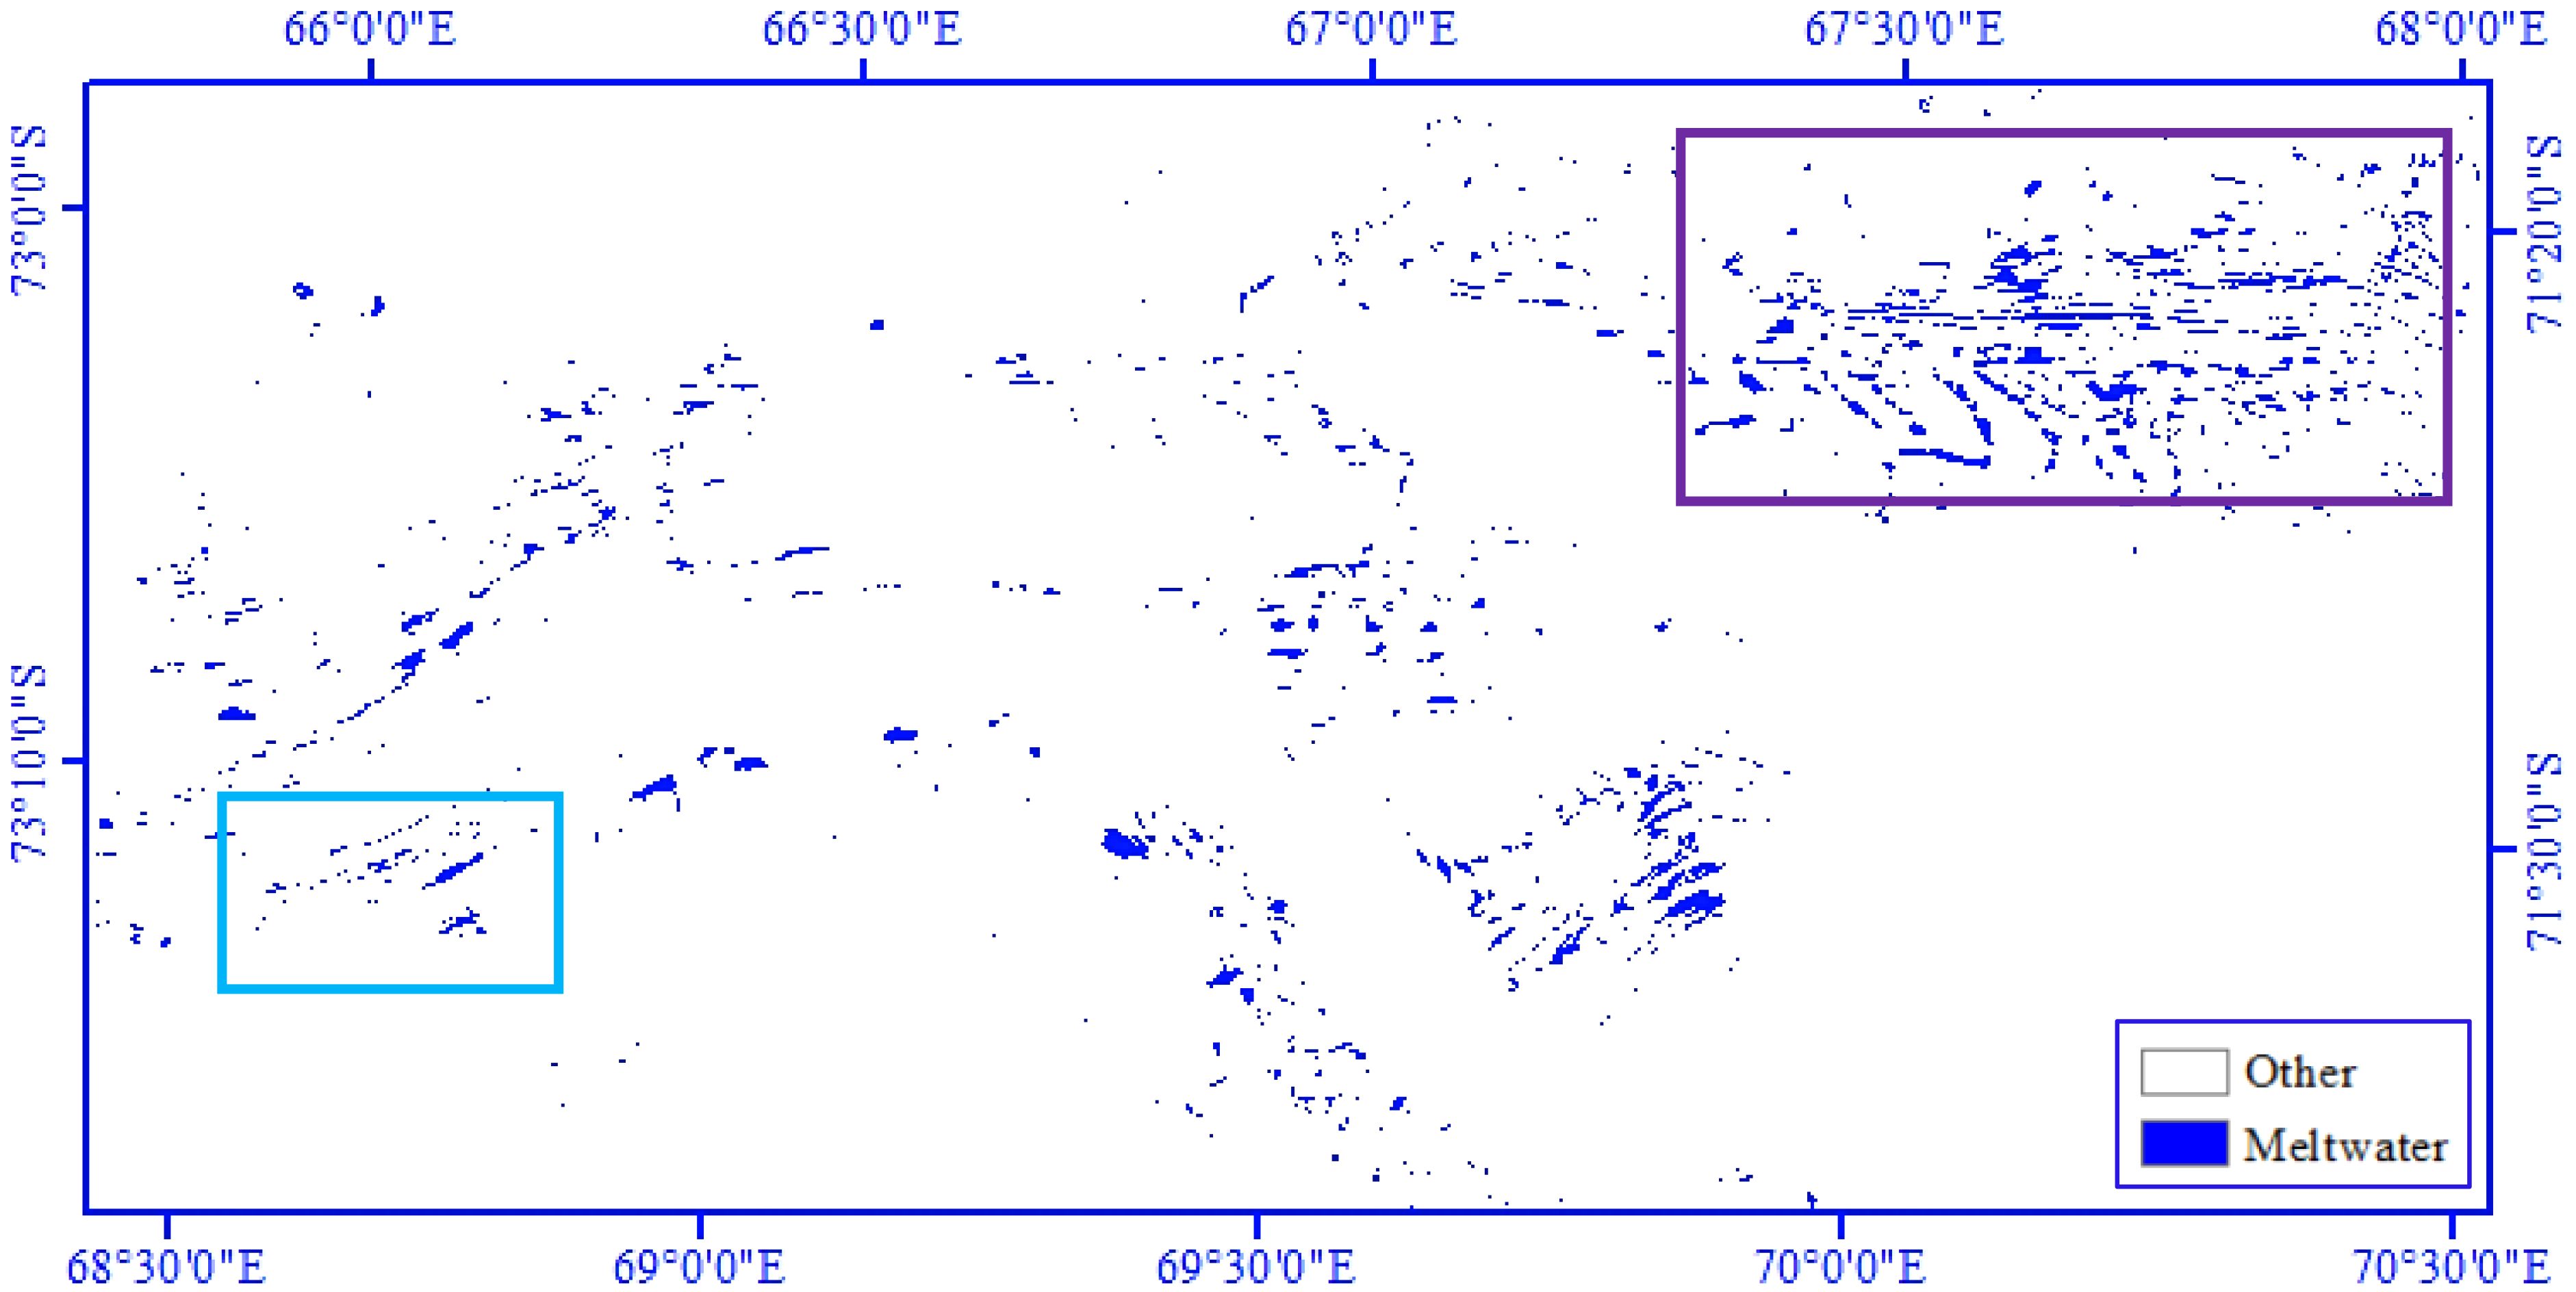
Figure 6. The Landsat 8 image meltwater extraction results on January 2, 2017 were based on WI2023.
To verify the feasibility of WI2023, we extracted meltwater using NDWI, NDWIice and MNDWice index methods using images without shadow interference, as shown in Figure 7. The results in Figure 7 indicate that under no shadow interference, the spatial distribution of meltwater extraction results for WI2023 is consistent with that of NDWI, NDWIice, and MNDWIice, and the water extraction areas are similar, with areas of 208.2114km2, 207.3573 km2, 208.0494 km2, and 208.0494 km2, respectively. The subtle differences in extraction results are mainly due to the different sensitivity of different water indices to wet snow, resulting in some wet snow being mistakenly extracted as meltwater.
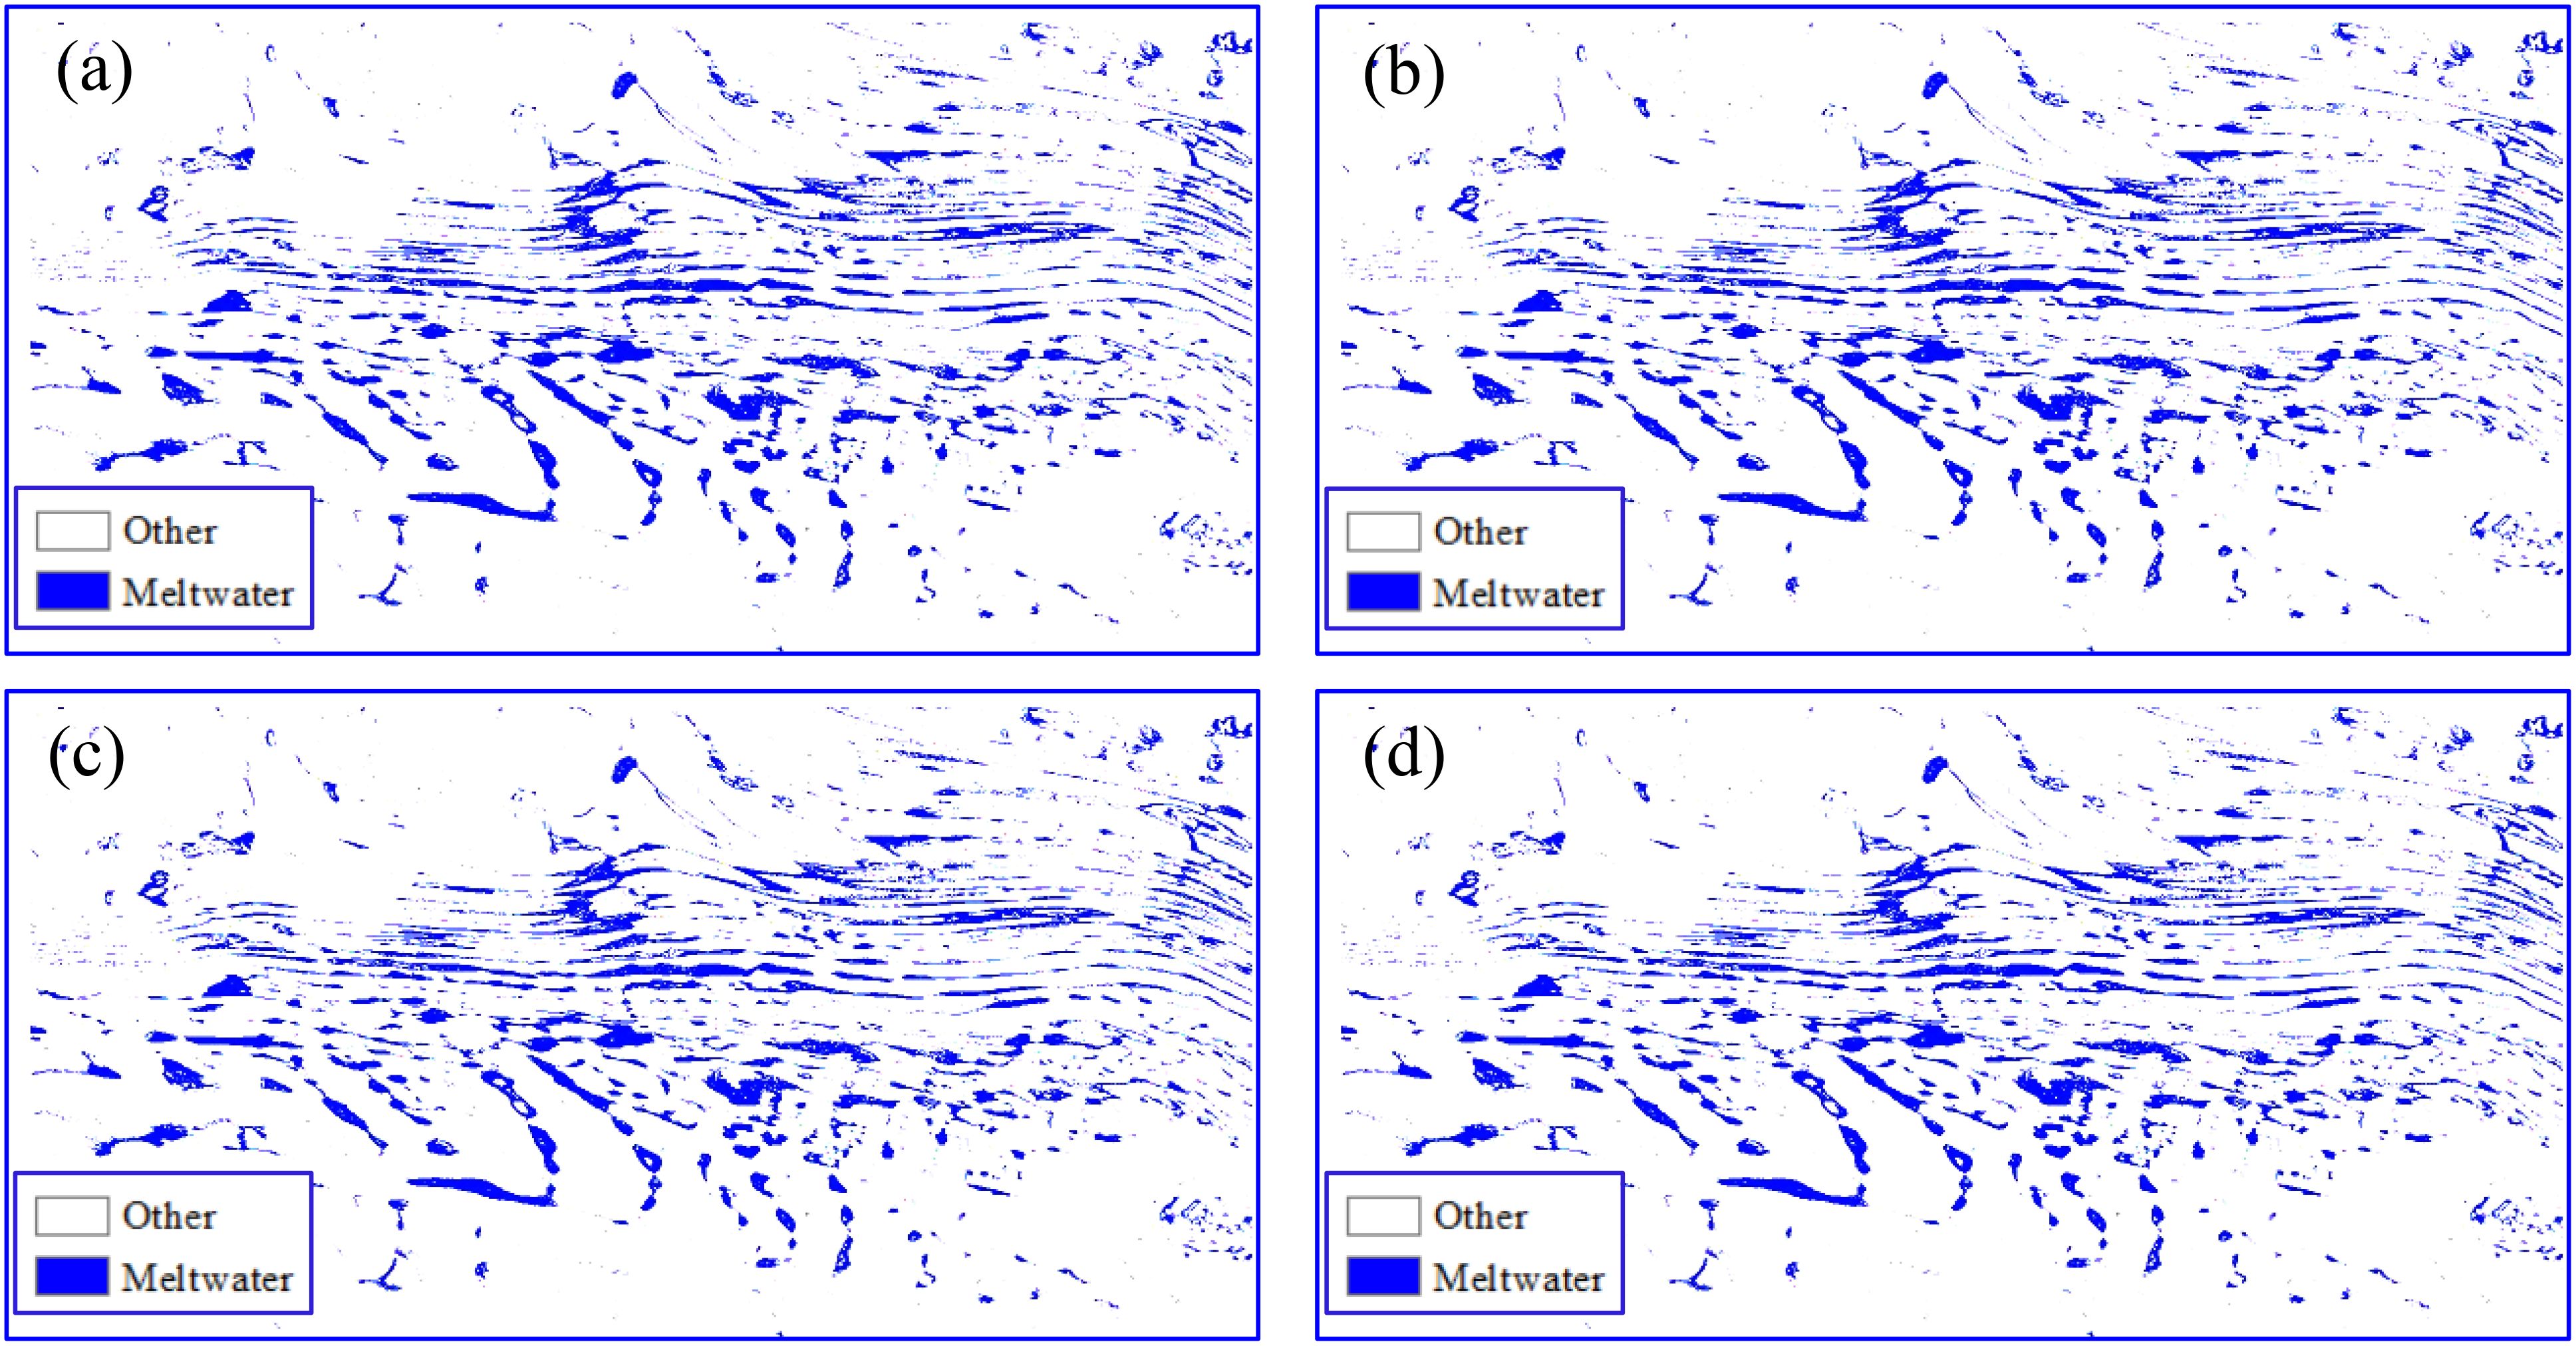
Figure 7. Meltwater extraction results based on NDWI (a), NDWIice (b), MNDWIice (c), and WI2023 (d) (Selected region in purple box in Figure 6).
To verify the effectiveness of WI2023 for shadow suppression, this study selected Landsat8 images with shadows. The shadows were detected by the algorithm proposed by (Kang et al., 2017)) on 2 January 2017 and performed NDWI, NDWIice, MNDWIice and WI2023 exponential operations, respectively. The results are shown in Figures 8B–E, respectively. From Figures 8B–D, the shadows in the red frame are mistakenly extracted as meltwater after NDWI, NDWIice, and MNDWIice exponential operations, while the shadows in the area selected in the red frame in Figure 8E are all extracted as non-water bodies after WI2023 exponential operations, in agreement with the actual features. In the presence of shadow interference, WI2023 can effectively widen the difference between shadow and meltwater compared to traditional water indices NDWI, NDWIice, and MNDWIice and remove shadow interference to extract meltwater information in images more accurately.
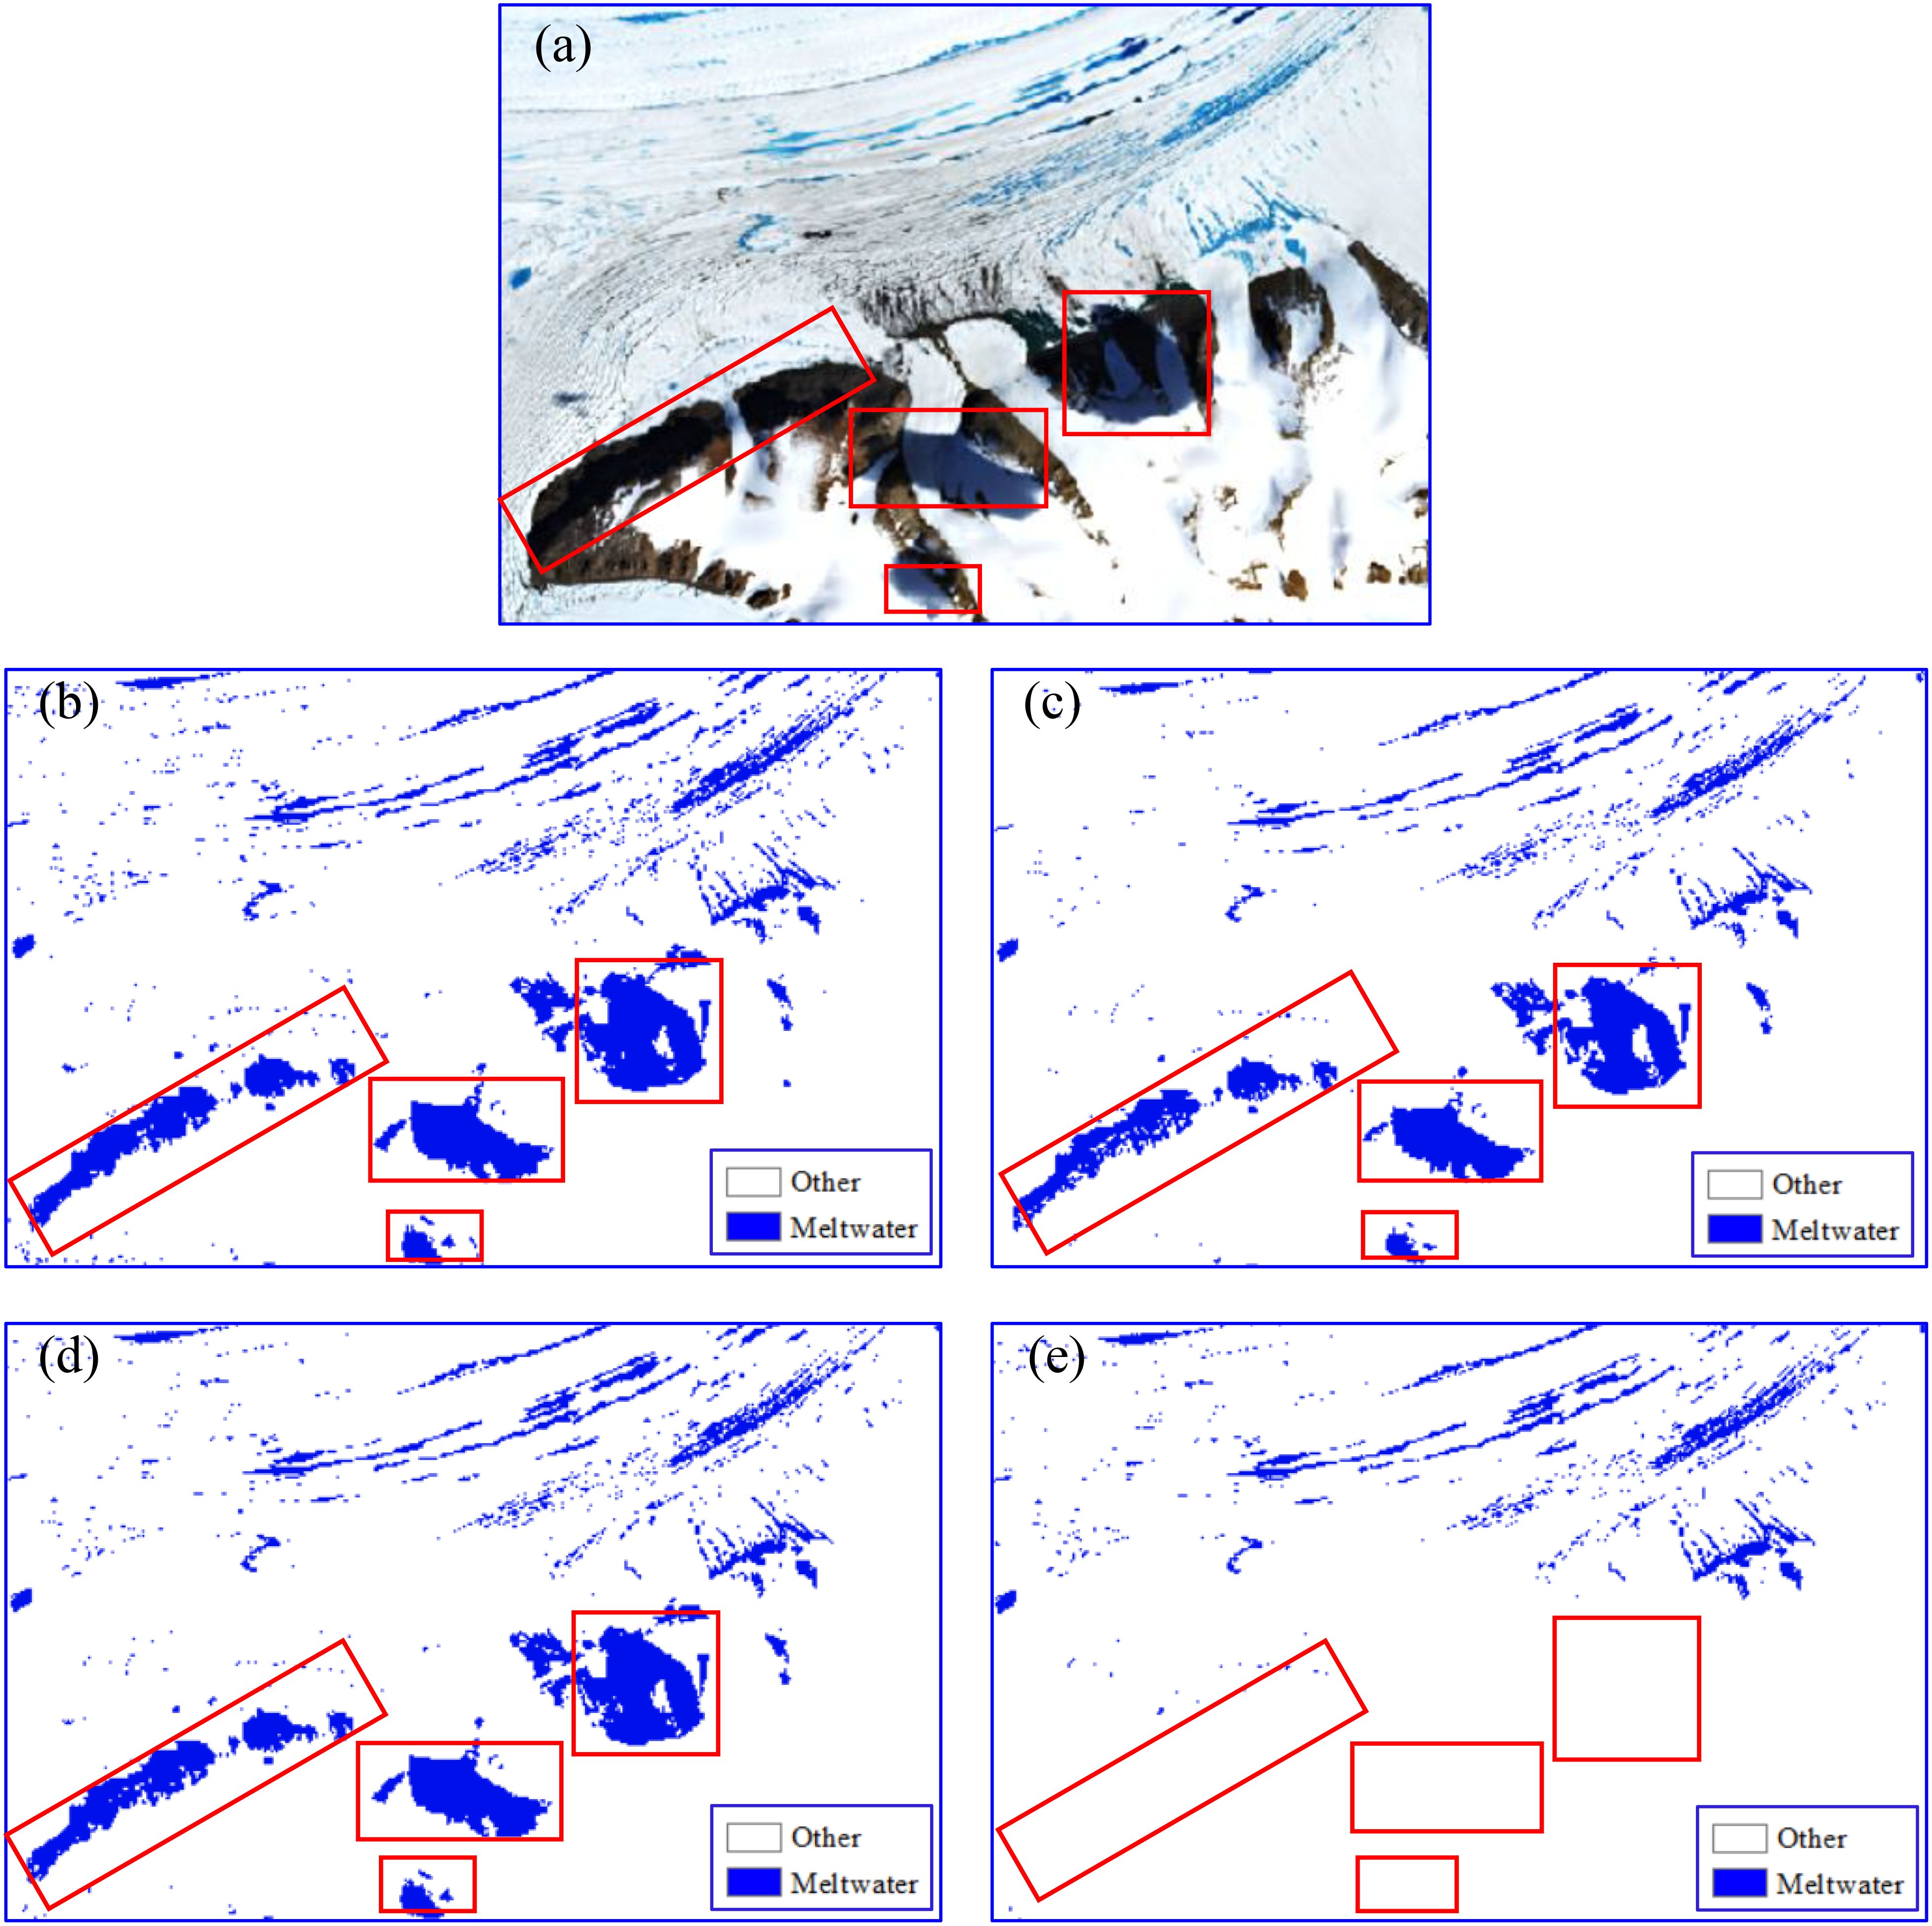
Figure 8. Landsat8 image 5, 4, and 3 bands combination on January 2, 2017 (a); Meltwater extraction results based on NDWI (b), NDWIice (c), MNDWIice (d), and WI2023 (e). The selected analysis area is shown in light blue box in Figure 6.
To further verify the extraction accuracy of WI2023, this study selected Landsat8 data and Sentinel-2 data from December 23, 2018, to extract meltwater and calculate their extraction area. Due to the higher resolution (10m) of Sentinel-2 data, the meltwater extraction results of Sentinel-2 data are used as a benchmark to evaluate the meltwater extraction results through evaluation indicators such as false extraction area and false extraction rate. This paper uses the method proposed by (Zhang et al., 2017) to extract meltwater information from Sentinel-2 data, while Landsat8 data uses NDWI, NDWIice, MNDWice, and WI2023 index methods to extract meltwater information, as shown in Figure 9. From Figure 9, it can be seen that the meltwater results extracted with WI2023 are basically consistent with those of Sentinel-2, while NDWI, NDWIice, and MNDWIice differ significantly from those of Sentinel-2, where the NDWIice and MNDWIice extraction results are essentially consistent, including mistakenly extracted shadows, and so their extraction results are oversized. NDWIice and Sentinel-2 have the largest difference in extraction results, which is caused by the fact that the shadows and part of the wet snow are mistakenly extracted as meltwater. The area of meltwater extracted from Sentinel-2 imagey is 49.7984 km2, while the areas of meltwater extracted from Landsat8 image are shown in Table 3. From Table 3, it can be seen that the extraction accuracy of WI2023 is 95.02%, and the meltwater extraction accuracies of NDWI, NDWIice, and MNDWice are 77.04%, 66.44%, 79.18%, respectively. We conducted a pixel-wise comparison of the extracted results in a local area (the region selected by the red box in Figure 9), and the results are shown in Figure 10. From this, the WI2023 meltwater extraction method proposed in this study can effectively reduce the interference of shadows and is of great significance for large-scale extraction and monitoring of dynamic changes in polar surface meltwater. In addition, it should be noted that the large extraction area errors of NDWI, NDWIice, and MNDWice are caused by a large number of shadows in the selected data in this study rather than the inherent problems of NDWI, NDWIice, and MNDWice. According to Yu et al. (Yu et al., 2012), the blue ice region has high reflectivity in the visible light band and can be confused with the meltwater region. However, our method is able to distinguish between blue ice and meltwater to some extent by combining the reflectance differences in the green and red bands. We acknowledge that misclassification of blue ice regions may exist in some regions. However, this phenomenon exists in all test methods, and the WI2023 method still outperforms traditional methods in terms of overall accuracy.
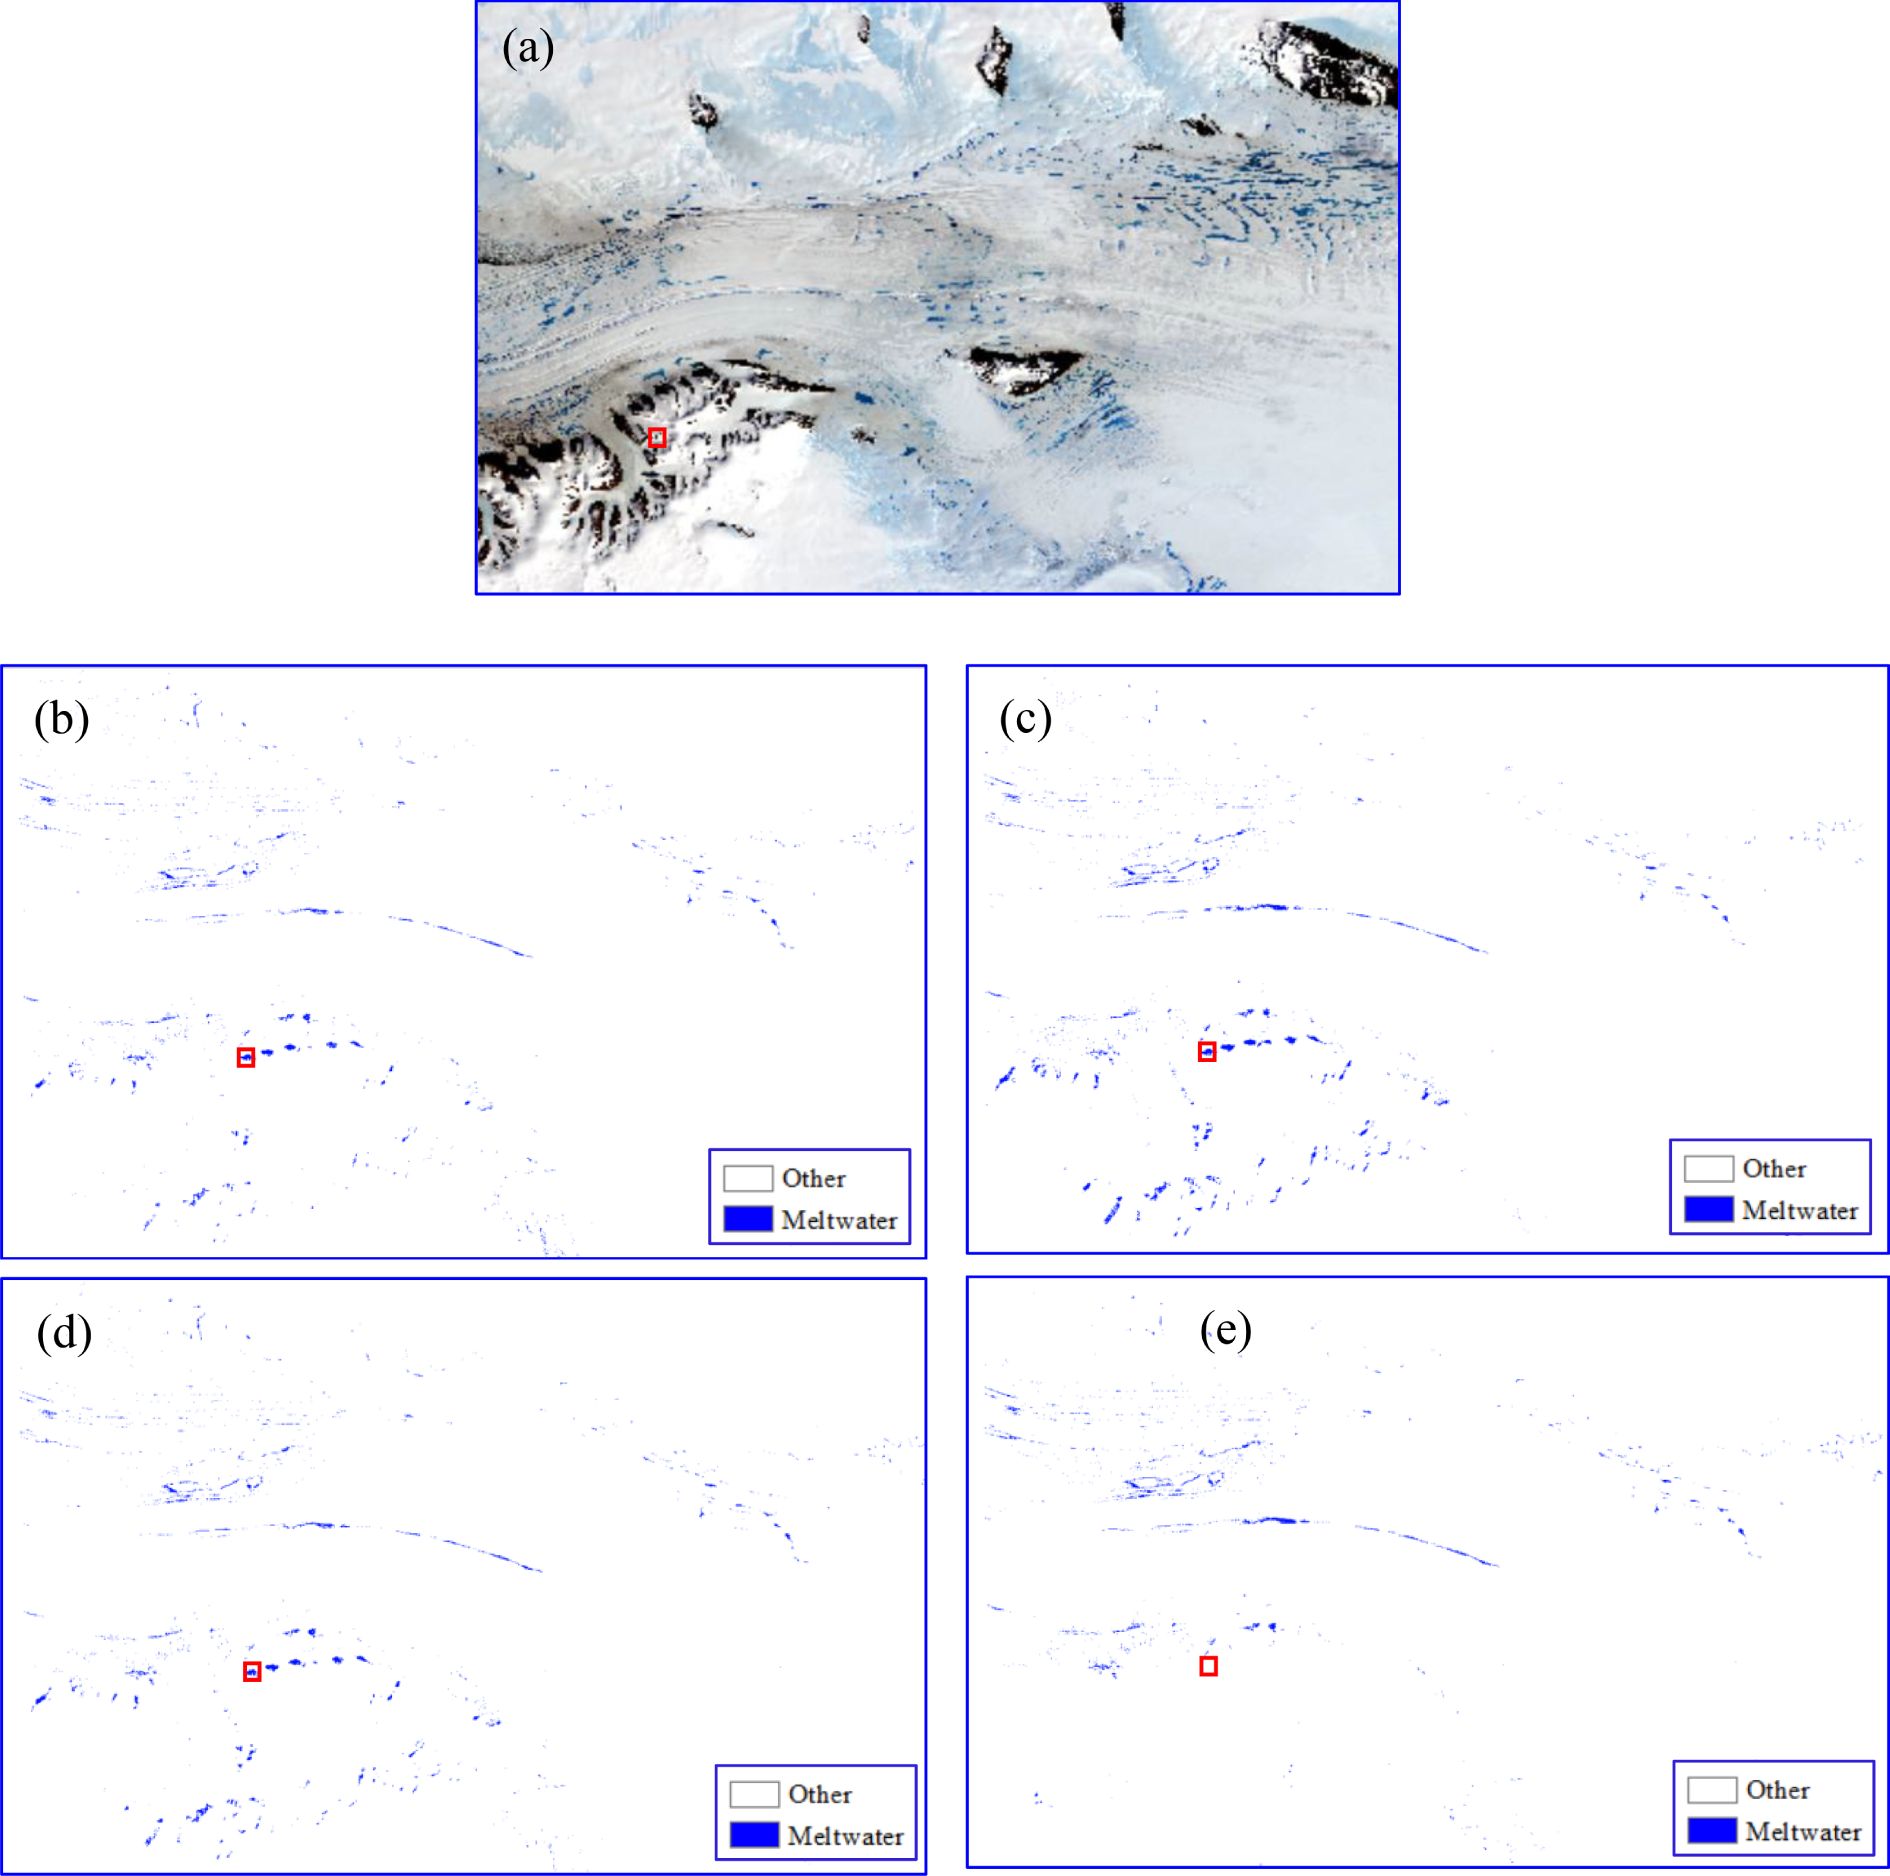
Figure 9. Extraction results of meltwater from Sentinel-2 imagery on December 23, 2018 (a), NDWI (b), NDWIice (c), MNDWIice (d), and WI2023 (e).
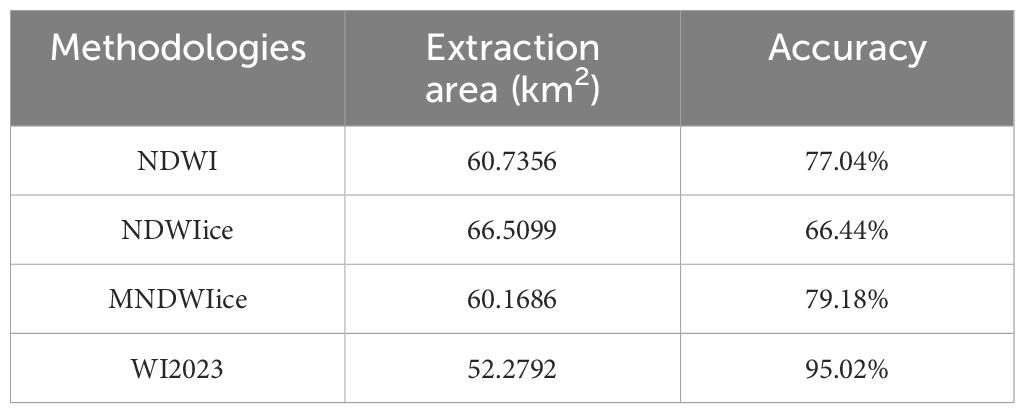
Table 3. Accuracy evaluation.

Figure 10. Landsat 8 image 5, 4, and 3 band combinations on January 2, 2017 (a), Meltwater extraction results based on 10m resolution (b), NDWI (c), NDWIice (d), MNDWIice (e), and WI2023 (f).
Afterwards, this study selected 10 Landsat 8 and Sentinel 2 images from the same day between 2018 and 2024, and calculated their extraction areas. The data information is shown in Table 4, and the area extraction results are shown in Figure 11. From Figure 11, it can be seen that the area curve trends of several water indices show good consistency. Among them, the area curves of NDWI and NDWIice are significantly higher than those of other area curves because NDWI and NDWIice not only mistakenly extract shadows as water bodies but also cannot effectively distinguish melting ice and snow. MNDWIce is an improvement compared to NDWIice, which can effectively distinguish between melting ice and snow, so its area curve is significantly lower than those of NDWI and NDWIice. However, MNDWIce also extracts shadows as water, so its area curve is higher than the surface area curve of WI2023 and Sentinel-2. WI2023 not only effectively distinguishes between shadows and water bodies but also has good discrimination between melting ice and snow and meltwater pools, so its area curve is closest to the area curve of Sentinel-2. Additionally, it should be noted that the same area in the Landsat8 and Sentinel-2 images on September 9, 2021, has no shadows, so their areas are almost identical.
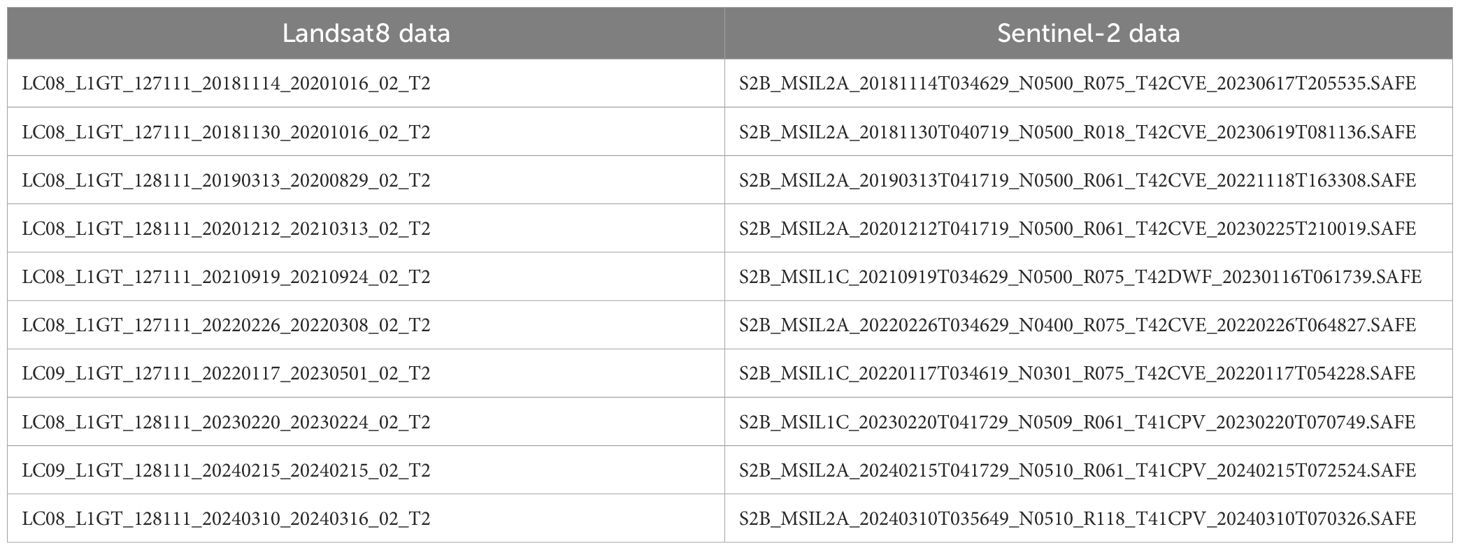
Table 4. Data information.
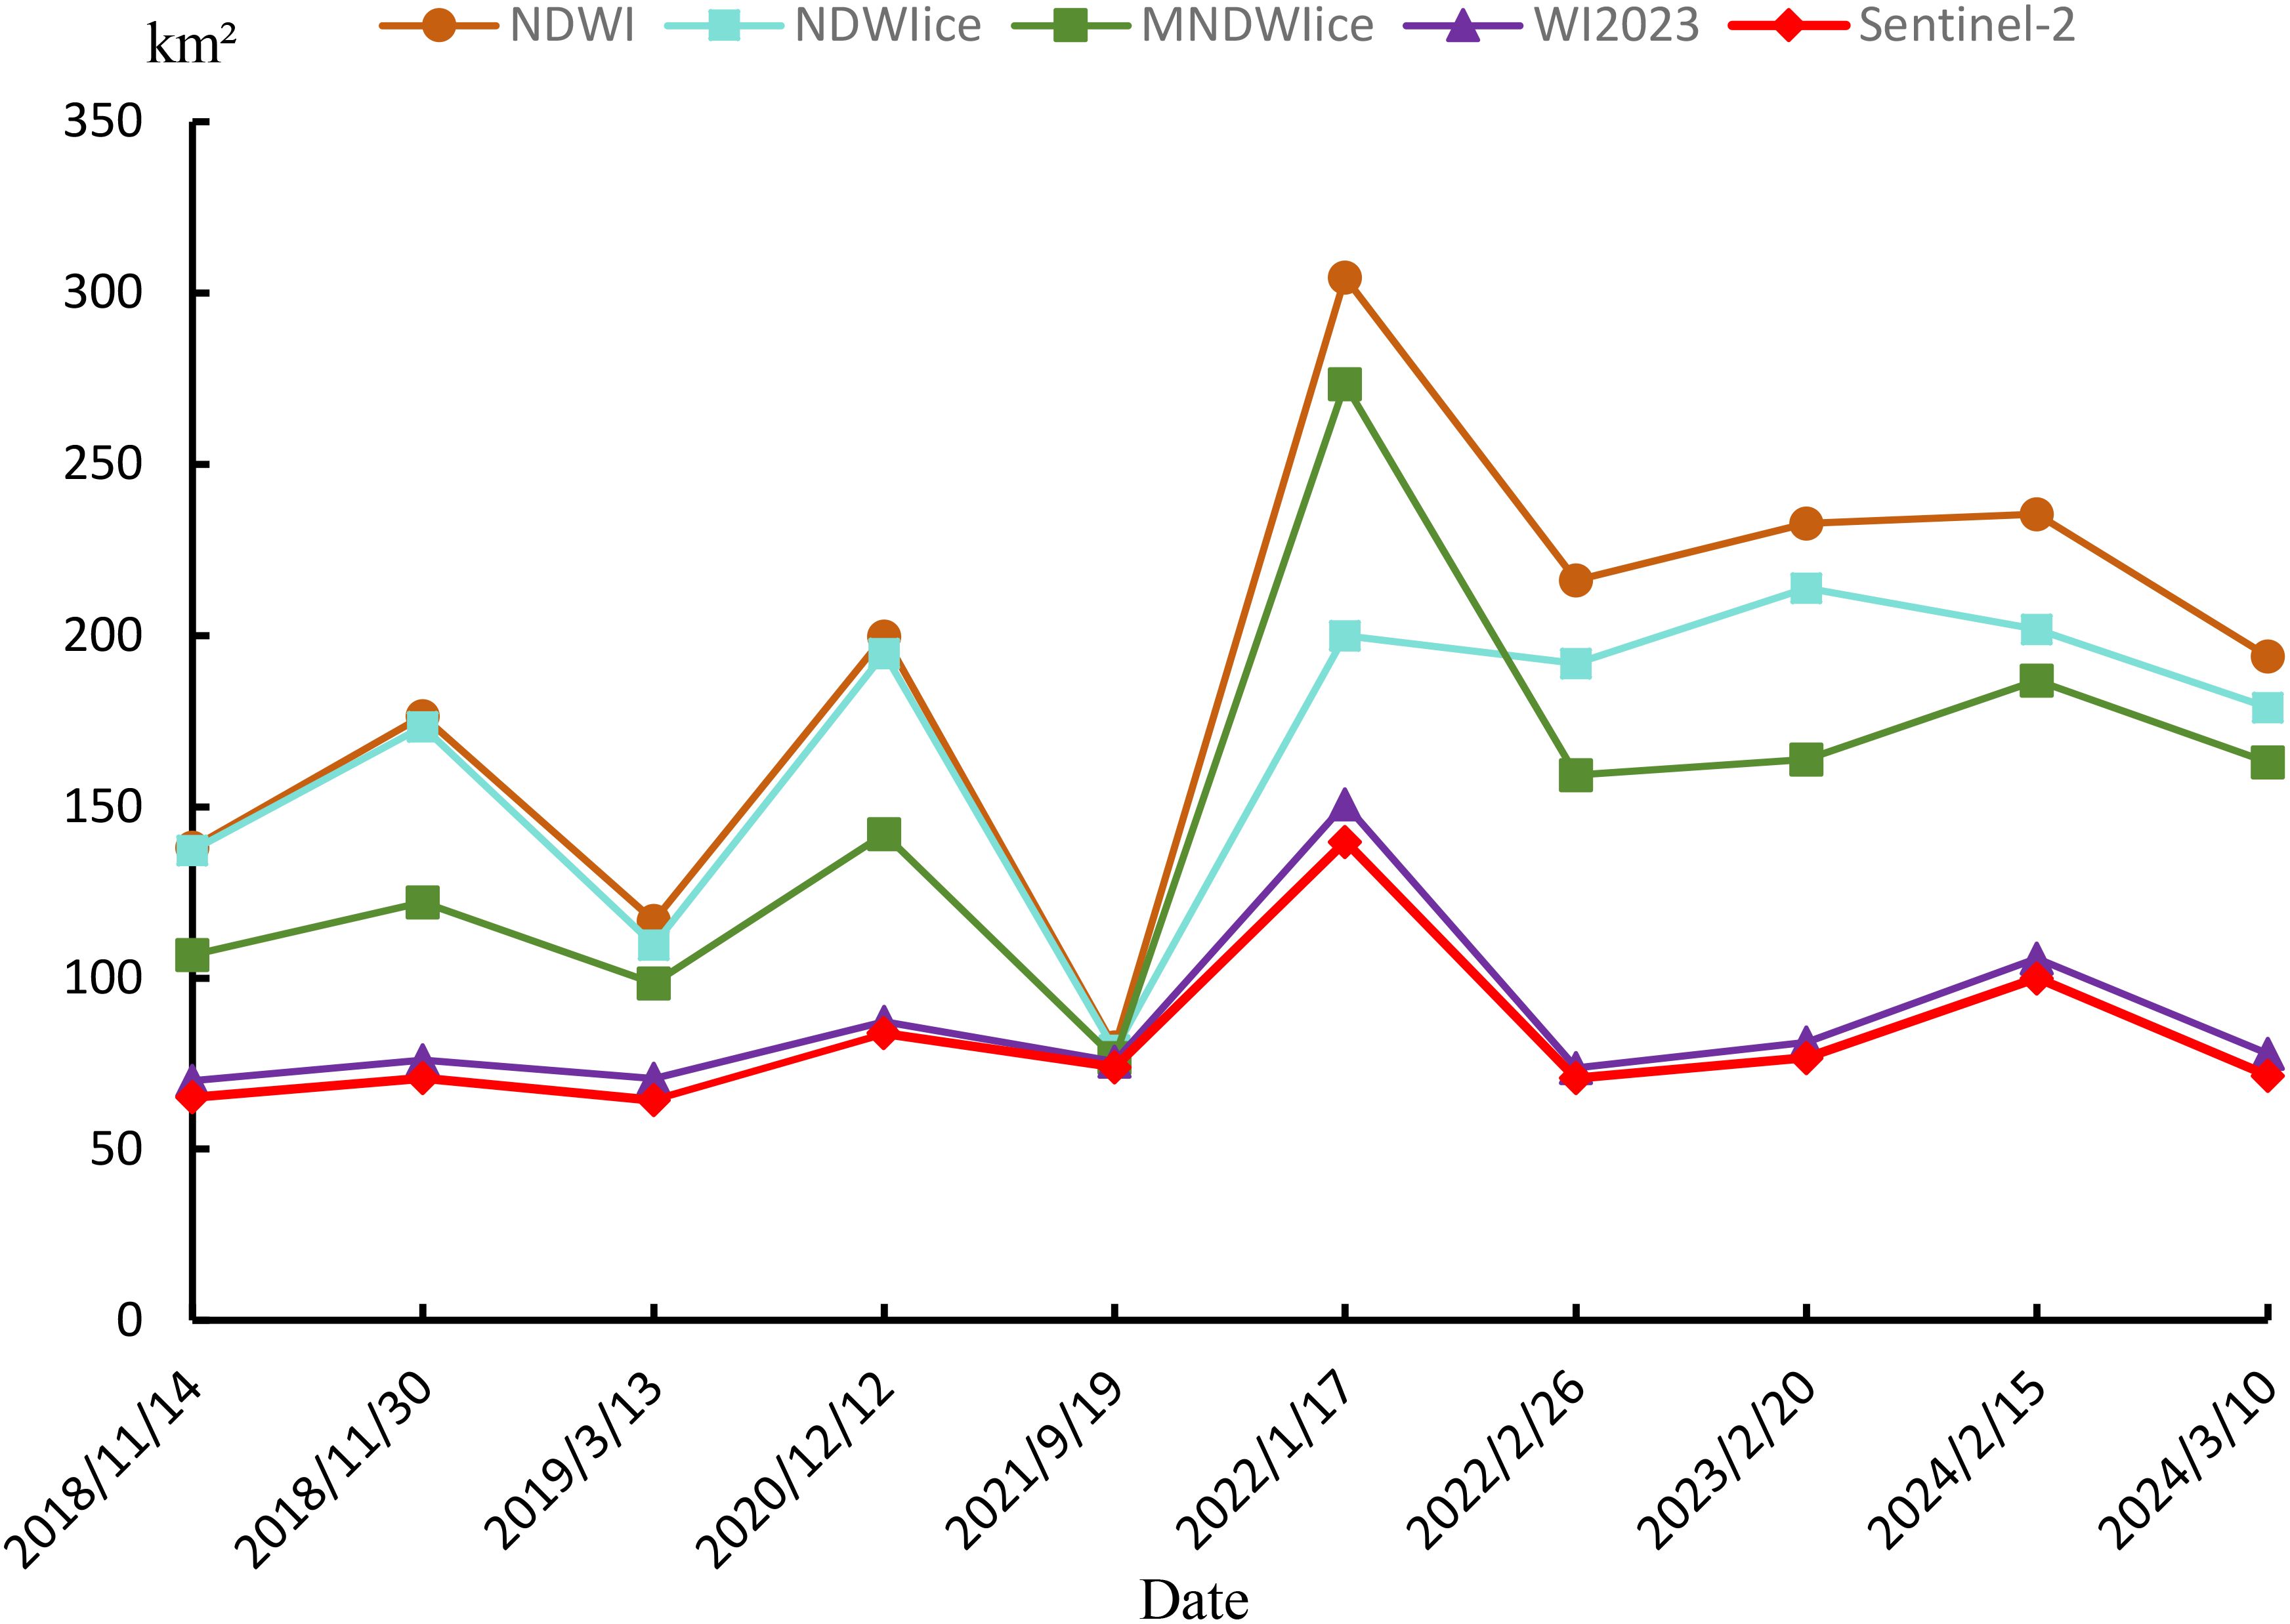
Figure 11. Water index area curve chart.
5 Discussion
The WI2023 meltwater extraction method proposed in this study significantly enhances the ability to distinguish between shadows and meltwater based on the rate of decrease in object reflectance curves. Traditional water indices, such as NDWI and MNDWI, typically rely on reflectance differences in specific bands when extracting water bodies, which may lead to misjudgments in complex terrains or environments. For example, the spectral characteristics of shaded areas and meltwater are similar in certain bands, leading traditional indices to easily mistake shadows for water bodies, especially in areas with low light or high reflectance. WI2023 can effectively avoid this misidentification problem by analyzing the rate of decrease in reflectivity rather than just static reflectivity values. Compared with traditional water indices, WI2023 has stronger universality. The use of traditional water indices usually requires selecting appropriate indices based on different land cover types to ensure the best extraction results. Due to the significant variations in reflectance of different types of land cover in spectral bands, a single water index often struggles to adapt to complex surface conditions and may result in decreased extraction accuracy due to factors such as lighting, seasonal variations, and soil moisture, such as melting ice and snow in polar environments. WI2023 breaks through this limitation by examining the rate of reflectance change, avoiding the limitations of spectral differences and eliminating the need to select different indices based on different land cover types. Therefore, WI2023 exhibits stronger adaptability under various environmental conditions and can stably extract water bodies in more complex geographical areas. The construction of WI2023 mainly relies on the red and green bands, which have high resolution in optical remote sensing satellites and can provide clearer ground reflectance data.
However, this study still has some shortcomings: (1) The Landsat 8 and Sentinel-2 optical remote sensing data used in this study are susceptible to external environmental influences, which may introduce some interference, thereby affecting the water index and causing bias in the results. Future studies will consider combining multi-source data to improve the accuracy of meltwater extraction. For example, although SAR data has low resolution, it is less affected by clouds and fog. Therefore, SAR data can be combined with optical remote sensing data to improve the accuracy of meltwater extraction. (2) Due to the lack of publicly available higher-resolution images and on-site observation data, this study only used Sentinel-2 satellite data with a resolution of 10m for accuracy verification, and the credibility of the verification results needs to be improved. In future, higher-resolution images and on-site observation data will be used to more accurately evaluate the meltwater extraction accuracy based on WI2023. (3) The launch time and period of Sentinel-2 satellite and Landsat8 satellite are different, and there are fewer images on the same day. This study only used Sentinel-2 from a single scene to verify the extraction results of Landsat8, which is not sufficient. In future, we will conduct spatiotemporal changes analysis on the Amery Ice Shelf to identify more Sentinel-2 and Landsat8 data from the same day in order to more fully verify the meltwater extraction accuracy based on WI2023.
6 Conclusions
This study is based on Landsat8 and Sentinel-2 high-resolution remote sensing images and aims to address the issue of meltwater indices mistakenly extracting shadows as meltwater. A novel meltwater index method, WI2023, is constructed, and the threshold (1.1) of WI2023 for extracting meltwater information from the Amery Ice Shelf is obtained using the OSTU method. Through experiments, the images without shadows, the meltwater extraction results of WI2023 are consistent with those of NDWI, NDWIice, and MNDWice. In the images with shadows and the meltwater extraction results of WI2023 have the smallest false extraction area (2.4808 km2) and the highest extraction accuracy (95.02%) compared to the water extraction results of NDWI, NDWIice, and MNDWice. The experimental results show that the WI2023 constructed based on the decreased rate of surface reflectance curve can minimize the impact of shadows and achieve higher accuracy in water extraction compared to the water index constructed through normalized ratio operation.
Data availability statement
The original contributions presented in the study are included in the article/supplementary material. Further inquiries can be directed to the corresponding author.
Author contributions
ZZ: Conceptualization, Writing – original draft, Writing – review & editing. XW: Conceptualization, Funding acquisition, Resources, Supervision, Validation, Writing – original draft, Writing – review & editing. ZS: Conceptualization, Methodology, Validation, Writing – original draft, Writing – review & editing. YZ: Data curation, Validation, Writing – review & editing, Writing – original draft.
Funding
The author(s) declare that financial support was received for the research and/or publication of this article. This research was supported by the Key Laboratory of GrainInformation Processing and Control (Henan University of Technology), Ministry of Education under Grant KFJJ-2020-113, and the Key Scientific Research Project in Colleges and Universities of Henan Province of China under Grant 25A420001.
Conflict of interest
The authors declare that the research was conducted in the absence of any commercial or financial relationships that could be construed as a potential conflict of interest.
Publisher’s note
All claims expressed in this article are solely those of the authors and do not necessarily represent those of their affiliated organizations, or those of the publisher, the editors and the reviewers. Any product that may be evaluated in this article, or claim that may be made by its manufacturer, is not guaranteed or endorsed by the publisher.
References
Abram N. J., Mulvaney R., Wolff E. W., Triest J., Kipfstuhl S., Trusel L. D., et al. (2020). Acceleration of snow melt in an Antarctic Peninsula ice core during the twentieth century. Nat. Geoscience. 6, 404–411. doi: 10.1038/NGEO1787
Bell R. E., Banwell A. F., Trusel L. D., and Kingslake J. (2018). Antarctic surface hydrology and impacts on ice-sheet mass balance. Nat. Climate Change. 8, 1044–1052. doi: 10.1038/s41558-018-0326-3
Bell R. E., Chu W., Kingslake J., Das I., Tesesco M., Tinto K. J., et al. (2017). Antarctic ice shelf potentially stabilized by export of meltwater in surface river. Nature 544, 344–348. doi: 10.1038/nature22048
Bett D. (2021). Modelling the Freshwater Balance and Influence of Icebergs in the Amundsen Sea, Antarctica (England: University of Southampton (United Kingdom).
Ding M. (2013). An up to date review on the mass balance over Antarctic. Progerss Geophysics. 28, 24–35. doi: 10.6038/pg20130104
Dirscherl M., Dietz A. J., Kneisel C., and Kuenzer C. (2003). Automated mapping of antarctic supraglacial lakes using a machine learning approach. Remote Sens. 12, 1203. doi: 10.3390/rs12071203
Halberstadt A. R. W., Gleason C. J., Moussavi M. S., Pope A., Trusel L. D., and DeConto R. M. (2020). Antarctic supraglacial lake identification using landsat-8 image classification. Remote Sens. 12, 1327. doi: 10.3390/rs12081327
He W. (2016). Distribution Characteristics of Amery Ice Shelf Water, Antarctic (Shanghai, China: Shanghai Ocean University).
He W., Cheng L., and Gao G. (2016). Spatial distribution and seasonal variation of ice shelf water between 2001 and 2002 at amery ice shelf, Antarctica. J. Shanghai Ocean University. 25, 753–766. doi: 10.12024/jsou.20151201622
Kang J., Cheng X., and Liu Y. (2017). Shadow detection in Antarctica using landsat 8 satellite images. J. Beijing Normal Univ. (Natural Science). 53, 187–193. doi: 10.16360/j.cnki.jbnuns.2017.02.013
Kashiwase H., Ohshima K. I., Nihashi S., and Eicken H. (2020). Evidence for ice-ocean albedo feedback in the Arctic Ocean shifting to a seasonal ice zone. Sci. Reported. 7, 8170. doi: 10.1038/s41598-017-08467-z
Kingslake J., Ely J. C., Das I., and Bell R. E. (2017). Widespread movement of meltwater onto and across Antarctic ice shelves. Nature 544, 349–352. doi: 10.1038/nature22049
Lenaerts J. T. M., Lhermitte S., Drews R., Ligtenberg S. R. M., Berger S., Helm V., et al. (2017). Meltwater produced by wind-albedo interaction stored in an East Antarctic ice shelf. Nat. Clim. Change 7, 58–62. doi: 10.1038/NCLIMATE3180
Li W., Yu Y., Meng F., Duan J., and Zhang X.. (2023). A image fusion and U-Net approach to improving crop planting structure multi-category classification in irrigated area. J. Intelligent Fuzzy Syst. 45, 185–198. doi: 10.3233/JIFS-230041
Li Q., Zhou C., and Liu R. (2020). Monitoring the Changes of Supraglacial Lakes on the polar record Glacier,East Antarctica. Chin. J. Polar Res. 33, 27–36. doi: 10.13679/j.jdyj.20200013
McFeeters S. (1996). The use of the normalized difference water index (NDWI) in the delineation of open water features. Int. J. Remote Sens. 17, 1425–1432. doi: 10.1080/01431169608948714
Miles K. E., Willis I. C., Benedek C. L., Williamson A. G., and Tedesco M. (2017). Toward monitoring surface and subsurface lakes on the Greenland ice sheet using sentinel-1 SAR and landsat-8 OLI imagery. Front. Earth Sci. 5. doi: 10.3389/feart.2017.00058
Mouginot J., Rignot E., Bjørk A. A., van den Broeke M., Millan R., Morlighem M., et al. (2019). Forty-six years of Greenland Ice Sheet mass balance from 1972 to 2018. Proc. Natl. Acad. Sci. USA. 116, 9239–9244. doi: 10.1073/pnas.1904242116
Munneke P., Luckman A. J., Bevan S. L., Smeets C. J., Gilbert E., Van Den Broeke M. R., et al. (2018). Intense winter surface melt on an Antarctic ice shelf. Geophysical Res. Letters. 45, 7615–7623. doi: 10.1029/2018GL077899
Niu L. X., Tang S., Yang Y., Zhang L., Zheng, and Wang L. (2021). Detection of antarctic surface meltwater using sentinel-2 remote sensing images via U-net with attention blocks: A case study over the amery ice shelf. IEEE Trans. Geosci. Remote Sensing. 61, 1–13. doi: 10.1109/TGRS.2023.3275076
Otsu N. (2007). A threshold selection method from gray-level histograms. IEEE Trans. Syst. Man Cybernetics. 9, 62–66. doi: 10.1109/TSMC.1979.4310076
Passchier S., O’Brien P., and Damuth J. (2003). Pliocene-pleistocene glaciomarine sedimentation in eastern prydz bay and development of the prydz trough-mouth fan, ODP sites 1166 and 1167, east Antarctica. Marine Geology 199, 279–305. doi: 10.1016/s0025-3227(03)00160-9
Qu Y., Cheng X., and Liu Y. (2020). Extraction of seasonal surface ablation zones in the dalk glacier (Antarctica) based on landsat-8 images. Chin. J. Polar Res. 32, 164–176. doi: 10.13679/j.jdy.20190029
Rignot E., Mouginot J., Scheuchl B., van den Broeke M., Van Wessem M. J., and Morlighem M. (2019). Four decades of Antarctic Ice Sheet mass balance from 1979–2017. Proc. Natl. Acad. Sci. USA. 116, 1095–1103. doi: 10.1073/pnas.1812883116
Roberts D., Craven M., Cai M., Allison I., and Nash G.. (2007). Protists in the marine ice of the Amery Ice Shelf, East Antarctica. Polar Biol. 30, 143–153. doi: 10.1007/s00300-006-0169-7
Stokes C. R., Sanderson J. E., Miles B. W., Jamieson S. S., and Leeson A. A. (2019). Widespread development of supraglacial lakes around the margin of the East Antarctic Ice Sheet. Sci. Rep. 9, 13823. doi: 10.1038/s41598-019-50343-5
Tuckett P. A., Ely J. C., Sole A. J., Lea J. M., Livingstone S. J., Jones J. M., et al. (2021). Automated mapping of the seasonal evolution of surface meltwater and its links to climate on the Amery Ice Shelf, Antarctica, The Cryosphere 15, 5785–5804. doi: 10.5194/tc-15-5785-2021
Van Den Broeke M. R., Reijmer C., and Van De Wal R. (2004). Surface radiation balance in Antarctica as measured with automatic weather stations. J. Geophysical Research: Atmospheres 109, D09103. doi: 10.1029/2003JD004394
Wen J., Huang L., Wang W., Jacka T., Damm V., and Liu Y. (2014). Ice thickness over the southern limit of the Amery Ice Shelf, East Antarctica, and reassessment of the mass balance of the central portion of the Lambert Glacier-Amery Ice Shelf system. Ann. Glaciology. 55, 81–86. doi: 10.3189/2014AoG66A154
Williamson A. G., Arnold N. S., Banwell A. F., and Willis I. C. (2017). A Fully Automated Supraglacial lake area and volume Tracking (“FAST”) algorithm: Development and application using MODIS imagery of West Greenland. Remote Sens. Environ. 196, 113–133. doi: 10.1016/j.rse.2017.04.032
Xu H. (2005). A study on information extraction of water body with the modified normalized difference water index (MNDWI). Natl. Remote Sens. Bull. 05, 589–595. doi: 10.11834/jrs.20050586
Yang K. (2013). The Progress of Greenland Ice Sheet surface ablation research. J. Glaciology Geocryology. 35, 101–109. doi: 10.7522/j.issn.1000-0240.2013.0012
Yang Z. and Kang Z. (2016). Detection of ice flow velocity on amery ice shelf by multi-kernel matching on frequency domain. Remote Sens. Information. 33, 58–65. doi: 10.3969/j.issn.1000-3177.2018.02.009
Yang K., Li M., Liu Y., Cheng L., Huang Q., and Chen Y. (2015). River detection in remotely sensed imagery using gabor filtering and path opening. Remote Sensing. 7, 8779–8802. doi: 10.3390/rs70708779
Yang T., Liang Q., Zheng L., Li T., Chen Z., Hui F., et al. (2023). Mass balance of the antarctic ice sheet in the early 21st century. Remote Sens 15, 1677. doi: 10.3390/rs15061677
Yang K. and Smith L. (2013). Supraglacial streams on the Greenland ice sheet delineated from combined spectral-shape information in high-resolution satellite imagery. IEEE Geosci. Remote Sens. Letters. 10, 801–805. doi: 10.1109/LGRS.2012.2224316
Yin Y., Li J., Yu T., Yang H., and Zhang Y. (2015). The study of object-oriented water body extraction method based on high resolution RS image. Bull. Surveying Mapp. 1), 81–85. doi: 10.13474/j.cnki.11-2246.2015.0016
Yu J., Liu H., Wang L., Jezek K., and Heo J. (2012). Blue ice areas and their topographical properties in the Lambert glacier, Amery Iceshelf system using Landsat ETM plus, ICESat laser altimetry and ASTER GDEM data. doi: 10.1017/S0954102011000630
Zhang L. (2020). Study on Remote Sensing Extraction of Antarctic Typical Ice Shelf Melting based on Landsat Data (Jilin, China: Jilin Jianzhu University). doi: 10.27714/d.cnki.gjljs.2020.000161
Zhang H., Wang D., and Gao Y. (2017). Research on extraction of water information in shadowed areas based on OLI data and decision tree algorithm. Surveying Mapp. Eng. 26, 45–48+54. doi: 10.19349/j.cnki.issn1006-7949.2017.11.010
Zhao J., Liang S., Li X., Duan Y., and Liang L. (2022). Detection of surface crevasses over antarctic ice shelves using SAR imagery and deep learning method. Remote Sens. 14, 487. doi: 10.3390/rs14030487
Keywords: Amery Ice Shelf, surface meltwater, Landsat8, shadow, NDWI
Citation: Zhou Z, Wang X, Sun Z and Zhao Y (2025) Study on extracting surface meltwater on the Amery Ice Shelf based on a novel water index. Front. Mar. Sci. 12:1476785. doi: 10.3389/fmars.2025.1476785
Received: 06 August 2024; Accepted: 09 May 2025;
Published: 30 May 2025.
Edited by:
David Alberto Salas Salas De León, National Autonomous University of Mexico, MexicoReviewed by:
Andrew Klein, Texas A and M University, United StatesSubhanil Guha, National Institute of Technology Raipur, India
Copyright © 2025 Zhou, Wang, Sun and Zhao. This is an open-access article distributed under the terms of the Creative Commons Attribution License (CC BY). The use, distribution or reproduction in other forums is permitted, provided the original author(s) and the copyright owner(s) are credited and that the original publication in this journal is cited, in accordance with accepted academic practice. No use, distribution or reproduction is permitted which does not comply with these terms.
*Correspondence: Zehao Sun, MjAyMjkzMDk1NkBzdHUuaGF1dC5lZHUuY24=