Abstract
The coastal zone, as a transition zone connecting terrestrial and marine ecosystems, has a relatively unique ecological environment. It is also one of the regions with the most intense human activities, highly sensitive to global changes, and has a fragile ecological environment. Therefore, it is crucial to accurately and timely assess the spatial and temporal patterns of ecological risks in the context of global changes. This study systematically assessed the ecological risks in the transboundary coastal zone of Northeast Asia from 1990 to 2020. The results show that the ecological environment in the transboundary coastal zone of Northeast Asia improved significantly over the past 30 years, and the greatest improvement occurred between 2000 and 2010. Among the five risk levels, High and Low increased, while Medium declined. The areas of ecological risk at the High and Low levels increased by 2,979 km² and 4,554 km², respectively. The ecological quality was highest on the Chinese and Russian sides of the study area, while the Republic of Korea and Japanese sides are considered to be more disturbed, with urbanization being the main factor affecting the coastal ecological quality in this region. On the Democratic People’s Republic of Korea side, environmental protection policies effectively improved ecological quality between 2000 and 2010, with a 28% reduction in high ecological risk in 2010 compared to 2000. The results of this study provide a scientific basis for ecological protection and sustainable management in the Northeast Asia region.
1 Introduction
The coastal zone is a transitional area where terrestrial and marine ecosystems converge (Mentaschi et al., 2018), providing essential habitats for coastal flora and fauna. Globally, about two-thirds of the population reside near cities with over 500,000 people within tidal estuary regions (Cracknell, 1999), and approximately 70% of large cities and populations are concentrated in coastal areas (Tu et al., 2022), exerting immense pressure on coastal ecosystems. In addition, factors such as sea-level rise (Murray et al., 2019), land reclamation (Li et al., 2022), infrastructure development (Wang et al., 2020) have caused significant ecological degradation. Human-induced land cover changes have affected multiple aspects of the Earth system, including climate, hydrology, biodiversity, and land sustainability (Mustard et al., 2004). Intensive human activities have already significantly altered ecosystems (Gong et al., 2023), making coastal resource investigation and management particularly urgent (Ghosh et al., 2016). Monitoring long-term land cover changes and assessing ecological risks in coastal regions are thus critical for advancing sustainable societal transformation (Wang et al., 2022).
Ecological Risk Assessment (ERA) is a scientific approach to quantifying the potential impacts of human activities and climate change, and has become an essential tool in environmental evaluation (Levine et al., 2019). Among various ERA methods, landscape ecological risk (LER) assessment has been widely applied (Qian et al., 2022; Guo et al., 2024). LER evaluates ecological conditions based on land use and landscape structure, making it suitable for long-term ecological risk studies (Ju et al., 2021). It reflects the adverse effects of natural or anthropogenic factors on landscape patterns and ecological processes (Peng et al., 2014) and serves as an effective tool for constructing ecological networks and achieving sustainable ecosystem management (Feng et al., 2019). The landscape index method is commonly used in LER (Zhang et al., 2022; Ahmadi Mirghaed and Souri, 2022), using metrics such as disturbance, fragmentation, vulnerability, and diversity to characterize landscape composition and configuration. Although effective in revealing landscape heterogeneity (Zhang et al., 2020), this method lacks attention to ecological processes and dynamics, limiting its applicability in complex systems like coastal zones (Xu et al., 2021).
Landscape Ecological Quality (LEQ) research, as an emerging field in landscape ecology, uses integrated remote sensing-based ecological indices to evaluate environmental conditions (Xiong et al., 2021), offering new perspectives for regional-scale ecological assessment (Luo and Li, 2021). The Remote Sensing Ecological Index (RSEI), which integrates four indicators—greenness, dryness, wetness, and heat—has been widely adopted in ecological quality assessment (Xu et al., 2019; Zheng et al., 2022; Yuan et al., 2021). However,current research seldom integrates LEQ and LER frameworks (Du et al., 2023), leading to significant limitations in evaluation results: traditional LER focuses on external risks while neglecting the internal health status of the system, whereas LEQ reflects ecological quality but fails to capture potential risks. This binary divide between risk and quality significantly constrains the scientific basis for integrated coastal management.
To address these methodological gaps, this study proposes an integrated assessment framework—the Ecological Risk Index (ERI). ERI couples the Landscape Ecological Risk Index (LERI) and the Landscape Ecological Quality Index (LEQI), enabling a two-dimensional evaluation of external risk pressure and internal ecological health in coastal ecosystems. Specifically, LERI quantifies external risks based on landscape vulnerability, disturbance, and fragmentation, while LEQI reflects ecological health through remote sensing indicators such as vegetation cover, land surface temperature, and moisture content. By determining the weights of LERI and LEQI, the ERI framework can more comprehensively identify ecological risk hotspots.
Given the limitations in land use classification and ecological risk assessment methods in existing studies, and the scarcity of systematic research on transboundary coastal zones, this study focuses on the coastal areas bordering China, Japan, Russia, the Republic of Korea (ROK), and the Democratic People’s Republic of Korea (DPRK). First, long-term land cover maps over the past three decades were developed using remote sensing data, OpenStreetMap (OSM), and manual interpretation. Second, LERI was calculated based on landscape metrics, while LEQI was constructed using remote sensing indices extracted via the Google Earth Engine platform. Finally, by integrating LERI and LEQI, ERI was developed to assess the spatial patterns and temporal evolution of ecological risk. This research provides a scientific basis for ecological conservation and resource management in complex and dynamic transboundary coastal regions.
2 Materials and methods
2.1 Study area
The Sea of Japan is located between 30°-53°N and 125°-142°E. It is the largest marginal sea in the northwest Pacific, separated from the northwest Pacific by Japan and Sakhalin Island. As a moderately productive ocean, it supports abundant marine biological resources (Yoo and Park, 2009). With hydrological characteristics similar to the North Atlantic, it is often referred to as a miniature ocean (Senjyu and Shiota, 2023). Its small scale allows for the observation of global ocean environment change trends in a relatively short period. The Sea of Japan has a profound impact on the economy, culture, and life of coastal countries, providing important fishery resources and maritime transportation and trade routes. It is also a geopolitical focal point, involving territorial and maritime rights of multiple countries. This study area, the transboundary coastal zone of Northeast Asia is a 60 km buffer zone of the Sea of Japan (Figure 1), with coastline data from GSHHG data version 2.3.7-Level_1. The baseline of the Sea of Japan coastline was extracted using GSHHG data, extending 50 km inland and 10 km into the sea, with local edits for ROK and Japan to ensure complete coverage of aquaculture ponds. The buffer zone range is determined based on human activities and nearshore aquaculture range.
Figure 1
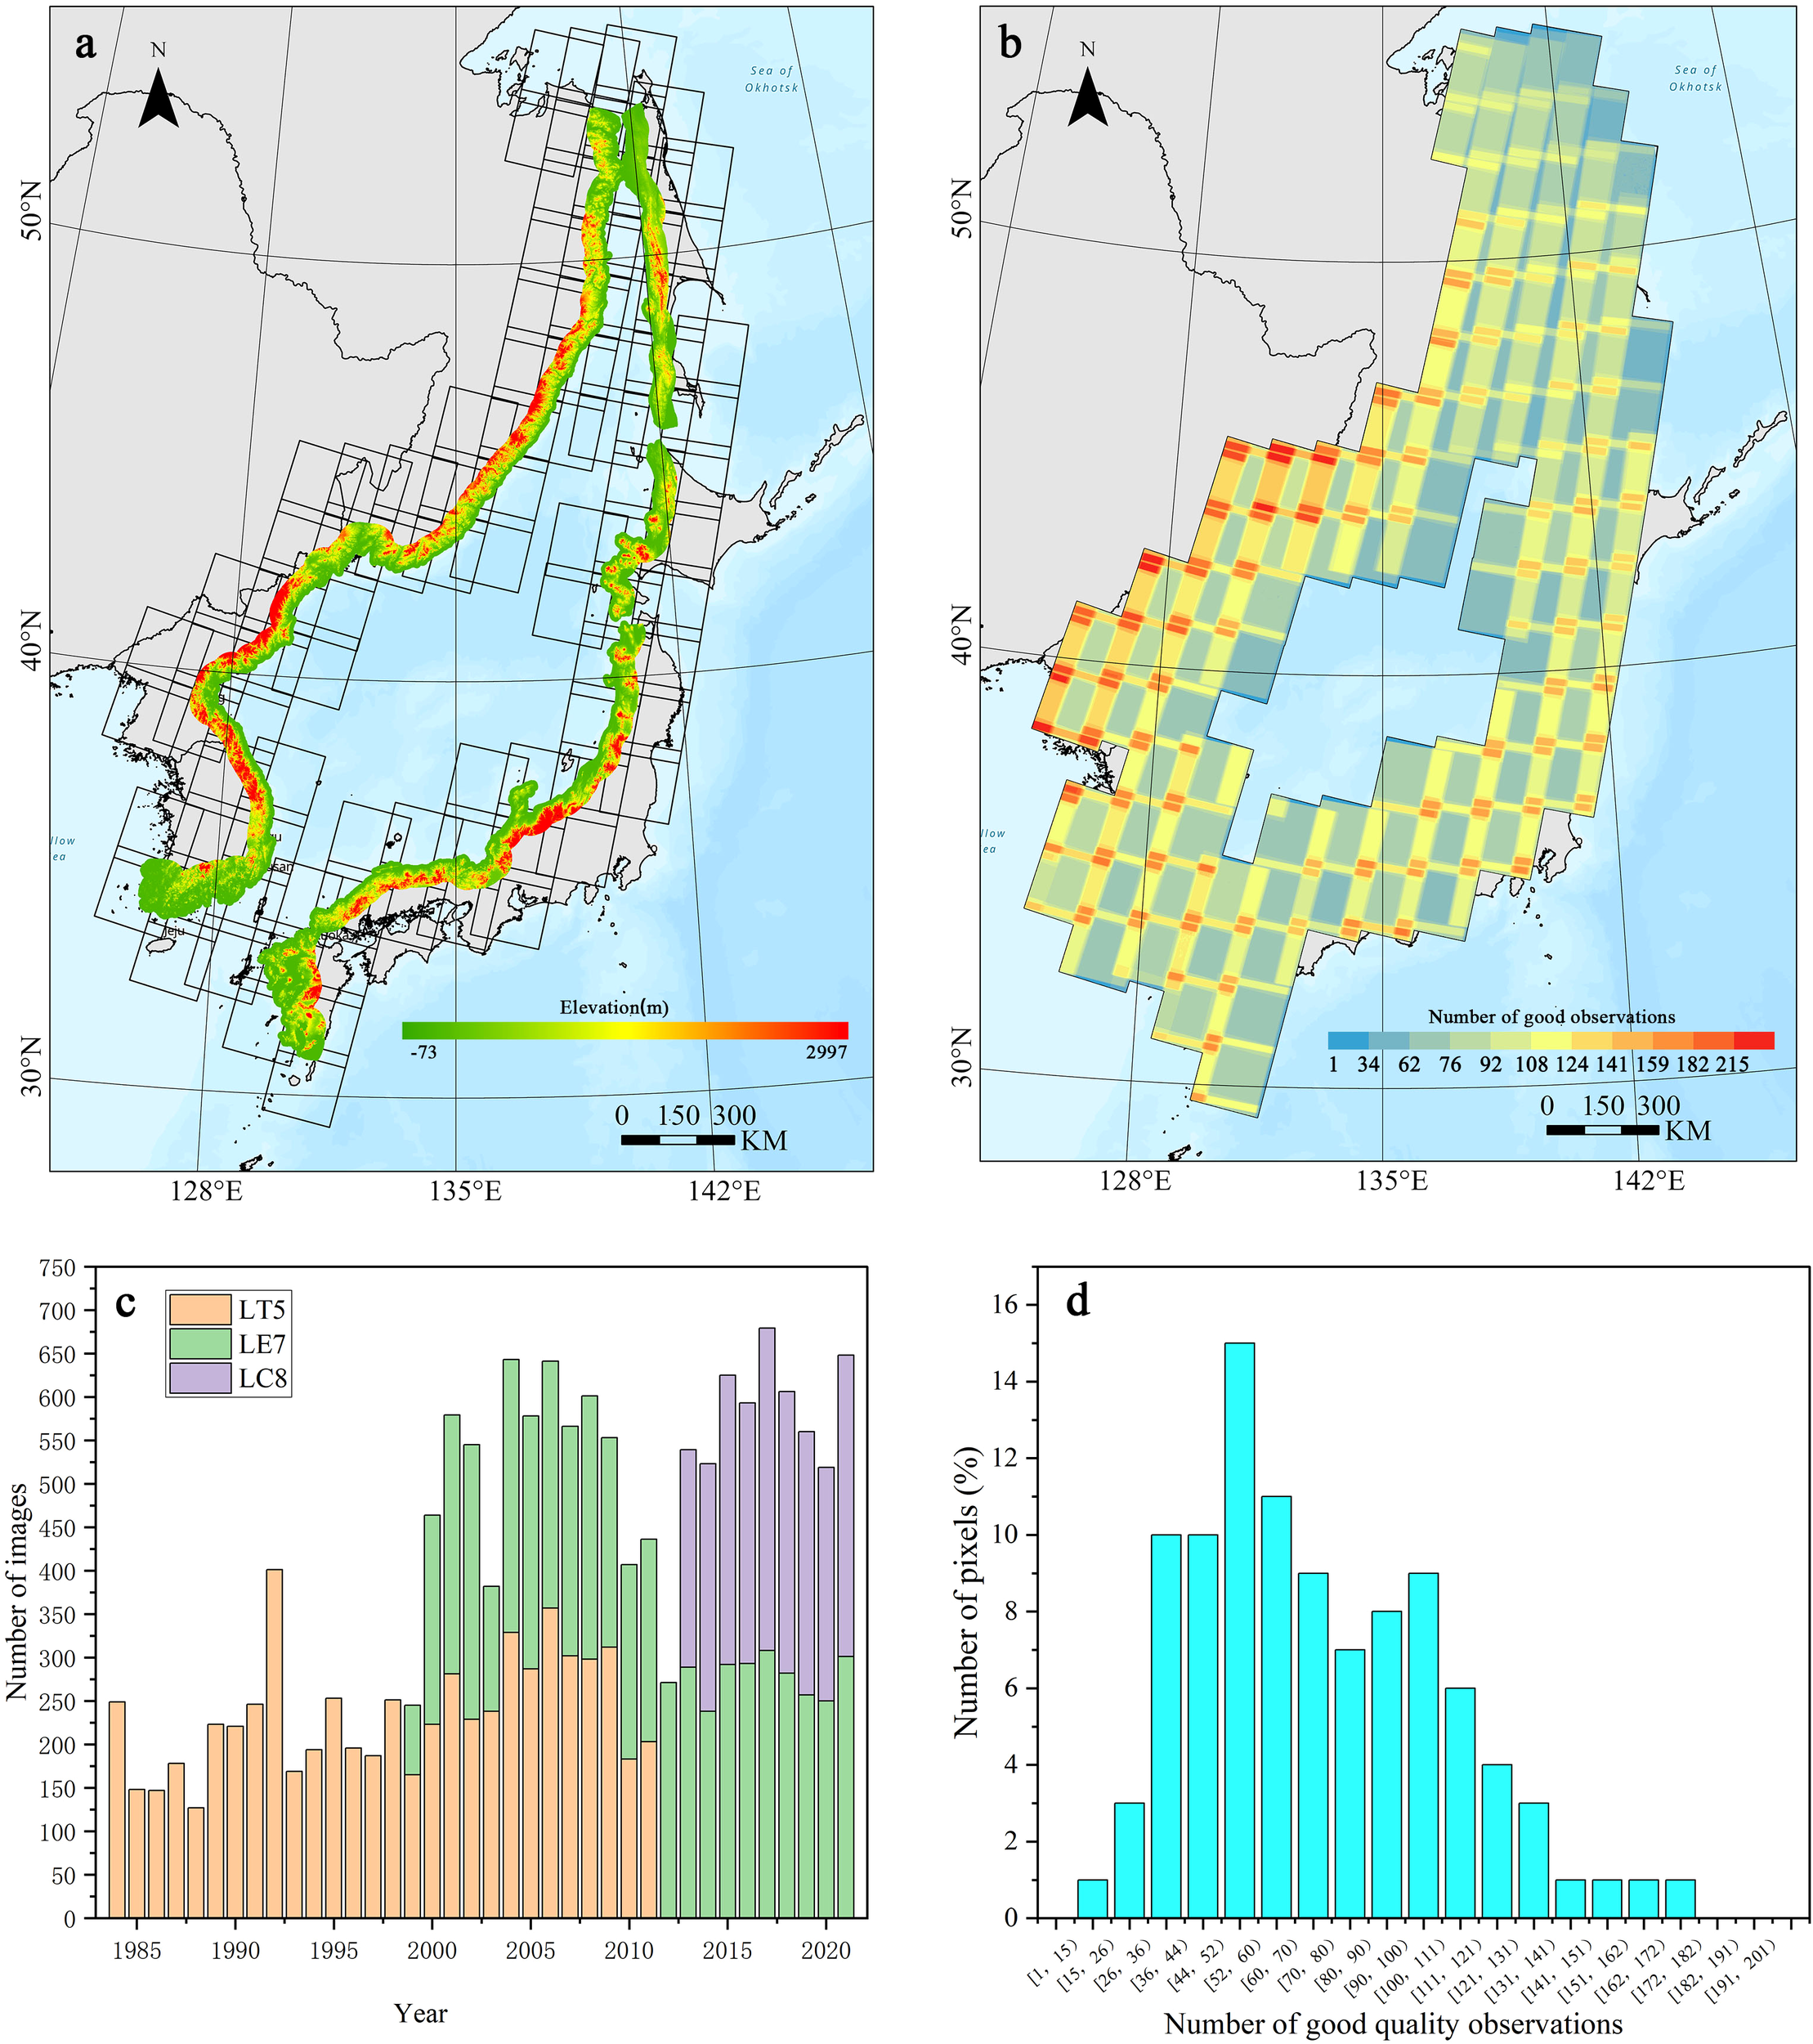
Location of study area and availability of time series Landsat images. (a) Location of study area and coverage of Landsat Worldwide Reference System 2 (WRS-2) path/row; (b) the number of all Landsat images in each path/row; (c) total numbers of images by sensors (Landsat 5/7/8); (d) the distribution of good-quality observation numbers of all pixels.
2.2 Data sources
Themain data used in this study include remote sensing imagery, land classification data, OSM data, digital elevation model (DEM) data, and coastline data. Remote sensing imagery was obtained from the Google Earth Engine (GEE) platform, using the Landsat Collection 2 Level 2 Tier 1 dataset of Landsat 5, 7, and 8 satellites for coastal zone land classification. The land samples were selected with reference to various datasets, including GLC-FCS30, ESRI-10, GLC-30, ESA-World, Nicholas J. Murray’s global tidal flats classification data, and OSM data. The coastline data was extracted from GSHHG 2.3.7 at the highest resolution and used as the baseline for creating the coastal zone buffer (Table 1).
Table 1
| Data | Data Source Website Link |
|---|---|
| GLC-FCS30 | https://data.casearth.cn |
| ESRI-10 | https://www.arcgis.com/apps/instant/media/index.html?appid=fc92d38533d440078f17678ebc20e8e2 |
| GLC-30 | https://www.webmap.cn/commres.do?method=globeIndex |
| ESA-World | https://viewer.esa-worldcover.org/worldcover |
| Open Street Map | https://www.openstreetmap.org |
| Tidal Flats | https://www.intertidal.app/download |
| Digital Elevation | https://developers.google.com/earth-engine/datasets/catalog/USGS_SRTMGL1_003 |
| GSHHG 2.3.7 | https://www.soest.hawaii.edu/wessel/gshhg/ |
Data and sources.
2.3 Methods
2.3.1 Coastal zone classification system
The classification of the coastal zone mainly refers to three global land cover products (GLC-FCS30, ESRI-10, GLC-30). Currently, representative coastal zone classification systems include the NOAA Coastal Change Analysis Program(CCAP) and the Australian Land Use and Management (ALUM) Classification System, but these classification systems are biased towards national scales. Based on this, the study reconsidered 11 coastal land cover types, first incorporating the main types of global land cover products, including forest, shrub, grassland, cropland, impervious surface, bare land, and water. The classification also emphasized subclasses of coastal wetlands: Natural wetlands as the basic type of CCAP classification and an important type of coastal land cover on the Russian side of the study area; aquaculture ponds as an important land cover type in the southern part of the ROK and Japanese sides, representing significant human activity features; mudflats are habitats for many birds, mollusks, and benthic organisms, with areas such as the Shinan Tidal Flat and Boseong-Suncheon Tidal Flat on the ROK side being listed as World Heritage Sites in 2021; sandy beaches are important for coastal ecosystems and weathering processes and are popular tourist destinations. Therefore, mudflats and sandy beaches were included in the classification scheme.
2.3.2 Training sample acquisition
In this study, a stratified sampling method was used to generate randomly distributed samples in coastal areas. Using three global land cover products from 2020 (GLC-FCS30, ESRI-10, GLC-30) and other data (OSM beach data, tidal flat map, ESA-WORLD, etc.) assisted in automatic sampling, producing 1,000 samples for each class. In sampling forest, cropland, built-up land, grassland, and water classes, samples were extracted from the corresponding categories of the three global land cover products. These land types had a higher proportion in previous land cover data, so samples were obtained within the intersection range of each category. Since no high-resolution beach map was available, coastal beaches were extracted from OSM vector data labeled beach. For natural wetlands, defined as land primarily covered by natural herbaceous plants and permanently or periodically flooded, this definition is similar to the submerged vegetation defined by ESRI-10 and the herbaceous wetland defined by ESA-WORLD, so the intersection of the two datasets was used to obtain samples. The mudflat data were generated using Nicholas J. Murray’s global tidal flat data. For shrub and bare land, six inland land cover types (forest, cropland, built-up land, grassland, shrub, bare land) were used to mask larger land cover types (forest, cropland, built-up land, grassland) and parts of coastal wetlands (mudflat, sandy beach, natural wetland), and the intersection part of (GLC-FCS30, ESRI-10, GLC-30) was used. Samples for 1990, 2000, and 2010 were obtained by annual screening, replacing erroneous sample points, and finally obtaining sample points for four periods from 1990 to 2020. After sampling, erroneous classified samples were deleted to correct obvious misclassification issues, such as confusion between high reflective urban areas and beaches, and misclassification due to time differences in mudflat data sampling.
2.3.3 Land cover classification method
The study first used a pixel-based classification method (Li et al., 2019), selecting the fused images from three years around 2000, 2010, and 2020 during the vegetation growing season (May 1 - September 30) of the Landsat satellite (Feyisa et al., 2014; Zhou et al., 2017). For 1990, due to incomplete coverage by Landsat images, all remote sensing images from May to September 1984-1992 (cloud cover <10%) were used. Land classification considered five spectral bands (red, green, blue, near-infrared, shortwave infrared) and seven spectral indices (Normalized Difference Vegetation Index (NDVI), Normalized Difference Built-up Index (NDBI), Normalized Difference Water Index (NDWI), Modified Normalized Difference Water Index (MNDWI), Normalized Difference Moisture Index (NDMI), Automated Water Extraction Index (AWEI), and Enhanced Vegetation Index (EVI)), with each index added as an independent band in the classification (Jiang et al., 2014; Zeng et al., 2019). Additionally, texture features and DEM data were included to aid classification. The texture features selected were the most commonly used two features: contrast (B8_CONTRAST) and correlation (B8_CORR), and slope and elevation were extracted from DEM data to participate in the coastal zone classification. Finally, a random forest classifier with 250 decision trees was run on the Google Earth Engine platform, with other parameters kept default, to obtain the final classification results.
Due to the similar physical properties (such as water color and submersion frequency) of coastal aquaculture ponds and seawater, it is challenging to classify aquaculture ponds and water bodies using pixel-oriented methods (Zou et al., 2022). However, compared with coastal waters, aquaculture ponds have a unique spatial grid structure, which can be accurately identified through manual classification methods. The classification of aquaculture ponds relies on visual interpretation. In this study, after processing the median synthetic images of three years, the NDWI was used, and the OTSU algorithm was employed to divide the landscape within the study area into water and non-water bodies. Google Earth, NDVI, and composite images of red, green, blue, and near-infrared bands were used to assist interpretation. To evaluate the accuracy of the classification results, 30% of the sample point data was selected as the test set. The Kappa coefficient of coastal zone land classification from 1990 to 2020 was calculated using the confusion matrix to validate the results.
2.3.4 Ecological risk assessment of coastal landscape
This study proposes an integrated Ecological Risk Index (ERI), which combines two core indicators—the Landscape Ecological Risk Index (LERI) and the Landscape Ecological Quality Index (LEQI)—to assess both potential ecological risks and the current state of the ecosystem.To quantify ecological risks, the study divides the coastal zone into 10 km × 10 km grid cells. The ERI is calculated as a weighted sum of LERI and LEQI (Equation 1), with equal weights (0.5). This dual-index approach captures both external pressures and internal ecosystem health.
In Equation 1, ERIk represents the Ecological Risk Index of the k-th risk unit, LERIk is the Landscape Ecological Risk Index of the k-th risk unit, LEQIk is the Ecological Environmental Quality Index of the k-th risk unit, and ω is the weight of LERIk and LEQIk (0.5). When calculating the ERI, both LERIk and LEQIk need to be normalized. The higher the LEQI, the better the regional ecological environment. When normalizing LEQI, the values need to be reversed. Below are the calculation methods for the two indices:
(1). Construction of the LERI: The LERIk is used to measure the sensitivity of the ecosystem to external disturbances and its potential risks (Egbueri, 2020). The calculation of this index is based on Fragstats Version 4.2 software. Using the land use data obtained in Section 2.3.3, independent risk calculations are performed for each land type within each 10km × 10km grid. The overall landscape risk for each grid is obtained by summing the individual risks of each land type (Equation 2). It incorporates two factors: Landscape Vulnerability Index (LVi), based on land use types; Landscape Disturbance Index (LDi), derived from fragmentation(Fi), separation(Si), and dominance(Di) metrics.
Aki represents the total area of the i-th landscape type in the k-th risk unit, and Ak represents the total area of the k-th risk unit.
LVi represents the degree of structural fragility associated with different landscape types, reflecting their capacity to resist and recover from external disturbances. Vulnerability levels were determined based on previous studies (Zhu et al., 2022; Mo et al., 2017) and adjusted according to the specific environmental characteristics of the study area. Six relative vulnerability levels were classified and normalized, with higher values indicating greater ecological fragility. The assigned normalized values are as follows: bare land (0.29), due to lack of vegetation cover, is highly susceptible to wind and water erosion; water bodies (0.24) are vulnerable to pollution and climate change, with limited recovery capacity; cropland (0.19) experiences long-term anthropogenic disturbance, weakening its ecological resilience; grassland (0.14) possesses moderate self-recovery ability but remains sensitive to environmental and human pressures; forest and shrubland (0.09) have stronger ecological functions and more stable internal structures; impervious surfaces (0.05), formed primarily through urbanization, exhibit relatively stable structures. Additional types include tidal flats and mudflats (0.29), located in transitional coastal zones and exposed to wave erosion, storm surges, and human development; natural wetlands (0.29), primarily in the lowlands of Sakhalin Island, Russia, are significantly affected by flooding, tides, and wave action; and aquaculture ponds (0.05), mainly distributed along southeastern ROK and western Japan, which are primarily used for artificial marine cultivation and demonstrate stronger resistance to disturbance.
LDi is composed of three parts and is used to measure the extent of damage to landscape types under external disturbances (Xu and Kang, 2017)(Equation 3). Fi reflects landscape structural integrity and patch fragmentation, higher fragmentation, common in urbanized coastal zones, weakens ecological resilience and increases risk, whereas natural landscapes like forests show lower fragmentation and better stability (De Montis et al., 2017) (Equation 4); Si reflects spatial isolation between landscape types, high separation in coastal areas due to development (ports, tourism) limits species movement, disrupts connectivity, and increases extinction risk (De Montis et al., 2020) (Equation 5); Di measures the dominance of a specific landscape type. By calculating and comparing the Di values of different landscape types, it can reveal whether a particular type dominates the coastal zone, especially land use types with weaker ecological functions (such as urbanized or agricultural areas), which often reduce biodiversity and ecosystem functions (Ricotta and Avena, 2003) (Equation 6).
a, b, c are the weights for each indicator, where a = 0.5, b = 0.3, and c = 0.2. i represents the landscape type, Fi is the Landscape Fragmentation Index, Si is the Landscape Separation Index, and Di is the Landscape Dominance Index.Ni represents the number of patches of landscape type i, and Ai represents the total area of landscape type i.Ni represents the number of patches of landscape type i, A is the total area of the landscape, and Ai is the total area of landscape type i.Ni represents the number of patches of landscape type i, N is the total number of patches, A is the total area of the landscape, and Ai is the total area of landscape type i.
(2). Construction of the LEQI: This study constructs the LEQI based on five key remote sensing indices—Surface Potential Water Abundance Index (SPWI), Normalized Difference Latent Heat Index (NDLI), Land-Surface Temperature (LST), Ratio Vegetation Index (RVI), and Normalized Difference Soil Index (NDSI)—to comprehensively reflect the coupled relationships among water, vegetation, soil, and heat in coastal zones. Compared to the RSEI method for ecological quality assessment, this approach places greater emphasis on the role of water-related ecological factors, as coastal areas tend to have higher humidity than inland regions. Water bodies are not only vital for the survival of flora and fauna but also improve the ecological environment through evaporation and transpiration (Ling et al., 2020). By evaluating ecological quality from multiple perspectives, this index helps provide a more comprehensive understanding of coastal ecosystem health. All indices were then normalized. The five indices are as follows: SPWI mainly reflects potential water abundance and moisture changes in coastal areas (Jiao et al., 2021). By identifying water-rich and dried-up zones, it plays a key role in water resource management and ecological restoration (Equation 7); NDLI indicates vegetation evapotranspiration capacity and water-use efficiency (Yang et al., 2020). Essential for monitoring drought responses and assessing regional ecological stability (Equation 8); LST directly affects organism growth and regional climate, serving as a key indicator for assessing coastal heat stress and environmental pressures (Equation 9); RVI measures vegetation health (Adeyeri et al., 2017), effectively identifying degraded areas for coastal ecological risk analysis (Equation 10); NDSI reflects the moisture content of the soil (the larger the NDSI, the drier the soil; the smaller the NDSI, the wetter the soil) (Deng et al., 2015), particularly useful for monitoring ecological health in land-water transition zones (Equation 11).
NIR represents the Near-Infrared band, SWIR represents the Short-Wave Infrared band, Blue represents the Blue band, Green represents the Green band, and Red represents the Red band. In Landsat 8, ST_B10 is used, while in Landsat 5 and Landsat 7, ST_B6 is used.
After calculating the five remote sensing indices, this study employed the entropy weight method to determine the weights of each index within each grid cell. This approach allows for an objective assessment of the relative importance of each indicator in evaluating the overall ecological quality (Sreeparvathy and Srinivas, 2020; Li, 2021; Jiao et al., 2021). This method automatically assigns weights based on the variability of each ecological indicator. First, five indicators are normalized. Then, the information entropy Ej (Equation 12) (Gao et al., 2020) of the five indicators is calculated to measure their degree of dispersion.
Information entropy reflects the spatial dispersion of each indicator; the higher the entropy value, the more evenly distributed the indicator is spatially, resulting in a higher weight. Finally, based on the normalized values of each indicator and their corresponding weights Wj (Equation 13) (Gao et al., 2020), the weighted LEQIi (Equation 14) is constructed. The LEQI values for all pixels are normalized to the range [0, 1].
Ej represents the information entropy of the jth indicator, n is the total number of valid pixels in the study area, Pij represents the proportion of the jth indicator in the ith pixel, Xij represents the original value of the ith pixel for the jth indicator, X′ij represents the normalized value of the indicator, Wj is the information entropy of the jth indicator, and K is the total number of ecological indicators (in this study, K = 5). The Sgnj for positive indicators (SPWI, NDLI, RVI) is positive, while for negative indicators (LST, NDSI), Sgnj is negative. LEQIi represents the Landscape Ecological Quality Index for the ith pixel. Table 2 shows the weights of each indicator determined by the entropy weight method.
Table 2
| Remote Sensing Index | 1990 | 2000 | 2010 | 2020 |
|---|---|---|---|---|
| SPWI | 0.18 | 0.18 | 0.19 | 0.16 |
| NDLI | 0.14 | 0.12 | 0.18 | 0.13 |
| LST | 0.21 | 0.18 | 0.13 | 0.19 |
| RVI | 0.25 | 0.29 | 0.25 | 0.23 |
| NDSI | 0.22 | 0.24 | 0.24 | 0.28 |
Weights determined using the entropy weight method.
According to the Natural Breaks method, the average value of the ERI results is divided into five levels. Following the method proposed by Wang et al. (2020), the coastal zone ERI change areas are classified into five categories based on risk transfer levels: extremely ecologically deteriorated area (EEDA): ERI level decreases by ≥2; ecologically deteriorated are (EDA): ERI level decreases by 1; ecologically stable area (ESA): ERI level remains unchanged; ecologically improved area (EIA): ERI level increases by 1; extremely ecologically improved ecological area (EEIA): ERI level increases by ≥2.By combining the GADM (https://gadm.org/) global country vector data, the average value of the ERI changes in the coastal zones of each coastal city is calculated. Figure 2 illustrates the technical approach used in this study.
Figure 2
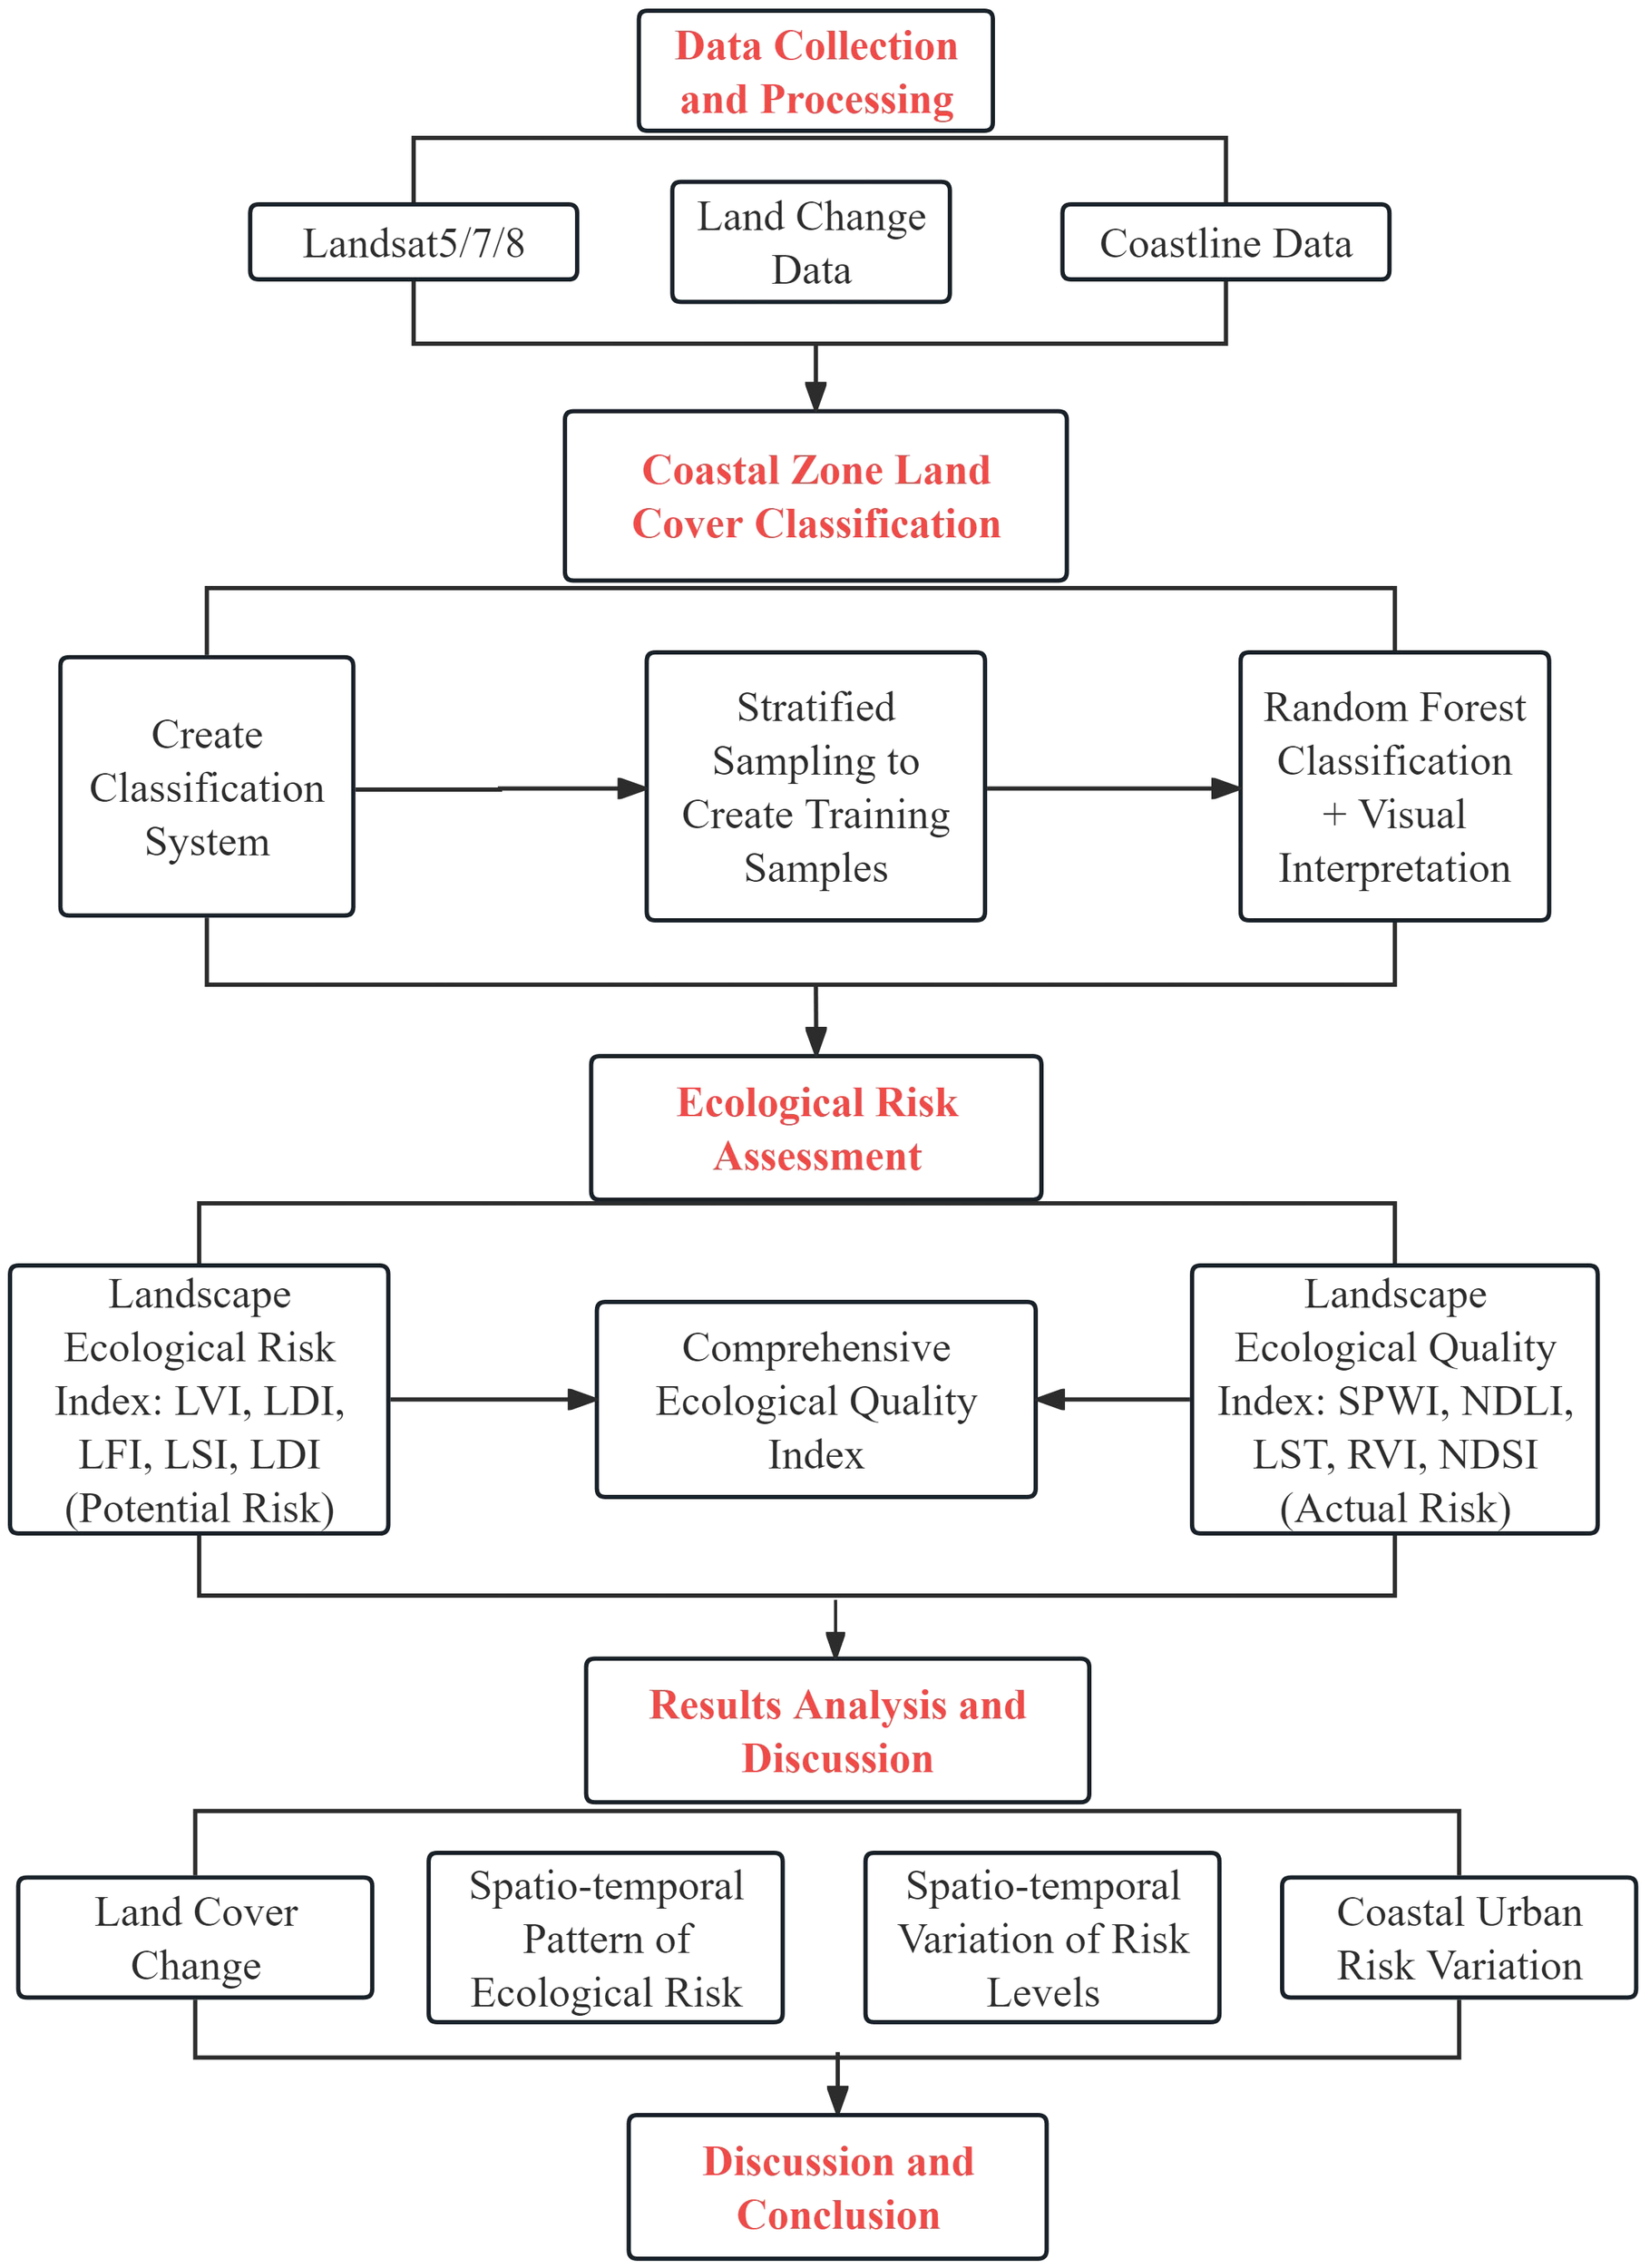
Technical workflow diagram.
3 Results
3.1 Land cover change in the transboundary coastal zone of northeast Asia
This study divides the land types in the transboundary coastal zone of Northeast Asia into 11 categories: cropland, forest, impervious surface, shrub, grassland, bare land, water, sandy beach, mudflat, natural wetland, and aquaculture pond. Among them, forest, cropland, and water areas are the largest, averaging 87.54% of the total area of the transboundary coastal zone of Northeast Asia, while bare land, sandy beach, and aquaculture ponds account for less than 1% (Table 3). Forest is the largest land type in the transboundary coastal zone of Northeast Asia, averaging 55.29% of the area. Bare land is mainly distributed on the DPRK side and in high mountain areas. Natural wetlands are mostly found in the northwest of Sakhalin Island and river outlets. Cropland and construction land are concentrated in coastal areas on the Japanese and ROK sides, and aquaculture ponds are mostly distributed in the southern coastal areas of ROK and Japan. Overall, the area of cropland decreased significantly from 40,842km² in 1990 to 31,413km² in 2020, with an average annual decrease of 0.77%, approximately 314 km² per year. The area of construction land increased by 78.83%, with an average annual increase of about 200km². Shrub and grassland areas increased rapidly from 1990 to 2010, with slower growth in the following decade. The area of sandy beach increased in the first 10 years but decreased slightly in the following 20 years. The area of mudflat changed little in the first and last 10 years but decreased rapidly from 2000 to 2010. The area of coastal aquaculture ponds, although small in proportion, showed a rapid increase overall.
Table 3
| Land Cover Type | 1990LUCC | 2000LUCC | 2010LUCC | 2020LUCC |
|---|---|---|---|---|
| Cropland | 9.20% | 7.91% | 7.41% | 7.08% |
| Forest | 57.39% | 54.87% | 54.16% | 54.76% |
| Impervious surface | 1.71% | 2.05% | 2.40% | 3.07% |
| Shrub | 0.82% | 1.51% | 1.85% | 1.85% |
| Grassland | 3.07% | 4.21% | 4.80% | 5.05% |
| Bare land | 0.39% | 1.02% | 0.49% | 0.46% |
| Water | 23.86% | 23.81% | 24.99% | 24.73% |
| Sandy beach | 0.27% | 0.42% | 0.35% | 0.33% |
| Mudflat | 1.42% | 1.46% | 0.57% | 0.68% |
| Natural wetland | 1.87% | 2.74% | 2.95% | 1.96% |
| Aquaculture pond | 0.01% | 0.01% | 0.03% | 0.04% |
LUCC area change percentage from 1990 to 2020.
The study shows that the average overall accuracy of land classification results in the transboundary coastal zone from 1990 to 2020 was 87.85%, with Kappa coefficients of 0.88, 0.86, 0.83, and 0.88 for the four periods. Forest, water, mudflat, and impervious surface classifications had the highest accuracy, averaging 94.49%, 92.68%, 91.38%, and 90.72%, respectively. The average accuracy of sandy beach, natural wetland, and cropland classifications also exceeded 85%, but the accuracy of shrub classification was the lowest at 79.73%. Overall, the classification accuracy meets the needs of coastal land cover analysis and does not affect the further analysis results.
According to the results of the transition matrix (Figure 3), overall, the areas of cropland, forest, and mudflat decreased over the past 30 years, while impervious surfaces increased. Cropland mainly transitioned to construction land, forest to grassland, mudflat to cropland, and impervious surfaces from cropland. From 1990 to 2000, there was a significant outflow of cultivated land and forest land. Specifically, 5% of cultivated land was converted to grassland, 6% to impervious surfaces, and 5% to shrubs. Additionally, 2% of forest land was converted to cultivated land and 4% to grassland. For other land types, the area of inflow exceeded the outflow, showing an increasing trend. During this period, grassland area increased the most over the 30 years, reaching 9,919 km².From 2000 to 2010, cultivated land and forest land continued to decrease by 2,190 km² and 3,101 km², respectively. The area of bare land also decreased, with 12% being converted to cultivated land. The inflow area of mudflats and sandy beaches was smaller than the outflow area.From 2010 to 2020, the cultivated land area continued to decrease by 1,503 km², while the decrease in forest land was reversed, with an increase of 2,622 km². The area of natural wetlands experienced significant changes, decreasing by 4,373 km², with the main transfer directions being to forest land (2,664 km²) and grassland (1,539 km²).
Figure 3
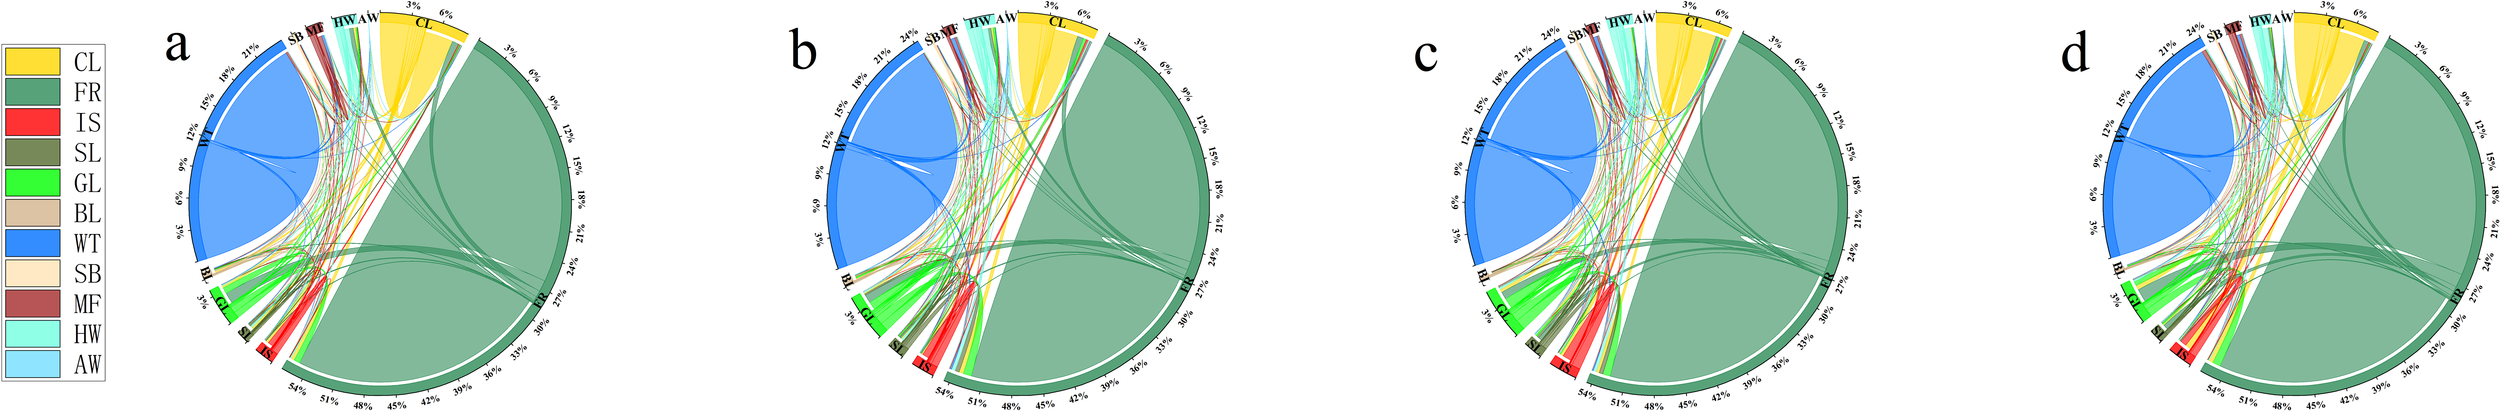
Land use transition matrix of transboundary coastal zones in Northeast Asia. (a) 1990-2000; (b) 2000-2010; (c) 2010-2020; (d) 1990-2020.
3.2 Spatial and temporal patterns of landscape ecological risk
Based on ERI results, the multi-year average proportions of Low and Medium Low risk areas were 64% (Russia), 65% (China), 41% (DPRK), 41% (ROK), and 52% (Japan). In contrast, the High and Medium High risk areas accounted for 12%, 18%, 30%, 28%, and 27%, respectively. Overall, the spatial distribution shows higher risks along the coast and lower risks inland. Among the five countries coastal areas, the ecological risk in the Russian coastal zone was the lowest (Figure 4). Over the past 30 years, the areas of High and Medium High risk zones in the transboundary coastal zone of Northeast Asia increased by 4%, with the High risk zone increasing by 2,970 km² and the Medium High risk zone by 15,129 km².
Figure 4
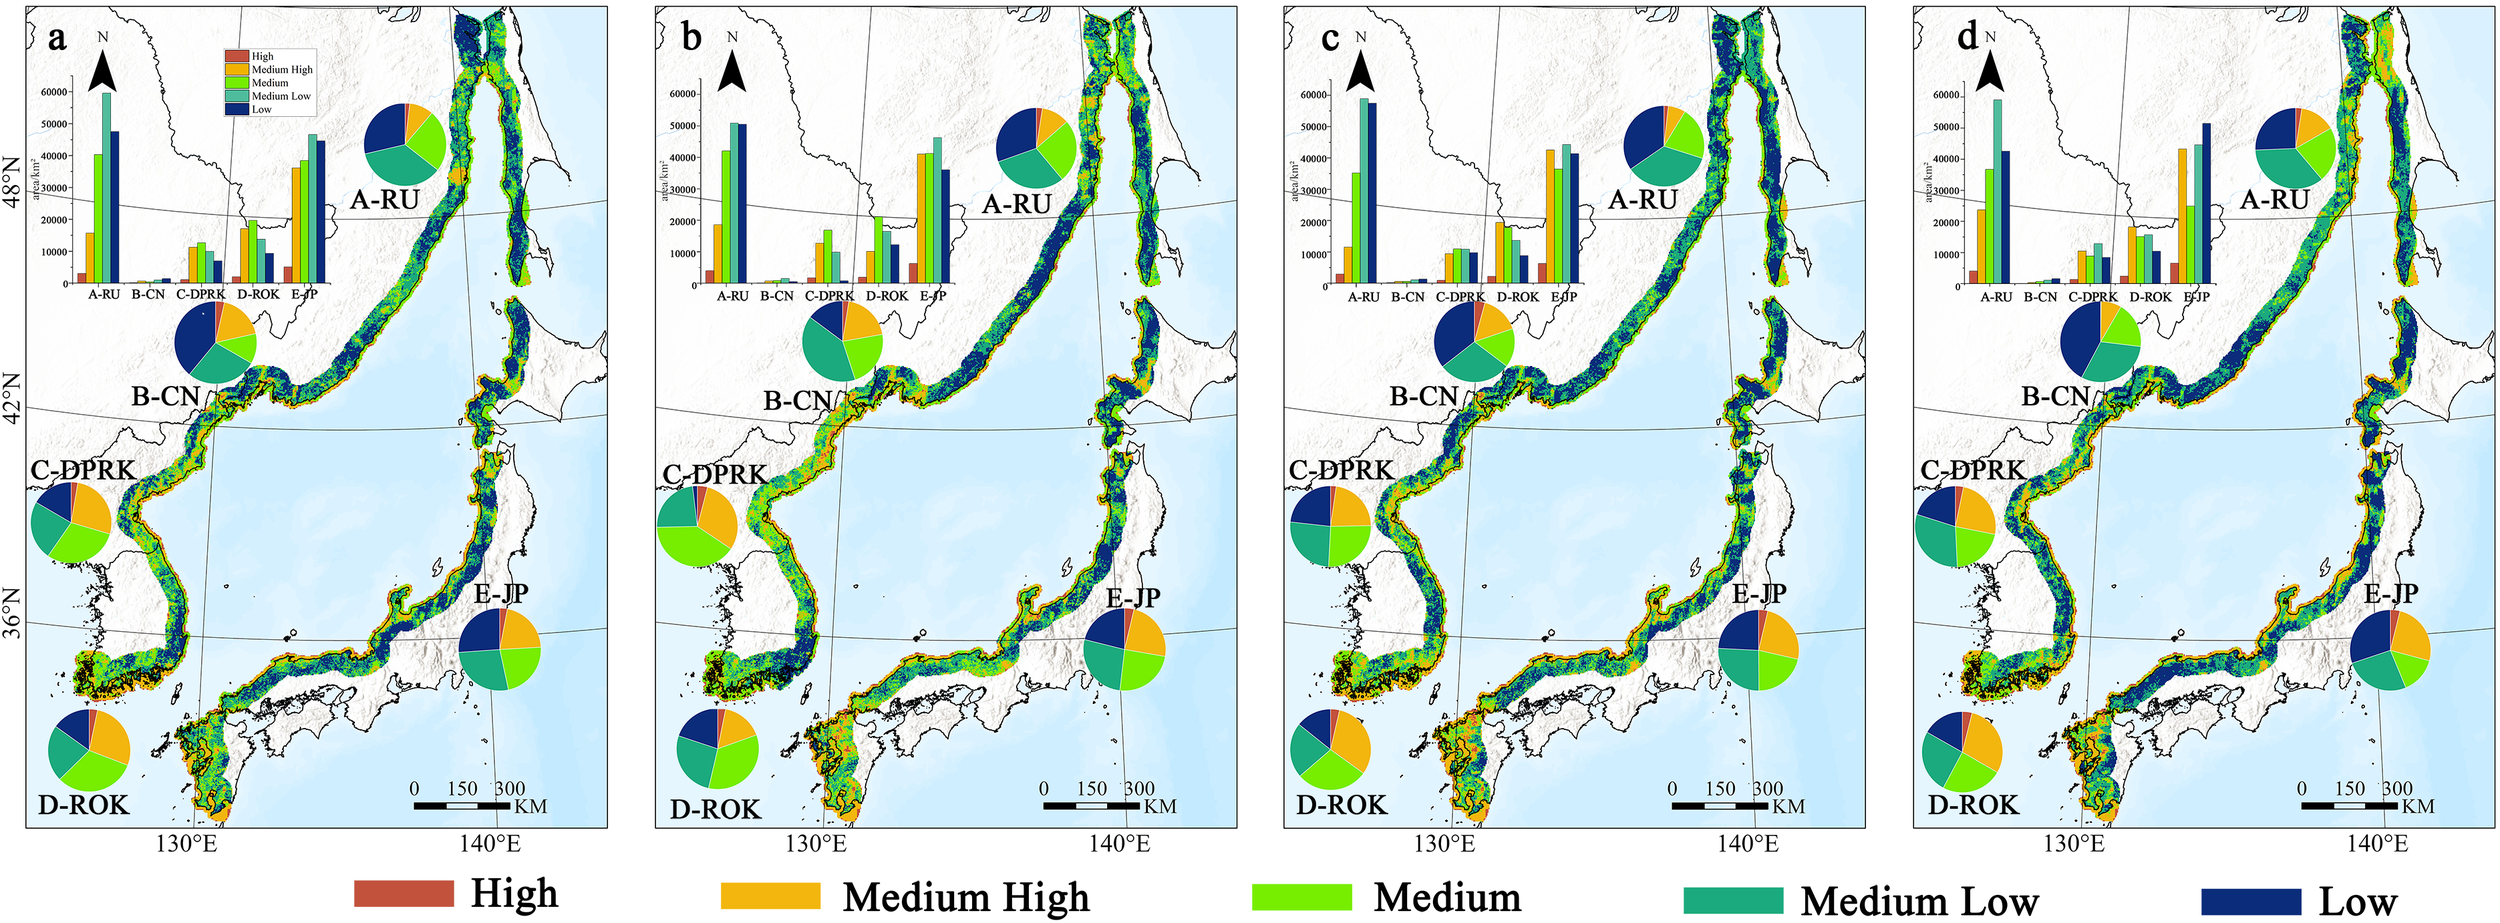
Spatial distribution of ecological risk levels in transboundary coastal zones of Northeast Asia. (a) 1990; (b) 2000; (c) 2010; (d) 2020.
From 1990 to 2020, the area of the Medium risk zone on the Chinese side increased by 7%, while other ecological risk levels showed an overall decreasing trend, with the overall ecological quality improving compared to 1990; The area of the Medium risk level on the Japanese side showed a decreasing trend, with overall risk zone changes being relatively stable. The highest risk was in the southern Kyushu region; On the ROK side, the area of Low and Medium Low zones fluctuated, reaching a maximum in 2000 (46%), while High and Medium High zones reached their lowest value (19%) in 2000. Overall, the ecological environment of ROK in the eastern coastal zone is better than in the southern coastal zone. Gyeongsangnam-do and Gyeongsangbuk-do are regions in the coastal zone of ROK where Low and Medium Low ecological quality categories are widely distributed. Yi (2021) found that the ecosystem service value in these regions increased between 1980 and 2000; The Russian side has the best ecological quality among the five countries coastal zones, with multi-year averages of 30% and 34% for Low and Medium Low zones, respectively. In 2010, the Low and Medium Low zones reached their maximum area, while the High and Medium High zones reached their minimum area, indicating the best ecological quality during this period; On the DPRK side, the areas of High and Medium High risk zones reached their maximum (34%) in 2000, while the Medium zone reached its peak (40%) in 2000 and then gradually decreased, with the Low and Medium Low zones reaching their minimum in 2000 and increasing over the past 20 years. This can be attributed to the improvements in the DPRK Forest Law and the implementation of the Ten-Year Forest Restoration Plan, which have led to an increase in coastal vegetation (Piao et al., 2021).
3.3 Spatial and temporal changes in landscape ecological risk
Overall, the southeast coastal areas of ROK deteriorated, while the eastern and southern regions improved. Gyeongsangnam-do saw improvements in the marine environment from 1990 to 2000 (Figure 5). From 2000 to 2010, the eastern coastal environment improved more significantly than the southern region. From 2010 to 2020, EEDA and EEIA areas significantly decreased, with EIA and ESA being the main changes; On the DPRK side, the environment in Hamgyongbuk-do deteriorated significantly from 1990 to 2000. From 2000 to 2010, EIA and EEIA areas increased significantly in Hamgyongbuk-do. The study also found that the environment in the border area between DPRK and ROK, particularly in Gangwon-do, experienced major changes dominated by EIA and EEIA transitions. On the Chinese side, the coastal zone mainly located in Jilin Province showed an overall improvement in the environment after the initial 10-year period of EDA being the main trend. From 1990 to 2000, EEDA and EDA were mainly located in the southern regions of Japan (Fukuoka Prefecture, Saga Prefecture, Miyazaki Prefecture) and central regions (Hyogo Prefecture, Kyoto Prefecture, Fukui Prefecture). The environment improved from 2000 to 2020, with Niigata Prefecture being relatively high-risk. Overall, the risk zones on the Japanese side over the past 30 years mainly distributed in the southwestern coastal areas and cities on both sides centered around Ishikawa Prefecture; On the Russian side, from 1990 to 2010, EEDA and EDA areas shifted from the northwest to the southwest, with EEDA and EDA areas mainly located in northern coastal swamp wetlands. However, it is worth noting that, as shown in Figure 4, the spatial distribution of EEDA and EDA on the Russian side is mainly influenced by the transition between the Low, Medium Low, and Medium risk levels, and the overall ecological environment remains the best among the five countries in the transboundary coastal zone of Northeast Asia. Using the GADM global vector database to divide the ecological risk distribution by administrative units, it was found that the coastal cities on the Russian side experienced a deterioration in the ecological environment over large areas in 2020 compared to 2010. On the DPRK side, coastal cities saw a significant improvement in the ecological environment in 2010. On the ROK side, the overall ecological environment of coastal cities has been improving, except in the southeastern region. Japanese coastal cities have also seen some improvement in the ecological environment over the past decade. Overall, in the past 30 years, the ecological environment of 23 coastal cities has deteriorated, while 40 cities have seen improvements (Figure 6). On the whole, the overall ecological environment of coastal cities has improved over the past 30 years.
Figure 5
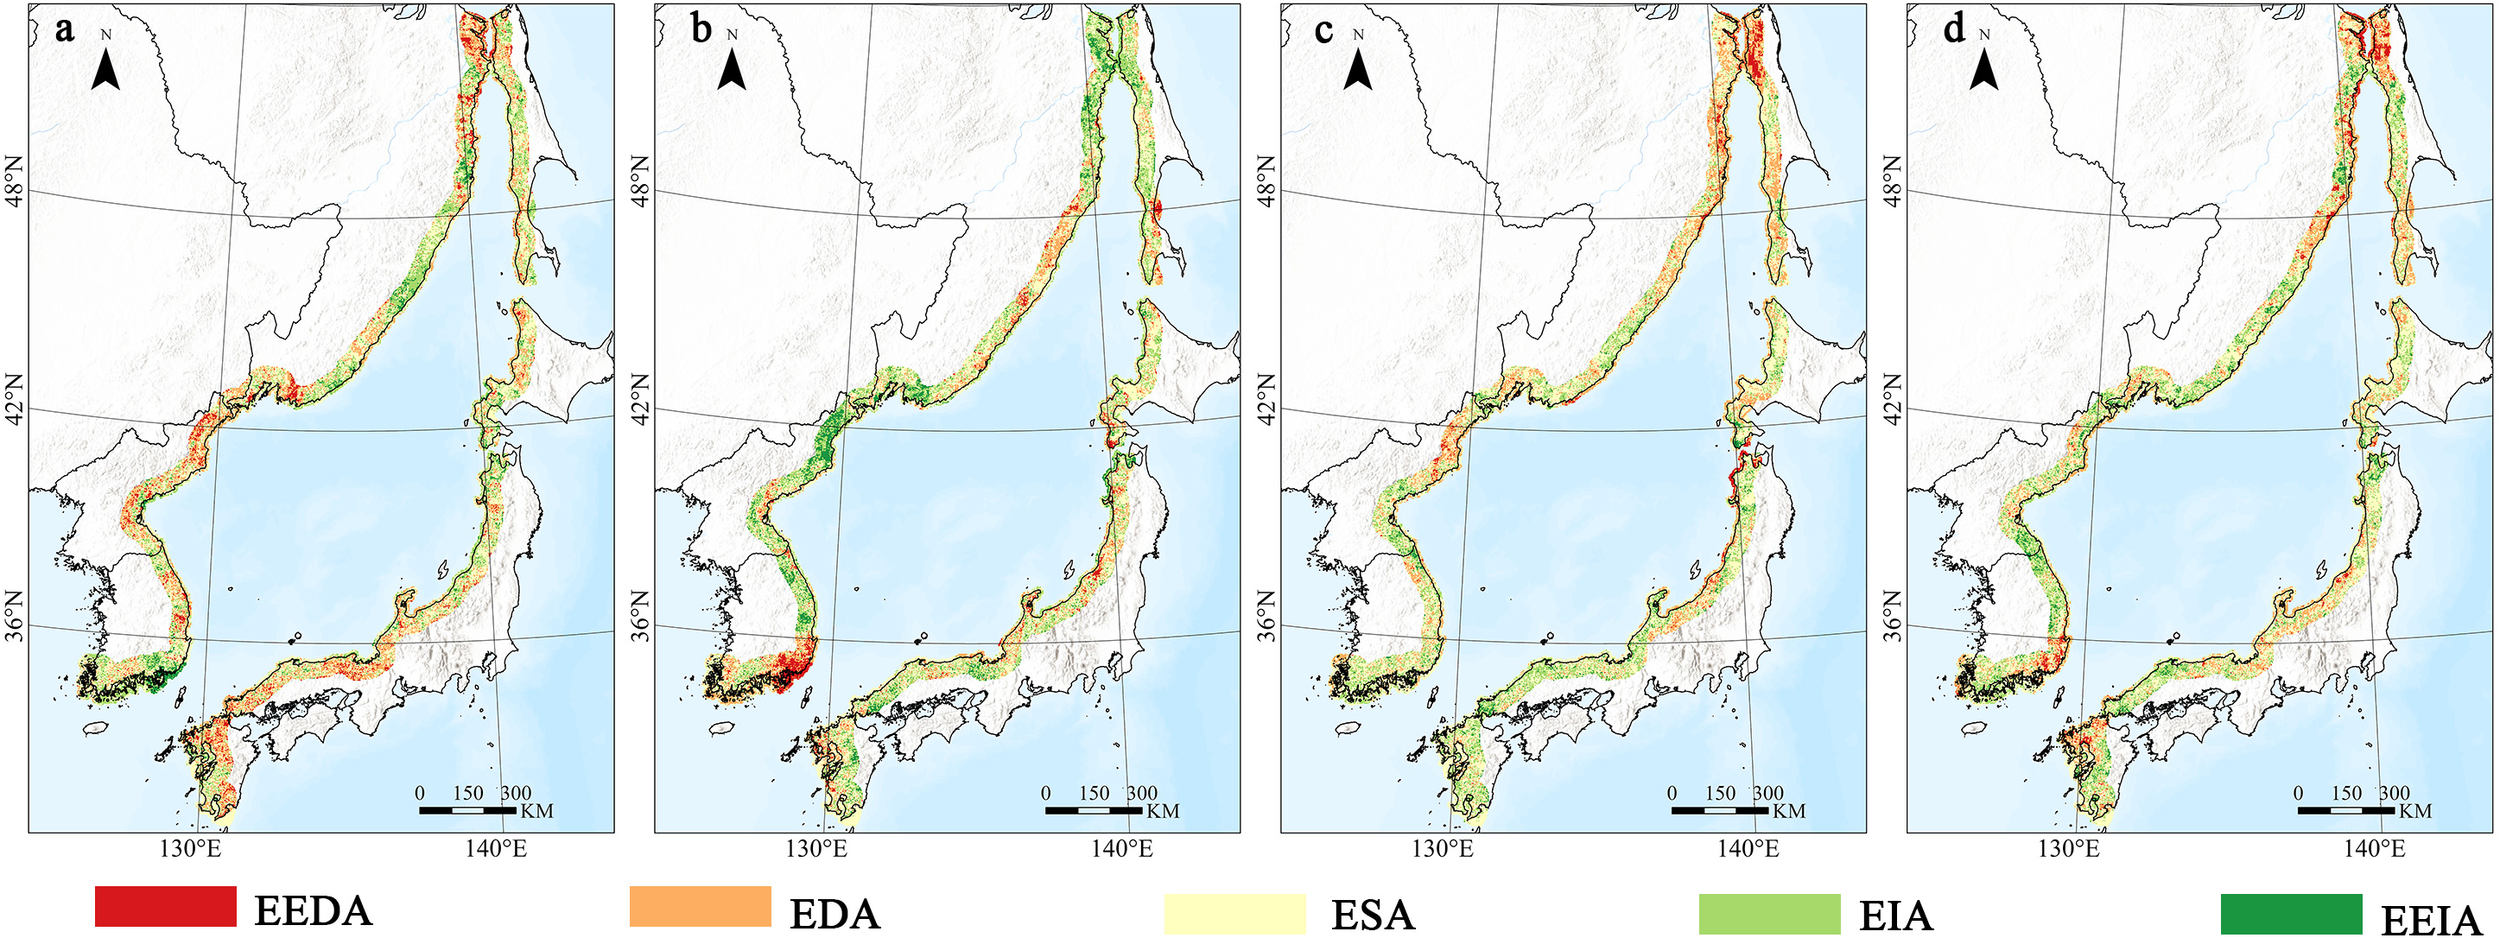
Spatial distribution map of landscape ecological risk transitions in transboundary coastal zones of Northeast Asia from 1990 to 2020. (a) 1990-2000; (b) 2000-2010; (c) 2010-2020; (d) 1990-2020.
Figure 6
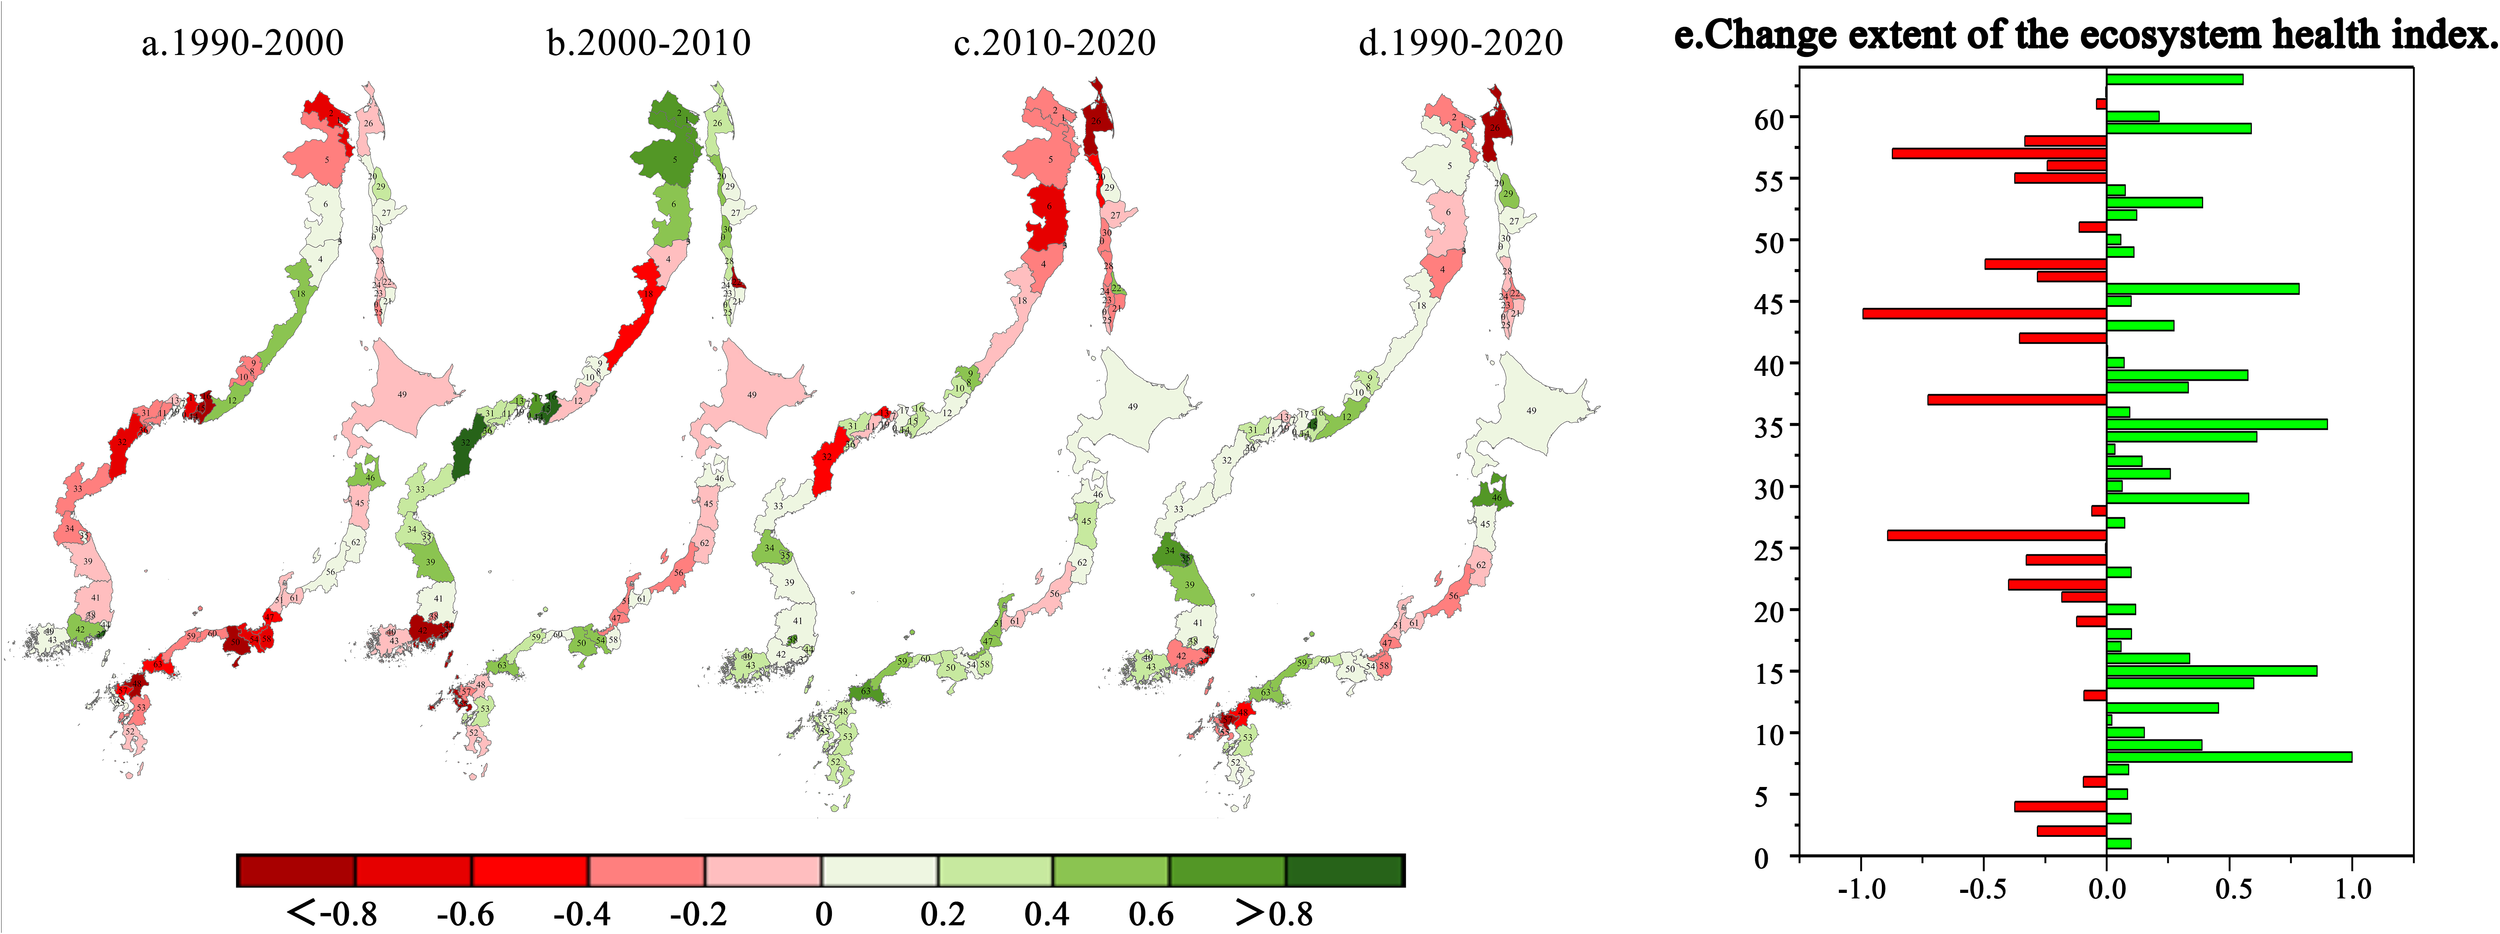
The ecological environment change trends of 63 coastal cities: negative values indicate deterioration, while positive values indicate improvement in environmental quality. Panels (a–c), and (d) represent the changes in coastal cities during different periods, and panel (e) shows the overall change in coastal cities over the past 30 years.
4 Discussion
4.1 Impact of human activities on ecological risk
The high ecological risk areas in ROK are primarily influenced by rapid urbanization. The increasing impermeable surfaces in the southeastern coastal industrial areas (mainly including Busan, Gyeongju, and Ulsan) have led to a reduction in cultivated land and forest areas, exacerbating ecological risks (Jin et al., 2019). Over the past 30 years, urbanized areas in the southeastern coastal cities of ROK have expanded 2.65 times, while coastal cultivated land has decreased by 13%. As a result, the ecological risk in the southeastern region has gradually shifted from Low to Medium Low and Medium, with the highest-risk High areas increasing by 33%. The expansion of impermeable surfaces and landscape fragmentation caused by urbanization have significantly reduced ecosystem service functions (Kang et al., 2018).It is noteworthy that in 2009, the ROK government revised the Coastal Management Act, granting local governments the authority to manage coasts independently (Chung et al., 2015), indicating ROK’s proactive attitude towards coastal protection. This landscape fragmentation due to rapid urbanization essentially reflects the disruption of ecological processes by urban development. Based on the current source-sink theory in landscape ecology, it is recommended to maintain certain ecological corridors in industrial areas within the existing regulatory framework (Tang et al., 2020), while also adopting the ecological red line system (Hu et al., 2020) to implement stricter urban growth boundary controls.
Japan’s urbanization process began earlier, and the challenges it faces in terms of ecological risk lie in the conflict between high-density urbanization and limited land resources. High-risk areas are mainly concentrated in Kyushu and central regions such as Toyama and Ishikawa Prefectures. For example, densely populated areas in Fukuoka Prefecture, Kyushu (with a population density of 1,000-5,514 people/km²), have transformed large amounts of agricultural and natural conservation land into residential and commercial areas (Yokohari et al., 2010; Irizuki et al., 2018). Over the past 30 years, cultivated land has decreased by 21%, and both forests and coastal wetlands have also decreased. This leads to a reduction in coastal ecosystem biodiversity, loss of habitats, and the disappearance of coastal wetlands, which also affects local fisheries and water quality.The ecological risk in Japan’s coastal areas exhibits typical features of high-density urbanization. Based on the Nature-based Solutions (NBS) concept (Lafortezza et al., 2018), it is recommended to implement a three-dimensional ecological compensation strategy. This would require high-density urban development projects to include sky gardens or vertical forests, equivalent to a certain proportion of the land area. These measures, through the use of three-dimensional space rather than horizontal expansion, can alleviate land pressure and ensure the continuity of certain ecological processes even in areas with high urban density.
The increase in ecological risk in DPRK is primarily attributed to deforestation and the conversion of agricultural land, with intensive land use leading to land degradation (e.g., in North Hamgyong Province). DPRK has the highest proportion of bare land among the five countries, and cultivated land is also experiencing degradation due to improper management (a decrease of about 39%). Forests have been converted into grasslands, weakening the stability of the ecosystem’s structure. While urbanization in DPRK is relatively low, its areas with Medium High and High ecological risks account for an average of 29%, which is lower than Japan and ROK but much higher than Russia (12%) and China (18%). Intensive agricultural land conversion has destroyed natural ecosystems, leading to habitat loss and a decline in biodiversity (Yao et al., 2024). Deforestation has reduced vegetation cover, and the increase in bare land has further triggered erosion risks.However, the Ten-Year Forest Restoration Plan implemented between 2000 and 2010 reduced ecological risks. The restoration of forests helped decrease landscape fragmentation and isolated patches, which is beneficial for ecosystem stability (Colombo et al., 2012; Mori et al., 2017). Despite this, the ecological environment quality has declined after 2010 (Figure 4c), indicating that environmental problems are often long-term and complex. Given DPRK’s unique national circumstances, it is recommended to combine forest restoration with food security strategies. In severely degraded areas like North Hamgyong Province, the cultivation of salt-tolerant economic crops such as seabuckthorn can be promoted. This agroforestry system not only helps to prevent soil erosion but also provides additional economic benefits through fruit processing industries.
4.2 The impact of natural factors on ecological risk
Russia faces ecological risks primarily from coastal erosion affecting natural wetlands, leading to the degradation and fragmentation of coastal wetlands. This is particularly evident in the western coastal wetlands of Sakhalin Island, where the area of marshes and sediment drainage zones exceeds 200 km² (Afanas’ev, 2023). The coastal terraces experience erosion at a rate of 1.9 × 10⁵ m³ per year, with over 50% of this area consisting of peatlands and shallow silty sediments rich in organic carbon, which are particularly vulnerable to erosion (Afanas’ev, 1991). The ecological risk level in these areas has gradually shifted from Medium and Medium Low to Medium High. These coastal erosion processes lead to wetland degradation and fragmentation, resulting in the loss of habitats and biodiversity (Duan et al., 2022).Although there is minimal human activity in this region, its unique natural geographic features contribute to a relatively high Ecological Risk Index (ERI). To address coastal erosion, vegetation buffer zones dominated by salt-tolerant species should be established along the coastal erosion front to effectively reduce hydrodynamic scour (Benazir et al., 2024). Additionally, peatland carbon sink monitoring technologies should be developed, prioritizing the protection of high-value wetland areas by quantifying organic carbon loss rates. It is important to note that natural erosion processes are often difficult to completely prevent, but establishing an early warning system can provide critical time for species migration and conservation efforts (Wang et al., 2023).
4.3 Limitations and future directions
This study used Landsat data to visually interpret the spatial distribution of nearshore aquaculture ponds, finding that aquaculture ponds are primarily located in the southern part of Japan, with offshore farming being the dominant method. However, the study also identified several limitations. Since aquaculture ponds share similar spectral characteristics with seawater in bands such as blue and green, confusion may occur at the boundaries of classifications, especially in turbid waters. To minimize errors, the study first used the normalized difference water index (NDWI) to highlight the edges of water bodies, combining historical data from Google Earth and RGB raster imagery for comprehensive interpretation. To ensure consistency in interpretation, the work was completed by a single researcher. Although this method may not identify all aquaculture ponds, the overall expansion trend of ponds is still clearly detectable. Additionally, the 30-meter spatial resolution (covering a 900m² area) may not capture the full extent of smaller aquaculture ponds, leading to an overall underestimation of their area. Since the time range of this study spans the past 30 years, commonly used high-resolution datasets such as Sentinel-2 (10-meter resolution) do not provide sufficient coverage in this region.We acknowledge the subjectivity inherent in visual interpretation. During the visual interpretation process, it was observed that the dominant aquaculture methods in the southern coastal areas were cage farming and raft farming. In the future, visual interpretation could be used as validation data, combined with high-resolution remote sensing data and deep learning technologies to improve the accuracy of pond identification. Moreover, it is important to further explore the potential ecological risks posed by aquaculture activities, particularly regarding water quality changes and species diversity.
Based on the regional differences in coastal ecological risks, future management policies should aim to build a nature-society collaborative resilience system: For ROK rapid urbanization, strict enforcement of urban growth boundary policies is needed. Legislation should establish inter-municipal ecological corridor networks to maintain connectivity between different urban and natural areas; In high-density urban areas such as Japan, three-dimensional spatial ecological compensation could be promoted. Future development policies should incorporate the construction of sky gardens/vertical forests as a condition for land development permits, advancing the creation of sky ecosystem. For DPRK and other agriculture-driven regions, the future should focus on developing a model that combines economic crop cultivation + ecological restoration. Exploring the implementation of carbon trading mechanisms for the restoration of degraded farmland could also be beneficial. This would involve planting economic crops to generate verifiable carbon credits, attracting international climate finance support, such as the UN’s REDD+ (Reducing Emissions from Deforestation and Forest Degradation) program; For areas in Russia and other regions affected by natural erosion, the development of a carbon loss-erosion rate correlation model is necessary. Priority protection should be implemented based on the carbon storage value of peatlands, ensuring the preservation of these valuable ecosystems. At the same time, it is recommended to establish an international coastal ecosystem database. Machine learning could be utilized to predict risk transmission paths under various scenarios, providing decision support for adaptive management strategies in response to ecological risks.
5 Conclusions
This study integrates the LERI and the LEQI to create a more comprehensive ecological risk assessment framework. The aim is to identify the current health status of coastal landscapes, potential risk changes, and to reveal ecological risk hotspot areas under various driving factors.The findings of this study provide scientific evidence for governments in Northeast Asia to develop future coastal protection policies and implement ecological restoration measures. By identifying current high-risk areas, this research offers guidance for future ecological restoration priorities, resource protection, and sustainable land-use planning in these regions. Furthermore, these findings also serve as a reference for cross-border ecological risk early warning systems and long-term monitoring, promoting coordinated cooperation between countries in ecological governance.The risk identification and assessment have facilitated the achievement of the United Nations Sustainable Development Goals (SDGs) 11 (Sustainable Cities) and 14 (marine eco-environment protection).
Statements
Data availability statement
The original contributions presented in the study are included in the article/supplementary material. Further inquiries can be directed to the corresponding author.
Author contributions
PT: Conceptualization, Data curation, Formal Analysis, Investigation, Methodology, Visualization, Writing – original draft. MP: Investigation, Writing – review & editing. XW: Formal Analysis, Investigation, Writing – review & editing. ZX: Funding acquisition, Project administration, Supervision, Writing – review & editing.
Funding
The author(s) declare financial support was received for the research and/or publication of this article. This study was supported by the National Natural Science Foundation of China (grant number 42276177), and the Natural Science Foundation of Jilin Province (grant number: YDZJ202401395ZYTS).
Acknowledgments
Thank you to the National Natural Science Foundation of China and the Natural Science Foundation of Jilin Province for supporting this project.
Conflict of interest
The authors declare that the research was conducted in the absence of any commercial or financial relationships that could be construed as a potential conflict of interest.
Publisher’s note
All claims expressed in this article are solely those of the authors and do not necessarily represent those of their affiliated organizations, or those of the publisher, the editors and the reviewers. Any product that may be evaluated in this article, or claim that may be made by its manufacturer, is not guaranteed or endorsed by the publisher.
References
1
Adeyeri O. E. Akinsanola A. A. Ishola K. A. (2017). Investigating surface urban heat island characteristics over Abuja, Nigeria: Relationship between land surface temperature and multiple vegetation indices. Remote Sens. Appl.7, 57–68. doi: 10.1016/j.rsase.2017.06.005
2
Afanas’ev V. V. (1991). Coastal erosion of northwestern Sakhalin. In Coastal zone of the Far Eastern seas (pp. 98–104). Moscow: Publishing House of the GO USSR.
3
Afanas’ev V. V. (2023). “Biogenic morpholitogenesis on sea coasts sakhalin island,” in Processes in GeoMedia—Volume VII. Ed. ChaplinaT. (Springer Nature, Singapore), 221–229. doi: 10.1007/978-981-99-6575-5_22
4
Ahmadi Mirghaed F. Souri B. (2022). Spatial analysis of soil quality through landscape patterns in the Shoor River Basin, Southwestern Iran. CATENA211, 106028. doi: 10.1016/j.catena.2022.106028
5
Benazir Triatmadja R. Syamsidik Nizam Warniyati (2024). Vegetation-based approached for tsunami risk reduction: Insights and challenges. Prog. Disaster Sci.23, 100352. doi: 10.1016/j.pdisas.2024.100352
6
Chung M. G. Kang H. Choi S.-U. (2015). Assessment of coastal ecosystem services for conservation strategies in South Korea. PLoS One10, e0133856. doi: 10.1371/journal.pone.0133856
7
Colombo S. J. Chen J. Ter-Mikaelian M. T. McKechnie J. Elkie P. C. MacLean H. L. et al . (2012). Forest protection and forest harvest as strategies for ecological sustainability and climate change mitigation. For. Ecol. Manage.281, 140–151. doi: 10.1016/j.foreco.2012.06.016
8
Cracknell A. P. (1999). Remote sensing techniques in estuaries and coastal zones an update. Int. J. Remote Sens.20, 485–496. doi: 10.1080/014311699213280
9
De Montis A. Martín B. Ortega E. Ledda A. Serra V. (2017). Landscape fragmentation in Mediterranean Europe: A comparative approach. Land Use Policy64, 83–94. doi: 10.1016/j.landusepol.2017.02.028
10
De Montis A. Serra V. Ganciu A. Ledda A. (2020). Assessing landscape fragmentation: A composite indicator. Sustainability12, 9632. doi: 10.3390/su12229632
11
Deng Y. Wu C. Li M. Chen R. (2015). RNDSI: A ratio normalized difference soil index for remote sensing of urban/suburban environments. Int. J. Appl. Earth Observation Geoinformation39, 40–48. doi: 10.1016/j.jag.2015.02.010
12
Du L. Dong C. Kang X. Qian X. Gu L. (2023). Spatiotemporal evolution of land cover changes and landscape ecological risk assessment in the Yellow River Basin 2015–2020. J. Environ. Manage.332, 117149. doi: 10.1016/j.jenvman.2022.117149
13
Duan H. Yu X. Zhang L. Xia S. Liu Y. Mao D. et al . (2022). An evaluating system for wetland ecological risk: Case study in coastal mainland China. Sci. Total Environ.828, 154535. doi: 10.1016/j.scitotenv.2022.154535
14
Egbueri J. C. (2020). Groundwater quality assessment using pollution index of groundwater (PIG), ecological risk index (ERI) and hierarchical cluster analysis (HCA): A case study. Groundwater Sustain. Dev.10, 100292. doi: 10.1016/j.gsd.2019.100292
15
Feng Y. Wang J. Bai Z. Reading L. (2019). Effects of surface coal mining and land reclamation on soil properties: A review. Earth-Science Rev.191, 12–25. doi: 10.1016/j.earscirev.2019.02.015
16
Feyisa G. L. Meilby H. Fensholt R. Proud S. R. (2014). Automated Water Extraction Index: A new technique for surface water mapping using Landsat imagery. Remote Sens. Environ.140, 23–35. doi: 10.1016/j.rse.2013.08.029
17
Gao P. Wang X. Wang H. Cheng C. (2020). Viewpoint: A correction to the entropy weight coefficient method by Shen et al. for accessing urban sustainability [Cities 42 (2015) 186–194. Cities103, 102742. doi: 10.1016/j.cities.2020.102742
18
Ghosh S. Mishra D. R. Gitelson A. A. (2016). Long-term monitoring of biophysical characteristics of tidal wetlands in the northern Gulf of Mexico — A methodological approach using MODIS. Remote Sens. Environ.173, 39–58. doi: 10.1016/j.rse.2015.11.015
19
Gong W. Duan X. Sun Y. Zhang Y. Ji P. Tong X. et al . (2023). Multi-scenario simulation of land use/cover change and carbon storage assessment in Hainan coastal zone from perspective of free trade port construction. J. Cleaner Production385, 135630. doi: 10.1016/j.jclepro.2022.135630
20
Guo J. Shen B. Li H. Wang Y. Tuvshintogtokh I. Niu J. et al . (2024). Past dynamics and future prediction of the impacts of land use cover change and climate change on landscape ecological risk across the Mongolian plateau. J. Environ. Manage.355, 120365. doi: 10.1016/j.jenvman.2024.120365
21
Hu T. Peng J. Liu Y. Wu J. Li W. Zhou B. (2020). Evidence of green space sparing to ecosystem service improvement in urban regions: A case study of China’s Ecological Red Line policy. J. Cleaner Production251, 119678. doi: 10.1016/j.jclepro.2019.119678
22
Irizuki T. Hirose K. Ueda Y. (2018). Ecological shifts due to anthropogenic activities in the coastal seas of the Seto Inland Sea, Japan, since the 20th century. Mar. pollut. Bull.127, 637–653. doi: 10.1016/j.marpolbul.2017.12.050
23
Jiang H. Feng M. Zhu Y. Lu N. Huang J. Xiao T. (2014). An automated method for extracting rivers and lakes from landsat imagery. Remote Sens.6, 5067–5089. doi: 10.3390/rs6065067
24
Jiao Z. Sun G. Zhang A. Jia X. Huang H. Yao Y. (2021). Water benefit-based ecological index for urban ecological environment quality assessments. IEEE J. Selected Topics Appl. Earth Observations Remote Sens.14, 7557–7569. doi: 10.1109/JSTARS.2021.3098667
25
Ju H. Niu C. Zhang S. Jiang W. Zhang Z. Zhang X. et al . (2021). Spatiotemporal patterns and modifiable areal unit problems of the landscape ecological risk in coastal areas: A case study of the Shandong Peninsula, China. J. Cleaner Production310, 127522. doi: 10.1016/j.jclepro.2021.127522
26
Kang T. S. Oh H. M. Lee E. I. Jeong K. Y. (2018). Disaster vulnerability assessment in coastal areas of korea. J. Coast. Res.85, 886–890. doi: 10.2112/SI85-178.1
27
Lafortezza R. Chen J. van den Bosch C. K. Randrup T. B. (2018). Nature-based solutions for resilient landscapes and cities. Environ. Res.165, 431–441. doi: 10.1016/j.envres.2017.11.038
28
Levine S. L. Giddings J. Valenti T. Cobb G. P. Carley D. S. McConnell L. L. (2019). Overcoming challenges of incorporating higher tier data in ecological risk assessments and risk management of pesticides in the United States: findings and recommendations from the 2017 workshop on regulation and innovation in agriculture. Integrated Environ. Assess. Manage.15, 714–725. doi: 10.1002/ieam.4173
29
Li X. (2021). TOPSIS model with entropy weight for eco geological environmental carrying capacity assessment. Microprocessors Microsystems82, 103805. doi: 10.1016/j.micpro.2020.103805
30
Li H. Wan W. Fang Y. Zhu S. Chen X. Liu B. et al . (2019). A Google Earth Engine-enabled software for efficiently generating high-quality user-ready Landsat mosaic images. Environ. Model. Software112, 16–22. doi: 10.1016/j.envsoft.2018.11.004
31
Li X. Yan H. Yang Y. Xu Z. Yang H. (2022). Spatiotemporal coastline variations in the Pearl River Estuary and the relationship with multiple human disturbances. Front. Mar. Sci.9. doi: 10.3389/fmars.2022.1032105
32
Ling H. Guo B. Yan J. Deng X. Xu H. Zhang G. (2020). Enhancing the positive effects of ecological water conservancy engineering on desert riparian forest growth in an arid basin. Ecol. Indic118, 106797. doi: 10.1016/j.ecolind.2020.106797
33
Luo M. Li T. (2021). Spatial and temporal analysis of landscape ecological quality in Yulin. Environ. Technol. Innovation23, 101700. doi: 10.1016/j.eti.2021.101700
34
Mentaschi L. Vousdoukas M. I. Pekel J.-F. Voukouvalas E. Feyen L. (2018). Global long-term observations of coastal erosion and accretion. Sci. Rep.8, 12876. doi: 10.1038/s41598-018-30904-w
35
Mo W. Wang Y. Zhang Y. Zhuang D. (2017). Impacts of road network expansion on landscape ecological risk in a megacity, China: A case study of Beijing. Sci. Total Environ.574, 1000–1011. doi: 10.1016/j.scitotenv.2016.09.048
36
Mori A. S. Lertzman K. P. Gustafsson L. (2017). Biodiversity and ecosystem services in forest ecosystems: a research agenda for applied forest ecology. J. Appl. Ecol.54, 12–27. doi: 10.1111/1365-2664.12669
37
Murray N. J. Phinn S. R. DeWitt M. Ferrari R. Johnston R. Lyons M. B. et al . (2019). The global distribution and trajectory of tidal flats. Nature565, 222–225. doi: 10.1038/s41586-018-0805-8
38
Mustard J. F. Defries R. S. Fisher T. Moran E. (2004). “Land-use and land-cover change pathways and impacts,” in Land Change Science: Observing, Monitoring and Understanding Trajectories of Change on the Earth’s Surface. Eds. GutmanG.JanetosA. C.JusticeC. O.MoranE. F.MustardJ. F.RindfussR. R.SkoleD.TurnerB. L.CochraneM. A. (Springer Netherlands, Dordrecht), 411–429. doi: 10.1007/978-1-4020-2562-4_24
39
Peng J. Liu Y. Pan Y. Zhao Z. Song Z. Wang Y. (2014). Study on the correlation between ecological risk due to natural disaster and landscape pattern-process: review and prospect. Adv. Earth Sci.29, 1186. doi: 10.11867/j.issn.1001-8166.2014.10.1186
40
Piao Y. Jeong S. Park S. Lee D. (2021). Analysis of land use and land cover change using time-series data and random forest in North Korea. Remote Sens.13, 3501. doi: 10.3390/rs13173501
41
Qian Y. Dong Z. Yan Y. Tang L. (2022). Ecological risk assessment models for simulating impacts of land use and landscape pattern on ecosystem services. Sci. Total Environ.833, 155218. doi: 10.1016/j.scitotenv.2022.155218
42
Ricotta C. Avena G. (2003). On the relationship between Pielou’s evenness and landscape dominance within the context of Hill’s diversity profiles. Ecol. Indic.2, 361–365. doi: 10.1016/S1470-160X(03)00005-0
43
Senjyu T. Shiota K. (2023). Revisit the upper portion of the Japan sea proper water: A recent structural change and freshening in the formation area. JGR Oceans128, e2022JC019094. doi: 10.1029/2022JC019094
44
Sreeparvathy V. Srinivas V. V. (2020). A fuzzy entropy approach for design of hydrometric monitoring networks. J. Hydrology586, 124797. doi: 10.1016/j.jhydrol.2020.124797
45
Tang Y. Gao C. Wu X. (2020). Urban ecological corridor network construction: an integration of the least cost path model and the inVEST model. ISPRS Int. J. Geo-Information9, 33. doi: 10.3390/ijgi9010033
46
Tu C. Ma H. Li Y. Fu C. You Z.-J. Newton A. et al . (2022). Transdisciplinary, co-designed and adaptive management for the sustainable development of rongcheng, a coastal city in China in the context of human activities and climate change. Front. Environ. Sci.10. doi: 10.3389/fenvs.2022.670397
47
Wang Y. Liao J. Ye Y. Fan J. (2022). Long-term human expansion and the environmental impacts on the coastal zone of China. Front. Mar. Sci.9. doi: 10.3389/fmars.2022.1033466
48
Wang S. Song Q. Zhao J. Lu Z. Zhang H. (2023). Identification of key areas and early-warning points for ecological protection and restoration in the yellow river source area based on ecological security pattern. Land12, 1643. doi: 10.3390/land12081643
49
Wang X. Xiao X. Zou Z. Chen B. Ma J. Dong J. et al . (2020). Tracking annual changes of coastal tidal flats in China during 1986–2016 through analyses of Landsat images with Google Earth Engine. Remote Sens. Environ.238, 110987. doi: 10.1016/j.rse.2018.11.030
50
Xiong Y. Xu W. Lu N. Huang S. Wu C. Wang L. et al . (2021). Assessment of spatial–temporal changes of ecological environment quality based on RSEI and GEE: A case study in Erhai Lake Basin, Yunnan province, China. Ecol. Indic.125, 107518. doi: 10.1016/j.ecolind.2021.107518
51
Xu J. Kang J. (2017). Comparison of ecological risk among different urban patterns based on system dynamics modeling of urban development. J. Urban Plann. Dev.143, 04016034. doi: 10.1061/(ASCE)UP.1943-5444.0000365
52
Xu H. Wang Y. Guan H. Shi T. Hu X. (2019). Detecting ecological changes with a remote sensing based ecological index (RSEI) produced time series and change vector analysis. Remote Sens.11, 2345. doi: 10.3390/rs11202345
53
Xu W. Wang J. Zhang M. Li S. (2021). Construction of landscape ecological network based on landscape ecological risk assessment in a large-scale opencast coal mine area. J. Cleaner Production286, 125523. doi: 10.1016/j.jclepro.2020.125523
54
Yang X. Peng L. L. H. Chen Y. Yao L. Wang Q. (2020). Air humidity characteristics of local climate zones: A three-year observational study in Nanjing. Building Environ.171, 106661. doi: 10.1016/j.buildenv.2020.106661
55
Yao Y. Zhang D. Nan Y. Jin S. Sun Y. (2024). Environmental degradation in the Korean Peninsula: Evidence from the environmental degradation index. Ecol. Indic.158, 111503. doi: 10.1016/j.ecolind.2023.111503
56
Yi H. (2021). Spatial and temporal dynamics of land change and the effects on ecosystem service values in the Republic of Korea (South korea) between the 1980s to the 2000s. J. Korean Geographical Soc.56, 675–704. doi: 10.22776/kgs.2021.56.6.675
57
Yokohari P. D. M. Amati M. Bolthouse J. Kurita H. (2010). Restoring urban fringe landscapes through urban agriculture: the Japanese experience. disP - Plann. Rev.46, 51–59. doi: 10.1080/02513625.2010.10557086
58
Yoo S. Park J. (2009). Why is the southwest the most productive region of the East Sea/Sea of Japan? J. Mar. Syst.78, 301–315. doi: 10.1016/j.jmarsys.2009.02.014
59
Yuan B. Fu L. Zou Y. Zhang S. Chen X. Li F. et al . (2021). Spatiotemporal change detection of ecological quality and the associated affecting factors in Dongting Lake Basin, based on RSEI. J. Cleaner Production302, 126995. doi: 10.1016/j.jclepro.2021.126995
60
Zeng Z. Wang D. Tan W. Huang J. (2019). Extracting aquaculture ponds from natural water surfaces around inland lakes on medium resolution multispectral images. Int. J. Appl. Earth Observation Geoinformation80, 13–25. doi: 10.1016/j.jag.2019.03.019
61
Zhang W. Chang W. J. Zhu Z. C. Hui Z. (2020). Landscape ecological risk assessment of Chinese coastal cities based on land use change. Appl. Geogr.117, 102174. doi: 10.1016/j.apgeog.2020.102174
62
Zhang F. Chen Y. Wang W. Jim C. Y. Zhang Z. Tan M. L. et al . (2022). Impact of land-use/land-cover and landscape pattern on seasonal in-stream water quality in small watersheds. J. Cleaner Production357, 131907. doi: 10.1016/j.jclepro.2022.131907
63
Zheng Z. Wu Z. Chen Y. Guo C. Marinello F. (2022). Instability of remote sensing based ecological index (RSEI) and its improvement for time series analysis. Sci. Total Environ.814, 152595. doi: 10.1016/j.scitotenv.2021.152595
64
Zhou Y. Dong J. Xiao X. Xiao T. Yang Z. Zhao G. et al . (2017). Open surface water mapping algorithms: A comparison of water-related spectral indices and sensors. Water9, 256. doi: 10.3390/w9040256
65
Zhu Z. Mei Z. Xu X. Feng Y. Ren G. (2022). Landscape ecological risk assessment based on land use change in the yellow river basin of Shaanxi, China. Int. J. Environ. Res. Public Health19, 9547. doi: 10.3390/ijerph19159547
66
Zou Z. Chen C. Liu Z. Zhang Z. Liang J. Chen H. et al . (2022). Extraction of aquaculture ponds along coastal region using U2-net deep learning model from remote sensing images. Remote Sens.14, 4001. doi: 10.3390/rs14164001
Summary
Keywords
coastal zone, ecological risk, northeast Asia, land cover change, vulnerability assessment
Citation
Tao P, Pei M, Wang X and Xu Z (2025) Urbanization as the main cause of ecological environment deterioration in cross-border coastal zones of northeast Asia. Front. Mar. Sci. 12:1484714. doi: 10.3389/fmars.2025.1484714
Received
22 August 2024
Accepted
10 July 2025
Published
08 August 2025
Volume
12 - 2025
Edited by
Shiqiang Du, Shanghai Normal University, China
Reviewed by
Jingwei Li, Shanghai Normal University, China
Martinez A. S., Universidade Federal de Sao Paulo, Brazil
Updates
Copyright
© 2025 Tao, Pei, Wang and Xu.
This is an open-access article distributed under the terms of the Creative Commons Attribution License (CC BY). The use, distribution or reproduction in other forums is permitted, provided the original author(s) and the copyright owner(s) are credited and that the original publication in this journal is cited, in accordance with accepted academic practice. No use, distribution or reproduction is permitted which does not comply with these terms.
*Correspondence: Zhen Xu, xuzhen@ybu.edu.cn
Disclaimer
All claims expressed in this article are solely those of the authors and do not necessarily represent those of their affiliated organizations, or those of the publisher, the editors and the reviewers. Any product that may be evaluated in this article or claim that may be made by its manufacturer is not guaranteed or endorsed by the publisher.