Abstract
Beachrocks are naturally cemented coastal sediments found in the intertidal zones of subtropical and tropical coasts, serving as vital coastal barriers against erosion—a protection increasingly crucial in an era of rising sea levels. Despite extensive research, the mechanisms underlying beachrock formation remain unresolved. A leading hypothesis is that cyanobacterial and algal mat photosynthesis elevates calcium carbonate saturation in seawater, thereby facilitating carbonate precipitation. However, the extent to which algal activity alters seawater saturation states to drive precipitation is not well understood. To advance eco-technological applications for coastal protection, an in-depth understanding and replication of beachrock formation processes in laboratory settings are essential. In this study, we examined carbonate cement precipitation beneath natural beachrock driven by cyanobacterial/algal mat photosynthesis and successfully replicated this process in the lab. Field observations showed that photosynthesis increased pH from 8.18 to 9.43, raising the carbonate saturation state (Ω) from 3.4 to 9.9. In laboratory experiments, pH similarly rose from 7.69 to 8.47, elevating Ω from 3.1 to 6.0 under light conditions. In both settings, the subsequent decline in total alkalinity confirmed calcium carbonate precipitation. Indeed, after three months of incubation, the carbonate sediments consolidated by acicular aragonite cement—matching the morphology observed in natural beachrock—achieved a compressive strength of 3 MPa. While this strength may support beach stabilization, further improvements are needed to enhance mechanical durability for practical coastal defense—yet these findings represent a foundational step toward developing eco-technological methods for enhancing coastal resilience against sea-level rise.
1 Introduction
Beachrocks are naturally cemented carbonate sands, gravels, and coastal sediments in general found in the intertidal zones of subtropical and tropical coasts, formed through natural cementation processes (Stoddart and Cann, 1965; Vousdoukas et al., 2007). They serve as valuable indicators of past shorelines and have been used to reconstruct sea-level change histories (e.g., Mauz et al., 2015; Evelpidou et al., 2019). The morphology and mineralogy of the carbonate cement that binds the sediments has been extensively studied using thin-section microscopy, scanning electron microscopy (SEM), energy-dispersive X-ray spectroscopy (EDS), X-ray diffraction (XRD), and other analytical methods. These cements are typically classified into three main types: acicular (fibrous or needle-like) aragonite, rim-type micritic high-magnesium calcite, and spar (prismatic) calcite (Vousdoukas et al., 2007; Mauz et al., 2015).
Several mechanisms have been proposed for beachrock formation, including seawater evaporation, seawater–groundwater mixing, CO2 degassing, and microbial/algal metabolic activity (Vousdoukas et al., 2007), with dominant processes varying by environmental setting. Early laboratory experiments demonstrated that physicochemical processes alone—such as mixing seawater with calcium carbonate-saturated freshwater—can induce carbonate precipitation (Thorsteson et al., 1972; Hanor, 1978). More recent studies emphasize the role of microbial/algal activity. Microscopic observations have confirmed that extracellular polymeric substances produced by cyanobacteria or algae, especially cyanobacteria, trap and bind sediment particles, contributing to cementation (Neumeier, 1999; Dupraz et al., 2009; Zhu and Dittrich, 2016).
Microbial/algal metabolic activities—particularly those that alter the carbonate chemistry—have also been shown to promote cementation. Processes such as urease activity and photosynthesis raise pH and increase the concentration of carbonate ions (CO32-), thereby enhancing the saturation state (Ω) of calcium carbonate and facilitating precipitation (Ariyanti, 2012; Zhu and Dittrich, 2016; Diaz and Eberli, 2022). Urease activity hydrolyzes urea to produce ammonia and CO32- (Equation 1), while photosynthesis consumes CO2 or bicarbonate (HCO3-), also increasing pH and CO32- levels (Equation 2). The resulting elevation in CO32- shifts the system toward supersaturation (Equation 3), promoting calcium carbonate precipitation.
While pH has frequently been monitored in both field and experimental settings (Hanor, 1978; Krumbein, 1979; McCutcheon et al., 2017; Ramachandran et al., 2020), measurements of Ω—the key indicator of carbonate precipitation potential—remain rare in biocementation studies related to beachrock. Accurate estimation of Ω requires pH and at least one additional parameter of the carbonate system (e.g., total alkalinity, CO2, or dissolved inorganic carbon), which is challenging to measure in small seawater volumes. Consequently, the dynamics of carbonate saturation during cementation remain poorly constrained.
Due to its stabilizing effect on sandy coastlines, beachrock has gained attention as a nature-based coastal protection measure, especially for coral reef coasts facing rising sea levels (Danjo and Kawasaki, 2013; 2014, 2016; McCutcheon et al., 2017; Heveran et al., 2020; Saitis et al., 2022). With sea-level rise projections reaching up to 1 meter by the end of this century (IPCC, 2021), the development of sustainable shoreline protection methods is increasingly urgent. Although many beachrocks are thought to form over millennia—making active observation and engineering enhancement difficult—several cases suggest formation over recent decades (Ariyanti, 2012; Omoto, 2014). These younger formations provide valuable insights into ongoing cementation processes and offer test beds for eco-engineering applications.
Accordingly, engineering approaches aimed at accelerating natural beachrock cementation are drawing increasing interest. Efforts have targeted both urease-driven biocementation (Danjo and Kawasaki, 2013; Saitis et al., 2022) and photosynthesis-induced cementation (Kamennaya et al., 2012; McCutcheon et al., 2016, 2017; Ramachandran et al., 2020) using microbial mats in laboratory and field environments. Most recently, Hibner et al. (2025) demonstrated initial carbonate cement crystallization within 150 days in a field study using cyanobacteria-dominated biofilms.
To support the development of eco-technological coastal protection, it is essential to accurately evaluate the saturation state (Ω), a critical driver of carbonate precipitation. Despite its importance, Ω has rarely been measured in past studies of beachrock biocementation, leaving a major gap in our understanding. This requires simultaneous measurement of at least two carbonate system parameters, such as pH and total alkalinity. In addition, the decrease in alkalinity is a direct and quantitative indicator of calcium carbonate precipitation. A clearer grasp of beachrock formation under both natural and controlled conditions is therefore needed. However, consistent evidence of cement precipitation replicated in both field and laboratory settings remains limited. To advance this approach, integrative field observations and controlled experiments are required leading to engineering solutions.
In this study, we investigated carbonate cementation at a site with active beachrock formation. We measured the saturation state of aragonite (Ω) using pH and total alkalinity (AT) and successfully replicated the natural cementation process under laboratory conditions that mimicked field Ω variability.
2 Materials and methods
2.1 Field survey
2.1.1 Study site
The study was conducted on beachrock located at Yoshihara on the north coast of Ishigaki Island in the southern Ryukyu Islands, Japan (Figure 1A). The distribution of the beachrock was initially identified through aerial photographs and satellite remote sensing, then verified with a field survey (Figure 1B). A topographic profile of the beachrock was measured using an auto level, referenced to sea level. Elevation data were subsequently corrected to mean sea level based on local tide tables (Japan Meteorological Agency). The tidal range at Yoshihara during spring tides ranges from -110 cm to +80 cm relative to mean sea level.
Figure 1
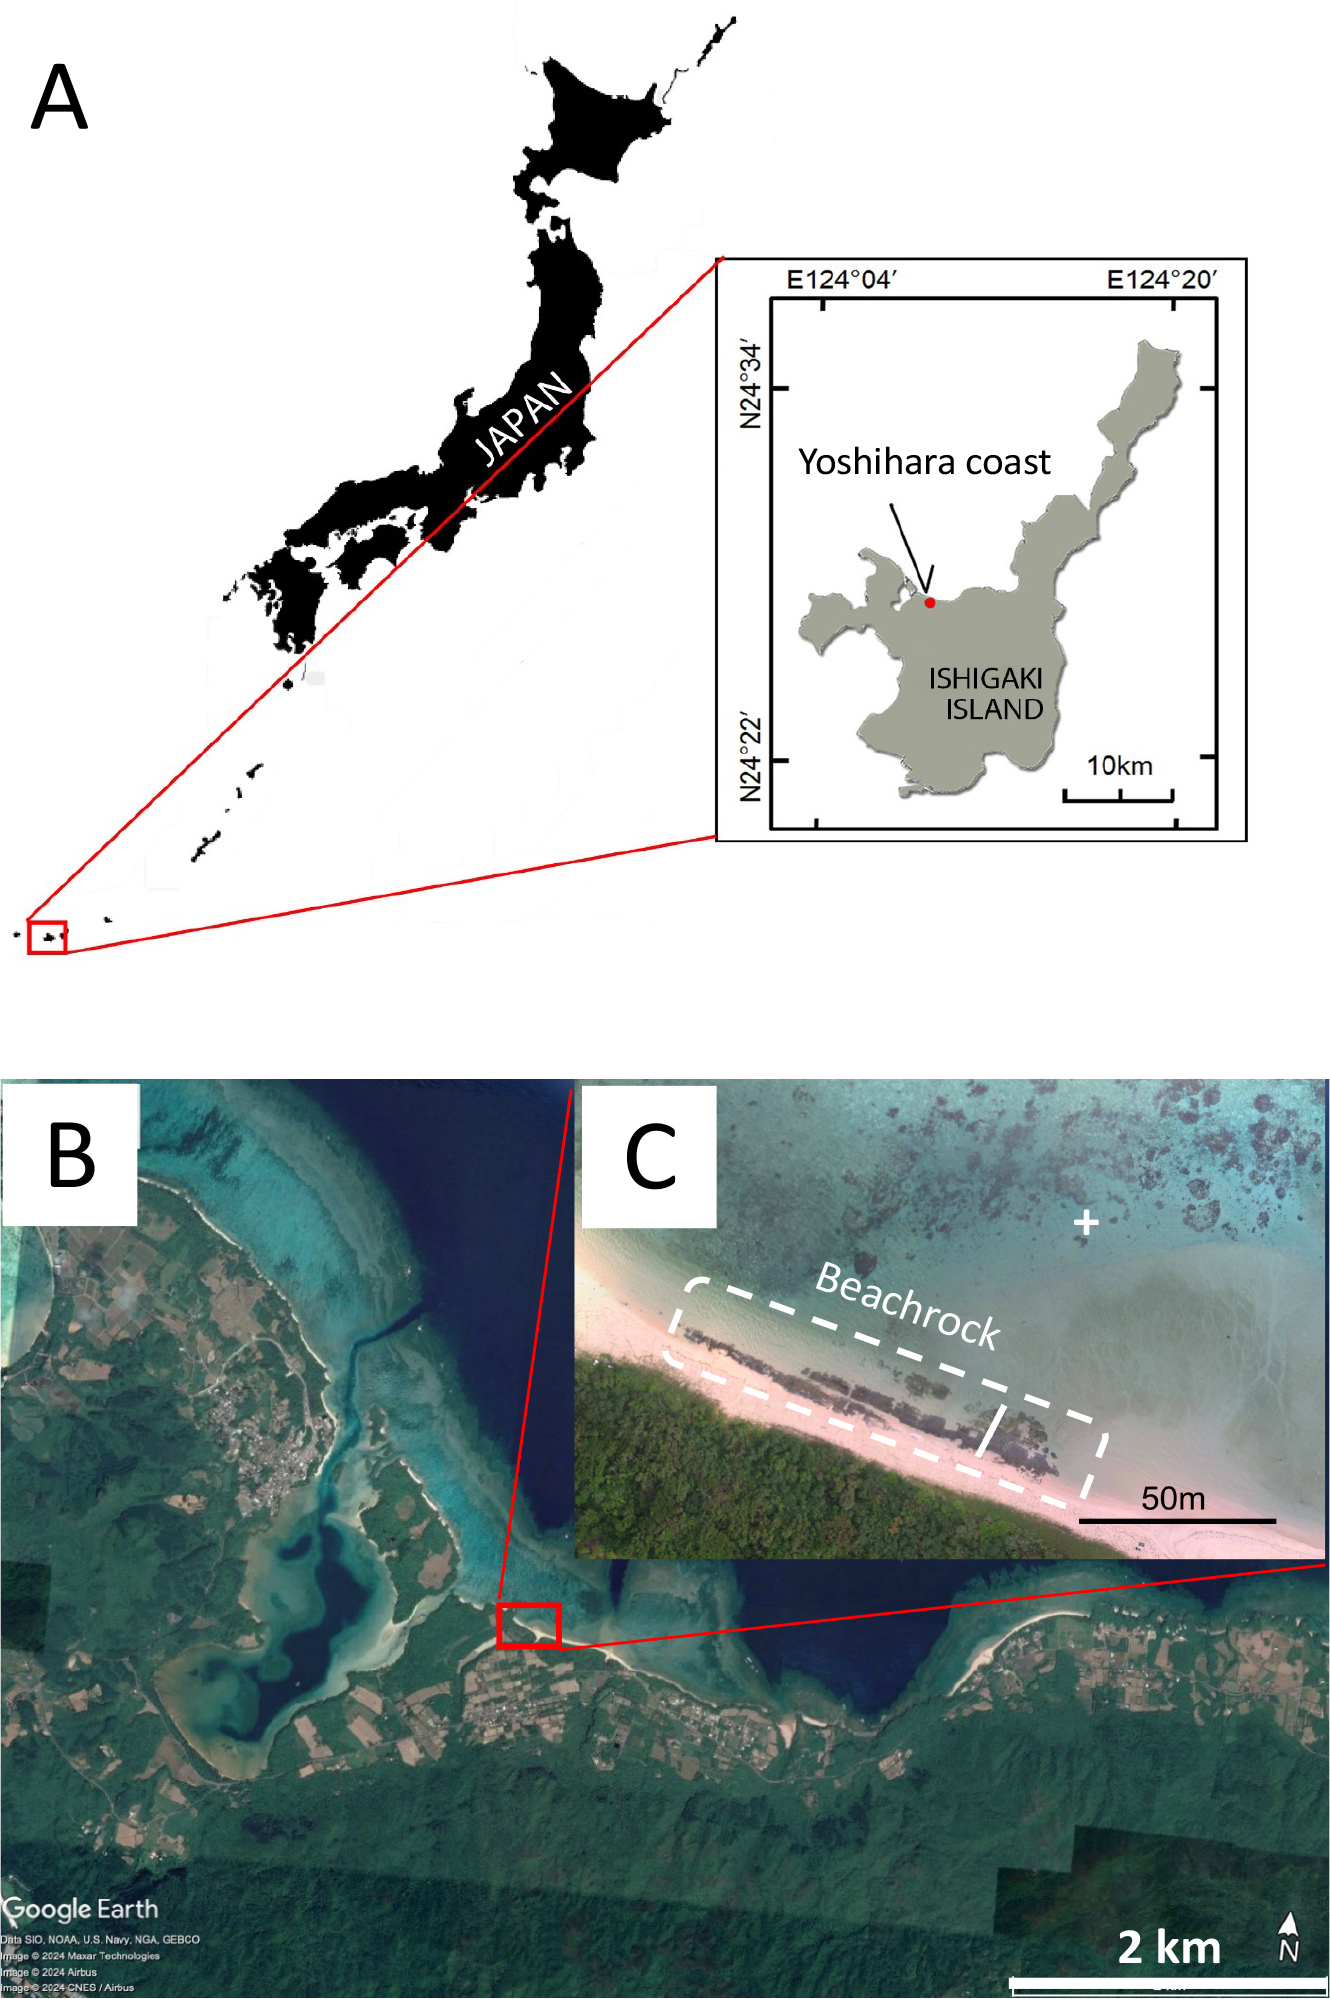
Location of study site, Yoshihara Coast, northern coast of Ishigaki Island, Ryukyu Islands. (A) Location of Yoshihara coast. (B) Enlarged image of Yoshihara coast (Image © March 19, 2021, Google Earth). (C) Enlarged image of the beachrock. The beachrock is outlined with a white broken line. The studied transect is indicated by a white line. The offshore sampling site was indicated by a white +.
Algal mats covering the surface of the beachrock were sampled by carefully peeling off the algae with tweezers. These samples were fixed in 10% seawater formalin and examined under a microscope for taxonomic identification.
2.1.2 Petrography
Core samples (150 mm in length and 30 mm in diameter) were collected from three points along a transect on the beachrock (Figure 2A). Surface hardness was measured at depths of 3 cm, 6 cm, and 12 cm using a soft-rock penetrometer (SH-70, Maruto Testing Machine Company) to assess the degree of cement consolidation with depth.
Figure 2
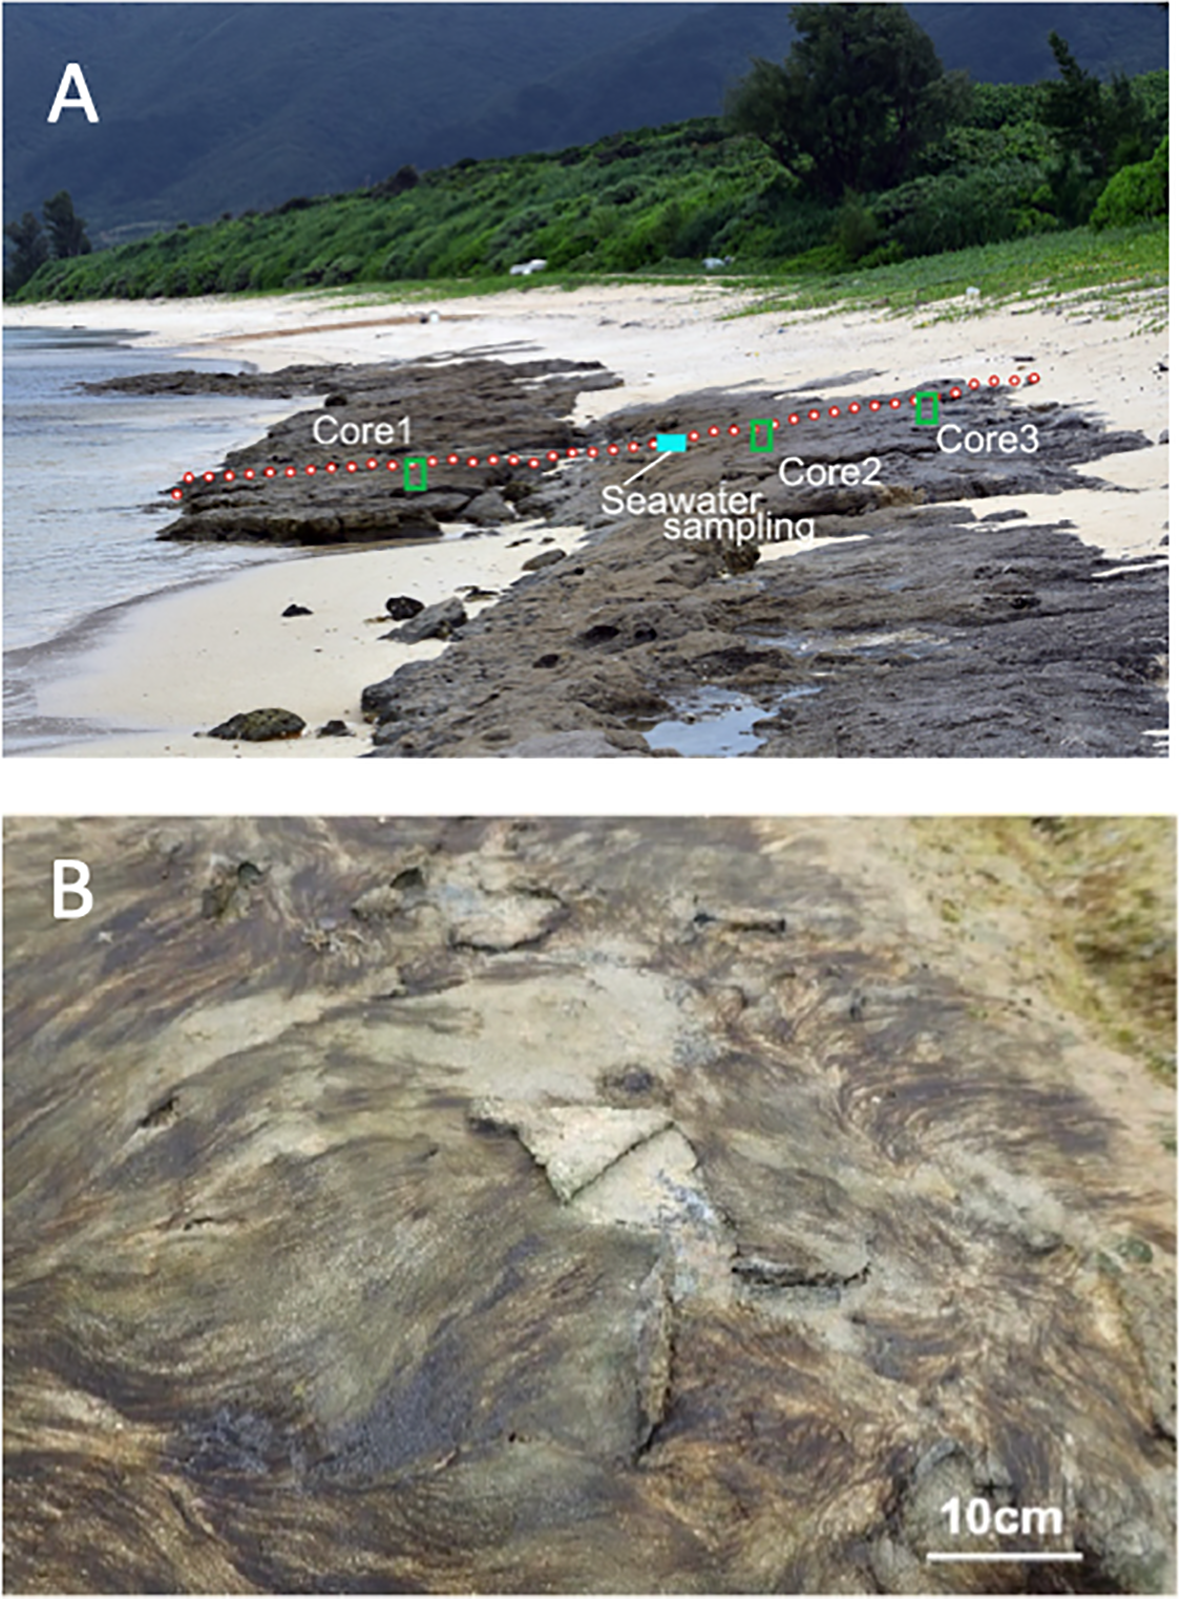
(A) Beachrock aligned along the coast with a gradient similar to the beach. (B) Cyanobacterial/algal mat covering the beachrock surface.
For fracture surface observations, samples were first dried in a desiccator to remove moisture. Cross-sectional analyses were performed by vacuum-impregnating the samples with a two-component epoxy resin (Stroas EpoFix), followed by surface polishing after curing. Gold coating was applied using a vacuum sputter coater (JEOL JEE-420T).
Specimens were examined with a scanning electron microscope (SEM; JEOL JSM-6490LV). SEM images were processed using Adobe Photoshop to distinguish sand and gravel grains from pore spaces, enabling quantification of porosity in each image. The micromorphology and elemental composition of the carbonate cement were analyzed using SEM coupled with energy-dispersive X-ray spectroscopy (SEM–EDX; JSM-6490LV, JEOL Ltd./Inca Energy 450, Oxford Instruments).
2.1.3 Measurement of carbonate chemistry
To monitor carbonate chemistry in the field, pH and total alkalinity (AT) of seawater within a tide pool on the beachrock were measured during low tide from 10:00 to 18:00 on September 9, 2017. A 50 mL seawater sample was collected hourly from a small, stagnant tide pool with a total volume of 5.5 L. Samples were analyzed for pH and AT on-site using an auto-burette titrator (ATT-05, Kimoto Electric Co. Ltd., Osaka, Japan), with analyses conducted within a few hours of collection. The saturation state of aragonite (Ω) was calculated based on the measured pH and AT (Lewis and Wallace, 1998). Concurrently, seawater was sampled 80 meters offshore 1 m depth for comparative analysis. Seawater temperature and photon flux density were measured using a Tidbit v2 Temperature Data Logger (Onset Co. Ltd.) and a DEFI2-L PAR Logger (JFE Advantech Co. Ltd.), respectively.
2.2 Laboratory experiment
In February 2017, a 3 mm-thick cyanobacterial/algal mat (10 cm × 10 cm) was carefully removed from the beachrock surface using a spatula, wrapped in seawater-saturated paper towels, and transported to the Hayama Marine Science Laboratory, Kajima Technical Research Institute. The mat was placed on a polypropylene fiber (PPF) mat (20 cm × 20 cm × 1 cm) within an aquarium (20 cm × 20 cm × 15 cm) and incubated under continuously circulated seawater (Supplementary Figure S1). The aquarium contained 2 L of seawater, circulated by a pump at a rate of 1 L min-1. To maintain water quality, two-thirds of the seawater was replaced monthly. Due to evaporation, salinity occasionally rose to 40–45 psu, and filtered freshwater was added every six days to restore salinity to 33–35 psu. The aquarium was illuminated by LED lights at a photon flux density of 800 µmol m-2 s-1 for 12 hours per day (06:00–18:00), followed by 12 hours of darkness. Water temperature and salinity were maintained at 25 ± 1 °C and 33–35 psu, respectively.
After four months, the cyanobacterial/algal mat had proliferated uniformly across the PPF substrate. Then, on 22 November 2017, coral sand and gravel (median diameter: 2.54 mm; 19% of particles <75 µm), collected from the Yoshihara coast near the beachrock, were washed with pure water, dried, and evenly spread over the mat to a thickness of 10 mm. Lighting, temperature, and circulation conditions were maintained throughout the experimental period. A control aquarium was prepared by placing the same thickness of coral sand on a PPF mat without the cyanobacterial/algal mat, under otherwise identical conditions.
On January 11–12, 2018, diurnal changes in carbonate chemistry in the experimental aquarium were monitored over a 24-hour period. Three months after the start of the experiment, on January 11, 2018, pH and total alkalinity (AT) were measured every three hours by sampling 60 mL of seawater from both the experimental and control aquaria. The aragonite saturation state (Ω) was calculated from the measured pH and AT values. Sand consolidation strength was assessed using a load cell (Imada Co. Ltd., Toyohashi, Japan). For petrographic analysis, consolidated sediment samples from the experimental aquarium were collected, embedded in epoxy resin, and thin-sectioned. The micromorphology and elemental composition of the precipitated cement were examined using scanning electron microscopy with energy-dispersive X-ray spectroscopy (SEM–EDX; JSM-6490LV, JEOL Ltd./Inca Energy 450, Oxford Instruments), following the same protocol as for the field samples.
3 Results
3.1 Field survey
3.1.1 Morphology and distribution of the beachrock
The beachrock at Yoshihara extends 75 m along the shore and spans 15 m in width covered by a cyanobacterial/algal mat (Figures 1C, 2A, B). This shoreline is shielded by a 300 m-wide coral reef flat, with a seaward reef crest exposed at low tide, creating a calm wave environment along the shore (Figure 1B). The beachrock formation exposed at the surface occurs between elevations of −23 cm and +113 cm relative to mean sea level with a distinct two-step profile divided by a 1:15 gradient slope (Figure 3). Beachrock possibly buried beneath beach sediments was not included in this survey. The mat is composed of a variety of filamentous cyanobacteria and green algae species (Figure 2B; Table 1). The seaward section of the beachrock, with a gradient less than 1:10, is mainly covered by green algae (Ulva spp.). The sloped area is primarily covered by cyanobacteria (Lyngbya confervoides and Hyella sp.), with a mat thickness of 3–5 mm. The landward section of the beachrock is nearly horizontal, black in color, and devoid of surface algae.
Figure 3
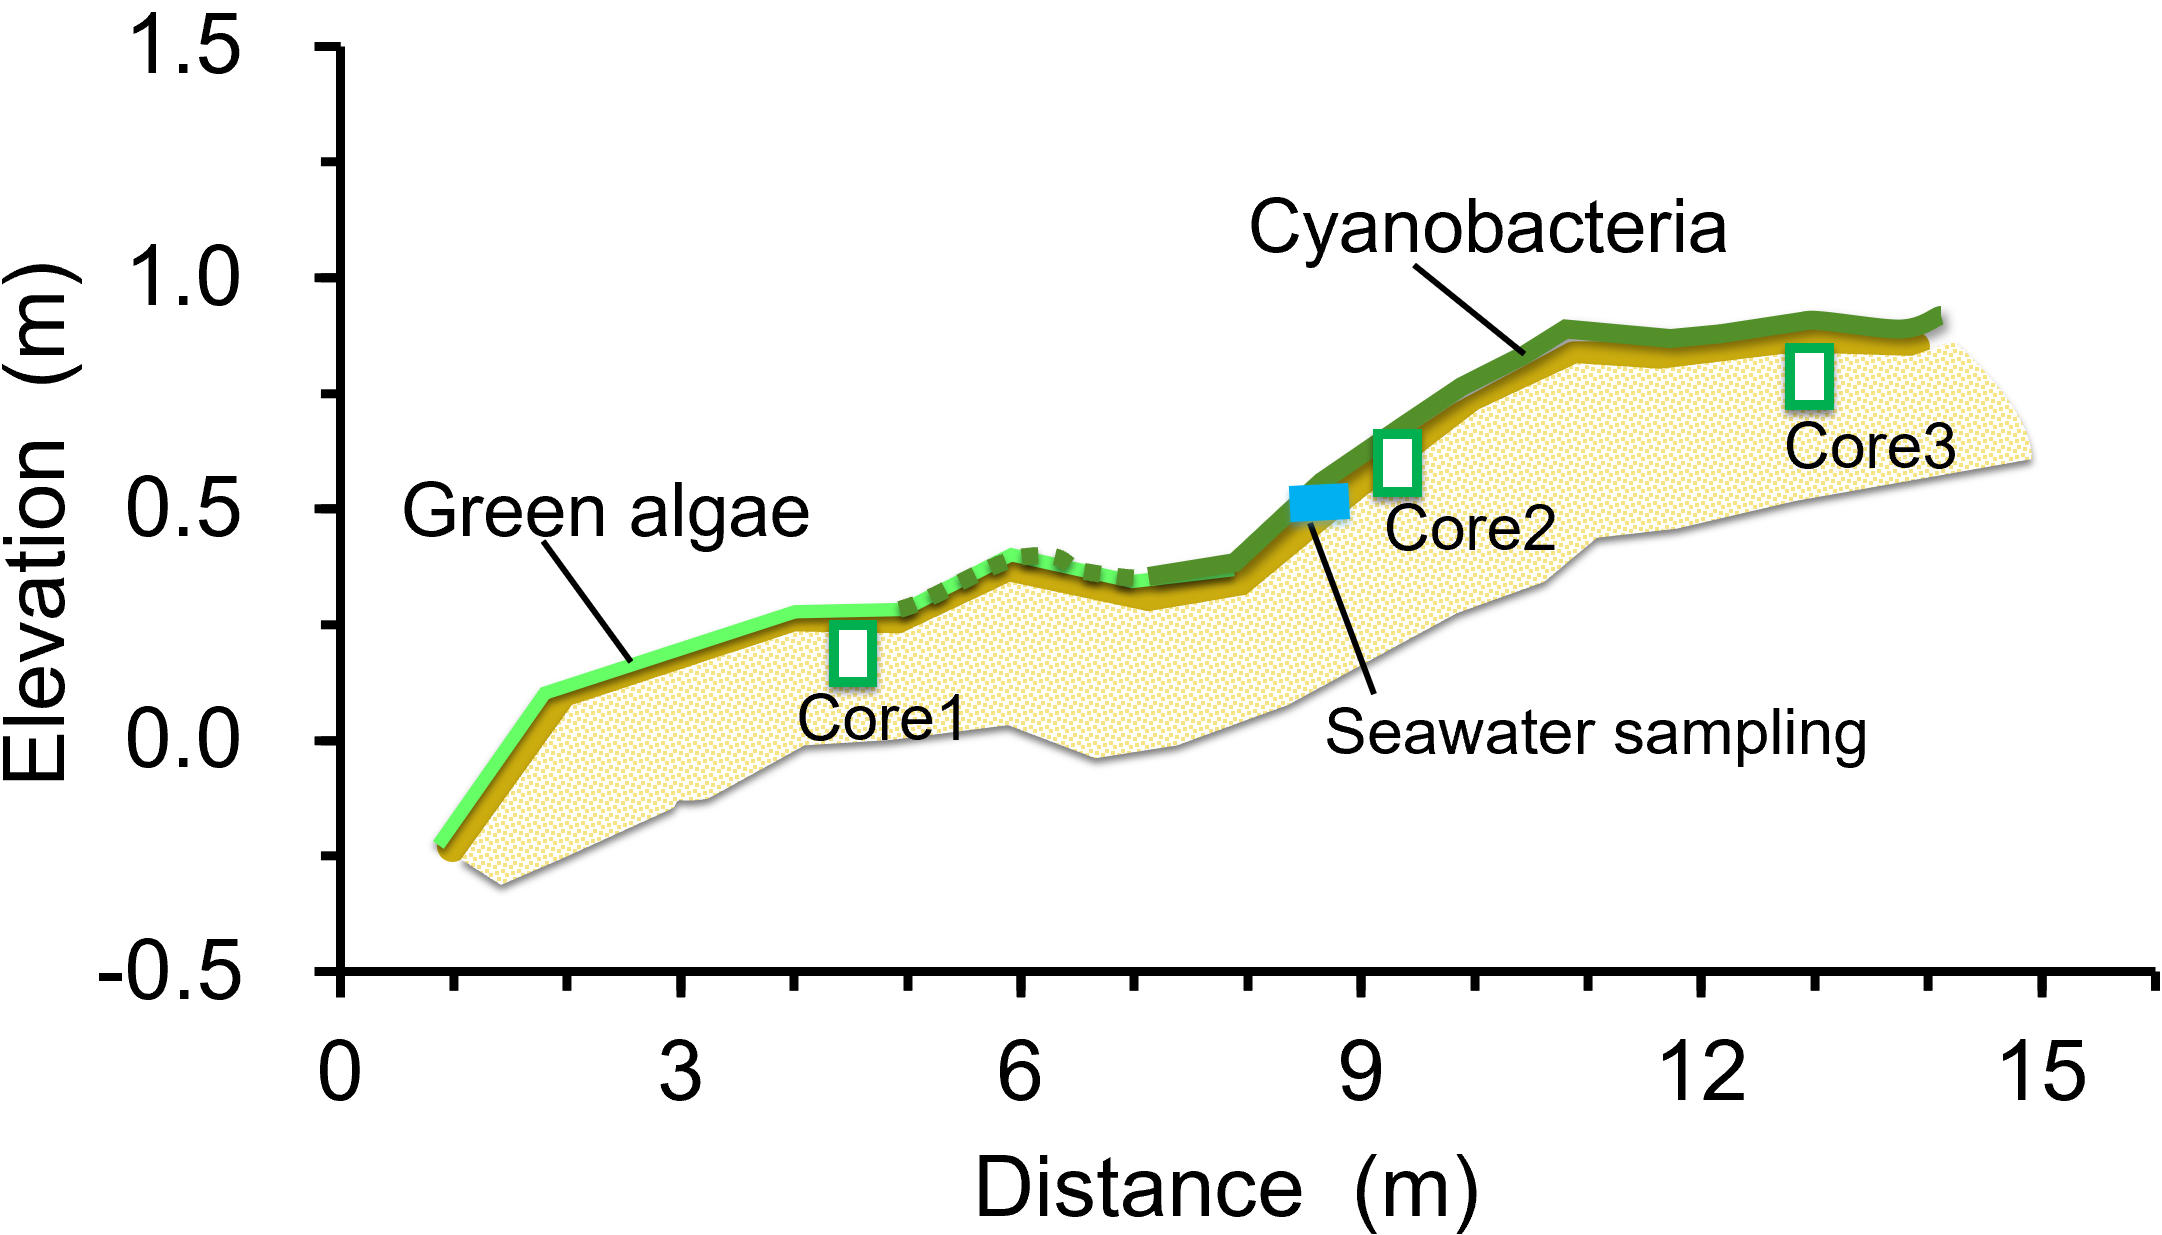
Transect section of the beachrock at Yoshihara, perpendicular to the shoreline. Elevation is in meters relative to mean sea level. The cyanobacterial/algal mat covering the beachrock surface is represented by light green and green lines. Blue rectangle indicates the tide pool at which seawater was sampled. Green open squares labeled Core 1, Core 2, and Core 3 indicate locations where core samples were collected for petrological analysis.
Table 1
| Natural beachrock | |
|---|---|
| Cyanobacteria | |
| Lyngbya confervoides | +++ |
| Hyella sp. | +++ |
| Aphanothece sp. | + |
| Plectonema terebrans | + |
| Green algae | |
| Monostroma nitidum | ++ |
| Ostreobium quekettii | |
| Ulva clathrate | ++ |
| Ulva compressa | ++ |
| Laboratory | |
|---|---|
| Cyanobacteria | |
| Hyella sp. | + |
| Hydrocoleum sp. | |
| Leptolyngbya sp. | + |
| Calothrix sp. | |
| Green algae | |
| Ulva spp. | ++ |
| Diatom | |
| Caloneis sp.* | |
Cyanobacteria and algae taxa identified in the mats in natural beachrock and the laboratory.
++: most dominant; ++: dominant; +: abundant; no mark: present.
*identified by SEM image.
Debris from electrical equipment was found tightly consolidated within the natural beachrock (Figure 4A). Additional anthropogenic materials, such as glass shards and aluminum can pull tabs, were also embedded within the sand and gravel matrix (Figure 4B). These findings suggest that this beachrock likely formed over the past several decades, and that its formation may still be ongoing.
Figure 4
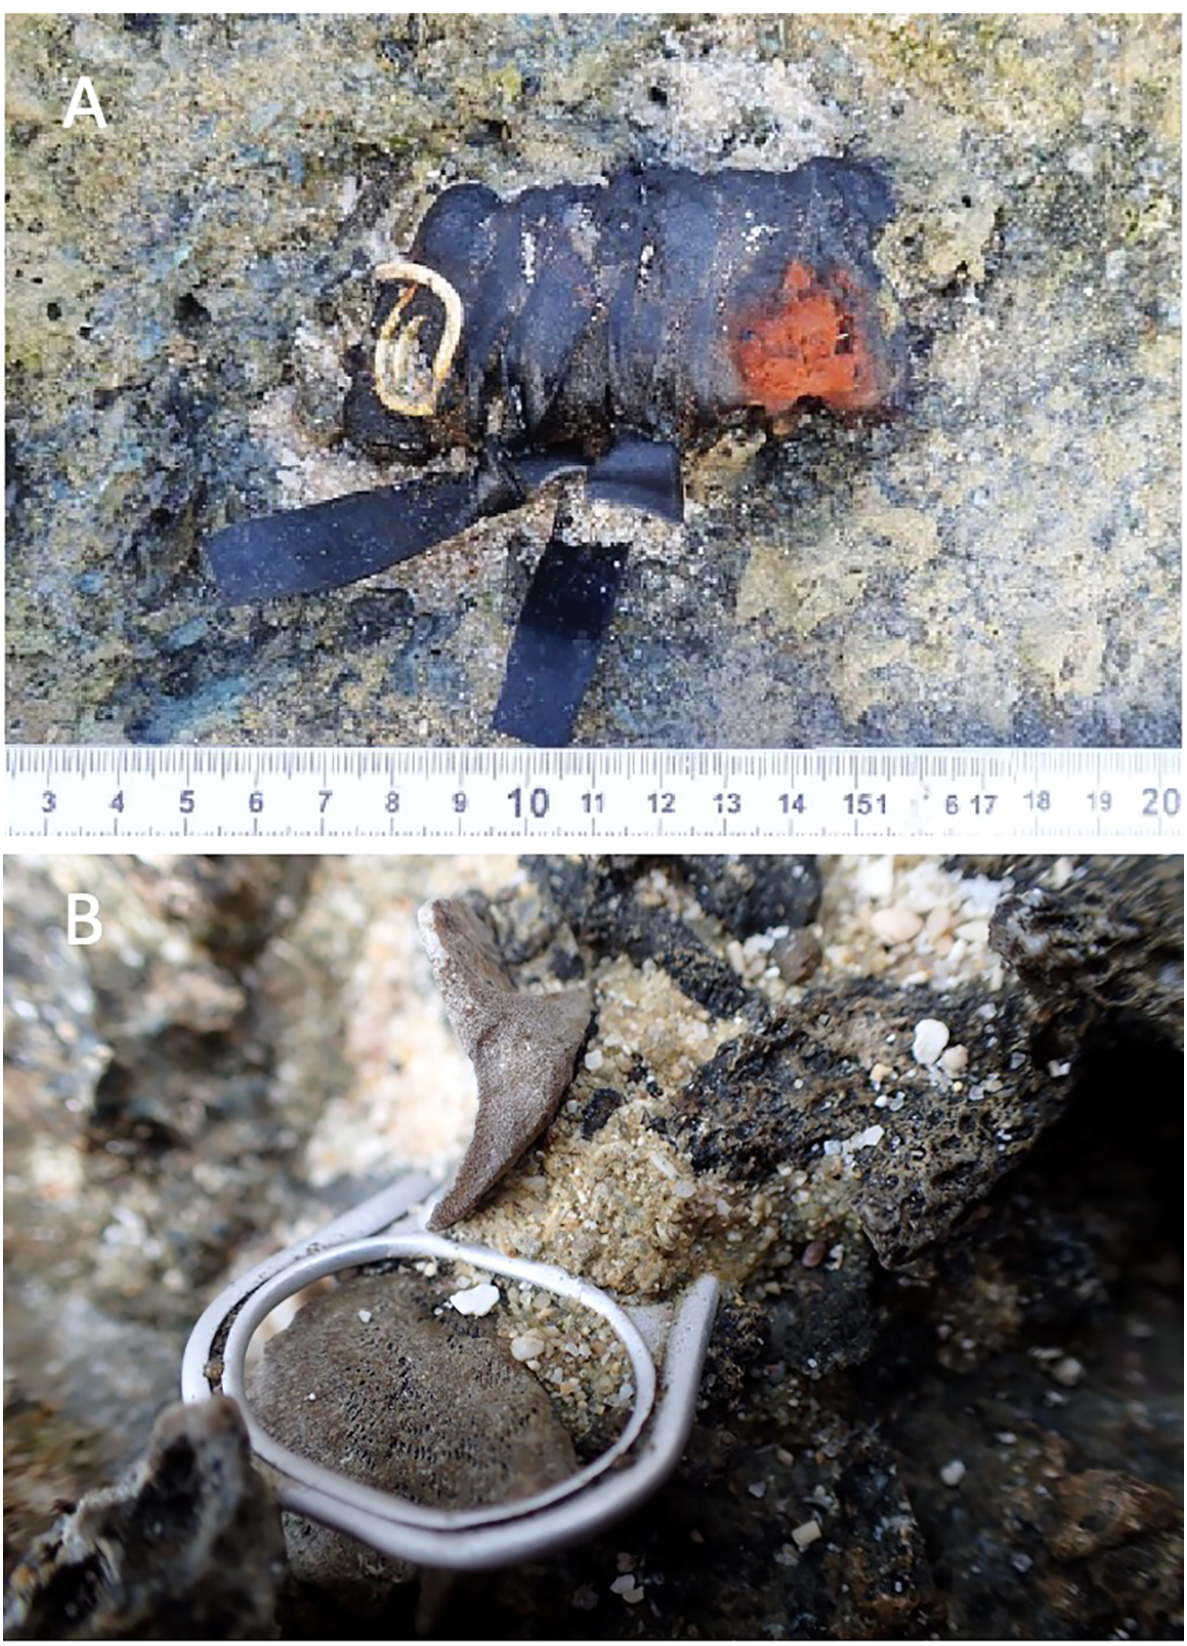
(A) Electrical equipment debris and (B) an aluminum beverage can pull tab consolidated within the beachrock along with sand and gravel.
3.1.2 Petrography
At the three core sampling sites (indicated by green rectangles in Figure 3), the surface strength of the beachrock ranged from 7–10 MPa, decreasing to 1.5–3 MPa at a depth of 6 cm (Figure 5A). Porosity ranged from 20% to 50%, with no significant variation observed with depth (Figure 5B). SEM observations of thin sections from the three cores revealed the following features: in Core 1, coral and shell fragments measuring 0.1 to several millimeters just under cyanobacteria mat were consolidated by rim-type micrite cement (Figure 6A). In Core 2, fine coral fragments ranging from 0.1 to 0.5 mm were observed, similarly consolidated with cyanobacteria (Figure 6B). In Core 3, foraminiferal shells approximately 2 mm in size were cemented together by rim cements (Figure 6C).
Figure 5
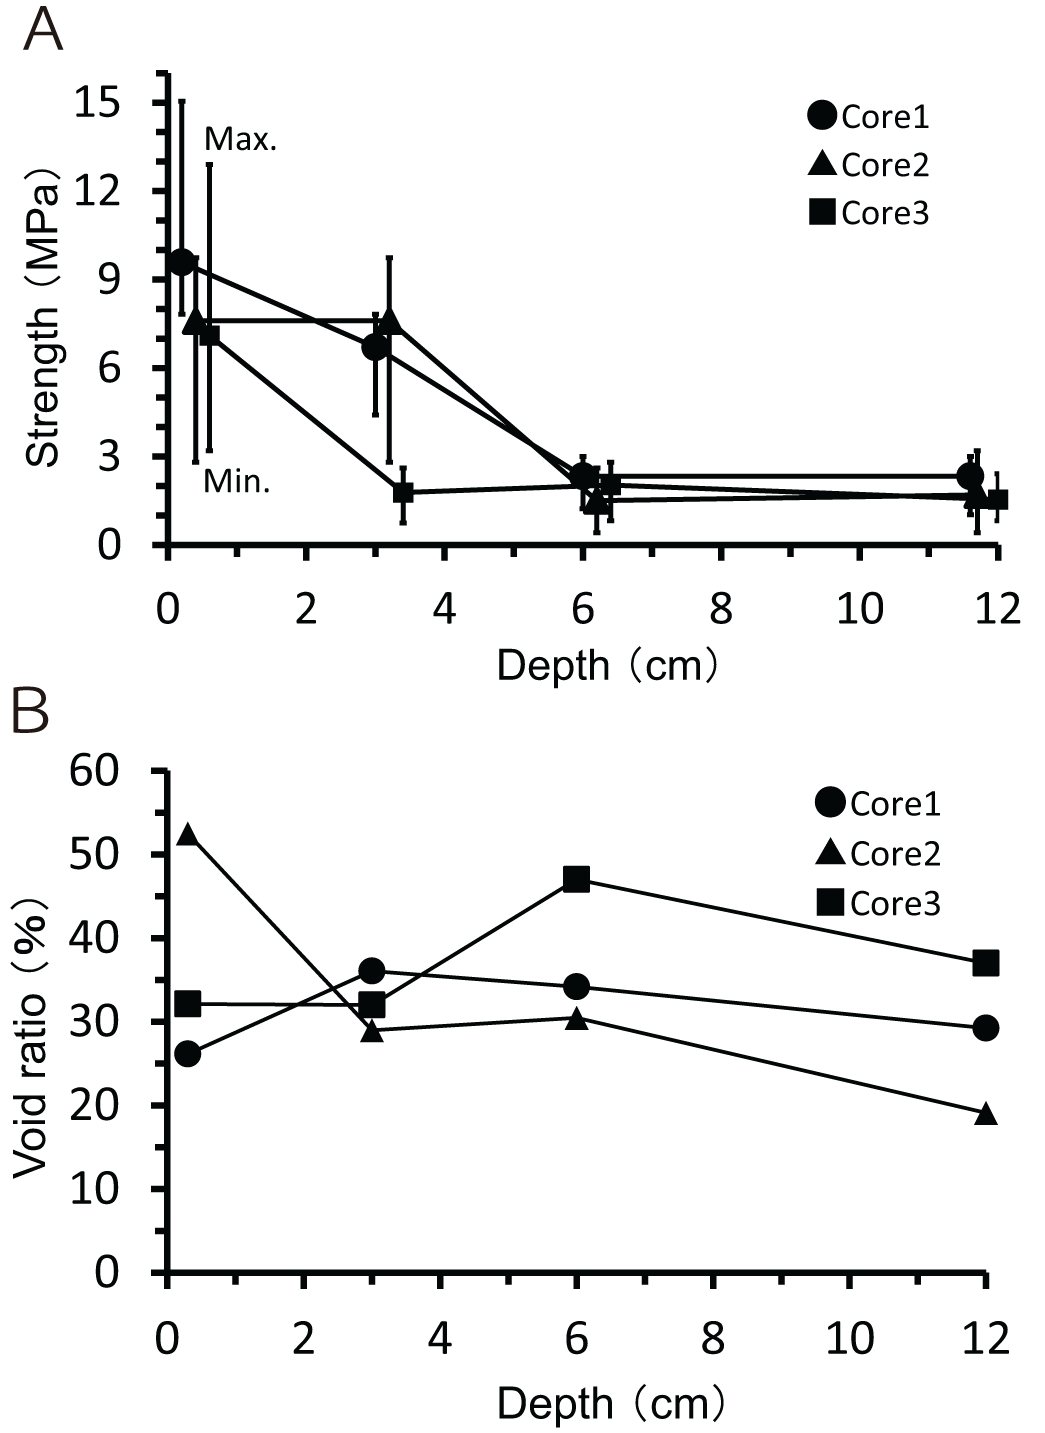
(A) Strength and (B) porosity of the beachrock in cores 1, 2 and 3.
Figure 6
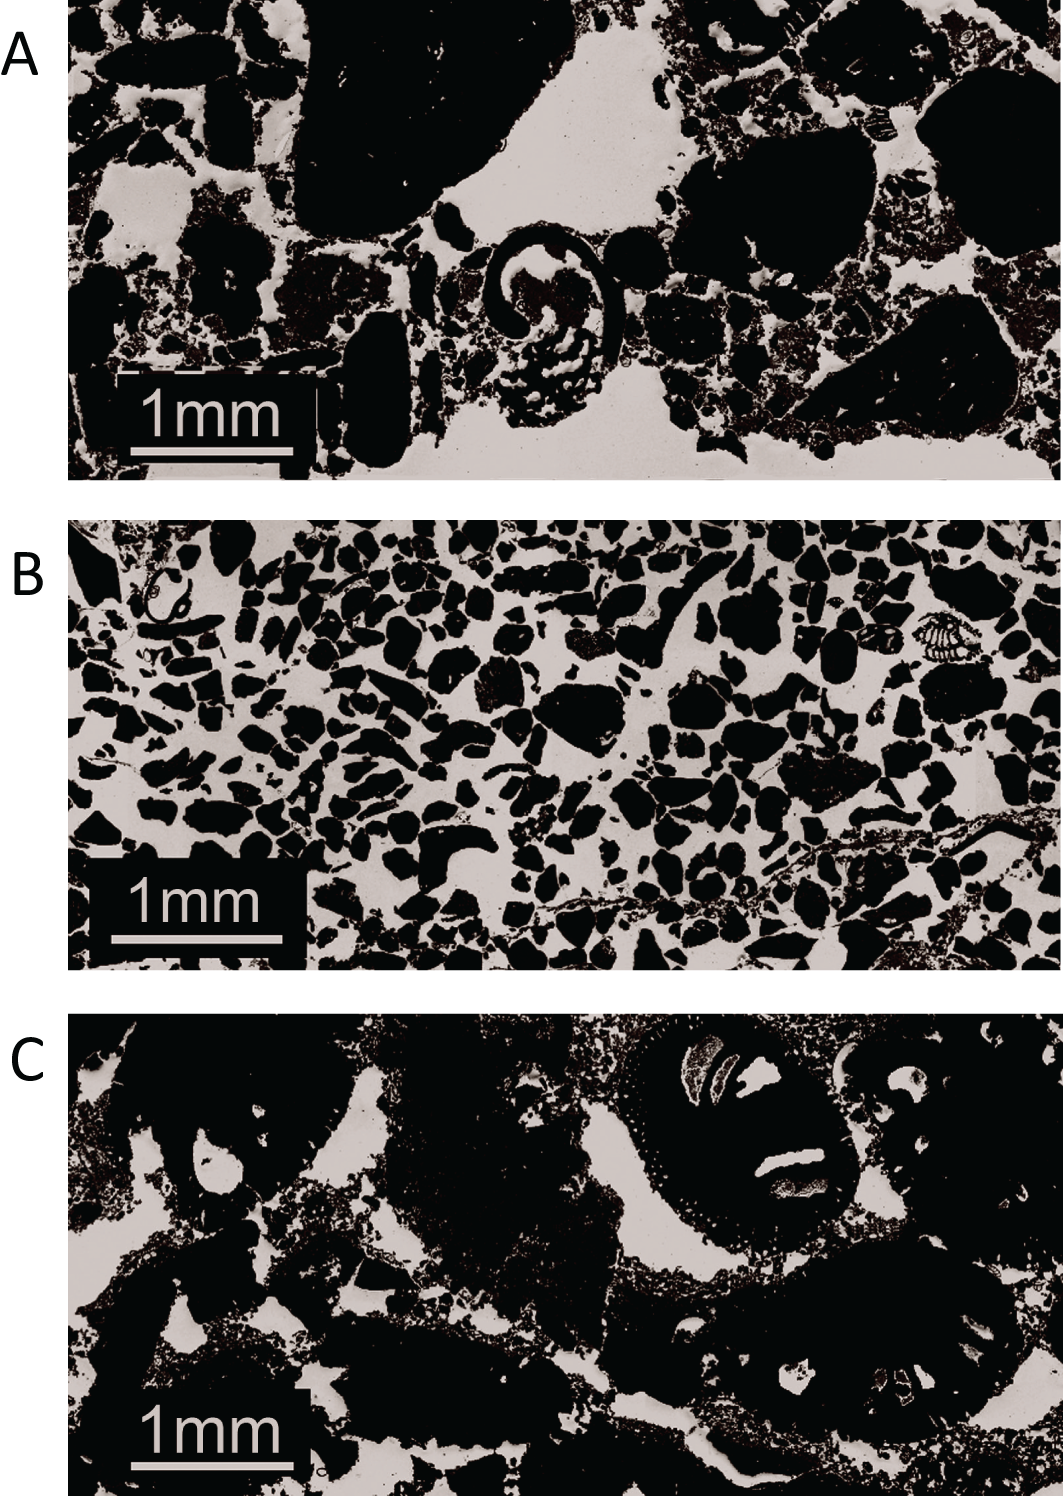
SEM images of the beachrock core samples taken from Core 1 (A), Core 2 (B), and Core 3 (C) in Figure 3.
In the well-consolidated surface layer (Figure 7A), coral fragments, foraminifera, and shell debris are cemented. SEM-EDX analysis revealed that acicular cements, ranging from 10–20 µm in length and 1 µm in width, had precipitated around the sand and gravel matrix, incorporating both calcium carbonate and silicate grains (Figures 7B, C). These cements, primarily composed of calcium with secondary amounts of iron (Fe) and silicon (Si), occasionally exhibited a blocky morphology (Figures 7D–F).
Figure 7
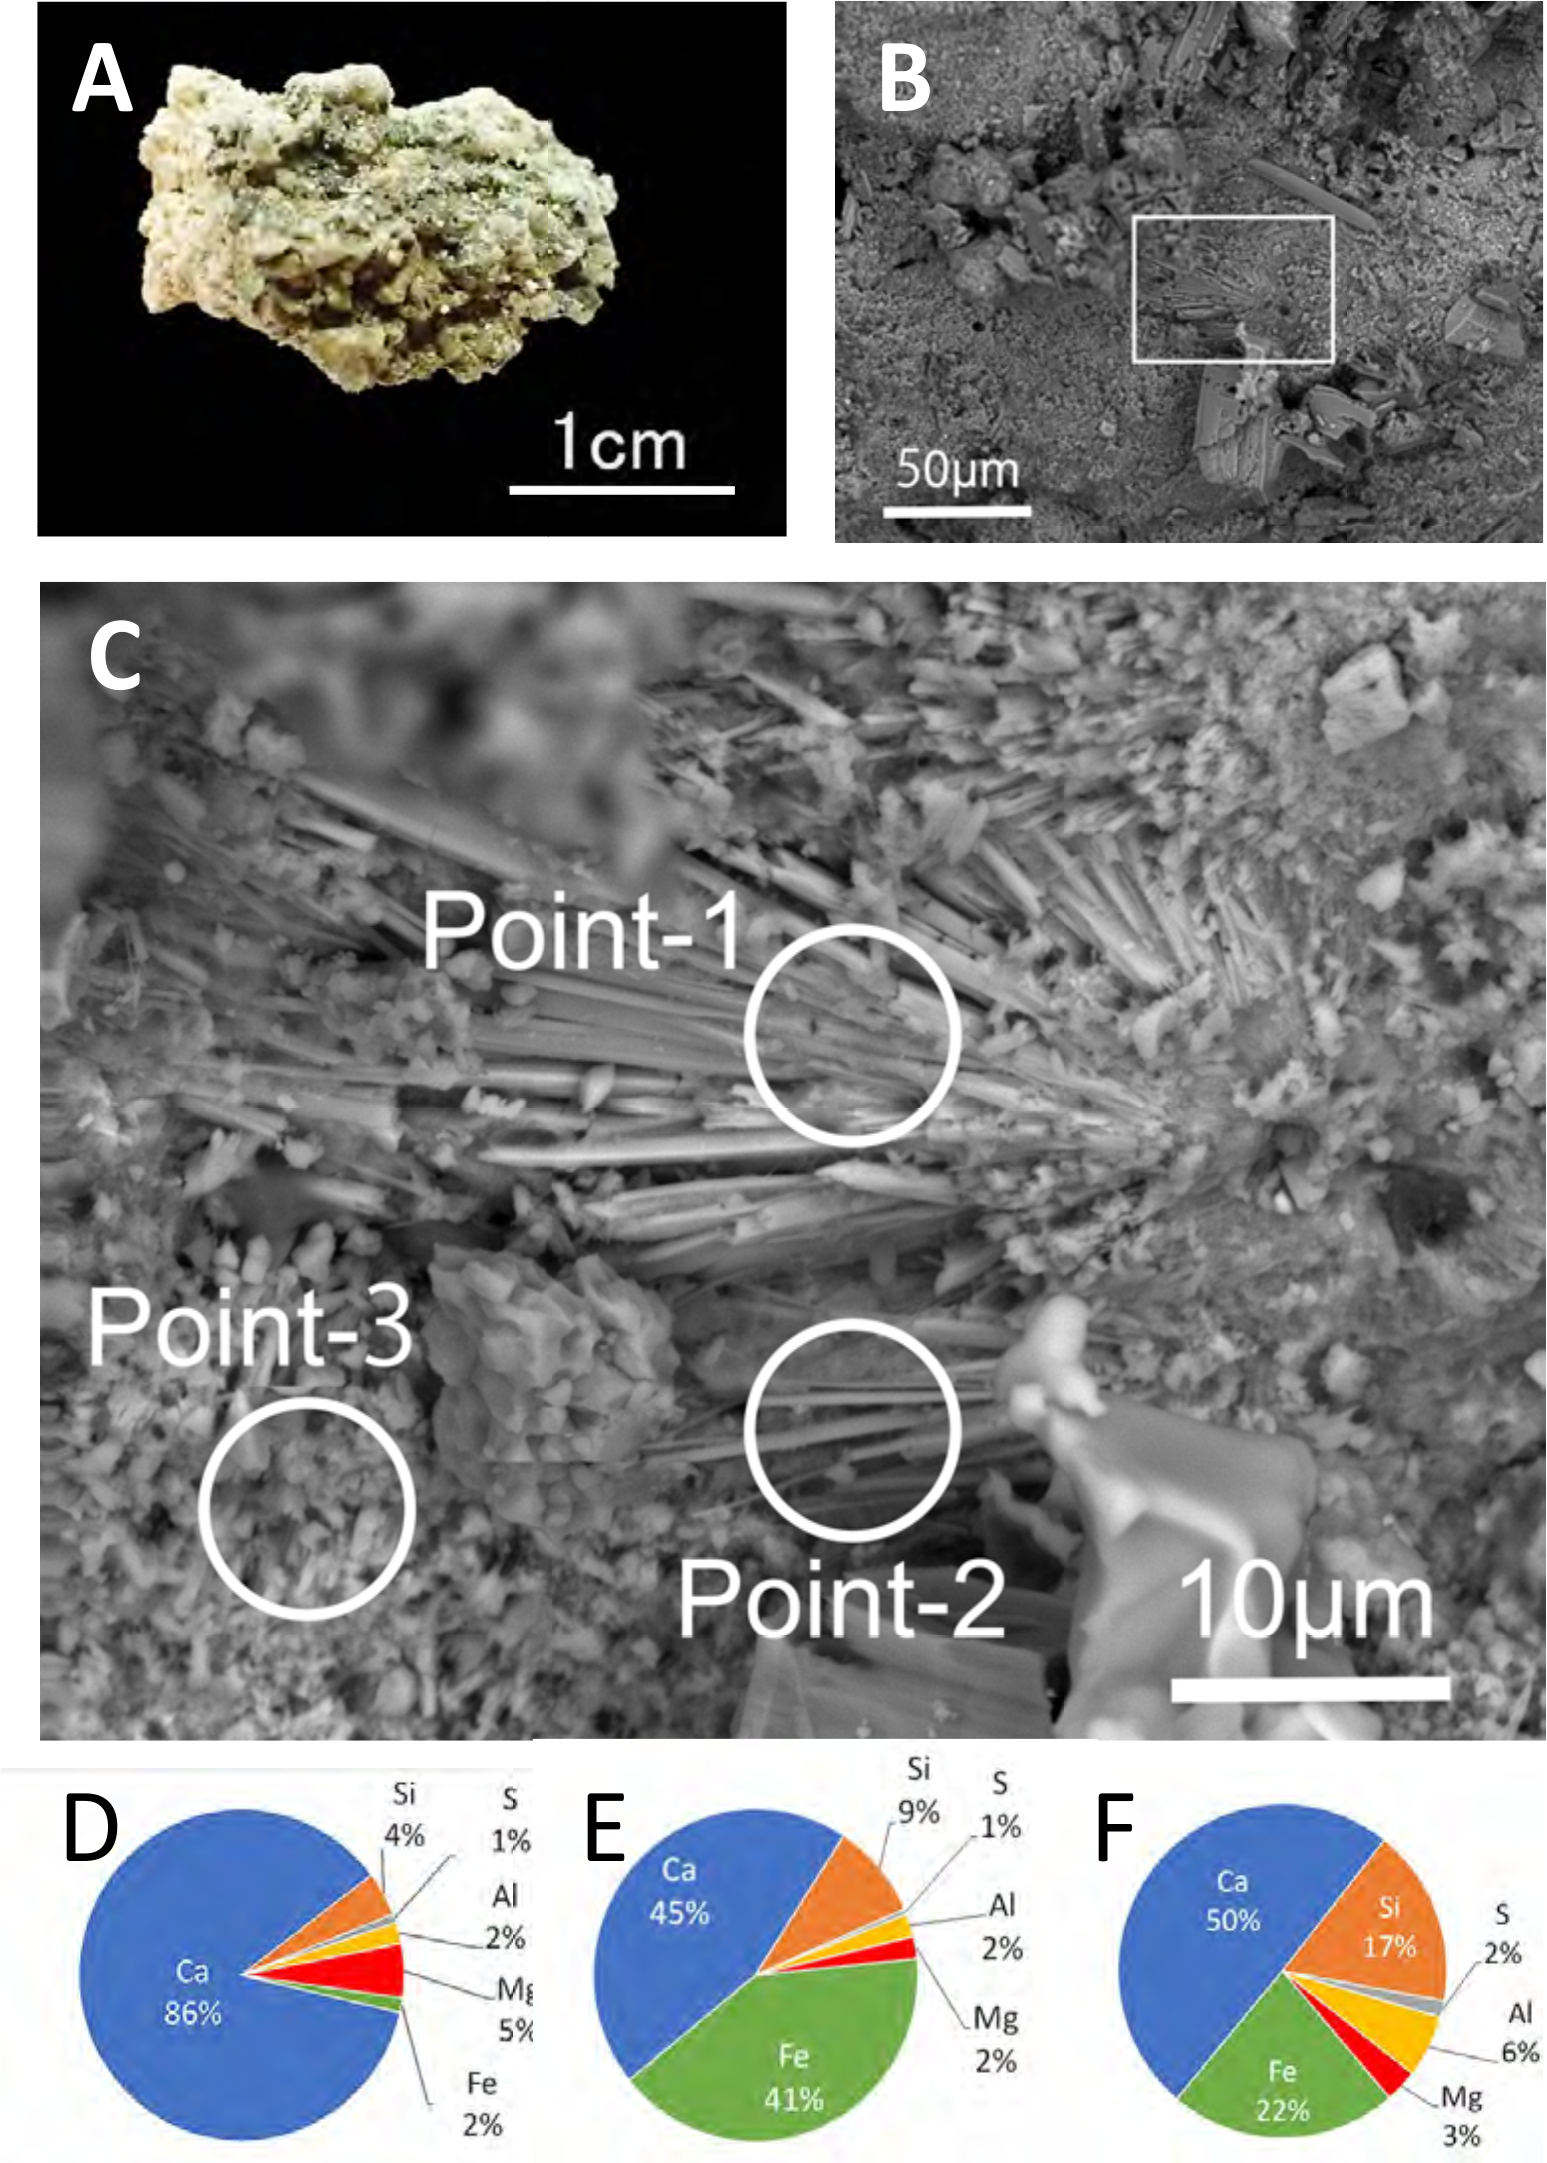
(A) Sample photo and (B) SEM image of precipitated cement in the natural beachrock. (C) Enlarged view of the boxed area in (B), showing fibrous cement 20–30 µm in length. (D-F) Elemental composition of the area at points 1, 2 and 3 in (C).
3.1.3 Seawater carbonate chemistry in the tide pool
Figure 8 shows changes in seawater carbonate chemistry in the tide pool and offshore. Within the tide pool on the beachrock, pH increased from 8.18 at 11:00 to a maximum of 9.43 at 17:00, while AT decreased from 2300 µmol kg-1 at 10:00 to 1500 µmol kg-1 at 18:00. In contrast, the carbonate chemistry of offshore seawater remained relatively stable, with a pH between 8.4 and 8.7 and an AT around 2300 µmol kg-1. Temperature and photon flux density within the tide pool reached peaks of 42°C and 4000 µmol m-2 s-1 at noon, respectively, which are typical for the summer season (Supplementary Figure 2).
Figure 8
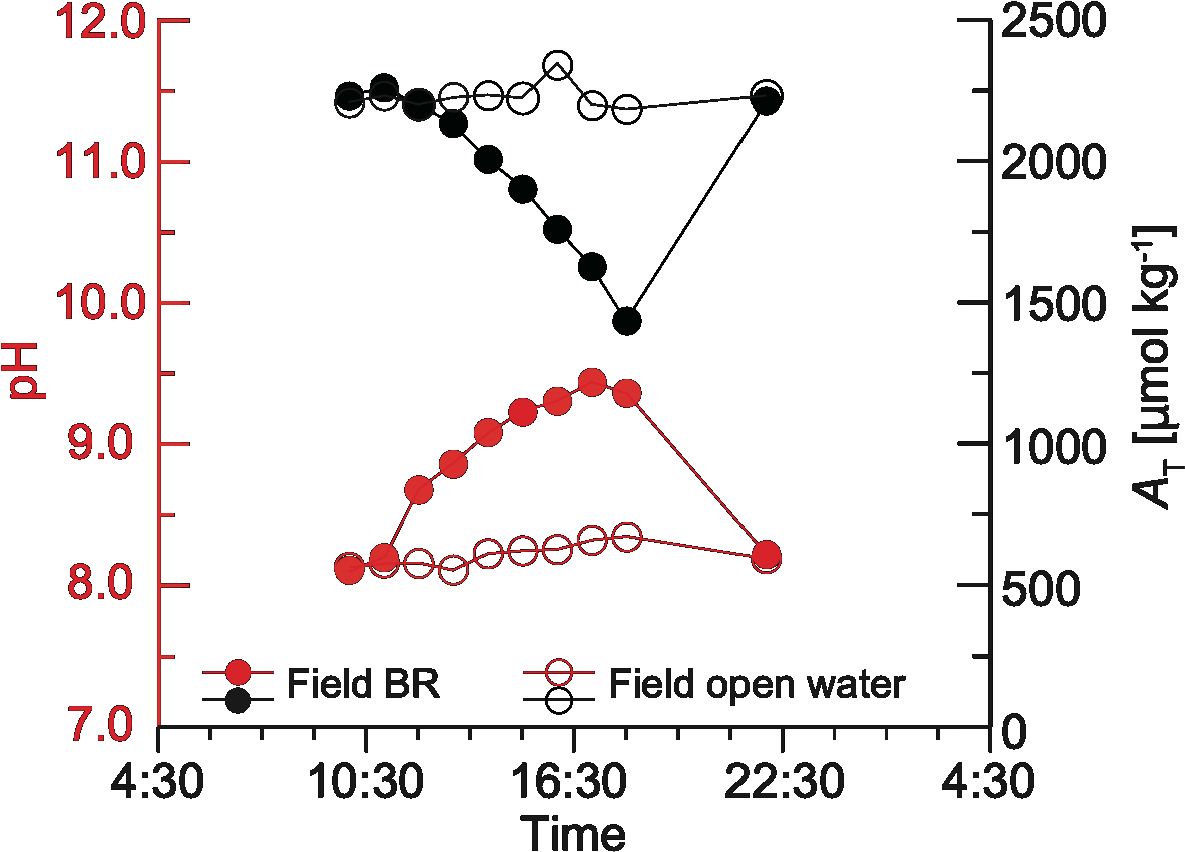
Time-series changes in carbonate chemistry during beachrock formation. pH (red) and total alkalinity (AT; black) in the natural beachrock (BR; filled circles) and open water (open circles). Measurement errors for AT range from 5 to 10 µmol kg-1.
3.2 Laboratory experiment
3.2.1 Artificial beachrock formation in the aquarium experiment
In the experimental aquarium underlain by cyanobacterial/algal mats, visible consolidation of sand was observed three months after the experiment began. The algae that formed the mat were dominated by green algae Ulva, with minor composition of cyanobacteria (Table 1). The surface layer of sand hardened into a coherent structure. Compressive strength measurements showed a range of 0.3 MPa to 4.8 MPa, with an average of 3.0 MPa at the surface. At a depth of 3 cm, the strength decreased to approximately 1.0 MPa (Figure 9).
Figure 9
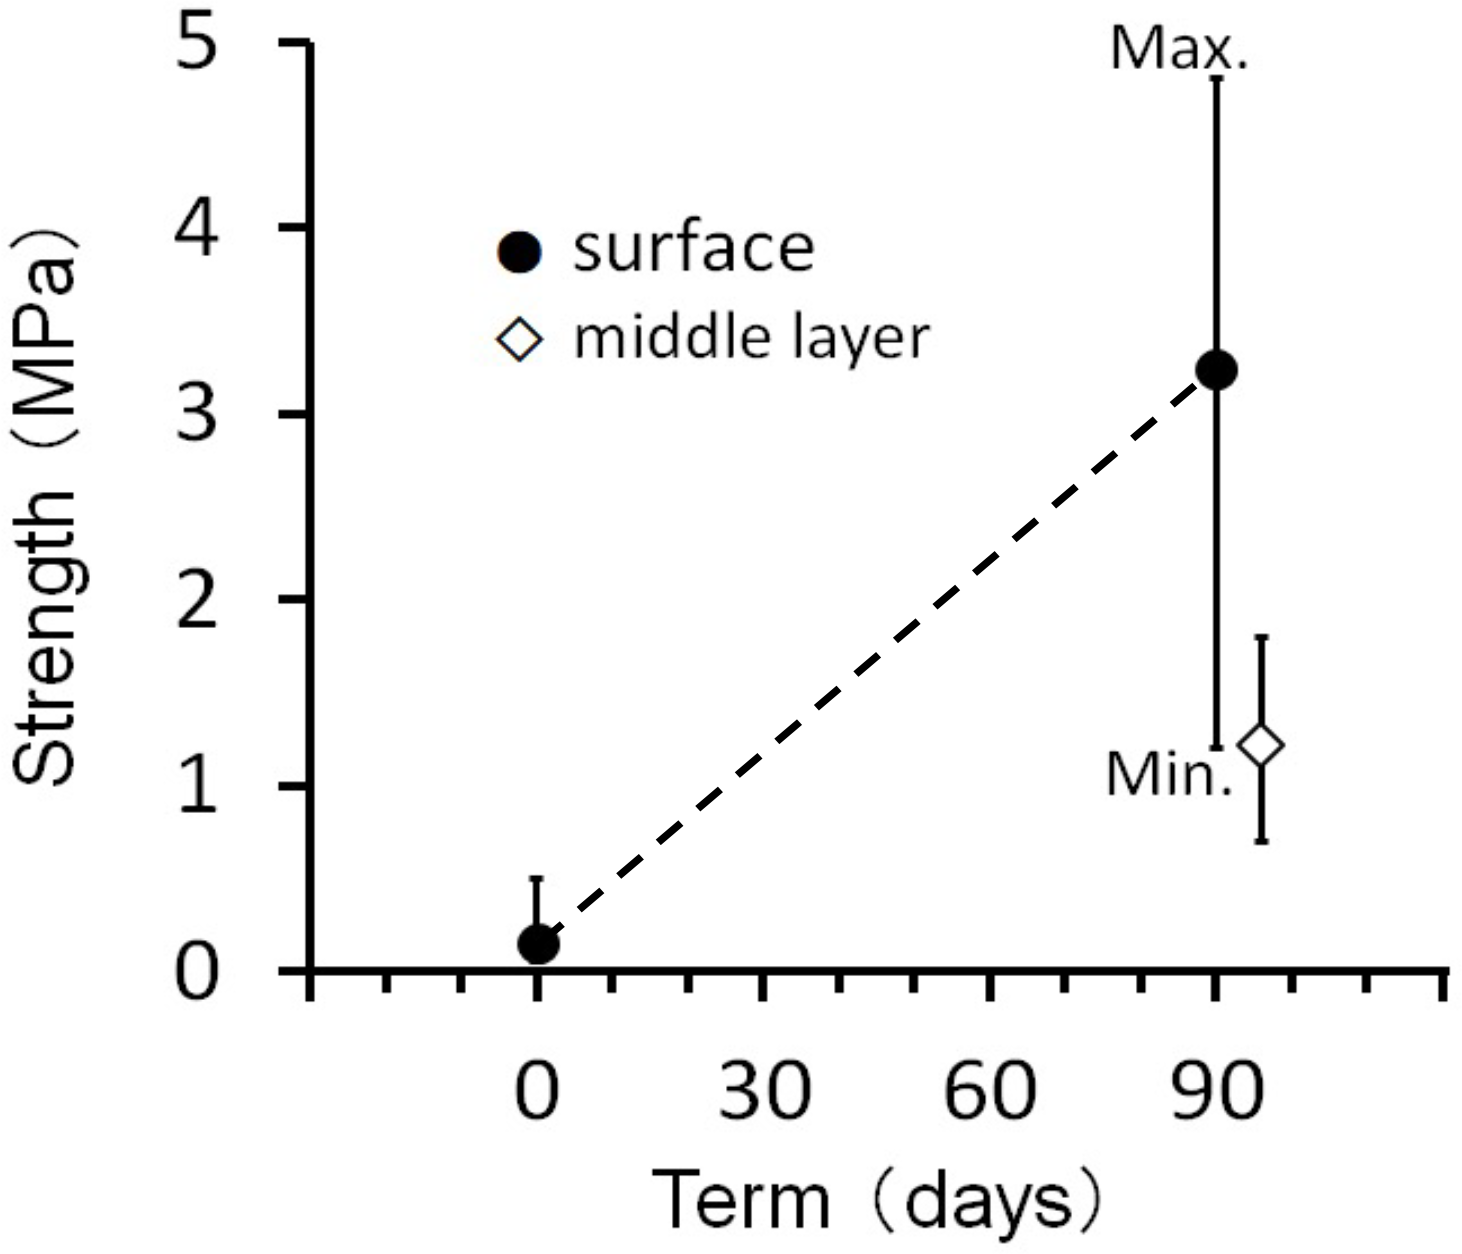
Surface strength at the start of the experiment and after three months (black circles), and strength measured 10 mm below the surface after three months (blank diamond).
SEM images of the hardened material revealed a dense network of fine, acicular crystals in contact with sand grains (Figures 10B, C). The morphology of the crystals was needle-like, approximately 10–20 µm in length and 1–2 µm in width precipitated in layered algae. SEM-EDX analysis revealed that the elemental composition of the cement was primarily calcium (Ca), whereas the algal structures were dominated by silica (Si) (Figures 10D, E). No visible cementation or consolidation occurred in the control aquarium without cyanobacterial/algal mats.
Figure 10
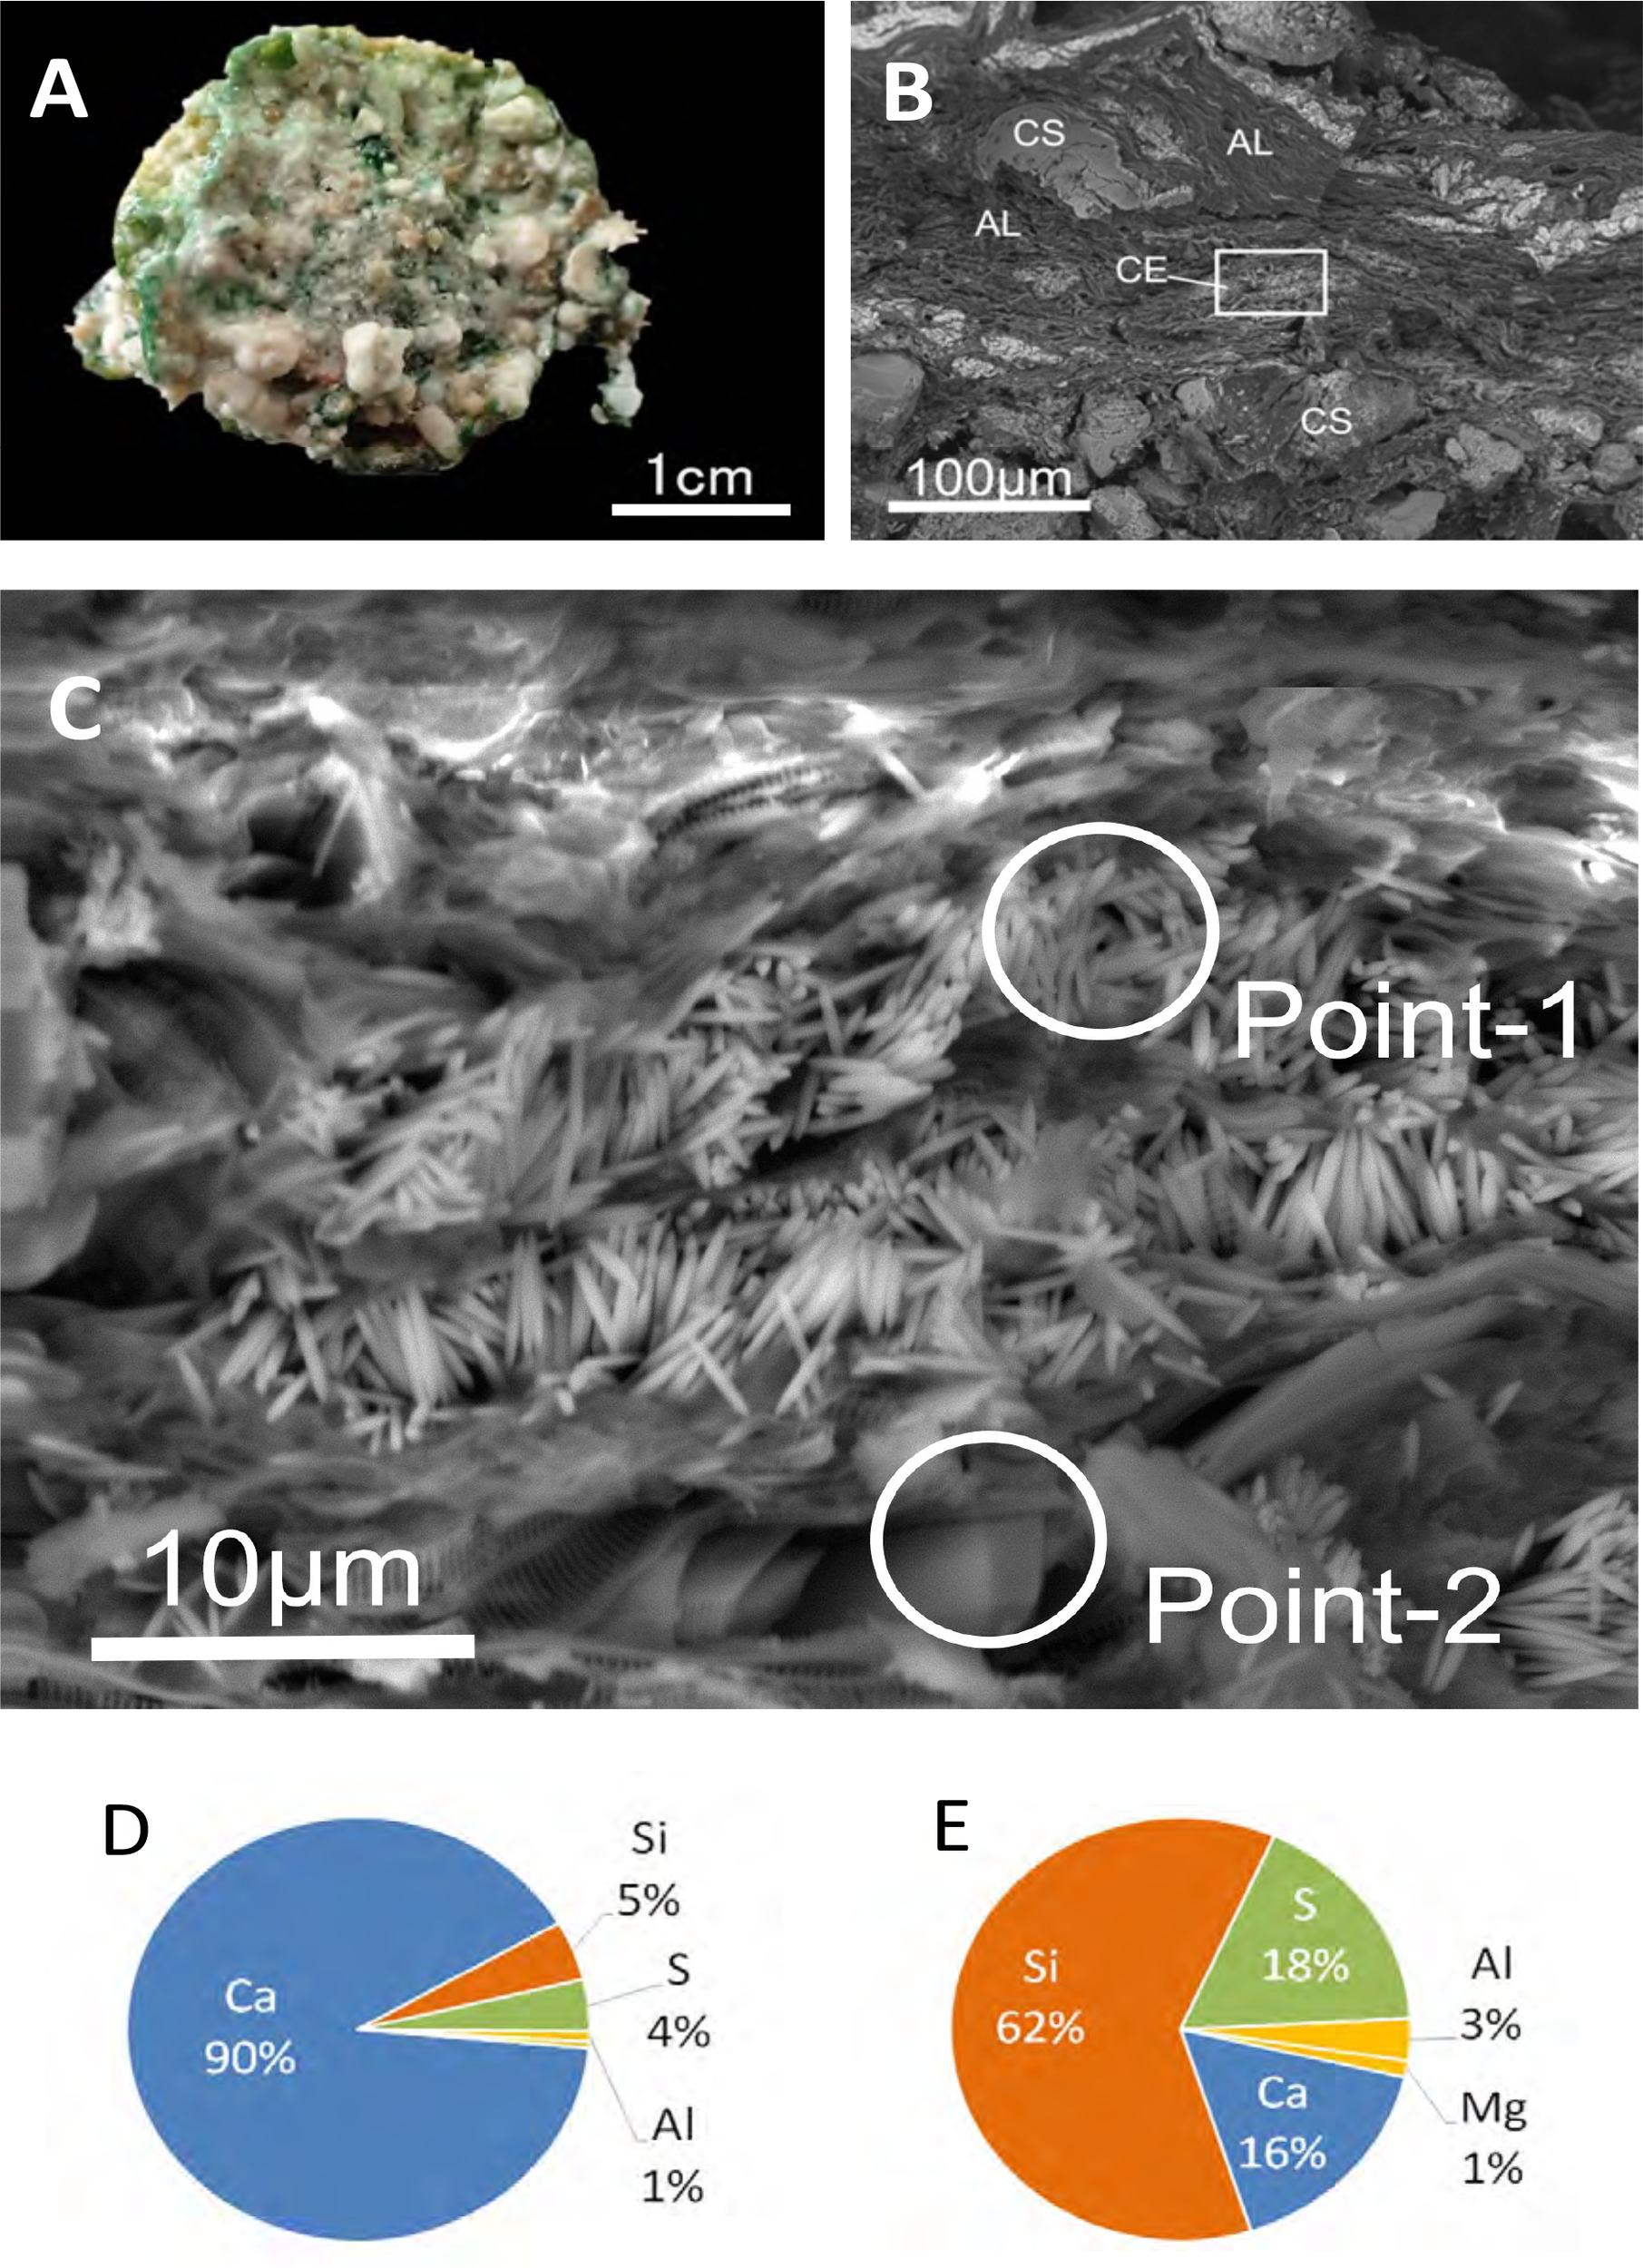
(A) Artificial beachrock consolidated in a laboratory experiment. (B) SEM image of cement precipitated in the aquarium experiment. CE, cement; CS, coral sand; AL, algae. (C) Enlarged view of the boxed area in (B), showing fibrous cement 20–30 µm in length. (D, E) Elemental composition of the area at points 1 and 2 in (C).
3.2.2 Seawater carbonate chemistry in the aquarium
In the experimental aquarium, pH increased from 7.69 at 06:00 to 8.47 at 15:00 under light conditions and subsequently decreased to 7.76 by 03:00 after the lights were turned off (Figure 11). Total alkalinity (AT) decreased steadily from 2400 µmol kg-1 at 06:00 to 1900 µmol kg-1 at 21:00. This trend continued despite the drop in pH, indicating a non-reversible decline in AT during the observation period. In contrast, the control aquarium maintained stable conditions, with pH fluctuating between 7.95 and 8.05, and AT remaining near 2300 µmol kg-1 throughout the cycle. Temperature was held constant at 15 ± 1°C, and light intensity reached approximately 800 µmol m-2 s-1 at midday.
Figure 11
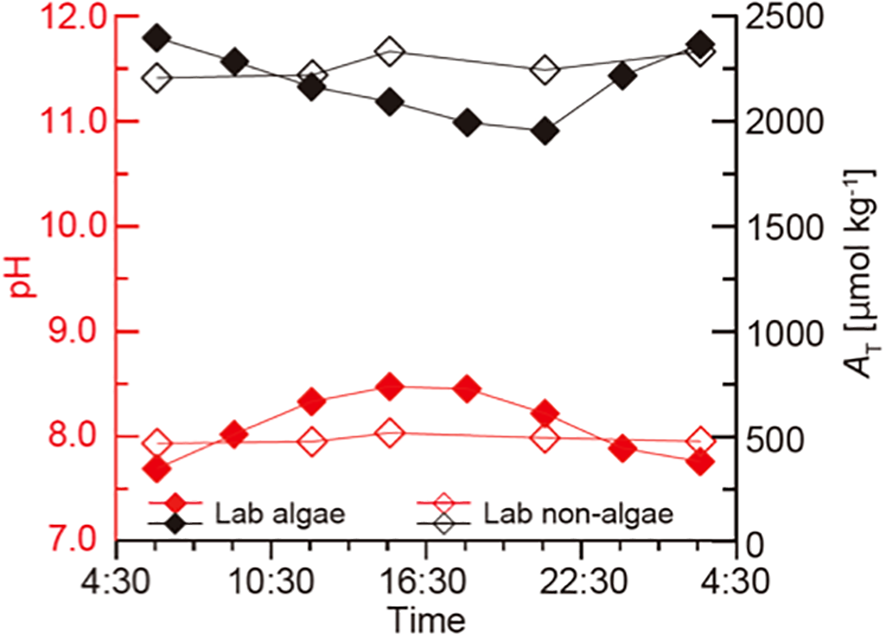
Time-series change in pH (red) and total alkalinity (black) in the aquarium experiment with microbial mat (filled diamonds) and without microbial mat as a control (open diamonds).
4 Discussion
4.1 Physical and structural similarities between natural and artificial beachrock
This study demonstrated that photosynthesis-driven cementation can form consolidated carbonate structures under laboratory conditions that closely resemble natural beachrock. After three months of incubation, the artificially formed beachrock reached compressive strengths up to 3 MPa—lower than natural beachrock (7–10 MPa), yet sufficient for temporary sediment stabilization and indicative of initial cementation. Scanning Electron Microscope (SEM) observations revealed that the cement formed in the laboratory was acicular (needle-like), characteristic (Figure 10). This cement was embedded within cyanobacterial/algal mats, indicating a biologically mediated origin.
SEM-EDX analysis revealed that the elemental composition of algae surrounding the cement was dominated by silica, indicating the presence of diatoms. However, visual observations showed that the algal mat in the aquarium was primarily composed of green algae and cyanobacteria, with diatoms not readily visible. This discrepancy may stem from the greater resistance of diatom frustules to pretreatment processes, allowing them to be more distinctly detected in SEM imaging. In reality, the algal mat likely comprised a mixed assemblage of green algae, cyanobacteria, and diatoms, with the latter being underrepresented in macroscopic observations.
In contrast, natural beachrocks—such as those observed at our field site (Figure 6)—primarily contain rim-type micritic cement, which envelops sediment particles and binds them into a cohesive framework. This rim cement, widely recognized as the dominant morphology in beachrocks (Mauz et al., 2015), contributes substantially to structural strength and consolidation. The needle-like cement observed in our laboratory likely represents an early stage of beachrock formation that—with extended incubation and stable environmental conditions—could mature into more robust structures resembling natural beachrock.
4.2 Carbonate chemistry and the role of photosynthesis in cementation
Although carbonate parameters (pH and AT) were measured in the overlying water column, they reflect benthic metabolic processes such as photosynthesis and calcification at the sediment surface. Cementation occurred within the surface sediment beneath the algal mat, indicating that the photosynthesis-driven increase in pH and saturation state extended into the porewater. While porewater chemistry was not directly measured, the close agreement between water column chemistry and observed cementation supports a strong coupling between benthic metabolism and overlying water chemistry—a relationship that is generally accepted (e.g. Cyronak et al., 2018).
In both environments, pH increased during daylight due to photosynthesis and decreased at night. Total alkalinity (AT), by contrast, showed a gradual decrease throughout the day and often continued declining even after pH dropped, particularly in the laboratory. These patterns reflect a delayed calcification response relative to pH fluctuation. Photosynthesis elevates pH by consuming dissolved CO2 and bicarbonate ions, which in turn increases the concentration of carbonate ions and raises the aragonite saturation state (Ω). This environment favors calcium carbonate precipitation. Concurrently, calcification consumes carbonate ions and reduces AT. In the natural environment, Ω rose from 3.4 to 9.9, and in the laboratory from 3.1 to 6.0 (Figure 12A), both indicating conditions of supersaturation sufficient for cementation.
Figure 12
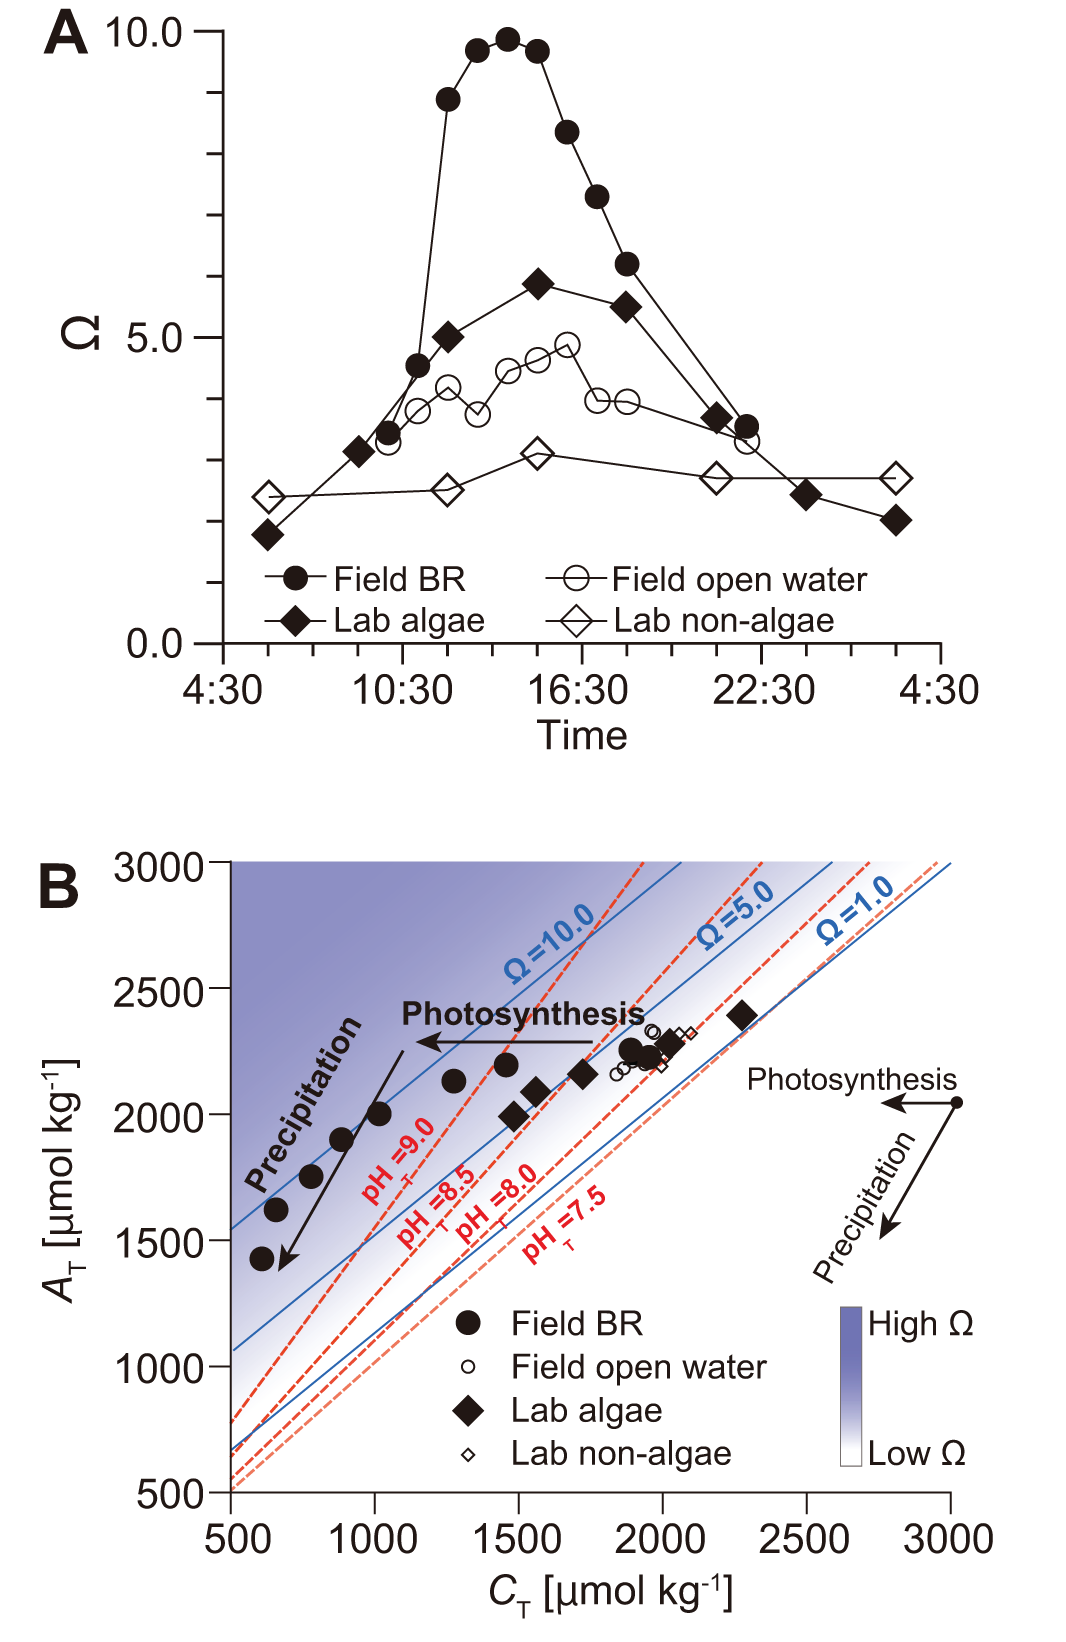
(A) Time-series changes in the carbonate saturation state (Ω) in the natural field beachrock (BR; filled circles) and the laboratory aquarium experiment (filled diamonds), compared with open water (open diamonds). (B) Changes in carbonate chemistry in natural beachrock (filled circles) and laboratory incubation (filled diamonds), plotted on an AT-CT diagram with Ω (blue lines) and pH (red dotted lines) isolines. Photosynthesis and precipitation are indicated by vectors along the X-axis and with a gradient of 2, respectively.
These relationships are visualized in the AT–CT diagram (Figure 12B; Deffeyes, 1965; Cyronak et al., 2018), where photosynthesis is expressed as a horizontal vector (no change in AT), and calcification as a vector with a slope of 2, reflecting the 2:1 stoichiometry of AT and CT removal during precipitation. As shown in the AT–CT diagram, the initial stage of the process—both in the field and the laboratory—was dominated by photosynthesis, which led to increases in pH and aragonite saturation state (Ω). This was subsequently followed by a marked phase of calcification, evidenced by a reduction in total alkalinity. This visualization clarifies how cyanobacterial/algal photosynthesis initiates conditions that lead to mineral precipitation, offering a mechanistic framework to differentiate among competing processes.
While the importance of alkalinity in inducing cementation has been emphasized in previous studies (Dupraz et al., 2009; Hibner et al., 2025), our findings show that Ω can increase through pH elevation alone, without changes in AT. In our observations, AT decreased only after Ω peaked, suggesting that carbonate precipitation, not alkalinity increase, is the driver of cementation in photosynthetic systems. The AT–CT diagram thus proves essential for differentiating metabolic drivers of cementation and demonstrates the unique contribution of photosynthesis to beachrock formation.
Precipitation rates inferred from AT decline—100 mmol kg-1 h-1 in the natural setting and 15 mmol kg-1 h-1 in the lab—are consistent with values from coral reef environments (Kayanne et al., 2005; Davis et al., 2020), validating our laboratory design. The alignment between field and experimental data affirms that beachrock-like cementation processes can be reliably reproduced under controlled conditions.
In terms of atmospheric CO2 dynamics, photosynthesis contributes to CO2 uptake, whereas calcification releases CO2. According to Ware et al. (1992), when the ratio of photosynthetic carbon fixation to calcification exceeds approximately 0.6, a reef or sedimentary system may act as a net CO2 sink. In our field and laboratory settings, photosynthesis exceeded calcification, suggesting a potential for net CO2 uptake. However, the overall carbon balance also depends on factors such as microbial respiration and carbonate dissolution. Therefore, a comprehensive assessment is needed to determine whether beachrock formation acts as a net sink for atmospheric CO2.
Our findings further show that photosynthetic mats facilitate cementation by both binding sediment particles and generating localized chemical conditions favorable to mineral precipitation. Notably, even after the mat shifted from cyanobacteria to filamentous green algae in the laboratory, cement formation continued. This indicates that the driving mechanism is the photosynthetic enhancement of carbonate saturation rather than taxon-specific metabolic pathways. In natural beachrock, cyanobacterial mats are well adapted to desiccation during low tide, which contributes to localized water evaporation and further increases Ω, supporting the potential applicability of this process in field condition.
4.3 Comparison with ureolytic biocementation and engineering implications
Advances in biomineralization research have enabled the development of microbial-induced carbonate precipitation (MICP), commonly referred to as biocement (Ramachandran et al., 2020; Zehner et al., 2021; Maureira et al., 2024). Biocementation can be induced through various microbial processes, including photosynthesis, ureolysis, sulfate reduction, and iron oxidation (Ariyanti, 2012; Zhu and Dittrich, 2016). Among these, carbonate precipitation via ureolytic bacteria has shown great promise and has been successfully applied in various geotechnical and engineering contexts, particularly for soil and sediment stabilization (Fukue et al., 2011; Dhami et al., 2013; Zehner et al., 2021).
While the ureolytic approach has demonstrated high effectiveness in controlled environments and has been successfully applied to terrestrial settings, its deployment in coral reef ecosystems warrants careful consideration. Ureolytic biocementation typically requires the addition of urea at relatively high concentrations—around 1 mol N L-1 (Wang et al., 2023)—to induce carbonate precipitation. In contrast, natural urea concentrations in coral reef waters are substantially lower, generally below 0.2 µmol N L-1, with localized hotspots reaching only 4–8 µmol N L-1 (Crandall and Teece, 2011). Consequently, field applications would require substantial urea input. Moreover, urea hydrolysis produces ammonia as a byproduct, which may pose ecological risks to oligotrophic reef systems that are particularly sensitive to nutrient enrichment (Whiffin et al., 2007).
In our study, although urease activity would theoretically raise alkalinity via the reaction shown in Equation (1), we observed no increase in alkalinity in either the field or the laboratory settings. This absence of alkalinity increase suggests that urease-driven carbonate precipitation was not a contributing process under the tested conditions, and highlights a potential limitation of applying this method in reef environments without additional intervention.
Given these constraints, our approach—based on photosynthesis by naturally occurring cyanobacterial and algal mats—offers an attractive alternative. It requires no chemical additives and relies on ecological processes already functioning in intertidal reef flats. Photosynthesis not only enhances Ω but also supports cyanobacterial/algal primary production, contributing positively to the ecosystem. This photosynthesis-driven biocementation approach therefore presents a sustainable, ecosystem-compatible strategy for coastal reinforcement, particularly in sensitive coral reef and atoll settings facing the threats of sea-level rise.
5 Conclusion and future perspective
Despite being based on data from a single location and single diurnal cycles, the consistent chemical trends observed in both field and laboratory settings provide strong proof-of-concept for the method’s viability. This study demonstrates that photosynthetic cyanobacterial/algal mats can induce carbonate cementation under laboratory conditions, replicating key features of natural beachrock formation. Measurements of pH and total alkalinity (AT) confirmed that photosynthesis elevates aragonite saturation state (Ω), driving calcium carbonate precipitation. Using the AT–CT diagram, we visualized sequential shifts in carbonate chemistry driven by metabolic processes, clarifying the link between photosynthesis and biogenic cementation. These findings provide a mechanistic foundation for photosynthesis-driven, eco-technological strategies for coastal protection.
In the laboratory experiment, the carbonate sand and gravel consolidated to a compressive strength of approximately 3 MPa at the surface after three months. This strength may mitigate minor erosion and wave activity; however, for coastal defense—especially under storm conditions—greater strength is needed. Achieving this will require optimizing environmental conditions, such as promoting microbial/algal mat development, maintaining ideal salinity and temperature, and designing semi-enclosed systems to sustain high photosynthetic activity.
Several limitations remain. The three-month experimental duration is short compared to the multi-year formation of natural beachrock, and it is unclear whether more robust rim and spar cements would eventually develop. The laboratory setup also simplified environmental complexity by excluding wave action, sediment flux, and seasonal changes. Moreover, while the shift from cyanobacteria to filamentous green algae did not inhibit cementation, the long-term mineralization potential of specific taxa remains uncertain.
Future studies should investigate the influence of nutrient and light availability, mat thickness, and mild oxidizing agents to enhance cementation. We have already consolidated a 13.5-kg sand block in an outdoor setting (Figure 13), demonstrating feasibility at a larger scale. These findings highlight both the promise and the engineering challenges of translating this method into durable beachrock structures for long-term coastal protection.
Figure 13
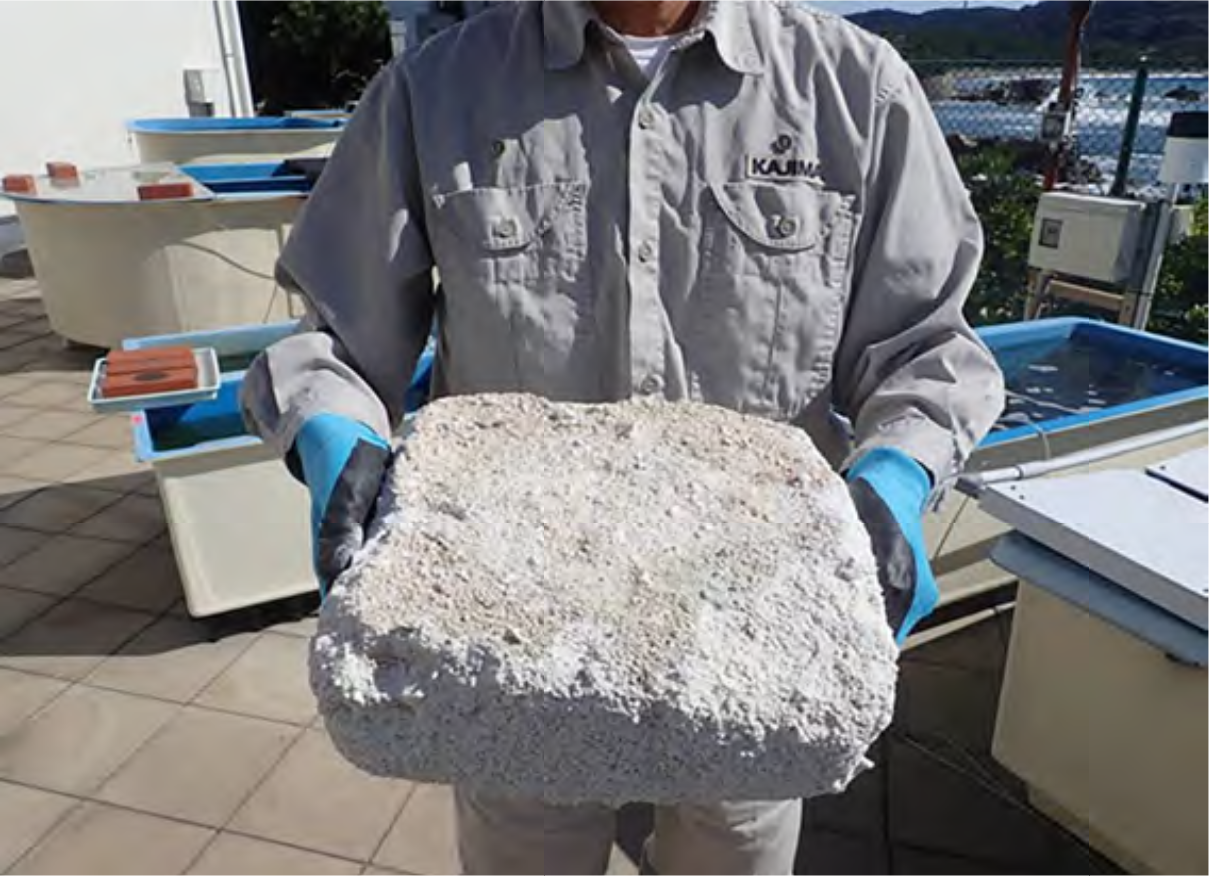
Consolidated block of carbonate sand and gravel in an outdoor aquarium. Dimensions: 30 cm x 30 cm x 12 cm; weight: 13.5 kg.
In summary, photosynthesis-driven biocementation offers a sustainable, scalable, and ecologically compatible solution for reinforcing coastlines—especially in coral reef and atoll environments vulnerable to sea-level rise and erosion. By replicating early-stage beachrock formation in the laboratory and achieving partial field-scale success, this study provides foundational knowledge and a practical framework for future biomineralization-based coastal protection systems.
Statements
Data availability statement
The datasets presented in this study can be found in online repositories. The names of the repository/repositories and accession number(s) can be found in the article/Supplementary Material.
Author contributions
KY: Writing – review & editing. SY: Writing – original draft, Writing – review & editing. HK: Writing – original draft, Writing – review & editing.
Funding
The author(s) declare that financial support was received for the research and/or publication of this article. This research was funded by R&D expenses of Kajima Corp, the Ministry of Land, Infrastructure, Transport and Tourism, and JST CREST. Kajima Corp was not involved in the study design, collection, analysis, interpretation of data, the writing of this article, or the decision to submit it for publication.
Acknowledgments
We thank H. Ohba for the identification of cyanobacterial and algal specimens. M. Tanaka, Y. Koshikawa, and B. K. Lim of Kajima Tech. Res. Inst. supported this research.
Conflict of interest
Author KY was employed by the company Kajima Corp.
The remaining authors declare that the research was conducted in the absence of any commercial or financial relationships that could be construed as a potential conflict of interest.
Generative AI statement
The author(s) declare that Generative AI was used in the creation of this manuscript. To polish up English, but the authors verify and take full responsibility for the use of generative AI in the preparation of this manuscript.
Correction note
A correction has been made to this article. Details can be found at: 10.3389/fmars.2025.1663879.
Publisher’s note
All claims expressed in this article are solely those of the authors and do not necessarily represent those of their affiliated organizations, or those of the publisher, the editors and the reviewers. Any product that may be evaluated in this article, or claim that may be made by its manufacturer, is not guaranteed or endorsed by the publisher.
Supplementary material
The Supplementary Material for this article can be found online at: https://www.frontiersin.org/articles/10.3389/fmars.2025.1532130/full#supplementary-material
References
1
Ariyanti D. (2012). Feasibility of using microalgae for biocement production through biocementation. J. Bioprocessing Biotechniques02. doi: 10.4172/2155-9821.1000111
2
Crandall J. B. Teece M. A. (2011). Urea is a dynamic pool of bioavailable nitrogen in coral reefs. Coral Reefs. 31, 207–214. doi: 10.1007/s00338-011-0836-1
3
Cyronak T. Andersson A. J. Langdon C. Albright R. Bates N. R. Caldeira K. et al . (2018). Taking the metabolic pulse of the world’s coral reefs. PLoS One13, e0190872. doi: 10.1371/journal.pone.0190872
4
Danjo T. Kawasaki S. (2013). A study of the formation mechanism of beachrock in Okinawa, Japan: Toward making artificial rock. Int. J. GEOMATE5, 634–639. doi: 10.21660/2013.9.3157
5
Danjo T. Kawasaki S. (2014). Formation mechanisms of beachrocks in Okinawa and Ishikawa, Japan, with a focus on cements. Mater Trans.55, 493–500. doi: 10.2320/matertrans.M-M2013844
6
Danjo T. Kawasaki S. (2016). Microbially induced sand cementation method using Pararhodobacter sp. Strain SO1, inspired by Beachrock formation mechanism. Mater Trans.57, 428–437. doi: 10.2320/matertrans.M-M2015842
7
Davis K. L. McMahon A. Correa R. E. Santos I. R. (2020). Calcification and organic productivity at the world’s southernmost coral reef. Mar. Chem.227. doi: 10.1016/j.marchem.2020.103870
8
Deffeyes K. S. (1965). Carbonate equilibria: A graphic and algebraic approach1. Limnol Oceanogr10, 412–426. doi: 10.4319/lo.1965.10.3.0412
9
Dhami N. K. Reddy M. S. Mukherjee A. (2013). Biomineralization of calcium carbonates and their engineered applications: a review. Front. Microbiol.4. doi: 10.3389/fmicb.2013.00314
10
Diaz M. R. Eberli G. P. (2022). Microbial contribution to early marine cementation. Sedimentology69, 798–822. doi: 10.1111/sed.12926
11
Dupraz C. Reid R. P. Braissant O. Decho A. W. Norman R. S. Visscher P. T. (2009). Processes of carbonate precipitation in modern microbial mats. Earth-Science Rev.96, 141–162. doi: 10.1016/j.earscirev.2008.10.005
12
Evelpidou N. Kawasaki S. Karkani A. Saitis G. Spada G. Economou G. (2019). Evolution of relative sea level in Okinawa (Japan) during Holocene. Geografia Fisica e Dinamica Quaternaria42, 3–16. doi: 10.4461/GFDQ.2019.42.1
13
Fukue M. Ono S. Sato Y. (2011). Cementation of sands due to microbiologically-induced carbonate precipitation. Soils Foundations51, 83–93. doi: 10.3208/sandf.51.83
14
Hanor J. S. (1978). Precipitation of beachrock cements - mixing of marine and meteoric waters vs Co2-degassing. J. Sediment Petrol48, 489–501.
15
Heveran C. M. Williams S. L. Qiu J. Artier J. Hubler M. H. Cook S. M. et al . (2020). Biomineralization and successive regeneration of engineered living building materials. Matter2, 481–494. doi: 10.1016/j.matt.2019.11.016
16
Hibner B. M. Cantine M. D. Trower E. J. Dodd J. E. Gomes M. L. (2025). How to make a rock in 150 days: observations of biofilms promoting rapid beachrock formation. Geobiology23, e70009. doi: 10.1111/gbi.70009
17
IPCC . (2021). Climate Change 2021: The Physical Science Basis (Cambridge, United Kingdom and New York, NY, USA: Cambridge University Press). doi: 10.1017/978100915789
18
Kamennaya N. Ajo-Franklin C. Northen T. Jansson C. (2012). Cyanobacteria as biocatalysts for carbonate mineralization. Minerals2, 338–364. doi: 10.3390/min2040338
19
Kayanne H. Hata H. Kudo S. Yamano H. Watanabe A. Ikeda Y. et al . (2005). Seasonal and bleaching-induced changes in coral reef metabolism and CO2 flux. Global Biogeochemical Cycles19. doi: 10.1029/2004gb002400
20
Krumbein W. E. (1979). Photolithotropic and chemoorganotrophic activity of bacteria and algae as related to Beachrock formation and degradation (Gulf-of-aqaba, sinai). Geomicrobiol J.1, 139–203. doi: 10.1080/01490457909377729
21
Lewis E. Wallace D. (1998). “Program developed for CO2 System calculations,” in Carbon Dioxide Information Analysis Center, vol. 21. (Oak Ridge National Laboratory, U.S. Department of Energy).
22
Maureira A. Zapata M. Olave J. Jeison D. Wong L. S. Panico A. et al . (2024). MICP mediated by indigenous bacteria isolated from tailings for biocementation for reduction of wind erosion. Front. Bioeng Biotechnol.12. doi: 10.3389/fbioe.2024.1393334
23
Mauz B. Vacchi M. Green A. Hoffmann G. Cooper A. (2015). Beachrock: A tool for reconstructing relative sea level in the far-field. Mar. Geology362, 1–16. doi: 10.1016/j.margeo.2015.01.009
24
McCutcheon J. Nothdurft L. D. Webb G. E. Paterson D. Southam G. (2016). Beachrock formation via microbial dissolution and re-precipitation of carbonate minerals. Mar. Geology382, 122–135. doi: 10.1016/j.margeo.2016.10.010
25
McCutcheon J. Nothdurft L. D. Webb G. E. Shuster J. Nothdurft L. Paterson D. et al . (2017). Building biogenic beachrock: Visualizing microbially-mediated carbonate cement precipitation using XFM and a strontium tracer. Chem. Geology465, 21–34. doi: 10.1016/j.chemgeo.2017.05.019
26
Neumeier U. (1999). Experimental modelling of beachrock cementation under microbial influence. Sedimentary Geology126, 35–46. doi: 10.1016/S0037-0738(99)00030-5
27
Omoto K. (2014). Report of calibrated 14C ages and δ13C analysis of beachrock samples collected from the Yaeyama Islands, southwest of Japan. Quaterly J. Geogr.65, 207–221.
28
Ramachandran A. L. Polat P. Mukherjee A. Dhami N. K. (2020). Understanding and creating biocementing beachrocks via biostimulation of indigenous microbial communities. Appl. Microbiol. Biotechnol.104, 3655–3673. doi: 10.1007/s00253-020-10474-6
29
Saitis G. Karkani A. Koutsopoulou E. Tsanakas K. Kawasaki S. Evelpidou N. (2022). Beachrock formation mechanism using multiproxy experimental data from natural and artificial Beachrocks: insights for a potential soft engineering method. J. Mar. Sci. Eng.10. doi: 10.3390/jmse10010087
30
Stoddart D. R. Cann J. R. (1965). Nature and origin of beach rock. J. Sediment Petrol35, 243–273. doi: 10.1306/74d7122b-2b21-11d7-8648000102c1865d
31
Thorsteson D. C. Mackenzie F. T. Ristvet B. L. (1972). Experimental vadose and phreatic cementation of skeletal carbonate sand. J. Sediment Petrol42, 162–167.
32
Vousdoukas M. I. Velegrakis A. F. Plomaritis T. A. (2007). Beachrock occurrence, characteristics, formation mechanisms and impacts. Earth-Science Rev.85, 23–46. doi: 10.1016/j.earscirev.2007.07.002
33
Wang Y. Konstantinou C. Tang S. Chen H. (2023). Applications of microbial-induced carbonate precipitation: A state-of-the-art review. Biogeotechnics1. doi: 10.1016/j.bgtech.2023.100008
34
Ware J. R. Smith S. V. Reakakudla M. L. (1992). Coral-reefs - sources or sinks of atmospheric CO2. Coral Reefs11, 127–130. doi: 10.1007/Bf00255465
35
Whiffin V. S. van Paassen L. A. Harkes M. P. (2007). Microbial carbonate precipitation as a soil improvement technique. Geomicrobiol J.24, 417–423. doi: 10.1080/01490450701436505
36
Zehner J. Royne A. Sikorski P. (2021). Calcite seed-assisted microbial induced carbonate precipitation (MICP). PLoS One16, e0240763. doi: 10.1371/journal.pone.0240763
37
Zhu T. Dittrich M. (2016). Carbonate precipitation through microbial activities in natural environment, and their potential in biotechnology: A review. Front. Bioeng Biotechnol.4. doi: 10.3389/fbioe.2016.00004
Summary
Keywords
beachrock, cyanobacteria, carbonate chemistry, coral reef, coastal protection
Citation
Yamaki K, Yamamoto S and Kayanne H (2025) Natural and artificial consolidation of sand (beachrock) induced by cyanobacterial/algal mat photosynthesis. Front. Mar. Sci. 12:1532130. doi: 10.3389/fmars.2025.1532130
Received
22 November 2024
Accepted
16 June 2025
Published
07 July 2025
Corrected
15 September 2025
Volume
12 - 2025
Edited by
Travis Blake Meador, Academy of Sciences of the Czech Republic (ASCR), Czechia
Reviewed by
Mireille Escudero, Universitat Politècnica de València, Spain
Niki Evelpidou, National and Kapodistrian University of Athens, Greece
Updates
Copyright
© 2025 Yamaki, Yamamoto and Kayanne.
This is an open-access article distributed under the terms of the Creative Commons Attribution License (CC BY). The use, distribution or reproduction in other forums is permitted, provided the original author(s) and the copyright owner(s) are credited and that the original publication in this journal is cited, in accordance with accepted academic practice. No use, distribution or reproduction is permitted which does not comply with these terms.
*Correspondence: Hajime Kayanne, kayanne@g.ecc.u-tokyo.ac.jp
Disclaimer
All claims expressed in this article are solely those of the authors and do not necessarily represent those of their affiliated organizations, or those of the publisher, the editors and the reviewers. Any product that may be evaluated in this article or claim that may be made by its manufacturer is not guaranteed or endorsed by the publisher.