 Ju-Wook Baek1,2
 Sung-Han Kim1,2
 Kyung-Tae Kim1
 Jin Young Choi1,2Hyun-Jeong Jeong1,2Chang Hwa Lee1,3Sung-Uk An4
 Jae Seong Lee1,2*
- 1Marine Environment Research Department, Korea Institute of Ocean Science and Technology, Busan, Republic of Korea
- 2Department of Convergence Study on the Ocean Science and Technology, Ocean Science and Technology School, Busan, Republic of Korea
- 3Department of Marine Science and Convergence Technology, Hanyang University, Ansan, Republic of Korea
- 4Department of Ecology and Conservation, National Marine Biodiversity Institute of Korea, Seocheon, Republic of Korea
To understand the factors controlling organic carbon (OC) and nutrient cycling in continental shelf sediments, we estimated total sediment oxygen uptake (TOU) and benthic nutrient flux (BNF) in the Southern Yellow Sea (SYS) during spring. The OC (0.28 to 1.58%), TN (0.03 to 0.22%), C/N ratio (7 to 11), and δ13C (–23.81 to –22.23‰) in the surface sediments showed spatial variation. The TOU ranged from 11.9 ± 0.02 to 20.5 ± 0.03 mmol O2 m−2 d−1, depending on the spatial distribution of OC content, with higher values in finer sediments. Sediment OC oxidation rates varied between 9.1 and 15.8 mmol C m−2 d−1, accounting for 5−87% of primary production in surface waters. The BNFs were comparable with other continental shelves, with dissolved inorganic nitrogen and dissolved inorganic phosphate fluxes contributing 1 to 33% and 2 to 14%, respectively, of the nutrients required for primary production. The findings suggest that sediment OC quantity and quality, influenced by sediment type, are major factors controlling the spatial variation of benthic OC cycles in the SYS. However, the benthic-pelagic coupling in the SYS during spring was weak, primarily because of low sediment OC oxidation and BNF rates. This study highlights the need for further research on temporal variability to fully understand the biogeochemical cycles in the Yellow Sea.
Introduction
The Yellow Sea (YS), a semi-enclosed continental shelf sea in the northwestern Pacific Ocean, lies between the Korean Peninsula and China (Song, 2011). It receives significant inputs of terrestrial materials, including nutrients and organic matter, from multiple river systems such as the Yellow, Changjiang, Xinyi, Sheyan, Han, and Keum rivers (Song et al., 2016; Cao et al., 2022; Tian et al., 2022). These riverine inputs sustainably support primary production (PP) in the YS by supplying essential bio-limiting elements. organic matter (OM), from both external sources and internal production, are deposited in the sediment (Liu et al., 2003; Wang et al., 2003; Shi et al., 2004; Yao et al., 2014).
Once deposited, particulate organic carbon (POC, referred to as OC) on the sediment surface undergoes rapid degradation, or is progressively buried into deeper sediment layers (Thamdrup and Canfield, 1996). Within the sediment, this OC is remineralized through microbial respiration pathways, resulting in the release of dissolved inorganic nutrients and carbon across the sediment-water interface (SWI) (Canfield et al., 2005; Jørgensen et al., 2022). Therefore, the estimation of OC remineralization in sediment is crucial for understanding benthic OC cycling and nutrient regeneration.
Oxygen (O2) is the most effective electron acceptor, as it has a higher energy yield than other acceptors such as NO3–, MnO2, FeOOH, and SO42– (Canfield et al., 2005). Moreover, O2 is involved in the reoxidation of reduced substances via anaerobic respiration pathways (Canfield et al., 1993; Hulth et al., 1994). As a result, in sediments, the rate of total O2 uptake is commonly used as a proxy for OC oxidation rate (Rasmussen and Jørgensen, 1992; Giles et al., 2007; Jørgensen et al., 2022).
During the oxidation of OM in sediment, inorganic nutrients are either released or accumulated in the pore water. The nutrient concentration gradient, between the overlying water and the sediment pore water, drives nutrient transport across the SWI. This benthic nutrient flux (BNF) supplies nutrients for PP, contributing between 3% and 22% of the total nutrient supply in continental shelf areas through benthic-pelagic coupling (Hopkinson et al., 2001; Lourey et al., 2001). Thus, sediment OC remineralization is a vital component of nutrient cycling in aquatic environments.
Previous studies have suggested that OM degradation in Southern Yellow Sea (SYS) sediments is influenced by the Yellow Sea Cold Water Mass (YSCWM) (Yao et al., 2014; Song et al., 2016; Zhao et al., 2018). However, most research has focused on the Chinese side of the YS, within China’s exclusive economic zone (EEZ), with limited data available for Korean territorial waters. This study aims to estimate total sediment O2 uptake (TOU), diffusive O2 uptake (DOU), and BNFs in the SYS. Our findings will contribute to (1) understanding spatial variations in TOU and BNF, (2) identification of the controlling factors for sediment OC oxidation rates and BNFs, and (3) quantification of the contribution of sediment OC oxidation and BNF to PP in the water column through benthic-pelagic coupling on the YS shelf during the spring season.
Materials and methods
Study area
The YS is geographically separated into the Northern Yellow Sea and the SYS by a line joining the Shandong peninsula with Baengnyeong Island in South Korea (Zhang et al., 2018) (Figure 1). The SYS shelf covers an area of 300 × 103 km2 with an average water depth of 44 m (Zhao et al., 2021). Water circulation in the SYS consists of the Yellow Sea Warm Current (YSWC), the Korea Coastal Current (KCC), and the China Coastal Current (CCC) (Figure 1). The northward-flowing YSWC, a branch of the Kuroshio Current (KC) characterized by warm and saline water, feeds into the YS (Figure 1). The YSCWM forms in the bottom waters of the central SYS from late spring to autumn as a consequence of cooling of the YSWC during winter (Song, 2011). South-flowing currents include the CCC along the Chinese coast and the KCC along the Korean coast (Figure 1).
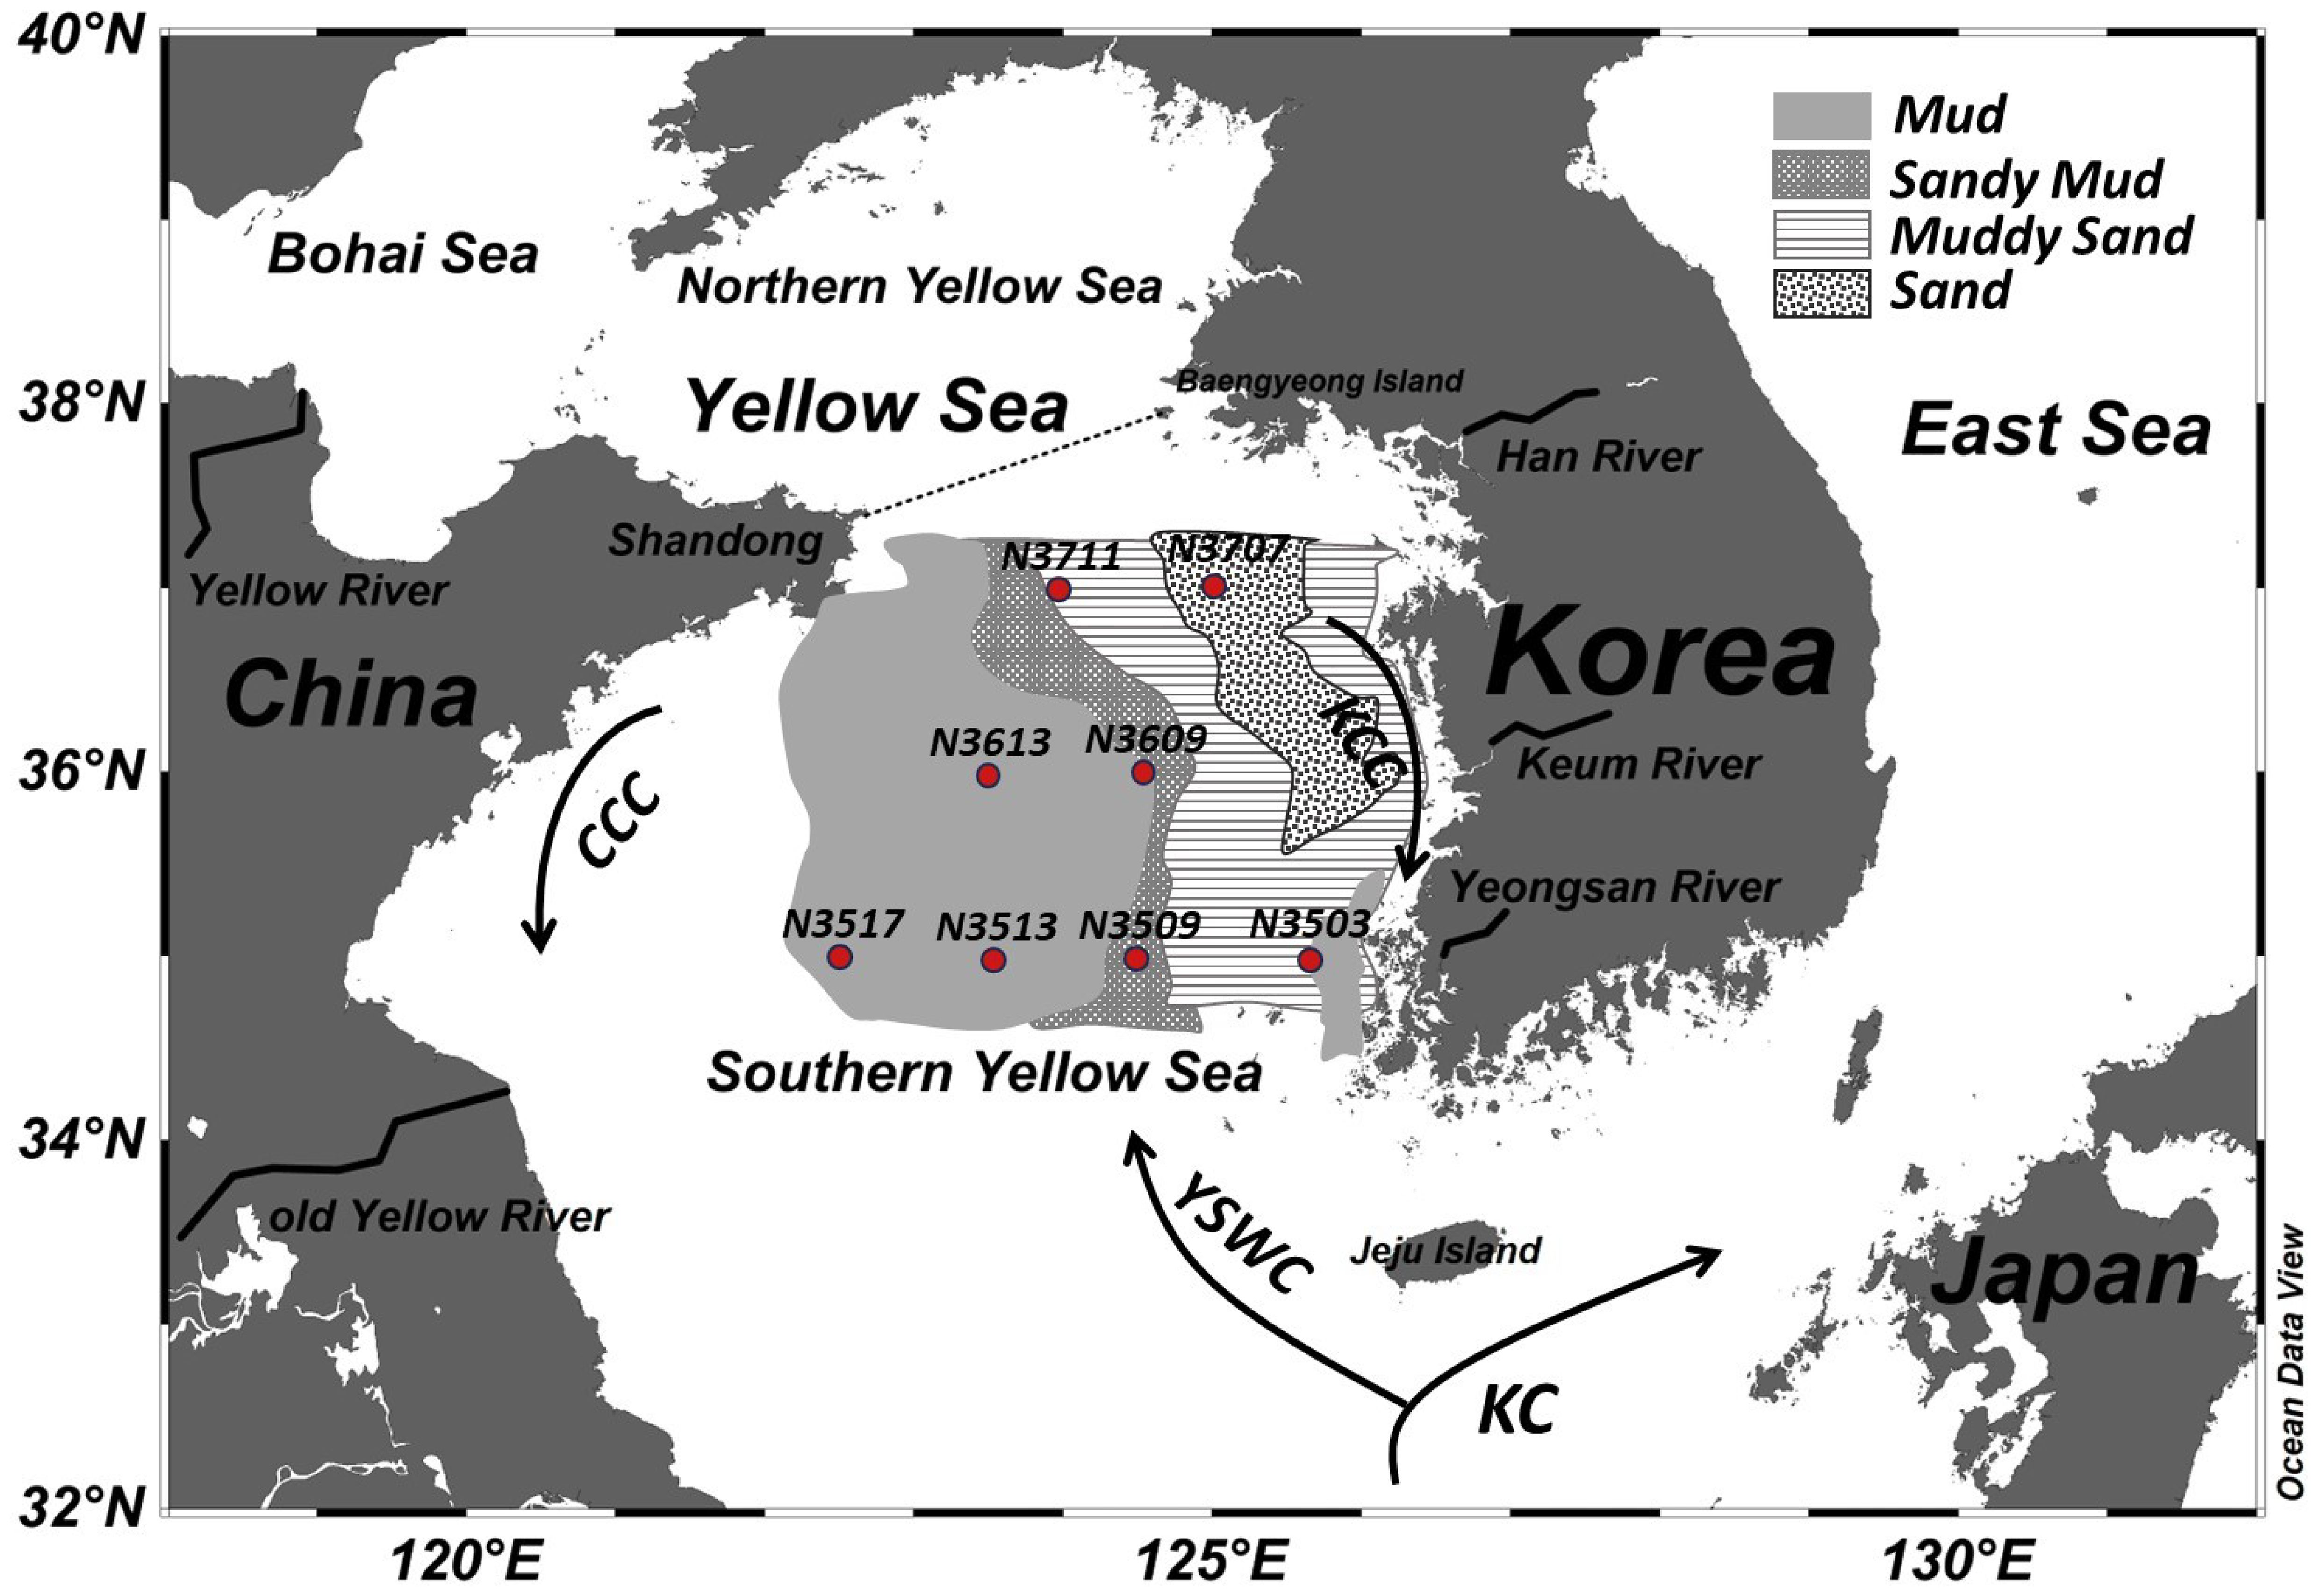
Figure 1. A map showing the sampling site locations and the circulation patterns in the south Yellow Sea, adapted from Qiao et al. (2017). The black arrows show the direction of major currents, including the Kuroshio Current (KC), Yellow Sea Warm Current (YSWC), China Coastal Current (CCC), and Korea Coastal Current (KCC). Surface sediment types in the Yellow Sea are shown, with modifications based on Park et al. (2000).
The sediment types in the SYS are influenced by a combination of hydrodynamic features and the locations of river inputs. Muddy sediments have developed in the central SYS and the western part of the Northern Yellow Sea (Shi et al., 2004). Cyclonic eddies and YSCWM have contributed to the formation of mud areas in the central SYS (i.e., at sample sites N3513, N3517, N3609, and N3613); the sources of these sediments have been traced back to the Yellow River and old Yellow River (Zhao et al., 2018) (Figure 1). A mud patch in the Eastern YS (northwest of Jeju Island; N3503) has been attributed to deposition of fine-grained materials from the Kuem River, facilitated by anticyclonic eddies (Shi et al., 2004; Song, 2011) (Figure 1). In the Southern Yellow Sea Mud Area (SYSMA), silt and clay together constitute more than 80% of the total sediment (Zhao et al., 2021). In contrast, high-energy sedimentary environments in the SYS, driven by coastal and tidal currents, exhibit continuous erosion and transportation of fine sediment (Shi et al., 2004). Consequently, the outer regions of the SYSMA (N3509, N3707, N3711) are characterized by a higher proportion of sand-size sediment than of fine sediment (Figure 1).
Sample collection
An SYS sampling survey was conducted aboard R/V Isabu from April 11 to 14, 2022 (Figure 1). The vertical distribution of water temperature, salinity, and dissolved O2 were measured with a CTD system (Seabird, SBE911plus). Undisturbed sediment samples were collected using intact acrylic cores (length = 25 cm, inner diameter = 6.5 cm) for analysis geochemistry, and incubation cores (length = 14 cm, inner diameter = 10 cm) for TOU measurement. The sediment was subsampled using a box corer (0.25 m2).
Onboard experiment
The total sediment O2 uptake rate was measured using ex situ incubation (Lee et al., 2019). The incubation chamber core was carefully inserted into the sediment without disturbing the surface. The sediment core was immediately closed with a gas-tight lid, leaving an internal water height of ~7 cm. The chamber core was submerged in a circulated water bath (EYELA, NTT-2100, Tokyo, Japan), with a constant in situ bottom water temperature, using an immersion cooler (EYELA, ECS-0, Tokyo, Japan), for a limited time (< 2 h). The O2 concentration in the chamber was measured at 10-s intervals with an inline O2 optode (Pyroscience GmbH, OXFTC2, Aachen, Germany). The optode sensors were calibrated using two-point calibration (i.e., zero concentration and air saturation of in situ bottom water). After the TOU measurement, the vertical O2 profile across the SWI was measured using an O2 microsensor (Glud, 2008). The O2 microsensor (Unisense, OX-25, Aarhus, Denmark) (tip diameter ~ 25 μm and low stirring sensitivity <1%) provided readings at 100 μm vertical intervals, with stirring of the overlying water. The output current of the microsensor was amplified by a picoammeter (Unisense, PA-3000, Aarhus, Denmark) and stored on a laptop computer via an analog-to-digital converter. Two-point calibration of the O2 microsensor was performed between 100% air saturation and zero concentration in situ bottom water, respectively. Water samples for BNFs estimation were collected at the start and end times of the TOU measurements. The collected BNFs samples were immediately filtered (0.45 μm, ADVENTEC, Tokyo, Japan) and stored in a deep freezer (< −60°C).
Laboratory analysis
To determine grain size, the sediment samples from 0–2 cm depth were oxidized and disassembled with 10% H2O2 and 0.1 N HCl. The gravel, sand, and silt in the sample were separated using the wet sieving method, and the weights of the fractions were measured. The fine fraction of the samples (< 62.5 μm) was determined using a Mastersizer 2000 laser diffraction analyzer (Malvern Instruments Ltd, Malvern, UK). The OC and TN content of the surface sediments were determined using a CHN analyzer (CE instrument, EA 1110, Milan, Italy) after removing CaCO3 with 10% HCl. The δ13C in the surface sediment was measured using an isotope ratio mass spectrometer (Isoprime, GV Instruments, Manchester, UK) interfaced with an elemental analyzer. The analytical precision for δ13C was ± 0.09‰, estimated by IAEA standards (CH-3 for carbon). The chlorophyll-a (Chl-a) in the surface sediment (0–2 cm) was extracted using 90% acetone for 24 hours and measured using a spectrophotometer (Optizen POP, KLAB, Seoul, Korea) (Parsons et al., 1984). The water samples in the incubation core for the sum of nitrate (NO2– + NO3–), NH4+, PO43–, and Si(OH)4 were analyzed using a nutrient autoanalyzer (QUAATRO, Seal Analytical, Wrexham, UK). Certified reference material (Lot. CP; Kanso Technos Co., Ltd, Osaka, Japan) was included in each batch of nutrient samples and was used to ensure the accuracy of the samples. Reproducibility was generally within ± 5%.
Calculation
The TOU and nutrient flux, via the SWI, were estimated from a least squares linear regression using the concentration gradients, with incubation time and height of the benthic chamber as follows:
where F is the TOU or the BNF (mmol m–2 d–1), dC/dt is the slope of the linear regression of time and O2 concentration, or the slope between the initial and final nutrient concentrations, V is the chamber volume (m3), and A is the chamber area (m2).
Based on the O2 vertical profiles, the upper diffusive boundary layer and the surface sediment position were determined and used to estimate the DOU (Jørgensen and Revsbech, 1985). DOU was calculated from the linear O2 slope (decreasing) relative to the upper diffusive boundary layer (Glud, 2008):
where DOU is the diffusive O2 flux (mmol m−2 d−1), D0 is the O2 molecular diffusion coefficient in seawater at a given salinity and temperature (Ramsing and Gundersen, from the table for seawater and gases, Unisense A/S) (cm−2 s−1), and dC/dZ is the linear O2 slope in the diffusive boundary layer (mmol cm−4).
Results
Oceanographic features
The sampling sites had water depths ranging from 30 to 85 m, with N3503 being the shallowest (Figure 2; Table 1). Apart from site N3517, salinity remained consistent with depth, and surface water temperatures were generally higher than bottom temperatures (Figure 2). The site nearest to the old Yellow River, N3517, has the lowest surface layer salinity among the sites (Table 1). The surface salinities and water temperatures at N3503 and N3707, which are near the Han River and Yeongsan River, were relatively lower than at other stations, likely as a result of terrestrial water inflow (Figure 2; Table 1). Overall, salinities and temperatures in both the surface and bottom waters increased from the Korean coastal waters toward the SYS, indicating freshwater discharge from rivers (Figure 2; Table 1). Dissolved O2 concentrations ranged from 241 to 317 μmol L–1, with surface waters having higher O2 concentrations than bottom waters (Table 1). Dissimilar to the patterns observed for salinity and temperature, O2 concentrations decreased from east to west (Table 1).
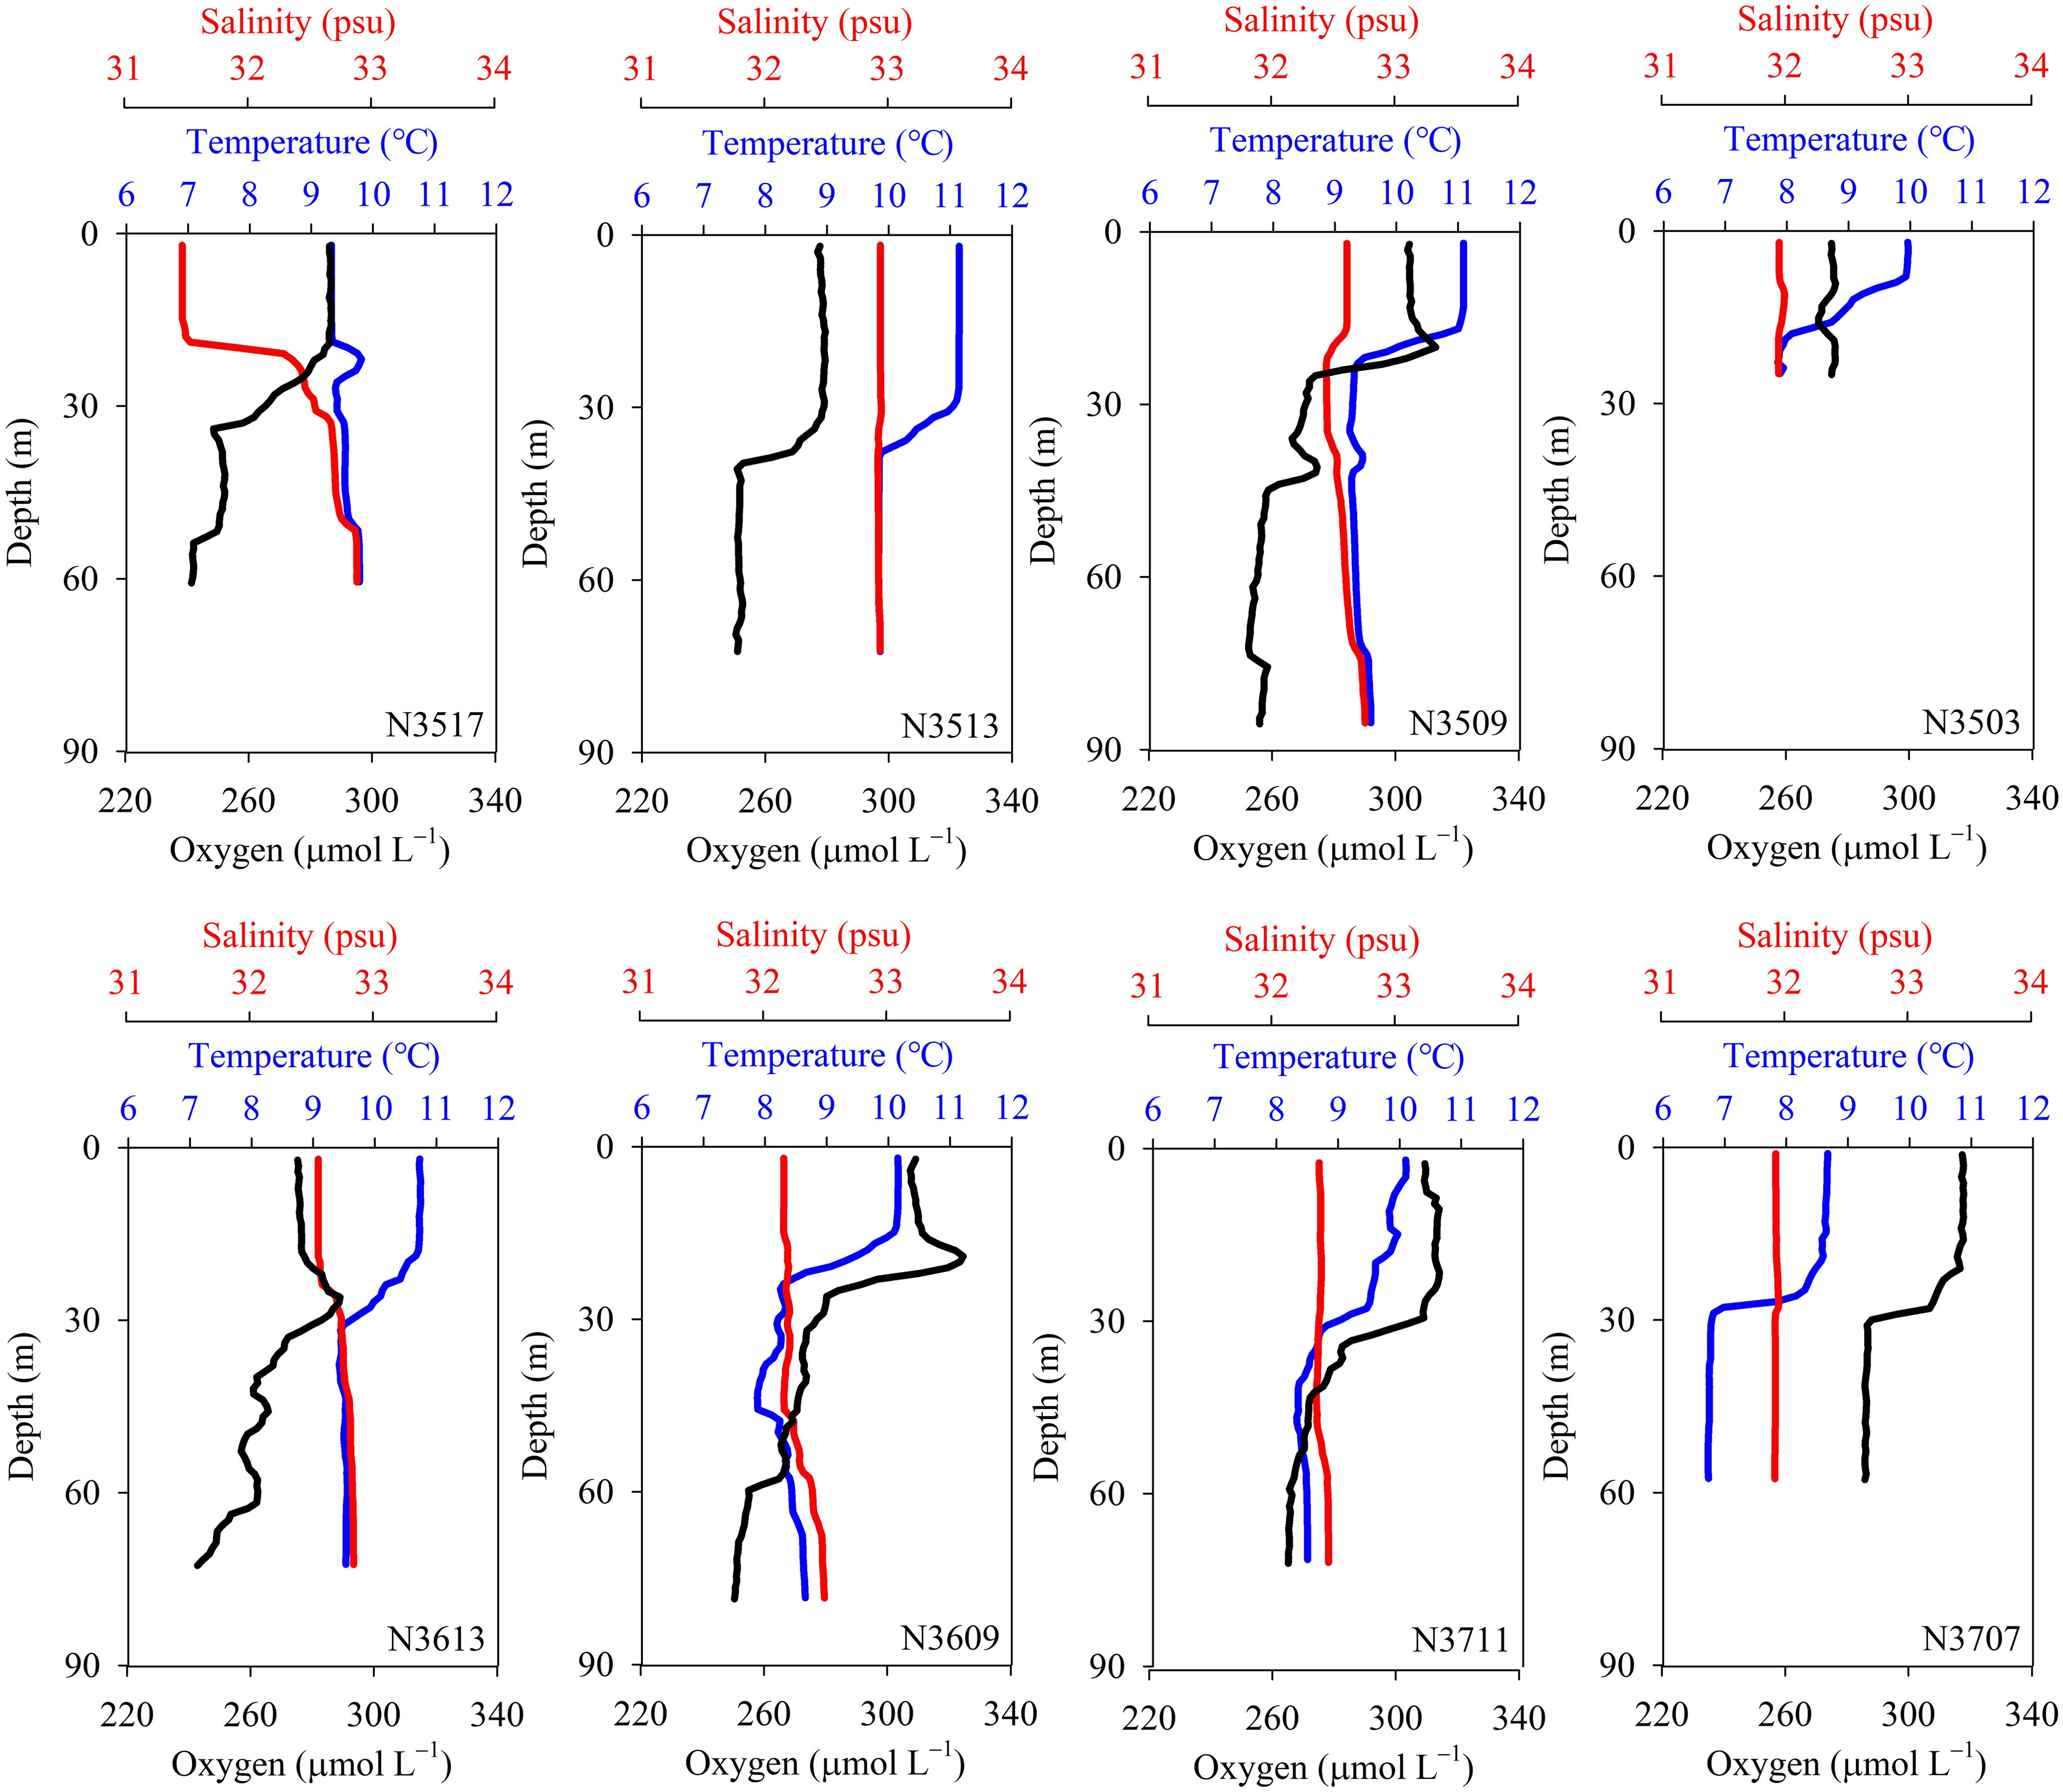
Figure 2. Vertical profiles of temperature, salinity, and dissolved oxygen concentration in the water column.
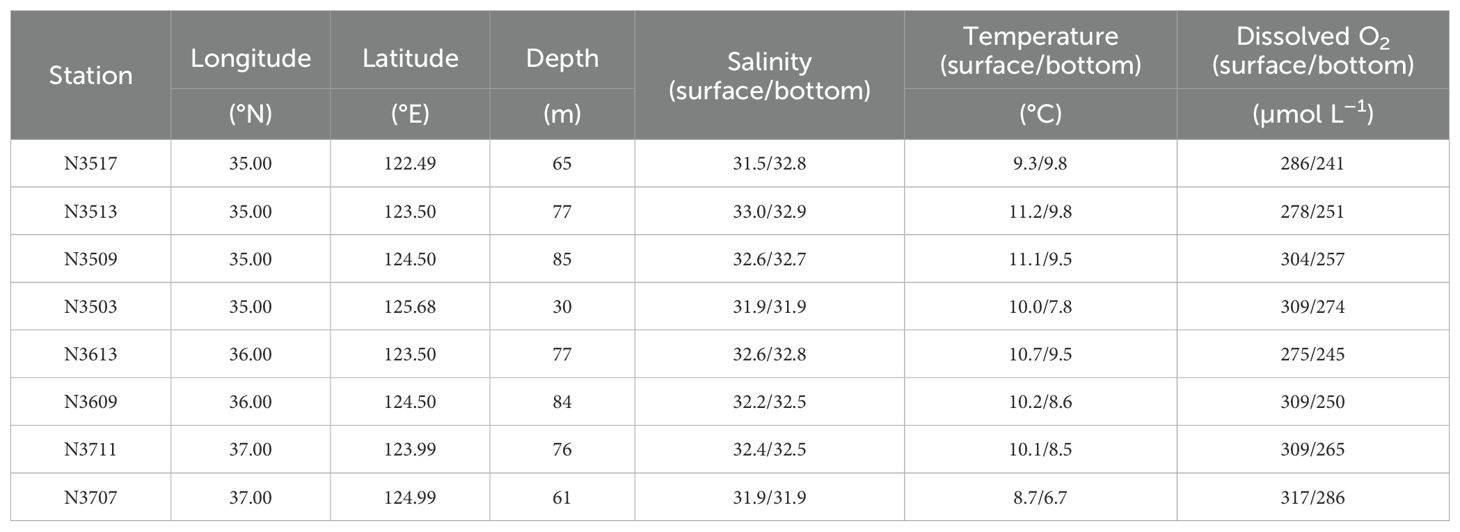
Table 1. Sampling site locations, water depth, salinity, temperature, and dissolved oxygen (O2) concentrations in the water column.
Grain size, organic carbon, and nitrogen content in the surface sediment
The grain sizes in the surface sediments varied from clay to gravel. Gravel content was 3% and was only found at site N3707 (Table 2). The sand content ranged from 2 to 86%, with the highest fraction observed at N3707 (Table 2). The silt content ranged from 8 to 76%, and the clay content ranged from 3 to 40%; N3503 had the highest silt content and N3613 had the highest clay content (Table 2). The median grain size ranged from 2.5 to 7.8 Ø, with finer-grained sediment at N3613 and coarser-grained sediment at N3707 (Table 2).
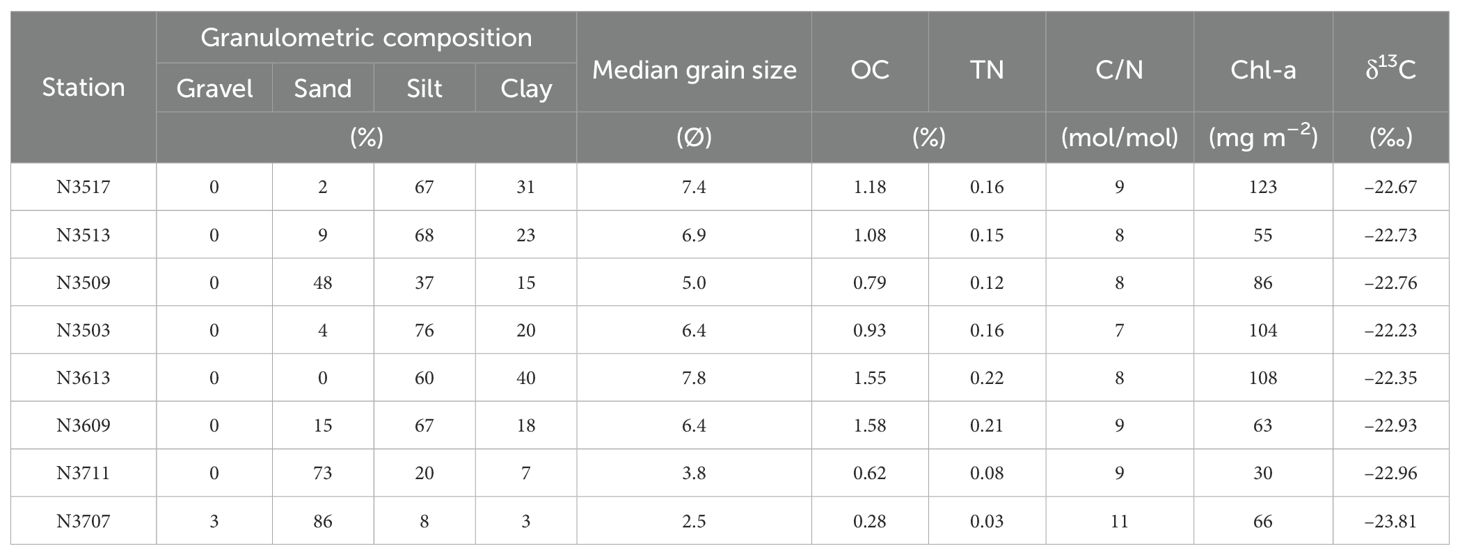
Table 2. The granulometric composition (gravel, sand, silt, and clay contents), median grain size, organic carbon (OC), total nitrogen (TN), carbon to nitrogen (C/N) ratio, chlorophyll-a (Chl-a) inventory, and δ13C in surface sediment (0–2 cm).
The OC and TN contents in the surface sediment (0–2 cm) ranged from 0.28 to 1.58% and from 0.03 to 0.22%, respectively. The highest values were in the fine sediment at N3613 and the lowest in coarse sediment at N3707 (Table 2). The carbon to nitrogen (C/N) molar ratios in the surface sediments ranged from 7 to 11, with the highest at N3707 (Table 2). The Chl-a inventory in the surface sediment showed values from 30 to 123 mg m–2, with the highest at N3517 and the lowest at N3711 (Table 2). The stable isotope δ13C values were all between –23.81 and –22.23‰, showing insignificant spatial variation (Table 2).
TOU, DOU, and BNF
The O2 concentration in the incubation chamber gradually decreased over time (Figure 3). The TOU ranged from 11.9 ± 0.02 to 20.5 ± 0.03 mmol m–2 d–1, with N3613 exhibiting approximately 2 times higher TOU than N3707 (Table 3). Vertical profiles of O2 (n = 3) in the pore water are shown in Figure 4. Unfortunately, we could not measure the vertical O2 distribution at N3711 because the microsensor failed after collisions with coarse particles or shell debris. The O2 penetration depth (OPD) varied from 0.27 ± 0.02 cm at N3613 to 0.93 ± 0.11 cm at N3509 (Table 3). The DOU ranged from 9.7 ± 2.47 to 19.4 ± 2.15 mmol m–2 d–1, with the highest value at N3613 and the lowest at N3509 (Table 3).
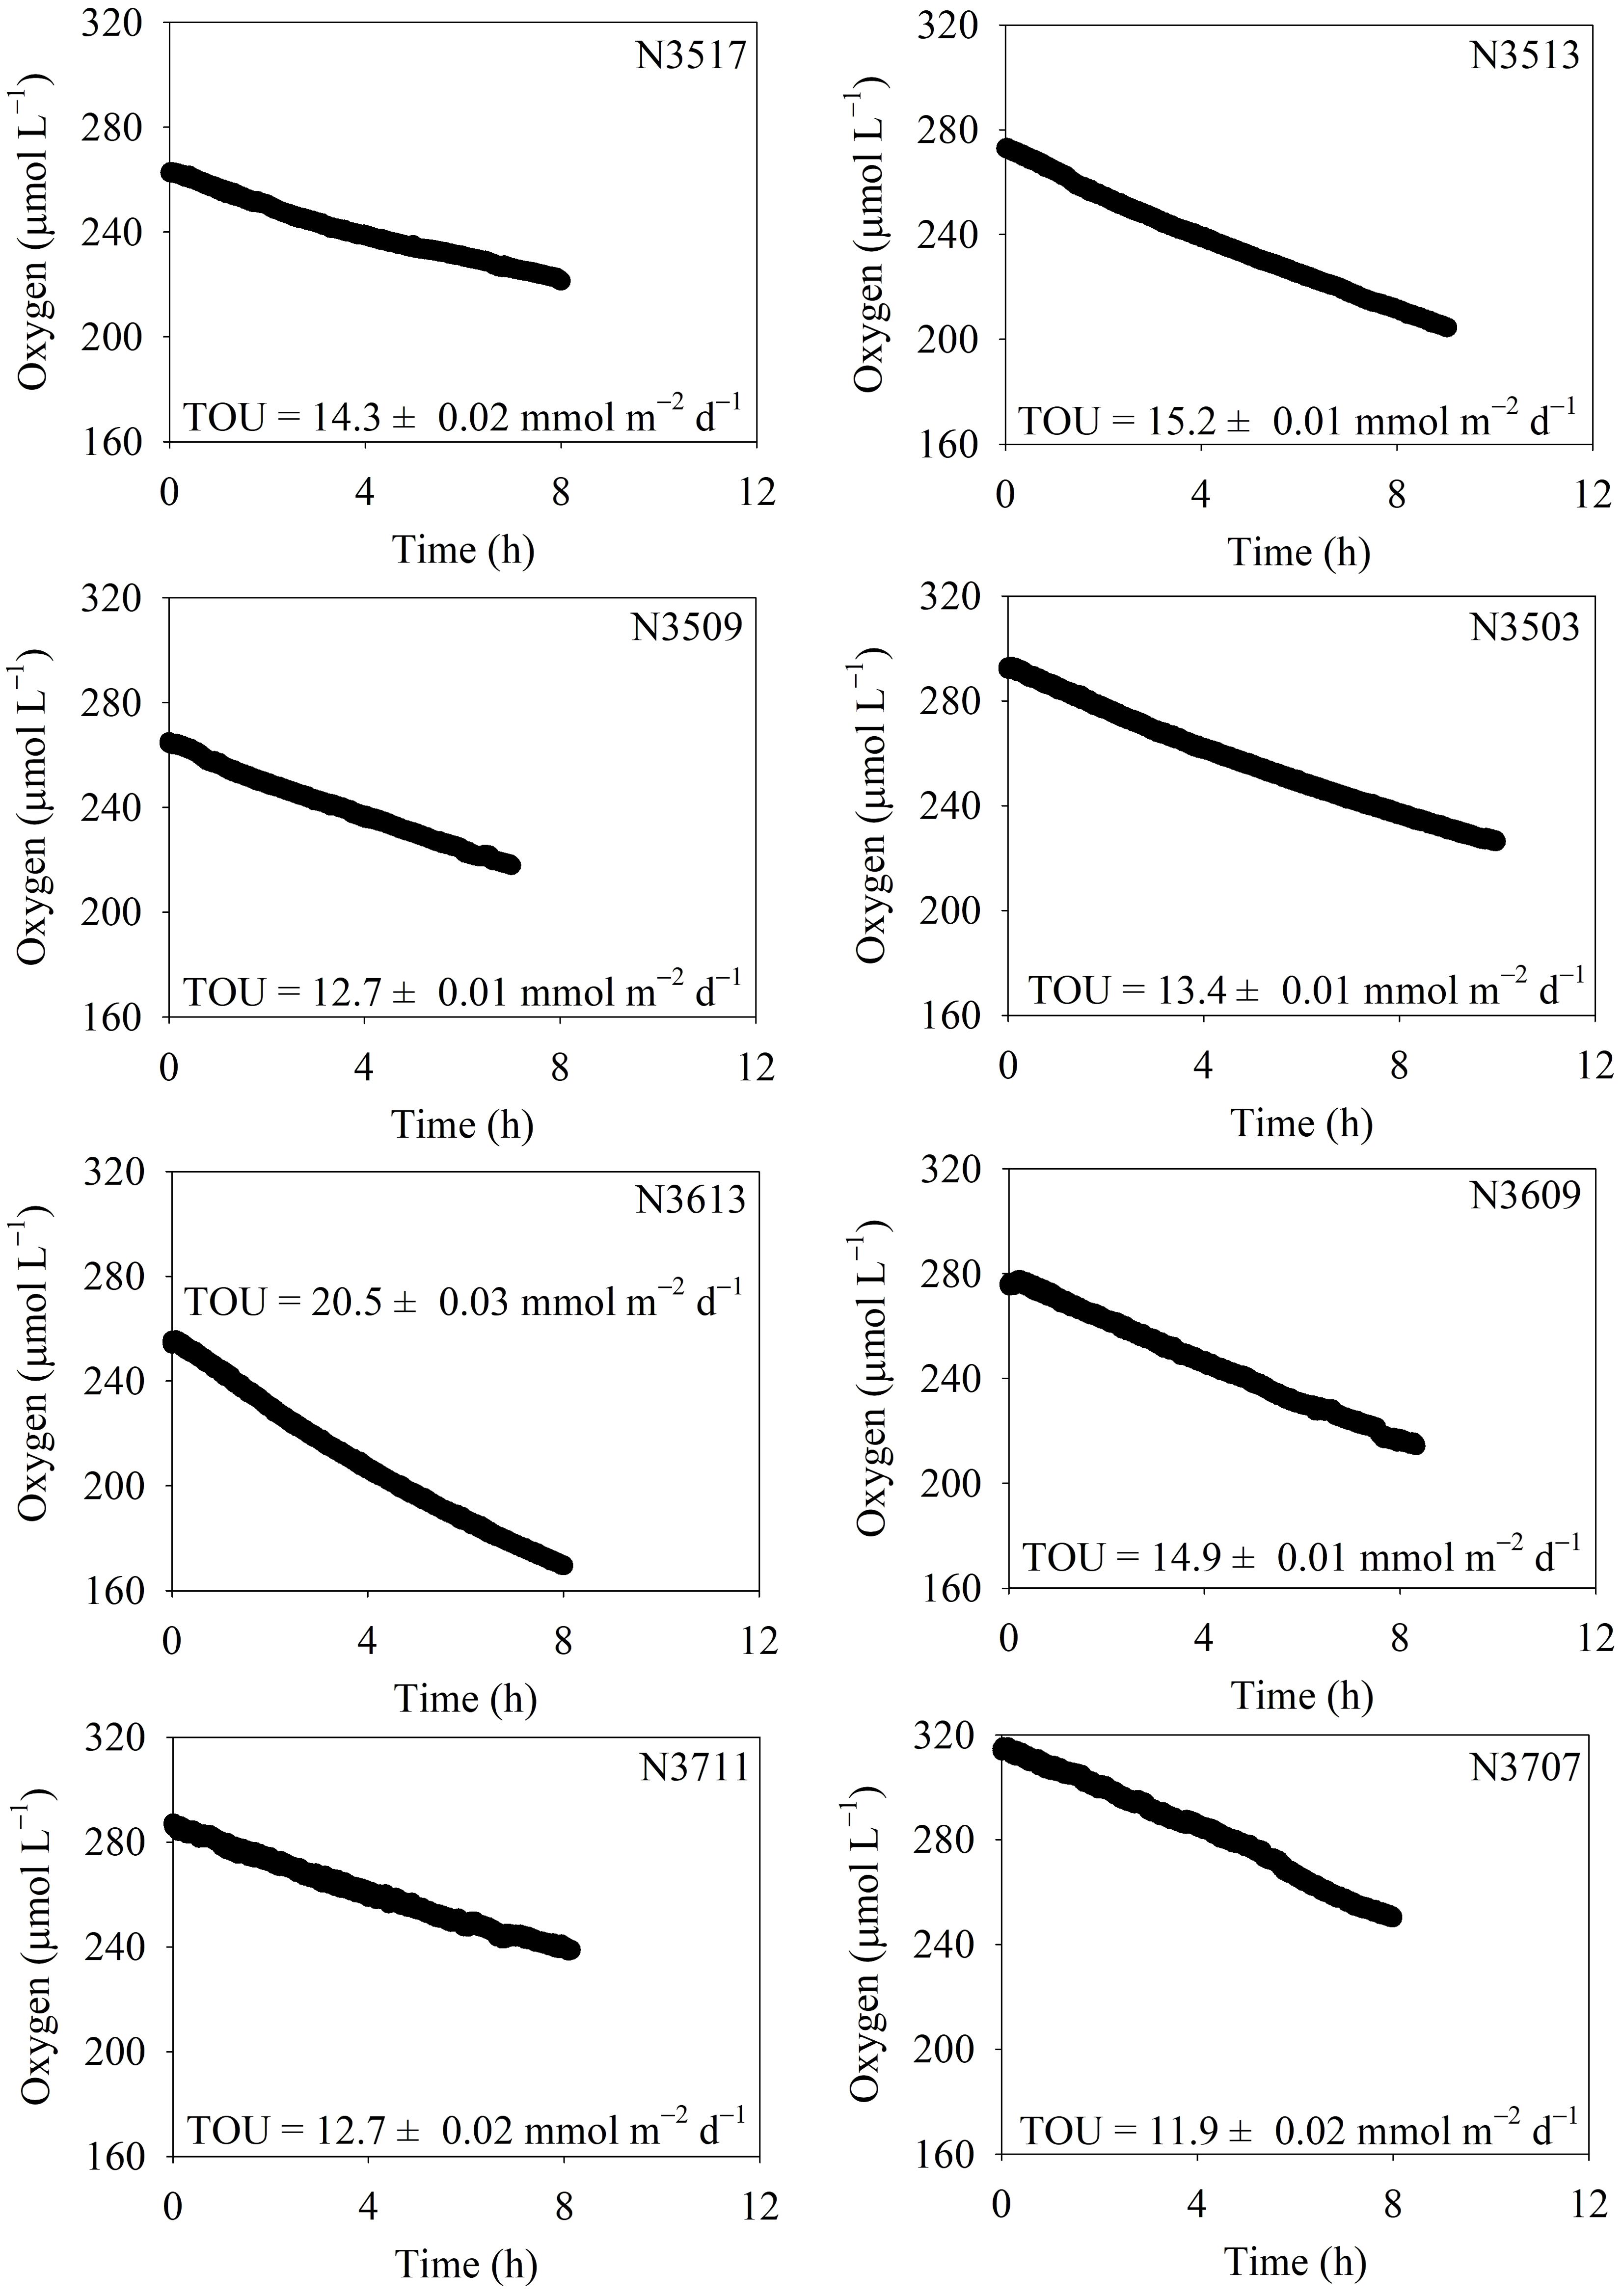
Figure 3. Temporal changes in dissolved oxygen concentration in the overlying water of the incubation core. Total sediment oxygen uptake (TOU) is determined through onboard incubation.
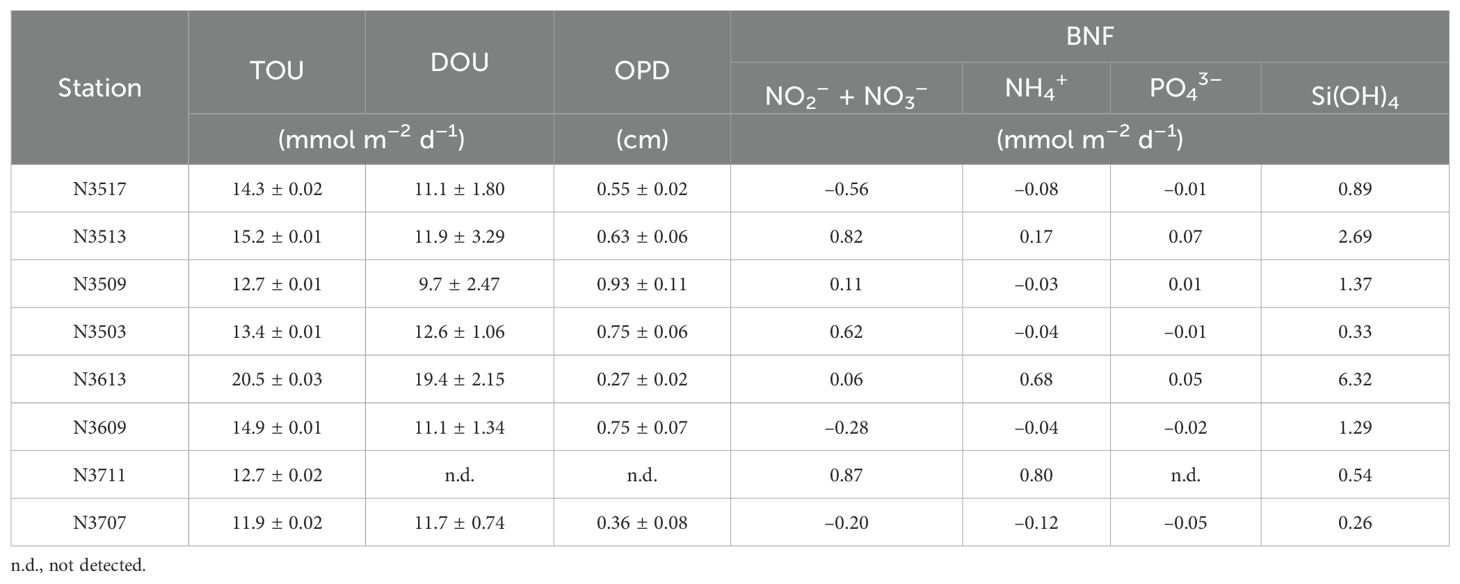
Table 3. Total sediment oxygen uptake (TOU), diffusive oxygen uptake (DOU), oxygen penetration depth (OPD), and benthic nutrient flux (BNF).
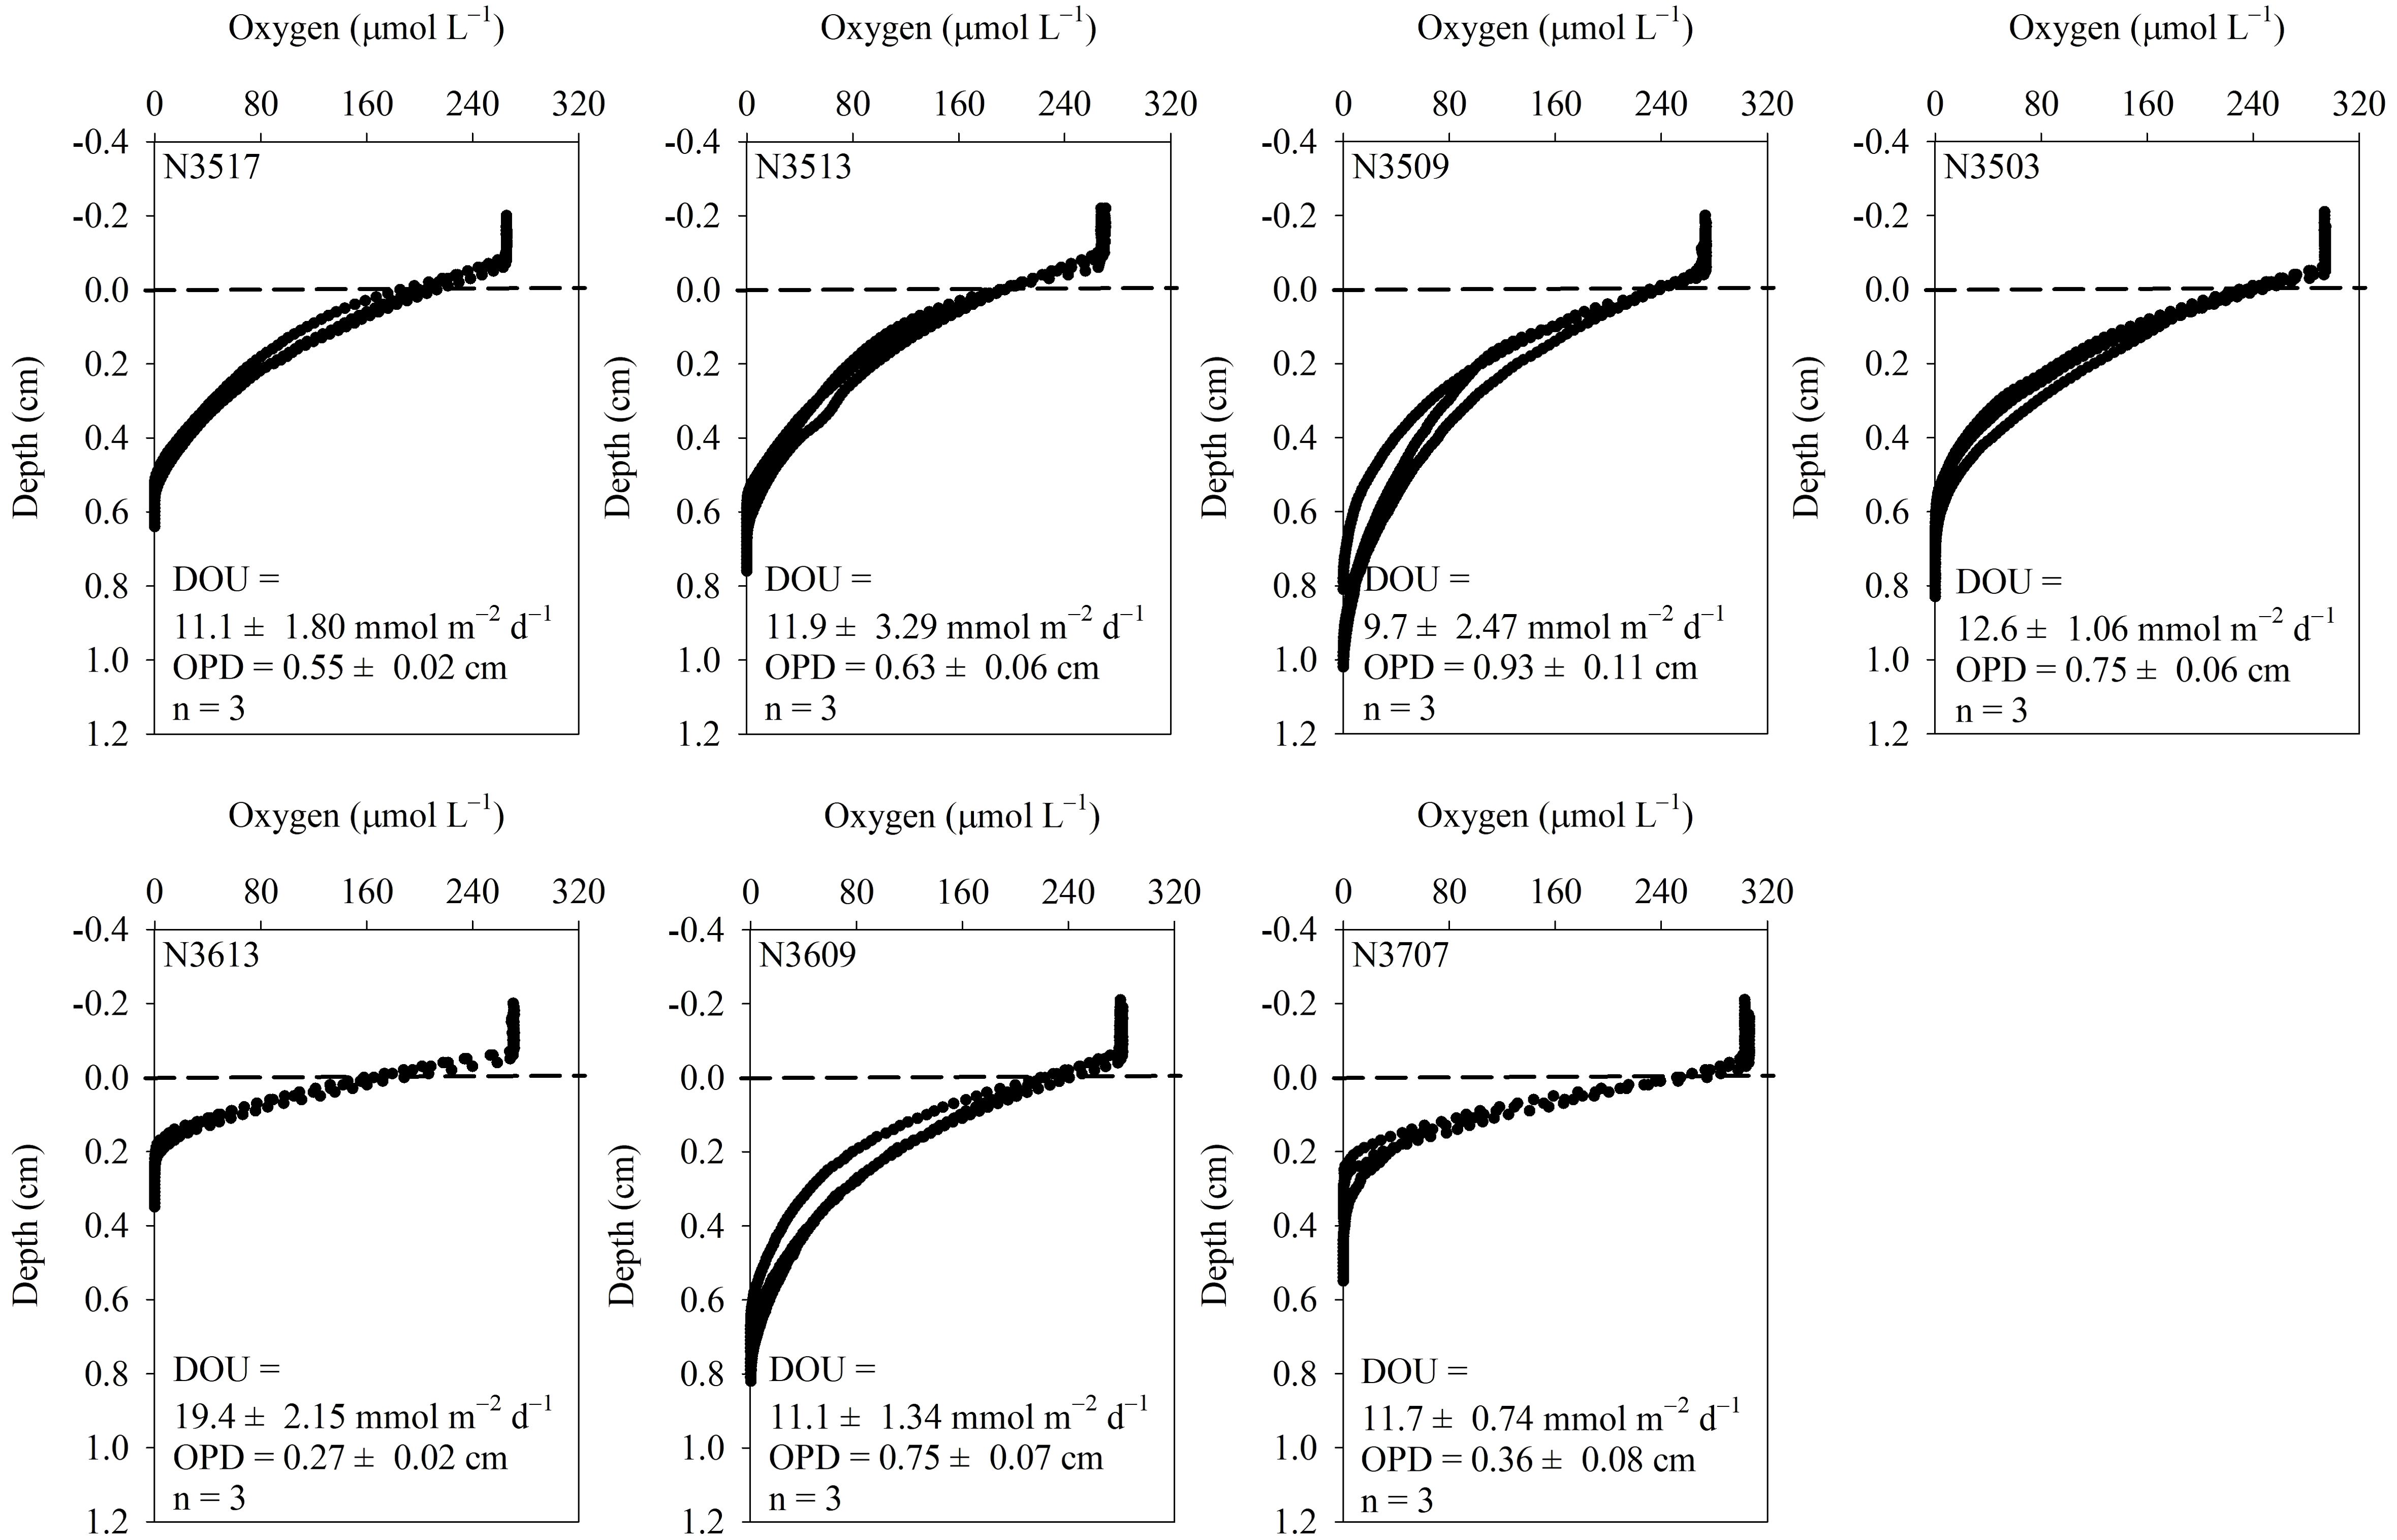
Figure 4. Vertical profiles of dissolved oxygen concentration near the sediment-water interface and oxygen penetration depth (OPD). The dotted lines represent the sediment-water interface. Diffusive oxygen uptake (DOU) was calculated using Fick’s first law of diffusion, applied to the oxygen gradient within the diffusive boundary layer.
The BNF results are also in Table 3. During the incubation, only silicate was released from the sediment (Figure 5). The BNFs ranged from –0.56 to 0.87 mmol m–2 d–1 for nitrate, –0.12 to 0.68 mmol m–2 d–1 for NH4+, –0.05 to 0.07 mmol m–2 d–1 for PO43–, and 0.26 to 6.32 mmol m–2 d–1 for Si(OH)4 (Table 3).
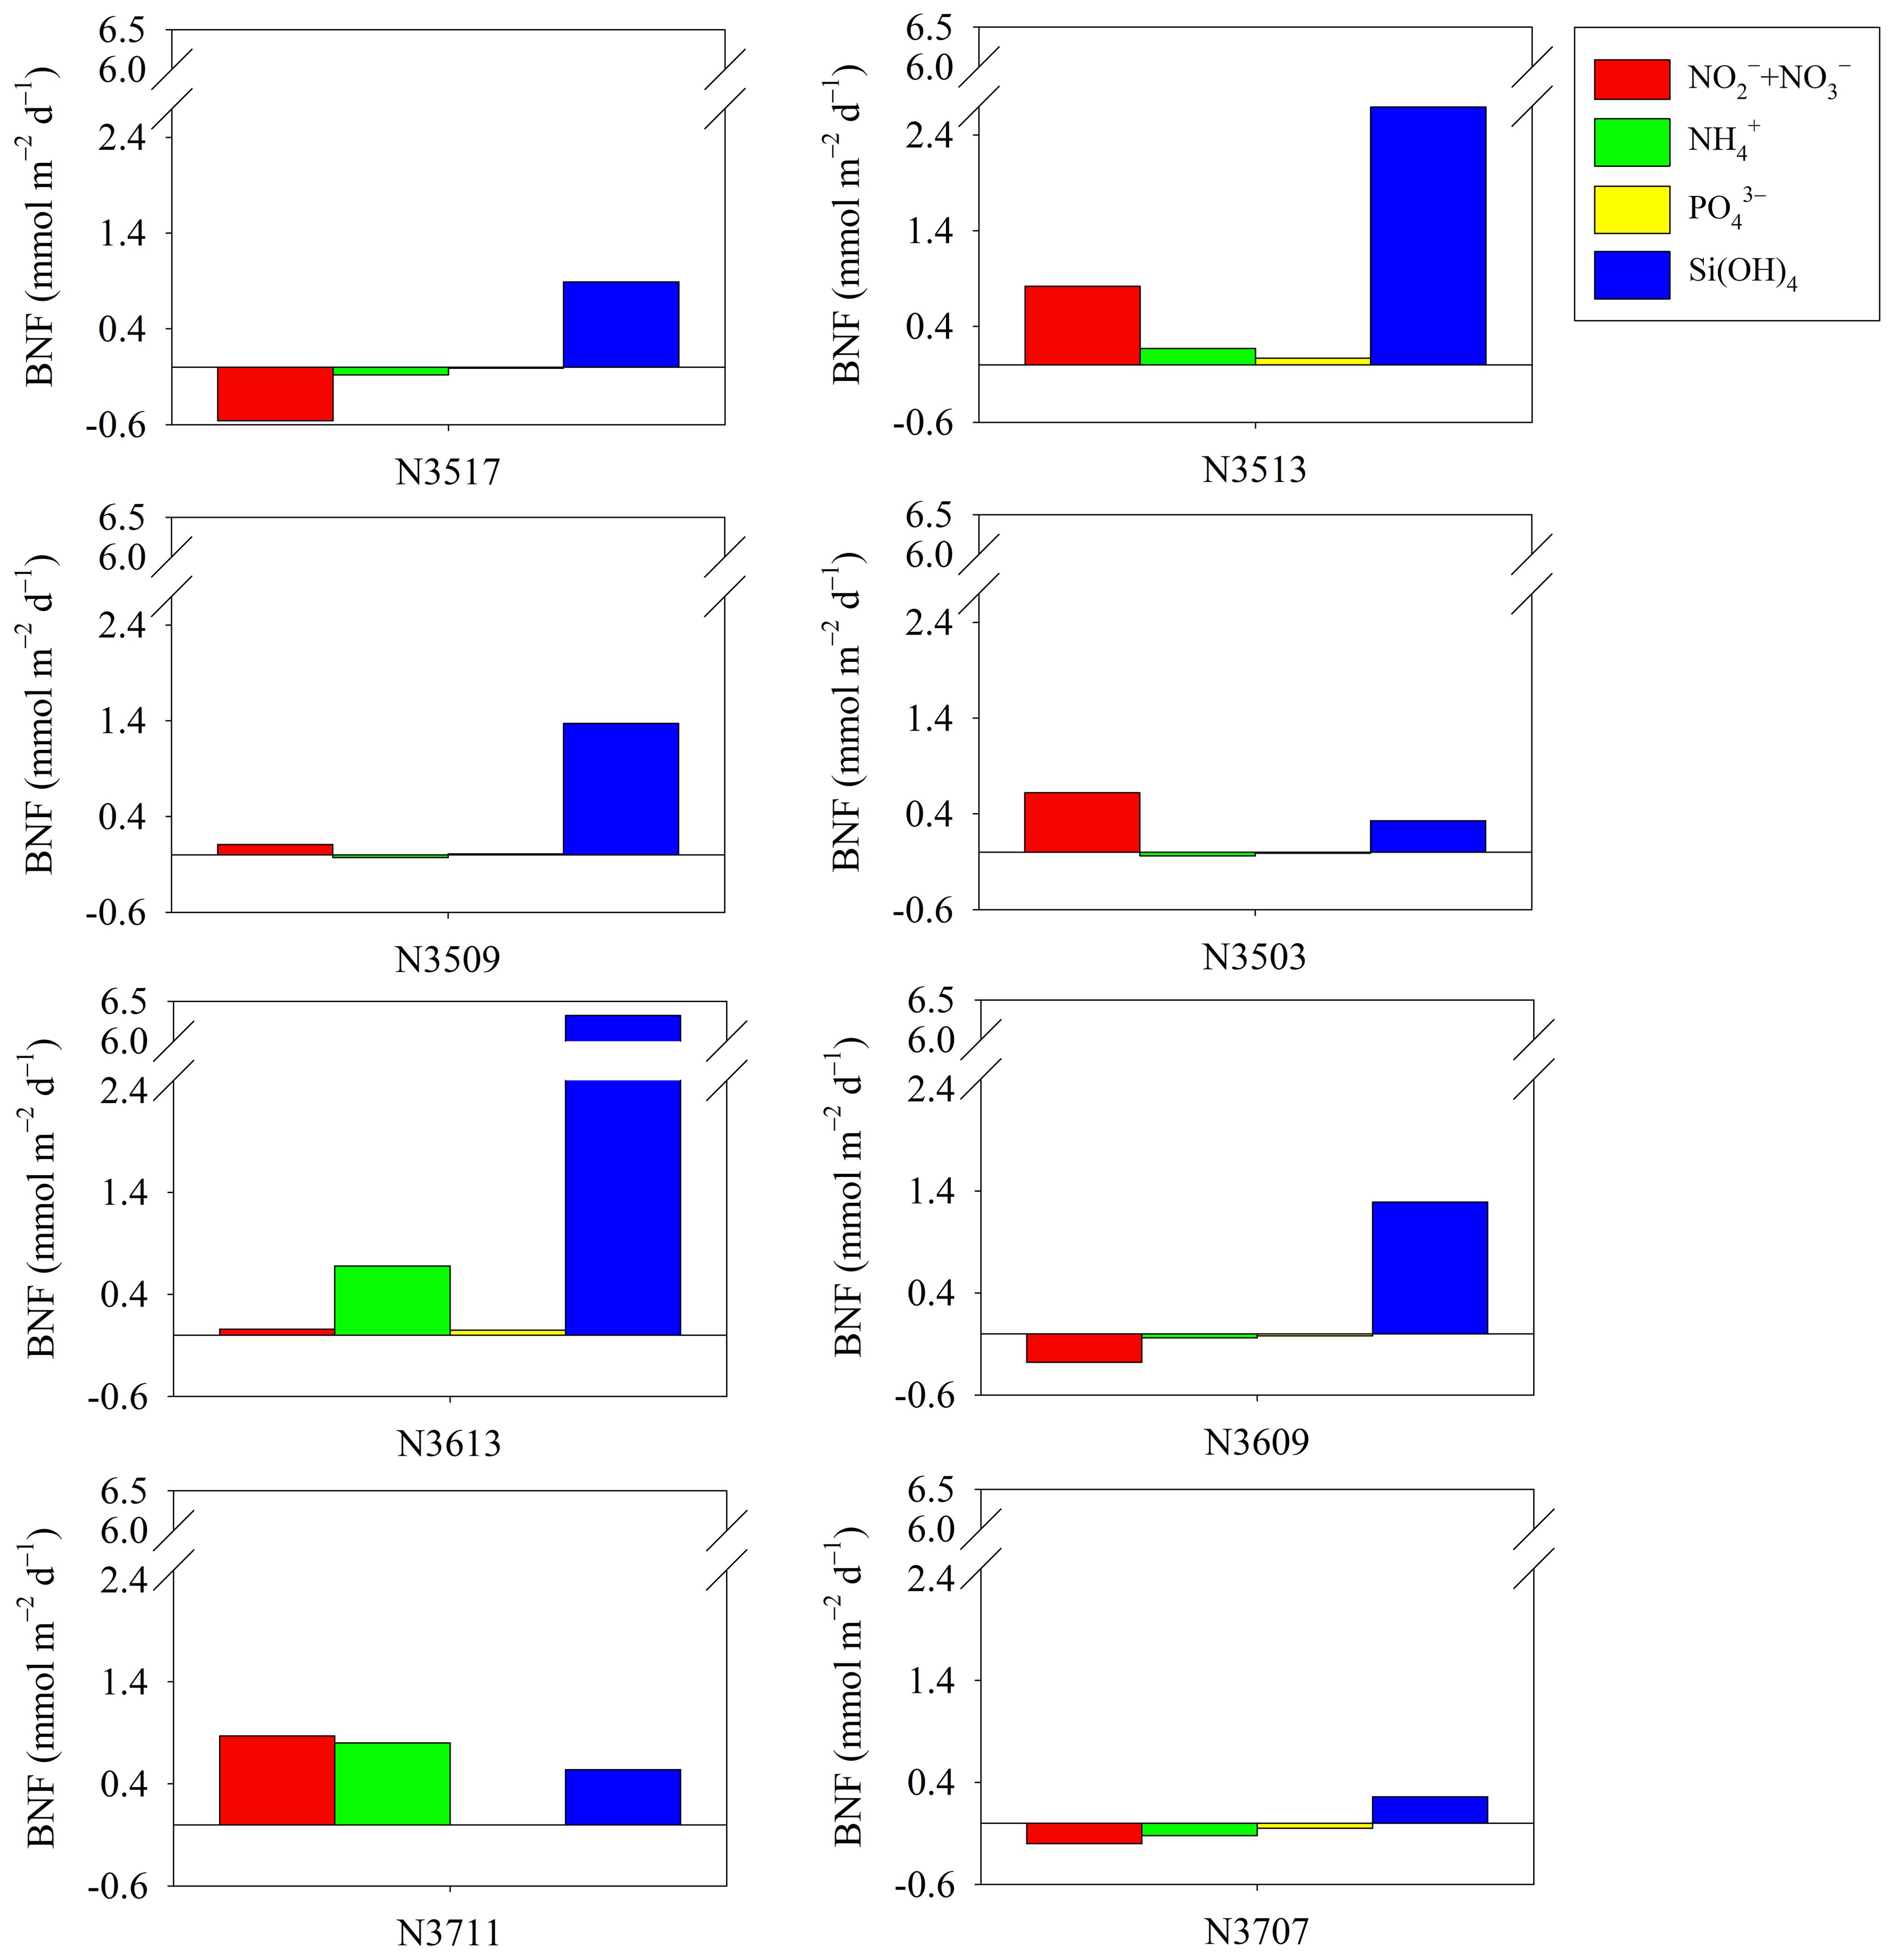
Figure 5. Comparison of benthic nutrient flux (BNF) measured through onboard incubation at different sampling sites.
Discussion
Several control factors for sedimentary OC oxidation have been suggested as underpinning the biogeochemical cycles of OC in the continental shelf (Chen et al., 2022; Jørgensen et al., 2022). Generally, the PP in the water column, sedimentary OC content and quality, sediment type, water depth, benthic fauna biomass, and bottom water O2 and temperature are the key factors influencing OC oxidation in the sediment. However, many of those factors in continental shelf sediment can differ spatiotemporally according to regional characteristics (Canfield et al., 2005; Giles et al., 2007; Pastor et al., 2011; Chen et al., 2022). In particular, the SYS features a variety of sediment types as a result of complex water mixing and the presence of sandy sediments from ancient river deltas that existed when sea levels were lower (Niino and Emery, 1961; Younm and Kim, 2002; Shi et al., 2004). Thus, sediment types can be key factors controlling sedimentary OC cycling in the SYS.
OC oxidation in SYS sediment
TOU values were significantly correlated with the surface sediment’s median grain size (r = 0.73, p < 0.05) and OC contents (r = 0.78, p < 0.05) (Figure 6). Our findings indicate that OC content may act as a control factor, in combination with grain size, for benthic OC oxidation in the YS, which is consistent with previous studies (Upton et al., 1993; Giles et al., 2007). In the SYS, sediment grain size can vary depending on local hydrodynamic characteristics (Shi et al., 2004). Zhao et al. (2021) suggested that the weak current energy and cyclonic cold eddies in the central SYS contribute to the formation of the SYSMA. In contrast, the muddy patch in the Eastern part of the SYS is formed by gradual deposition of suspended particles driven by anticyclonic circulation (Shi et al., 2004). Given that OC is preferentially adsorbed onto clay surfaces, the OC content in YS sediment could be influenced by the presence of fine sediments (Bock and Mayer, 2000; Ma et al., 2018; Guo et al., 2021). Consequently, the highest TOU was observed in fine sediment with high OC content (N3613), while coarse sediment exhibited the lowest TOU and OC content (N3707). Therefore, spatial variations in sediment OC oxidation in the SYS may be attributed to the distribution of OC across sediment types.
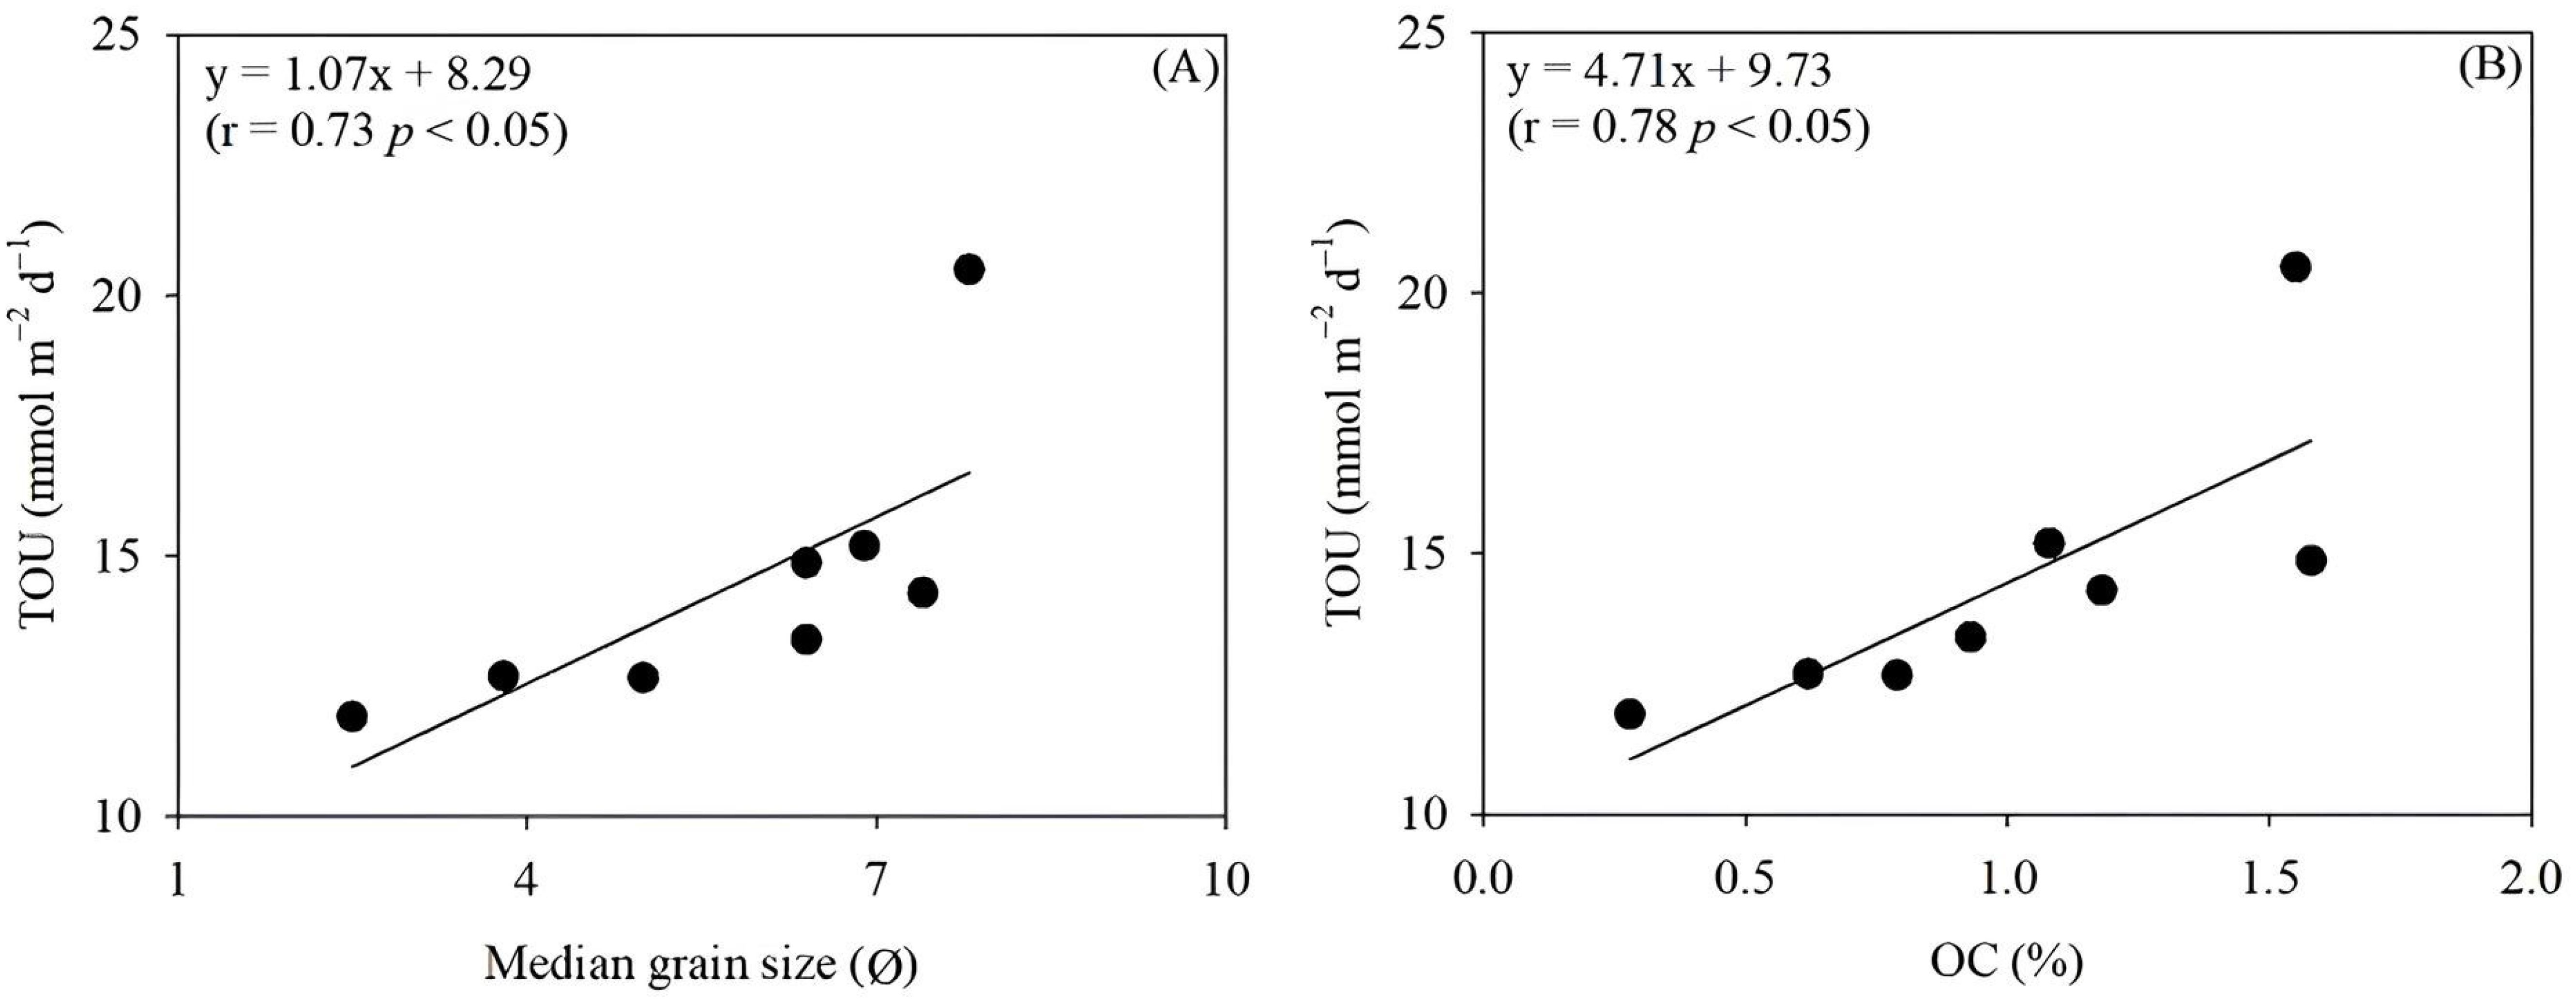
Figure 6. The relationship between total sediment oxygen uptake (TOU) and median grain size (A), and organic carbon (OC) content (B).
Although TOU, in this study, varied with grain size and OC content, the spatial differences in the SYS were not significant (Tables 2, 3). The TOU values in SYS are comparable to those measured in temperate shelf areas with similar water depth but lower than those in temperate shelf areas with higher OC contents (1.45–3.45%). Conversely, TOUs in this study were relatively higher than those in polar regions with refractory OC composition (C/N: 7.1–17.3) and lower temperatures (–1.7 to 4.0°C) (Table 4). The sedimentary OC oxidation was estimated using the Redfield ratio of 138O2:106C, and the total sediment OC oxidation rate (TCox) ranged from 9.1 to 15.8 mmol C m–2 d–1, which is higher than the values reported in previous studies in the YS, which ranged from 1.7 to 8.8 mmol C m–2 d–1 (Song et al., 2016; Zhao et al., 2018).
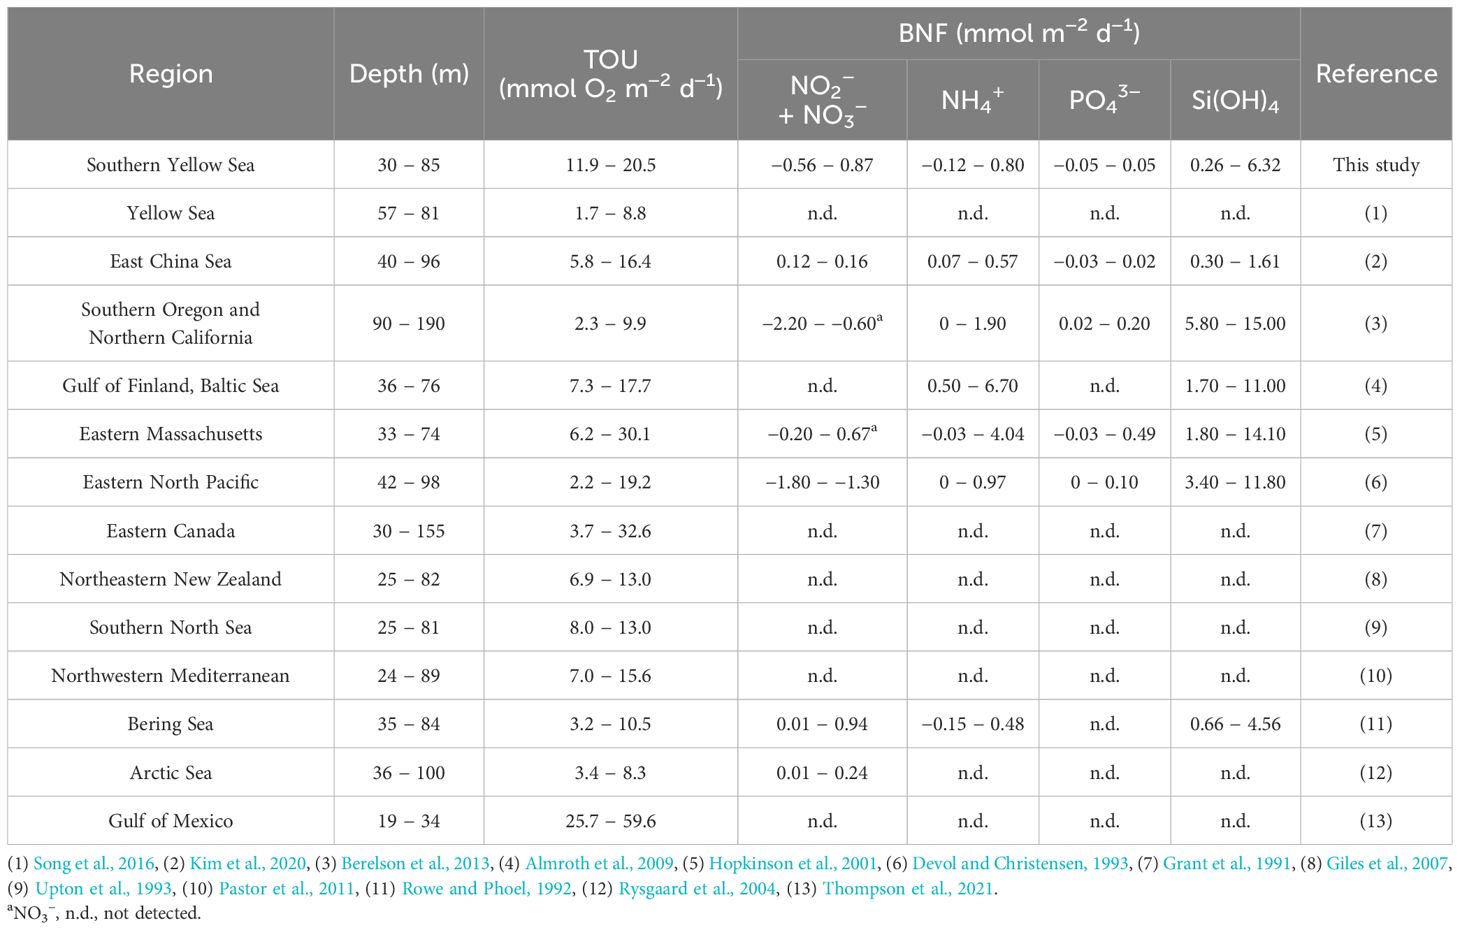
Table 4. Total sediment oxygen uptake (TOU) and benthic nutrient flux (BNF) measured in various continental shelves.
In this study, PP in the euphotic zone of the SYS ranged from 11.8 to 199.3 mmol C m–2 d–1 (Noh et al., 2024, unpublished). Assuming that all pelagic PP was remineralized through sediment OC oxidation, the TCox accounts for from 5 to 87% of PP in the water column in the SYS (Table 5). Except for N3503, TCox/PP ranged from 5 to 26%, which is comparable with values reported for the YS (8%; Song et al., 2016) and East China Sea (17%; Kim et al., 2020). In contrast, the higher TCox/PP at N3503 (87%) may be due to the low PP, likely caused by high turbidity (Song, 2011). Indeed, at N3503, Brightness Transmission (64.5–64.8%) and the Beam Attenuation Coefficient (1.73–1.75m–1) in the surface water (0–5 m) were 1.3 times lower and 2.6 times higher, respectively, compared to the average values of the other stations (84.6% and 0.67 m–1).
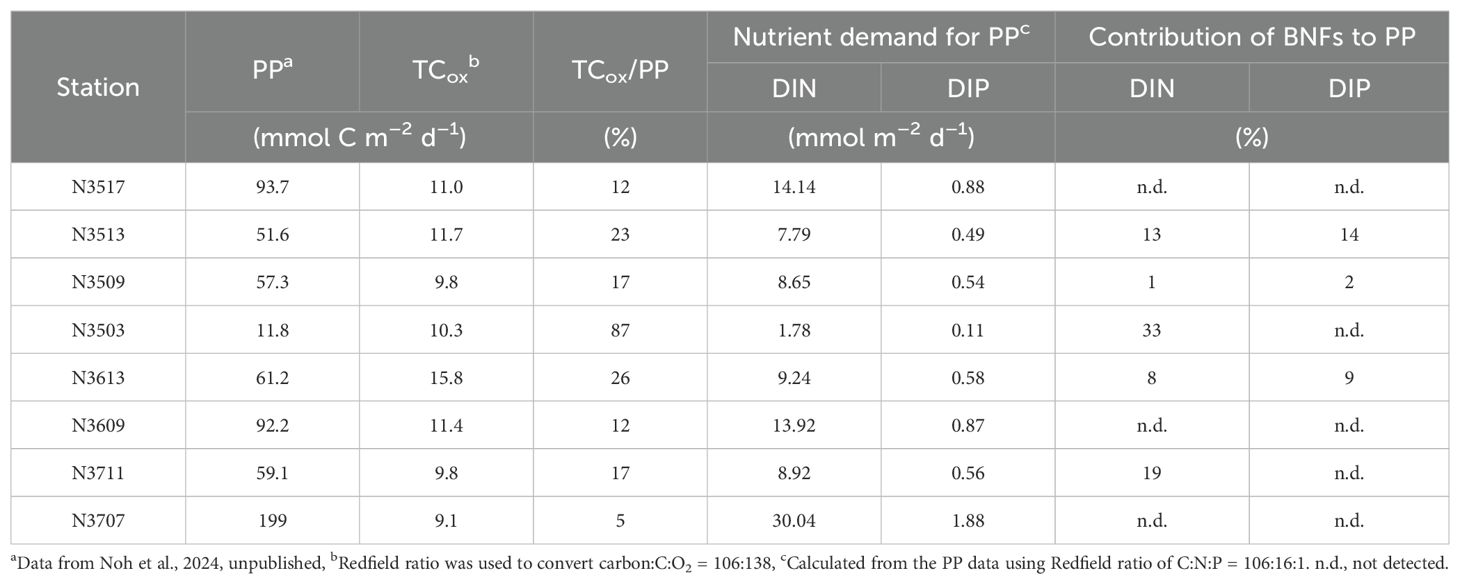
Table 5. Total sediment organic carbon oxidation (TCox), TCox/primary production (PP), nutrient demand for PP, and contribution of benthic nutrient fluxes (BNFs) to the requirement for PP.
Spatial variability of OC oxidation
The δ13C and C/N ratios in sediments are commonly used as proxies for determining the origin and/or quality of OC (Figures 1, 7; Table 4). For example, marine origin OC shows a higher δ13C ratio (–21 to –19‰) and lower C/N ratio (~ 7) than terrestrial OC (δ13C: –26 to –24‰; C/N: > 10). Any mixture of marine and terrestrial-derived OC can have values between these two endmembers (Yao et al., 2015; Chen et al., 2021). Furthermore, the normalized TOU relative to the C/N ratio can be used to distinguish the remineralization states of OC. Higher values may indicate oxidation of fresh OC, whereas lower values may suggest the oxidation of refractory OC (Figure 7).
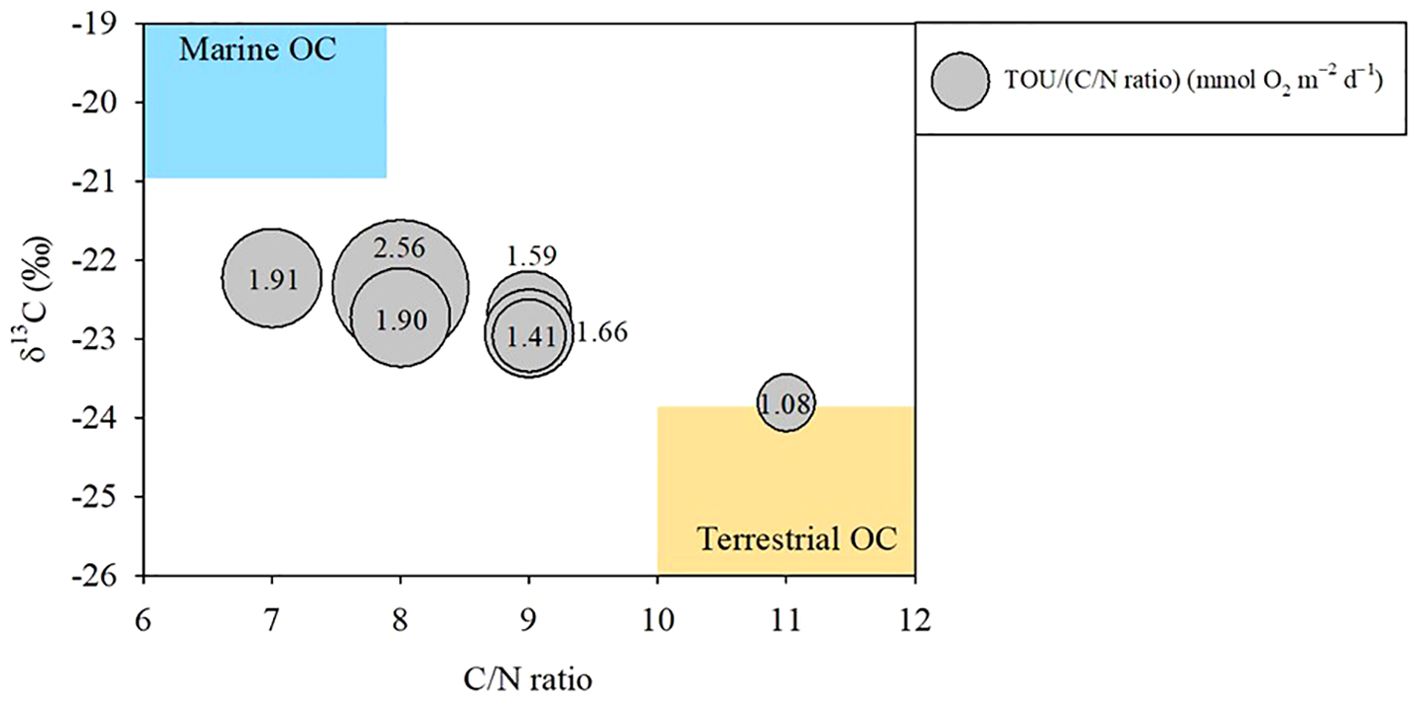
Figure 7. Bubble chart of normalized total sediment oxygen uptake (TOU) relative to the C/N ratio (TOU/(C/N)) as a function of the C/N ratio and δ13C. TOU/(C/N) represents the remineralization state of organic carbon (OC) in the sediment. The boundaries of marine OC (blue area) and terrestrial OC (yellow area) sources are based on Liu X. et al., 2020, and Chen et al., 2021.
Previous studies have suggested that the properties of OC in the surface sediment of the SYS are influenced by contributions from both marine and terrestrial sources (Zhao et al., 2018; Liu X. et al., 2020; Chen et al., 2021). The lowest value of TOU/(C/N) was observed at station N3707, which had a relatively high contribution of terrestrial OC. In contrast, other stations, with C/N ratios from 7 to 8 and δ13C values ranging from –22.96 to –22.23‰, indicated a greater fraction of marine OC, resulting in higher TOU/(C/N) ratios, approximately twice those at N3707 (Chen et al., 2021).
Terrestrial OC undergoes pre-aging before reaching an aquatic system, making it more refractory than marine OC (Arndt et al., 2013; Zhao et al., 2018). Burdige (2007) reported that terrestrial OC is more likely to be preferentially buried, while marine OC tends to be remineralized in marine sediment. Indeed, there is a distinct difference between the burial efficiencies of terrestrial OC (68%) and marine OC (7%) in YS sediments (Zhao et al., 2021). Consequently, increased terrestrial OC in sediments can reduce the efficiency of OC oxidation. These factors, which influence the fate of sediment OC, are based on its quality and are particularly significant in the SYS, where the complex distribution of OC is influenced by interactions between various OC sources and hydrodynamic characteristics.
BNF and benthic–pelagic coupling
The nutrients accumulated in pore water through benthic OC remineralization are exchanged across the SWI, potentially serving as a nutrient source for primary producers in the water column (Mortimer et al., 1999; Hopkinson et al., 2001; An et al., 2019; Guo et al., 2020; Yang et al., 2021). Therefore, estimating nutrient flux is essential for evaluating benthic-pelagic coupling. The BNFs measured in this study were within the ranges reported in most of the related literature (Table 4). The fluxes of nitrate, NH4+, and PO43– showed transport in either direction across the SWI, at different stations, indicating that these nutrients were either released from the sediment or absorbed into it.
During sediment OC oxidation, dissimilatory nitrate reduction to ammonia can increase NH4+ while decreasing nitrate (Nunnally et al., 2013; Yang et al., 2021). However, our results did not show simultaneous efflux of NH4+ and nitrate influx (Figure 5). Additionally, NH4+ and nitrate fluxes were not correlated with TOU (Spearman, r = 0.35, p = 0.40), and the average OPD was 0.61 ± 0.21 cm (Table 3). These findings indicate that during spring the SYS sediment was oxic, favoring nitrification (Song et al., 2021). Janssen et al. (2005) demonstrated that in highly permeable, coarse-grained sediment, greater oxygen penetration depth promotes ammonium nitrification, leading to relatively lower ammonium release compared to fine-grained sediments. Under oxic conditions, nitrification can decrease NH4+ and increase nitrate in the upper sediment layer, promoting NH4+ influx and nitrate efflux (Rowe and Phoel, 1992; Denis and Grenz, 2003; Rysgaard et al., 2004; Louis et al., 2021). Zhou et al. (2022) suggested that a combination of nitrification and denitrification processes may control the NH4+ and nitrate fluxes in the SYS. Therefore, the relative contributions of nitrification and denitrification processes, for OC oxidation, may affect NH4+ and nitrate fluxes at the SWI.
The benthic PO43– flux was not correlated with TOU (Spearman, r = 0.53, p = 0.18). Therefore, the low efflux and uptake of PO43– might be attributed to removal processes exceeding regeneration of inorganic nutrients via benthic OC oxidation. The decrease in PO43– flux is likely a consequence of adsorption onto Fe-oxides in the oxidative environment of the samples (Liu J. et al., 2020; Yang et al., 2021). An et al. (2019) reported that the release of PO43– from iron-bound inorganic P (Fe-P) results from the biotic and/or abiotic reduction of Fe(III) under anaerobic conditions. In addition, Louis et al. (2021) reported that low porosity can reduce the thickness of the oxic layer in sediment, which can enhance the solubilization of Fe(III)-bound phosphorus, thereby increasing phosphorus flux across the sediment-water interface. Unlike dissolved inorganic nitrogen (DIN) and phosphate (DIP), Si(OH)4 was released from sediment at all stations (Table 3). Previous studies have shown that silicate efflux is related to the biogenic silica concentration in the sediment and benthic remineralization (Conley et al., 1989; Denis and Grenz, 2003; Miatta and Snelgrove, 2021; Yang et al., 2021). Although dissolved inorganic silicate (DSi) flux was not correlated with Chl-a (Spearman, r = 0.10, p = 0.82), it was significantly correlated with TOU (Spearman, r = 0.78, p < 0.05). These results imply that SYS sediments could potentially serve as major sources of Si(OH)4 with sediment OC degradation (Liu et al., 2016).
Using the Redfield ratio (C:N:P = 106:16:1, Redfield et al., 1963; Conley et al., 1989), we estimated the contribution of BNF to the nutrient requirements for PP in the water column. The levels of DIN and DIP were, respectively, 1–33% and 2–14% of the nutrients required for PP (Table 5). These findings suggest that the significance of BNF in supplying N and P from sedimentary OC remineralization in the SYS during spring, may vary among the sediment types. In addition, the BNFs in this study were comparable with, or less than, those in other shelf seas with similar water depths (Table 4). Moreover, the benthic-pelagic coupling in the SYS during spring appears to be less significant than in other shelf areas (Denis and Grenz, 2003; Kim et al., 2020; Yang et al., 2021).
Conclusion
The TOU measured in the SYS during spring suggests that variations of OC content across sediment types play a crucial role in controlling sediment OC oxidation. Regardless of OC content and median grain size, the influences of variations in OC quality, as indicated by the C/N ratio and δ13C, on TOU exhibited distinct differences. The contribution of terrestrial and marine sources to sediment OC composition may control the efficiency of sediment OC oxidation. Thus, both the quantity and quality of sediment OC are key factors in determining the spatial characteristics of the benthic OC cycle in the SYS. With the exception of DSi flux, BNFs exhibited a weak correlation with sediment OC oxidation. Additionally, the nutrient efflux observed in this study was comparable with or lower than that on other continental shelves, and the contribution of BNFs to the nutrient requirements of PP was minimal. Consequently, the benthic-pelagic coupling in the SYS during spring was weak due to low BNF, following the low sediment OC oxidation rate. However, since our results are representative only of the spring season, further studies on temporal variability are necessary to fully understand the biogeochemical cycle in the YS.
Data availability statement
The original contributions presented in the study are included in the article/supplementary material. Further inquiries can be directed to the corresponding author.
Author contributions
JB: Conceptualization, Formal analysis, Visualization, Writing – original draft. SK: Conceptualization, Visualization, Writing – review & editing. KK: Conceptualization, Formal analysis, Funding acquisition, Writing – review & editing. JC: Investigation, Methodology, Writing – review & editing. HJ: Investigation, Methodology, Writing – review & editing. CL: Methodology, Visualization, Writing – review & editing. SA: Writing – review & editing. JL: Conceptualization, Funding acquisition, Investigation, Visualization, Writing – review & editing.
Funding
The author(s) declare that financial support was received for the research and/or publication of this article. This work was supported by the National Research Foundation of Korea (NRF) grant funded by the Korea government (MSIT) (RS-2022-NR068500) and Korea Institute of Marine Science and Technology Promotion (KIMST) funded by the Ministry of Oceans and Fisheries (20210696). This work was also supported by grants from the National Marine Biodiversity Institute of Korea (2025M00300).
Conflict of interest
The authors declare that the research was conducted in the absence of any commercial or financial relationships that could be construed as a potential conflict of interest.
Generative AI statement
The author(s) declare that no Generative AI was used in the creation of this manuscript.
Publisher’s note
All claims expressed in this article are solely those of the authors and do not necessarily represent those of their affiliated organizations, or those of the publisher, the editors and the reviewers. Any product that may be evaluated in this article, or claim that may be made by its manufacturer, is not guaranteed or endorsed by the publisher.
References
Almroth E., Tengberg A., Andersson J. H., Pakhomova S., Hall P. O. J. (2009). Effects of resuspension on benthic fluxes of oxygen, nutrients, dissolved inorganic carbon, iron and manganese in the Gulf of Finland, Baltic Sea. Cont. Shelf Res. 29, 807–818. doi: 10.1016/j.csr.2008.12.011
An S. U., Mok J. S., Kim S. H., Choi J. H., Hyun J. H. (2019). A large artificial dyke greatly alters partitioning of sulfate and iron reduction and resultant phosphorus dynamics in sediments of the Yeongsan River estuary, Yellow Sea. Sci. Total Environ. 665, 752–761. doi: 10.1016/j.scitotenv.2019.02.058
Arndt S., Jørgensen B. B., LaRowe D. E., Middelburg J. J., Pancost R. D., Regnier P. (2013). Quantifying the degradation of organic matter in marine sediments: A review and synthesis. Earth Sci. Rev. 123, 53–86. doi: 10.1016/j.earscirev.2013.02.008
Berelson W. M., McManus J., Severmann S., Reimers C. E. (2013). Benthic flux of oxygen and nutrients across Oregon/California shelf sediments. Cont. Shelf Res. 55, 66–75. doi: 10.1016/j.csr.2013.01.009
Bock M. J., Mayer L. M. (2000). Mesodensity organo–clay associations in a near-shore sediment. Mar. Geol. 163, 65–75. doi: 10.1016/S0025-3227(99)00105-X
Burdige D. J. (2007). Preservation of organic matter in marine sediments: Controls, mechanisms, and an imbalance in sediment organic carbon budgets? Chem. Rev. 107, 467–485. doi: 10.1021/cr050347q
Canfield D. E., Kristensen E., Thamdrup B. (2005). Aquatic geomicrobiology. Adv. Mar. Biol. 48, 1–599. doi: 10.1016/s0065-2881(05)48017-7
Canfield D. E., Thamdrup B., Hansen J. W. (1993). The anaerobic degradation of organic matter in Danish coastal sediments: iron reduction, manganese reduction, and sulfate reduction. Geochim. Cosmochim. Acta 57, 3867–3883. doi: 10.1016/0016-7037(93)90340-3
Cao Y., Bi R., Wang X., Chen X., Hu J., Wang Y., et al. (2022). The sources and burial of marine organic carbon in the eastern China marginal seas. Front. Mar. Sci. 9. doi: 10.3389/fmars.2022.824181
Chen Y., Hu C., Yang G.-P., Gao X.-C. (2021). Source, distribution and degradation of sedimentary organic matter in the South Yellow Sea and East China Sea. Estuar. Coast. Shelf Sci. 255, 107372. doi: 10.1016/j.ecss.2021.107372
Chen Z., Nie T., Zhao X., Li J., Yang B., Cui D., et al. (2022). Organic carbon remineralization rate in global marine sediments: A review. Reg. Stud. Mar. Sci. 49, 102112. doi: 10.1016/j.rsma.2021.102112
Conley D. J., Kilham S. S., Theriot E. (1989). Differences in silica content between marine and freshwater diatoms. Limnol. Oceanogr. 34, 205–212. doi: 10.4319/lo.1989.34.1.0205
Denis L., Grenz C. (2003). Spatial variability in oxygen and nutrient fluxes at the sediment-water interface on the continental shelf in the Gulf of Lions (NW Mediterranean). Oceanologica Acta 26, 373–389. doi: 10.1016/s0399-1784(03)00017-3
Devol A. H., Christensen J. P. (1993). Benthic fluxes and nitrogen cycling in sediments of the continental margin of the eastern North Pacific. J. Mar. Res. 51, 345–372. doi: 10.1357/0022240933223765
Giles H., Pilditch C. A., Nodder S. D., Zeldis J. R., Currie K. (2007). Benthic oxygen fluxes and sediment properties on the northeastern New Zealand continental shelf. Cont. Shelf Res. 27, 2373–2388. doi: 10.1016/j.csr.2007.06.007
Glud R. N. (2008). Oxygen dynamics of marine sediments. Mar. Biol. Res. 4, 243–289. doi: 10.1080/17451000801888726
Grant J., Emerson C. W., Hargrave B. T., Shortle J. L. (1991). Benthic oxygen consumption on continental shelves off eastern Canada. Cont. Shelf Res. 11 (8), 1083–1097. doi: https://doi.org/10.1016/0278-4343(91)90092-K
Guo J., Yuan H., Song J., Li X., Duan L. (2020). Hypoxia, acidification and nutrient accumulation in the Yellow Sea Cold Water of the South Yellow Sea. Sci. Total Environ. 745, 141050. doi: 10.1016/j.scitotenv.2020.141050
Guo J., Yuan H., Song J., Li X., Duan L., Li N., et al. (2021). Evaluation of sedimentary organic carbon reactivity and burial in the eastern China marginal seas. J. Geophys. Res. Oceans. 126, e2021JC017207. doi: 10.1029/2021jc017207
Hopkinson J. C.S., Giblin A. E., Tucker J. (2001). Benthic metabolism and nutrient regeneration on the continental shelf of Eastern Massachusetts, USA. Mar. Ecol. Prog. Ser. 224, 1–19. doi: 10.3354/meps224001
Hulth S., Blackburn T. H., Hall P. O. J. (1994). Arctic sediments (Svalbard): consumption and microdistribution of oxygen. Mar. Chem. 46, 293–316. doi: 10.1016/0304-4203(94)90084-1
Janssen F., Huettel M., Witte U. (2005). Pore-water advection and solute fluxes in permeable marine sediments (II): Benthic respiration at three sandy sites with different permeabilities (German Bight, North Sea). Limnol Oceanogr. 50, 779–792. doi: 10.4319/lo.2005.50.3.0779
Jørgensen B. B., Revsbech N. P. (1985). Diffusive boundary layers and the oxygen uptake of sediments and detritus. Limnol Oceanogr. 30, 111–122. doi: 10.4319/lo.1985.30.1.0111
Jørgensen B. B., Wenzhöfer F., Egger M., Glud R. N. (2022). Sediment oxygen consumption: Role in the global marine carbon cycle. Earth. Sci. Rev. 228, 103987. doi: 10.1016/j.earscirev.2022.103987
Kim S.-H., Lee J. S., Kim K.-T., Kim S.-L., Yu O. H., Lim D., et al. (2020). Low benthic mineralization and nutrient fluxes in the continental shelf sediment of the northern East China Sea. J. Sea Res. 164, 101934. doi: 10.1016/j.seares.2020.101934
Lee J. S., Han J. H., An S. U., Kim S. H., Lim D., Kim D., et al. (2019). Sedimentary organic carbon budget across the slope to the basin in the southwestern ulleung (Tsushima) basin of the east (Japan) sea. J. Geophys. Res. Biogeosci. 124, 2804–2822. doi: 10.1029/2019jg005138
Liu J., Krom M. D., Ran X., Zang J., Liu J., Yao Q., et al. (2020). Sedimentary phosphorus cycling and budget in the seasonally hypoxic coastal area of Changjiang Estuary. Sci. Total Environ. 713, 136389. doi: 10.1016/j.scitotenv.2019.136389
Liu X., Tang D., Ge C. (2020). Distribution and sources of organic carbon, nitrogen and their isotopic composition in surface sediments from the southern Yellow Sea, China. Mar. pollut. Bull. 150, 110716. doi: 10.1016/j.marpolbul.2019.110716
Liu J., Zang J., Bouwman L., Liu S., Yu Z., Ran X. (2016). Distribution and budget of dissolved and biogenic silica in the Bohai Sea and Yellow Sea. Biogeochemistry 130, 85–101. doi: 10.1007/s10533-016-0244-2
Liu S. M., Zhang J., Chen S. Z., Chen H. T., Hong G. H., Wei H., et al. (2003). Inventory of nutrient compounds in the Yellow Sea. Cont. Shelf Res. 23, 1161–1174. doi: 10.1016/s0278-4343(03)00089-x
Louis J., Jeanneau L., Andrieux-Loyer F., Gruau G., Caradec F., Lebris N., et al. (2021). Are benthic nutrient fluxes from intertidal mudflats driven by surface sediment characteristics? Comptes Rendus. Géoscience 353, 173–191. doi: 10.5802/crgeos.57
Lourey M. J., Alongi D. M., Ryan D. A. J., Devlin M. J. (2001). Variability of nutrient regeneration rates and nutrient concentrations in surface sediments of the northern Great Barrier Reef shelf. Cont. Shelf Res. 21, 145–155. doi: 10.1016/S0278-4343(00)00084-4
Ma W.-W., Zhu M.-X., Yang G.-P., Li T. (2018). Iron geochemistry and organic carbon preservation by iron (oxyhydr)oxides in surface sediments of the East China Sea and the south Yellow Sea. J. Mar. Syst. 178, 62–74. doi: 10.1016/j.jmarsys.2017.10.009
Miatta M., Snelgrove P. V. R. (2021). Benthic nutrient fluxes in deep-sea sediments within the Laurentian Channel MPA (eastern Canada): The relative roles of macrofauna, environment, and sea pen octocorals. Deep Sea Res. Part I Oceanogr. Res. Pap 178, 103655. doi: 10.1016/j.dsr.2021.103655
Mortimer R. J. G., Krom M. D., Watson P. G., Frickers P. E., Davey J. T., Clifton R. J. (1999). Sediment–water exchange of nutrients in the intertidal zone of the humber estuary, UK. Mar. pollut. Bull. 37, 261–279. doi: 10.1016/S0025-326X(99)00053-3
Niino H., Emery K. O. (1961). Sediments of shallow portions of east China sea and south China sea. GSA Bull. 72, 731–762. doi: 10.1130/0016-7606(1961)72[731:Sospoe]2.0.Co;2
Nunnally C. C., Rowe G. T., Thornton D. C. O., Quigg A. (2013). Sedimentary oxygen consumption and nutrient regeneration in the northern Gulf of Mexico hypoxic zone. J. Coast. Res. 63, 84–96. doi: 10.2112/si63-008.1
Park S.-C., Lee H.-H., Han H.-S., Lee G.-H., Kim D.-C., Yoo D.-G. (2000). Evolution of late Quaternary mud deposits and recent sediment budget in the southeastern Yellow Sea. Mar. Geol. 170, 271–288. doi: 10.1016/S0025-3227(00)00099-2
Parsons T. R., Maita Y., Lalli C. M. (1984). A manual of chemical and biological methods for seawater analysis (Oxford, UK: Pergamon, Press), 173pp. doi: 10.25607/OBP-1830
Pastor L., Deflandre B., Viollier E., Cathalot C., Metzger E., Rabouille C., et al. (2011). Influence of the organic matter composition on benthic oxygen demand in the Rhône River prodelta (NW Mediterranean Sea). Cont. Shelf Res. 31, 1008–1019. doi: 10.1016/j.csr.2011.03.007
Qiao S., Shi X., Wang G., Zhou L., Hu B., Hu L., et al. (2017). Sediment accumulation and budget in the Bohai Sea, Yellow Sea and East China Sea. Mar. Geol. 390, 270–281. doi: 10.1016/j.margeo.2017.06.004
Rasmussen H., Jørgensen B. B. (1992). Microelectrode studies of seasonal oxygen uptake in a coastal sediment: role of molecular diffusion. Mar. Ecol. Prog. Ser. 81, 289–303. doi: 10.3354/meps081289
Redfield A. C., Ketchum B. H., Richards F. A. (1963). The influence of organisms on the composition of seawater. sea 2, 26–77.
Rowe G. T., Phoel W. C. (1992). Nutrient regeneration and oxygen demand in Bering Sea continental shelf sediments. Cont. Shelf. Res. 12, 439–449. doi: 10.1016/0278-4343(92)90085-X
Rysgaard S., Glud R. N., Risgaard-Petersen N., Dalsgaard T. (2004). Denitrification and anammox activity in Arctic marine sediments. Limnol. Oceanogr. 49, 1493–1502. doi: 10.4319/lo.2004.49.5.1493
Shi X., Chen Z., Cheng Z., Cai D., Bu W., Wang K., et al. (2004). Transportation and deposition of modern sediments in the southern Yellow Sea. J. korean Soc oceanogr. 39, 57–71.
Song J. (2011). Biogeochemical processes of biogenic elements in China marginal seas (Berlin, Heidelberg: Springer Science & Business Media). doi: 10.1007/978-3-642-04060-3
Song G., Liu S., Zhang J., Zhu Z., Zhang G., Marchant H. K., et al. (2021). Response of benthic nitrogen cycling to estuarine hypoxia. Limnol. Oceanogr. 66, 652–666. doi: 10.1002/lno.11630
Song G., Liu S., Zhu Z., Zhai W., Zhu C., Zhang J. (2016). Sediment oxygen consumption and benthic organic carbon mineralization on the continental shelves of the East China Sea and the Yellow Sea. Deep Sea Res. Part II Top. Stud. Oceanogr. 124, 53–63. doi: 10.1016/j.dsr2.2015.04.012
Thamdrup B., Canfield D. E. (1996). Pathways of carbon oxidation in continental margin sediments off central Chile. Limnol. Oceanogr. 41, 1629–1650. doi: 10.4319/lo.1996.41.8.1629
Thompson L., Maiti K., White J. R., DuFore C. M., Liu H. (2021). The impact of recently excavated dredge pits on coastal hypoxia in the northern Gulf of Mexico shelf. Mar. Environ. Res. 163, 105199. doi: 10.1016/j.marenvres.2020.105199
Tian S., Gaye B., Tang J., Luo Y., Lahajnar N., Dähnke K., et al. (2022). Nitrate regeneration and loss in the central yellow sea bottom water revealed by nitrogen isotopes. Front. Mar. Sci. 9. doi: 10.3389/fmars.2022.834953
Upton A. C., Nedwell D., Parkes R., Harvey S. M. (1993). Seasonal benthic microbial activity in the southern North Sea - Oxygen uptake and sulphate reduction. Mar. Ecol. Prog. Ser. 101, 273–281. doi: 10.3354/meps101273
Wang B.-d., Wang X.-l., Zhan R. (2003). Nutrient conditions in the yellow sea and the east China sea. Estuar. Coast. Shelf Sci. 58, 127–136. doi: 10.1016/S0272-7714(03)00067-2
Yang B., Gao X., Zhao J., Liu Y., Xie L., Lv X., et al. (2021). Potential linkage between sedimentary oxygen consumption and benthic flux of biogenic elements in a coastal scallop farming area, North Yellow Sea. Chemosphere. 273, 129641. doi: 10.1016/j.chemosphere.2021.129641
Yao P., Yu Z., Bianchi T. S., Guo Z., Zhao M., Knappy C. S., et al. (2015). A multiproxy analysis of sedimentary organic carbon in the Changjiang Estuary and adjacent shelf. J. Geophys. Res. Biogeosci. 120, 1407–1429. doi: 10.1002/2014jg002831
Yao P., Zhao B., Bianchi T. S., Guo Z., Zhao M., Li D., et al. (2014). Remineralization of sedimentary organic carbon in mud deposits of the Changjiang Estuary and adjacent shelf: Implications for carbon preservation and authigenic mineral formation. Cont. Shelf. Res. 91, 1–11. doi: 10.1016/j.csr.2014.08.010
Younm J.-S., Kim Y.-S. (2002). Rate of sediment accumulation and geochemical characteristics of muddy sediment in the central yellow sea. Korea Assoc. For Quat. Res. 16, 1–16.
Zhang Y., Li G., Guo H., Liu Y., Wang H., Xu J., et al. (2018). Sedimentary characteristics of the second marine layer during the late marine isotope stage 3 in southern yellow sea and their response to the east asian monsoon. J. Ocean Univ. China 17, 1103–1113. doi: 10.1007/s11802-018-3527-5
Zhao B., Yao P., Bianchi T. S., Arellano A. R., Wang X., Yang J., et al. (2018). The remineralization of sedimentary organic carbon in different sedimentary regimes of the Yellow and East China Seas. Chem. Geol. 495, 104–117. doi: 10.1016/j.chemgeo.2018.08.012
Zhao B., Yao P., Bianchi T. S., Yu Z. G. (2021). Controls on Organic Carbon Burial in the Eastern China Marginal Seas: a regional synthesis. Glob. Biogeochem. Cycle 35, e2020GB006608. doi: 10.1029/2020gb006608
Keywords: total sediment oxygen uptake, benthic nutrient fluxes, organic carbon, continental shelf, Yellow Sea
Citation: Baek J-W, Kim S-H, Kim K-T, Choi JY, Jeong H-J, Lee CH, An S-U and Lee JS (2025) Spatial variability of sediment oxygen consumption and benthic nutrient fluxes in the continental shelf of the Southern Yellow Sea during spring. Front. Mar. Sci. 12:1535248. doi: 10.3389/fmars.2025.1535248
Received: 27 November 2024; Accepted: 18 March 2025;
Published: 16 April 2025.
Edited by:
Selvaraj Kandasamy, Central University of Tamil Nadu, IndiaReviewed by:
Solomon Dan, Beibu Gulf University, ChinaHuawei Wang, Southern University of Science and Technology, China
Copyright © 2025 Baek, Kim, Kim, Choi, Jeong, Lee, An and Lee. This is an open-access article distributed under the terms of the Creative Commons Attribution License (CC BY). The use, distribution or reproduction in other forums is permitted, provided the original author(s) and the copyright owner(s) are credited and that the original publication in this journal is cited, in accordance with accepted academic practice. No use, distribution or reproduction is permitted which does not comply with these terms.
*Correspondence: Jae Seong Lee, bGVlanNAa2lvc3QuYWMua3I=