Abstract
Predicting tropical cyclones (TC) rapid intensification (RI) is one of the most significant challenges. This study refines the Net Energy Gain Rate (NGR) metric to improve TC intensity predictions, focusing on uncertainties in the drag coefficient (Cd) at extreme wind speeds and the effective length scale of TC-induced momentum transfer to the ocean (Rw). Using data from the western North Pacific basin (2004–2021), we conducted sensitivity analyses with four Cd parameterizations (increasing, decreasing, constant, and control) and varied Rw from 0.5 to 4 times the radius of maximum wind (Rmax). Results indicate that Rw=1Rmax consistently yields the highest correlation coefficient between NGR and intensity change in 24-hour among all combinations, especially for strong TCs (Category 3 or higher). Among the Cd parameterizations, the scenario where Cd decreases at wind speeds exceeding 50 m s-1 showed superior performance in capturing intensity changes. Multi-linear regression models incorporating NGR, prior 12-hour intensity changes, and vertical wind shear confirmed that decreasing Cd at Rw=1Rmax provides the most reliable predictions, achieving the highest prediction performance in the TC intensity change in 24-hour. These findings underscore the importance of accurately representing Cd behavior under extreme wind conditions and precisely defining Rw to enhance the predictive skill of NGR-based TC intensity forecasts.
1 Introduction
The rapid intensification (RI) of tropical cyclones (TCs)—defined as an increase in wind speed of at least 30 knots within 24 hours—remains one of the most significant challenges in weather forecasting. Accurate predictions of these sudden surges in intensity are crucial for issuing timely evacuation orders, implementing disaster response measures, and minimizing damage to both infrastructure and human life (Kaplan and DeMaria, 2003; Sampson et al., 2011; Rappaport et al., 2012). With the growing destructiveness of tropical cyclones in a warming climate (Emanuel, 2005; Mendelsohn et al., 2012; Liu et al., 2020), coupled with their shifting genesis and maximum intensity to higher latitudes (Kossin et al., 2014; Daloz and Camargo, 2018; Sun et al., 2019; Shan and Yu, 2020; Feng et al., 2021; Studholme et al., 2022), reliable RI predictions have become more critical than ever for coastal populations around the world.
Despite advancements in dynamic and statistical TC prediction skills, including artificial intelligence techniques such as machine learning algorithms and neural networks (Atlas et al., 2015; Kim et al., 2018; Chen et al., 2020; Kumar et al., 2023; Wang et al., 2023; Majumdar et al., 2023), improvements in forecasting TC intensity have been modest (Rappaport et al., 2012; DeMaria et al., 2014; Balaguru et al., 2018; Cangialosi et al., 2020). One of the primary sources of intensity forecast errors lies in the challenges associated with predicting RI. The complexity of RI processes arises from intricate interactions between oceanic and atmospheric conditions, including sea surface temperature, ocean heat content, vertical wind shear, mid-level moisture, and internal storm dynamics (Kaplan et al., 2015). While advancements in modeling techniques have somewhat improved RI forecasts, accurately capturing the timing and magnitude of these events remains challenging due to their highly dynamic and nonlinear nature. As a result, significant gaps persist in RI prediction, with current models still struggling to identify and fully understand the key factors that drive its occurrence and intensity (DeMaria et al., 2014; Cangialosi et al., 2020; Huang et al., 2021; Jiang et al., 2022).
The surface heat flux between the ocean and atmosphere—particularly the latent heat flux—is a key energy source for TC development (Emanuel, 1986; Bryan, 2012; Green and Zhang, 2014; Zhang and Emanuel, 2016). Among these, the latent heat flux is dominant in TC intensification and is significantly affected by TC-induced sea surface cooling (SSC). TC-induced SSC is determined by the ocean’s initial thermal structure and the total amount of momentum transferred from the TC’s winds to the ocean. Greater momentum transfer leads to deeper vertical mixing, which brings cooler water to the surface and intensifies SSC (Price, 1981; Sanford et al., 2011). The total momentum transfer is controlled by wind stress and the duration of the TC’s influence over a given area, itself dictated by the storm’s translation speed and the effective radius of its winds (Rw). While numerous studies have examined the role of translation speed in SSC, relatively few have focused on the critical impact of Rw (Li et al., 2024). As the length scale over which wind stress effectively transfers momentum to the ocean, Rw influences the TC’s residence time over specific ocean regions and consequently affects the magnitude of SSC. Therefore, a targeted sensitivity analysis of Rw is essential for accurately representing ocean conditions during a TC’s passage.
The drag coefficient (Cd) is a critical factor in determining wind stress, as it directly controls the efficiency of momentum transfer from the wind to the ocean. A higher Cd increases wind stress, amplifying the force exerted on the ocean surface. This enhanced wind stress leads to deeper vertical mixing and enhanced SSC, significantly influencing the energy available for a TC to intensify. Additionally, increased Cd results in greater frictional dissipation in the atmospheric boundary layer, dissipating the TC’s energy and directly affecting its intensification process (Kim et al., 2022; Lee et al., 2022). Given its significant impact on both processes, accurate parameterization of Cd is crucial for improving TC intensity predictions. Generally, Cd increases with wind speed under low to moderate conditions—up to approximately 30 m s-1—but decreases or levels off at higher wind speeds (Powell et al., 2003; Jarosz et al., 2007; Edson et al., 2013; Donelan, 2018; Richter et al., 2021). However, due to limited observational data under extreme wind conditions, conflicting results persist regarding Cd’s behavior at extreme wind speeds exceeding 50 m s-1 (Richter et al., 2016). Some studies suggest that Cd decreases at these high wind speeds (Richter et al., 2021; Lee et al., 2022), while others report that it increases (Soloviev et al., 2014; Donelan, 2018), levels off (Takagaki et al., 2012; Wang et al., 2024), or shows no clear trend (Bell et al., 2012). This uncertainty poses a significant challenge for accurately modeling air-sea interactions and predicting TC intensity, especially during RI events.
The Net Energy Gain Rate (NGR), introduced by Lee et al. (2019), builds upon the maximum potential intensity (MPI) framework (Emanuel, 1988) to quantify the energy exchange between the ocean and the atmosphere during TCs. In their study, they utilized a realistic wind-dependent parameterization of Cd, suggested in previous observation-based research, to calculate frictional dissipation. Additionally, instead of using sea surface temperature, they employed depth-averaged ocean temperature to compute the energy generation term, allowing NGR to provide a more accurate representation of TC energy dynamics. This metric strongly correlates with 24-hour TC intensity changes, outperforming traditional predictors like MPI and Intensification Potential (POT) in forecasting intensity changes (Lee et al., 2019). Moreover, statistical model tests incorporating NGR demonstrate significantly improved predictive skills for RI, highlighting its potential as a valuable tool for enhancing TC intensity forecasts (Kim et al., 2024).
Building upon the challenges in accurately modeling air-sea interactions and predicting TC RI, this study aims to enhance the reliability of TC intensity forecasts by refining NGR metrics. Specifically, we address two critical uncertainties that may impact the predictability of NGR: Rwand the relationship between Cd and high wind speeds exceeding 50 m s-1. Firstly, due to the uncertainty surrounding Cd at extreme wind conditions, we calculate four different NGR values, each considering the various possible behaviors of Cd under extreme winds. This method addresses existing uncertainties in the frictional dissipation and representation of wind stress, as well as its effects on the flux exchanges. Secondly, we conduct a comprehensive sensitivity analysis of Rw to systematically evaluate its impact on TC-induced vertical mixing and the predictability of NGR. This aims to optimize the NGR calculations to capture oceanic conditions more accurately during the TCs. The data and methodologies employed in this research are detailed in Section 2. Section 3 examines the effects of the four different Cd parameterizations on NGR and conducts a sensitivity analysis of Rw. Finally, Section 4 presents our discussions and summarizes the study’s key findings.
2 Data and methods
2.1 Data
This study used version v04r01 of the International Best Track Archive for Climate Stewardship (IBTrACS) dataset (Knapp et al., 2010). The best track data include various information derived from all forecasting agencies, such as the geographic locations of TC centers, maximum sustained wind speed, minimum central pressure, translation speed, radius of maximum wind, and other relevant parameters. We analyzed data provided by the Joint Typhoon Warning Center from 2004 to 2021. In this study, TCs are defined as storms with a maximum surface wind speed of over 34 knots occurring in the western North Pacific (WNP) basin, which is the region between 0°–60°N latitude and 100°–180°E longitude. To simplify the analysis and avoid possible uncertainties introduced by interpolation, we used the 6-hour interval track data. Cases in which the TC was within 259 km of the coastline—corresponding to the global mean radius of 34kt winds plus one standard deviation, based on a statistical analysis of TCs from 2001 to 2017 (Kim et al., 2022)—were excluded from the analysis to minimize the influence of topography.
Several oceanic and atmospheric variables were examined to calculate the NGR and mixing depth for individual TCs in the WNP. Sea surface temperature (SST), DAT, and ocean temperature and salinity profiles were obtained from the Hybrid Coordinate Ocean Model (HYCOM) Navy Coupled Ocean Data Assimilation (NCODA) nowcast/forecast system provided by the Naval Research Laboratory. The HYCOM-NCODA data used include daily outputs for 2004–2018 and 6-hourly outputs for 2019–2021. The HYCOM salinity and temperature profiles below the water surface were interpolated at regular depth intervals of 1 m between 1 m and 500 m. The NGR values were obtained based on Emanuel’s ‘pcmin.f’ Fortran function, which is available online (pcmin_2013.f). The atmospheric variables required to calculate NGR—air temperature, relative humidity, and mean sea level pressure—were obtained from the Global Forecast System (GFS) analysis data provided by the NCEP. The GFS data have spatial resolutions of 1° × 1°for 2004–2016 and 0.5° × 0.5°for 2017–2021, with 6-hour temporal resolution. All atmospheric and oceanic variables were averaged within a radius of 200 km from the storm center using prestorm conditions (3 days prior) (Lee et al., 2019, 2022; Kim et al., 2022, 2024; Moon et al., 2022).
In this study, our ultimate goal is to develop an operational model for predicting TC RI using GFS forecast fields as input. To achieve this, we have trained our model with GFS analysis fields. Notably, the 6-hourly gridded analysis data provided by NOAA’s NCEI has been available only from March 2004 onward. Consequently, our overall analysis period was chosen to align with these data availability constraints.
2.2 Net energy gain rate
NGR measures the difference between the enthalpy flux out of the sea surface (G) and the surface frictional dissipation of energy (D) in the atmospheric boundary layer, which is defined as:
where DAT is the depth-averaged ocean temperature, is TC outflow temperature determined by the atmospheric vertical profile, is enthalpy exchange coefficient, is the air density, is surface wind speed, is saturation enthalpy of the sea surface, is surface enthalpy in the TC environment. DAT is computed as:
where Ti is the initial ocean temperature, and d is the mixing depth discussed in Section 2.4.
2.3 Drag coefficient parameterizations for extreme winds
Owing to uncertainties in Cd under extreme wind conditions (Powell et al., 2003; Donelan, 2018; Soloviev et al., 2014; Richter et al., 2021; Lee et al., 2022; Wang et al., 2024), we evaluate four different parameterizations that reflect possible behaviors of Cd for winds above 50 m s-1. Following Kim et al. (2022), we considered four different behaviors of the drag coefficient Cd: three experimental Cd fittings and one control fitting. All three experimental Cd fittings are the same up to 50 m s-1 but show different trends after 50 m s-1: increasing (CD_IC), decreasing (CD_DC), and constant (CD_CN) (Figure 1). These Cd fittings (CD_IC, CD_DC, CD_CN) range from 1 × 10⁻³ to 2.5 × 10⁻³ for wind speeds below 50 m s-1, which are within the range of field and experimental study results (Powell et al., 2003; Jarosz et al., 2007; Edson et al., 2013; Soloviev et al., 2014; Donelan, 2018; Richter et al., 2021). In the control experiment (CD_DN), we used the Cd from Donelan et al. (2004), where Cd increases up to 33 m s-1 (consistent with the other three experimental Cd fittings) but saturated beyond 33 m s-1.
Figure 1
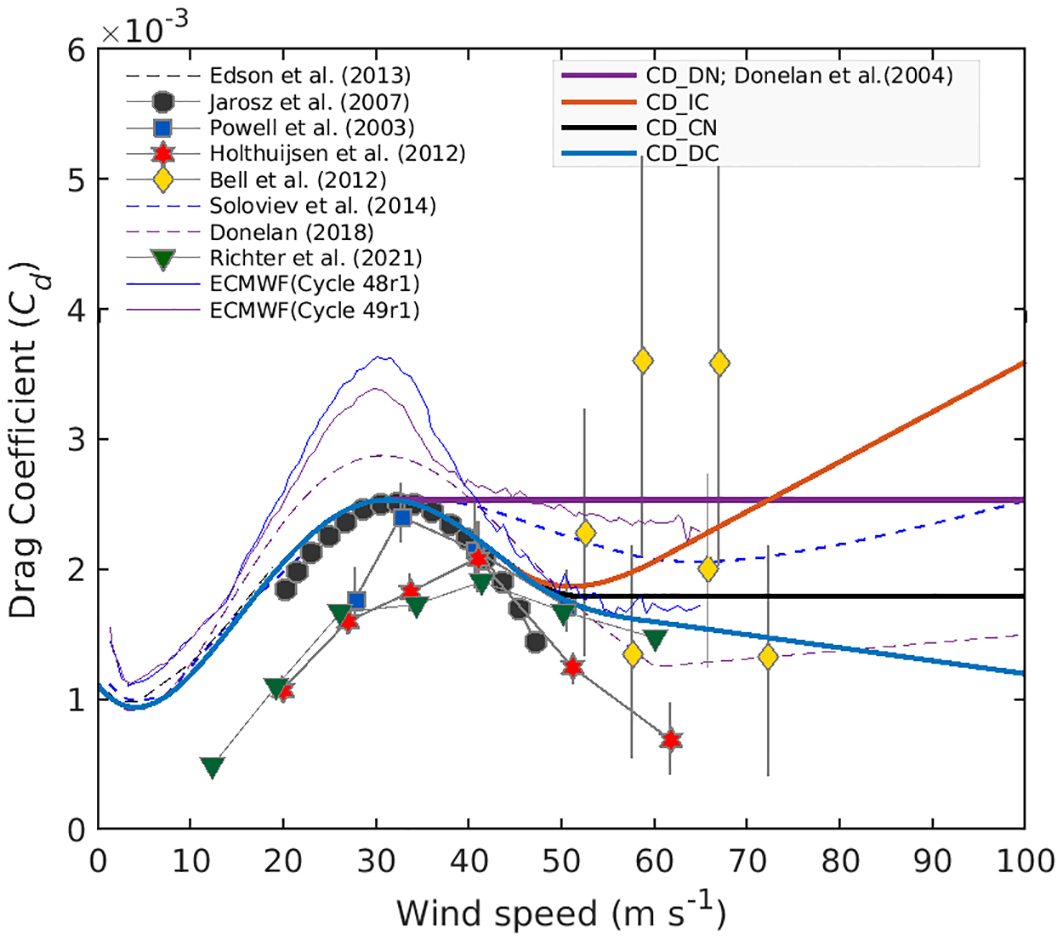
Comparison of drag coefficients (Cd) parameterizations presented in previous studies as a function of 10-meter wind speed. The Cd parameterizations used in this study are highlighted in the legend with gray shading.
2.4 Depth of TC-induced mixing and sensitivity analysis of Rw
To estimate the depth of TC-induced mixing (d), we use Price (2009) method, which links vertical turbulent mixing to the TC wind forcing under the criterion that the bulk Richardson number of the surface mixed layer should not be less than 0.6 (Price, 1981):
where g is the acceleration due to gravity, ρ(z) is the density profile derived from ocean temperature and salinity profiles, ρ0 is the reference density, τ is the wind stress, S is the non-dimensional storm speed (S = 1.2) (Price et al., 1994), and represents the TC’s residence time over a given location. In many studies, Rw/Uh is taken as 4Rmax/Uh (Price, 2009; Pun et al., 2019; Kim et al., 2022; Moon et al., 2022), assuming the ocean is mixed by the time the TC has completely passed. However, Because the ocean encountered by the TC during its intensification is still in the process of mixing and not yet fully mixed, using this method may lead to an overestimation of SSC. To address this issue, we conducted sensitivity experiments by varying Rw from 0.5Rmax to 4Rmax increments of 0.5Rmax. This systematic approach identifies the Rw value that yields optimal NGR-based prediction of 24-hour intensity changes, especially during RI events.
3 Results
3.1 Sensitivity analysis of Cd parameterizations and Rw values
To investigate how different Cd parameterizations and values of Rw affect 24-hour TC intensity changes, we performed a series of sensitivity analyses using four different Cd parameterizations—CD_IC, CD_DC, CD_CN, and CD_DN—along with varying values of Rw(from 0.5 to 4 times Rw). For each combination of Cd and Rw, we calculated the NGR, and analyzed the correlation coefficients between NGR and observed 24-hour changes in TC intensity. Because the four Cd parameterizations show significant divergence for wind speeds above 50 m s-1, we separately considered all TCs (tropical storm or higher) and strong TCs (Saffir-Simpson Category 3 or higher).
Figure 2 compares the correlation coefficients between NGR and observed 24-hour intensity changes across the tested Rw and Cd combinations. Although some Cd parameterizations achieve relatively high correlations at Rw = 0.5 Rw, the highest correlation among all combinations appears at Rw = 1 Rw, especially for stronger TCs (≥ Cat3). Among the Cd parameterizations, CD_DC and CD_CN consistently exhibit higher correlations, whereas CD_IC (Figure 2, red solid line) generally shows the weakest correlation across all Rw values—even lower than the control (CD_DN; Figure 2, purple solid line).
Figure 2
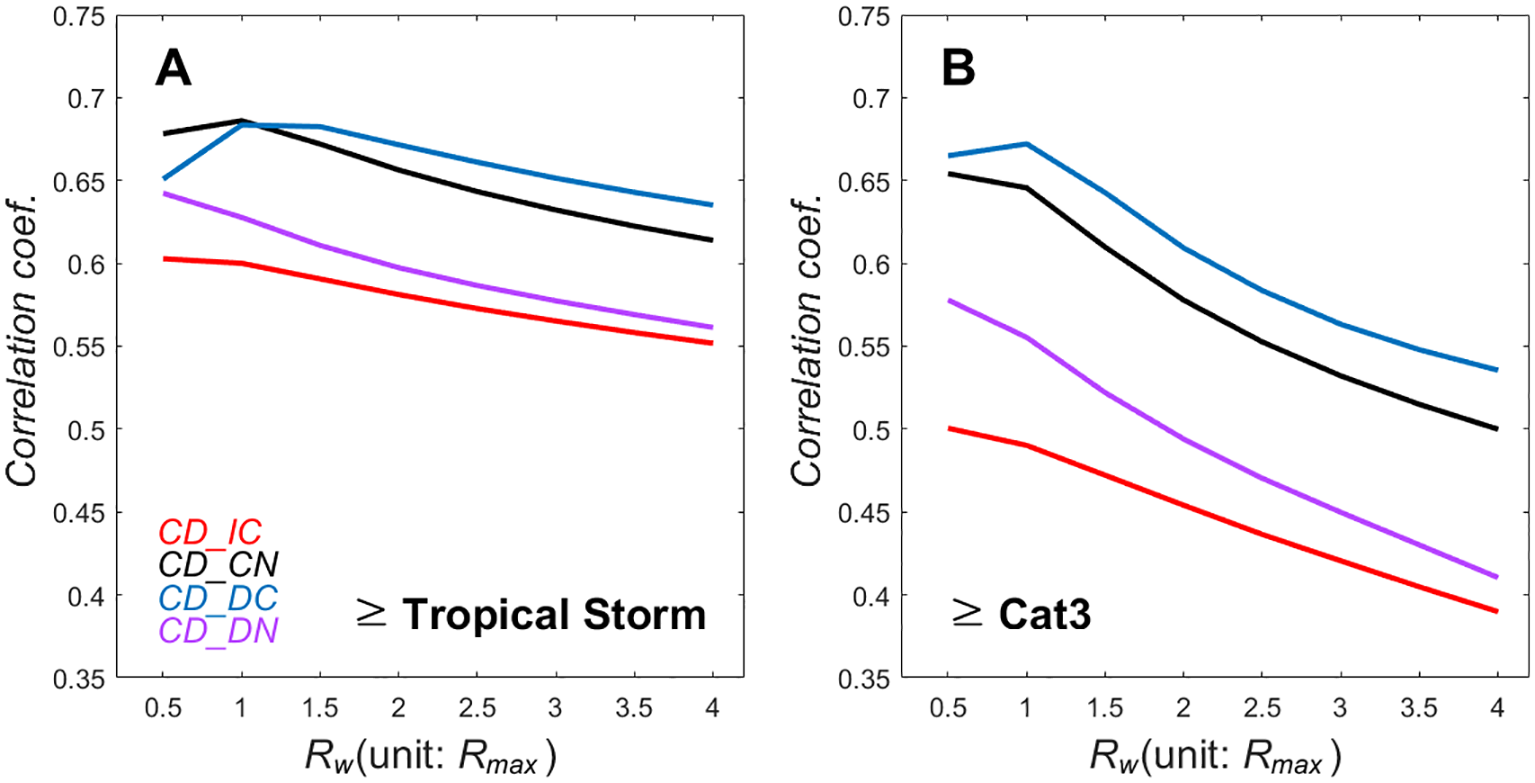
Comparison of correlation coefficients between NGR and the 24-hour intensity change based on different Cd fittings as a function of Rw (in units of Rmax). (A) shows results for TCs at tropical storm intensity or higher (≥ Tropical Storm), while (B) represents those rated at category three or higher on the Saffir-Simpson scale (≥ Cat 3).
In strong TCs, where most RIs occur (Lee et al., 2016), CD_DC showed the highest correlation coefficients in the all Rw range. CD_DC, where Cd decreases after 50 m s-1, notably shows improved performance in capturing TC intensity changes, particularly strong TCs experiencing RI events. This aligns with the findings of Lee et al. (2022), which demonstrated that a decreasing Cd parameterization significantly reduces the underestimation of TC intensity in numerical models and provides the best prediction performance for intense storms. This agreement further underscores the importance of accurately parameterizing Cd for capturing RI dynamics.
Figure 3 illustrates the effect of Rw values and Cd parameterizations on the d and DAT for TCs of tropical storm intensity (≥ TS) and strong TCs (≥ Cat 3). The wind stress is proportional to the Cd times the wind speed squared (Rieder et al., 1994; Powell et al., 2003); this indicates that decreased or constant Cd under high wind reduces the momentum flux into the ocean compared to increased Cd, inhibiting vertical mixing of the upper ocean. Consequently, SSC in the CD_DC and CD_CN experiments is reduced, resulting in a higher DAT than CD_IC and CD_DN.
Figure 3
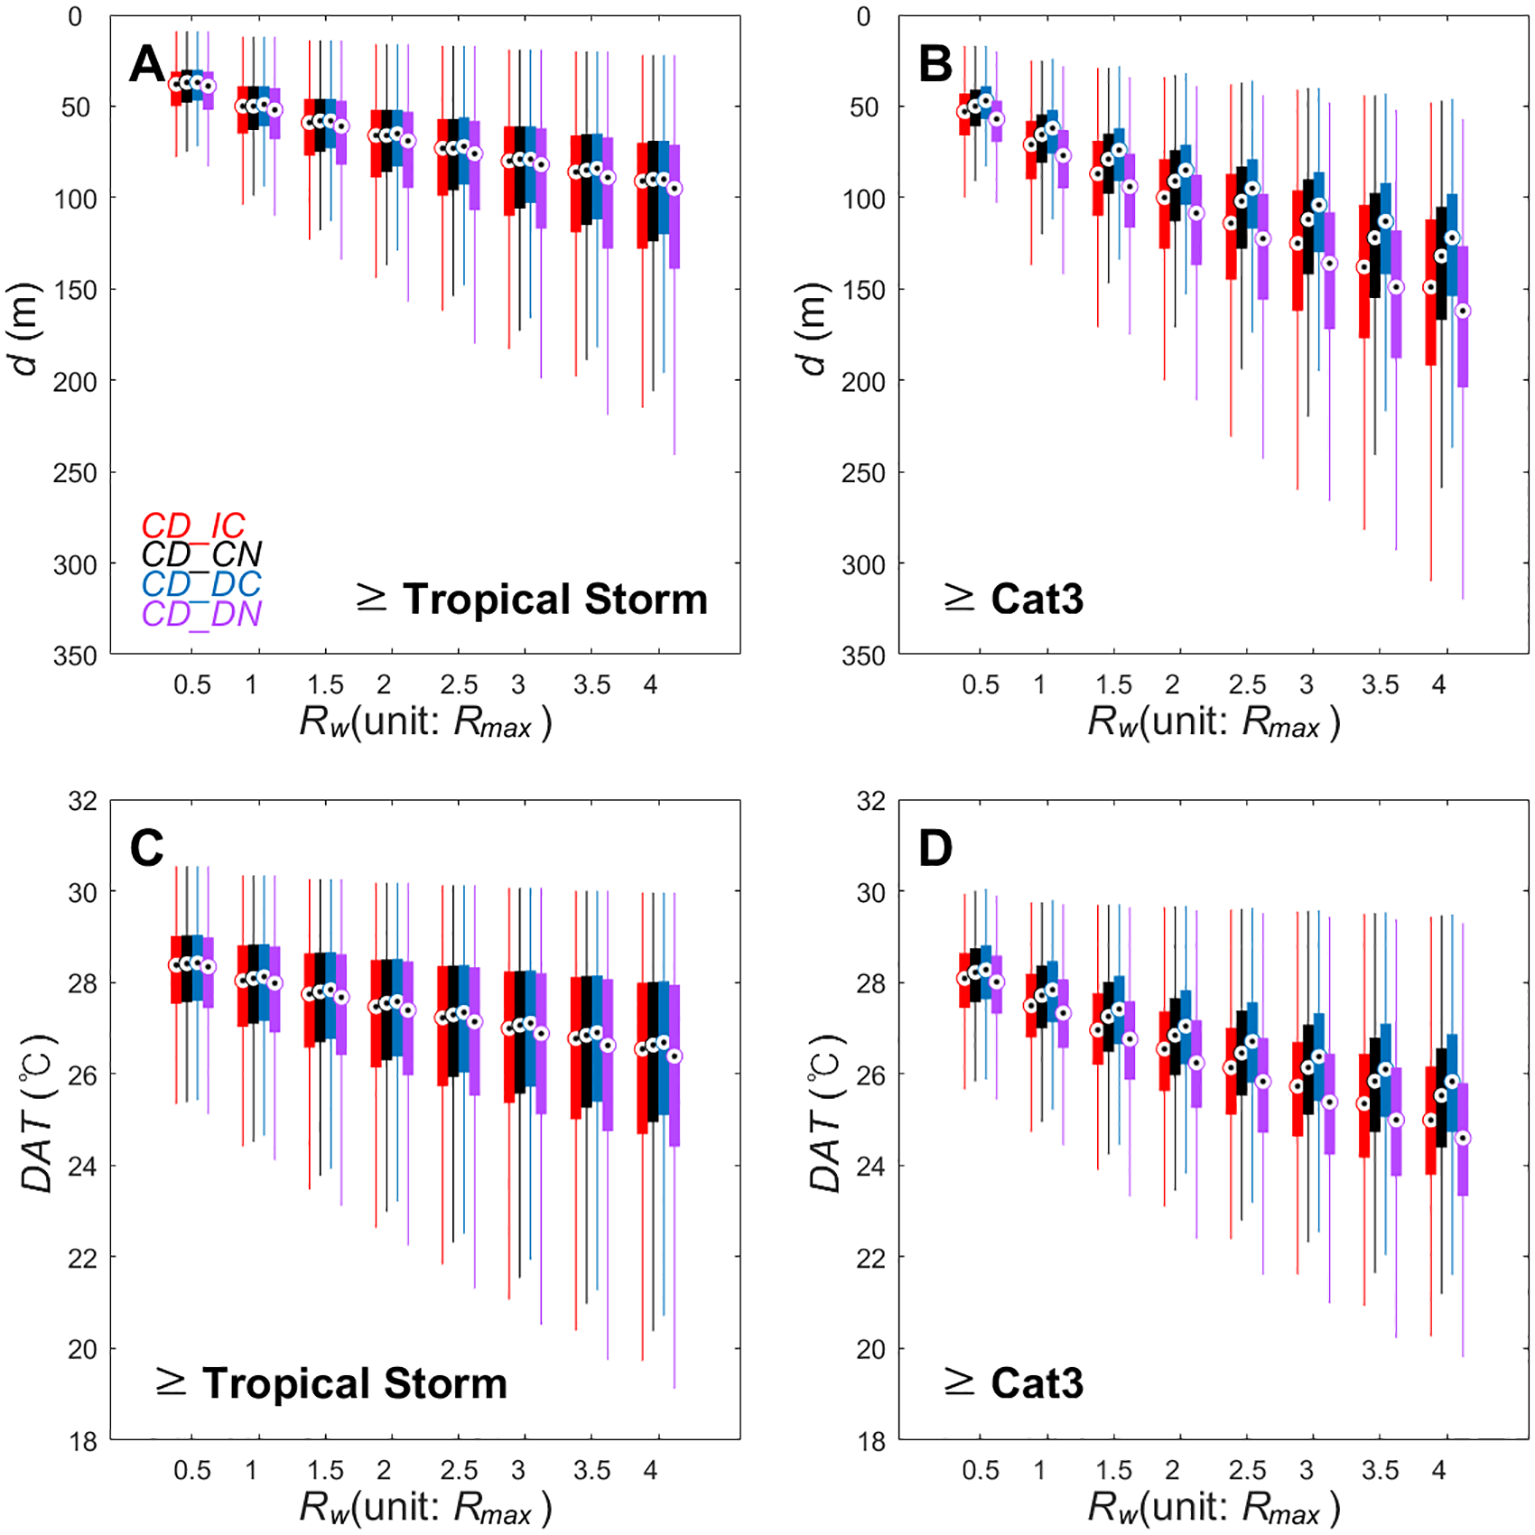
Box plot comparison of TC-induced vertical mixing depth (d; upper panels) and the depth-averaged temperature (DAT; bottom panels) as a function of Rw (in units of Rmax) based on different Cd fittings. (A, C) Results for TCs at tropical storm intensity or higher (≥ Tropical Storm). (B, D) Results for TCs rated at category three or higher on the Saffir-Simpson scale (≥ Cat 3).
Moreover, as Rw increases (implying longer residence time of the TC over a given location), d also increases—an effect that is particularly notable in strong TCs. However, the correlation analysis (Figure 2) reveals that the correlation coefficients drop significantly as Rw increases, especially in cases with higher Cd values. Given that Rw in NGR calculations only affects the estimation of d, the decrease in correlation with increasing Rw suggests that this trend is likely due to an overestimation of d. The CD_CN (CD_DC), Rw = 1Rmax combination, which had the highest correlation coefficient, showed an average mixing depth of 53 m (52 m) and a median of 50 m (50 m). These values align with the findings of Lee et al. (2019), where the 50 m depth-averaged temperature-based NGR demonstrated the highest prediction performance.
3.2 Multi-linear regression model performance
To further quantify the influence of these findings on TC intensity predictions, multi-linear regression models were developed for all combinations, and their skill was evaluated. Following Lee et al. (2019), the predictors included NGR, the previous 12-hour intensity change, and vertical wind shear. The models were trained using data from 2004 to 2017 and evaluated on independent data from 2018 to 2021. We used Principal Component Regression to address multicollinearity, ensuring robust and efficient predictions.
For both tropical storm intensity TCs (≥ TS) and strong TCs (≥ Cat 3), the highest coefficient of determination (R2) and lowest mean absolute error (MAE) are observed in combinations using Rw = 1Rmax (Figure 4). Among these, the Cd parameterization with CD_DC consistently demonstrates the best predictive performance, suggesting that Rw = 1 Rmax is the most suitable value for capturing the relationship between NGR and 24-hour TC intensity changes. This result aligns closely with the findings from the correlation analysis.
Figure 4
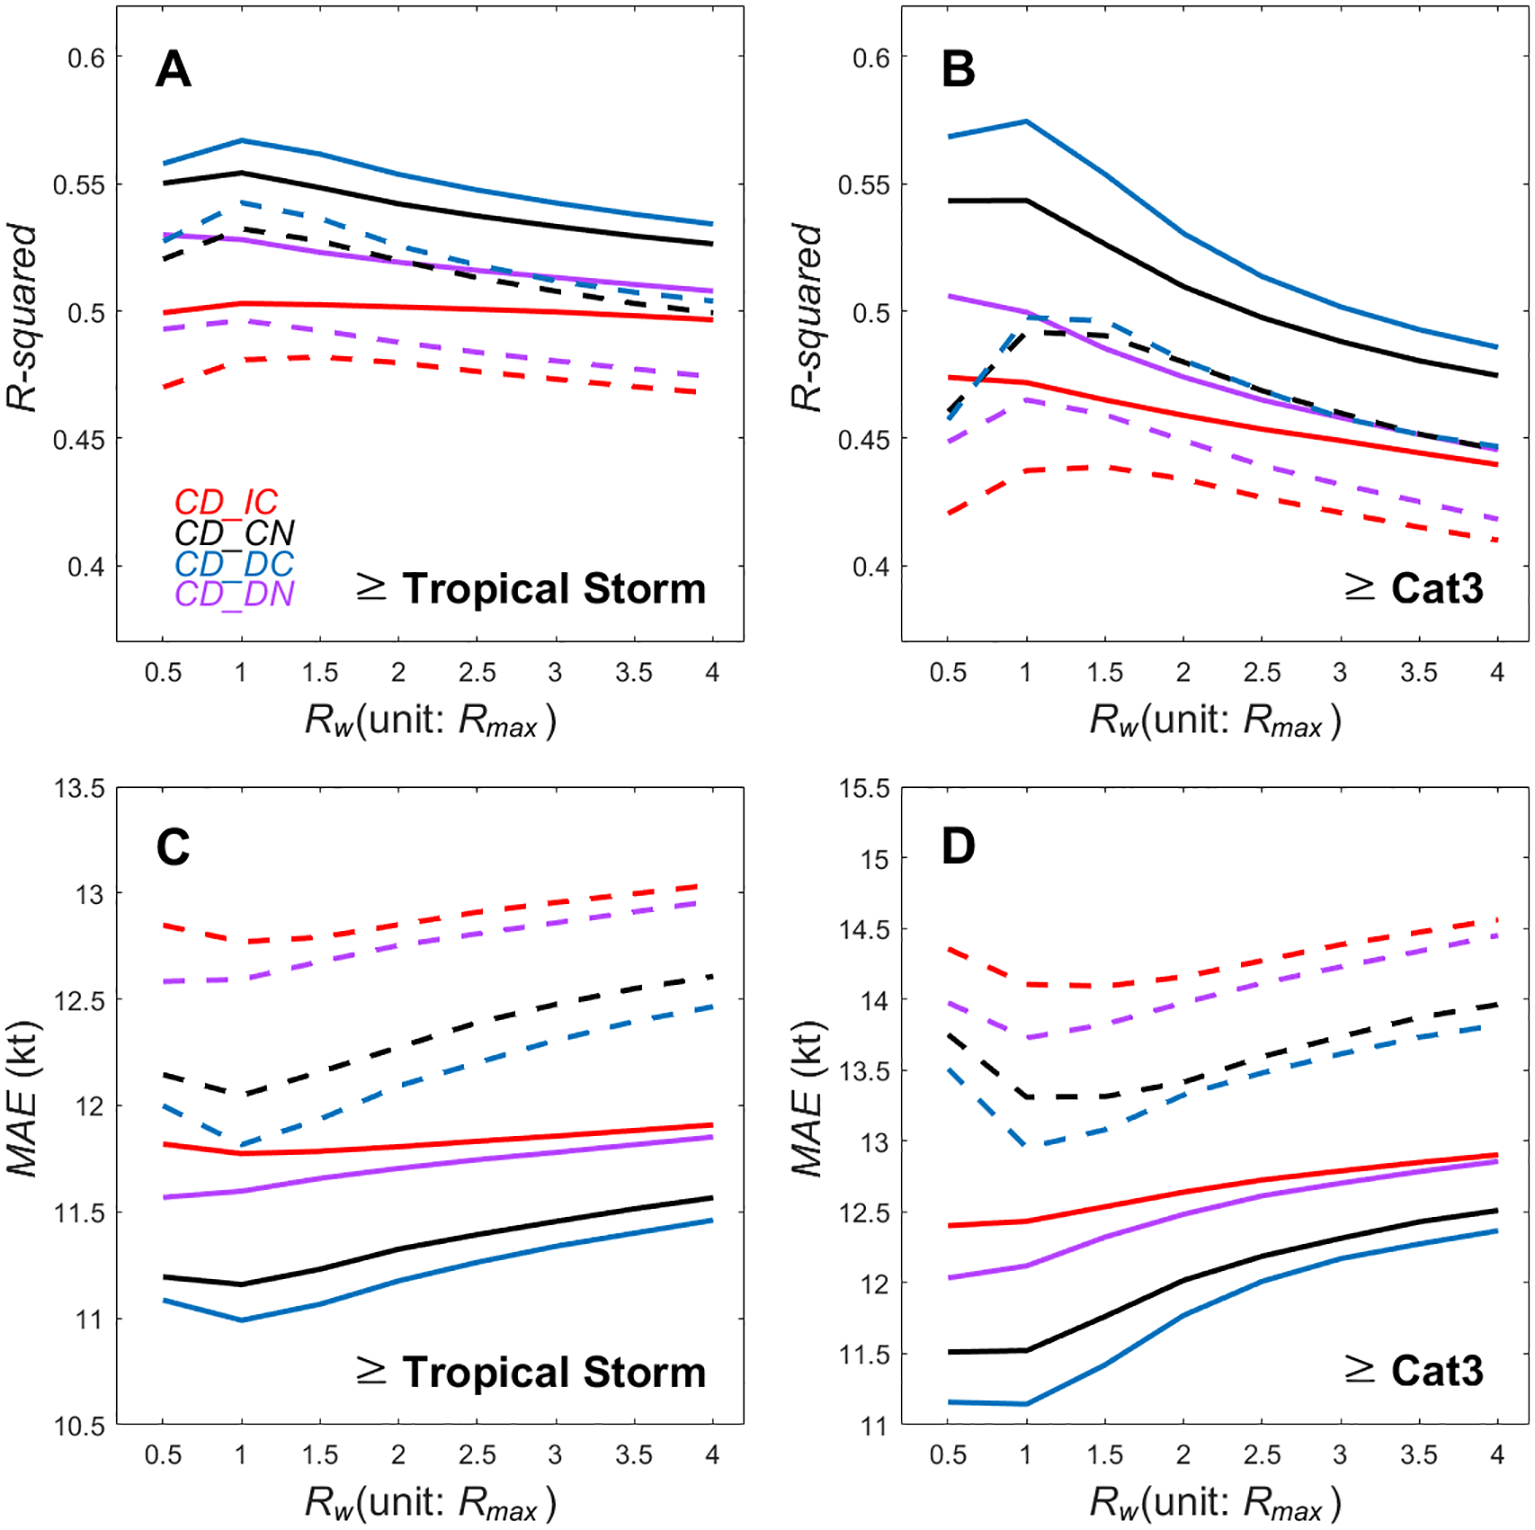
Comparison of the R² (A, B; upper panels) and the Mean Absolute Error (MAE; C, D; bottom panels) of multi-linear regression models as a function of Rw (in units of Rmax) based on different Cd fittings. (A, C) Results for TCs at tropical storm intensity or higher (≥ Tropical Storm). (B, D) Results for TCs rated at category three or higher on the Saffir-Simpson scale (≥ Cat 3). Solid lines represent model performance during the training period (2004-2017), while dashed lines represent the results of the test period (2018-2021). The multi-linear regression model incorporates NGR, previous 12-hour intensity change, and 850- to 200-hPa vertical wind shear as predictors, following Lee et al. (2019).
When Rw exceeds 1 Rmax, both R2 and MAE degrade for all Cd parameterizations, particularly for strong TCs (≥ Cat 3). This pattern indicates that larger Rw values are less effective in accurately representing the TC-induced mixing. Both R2 and MAE analyses highlight the poor performance of CD_IC and CD_DN across all Rw values. CD_IC, in particular, shows the lowest R2 and highest MAE. By comparing the performance of the Cd parameterizations, those that exhibit significant differences above 50 m s-1, the behavior of Cd under extreme wind conditions can be indirectly inferred. The contrasting predictive performance of CD_DC and CD_IC for strong TCs (≥ Cat 3) indirectly suggests that Cd behavior under extreme wind speeds is more consistent with a decreasing trend. This supports the hypothesis that reduced frictional dissipation and suppressed SSC are critical for accurately capturing the dynamics of RI (Kim et al., 2022; Lee et al., 2022). Thus, CD_DC appears better suited for NGR-based TC intensity predictions, as it aligns more closely with the observed physical processes during extreme wind events.
The R² and MAE values obtained using the CD_DC are similar to those reported by Lee et al. (2019) when using the 50 m DAT-based NGR. In Lee et al. (2019), attempts were made to calculate NGR using SSTs that reflected mixing depths based on TC intensity rather than a fixed-depth average. However, those results did not outperform the more straightforward 50 m DAT approach. Regardless of the Cd parameterization, the d at Rw= 1Rmax, which showed the highest correlation coefficient, is around 50–60 m (Figure 3).
However, the regression model combining CD_DC with Rw = 1Rmax shows improved predictive performance compared to the fixed-depth 50 m DAT-based NGR model. Specifically, during the training period (test period), the CD_DC and Rw = 1Rmax model achieved an R2 of 0.57 (0.54) and MAE of 11.0 (11.8) kt, outperforming the fixed-depth model, which had an R2 of 0.54 (0.51) and MAE of 11.4 (12.3) kt. These improvements indicate that a more realistic representation of ocean response—calculated by adequately incorporating TC-specific information—can yield higher predictive performance than a uniform 50 m mixing depth. Furthermore, given that the predictive performance of Rw = 4Rmax used before the sensitivity analysis (as evaluated in Lee et al., 2019) was lower than the prediction based on the 50 m DAT, our results demonstrate that carefully tuned sensitivity analyses can significantly improve predictive skill.
4 Summary and discussion
This study conducted a comprehensive sensitivity analysis to investigate the impact of the Cd and the Rw on the NGR and, consequently, on TC intensity changes within 24 hours. By evaluating four different Cd parameterizations—increasing (CD_IC), decreasing (CD_DC), constant (CD_CN), and the control (CD_DN)—and varying Rw from 0.5 to 4 times the Rmax, we aimed to refine NGR calculations to enhance the predictability of RI events. The results consistently showed that the highest correlations between NGR and observed 24-hour TC intensity changes among all combinations appear at Rw = 1 Rw, particularly for strong TCs (Category 3 or higher). Among the Cd parameterizations, CD_DC—where Cd decreases above 50 m s-1— produces the best predictive performance, followed by CD_CN. This finding aligns with previous studies indicating that a decreasing Cd in extreme winds reduces the negative bias of TC intensity prediction in numerical models (Lee et al., 2022). Furthermore, the analysis of d and DAT revealed that Cd parameterization and Rw values significantly influence upper-ocean response, which in turn affects TC intensity changes. A lower or constant Cd at high wind speeds, as seen in CD_DC and CD_CN, reduces ocean momentum flux, leading to weaker vertical mixing and higher DAT. This mechanism helps sustain warmer sea surface conditions, which are crucial for TC intensification. While increasing Rw results in a greater d, particularly in strong TCs, the correlation analysis suggests that higher Rw values lead to a decline in correlation coefficients, likely due to d overestimation. The CD_CN (CD_DC) and Rw =1 Rmax combination exhibited the best correlation and optimal mixing depth (~50 m), aligning with prior studies demonstrating the predictive advantages of a 50 m depth-averaged temperature-based NGR (Lee et al., 2019). In addition, multi-linear regression models that incorporate NGR, previous 12-hour intensity changes, and vertical wind shear were developed to assess predictive performance. The highest R2 and the lowest MAE are achieved with the combination of CD_DC and Rw = 1Rmax, further confirming the findings from the correlation analysis. This consistency between the regression model results and the correlation analysis strengthens the conclusion that the CD_DC and Rw = 1Rmax combination provides the most reliable framework for predicting 24-hour TC intensity changes, particularly for strong TCs experiencing RI events. These findings reinforce the importance of optimizing Cd parameterization and Rw selection to improve TC intensity prediction, particularly for RI events.
Wang et al. (2021) introduced a modified energy-based dynamical system model to explain how the TC intensification rate (IR) varies with storm intensity. According to their findings, the IR depends on the balance between intensification potential (IP) and frictional dissipation, with the IR peaking at an intermediate intensity (30–40 m s-1) before decreasing. A key contribution of their model is the concept of dynamical efficiency, which is governed by inertial stability and clarifies why the IR initially increases but then declines as TC intensifies. The NGR approach focuses on the imbalance between frictional dissipation and enthalpy flux from the sea surface. Kim et al. (2022) demonstrated that the reduction in frictional dissipation within specific intensity ranges where Cd decreases sharply leads to an increase in NGR, which in turn enhances IR in those storm intensity ranges. This aligns closely with the results of Wang et al. (2021), where a large IP relative to frictional dissipation (i.e., high NGR) leads to a higher IR.
Li et al. (2024) found that while a larger size contributes to a higher steady-state intensity, it also reduces the energy conversion efficiency, resulting in two opposing effects that limit the overall impact of size on IR. This study supports the validity of Wang et al. (2021)’s theory and highlights that TC size plays a secondary role in determining intensification rate compared to intensity. However, these results are derived from an atmosphere-only model without considering ocean-atmosphere coupling. TC size significantly influences momentum transfer to the ocean, which in turn affects SSC. Therefore, analyses of TC IR in relation to TC size should consider oceanic feedback to ensure a more comprehensive understanding.
Kim et al. (2022) quantitatively demonstrated that the reduction in Cd for wind speeds exceeding 33 m s-1, using the same parameterization applied in this study, contributes to the increase in NGR through both reduced frictional dissipation and suppressed SSC. Specifically, 75% of the NGR increase was due to reduced frictional dissipation, while 25% was attributed to decreased SSC (DAT increase). This increase in NGR was observed primarily within the TC intensity range (33-50 m s-1), where RI commonly occurs. This finding highlights that Cd reduction plays a dual role in enhancing the available energy for TC intensification, emphasizing both frictional and oceanic thermal effects.
Although the behavior of Cd at wind speeds exceeding 50 m s−1 remains uncertain, Kim et al. (2022) demonstrated that a parameterization in which Cd decreases beyond this threshold (i.e., CD_DC) most accurately reproduces the bimodal distribution of lifetime maximum intensity (LMI) in global TCs. Building on this, Lee et al. (2022) introduced an indirect method for estimating Ck/Cd at extreme wind speeds by matching observed LMI with the theoretical MPI. This refined parameterization, which includes a decreasing Cd above 50 m s−1, has been shown to improve intensity forecasts by reducing prediction errors by up to 32% compared to traditional models, highlighting its effectiveness for capturing high-wind dynamics. This result aligns with the findings of Kim et al. (2022), which highlight two key roles of decreasing Cd: reducing frictional dissipation and limiting SSC. These processes contribute to an increase in excess energy, which enhances TC IR. Consequently, this helps mitigate the underestimation of intense TC simulations, a common issue in TC-ocean coupled models.
In this study, we found that applying Rw = 1Rmax instead of the conventional 4 Rmax approach reduces the NGR-based TC intensity prediction error by about 10% (Figure 4C; CD_DC, training period). This improvement becomes especially relevant when considering that, during intensification, a TC interacts with an ocean in the midst of an active mixing process rather than one that is already fully homogenized. The traditional assumption of 4 Rmax implicitly treats the upper ocean as if it were thoroughly mixed by the time the storm passes, which can lead to an overestimation of SSC and subsequently inflate forecast errors in 24-hour intensity change. The roughly 10% reduction in forecast error underscores the importance of selecting an appropriate Rw to avoid overestimating SSC and to better represent the energetics of the storm–ocean system, particularly when RI is likely to occur.
While our study addresses several key uncertainties, notable limitations remain. Yablonsky and Ginis (2009) have shown that the SSC induced by slow-moving TCs (< 5 m s-1) differs substantially between three-dimensional (3D) and one-dimensional (1D) ocean models. Slow-moving TCs induce prolonged mixing and upwelling, resulting in a deeper mixed layer and more significant SST cooling (Tsai et al., 2008; Chu et al., 2020; Yu et al., 2023; John et al., 2024). This suggests that upwelling is crucial in accurately modeling SSC for slow-moving TCs. To assess the impact of TC translation speed on the correlation coefficient of NGR, TCs were divided into two groups: those with translation speeds ≥ 5.1 m s-1 and those with speeds < 5.1 m s-1. The results indicate that the predictive skill of NGR is significantly more excellent for fast-moving TCs (Figure 5). This difference in performance can be attributed to the limitations of the 1D mixing depth estimation model used in this study, which does not account for upwelling. Therefore, to improve the accuracy of NGR calculations for these storms, future work should incorporate a 3D process such as upwelling.
Figure 5
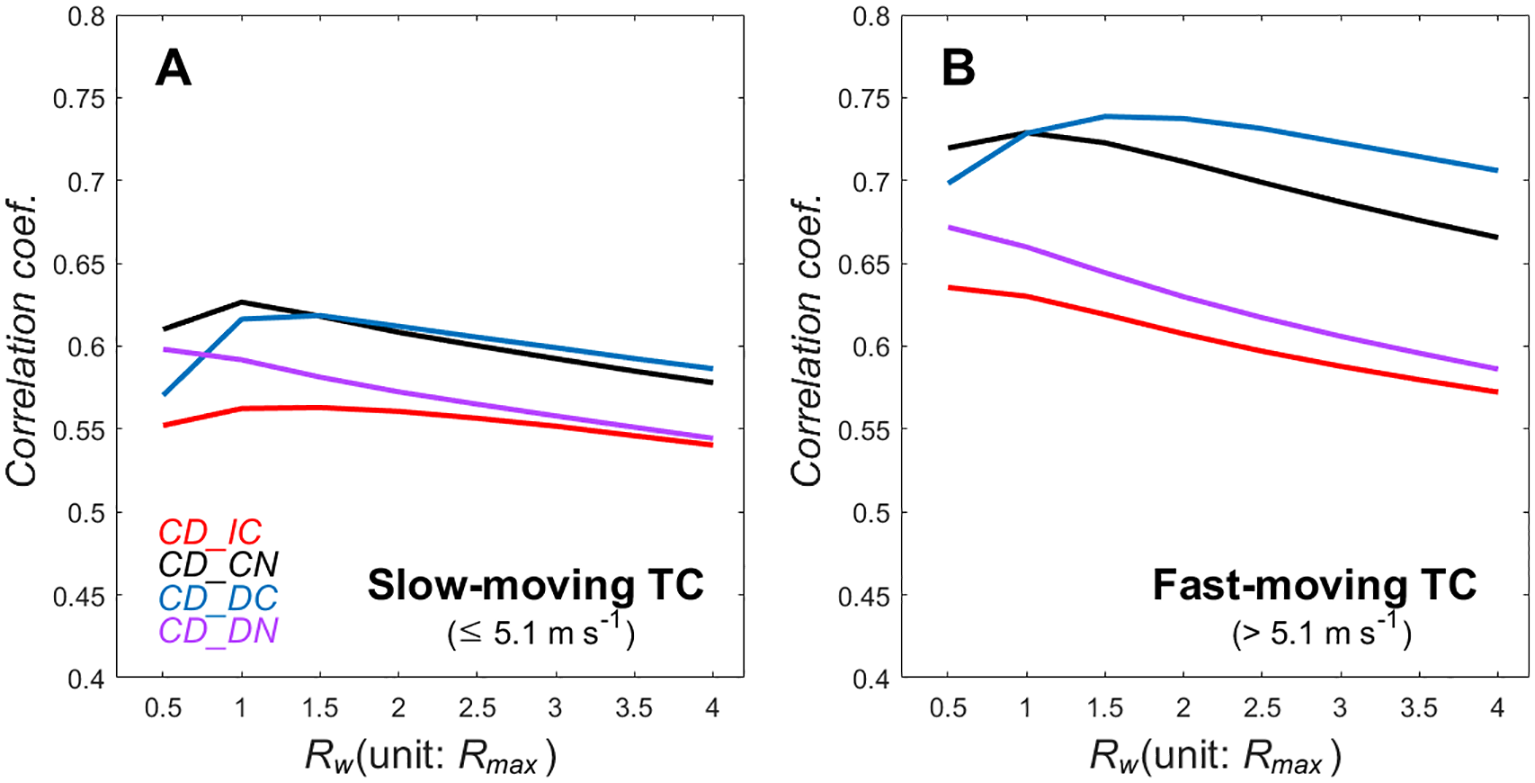
Comparison of correlation coefficients between NGR and the 24-hour intensity change based on different Cd fittings as a function of Rw (in units of Rmax). (A) shows results for slow-moving TCs (≤ 5.1 m s-1), and (B) represents fast-moving TCs (> 5.1 m s-1). The threshold of 5.1 m s-1 corresponds to the median translational speed of analyzed TCs in the western North Pacific.
In this study, the Ck was assumed to be a constant in NGR calculations. However, Cd and Ck are crucial in determining TC intensity (Zhang and Emanuel, 2016; Sroka and Emanuel, 2022). The assumption of a constant Ck overlooks the potential impact of wind-speed-dependent changes in enthalpy flux, particularly under extreme wind conditions where sea spray becomes significant (Andreas and Emanuel, 2001; Andreas, 2011). Future studies should investigate the wind-speed dependency of Ck and its interaction with Cd to better represent the energy exchanges during TCs. Collecting more observational data on Cd and Ck under extreme wind conditions is also crucial. Such data would help validate and refine the parameterizations used in predictive models, reducing uncertainties and improving forecast accuracy.
This study underscores the critical importance of accurately parameterizing both the Cd and Rw in modeling the energy exchanges central to TC intensification. By refining these parameters within the NGR framework, we have demonstrated improved predictive skills for RI events. Our sensitivity analyses suggest that a decreasing Cd for wind speeds above 50 m s-1, together with a Rw set to 1Rmax, can effectively limit excessive frictional dissipation and sea surface cooling—both of which are essential for maintaining the latent heat flux needed to fuel high-intensity storms. Nevertheless, the scarcity of in situ observations under extreme wind conditions highlights the challenges in deriving definitive empirical values for Cd (and possibly Ck). While our results, based on model analysis data, align with the decreasing Cd behavior indicated in prior work (Kim et al., 2022; Lee et al., 2022), we acknowledge that deeper insight into TC-induced ocean mixing requires additional observational validation. For instance, Argo float measurements collected during a storm’s passage could directly estimate the mixing depth, enabling more precise momentum-transfer calculations. Incorporating such real-time observational data is inherently difficult—especially in an operational forecasting context—but remains a vital goal for future research. Finally, our findings highlight the need for further improving the realism of TC-ocean coupled models, particularly by incorporating three-dimensional ocean processes and wind-speed-dependent changes in both Cd and Ck. Such enhancements would help mitigate the systematic underestimation of intense TCs and strengthen the reliability of intensity forecasts. Continued investigations in this domain are crucial not only for advancing the scientific understanding of TC dynamics but also for reducing the societal impacts of these devastating phenomena through more accurate prediction and preparedness.
Statements
Data availability statement
The original contributions presented in the study are included in the article/supplementary material. Further inquiries can be directed to the corresponding author.
Author contributions
SK: Conceptualization, Formal Analysis, Investigation, Writing – original draft, Writing – review & editing, Methodology. WL: Data curation, Methodology, Writing – review & editing, Formal Analysis. SW: Data curation, Methodology, Validation, Writing – review & editing. H-WK: Supervision, Validation, Writing – review & editing. KK: Project administration, Validation, Writing – review & editing. SK: Conceptualization, Supervision, Validation, Writing – review & editing.
Funding
The author(s) declare that financial support was received for the research and/or publication of this article. This research was supported by Korea Institute of Marine Science &Technology Promotion (KIMST) funded by the Ministry of Oceans and Fisheries (20220566). This research was supported by the project titled “Development of typhoon analysis and forecast technology (KMA2018-00722)” of the National Typhoon Center at the Korea Meteorological Administration.
Conflict of interest
The authors declare that the research was conducted in the absence of any commercial or financial relationships that could be construed as a potential conflict of interest.
Generative AI statement
The author(s) declare that no Generative AI was used in the creation of this manuscript.
Publisher’s note
All claims expressed in this article are solely those of the authors and do not necessarily represent those of their affiliated organizations, or those of the publisher, the editors and the reviewers. Any product that may be evaluated in this article, or claim that may be made by its manufacturer, is not guaranteed or endorsed by the publisher.
References
1
Andreas E. L. (2011). Fallacies of the enthalpy transfer coefficient over the ocean in high winds. J. Atmospheric Sci.68, 1435–1445. doi: 10.1175/2011jas3714.1
2
Andreas E. L. Emanuel K. A. (2001). Effects of Sea spray on tropical cyclone intensity. J. Atmospheric Sci.58, 3741–3751. doi: 10.1175/1520-0469(2001)058<3741:eossot>2.0.co;2
3
Atlas R. Tallapragada V. Gopalakrishnan S. (2015). Advances in tropical cyclone intensity forecasts. Mar. Technol. Soc. J.49, 149–160. doi: 10.4031/MTSJ.49.6.2
4
Balaguru K. Foltz G. R. Leung L. R. Hagos S. M. Judi. D. R. (2018). On the use of ocean dynamic temperature for hurricane intensity forecasting. Wea. Forecasting33, 411–418. doi: 10.1175/WAF-D-17-0143.1
5
Bell M. M. Montgomery M. T. Emanuel K. A. (2012). Air-sea enthalpy and momentum exchange at major hurricane wind speeds observed during CBLAST. J. Atmos. Sci.69, 3197–3222. doi: 10.1175/JAS-D-11-0276.1
6
Bryan B. H. (2012). Effects of surface exchange coefficients and turbulence length scales on the intensity and structure of numerically simulated hurricanes. Monthly Weather Rev.140, 1125–1143. doi: 10.1175/MWR-D-11-00231.1
7
Cangialosi J. P. Blake E. DeMaria M. Penny A. Latto A. Rappaport E. et al . (2020). Recent progress in tropical cyclone intensity forecasting at the National Hurricane Center. Weather Forecasting.35, 1913–1922. doi: 10.1175/WAF-D-20-0059.1
8
Chen R. Zhang W. Wang X. (2020). Machine learning in tropical cyclone forecast modeling: A review. Atmosphere11, 676. doi: 10.3390/atmos11070676
9
Chu J. E. Lee S. S. Timmermann A. Wengel C. Stuecker M. F. Yamaguchi R. (2020). Reduced tropical cyclone densities and ocean effects due to anthropogenic greenhouse warming. Sci. Adv.6, eabd5109. doi: 10.1126/sciadv.abd5109
10
Daloz A. S. Camargo S. J. (2018). Is the poleward migration of tropical cyclone maximum intensity associated with a poleward migration of tropical cyclone genesis? Climate Dynamics50, 705–715. doi: 10.1007/s00382-017-3636-7
11
DeMaria M. Sampson C. R. Knaff J. A. Musgrave K. D. (2014). Is tropical cyclone intensity guidance improving? Bull. Am. Meteorological Soc.95, 387–398. doi: 10.1175/BAMS-D-12-00240.1
12
Donelan M. A. (2018). On the decrease of the oceanic drag coefficient in high winds. J. Geophys. Res.-Oceans123, 1485–1501. doi: 10.1002/2017JC013394
13
Donelan M. A. Haus B. K. Reul N. Plant W. J. Stiassnie M. Graber H. C. et al . (2004). On the limiting aerodynamic roughness of the ocean in very strong winds. Geophys. Res. Lett.31, L18306. doi: 10.1029/2004GL019460
14
Edson J. B. Jampana V. Weller R. A. Bigorre S. P. Plueddemann A. J. Fairall C. W. et al . (2013). On the exchange of momentum over the open ocean. J.Phys. Oceanogr.43, 1589–1610. doi: 10.1175/JPO-D-12-0173.1
15
Emanuel K. A. (1986). An air-sea interaction theory for tropical cyclones. Part I: steady-state maintenance. J. Atmospheric Sci.43, 585–605. doi: 10.1175/1520-0469(1986)043<0585:AASITF>2.0.CO;2
16
Emanuel K. A. (1988). The maximum intensity of hurricanes. J. Atmospheric Sci.45, 1143–1155. doi: 10.1175/1520-0469(1988)045<1143:TMIOH>2.0.CO;2
17
Emanuel K. A. (2005). Increasing destructiveness of tropical cyclones over the past 30 years. Nature436, 686–688. doi: 10.1038/nature03906
18
Feng X. Klingaman N. P. Hodges K. I. (2021). Poleward migration of western North Pacific tropical cyclones related to changes in cyclone seasonality. Nat. Commun.12, 6210. doi: 10.1038/s41467-021-26369-7
19
Green B. W. Zhang F. (2014). Sensitivity of tropical cyclone simulations to parametric uncertainties in air-sea fluxes and implications for parameter estimation. Monthly Weather Rev.142, 2290–2308. doi: 10.1175/MWR-D-13-00208.1
20
Huang X. Peng X. Fei J. Cheng X. Ding J. Yu D. (2021). Evaluation and error analysis of official tropical cyclone intensity forecasts during 2005–2018 for the western North Pacific. J. Meteor. Soc Japan99, 139–163. doi: 10.2151/jmsj.2021-008
21
Jarosz E. Mitchell D. A. Wang D. W. Teague W. J. (2007). Bottom-up determination of air-sea momentum exchange under a major tropical cyclone. Science315, 1707–1709. doi: 10.1126/science.1136466
22
Jiang S. Fan H. Wang C. (2022). Improvement of typhoon intensity forecasting by using a novel spatio-temporal deep learning model. Remote Sens14, 5205. doi: 10.3390/rs14205205
23
John E. B. Balaguru K. Leung L. R. Hagos S. M. Hetland R. D. (2024). Observed increase in tropical cyclone-induced sea surface cooling near the US Southeast Coast. Geophysical Res. Lett.51, e2024GL110087. doi: 10.1029/2024GL110087
24
Kaplan J. DeMaria M. (2003). Large-scale characteristics of rapidly intensifying tropical cyclones in the North Atlantic basin. Weather Forecasting.18, 1093–1108. doi: 10.1175/1520-0434(2003)018<1093:LCORIT>2.0.CO;2
25
Kaplan J. Rozoff C. M. DeMaria M. Sampson C. R. Kossin J. P. Velden C. S. et al . (2015). Evaluating environmental impacts on tropical cyclone rapid intensification predictability utilizing statistical models. Weather Forecasting30, 1374–1396. doi: 10.1175/WAF-D-15-0032.1
26
Kim S. Kang H. Moon I. Kang S. K. Chu P. (2022). Effects of the reduced air-sea drag coefficient in high winds on the rapid intensification of tropical cyclones and bimodality of the lifetime maximum intensity. Front. Mar. Sci.9. doi: 10.3389/fmars.2022.1032888
27
Kim S. Lee W. Kang H. Kang S. K. (2024). Predicting rapid intensification of tropical cyclones in the western North Pacific: A machine learning and net energy gain rate approach. Front. Mar. Sci.10. doi: 10.3389/fmars.2023.1296274
28
Kim S. H. Moon I. J. Chu P. S. (2018). Statistical–dynamical typhoon intensity predictions in the Western North Pacific using track pattern clustering and ocean coupling predictors. Weather Forecasting33, 347–365. doi: 10.1175/WAF-D-17-0082.1
29
Knapp K. R. Kruk M. C. Levinson D. H. Diamond H. J. Neumann C. J. (2010). The international best track archive for climate stewardship (IBTrACS): Unifying tropical cyclone data. Bull. Am. Meteorol Soc91, 363–376. doi: 10.1175/2009BAMS2755.1
30
Kossin J. P. Emanuel K. A. Vecchi G. A. (2014). The poleward migration of the location of tropical cyclone maximum intensity. Nature509, 349–352. doi: 10.1038/nature13278
31
Kumar S. Dube A. Ashrit R. Mitra A. K. (2023). A machine learning (ml)-based approach to improve tropical cyclone intensity prediction of NCMRWF ensemble prediction system. Pure Appl. Geophysics180, 261–275. doi: 10.1007/s00024-022-03206-6
32
Lee W. Kim H. Chu S. Moon J. Soloviev A. V. (2019). An index to better estimate tropical cyclone intensity change in the western north pacific. Geophysical Res. Lett.46, 8960–8968. doi: 10.1029/2019GL083273
33
Lee W. Kim S. Moon I. Bell M. M. Ginis I. (2022). New parameterization of air-sea exchange coefficients and its impact on intensity prediction under major tropical cyclones. Front. Mar. Sci.9. doi: 10.3389/fmars.2022.1046511
34
Lee C. Y. Tippett M. K. Sobel A. H. Camargo S. J. (2016). Rapid intensification and the bimodal distribution of tropical cyclone intensity. Nat.Commun7, 10625. doi: 10.1038/ncomms10625
35
Li Y. Wang Y. Tan Z. (2024). On the size dependence in the recent time-dependent theory of tropical cyclone intensification. J. Atmospheric Sci.81, 1669–1688. doi: 10.1175/JAS-D-24-0015.1
36
Liu L. Wang Y. Zhan R. Xu J. Duan Y. (2020). Increasing destructive potential of landfalling tropical cyclones over China. J. Climate33, 3731–3743. doi: 10.1175/JCLI-D-19-0451.1
37
Majumdar S. J. Magnusson L. Bechtold P. Bidlot J. R. Doyle J. D. (2023). Advanced tropical cyclone prediction using the experimental global ECMWF and operational regional COAMPS-TC systems. Monthly weather Rev.151, 2029–2048. doi: 10.1175/MWR-D-22-0236.1
38
Mendelsohn R. Emanuel K. Chonabayashi S. Bakkensen L. (2012). The impact of climate change on global tropical cyclone damage. Nat. Climate Change2, 205–209. doi: 10.1038/nclimate1357
39
Moon I. Knutson T. R. Kim H. Babanin A. V. Jeong J. (2022). Why do eastern north pacific hurricanes intensify more and faster than their western-counterpart typhoons with less ocean energy? Bull. Am. Meteorological Soc.103, E2604–E2627. doi: 10.1175/BAMS-D-21-0131.1
40
Powell M. D. Vickery P. J. Reinhold T. A. (2003). Reduced drag coefficient for high wind speeds in tropical cyclones. Nature422, 279–283. doi: 10.1038/nature01481
41
Price J. F. (1981). Upper ocean response to a hurricane. J. Phys. Oceanogr.11, 153–175. doi: 10.1175/15200485(1981)011<0153:UORTAH>2.0.CO;2
42
Price J. F. (2009). Metrics of hurricane-ocean interaction: Vertically-integrated or vertically-averaged ocean temperature? Ocean Sci.5, 351–368. doi: 10.5194/os-5-351-2009
43
Price J. F. Sanford T. B. Forristall G. Z. (1994). Forced stage response to a moving hurricane. J. Phys. Oceanogr.24, 233–260. doi: 10.1175/1520-0485(1994)024<0233:FSRTAM>2.0.CO;2
44
Pun I.-F. Chan J. C. L. Lin I.-I. Chan K. T. F. Price J. F. Ko D. S. et al . (2019). Rapid intensification of typhoon hato, (2017) over shallow water. Sustainability11, 3709. doi: 10.3390/su11133709
45
Rappaport E. N. Jiing J. G. Landsea C. W. Murillo S. T. Franklin J. L. (2012). The joint hurricane test bed: Its first decade of tropical cyclone research-to-operations activities reviewed. Bull. Amer. Meteor. Soc93, 371–380. doi: 10.1175/BAMS-D-11-00037.1
46
Richter D. H. Bohac R. Stern D. (2016). An assessment of the flux profile method for determining air-sea momentum and enthalpy fluxes from dropsonde data in tropical cyclones. J. Atmospheric Sci.73, 2665–2682. doi: 10.1175/jas-d-15-0331.1
47
Richter D. H. Wainwright C. Stern D. P. Bryan G. H. Chavas D. (2021). Potential low bias in high-wind drag coefficient inferred from dropsonde data in hurricanes. J. Atmospheric Sci.78, (7). doi: 10.1175/JAS-D-20-0390.1
48
Rieder K. F. Smith J. A. Weller R. A. (1994). Observed directional characteristics of the wind, wind stress, and surface waves on the open ocean. J. Geophysical Research: Oceans99, 22589–22596. doi: 10.1029/94JC02215
49
Sampson C. R. Kaplan J. Knaff J. A. DeMaria M. Sisko C. A. (2011). A deterministic rapid intensification aid. Weather Forecasting26, 579–585. doi: 10.1175/WAF-D-10-05010.1
50
Sanford T. B. Price J. F. Girton J. B. (2011). Upper-ocean response to hurricane Frances, (2004) observed by profiling EM-APEX floats. J. Phys. Oceanography41, 1041–1056. doi: 10.1175/2010JPO4313.1
51
Shan K. Yu X. (2020). Enhanced understanding of poleward migration of tropical cyclone genesis. Environ. Res. Lett.15, 104062. doi: 10.1088/1748-9326/abaf85
52
Soloviev A. V. Lukas R. Donelan M. A. Haus B. K. Ginis I. (2014). The air-sea interface and surface stress under tropical cyclones. Sci. Rep.4, 5306. doi: 10.1038/srep05306
53
Sroka S. Emanuel K. (2022). Sensitivity of sea-surface enthalpy and momentum fluxes to sea spray microphysics. J. Geophysical Research: Oceans127, e2021JC017774. doi: 10.1029/2021JC017774
54
Studholme J. Fedorov A. V. Gulev S. K. Emanuel K. Hodges K. (2022). Poleward expansion of tropical cyclone latitudes in warming climates. Nat. Geosci.15, 14–28. doi: 10.1038/s41561-021-00859-1
55
Sun J. Wang D. Hu X. Ling Z. Wang L. (2019). Ongoing poleward migration of tropical cyclone occurrence over the western North Pacific Ocean. Geophysical Res. Lett.46, 9110–9117. doi: 10.1029/2019GL084260
56
Takagaki N. Komori S. Suzuki N. Iwano K. Kuramoto T. Shimada S. et al . (2012). Strong correlation between the drag coefficient and the shape of the wind sea spectrum over a broad range of wind speeds. Geophys. Res. Lett.39, L23604. doi: 10.1029/2012GL053988
57
Tsai Y. Chern C. S. Wang J. (2008). The upper ocean response to a moving typhoon. J. oceanography64, 115–130. doi: 10.1007/s10872-008-0009-1
58
Wang W. Han J. Shin J. Chen X. Hazelton A. Zhu L. et al . (2024). Physics schemes in the first version of NCEP operational hurricane analysis and forecast system (HAFS). Front. Earth Sci.12, 1379069. doi: 10.3389/feart.2024.1379069
59
Wang W. Han J. Yang F. Steffen J. Liu B. Zhang Z. et al . (2023). Improving the intensity forecast of tropical cyclones in the hurricane analysis and forecast system. Weather Forecasting38, 2057–2075. doi: 10.1175/WAF-D-23-0041.1
60
Wang Y. Li Y. Xu J. Tan Z. Lin Y. (2021). The intensity dependence of tropical cyclone intensification rate in a simplified energetically based dynamical system model. J. Atmospheric Sci.78, 2033–2045. doi: 10.1175/JAS-D-20-0393.1
61
Yablonsky R. M. Ginis I. (2009). Limitation of one-dimensional ocean models for coupled hurricane–ocean model forecasts. Monthly Weather Rev.137, 4410–4419. doi: 10.1175/2009MWR2863.1
62
Yu J. Lv H. Tan S. Wang Y. (2023). Tropical cyclone-induced sea surface temperature responses in the northern Indian ocean. J. Mar. Sci. Eng.11, 2196. doi: 10.3390/jmse11112196
63
Zhang F. Emanuel K. A. (2016). On the role of surface fluxes and WISHE in tropical cyclone intensification. J. Atmospheric Sci.73, 2011–2019. doi: 10.1175/JAS-D-16-0011.1
Summary
Keywords
drag coefficient, tropical cyclone intensity change, rapid intensification, air-sea interactions, net energy gain rate
Citation
Kim S, Lee W, Won S, Kang H-W, Kim KO and Kang SK (2025) Sensitivity analysis of drag coefficient and length scale of wind influence on tropical cyclone intensity change using net energy gain rate. Front. Mar. Sci. 12:1536014. doi: 10.3389/fmars.2025.1536014
Received
28 November 2024
Accepted
03 March 2025
Published
20 March 2025
Volume
12 - 2025
Edited by
Alexander Babanin, The University of Melbourne, Australia
Reviewed by
Yuanlong Li, Nanjing University, China
Jia Sun, Ministry of Natural Resources, China
Updates
Copyright
© 2025 Kim, Lee, Won, Kang, Kim and Kang.
This is an open-access article distributed under the terms of the Creative Commons Attribution License (CC BY). The use, distribution or reproduction in other forums is permitted, provided the original author(s) and the copyright owner(s) are credited and that the original publication in this journal is cited, in accordance with accepted academic practice. No use, distribution or reproduction is permitted which does not comply with these terms.
*Correspondence: Woojeong Lee, lwj@korea.kr
Disclaimer
All claims expressed in this article are solely those of the authors and do not necessarily represent those of their affiliated organizations, or those of the publisher, the editors and the reviewers. Any product that may be evaluated in this article or claim that may be made by its manufacturer is not guaranteed or endorsed by the publisher.