Abstract
Lofoten and Vesterålen region in Northern Norway contains the main spawning areas for the Northeast Arctic (NEA) cod. A large embayment, partially sheltered from the continental slope and open ocean by the Lofoten-Vesterålen archipelago, called Vestfjorden contains approximately 60 % of the NEA cod spawning in this region. The dynamical ocean processes that control transport paths and transport times of cod eggs and larvae out of this embayment are of major importance, not only for the fish stock, but in general for the marine ecosystem in the region. This study investigates the net impact of nonlinear tidal dynamics on transport and dispersion of particles, resembling cod eggs and larvae, out of Vestfjorden. The coastal ocean circulation in and around Vestfjorden is simulated with a variable mesh model, both with and without tides. The two different flow fields are used to advect passive particles seeded near Henningsværstraumen, a key spawning location within the embayment. A comparison of the two transport calculations reveals that nonlinear tidal dynamics clearly impact the particle drift in the region. When including tides in the model simulation, transport through the various straits that cut through the Lofoten-Vesterålen archipelago becomes more important, causing the total particle drift out of Vestfjorden to increase by about 10%. One strait in particular, Moskstraumen, contributes with a significant transport (∼ 30%) in the model simulation with tides included, but other straits contribute as well. For comparison, in the simulation where tides are excluded, almost 90% of the particles are transported out of the embayment around the southern tip of the archipelago and only 6% through Moskstraumen. A key implication of the tidal transport through the straits is that the journey for a large fraction of the cod eggs/larvae from Vestfjorden to the shelf is considerably shortened.
1 Introduction
The ocean surrounding Lofoten and Vesterålen in Northern Norway contains important spawning grounds for many fish species, including the main spawning grounds for the Northeast Arctic (NEA) cod (Ellertsen et al., 1989). The NEA cod is the largest stock of Atlantic cod (Yaragina et al., 2011, Gadus morhua) and historically the most important species for Norwegian fisheries (Øiestad, 1994). Up to 60–70% of the NEA cod spawning occurs in the waters surrounding Lofoten and Vesterålen (Sundby and Nakken, 2008), with Vestfjorden as the main spawning area. Vestfjorden is a large embayment separated from the open ocean by the Lofoten-Vesterålen archipelago (see Figure 1). The spawning takes place in spring, and about five months of pelagic drift awaits the offspring before it reaches the nursing grounds in the Barents Sea (Åndalsvik and Sundby, 1994; Kjeldsbu et al., 2023). Both the survival and growth rate during these early life stages of the NEA cod are crucial for the recruitment of the fish stock (Hjort, 1914; Houde, 2008; Vikebø et al., 2005). Therefore, knowledge about drift patterns and the underlying ocean dynamics is important when identifying factors controlling the recruitment and stability of the NEA cod stock.
Figure 1
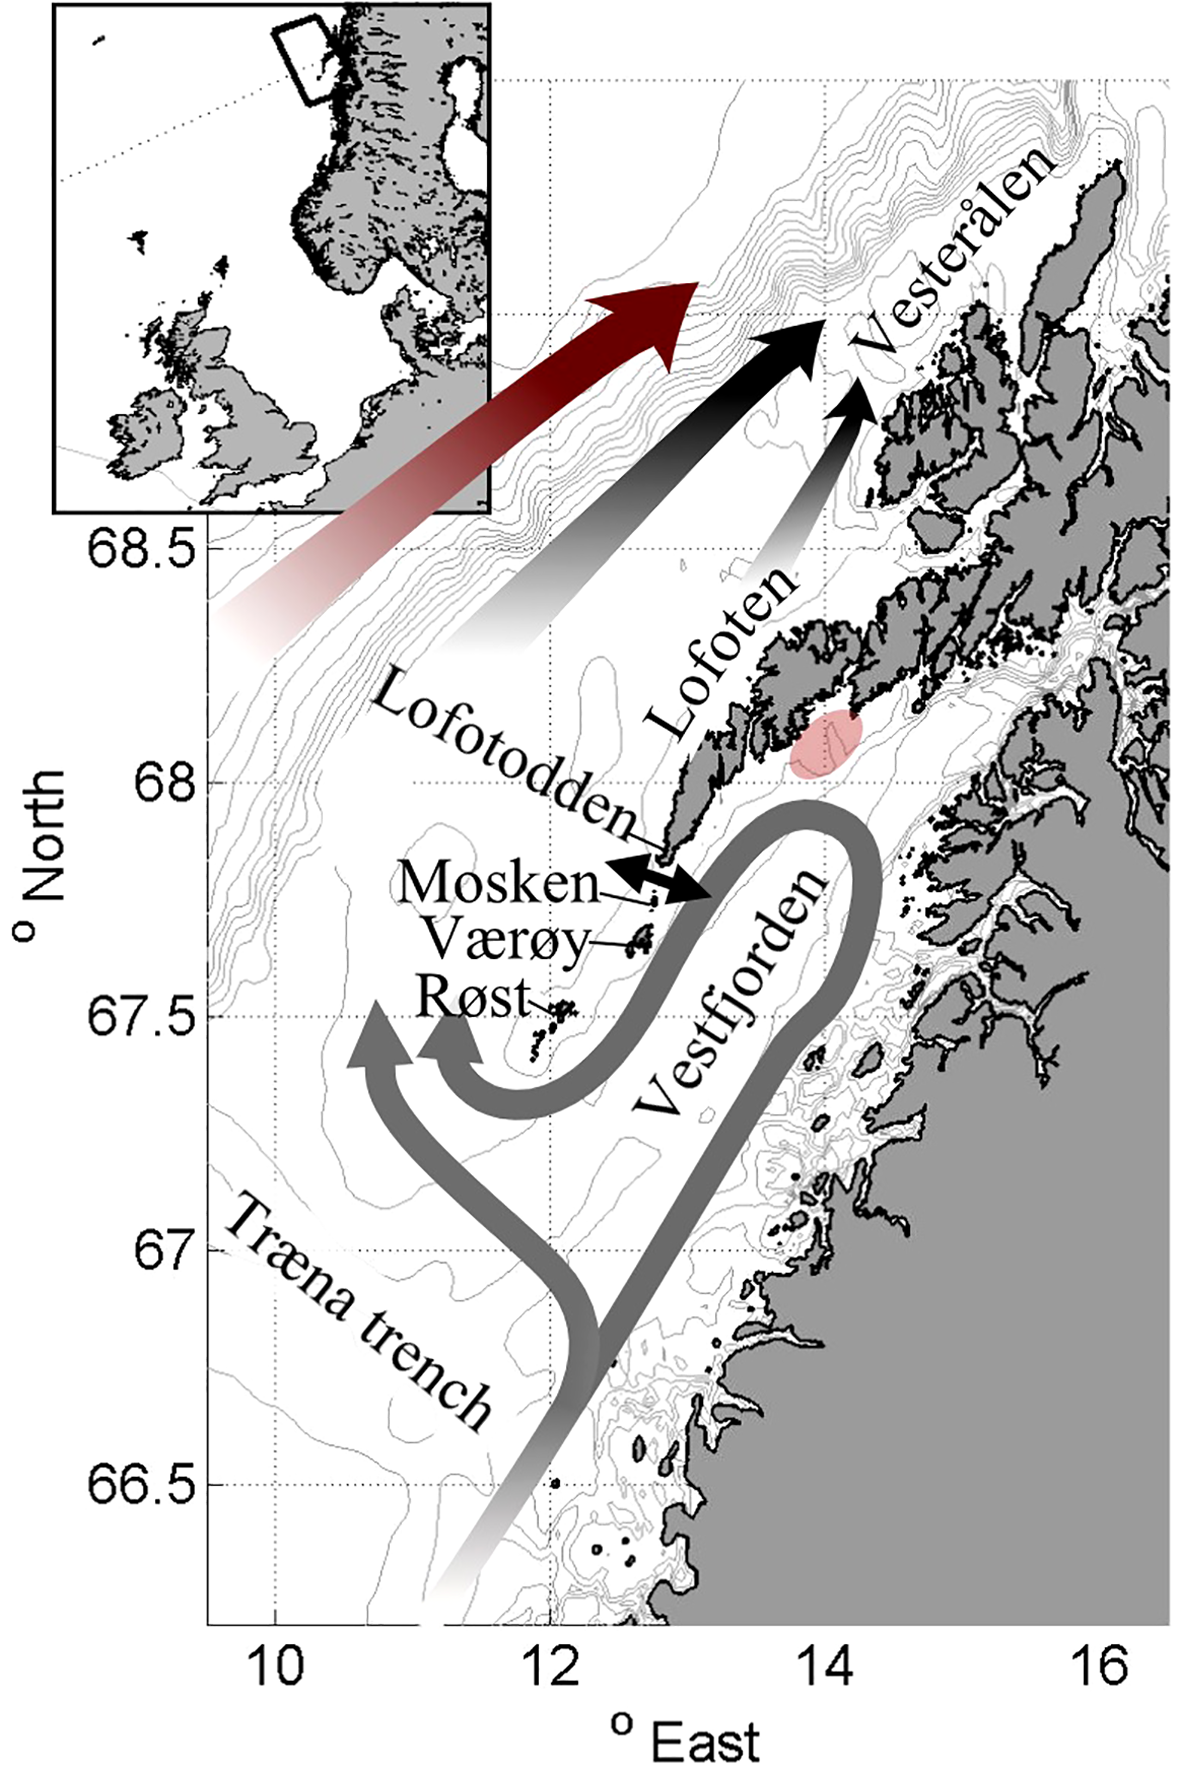
A sketch showing the ocean circulation in Lofoten and Vesterålen. The mean circulation of the Norwegian Coastal Current (NCC) in Vestfjorden is illustrated with gray arrows. The black arrows on the shelf illustrate the continuation of the NCC on the shelf and the red arrow west of the shelf break illustrates the Norwegian Atlantic Current (NwAC). The transparent red patch marks the spawning ground Henningsværstraumen and the black two-headed arrow indicates Moskstraumen, the most important tidal strait. The sketch is based on Sætre (1999) and Mitchelson-Jacob and Sundby (2001).
The transport of NEA cod eggs and larvae from the Lofoten-Vesterålen area to the Barents Sea has been widely studied over the years, where the focus typically has been on the large-scale drift northward along the Norwegian shelf (Åndalsvik and Sundby, 1994; Vikebø et al., 2007; Opdal et al., 2008; Ottesen et al., 2014). The general surface circulation in the region is sketched in Figure 1. On the continental shelf the eggs and larvae drift northeastward towards the Barents Sea with the Norwegian Coastal Currents (NCC) and also partly with the Norwegian Atlantic Current (NwAC), which runs parallel to the NCC just offshore of the shelf break (Åndalsvik and Sundby, 1994; Vikebø et al., 2005). The NCC itself splits into two branches south of Vestfjorden. One of these branches enters and encircles Vestfjorden in a counter-clockwise fashion before reconnecting with the other branch just off the southern tip of the Lofoten archipelago (Sundby, 1978, Figure 1).
Studies have indicated that NEA cod eggs originating from Vestfjorden primarily follow the inner NCC branch and leave the embayment south of Røst, the southernmost island of the Lofoten archipelago (Ellertsen et al., 1981). The surface circulation, and thus the egg drift, within Vestfjorden are shown to be largely influenced by winds (Ellertsen et al., 1981; Mitchelson-Jacob and Sundby, 2001; Furnes and Sundby, 1981). For example, during northeasterly winds, the current structure sketched in Figure 1 is strengthened and the transport out of the embayment via the NCC is enhanced. In contrast, during southwesterly winds the surface circulation partly reverses and eggs are assumed to remain longer inside Vestfjorden (Furnes and Sundby, 1981; Mitchelson-Jacob and Sundby, 2001).
However, currents and current variability in the Lofoten-Vesterålen region are also largely dictated by the tides. Tidal currents are prominent, with maximum speeds exceeding 2 m/s in many of the straits connecting Vestfjorden to the shelf (Moe et al., 20002). The northward-propagating tidal waves, emerging from the North Atlantic, are distorted by the Lofoten archipelago (Gjevik, 1997; Moe et al., 20002). The inner parts of the waves get trapped inside Vestfjorden while the outer parts continue unobstructed along the shelf. The result of this distortion is both a phase shift between the inner and outer part of the waves, as well as an elevated tidal amplitude inside Vestfjorden. Large gradients in sea surface height are thus established across the archipelago causing the strong currents that are observed in the straits. In fact, one strait on the shallow ridge south of Lofotodden hosts the famous Lofoten Maelstrom or, more precisely, Moskstraumen (indicated by a two-headed arrow in Figure 1). Moskstraumen is well-known for its vigorous and deadly currents and has been the inspiration for many tales and stories that can be traced back to Medieval times (Gjevik, 1997). Here, interactions between the oscillating tidal currents and the background currents appear to produce particularly prominent time-mean transport out of Vestfjorden (Ommundsen, 2002; Lynge et al., 2010). The present study aims to investigate the role that Moskstraumen and tidal currents in the other straits along the archipelago may play in the net transport and dispersion of NEA cod eggs and larvae.
In a high-resolution 2D numerical model study, Børve et al. (2021) examined two specific dynamical processes that may generate time-mean tidal transport in Lofoten. The first process, tidal pumping, results from flow separation and the formation of self-propagating dipoles during outflow from strait openings (Wells and van Heijst, 2003; Nøst and Børve, 2021). The dipoles, which can trap and bring with them water properties, are highly effective transport mechanisms if they escape the return flow during the subsequent phase of the tide. The tidal pumping was found to be most effective in Moskstraumen, but pumping through other straits also contributed to transport out of Vestfjorden. The second process is the rectification of tidal currents around islands and banks. When oscillating tidal currents move up and down topographic slopes, vortex stretching and compression in the presence of bottom friction may cause residual along-slope currents (Huthnance, 1973; Zimmerman, 1978). The 2D study of Børve et al. (2021) showed that this process can generate time-mean anti-cyclonic circulation cells around the islands Mosken, Værøy and Røst south of Lofotodden. Through interactions with smaller-scale flow features, these rectified tidal currents thus also contributed to significant tracer transport out of Vestfjorden.
This study builds on the findings of Børve et al. (2021). While the 2D tidal simulation of Vestfjorden was conducted to investigate the strength and presence of nonlinear tidal transport dynamics in a realistic Lofoten and Vesterålen, the present study investigates the importance of such dynamics relative to other transport mechanisms in this region. While previous studies have investigated the tides in the Lofoten and Vesterålen region (Gjevik, 1997; Moe et al., 20002), and their impact on transport and dispersion through specific straits, like Moskstraumen (Lynge et al., 2010; Ommundsen, 2002). This study is the first to quantify the integrated effect nonlinear tidal dynamics have on transport of particles, like cod eggs and larvae, out of Vestfjorden.
To investigate the net effect of tidal transport on particle-drift, relative to other transport mechanisms, realistic 3D ocean simulations are conducted both with and without tides. Since nonlinear tidal dynamics occur on small spatial scales high-resolution model mesh (50–100 m) is required to resolve the key processes properly (Lynge et al., 2010; Nøst and Børve, 2021; Børve et al., 2021). To achieve such high resolution in the many of the straits cutting through the archipelago while also covering the whole ocean region variable mesh model technology is used. Furthermore, since most previous model studies of long-term transport in Lofoten-Vesterålen are based on ocean models with spatial resolution between a few hundred meters and a few kilometers, the present study should provide important new insights into the ocean dynamics in the region and, specifically, the impacts of nonlinear tidal transport on the early life cycle of the NAE cod.
2 Materials and methods
We restrict ourselves to investigate particle drift from Henningsværstraumen (indicated by the red ellipse in Figure 1). This location is the main spawning ground for the NEA cod in the Lofoten-Vesterålen region and accounts for almost 60% of the total spawning inside Vestfjorden (Sundby, 1978). The NEA cod spawning season typically starts in the beginning of March and lasts until end of April, with a peak spawning at the beginning of April. We therefore simulate the hydrography and flow field of the region for a random year (here: 2018) and release synthetic particles continuously through March and April. We track all particle trajectories over four weeks to investigate their drift patterns and locations at various ages and times.
2.1 Hydrodynamical modelling
We use the Finite Volume Coastal Ocean Model (Chen et al., 2003, FVCOM) to simulate hydrography and currents. FVCOM is a three-dimensional primitive equation coastal ocean model operating on an unstructured horizontal grid (Chen et al., 2003). It discretizes the integral form of the governing equations and calculates momentum advection using a second-order accuracy flux scheme (Chen et al., 2003; Kobayashi et al., 1999). Horizontal diffusion is calculated using the Smagorinsky turbulent closure scheme (Smagorinsky, 1963). The bottom stress is formulated as a quadratic bottom friction with a depth-dependent drag coefficient. The governing equations are integrated in time using the modified explicit forth-order Runga-Kutta time stepping scheme (Chen et al., 2003).
The whole model domain, shown in 2a, covers the coastline of Nordland county and the southern part of Troms county in Northern Norway, including the whole shelf region and part of the Lofoten Basin further off-shore. The coastline of Northern Norway is complex, consisting of a myriad of islands and narrow straits. The unstructured triangular grid cells in FVCOM give us the flexibility to have the high resolution needed for resolving important nonlinear flow features near land while at the same time covering a large enough domain that captures the northward-propagating tidal waves as well as the background currents (the NCC and NwAC).
The straits cutting through the Lofoten-Vesterålen archipelago and the shallow ridge southwest of Lofotodden requires particularly fine resolution if one is to capture small-scale nonlinear tidal dynamics there (Lynge et al., 2010; Børve et al., 2021). The grid resolution is therefore set to be 30–50 m along the coast and in these narrow passages. To allow for the generation of flow-separation eddies, all straits are resolved with at least 5 grid cells across the narrowest cross-sections. Most strait openings, where eddy formation normally occurs, are resolved with at least 10 grid cells. The grid resolution decreases away from land and steep topography, down to 2.4 km at the outer open boundary. In the vertical we use a terrain-following sigma coordinate system, with a total of 34 layers. To include the effect of wind forcing on the upper water column we have the highest resolution here, and the vertical resolution then decreases with depth.
Our FVCOM setup is nested into the NorShelf model, run operationally by the Norwegian Meteorological Institute (Röhrs et al., 2018). NorShelf is a data-assimilation product (using 4Dvar) based on the Regional Ocean Modeling System (Shchepetkin and McWilliams, 2005, ROMS) that covers the whole shelf sea of Norway. It has a 2.4 km grid resolution in the horizontal and stretched topography-following coordinates with 42 layers in the vertical. Temperature, salinity, 3D currents and sea surface height (SSH) from this model are applied along the open boundary of the FVCOM domain (dashed line in Figure 2A) through a 10 km wide nesting zone. The atmospheric forcing is taken from hourly data fields of the Arome MetCoOp model (Müller et al., 2017). MetCoOp is an operational convective-scale weather prediction model (horizontal resolution of 2.5 km), provided by the Norwegian Meteorological Institute in collaboration with the Swedish Meteorological and Hydrological Institute (available on https://thredds.met.no/thredds/metno.html). Finally, river runoff from the coast is also included. This is based on observed and modeled river discharges from more than 7000 rivers provided by the Norwegian Water Resources and Energy Directorate (NVE; https://atlas.nve.no).
Figure 2
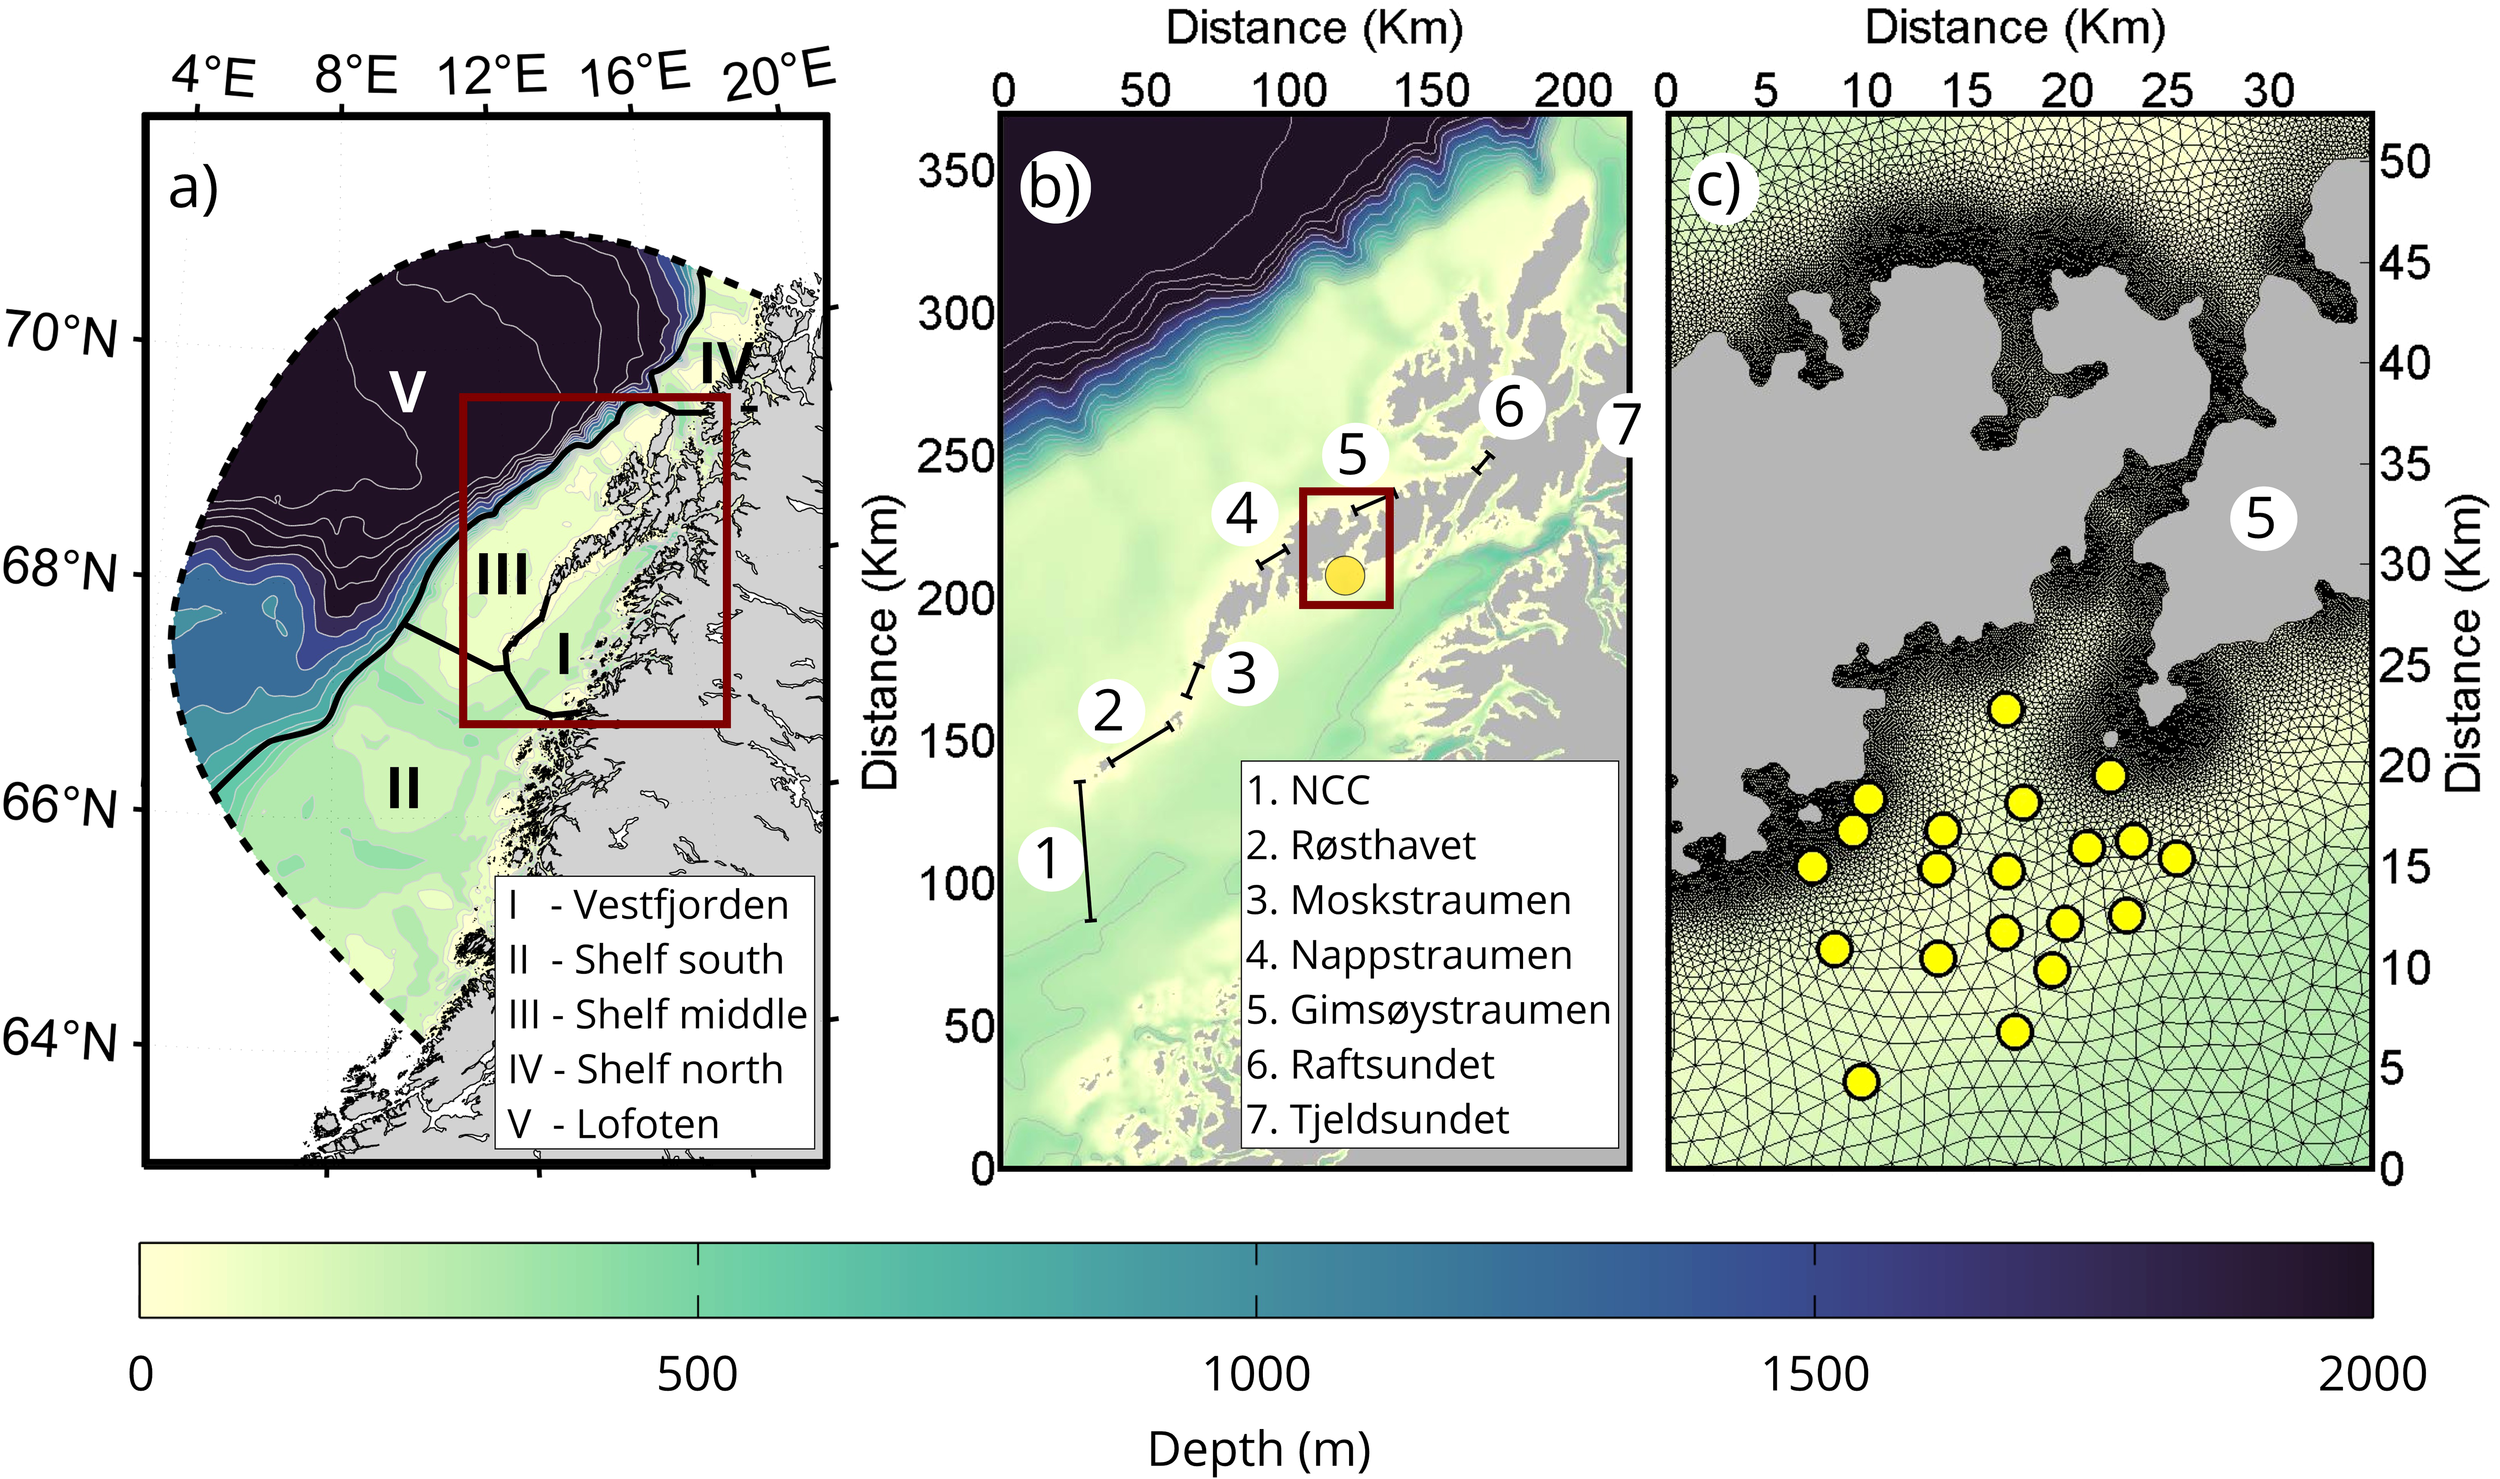
(a) The full model domain including coastline and bathymetry is displayed in the left panel. The thick solid black line, along with the outer boundary of the domain (dashed black line) marks the boundaries between the different sub-regions used for particle tracking. The red rectangle shows the main interest region, Lofoten and Vesterålen, zoomed in on in the middle panel. (b) In the middle panel we show the different transport routes out of Vestfjorden which we investigated. (c) In the right panel, we plot the spawning ground Henningsværstraumen (near Gimsøystraumen) and the 21 release points for particle tracking marked by yellow dots. In this panel the model grid is also shown (triangles). In all panels, the bottom depth is indicated with the background color.
We make two runs with our model. One run is forced with hourly data from NorShelf, to capture the tides, while the other run is forced by daily-mean fields where the tides are effectively filtered out. The NorShelf simulation itself applies in total eight of the major tidal constituents from the TPXO global inverse barotropic model (Egbert and Erofeeva, 2002), which are imposed on the velocity and SSH fields at that model’s lateral boundaries (Röhrs et al., 2018). For simplicity we will throughout this paper refer to the simulation forced with hourly flow fields, including the full tidal signal, as the ‘WiTi’ run, and the simulation forced with daily-mean flow fields, excluding tides, as the ‘NoTi’ run.
2.2 Model validation
A good model representation of the northward-propagating tidal waves is crucial for obtaining realistic tidal current amplitudes in the straits in Lofoten-Vesterålen. We therefore compare the tides in the WiTi run against observations compiled by Moe et al. (20002) and Dataset Norwegian Mapping Authority, Hydrographic Service, (2021), using the Matlab-based harmonic analysis package U-tide (Codiga, 2011). Figure 3 shows the comparison between the simulated and observed tidal components. The signal in sea surface height (SSH) is evaluated at five different locations. The amplitude and phase of the comparison are shown in Figures 3A, B for the most prominent semi-diurnal and diurnal constituents. The model is in general in very good agreement with the observed SSH amplitude. The phase-shift is also well represented in the model, however, somewhat off for the N2-constituent.
Figure 3
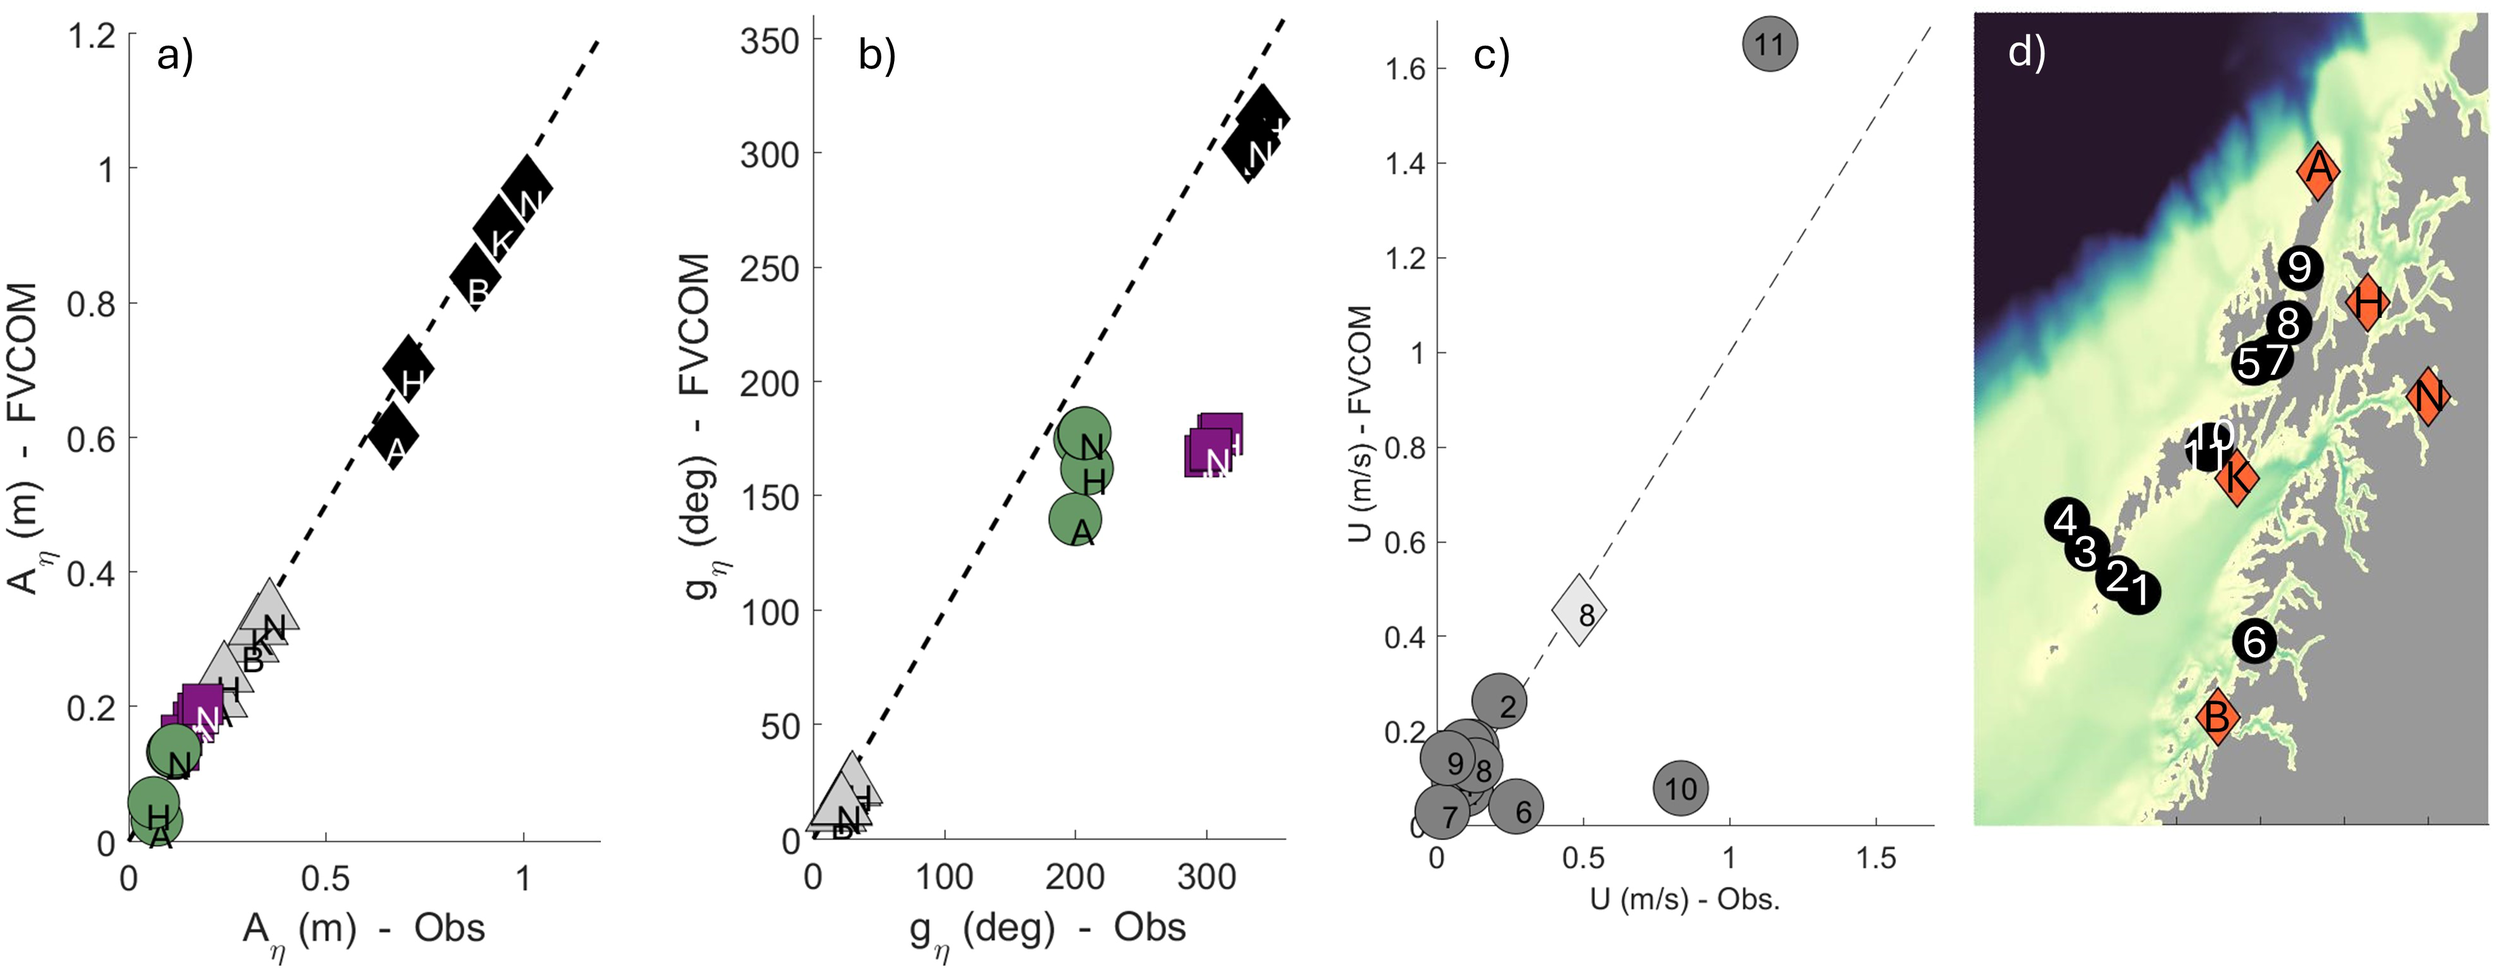
Comparison between modelled and observed tides in Lofoten-Vesterålen. Comparison of the amplitude (A) and phase shift (G) of sea surface height (SSH) are displayed in (a, b), respectively. Displayed are data from five stations: Andenes (A), Harstad (H), Kabelvåg (K), Narvik (N) and Bodø (B); locations are shown as orange markers in the map in (d). The different tidal constituents considered are M2 (black diamonds), K1 (green circles), N2 (purple squares) and S2 (gray triangles). (c) shows the comparison of tidal current amplitude. In total we compare 11 stations in the Lofoten-Vesterålen region, shown as black markers in the map. We display the M2 tidal current amplitude from all stations, and in addition the K1 tidal current amplitude from station 8 (diamond). The pink star in the map shows the location of the current meter used for the analysis presented in Figure 4.
The current amplitudes are evaluated at 11 stations for the M2 constituent and at one location for the K1 constituent; these are shown in Figure 3C. In general, the model reproduces similar current speeds as the observations. Currents at station 10, which is located inside the tidal strait Nappstraumen, are too weak in the model. This station is located to the side of, yet close to, the core of the current where we expect a large velocity shear. So we can anticipate that small differences in location of the station can give large variations in the current speed. Station 11 is located close to station 10, but slightly further south and apparently inside the core of the strait current, and this shows better agreement with the observation. So the high current speeds at station 11, both in observations and in the model, indicate that the model does reproduce the prominent tidal currents inside the strait.
The overall impression is that the model reproduces the tides in Lofoten adequately for the purpose of investigating their general influence on the transport dynamics in the region. In addition, we compare time series of the full flow field from the WiTi run with an ADCP which was measuring in Vestfjorden (yellow star in Figure 3D) within the simulation period. The ADCP data is collected with a bottom-mounted Nortek Aquadopp profiler, measuring at at 400 kHz, during the period 23.05.18–28.11.18. In general, the model represents the observed currents very well, as shown in Figure 4. The model tends to overestimate the strongest velocities near the surface and underestimate the strongest velocities near the sea bottom. However, the discrepancies mainly concern the 5% highest current speeds. The exception is the deepest measurement (43 m depth), where the model in general underestimates the current speed.
Figure 4
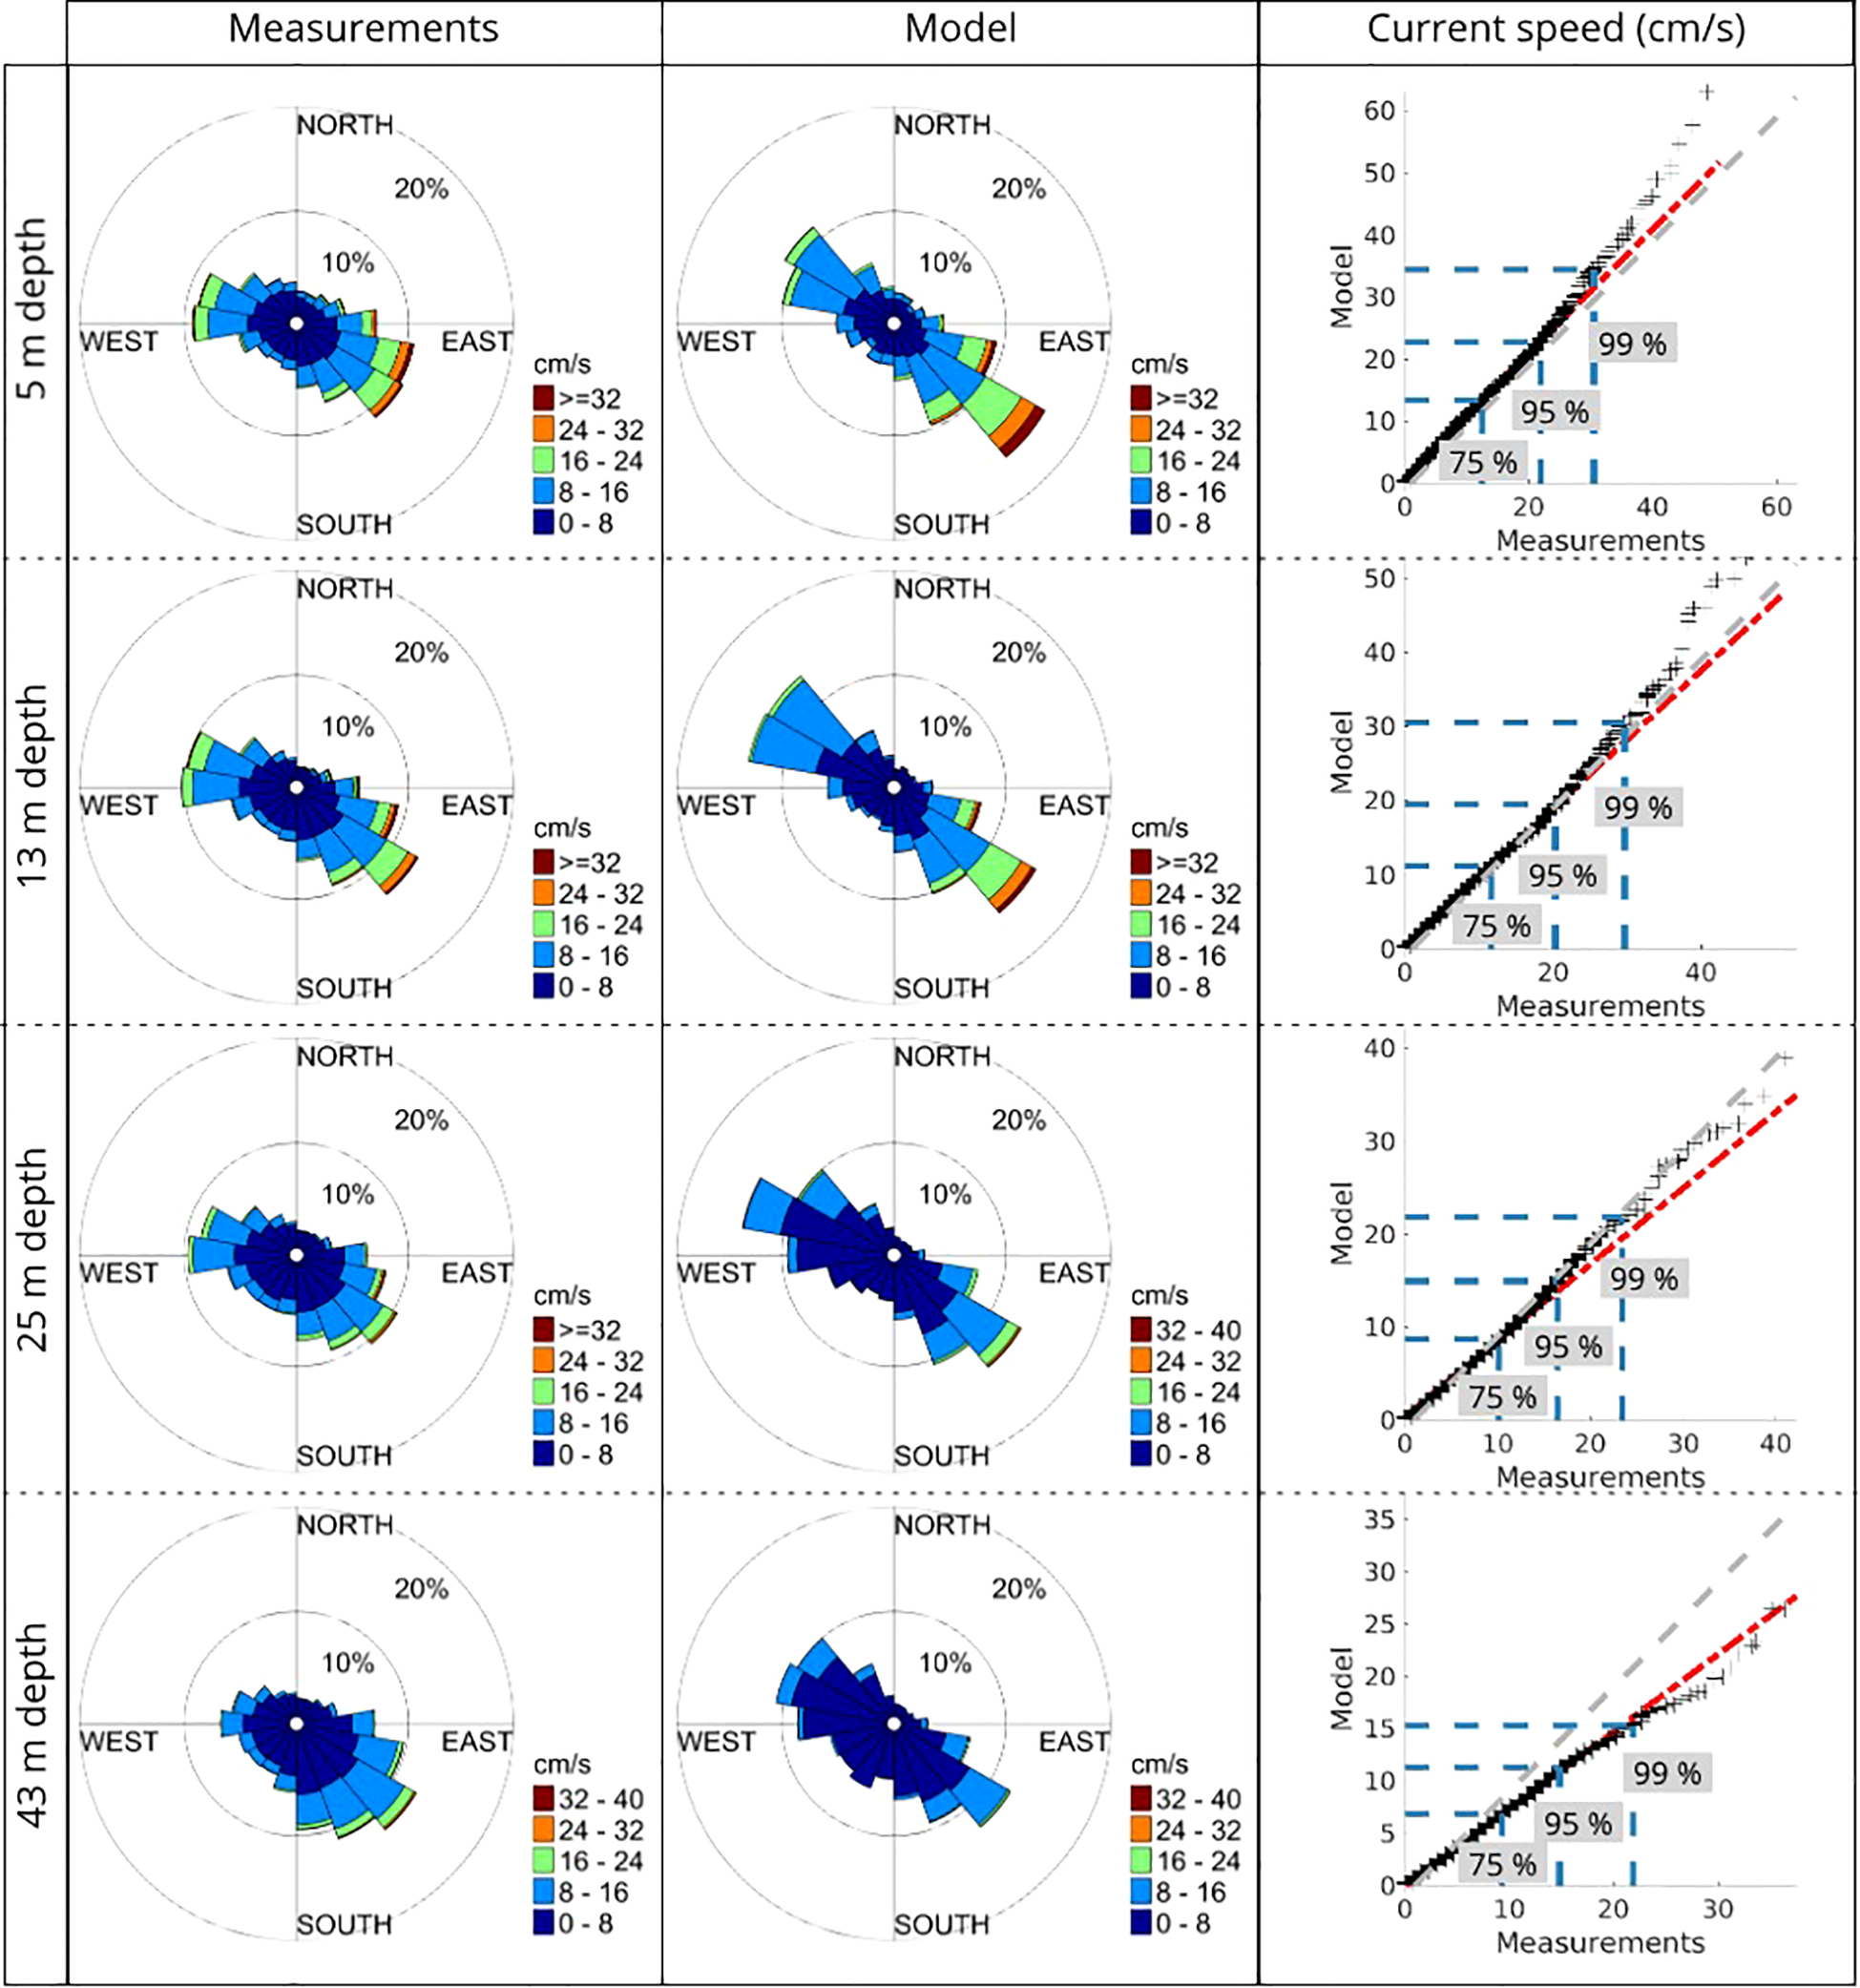
Comparison between model currents (WiTi run) and currents collected by an ADCP in Vestfjorden (location given by yellow star in Figure 3D). The comparison is from the time period 23.05.18–28.11.18, which is within the model run used in this study. The left and middle panels show the current velocity as rose plots. Colors indicate current speed, and the radius of sectors indicates the number of data points (percent is indicated by the circles) as a function of direction and speed. The left panels show observations at four different depths while the middle panels show the model data at similar depths. The right panels are quantile plots of current speed between the model and observations. The black crosses represent the data points, the gray dashed lines indicate one-to-one relationships, while the red dashed line show the linear regression for the data points. The blue horizontal and vertical dashed lines show the 75, 95 and 99 percentiles for the model data and the measurements, respectively.
2.3 Lagrangian particle drift modelling
The open-source Python-based framework for Lagrangian drift modeling, OpenDrift, developed at the Norwegian Meteorological Institute (Dagestad et al., 2018) is used for particle advection. We apply the basic module for passive advection of particles by the 3D ocean currents. A random walk component to the drift was set to zero. This choice allows us to investigate the exact difference in particle drift pattern when full tidal forcing is applied contra when it is not. A common challenge in Lagrangian modelling is the handling of particles that are advected to shore. Here, to avoid a large number of stranded particles in the simulations, we move any particle that hits land back to its last position before hitting land.
We release particles in Henningsværstraumen every hour from 1 March to 1 May at 21 positions, all located over bottom depths between 50 m and 150 m (Figure 2C. The NEA cod spawns within the thermocline, at temperatures of 4–6 degrees Celsius, which generally can be found at 50–150 m depth (Solemdal and Sundby, 1981). While the spawning can occur at the bottom, the NEA cod eggs have low density and quickly rise towards the surface Sundby (1983), Sundby, 1990). During calm weather, the concentration of eggs is typically increasing exponentially towards the surface from 30–20 m depth, while during windy conditions turbulence tends to mix eggs further down in the water column. However, we still expect the highest concentrations near the surface, and generally always above 20 meters depth (Sundby, 1990). So, for each of the 21 positions, we release the particles in the upper 10 meters of the water column, where we expect the bulk of the eggs to be located. In total 22 particles are released every hour in each position, 2 particles each at 0, 1, 2,…, 10 m depths. Since we are mainly interested in examining pure dynamical impacts on transport, we neglect the egg buoyancy effect. The particles in the model thus only move vertically by passive advection. We conduct the same experiment, releasing particles at the same time and same locations, in the two simulations (WiTi and NoTi) to obtain comparable results.
2.4 Particle statistics
Particles are tracked for a total of four weeks after release to capture information about the particle position at the average hatching time (3 weeks) and at the time of full food intake (4 weeks) for NEA cod eggs and larvae (Geffen et al., 2006; Solberg and Tilseth, 1990). To form statistics, we map particle positions on a 5 km by 5 km regular grid. In each cell of this grid we count the number of unique particles that entered during the first 3 weeks and during the first 4 weeks after their release.
To investigate the abundance of particles in different geographical domains as a function of time, as well as the rate of retention of particles inside Vestfjorden, we also divide the model domain into larger sub-regions. The different regions (shown in Figure 2A) are Vestfjorden (I), The Shelf regions (II-IV), which consists of Shelf south (II), Shelf middle (III) and Shelf north (IV), as well as the Lofoten Basin (V, defined as regions having bottom depths deeper than 500 m). The number of particles in each of the sub-regions. thus provides information about the progress northward, the potential for loss towards the Lofoten Basin, and position on the shelf at various times, and how this compares when tides are either present or absent.
Finally, we also quantify the relative importance of the different transport routes out of Vestfjorden by counting the number of particles that exited Vestfjorden via the different straits and openings displayed in Figure 2B. A challenge in determining through which strait the particle exited is that a particle may re-enter the embayment and then exit again at a later stage. Although many approaches exist, in this study we chose to assign a particle to the strait through which it exited the last time during the 4 weeks simulation.
3 Results
3.1 Time-mean surface circulation
Figure 5A shows the modeled time-mean surface circulation in the more realistic model simulation with tides (WiTi), averaged from 1 March to 1 June 2018. The current field is in good agreement with results from previous studies, as sketched in Figure 1. Primarily, we see that the inner branch of the NCC enters Vestfjorden at the eastern side, recirculates south of Henningsværstraumen and exits south of the island of Røst. Here this inner branch also reunites with the outer branch. At the shelf west of Røst the NCC again bifurcates; one branch follows the coastline northeastward while another branch continues northwestward across the shelf to eventually join up with the northward flowing NwAC along the shelf break.
Figure 5
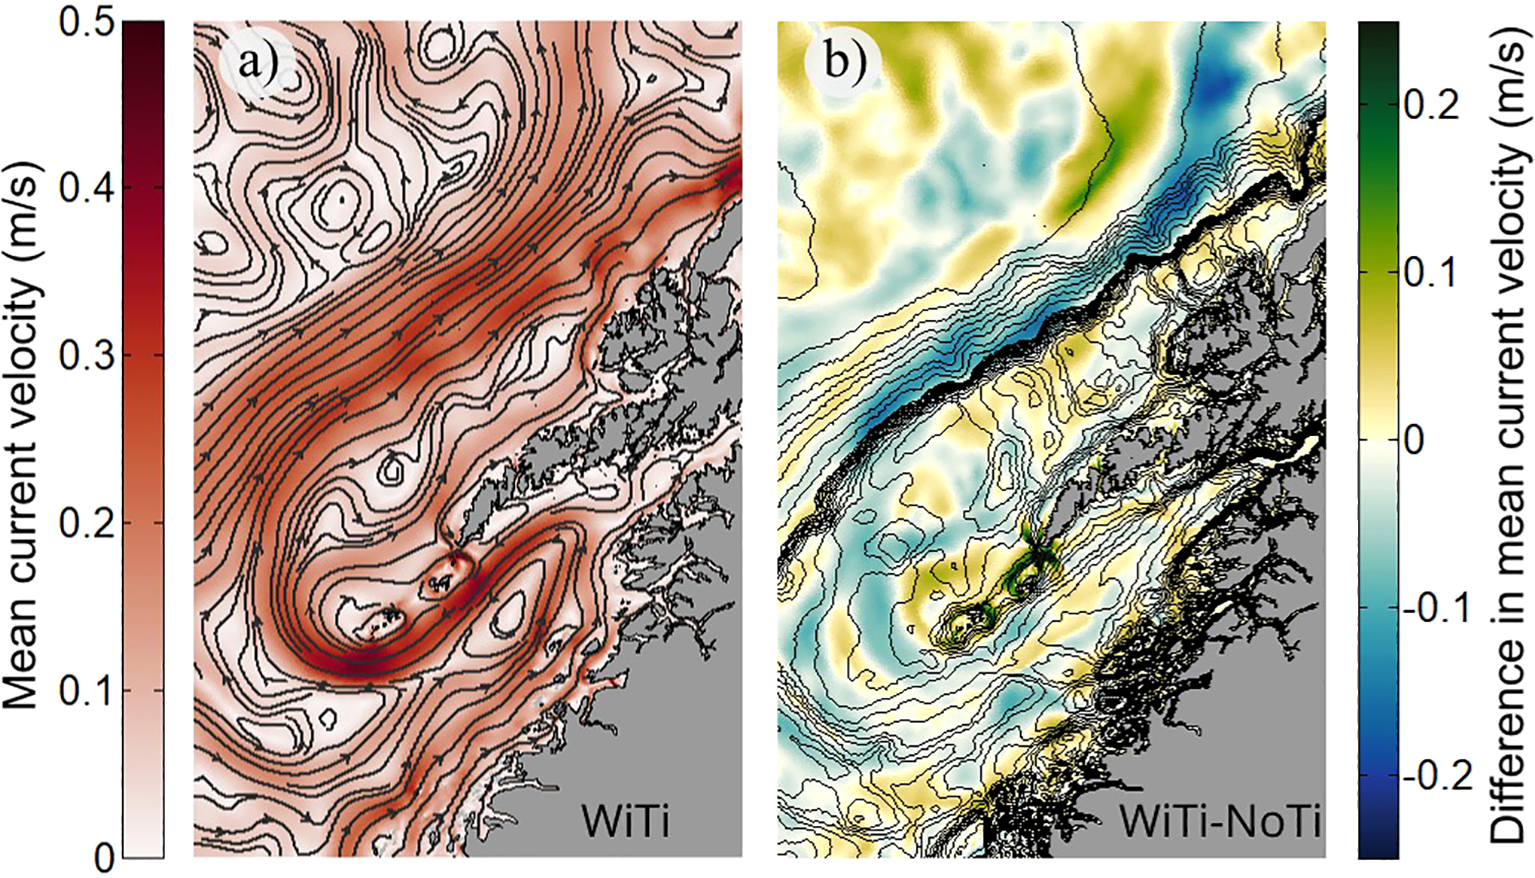
The modeled time-mean surface circulation. The left panel (a) shows streamlines and current strength (color) from the WiTi run. The right panel (b) shows the difference in current speed between the two runs (color) and bottom bathymetry (contours).
The net effect of including tides is indicated by the difference in the time-mean current strength between the model simulations, shown in Figure 5B. We expect that the observed differences will mostly be due to tidal rectification, but in these 3D simulations hydrographic changes, e.g. from different vertical mixing levels, may also contribute. The most obvious signal to be observed is perhaps that tidal effects seem to slow down the strength of the NCC core, particularly in the inner part of Vestfjorden, while accelerating the flanks of the current. This may suggest that the oscillating tides generally stir momentum down-gradient. While we will not pursue the details of the underlying dynamics here, it is worth noting that such modification of the NCC may also impact particle transport along this main advection path.
On a smaller scale, the most prominent strengthening of the time-mean surface circulation due to tides is seen around the island groups Mosken and Værøy, and Røst, as well as inside some of the narrow straits cutting through the archipelago further north. Figure 6 zooms in to show flow conditions around the bank regions southwest of Lofotodden, again showing both the time-mean flow in the WiTi run and the difference in flow strength between the two runs. In Figure 6A a time-mean anticyclonic flow patterns around the island groups Mosken-Værøy and around Røst is evident. The difference in current speed between the two runs, which exceeds 0.2 m/s in places, thus reflect the strength of the tidally-induced rectified circulation around the two island groups. In fact, the placement of the re-circulation cells and current strengths are remarkably similar to what was observed in the 2D tide-only simulation of (Børve et al., 2021). This confirms that tidal rectification around these islands is indeed present also in a realistic, stratified, ocean. In the vicinity of Moskstraumen we also see smaller re-circulation cells. These, however, are not encircling coastal features but are instead the time-mean imprint of highly non-linear flow-separation vortices, located on both sides of the strait. Such time-mean footprints of flow-separation vortices can also be seen in Nappstraumen, further north (Figure 6B). North of the narrowest cross-section is the imprint of a dipole vortex and its trailing jet, formed at the abrupt opening of the strait there. Dipole vortex formation here is also in close agreement with the results from the 2D simulations of Børve et al. (2021). And, as shown by that study, such flow-separation vortices, as well as rectified Eulerian re-circulation cells around islands, may contribute to the transport of tracers through the Lofoten-Vesterålen archipelago. We investigate this possibility next.
Figure 6
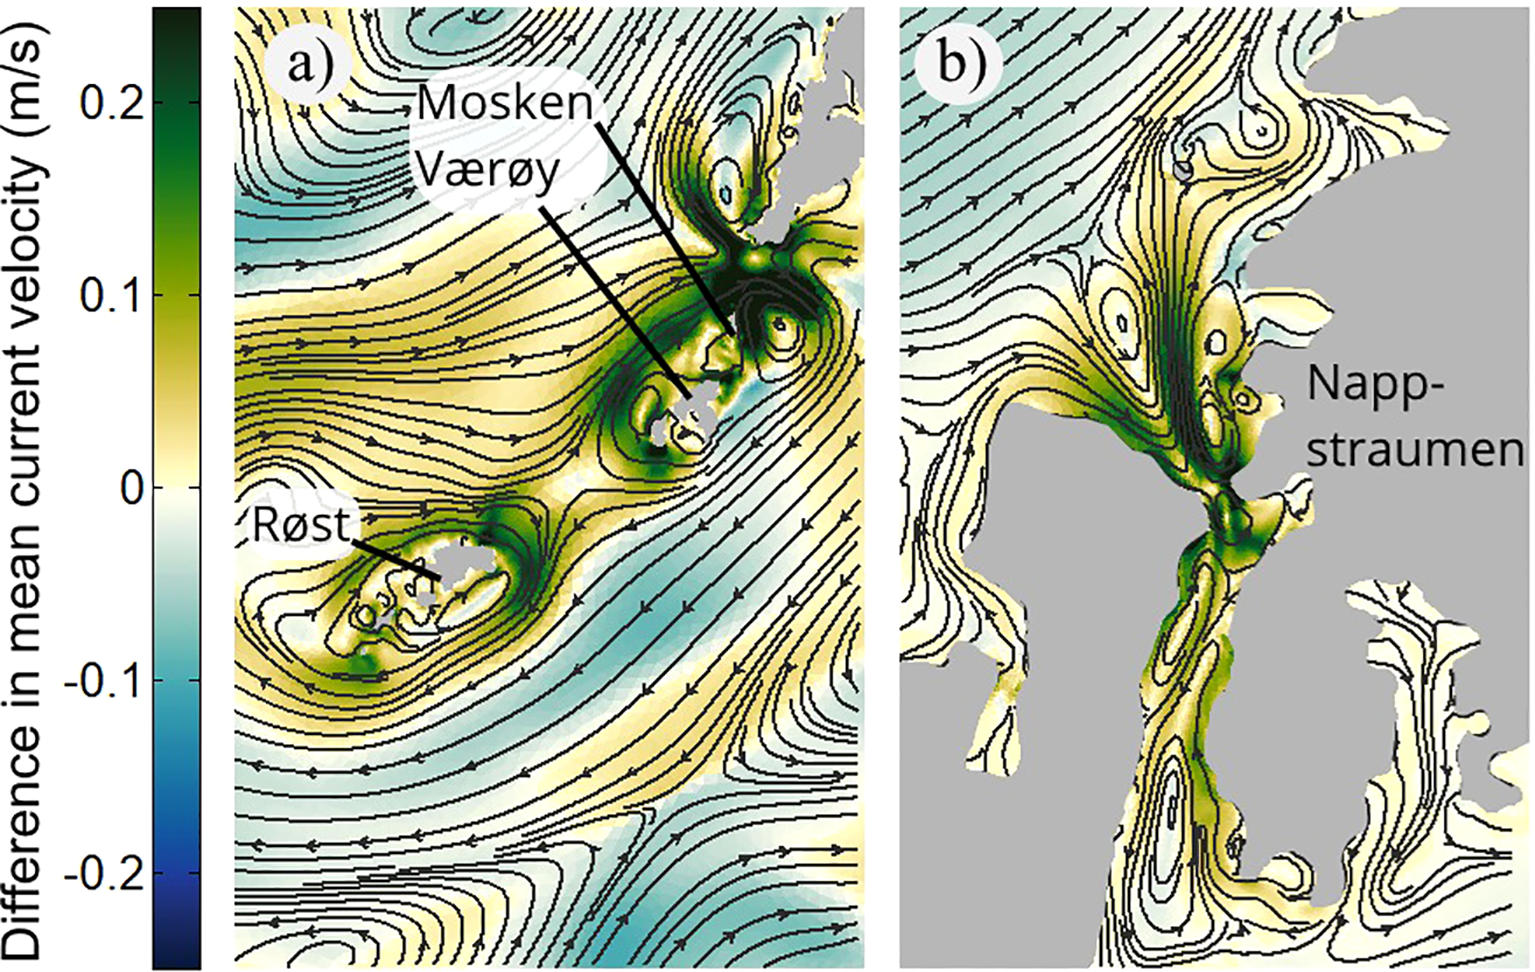
Difference in time-mean surface currents between WiTi run and the NoTi run in (a) Southern Lofoten (Mosken-Værøy and Røst) and in (b) Nappstraumen. The streamlines show the mean circulation in the WiTi run, while positive/negative values of the shading imply that the current velocity is higher/lower in the WiTi run.
3.2 General pattern of particle drift from Henningsværstraumen
The main pathways for particle drift in the two different model simulations are illustrated in Figure 7. The colors indicate the occurrence ratio of unique particles that have traveled through 5 km by 5 km grid cells during 3 and 4 weeks of passive drift from their release location in Henningsværstraumen. The left and right panels show the results from the WiTi and the NoTi run, respectively. In both model simulations, and in agreement with earlier studies, the dominant particle drift out of Vestfjorden follows the NCC around the south side of Røst. And, as could be anticipated from the difference in current strength seen in Figure 5, the particles that follow the NCC move faster out of Vestfjorden and reach further out on the shelf in the NoTi run compared to the WiTi run.
Figure 7
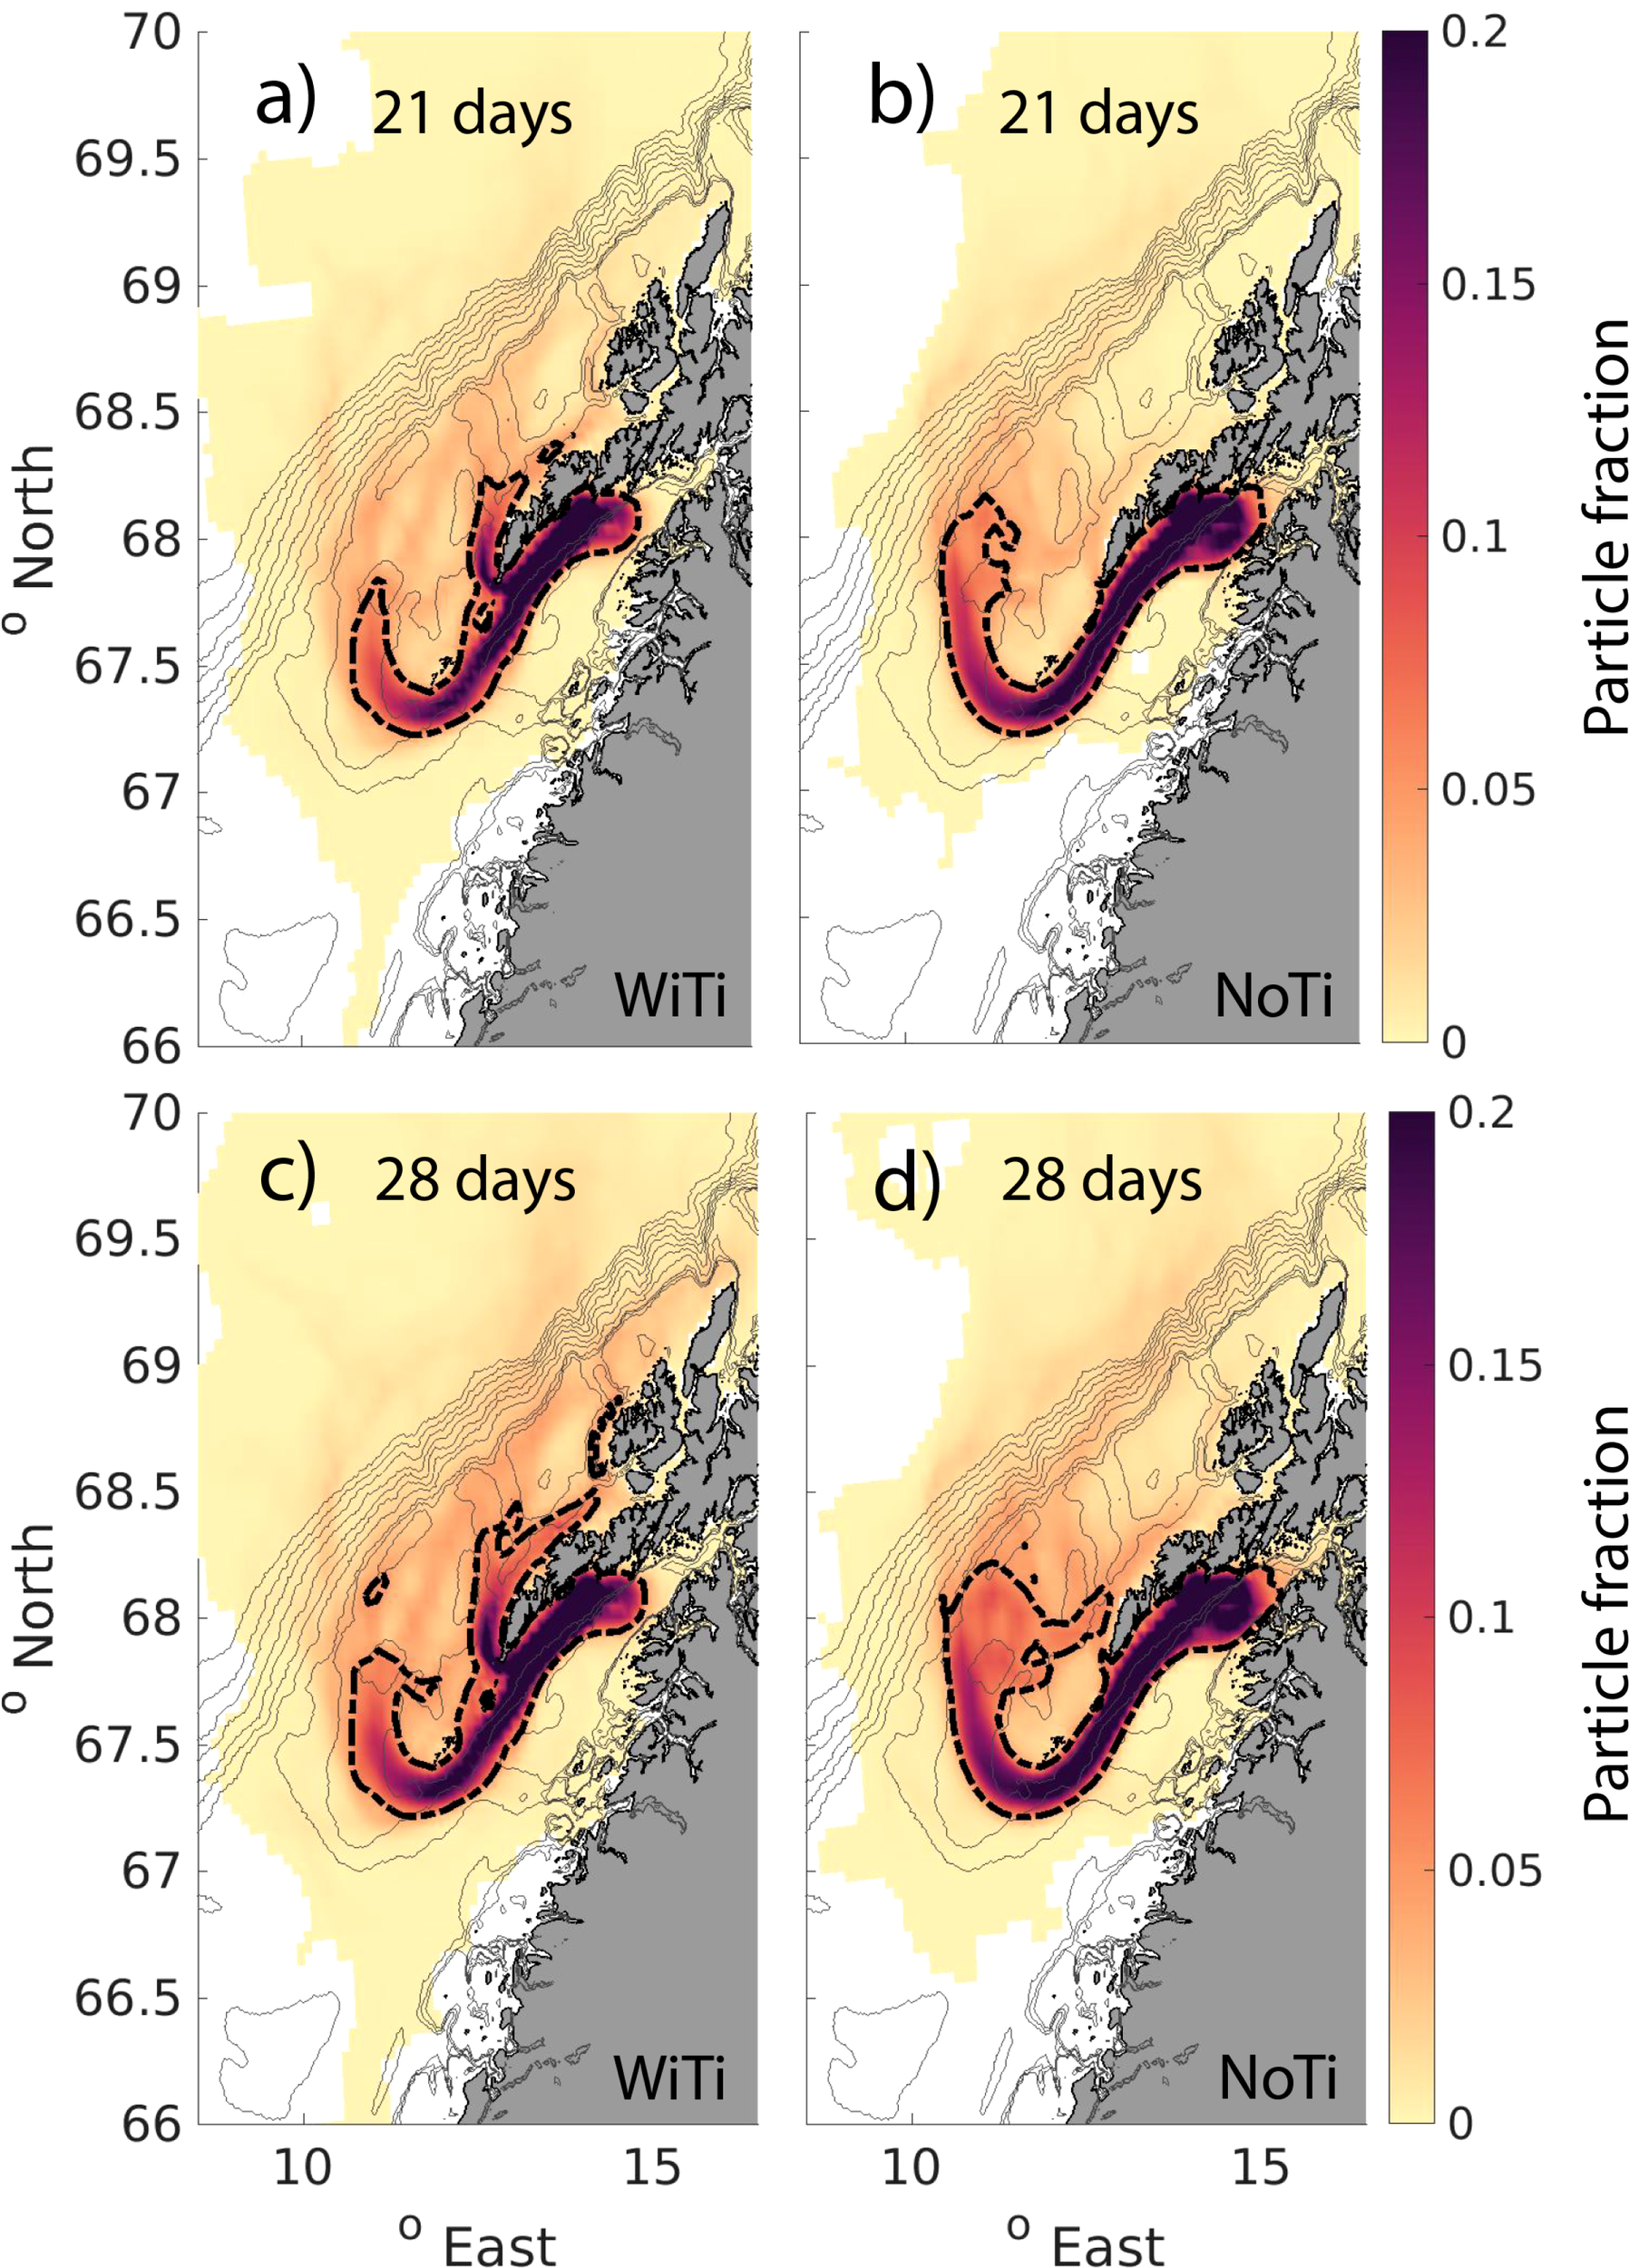
Particle distribution integrated over the first 21 days (A, B) and for the first 28 days (C, D) after release from Henningsværstraumen. The colors give the fraction of unique particles that has entered each of the 5 km by 5 km grid cells. The left panels (A, C) show the particle distribution for the simulations with tides included (WiTi), and the right panels (B, D) show the particle distribution for the simulations where we exclude tides (NoTi). The black dashed contours show the limit of 0.05 particle fraction within a grid-cell. The thin gray contours outline the bathymetry in the region.
More relevant to our focus here are the additional transport routes out of Vestfjorden through the straits in the archipelago in the presence of tides, and most notably through Moskstraumen. The particles that exit here effectively take a shortcut out of the embayment. Once outside, they are then transported rapidly northward along the inner parts of the shelf. Thus, even if the main advection path along the NCC is slightly faster in the NoTi run, particles in the WiTi run have reached further north along the shelf, particularly near the coast. Also along the shelf break and around banks on the shelf, we see a larger fraction of particles northward on the shelf in the WiTi run compared to the NoTi run.
The efficiency of particle transport out of Vestfjorden in the two model runs is quantified in Figure 8. What is shown is the fraction of particles in the various bulk regions (shown in Figure 2A) after 3 and 4 weeks of drift. A systematic difference between the two runs is already notable after 3 weeks. And after 4 weeks of drift, only 25% of the particles in the WiTi run are still inside Vestfjorden, while 55% and 20% are located on the shelf and in the Lofoten Basin, respectively. In the NoTi run, on the other hand, 34% of the particles are inside Vestfjorden after 4 weeks, while 48% are on the shelf and 16% are in the Lofoten Basin. In other words, by including full tidal forcing in the model, the particle transport out of the embayment increases by about 10%. Of the particles that have escaped Vestfjorden, the relative loss to the Lofoten Basin within 4 weeks of drift is approximately the same in the two model runs (26% in the WiTi run versus 25% in the NoTi run). This indicates that the bulk of the increase in total loss of particles to the Lofoten Basin when tides are included (seen in Figure 8) is more linked to an increase in particle transport out of Vestfjorden related to tidal dynamics, rather than due to enhanced off-shelf transport to the Lofoten basin by tides.
Figure 8
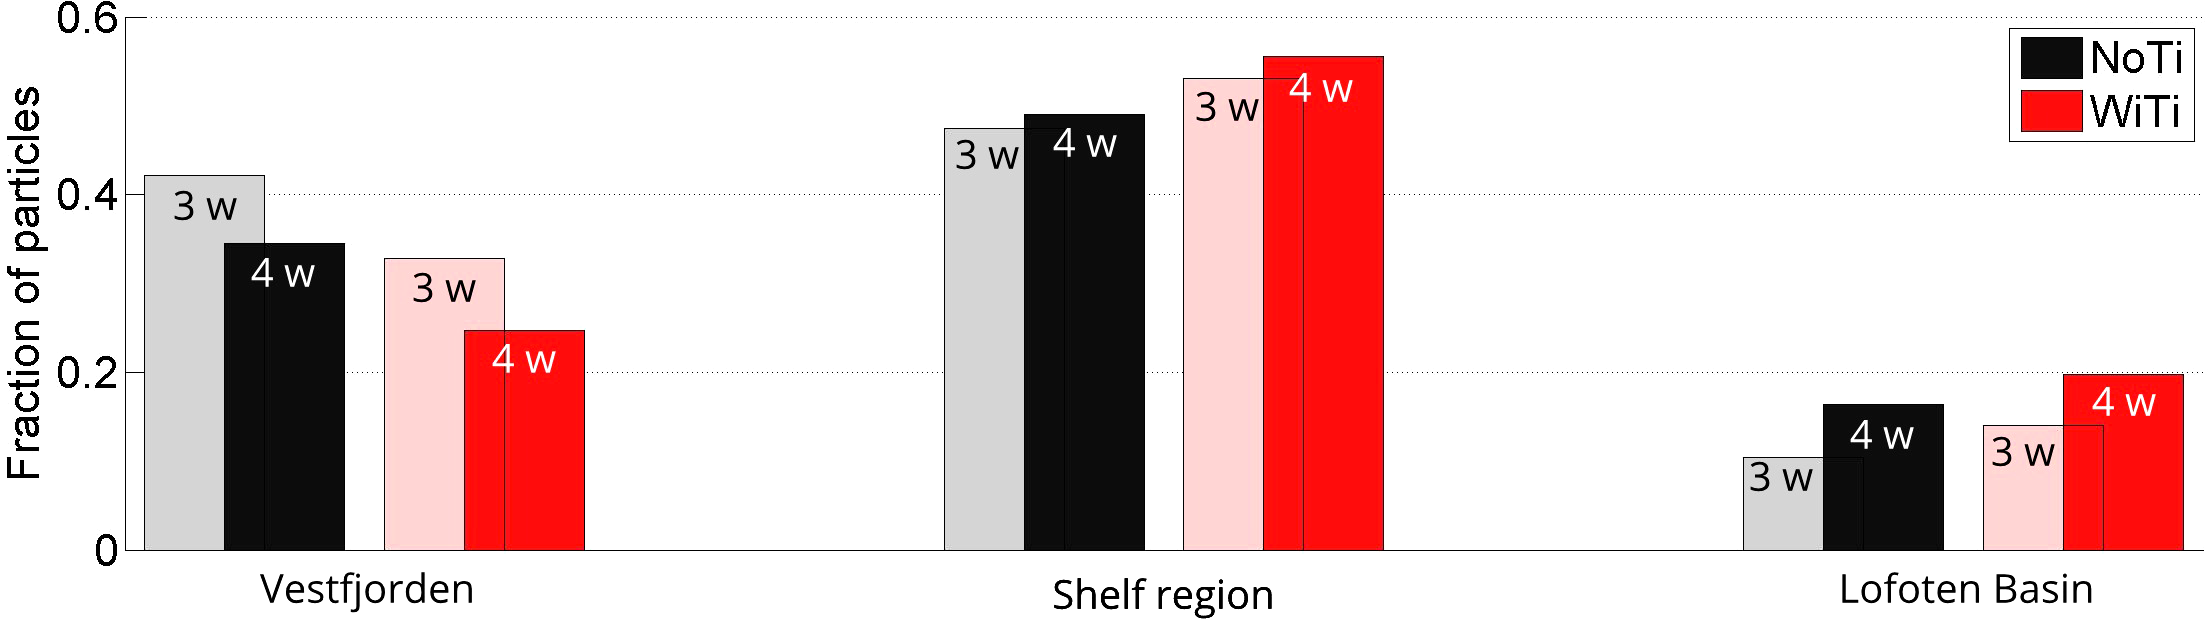
Fraction of particles that is located inside Vestfjorden (region I in Figure 2A), on the outer shelf (regions II, III and IV) and in the Lofoten Basin (region V) after 3 weeks (light colors) and after four weeks (dark colors). The black colors represent the WiTi run while the red colors represent the NoTi run.
As suggested by Figure 7, the more fundamental impact of tides on particle transport is on the selection of transport routes out of Vestfjorden. Figure 9 attempts to quantify this by showing the fractional contribution of various routes, 2, 3 and 4 weeks after particles have been seeded in each of the simulations. Since very few to no particles exit Vestfjorden through the straits further northeast (straits 6 and 7 in Figure 2B) we have excluded these in the analysis. These two straits are, based on the model results, not considered important for the transport of eggs and larvae that are spawned in Henningsværstraumen. The upper panel quantifies the main transport routes out of the embayment independently of where the particles end up. In both simulations, the route following the main advection path of the NCC around Røst dominates. But all of the other four routes (Røsthavet, Moskstraumen, Nappstraumen and Gimsøystraumen) allow particles to exit within 2 weeks, both in the WiTi and the NoTi run. And, importantly, the fraction of particles that has followed the main path of the NCC within 4 weeks is only 59% in the WiTi run, compared to 87% in the NoTi run. Moskstraumen, which is the second most important transport route in both model simulations, accounts for 32% in the WiTi run but only 6% in the NoTi run. Røsthavet contributes with 4% and 1% in the WiTi and NoTi run, respectively. Finally, the longer straits further to the northeast, Nappstraumen and Gimsøystraumen, contribute with 3% and 2% in the WiTi run, and 1% and 2% in the NoTi run, respectively.
Figure 9
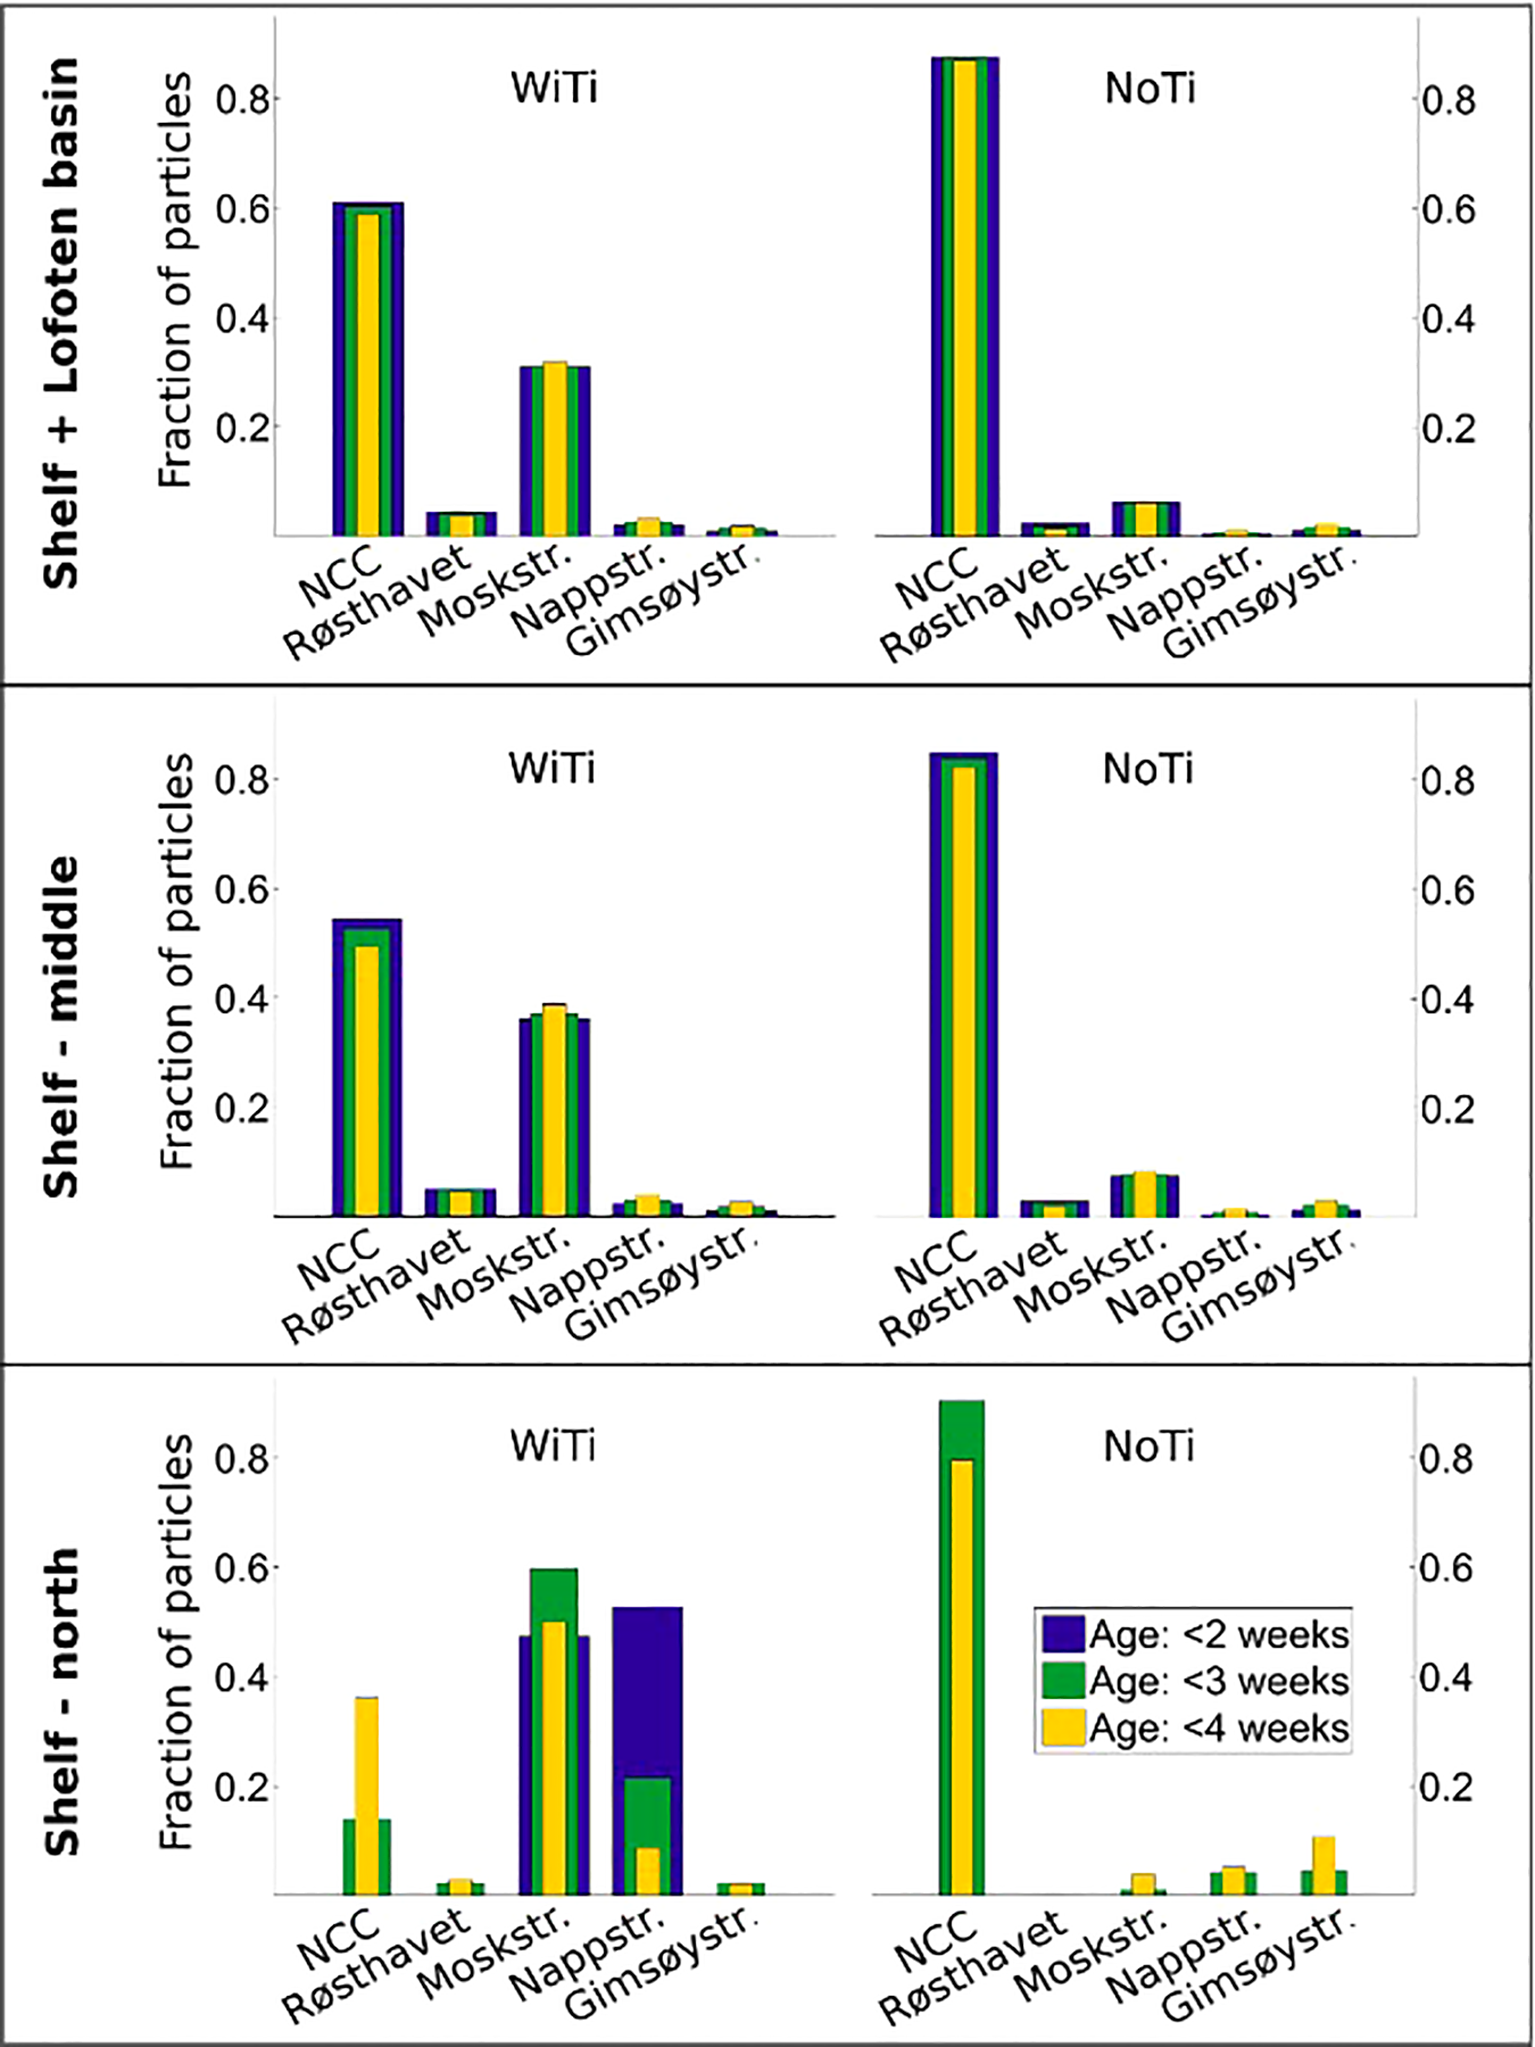
Fraction of particles transported along the five main transport routes out of Vestfjorden, namely the NCC (south of Røst), Røsthavet, Moskstraumen, Nappstraumen and Gimsøystraumen. The upper panel considers particles that end up anywhere outside Vestfjorden (ending either on the shelf or in the Lofoten Basin). The middle and lower panels consider particles that end up on the Shelf-middle and Shelf-north, respectively (regions III and IV in Figure 2A). The blue, yellow and green colors indicate particles at age younger than 2 weeks, 3 weeks, and 4 weeks.
The middle and lower panels in Figure 9 show the same calculation, but now done for particles that end up on the middle and northern shelf, respectively (regions III and IV in Figure 2B). For the middle shelf region, the contributions from the various routes are generally similar to the overall transport out of Vestfjorden (upper panel), particularly for the NoTi run. But in the WiTi run, a slightly higher fraction of particles ends up on the middle part of the shelf after exiting through Moskstraumen with a lower fraction having exited via the NCC. This indicates that a larger fraction of particles exiting via the NCC are either still located in the southern shelf (region II) or lost to the Lofoten Basin (region V) than what is the case for particles transported through the straits.
The impact of tides on transport routes and transport times becomes most apparent when doing the counts for particles that reach the northern shelf (region IV). In our model simulations, no particles have reached this region within 2 weeks when tides are excluded, while both Moskstraumen and Nappstraumen provide transport routes within such a short time period when tides are included. In the WiTi simulation these two routes also dominate the contribution to the northern shelf after 3 and 4 weeks. In contrast, modelling drift without tides in the NoTi run gives the impression that almost 80% of particles that reach this far north after three weeks have been advected south of Røst via the NCC. A more correct estimate, as indicated by the WiTi run, is less than 20%.
3.3 Temporal variations in particle drift
Particle drift can be expected to vary in time due to both changes in external forcing and internal ocean variability. Given the importance of tidal advection seen above, we now ask whether the spring-neap cycle in tidal forcing can also modulate export from Vestfjorden and whether it may be comparable to transport variability due to changing wind forcing.
Spring-neap variability is assessed by calculating the fraction of particles that leaves Vestfjorden via the different transport routes during different stages of the spring-neap cycle. We define spring tide as periods when the amplitude in sea surface height variability is more than 2 standard deviations above the mean amplitude at any given location. Likewise, neap tide is defined as periods when the amplitude is less than 2 standard deviations below the mean. Finally, we also define an ‘intermediate tide’ when amplitudes are within 2 standard deviations of the mean. Since the time-series for neap, spring and the intermediate tide are not necessarily of equal length, the fraction estimates are normalized by the corresponding lengths for comparison.
The result of this exercise is shown in Figure 10. It suggests that the total particle transport out of the embayment, summed over all transport routes, is in general lowest during neap-tide. But whether the largest transport rates occur during spring or intermediate tide depends on the transport route. Both Moskstraumen and Nappstraumen, where tidal pumping is the main transport mechanism, have largest transport rates during spring tide, almost twice the rates as during intermediate tide. In contrast, the transport via the NCC and Røsthavet is highest during intermediate tide. The higher transport rates here during intermediate tides can be due to weaker tidal contribution to the net transport and thus less particles that have already been transported out of Vestfjorden upstream through Moskstraumen and Nappstraumen, compared to spring tide. The transport through Gimsøystraumen, the northernmost of the straits considered and also one in which tidal pumping is not very important, is also highest during intermediate tides. However, the detailed interplay between variations in particle transport through the different straits upstream and downstream along the NCC, have not been investigated.
Figure 10
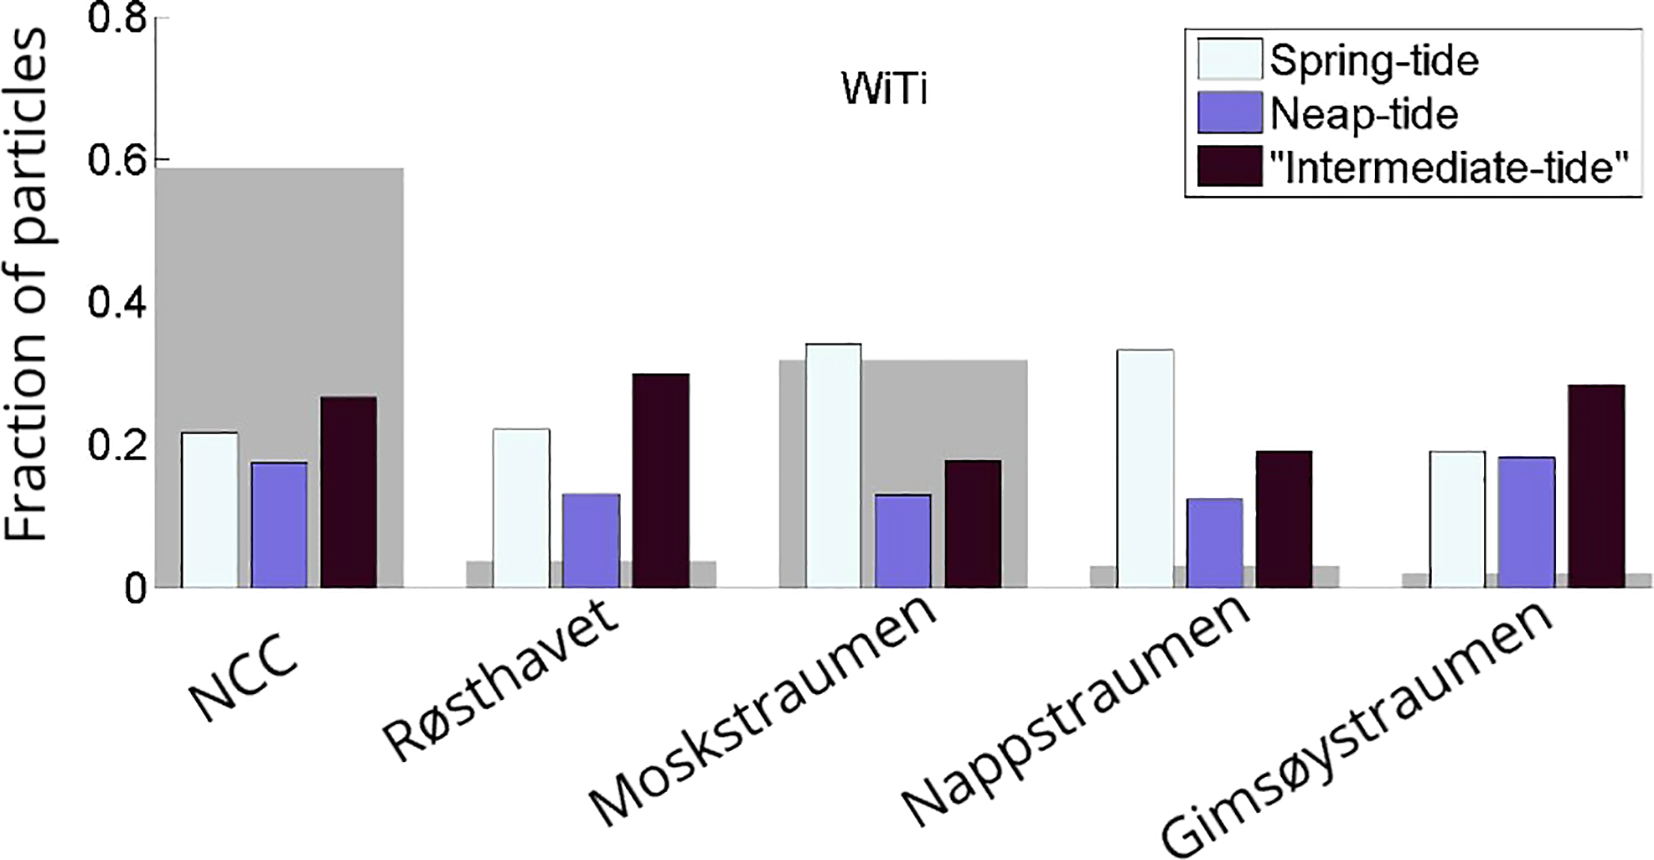
Weighed fraction of particles that exits Vestfjorden during spring, neap and intermediate tide via the main transport routes out of Vestfjorden. The gray patches in the background show the total fraction of particles that exited through the different straits.
Earlier studies have pointed to winds as the primary source for variability in the surface circulation in the Lofoten-Vesterålen region (Sundby, 1978; Mitchelson-Jacob and Sundby, 2001; Strand et al., 2017). Particle drift in Vestfjorden has also been closely linked to wind forcing (Ellertsen et al., 1981; Furnes and Sundby, 1981). More specifically, winds from the prevailing directions northeast and southwest impact the surface circulation and transport both inside Vestfjorden and on the shelf. Since both the shelf and Vestfjorden are north-easterly directed (Strand et al., 2017, about 42 degrees from east), winds from these two directions will typically act with or against the predominant flow directions. It would thus be useful to know how the spring-neap cycle in particle transport measures up to such wind-driven variability.
To evaluate wind-driven transport variations out of Vestfjorden, we investigate surface currents and particle drift during time periods when the mean winds along the coast come from the northeast (NE) and from the southwest (SW). We extract these time periods following the approach by Strand et al. (2017) and define the two wind sectors NE and SW as spanning +/- 45 degrees relative to the direction of the shelf (42 degrees north of east). The composite mean surface circulation during NE and SW winds is shown in Figure 11. The patterns, which can largely be seen as adjustments to offshore and onshore surface Ekman transport, are very similar to the schematic differences illustrated in Figure 10 of Mitchelson-Jacob and Sundby (2001). On the outer shelf, NE winds force the NCC to take on a more westward path and inhibit the formation of the coastal branch of the NCC which was seen in Figure 5A. At the shelf break, the NCC has a strong cross-slope component towards the Lofoten Basin. In contrast, during SW winds the north-eastward along-shelf component of the surface flow is strengthened. Inside Vestfjorden NE winds enhance current speeds in the NCC branch that flows through Vestfjorden, while SW winds cause the SW-directed NCC along the west side of Vestfjorden to weaken. Additionally, during SW winds an anticyclonic flow encircling all the islands south of Lofotodden appears with a prominent eastward component through Moskstraumen, presumably weakening the transport of particles through this passage.
Figure 11
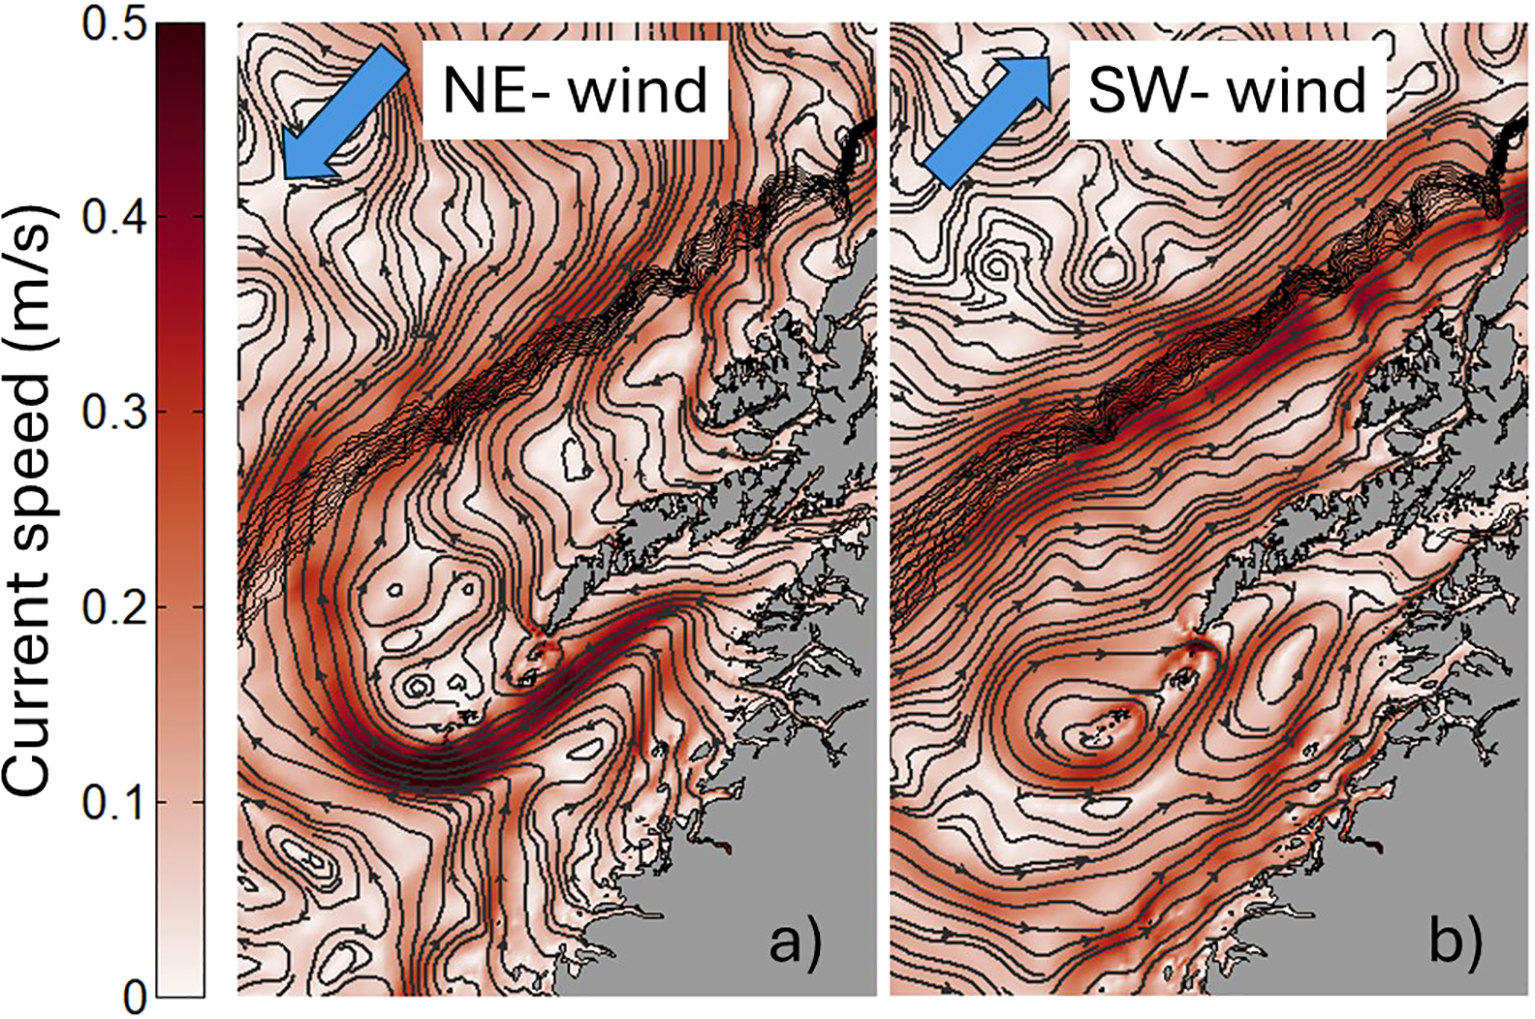
Composite means of the surface circulation in Lofoten during (a) NE-wind events and (b) SW-wind events in the WiTi run. The NoTi run show very similar time mean surface circulation for these wind regimes.
The effect of these two dominant wind regimes on particle transport out of Vestfjorden is quantified in Figure 12. For completeness, we also include transport when the winds come neither from NE or SW—labeled as ‘other wind directions’, and again the counts have been normalized by the length of each category. The results for the WiTi run are shown in the top panel. The calculation indicates that transport out of the embayment via the NCC, Røsthavet and Moskstraumen is higher during NE winds than during SW winds, and vice versa for the two northernmost straits Nappstraumen and Gimsøystraumen. This behavior is in agreement with the predominant circulation patterns of the two forcing regimes and is also in agreement with the earlier findings of Furnes and Sundby (1981). At the most basic level the difference can be understood as a ‘pile-up’ effect in the inner parts of the embayment during SW winds. But somewhat surprisingly, the difference in transport between the two regimes is smallest along the main advection path of the NCC. In general, the export through all openings for ‘other wind directions’ is generally comparable in size to that of the dominating wind regime. And this regime even dominates transport via the NCC.
Figure 12
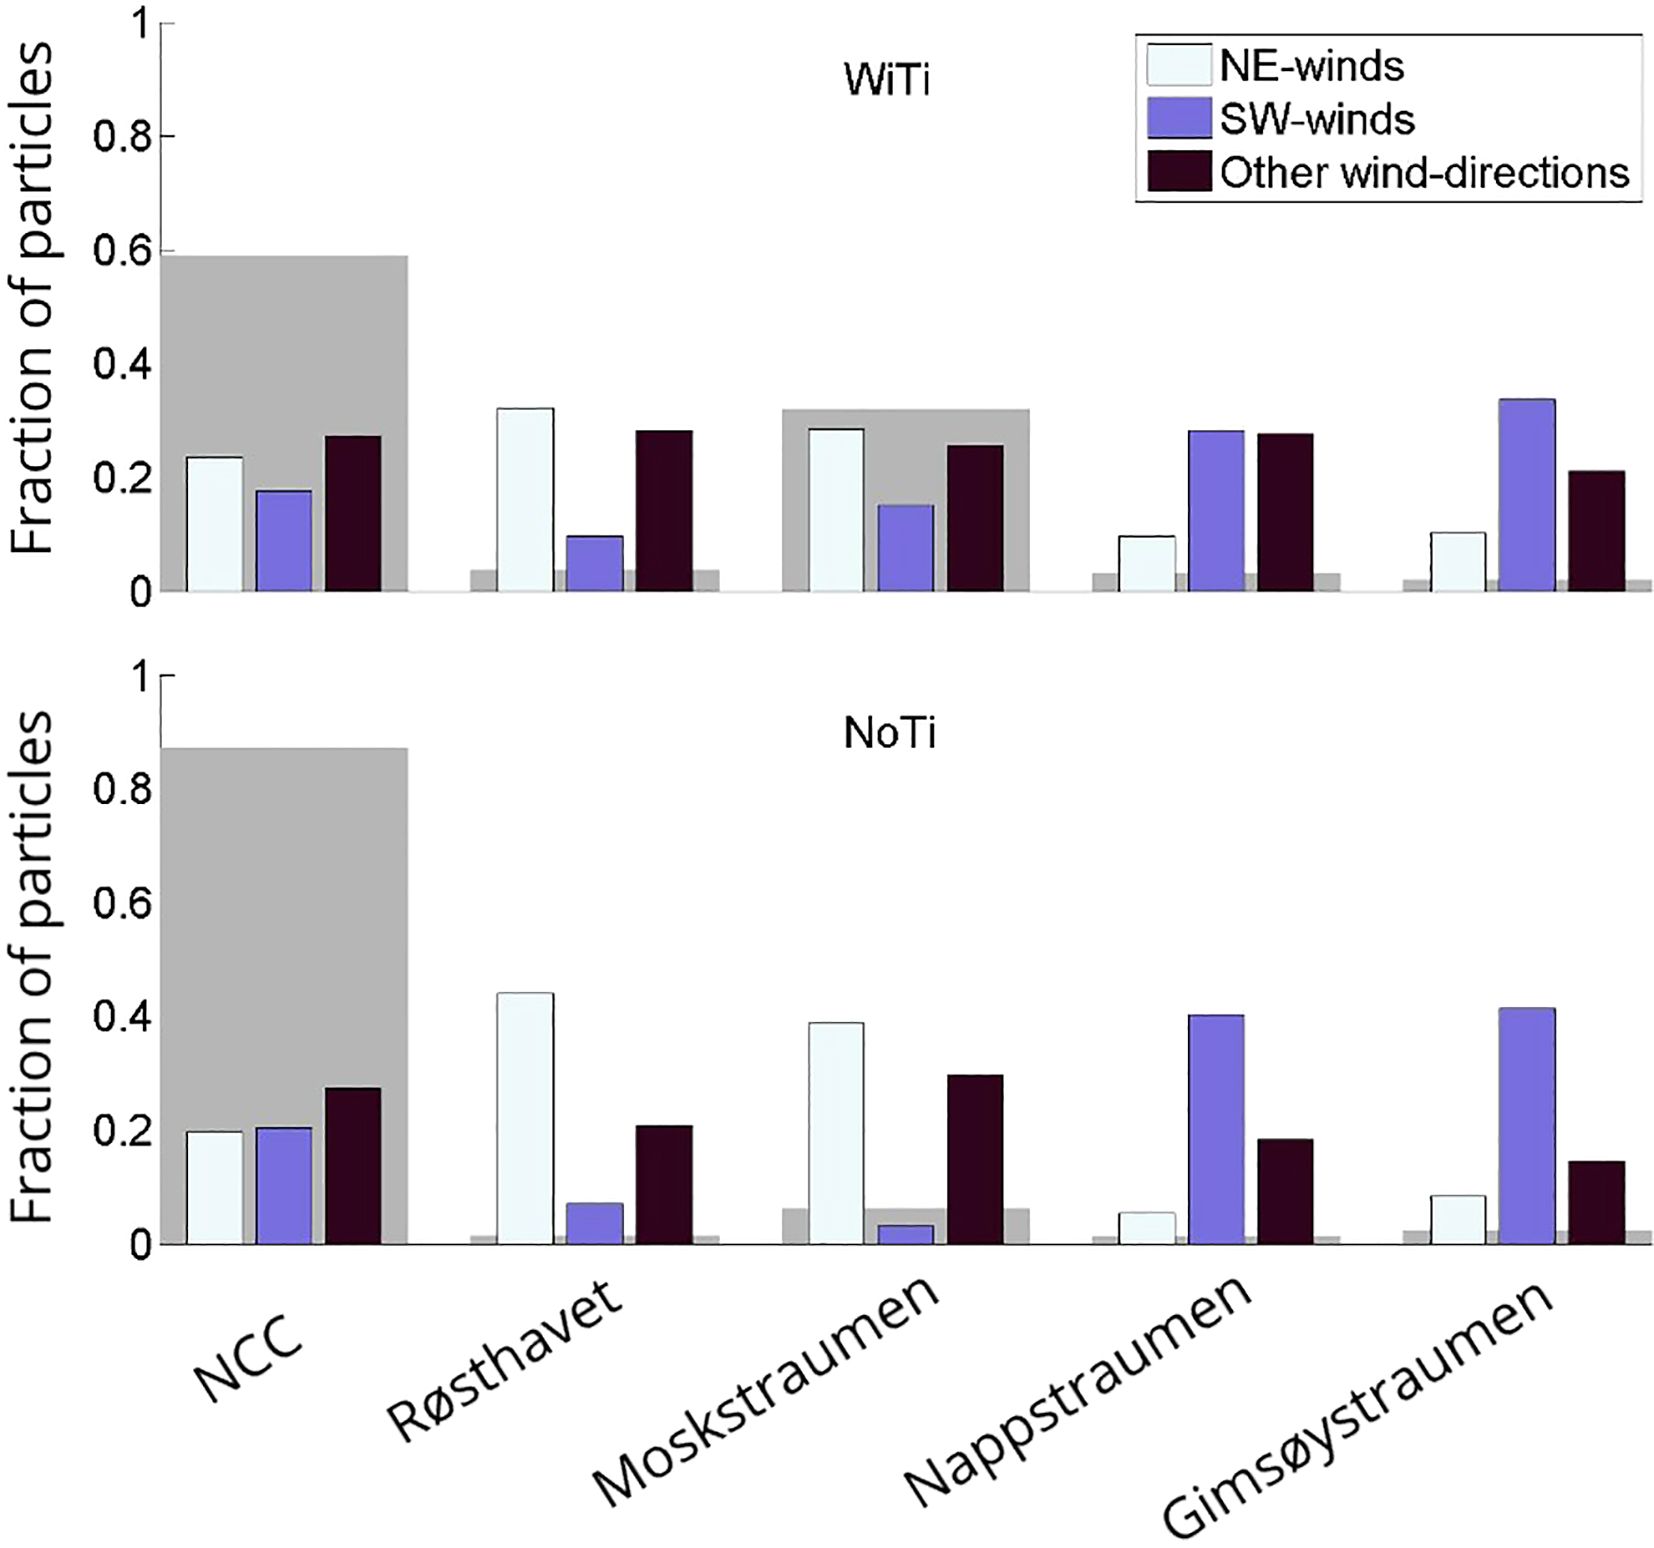
Weighed fraction of particles that exits Vestfjorden during NE-winds and SW-winds, as well as other wind directions”, via the main transport routes out of Vestfjorden. The gray patches in the background show the fraction of particles that exited through the different straits in total. The upper and lower panels show the results from the WiTi run and the NoTi run, respectively.
Again, we will not study these differences in detail. However, it is worth noting that the temporal variation in particle transport through the straits due to variable wind forcing is considerably larger in the model simulation where tides are excluded (NoTi run) compared to the more realistic WiTi run. And, more importantly, a comparison with Figure 10 reveals that the relative changes due to these wind variations when tides are present are comparable to or even smaller than the transport variations over the spring-neap tidal cycle.
4 Discussion and concluding remarks
The area around the Lofoten-Vesterålen archipelago has since the Stone age been known as the major spawning ground for Northeast Atlantic cod, and the cod fisheries here have historical been very important for both the local communities and the Norwegian state (Øiestad,1994). Sustainable use of this fish stock in the future must depend on identifying and examining all factors that impact the life cycle of the species, and this includes understanding the underlying ocean dynamics. Our model study shines light on one such dynamical aspect, namely the net impact of the ever-present tidal oscillations. The model results give clear indication that ocean tides are of considerable importance for the transport of cod eggs and larva from the spawning area in the Vestfjorden embayment and onto the outer shelf. Specifically, tides increase the net export of particles (eggs) out of the embayment by 10% and, perhaps more importantly, they impact the transport path and travel times, primarily by forcing more of the particles through the many straits that cut through the Lofoten-Vesterålen archipelago.
While Moskstraumen is an already-established transport route out of the embayment (Sundby, 1978; Ellertsen et al., 1981; Ommundsen, 2002), the other straits further north, like Nappstraumen, have previously only been hypothesized as potential routes out of Vestfjorden (Ommundsen, 2002). Here, we find that all the four straits evaluated in this study have increased particle transport when tides are included, with Moskstraumen (32%) and Røsthavet (6%) contributing the most. Tidal pumping by dipole formation (Børve et al., 2021) appears to be the dominant process at play in the narrow straits. Moskstraumen is special among the straits in relation to particle transport, due to its geometry. When a large volume of water needs to pass through the small constraint that Moskstraumen is the speed of the current becomes large (up to 3 m/s). The tidal jet that forms, also creates starting-jet vortices at each side of the strait. Because the strait is narrow enough these two vortices interact and form a self-propagating dipole. These dipole vortices can capture particles from inside Vestfjorden and transport them far enough westward towards the shelf to avoid being drawn back into Vestfjorden during the subsequent phase of the tide (Børve et al., 2021). Transport through the wider Røsthavet, however, is primarily due to a different mechanism, involving the generation of rectified time-mean anti-cyclonic circulation cells around the islands Værøy and Mosken (Børve et al., 2021). The time-evolving Lagrangian interaction between these relatively large-scale cells and smaller-scale flow features thus ensures a net transport of particles across this wide opening in the archipelago.
Another interesting result of the study is that the fortnightly spring-neap modulation of the tidal strength appears to also modulate transport out of Vestfjorden. Specifically, in Moskstraumen and Nappstraumen export during spring tide is more than twice that during neap tide. The differences between the two phases of the tide are smaller for the other export routes and are also dominated by periods in-between springs and neaps for reasons we have not been able to pin down. But, importantly, the spring-neap variation in transport, at least through Moskstraumen and Nappstraumen, is comparable to or even larger than transport differences between the two predominant wind regimes over the region. And, indeed, the presence of tides seem to reduce the sensitivity of particle export to wind variations considerably. This last result may have been anticipated since a non-negligible fraction of the total transport is due to ocean dynamics that is not sensitive to the winds at all.
In general, we find from the model study that tides both enhances the net transport of particles and influences the transport routes and thus travel times out of Vestfjorden and northward on the shelf. The reduced travel times to the northern shelf regions, can both be due to a more effective route out of Vestfjorden, and potentially also partly due to tidally-induced transport on the outer shelf itself. Enhanced northward transport on the shelf can specifically be linked to an observable amplification of diurnal tidal currents there. The amplification is due to the generation and propagation of diurnal continental shelf waves (CSWs) in the region (Moe et al., 20002; Weber and Børve, 2022). Damping of these CSWs by interactions with the rugged coastline results in a northward Lagrangian drift, which induce the highest velocities near land (Weber and Børve, 2022). Weber and Børve (2022) estimated the magnitude of the total northward Lagrangian drift induced by diurnal CSWs west of Vesterålen to be around 6 cm/s, a value which is comparable to the estimated mean speed of the NCC.
From a biological perspective transport routes and travel time of cod eggs and larave from Vestfjorden out to, and northward along, the outer shelf is highly interesting. At the shelf and shelf break area north and west of Lofoten-Vesterålen archipelago super swarms of Calanus zooplankters, covering an area of more than 1000 km2 and with species densities of more than 4000 species/m3 in the upper 10 m, have been observed by a combination of remote sensing technology and net sampling (Basedow et al., 2019). The Arctic Calanus species, which are very energy-rich with a lipid content often over 60% (Scott et al., 2002), make the slope and shelf regions west and north of the Lofoten-Vesterålen archipelago an area with plenty of energy-rich food, ideal for cod larvae at different sizes. Also, from late February to mid-April a semi-permanent transport barrier along the shelf break has been observed (Dong et al., 2021). This barrier restrains the cross-shelf exchange in the surface waters and prevents Calanus species and cod larvae to be transported off the shelf during this period. The combined effect of high phytoplankton production, advection of Calanus species on to the shelf and the semi-permanent transport barrier makes this into an area of high biological significance.
The review by Kjesbu et al. (2023) discusses how the “recruitment problem in the Northeast Atlantic cod”, is influenced by the timing of the phytoplankton bloom, the zooplankton dynamics, and first feeding of cod larvae on Calanus nauplii. More specifically, a new study (Basedow et al., 2024) shows that LofotenVesterålen has several phytoplankton blooms, starting in the fjords in March and lasting until end of May/beginning of June on the shelf and in the Lofoten basin. It would appear that the relative timing of these shelf processes and the arrival of NEA cod eggs and larvae from Vestfjorden to the outer shelf should greatly impact the specie’s life cycle. And as seen here, tidal dynamics may be a factor that contributes to this interplay.
However, it is worth reminding that this study focuses on the tidal transport dynamics and their impact on the regional ocean circulation and transport in the Lofoten and Vesterålen region. For simplicity and to provide more generic results we use passive particles, i.e. particles that have neutral buoyancy. NEA cod egg and larvea is used as example to highlight the importance of understanding the dynamics influencing the transport in complex coastal areas. But since both fish eggs and larvae have their own buoyancy, and the impact of such effects on integrated drift remains unknown, this should be investigated as a next step.
Additionally, it should be noted that the tides also enhance vertical and horizontal mixing of active tracers, i.e. of salinity and temperature (not shown). The water columns in the straits are well-mixed in both simulations, so tides impose little effect on the stratification inside the straits. The lateral mixing and strong tidal currents, on the other hand, lead to a distinct change in the water mass properties in the straits between the two simulations. The WiTi case exhibits a stronger presence of water from the NCC, which is more saline due to mixing with Atlantic Water further south compared to the water mass closer to the coast which typically is more influenced by fresh water run offs. Thus, the results suggest that tidal forcing increases the influx of saline water into the strait, with temperatures between 3-8°C. This influx leads to a shift in the water column toward higher densities inside the straits in the WiTi run compared to the NoTi run. The increased mixing associated with tidal forcing results in a reduced temperature and salinity range, but does not change the stratification and vertical distribution of the passive particles significantly (not shown). However, when modeling realistic cod eggs and larvea, the changes in the water mass composition due to tidal mixing and dispersion might influence the modeled growth and hatch time of cod eggs and larvae.
Furthermore, we also omit wind-driven high-frequency surface waves. These can impact the vertical distribution of particles in the upper layer ocean by modulating turbulent vertical mixing as well as horizontal particle transport near the surface by Stokes drift. In fact, Röhrs et al. (2014) showed though numerical modelling that when wind-wave Stokes drift is included particles are generally transported closer to land and thus closer to the various strait entrances in Lofoten. This effect may be particularly tied to the swell which typically comes in from the open ocean and then refracts wave pseudo-momentum and Stokes transport toward the shore. Hence, by including wind-induced Stokes drift in simulations, the observed tidal pumping and the associated transport through the straits might become even more important. However, this is yet to be shown.
It is worth stressing the importance of the use of a variable-mesh ocean model in this study. The nonlinear processes that generate flow separation and dipole eddies occur on small scales and are typically tied to abrupt changes in coastline and topography. Very high mesh resolution is thus required to resolve the small-scale dynamics in and near the straits (Lynge et al., 2010; Nøst and Børve, 2021; Børve et al., 2021). At the same time, we are interested in the far-field impact in the whole Lofoten-Vesterålen region. This double focus is hard to achieve with a regular-mesh model, at least not with present-day computing power. Based on the results in this study we highly recommend that ocean circulation and transport in complex coastal regions are modelled with high resolution both spatially and temporally, particularly in areas that have strong currents (like tides), to resolve non-linear flow dynamics which can be important for ocean transport.
To sum up, this study clearly highlights the need for resolving and including small-scale tidal dynamics when modelling transports of cod eggs and larvae in the Lofoten and Vesterålen region (and other similar complex coastal regions). As seen, tidal processes have systematic impact on travel times for cod eggs and larvae from Vestfjorden, and potentially for cod juveniles along the shelf towards the Barents Sea. The next question is then how these results fits in with what is known about the early life cycle of the species.
Statements
Data availability statement
The original contributions presented in the study are included in the article/supplementary material, further inquiries can be directed to the corresponding author/s.
Author contributions
EB: Conceptualization, Formal analysis, Investigation, Methodology, Validation, Visualization, Writing – original draft, Writing – review & editing. PI: Supervision, Writing – review & editing. ON: Methodology, Supervision, Writing – review & editing, Software. PG: Methodology, Writing – review & editing, Validation. SF-P: Conceptualization, Writing – review & editing.
Funding
The author(s) declare financial support was received for the research, authorship, and/or publication of this article. EB was funded by VISTA – a basic research program in collaboration between the Norwegian Academy of Science and Letters, and Equinor (project no.6168). This research was supported by the GLIDER project, which was funded by the DEMO2000 research program: Norwegian Research Council and ConocoPhillips, project 269188, “Unmanned ocean vehicles, a flexible and cost-efficient offshore monitoring and data management approach”. Equinor and ConocoPhillips were not involved in the study design, collection, analysis, interpretation of data, the writing of this article, or the decision to submit it for publication.
Acknowledgments
Thanks are due to Frank Gaarsted for generously providing the validation material for the current validation of the WiTi-model run, and also for his contribution in setting up the fvcom-model framework and opendrift framework at Akvaplan-niva.
Conflict of interest
Authors EB, ON, PG, and SF-P were employed by the company Akvaplan-niva AS.
The remaining authors declare that the research was conducted in the absence of any commercial or financial relationships that could be construed as a potential conflict of interest.
Generative AI statement
The author(s) declare that no Generative AI was used in the creation of this manuscript.
Publisher’s note
All claims expressed in this article are solely those of the authors and do not necessarily represent those of their affiliated organizations, or those of the publisher, the editors and the reviewers. Any product that may be evaluated in this article, or claim that may be made by its manufacturer, is not guaranteed or endorsed by the publisher.
References
1
Åndalsvik B. Sundby S. (1994). “Modelling the transport of cod larvae from the lofoten area,” in ICES marine science symposia, vol. 198. (Copenhagen, Denmar: International Council for the Exploration of the Sea) 198, 379–392.
2
Basedow S. L. McKee D. Lefering I. Gislason A. Daase M. Trudnowska E. et al . (2019). Remote sensing of zooplankton swarms. Sci. Rep.9, 686. doi: 10.1038/s41598-018-37129-x
3
Basedow S. L. Renner A. H. H. Espinasse B. Falk-Petersen S. Graeve M. Bandara K. et al . (2024). Progress in Oceanography. The impact of advection on a subarctic fjord food web dominated by the copepod calanus finmarcicus. 224. doi: 10.1016/j.pocean.2024.103268
4
Børve E. Isachsen P. Nøst O. A. (2021). Rectified tidal transport in lofoten-vesterålen, northern Norway. Ocean Sci.17, 1753–1773. doi: 10.5194/os-17-1753-2021
5
Chen C. Liu H. Beardsley R. C. (2003). An unstructured grid, finite-volume, three-dimensional, primitive equations ocean model: Application to coastal ocean and estuaries. J. Atmospheric Oceanic Technol.20, 159–186. doi: 10.1175/1520-0426(2003)020(0159:AUGFVT)2.0.CO;2
6
Codiga D. L. (2011). Unified tidal analysis and prediction using the UTide matlab functions. Tech. Rep. (University of Rhode Island), 1. doi: 10.13140/RG.2.1.3761.2008
7
Dagestad K. F. Breivik R.J. adlandsvik B. (2018). Opendrift v1.0: a generic framework for trajectory modelling. Geoscientific Model. Dev.11, 1405–1420. doi: 10.5194/gmd-11-1405-2018
8
Dataset Norwegian Mapping Authority, Hydrographic Service (2021). Api for water level data. Available online at: https://api.sehavniva.no/tideapi_en.html (Accessed 2024-09-11).
9
Dong H. Zhou M. Hu Z. Zhang Z. Zhong Y. Basedow S. L. et al . (2021). Transport barriers and the retention of calanus finmarchicus on the lofoten shelf in early spring. Continental Shelf Res.19, 1809–1831. doi: 10.1016/S0278-4343(99)00041-2
10
Egbert G. D. Erofeeva S. Y. (2002). Efficient inverse modeling of barotropic ocean tides. Am. Meteorological Soc.19, 183–204. doi: 10.1175/1520-0426(2002)019(0183:EIMOBO)2.0.CO;2
11
Ellertsen B. Fossum P. Solemdal P. Sundby S. (1989). Relation between temperature and survival of eggs and first-feeding larvae of northeast arctic cod (gadus morhua l.). Rapp. P. V. Réun. Cons.Int. Explor. Mer191, 209–219. doi: 0.17895/ices.pub.19279787
12
Ellertsen B. Solemdal P. T. T. S. Sundby S. Tilseth S. Westgård T. et al . (1981). Spawning period, transport and dispersal of eggs from the spawning area of arcto-norwegian cod (gadus morhua l.). Rapp.P. V.
13
Furnes G. K. Sundby S. (1981). Upwelling and wind induced circulation in vestfjorden. Norwegian Coast. Current Proc. Norwegian Coast. Curr. Symposium1, 152–177.
14
Geffen A. J. Fox C. J. Nash D. M. (2006). Temperature-dependent development rates of cod gadus morhua eggs. J. Fish Biol.69, 1060–1080. doi: 10.1111/j.1095-8649.2006.01181.x
15
Gjevik B. (1997). Sources of the maelstrom. Nature388, 837–838. doi: 10.1038/42159
16
Hjort J. (1914). “Fluctuations in the great fisheries of northern europe viewed in the light of biological research,” in Rapports Et Proces-Verbaux` (Copenhagen, Denma: International Permanent Council for the Exploration of the Sea), 1–228.
17
Houde E. D. (2008). Emerging from hjort’s shadow. J. Northwest Atlantic Fishery Sci.41, 53–70. doi: 10.2960/J.v41.m634
18
Huthnance J. (1973). Tidal current asymmetries over the norfolk sandbanks. Estuar. Coast. Mar. Sci.1, 89–99. doi: 10.1016/0302-3524(73)90061-3
19
Kjeldsbu O. S. Tiedemann I. Alix M. Thorsen A. Sundby S. (2023). Half a century of high-latitude fisheries oceanography research on the “recruitment problem” in northeast arctic cod (gadus morhua). ICES J. Mar. Sci.80, 1179–1201. doi: 10.1093/icesjms/fsad073
20
Kjesbu O. S. Tiedemann I. Alix M. Thorsen A. Sundby S. (2023). Half a century of high-latitude fisheries oceanography research on the “recruitment problem” in northeast arctic cod (gadus morhua). ICES J. Mar. Sci.80, 1179–1201. doi: 10.1093/icesjms/fsad073
21
Kobayashi M. H. Pereira J. M. Pereira J. C. F. (1999). A conservative finite-volume second-order-accurate projection method on hybrid unstructured grids. J. Comput. Phys.150, 40–75. doi: 10.1006/jcph.1998.6163
22
Lynge B. K. Berntsen J. Gjevik B. (2010). Numerical studies of dispersion due to tidal flow through moskstraumen, northern Norway. Ocean Dynamics60, 907–920. doi: 10.1007/s10236-010-0309-z
23
Mitchelson-Jacob G. Sundby S. (2001). Eddies of vestfjorden, Norway. Continental Shelf Res.21, 1901–1918. doi: 10.1016/S0278-4343(01)00030-9
24
Moe H. Ommundsen A. Gjevik B. (20002). A high resolution tidal model for the area around the lofoten islands, northern Norway. Continental Shelf Res.22, 485–504. doi: 10.1016/S0278-4343(01)00078-4
25
Müller M. Homleid M. Ivarsson K.-I. Køltzow M. A. Lindskog M. Midtbø K. H. et al . (2017). Arome-metcoop: A nordic convective-scale operational weather prediction model. Am. Meteorological Soc.32, 609–627. doi: 10.1175/WAF-D-16-0099.1
26
Nøst O. A. Børve E. (2021). Flow separation, dipole formation, and water exchange through tidal straits. Ocean Sci.17, 1403–1420. doi: 10.5194/os-17-1403-2021
27
Øiestad V. (1994). “Historic changes in cod stocks and cod fisheries: Northeast arctic cod,” in ICES marine science symposia, vol. 198. (International Council for the Exploration of the Sea, Copenhagen, Denmark), 17–30. doi: 10.17895/ices.pub.19271168
28
Ommundsen A. (2002). Models of cross shelf transport introduced by the lofoten maelstrom. Continental Shelf Res.22, 93–113. doi: 10.1016/S0278-4343(01)00069-3
29
Opdal A. F. Vikebø F. Fiksen (2008). Relationships between spawning ground identity, latitude and early life thermal exposure in northeast arctic cod. J. Northw. Atl. Fish. Sci.41, 13–22. doi: 10.2960/J.v41.m621
30
Ottesen G. Bogstad B. Yaragina N. A. Stige L. C. Vikebø F. B. Dalpadado P. (2014). A review of early life history dynamics of barents sea cod (gadus morhua). ICES J. Mar. Sci.71, 2064–2087. doi: 10.1093/icesjms/fsu037
31
Röhrs J. Christensen K. H. Vikebø F. Saetra S. S. Broström G. (2014). Wave-induced transport and vertical mixing of pelagic eggs and larvae. Limnology Oceanography59, 1213–1227. doi: 10.4319/lo.2014.59.4.1213
32
Röhrs J. Sperrevik A. K. Christensen K. H. (2018). NorShelf: A reanalysis and data-assimilative forecast modelfor the Norwegian Shelf Sea. Tech. Rep.4, 42. doi: 10.5281/zenodo.2384124
33
Sætre R. (1999). Features of the central norwegian shelf circulation. Front. Neurosci.19. doi: 10.3389/fnins.2013.12345
34
Scott C. L. Kwasniewski S. Falk-Petersen S. Sargent J. R. (2002). Species differences, origins and functions of fatty alcohols and fatty acids in the wax esters and phospholipids of calanus hyperboreus, c. glacialis and c. finmarchicus from arctic waters. Mar. Ecol. Prog. Ser.235, 127–134. doi: 10.3354/meps235127
35
Shchepetkin A. F. McWilliams J. C. (2005). The regional oceanic modeling system (roms): a split-explicit, free-surface, topography-following-coordinate oceanic model. Ocean Model.9, 347–404. doi: 10.1016/j.ocemod.2004.08.002
36
Smagorinsky J. (1963). General circulation experiments with the primitive equations: I. @ the basic experiment. Monthly weather Rev.91, 99–164. doi: 10.1175/1520-0493(1963)091(0099:GCEWTP)2.3.CO;2
37
Solberg T. Tilseth S. (1990). Growth, energy consumption and prey density requirements in first feeding larvae of cod (gadus morhua l.) (Institute of marine research). Flødevigen rapportseri1, 145–166.
38
Solemdal P. Sundby S. (1981). “Vertical distribution of pelagic fish eggs in relation to species, spawning behaviour and wind conditions (ICES),” in ICES CM documents, vol. 1981. , 77.
39
Strand K. O. Sundby S. Albretsen J. Vikebø F. B. (2017). The northeast Greenland shelf as a potential habitat for the northeast arctic cod. Front. Mar. Sci.4. doi: 10.3389/fmars.2017.00304
40
Sundby S. (1978). “In/out-flow of coastal water in vestfjorden,” in Council meeting of the international exploration of the sea, C.M. 1978/C:51 (ICES), (Copenhagen, Denmark: International Council for the Exploration of the Sea), 17.
41
Sundby S. (1983). A one-dimensional model for the vertical distribution of pelagic fish eggs in the mixed layer. Deep Sea Res. Part A. Oceanographic Res. Papers30, 645–661. doi: 10.1016/0198-0149(83)90042-0
42
Sundby S. (1990). Factors controlling the vertical distribution of eggs (Institute of marine research), HELP, havforskningsinstututtets egg- og larveprogram. 15pp.
43
Sundby S. Nakken O. (2008). Spatial shifts in spawning habitats of arcto-norwegian cod related to multidecadal climate oscillations and climate change. ICES J. Mar. Sci.65, 953–962. doi: 10.1093/icesjms/fsn085
44
Vikebø F. Jørgensen C. Kristiansen T. Fiksen (2007). Drift, growth, and survival of larval northeast arctic cod with simple rules of behaviour. Mar. Ecol. Prog. Ser.347, 207–219. doi: 10.3354/meps06979
45
Vikebø F. Sundy S. Åndalsvik B. Fiksen B. (2005). The combined effect of transport and temperature on distribution and growth of larvae and pelagic juveniles of arcto-norwegian cod. ICES J. Mar. Sci.62, 1375–1386. doi: 10.1016/j.icesjms.2005.05.017
46
Weber J. E. H. Børve E. (2022). On group velocity and spatial damping of diurnal continental shelf waves. Continental Shelf Res.232, 6. doi: 10.1016/j.csr.2021.1046305
47
Wells M. G. van Heijst G.-J. F. (2003). A model of tidal flushing of an estuary by dipole formation. Dynamics Atmospheres Oceans37, 223–244. doi: 10.1016/j.dynatmoce.2003.08.002
48
Yaragina N. A. Aglen A. Sokolov K. M. (2011). “The impact of fisheries on population dynamics,” in The Barents Sea ecosystem, resources, management: half a Century of Russian-Norwegian cooperation. Eds. JakobsenT.OziginV. K. (Tapir Academic Press, Trondheim), 750–759.
49
Zimmerman J. T. F. (1978). Topographic generation of residual circulation by oscillatory (tidal) currents. Geophysical Astrophysical Fluid Dynamics11, 35–47. doi: 10.1080/03091927808242650
Summary
Keywords
tides, shelf dynamics, Lagrangian drift, tidal transport, numerical modelling, cod eggs, coastal processes
Citation
Børve E, Isachsen PE, Nøst OA, Ghaffari P and Falk-Petersen S (2025) Tidal effects on transport and dispersion of particles, cod eggs and larvae in the Lofoten and Vesterålen region, Norway. Front. Mar. Sci. 12:1541652. doi: 10.3389/fmars.2025.1541652
Received
08 December 2024
Accepted
06 February 2025
Published
03 March 2025
Volume
12 - 2025
Edited by
Xiaohui Xie, Ministry of Natural Resources, China
Reviewed by
Tien Anh Tran, Seoul National University, Republic of Korea
Yu-Kun Qian, Chinese Academy of Sciences (CAS), China
Updates
Copyright
© 2025 Børve, Isachsen, Nøst, Ghaffari and Falk-Petersen.
This is an open-access article distributed under the terms of the Creative Commons Attribution License (CC BY). The use, distribution or reproduction in other forums is permitted, provided the original author(s) and the copyright owner(s) are credited and that the original publication in this journal is cited, in accordance with accepted academic practice. No use, distribution or reproduction is permitted which does not comply with these terms.
*Correspondence: Eli Børve, elbor@equinor.com
Disclaimer
All claims expressed in this article are solely those of the authors and do not necessarily represent those of their affiliated organizations, or those of the publisher, the editors and the reviewers. Any product that may be evaluated in this article or claim that may be made by its manufacturer is not guaranteed or endorsed by the publisher.