 Miao Su
 Sung-Hoon Bae2†‡
 Keun-sik Park
- 1The Graduate School of Technology Management, Kyunghee University, Yongin, Republic of Korea
- 2Department of Trade and Logistics, Chung-Ang University, Seoul, Republic of Korea
- 3Department of International Trade, Dankook University, Yongin, Republic of Korea
With its safe and efficient characteristics, container transportation has become vital for advancing the global economy. However, port congestion has become a significant obstacle to the container freight price system’s stability. There is currently no dependable engineering solution to guarantee the stability of the maritime transport system in a port congestion scenario. Therefore, decision-makers must comprehend the changing characteristics of the container freight index in the context of port congestion. Using the Shanghai container freight index as a proxy, this paper investigated the effect of port congestion on container freight rates, proposing a container freight index forecasting model. This study compiled congestion data from the Shanghai, Busan, Los Angeles, and New York ports from January 1, 2016 to January 1, 2023, to predict a Shanghai container freight index (SCFI). With its high-precision fitting effect, the RBF neural network effectively predicted the change in SCFI, and the R2 reached 96%. We also confirmed the transfer effect of SCFI using the time-lag correlation model in a large congestion environment. The research results give container shipping organizations a decision-making foundation for planning shipping strategies and mitigating market risk.
Highlights
● Analyzed the fluctuations in freight rates within the context of port congestion.
● Utilizing deep learning to forecast shipping costs.
● Utilizing time-lag correlation to determine the internal relationship between freight rates.
● Enhance quantitative research on port congestion and freight rates.
1 Introduction
Container transport is one of the most rapidly expanding sectors of the global shipping industry (Montes et al., 2012; Mondello et al., 2023). It has become the backbone of the global transportation industry over time (Fan et al., 2012). Container shipping has contributed significantly to the economic growth of cities and even nations. Therefore, the normal operation of the container transportation industry has contributed significantly to the robust growth of the global economy (Shuaibu, 2019). Notably, container shipping volume continues to rise, and containerization within the transportation industry is also intensifying (Berle et al., 2011). Nevertheless, taking into account the specific advantages of containerized transport, such as shorter handling costs and times as well as guarantees of cargo security, this proportion is expected to continue to grow rapidly over the next few years (Lee et al., 2013; Tavakoli et al., 2023). Nonetheless, the volatility of container freight rates has always been a significant factor impeding the growth of the container transportation industry (Jeon et al., 2020). In actuality, container freight rates are central to the container transportation industry (Adumene et al., 2021). Fluctuating container freight rates, upon which the success or failure of shipping lines depends significantly, characterize container shipping risks (Schramm and Munim, 2021).
The contemporary shipping market extensively utilizes the container freight rate index to reflect the dynamics and status of container freight rates (Yuan, 2014; Gui et al., 2022). Due to the growing containerization of maritime cargo, the standards used to measure the freight index for the container transport industry are becoming more stringent (Schramm and Munim, 2021). The Shanghai containerized freight index (SCFI) is a key indicator of the container transportation market in China. SCFI is also a widely used economic indicator in the global economy. The dynamic changes of SCFI can directly impact the profits of container transportation companies around the globe (Xu, 2021). Therefore, mastering the changing characteristics of SCFI is crucial for container transport operators and investors when making investment decisions (Yuan, 2014; Wu et al., 2024). However, even though the study of SCFI fluctuation has progressively become the consensus in the global shipping industry, there are very few studies on the prediction of SCFI fluctuation (Chen et al., 2021). Most shipping freight rate forecasts are primarily based on Baltic Dry Index (BDI) forecasting studies (Yuan, 2014). In addition, among the few SCFI studies, the prediction of SCFI is still surrounded by controversy (Hirata and Matsuda, 2022).
Notably, since the onset of the COVID-19 pandemic, the world’s leading container ports have experienced unusually severe congestion due to a severe imbalance between demand and the effective transportation capacity of sea containers (Guerrero et al., 2022; Ma et al., 2021). SCFI has undergone a remarkable upswing under port congestion, resulting in significant losses for sectors associated with container transport (Koyuncu and Tavacioğlu, 2021). The research concurs that container freight index forecasting in specific environments requires immediate attention (Jeon et al., 2020; Chen et al., 2021; Hirata and Matsuda, 2022; Rahman and Adjeroh, 2019; Huang et al., 2022; Bai et al., 2023). In addition, port congestion has become a widespread issue in numerous industries, particularly container shipping. Congestion at container ports impacts the SCFI market by limiting shipping supply (Fan et al., 2012). In fact, congestion research has been a significant concern in the maritime industry, particularly in global emergencies such as natural disasters, financial crises, and epidemics (Lin et al., 2022). According to studies, port congestion may transmit from one port of call to another (Xu et al., 2021). Considering the “knock-on” effect of container port congestion, port congestion will continue to the next port with a higher correlation (Koyuncu and Tavacioğlu, 2021; Regan and Golob, 2000). When congestion events occur, freight rates on various global container transport system routes become more uncertain. Port congestion makes container ocean freight rates more unpredictable when coupled with the heterogeneity of the container shipping market (container freight rates exhibit cyclicality and volatility) (Hirata and Matsuda, 2022). Therefore, when planning major infrastructure projects, it is critical to identify the most influential attributes that exporters and importers consider when choosing a port (Vega et al., 2019). Consequently, industry researchers have increasingly valued the field of study on the adverse effects of port congestion on SCFI dynamics.
Intriguingly, despite the expanding challenge of container port congestion, there is relatively little academic or commercial research on producing an excellent integrated response in SCFI (Xu et al., 2021). Port congestion’s effect on SCFI has been a relatively unexplored study area. Consequently, we pose the following research topics:
RQ1: When congestion occurs, is it possible to precisely predict the change in SCFI?
RQ2: When port congestion events occur, does SCFI also have a “transfer effect?”
We have made the following endeavors to address the above issues and fill the research gap in container shipping freight and port congestion. First, we gathered the SCFI Weekly Freight Index data. We also gathered Shanghai, Busan, New York, and Los Angeles port daily congestion data between January 1, 2016, and January 1, 2023. In this investigation, we used the above data and the RBF neural network model to predict and analyze SCFI. In addition, we employed the time-lag correlation model to confirm the existence of the “transfer effect” among subdivided SCFIs during periods of port congestion. The results indicate that the R2of the container freight rate forecasting model developed in this study attained 96%, 94%, and 93% for the SCFI Composite Index, SCFI Shanghai–Los Angeles Index (SCFI1), and SCFI Shanghai–New York Index (SCFI2). This study also confirmed the hysteresis correlation between SCFI1 and SCFI2 during uncommon extreme congestion.
This study makes multiple contributions. First, it provides a comprehensive deep-learning method for predicting SCFI, which increases the accuracy of transportation industry forecasts. Second, it verifies the characteristics of the impact of port congestion, a prevalent occurrence, on the economic indicators of container shipping and expands the research on port congestion. Third, this study improves the maritime sector’s ability to respond to port congestion events in advance and reduces the negative influence of port congestion on the container shipping industry. This study concludes by proposing and validating the “transfer effect” of SCFI in the container transportation system, enhancing the research on container shipping system freight rates.
The rest of this paper is as follows. In Section 2, we forecast research on the ocean freight index and port congestion. Then, in Section 3, we introduce this study’s collected research data and methods. Next, Section 4 explores the results of the analysis. Finally, Section 5 presents this study’s contributions and conclusions.
2 Literature review
2.1 Research on freight rate prediction
SCFI forecasts provide stakeholders in the container shipping industry with a crucial premise for decision-making (Schramm and Munim, 2021; Zhu et al., 2019). Irrespective of whether the results of SCFI’s projections meet the requirements of their optimal business environment, their accuracy is crucial (Orrell and McSharry, 2009). Therefore, increasing the accuracy of SCFI forecasts is essential for shipping industry agents seeking to make business decisions and avoid or reduce potential risks (Duru, 2010). Existing research on shipping freight price forecasting focuses primarily on predicting the world’s key shipping freight price indicators. Researchers regard the Baltic Dry Index (BDI) and the Baltimore Tanker Index as the primary maritime shipping market indicators. Scholars frequently view these freight rate indicators as indicators of the overall transportation market and global economic health (Han et al., 2020). Consequently, research on freight rate forecasting centers primarily on these indicators (Chen et al., 2021; Sirshar et al., 2022). Although research on freight rate forecasting in container transportation began relatively late, it has progressed quickly. In recent years, SCFI has progressively become one of the most significant indicators in the shipping industry and an essential indicator for container shipping evaluation. Moreover, SCFI is one of the most frequently cited indicators for evaluating the health and status of international trade. However, compared to the preceding two fields, SCFI prediction studies are relatively scarce (Nielsen et al., 2014; Tasdelen and Sen, 2021). In the past, many empirical studies have focused on the determination of freight rates in shipping markets (Fung et al., 2003). Notably, prior research on the maritime freight index provides methodological guidance for the SCFI’s forecasting research.
According to various forecasting methods, we can divide the existing literature on shipping freight price forecasting into three categories (Zhang et al., 2019). The traditional econometric approach is the initial technique. Shipping freight price analysis and forecast widely uses the autoregressive integrated moving average (ARIMA), vector autoregressive (VAR), generalized autoregressive conditional heteroscedasticity (GARCH), and vector error correction (VEC) models (Zhang et al., 2019; Xiao et al., 2021; Xu et al., 2023). First, Cullinane et al. (1999) pioneered using ARIMA models to evaluate the impact of the BDI’s new composition principles. Second, Chen et al. (2012) utilized ARIMA and VAR to predict the freight rates of multiple dry bulk transportation routes and discovered that VAR performed better than ARIMA in sample prediction. In addition, other studies have demonstrated that combining GARCH and classical econometric models can enhance the precision of BDI forecasting (Katris and Kavussanos, 2021). However, Batchelor et al. (2007) found that the VECM model provided the best fit in predicting forward freight rates versus spot freight rates. In addition, Koyuncu and Tavacioğlu (2021) compared the SCFI prediction methods SARIMA and Holt-Winters. They concluded that the SARIMA model is superior to extant freight rate forecasting models when making short-term monthly predictions. Weimar-Rasmussen (2010) also utilized the ARMA and ARFIMA models to predict the container freight rates for the three most important routes. According to numerous research sources, traditional econometric models have poorly predicted the maritime shipping market (Zhang et al., 2018, 2019; Katris and Kavussanos, 2021). This inadequate forecasting is primarily due to the difficulty of capturing the non-linear properties of the dry bulk cargo capacity index using conventional econometric techniques. Therefore, non-linear regression and artificial intelligence (AI) techniques predominate in maritime freight price forecasting research.
The second category of techniques consists primarily of artificial neural networks (ANN), support vector machines, other machine learning algorithms, and non-linear regression (Zhang et al., 2018; Katris and Kavussanos, 2021). For instance, Adland and Cullinane (2006) analyzed the non-linear dynamics of spot freight rates in the tanker market. Leonov and Nikolov (2012) utilized wavelet and neural network-based models to predict dry bulk freight rates. Li and Parsons (1997) used neural networks to forecast monthly tanker freight rates from the short term to the long term. They discovered that neural systems performed better than ARIMA time-series methods in long-term forecasting. In addition, Yang et al. (2008) utilized a support vector machine (SVM) to investigate and forecast the freight price instability warning of the China Coastal Bulk Freight Index (CCBFI), China Container Freight Index (CCFI), and Baltic Sea Freight Index (BFI). Their research accurately depicts the extreme volatility of several transport freight indices. However, fluctuations in freight rates are typically complex and non-stationary. Any single predictive instrument has limitations, including single non-linear regression and artificial intelligence-based methods. Therefore, there is ongoing research to increase the accuracy of shipping freight index predictions by employing integrated methods (Zhang et al., 2019).
In the third category of forecasting methodologies, the literature proposes redefining the accuracy of freight rate forecasting by constructing an ensemble model (Zhang et al., 2019; Rahman and Adjeroh, 2019). This method primarily integrates multiple independent models into a single model to increase the accuracy of shipping freight index prediction. For the short-term prediction of tanker freight rates, Eslami et al. (2017) devised a hybrid model based on an artificial neural network (ANN) and adaptive genetic algorithm (AGA). Han et al. (2014) utilized wavelet transform to eliminate noise from BDI data and combined it with other artificial intelligence techniques to improve the accuracy of BDI prediction. Using a dynamic fluctuation network (DFN) and artificial intelligence, Zhang et al. (2019) predicted BDI. In addition, Kamal et al. (2020) utilized a profoundly integrated recurrent network composed of recurrent neural networks (RNN), long short-term memory (LSTM), and gated rectifier unit neural network (GRU) to improve the predictive performance of BDI. In addition, Chen et al. (2021) predicted China’s container freight index using the decomposition–integration method that combines the empirical mode decomposition and the gray fluctuation prediction model. They discovered that the method performed better than autoregressive moving average models for multistep-ahead forecasts. Hirata and Matsuda (2022) compared the long-short-term memory (LSTM) and seasonal autoregressive integrated moving average (SARIMA) techniques for forecasting the composite and route-based Shanghai Containerized Freight Index (SCFI). LSTM possesses superior efficacy (Shoorkand et al., 2024). Innovative studies also predict container freight rates using machine learning and natural language technology (Saeed et al., 2023).
2.2 Research on port congestion
The smooth operation of container port operations significantly influences the efficiency of global cargo management, vessel availability, supply chain connectivity, and overall trade costs (Guo et al., 2021). Consequently, container ports play a crucial role in international commerce (Wang et al., 2020). Nonetheless, the frequent occurrence of port congestion has impeded the regular operation of container ports. Studies provide an overview of the causes of container port congestion (Talley and Ng, 2016). First, a study identified inadequate infrastructure or hinterland transport capacity as the leading cause of port congestion (Tongzon, 2009). Second, extreme weather conditions, strikes, demand shocks, or labor shortages are the second leading cause of port congestion. In addition, sudden events such as the global financial crisis, natural disasters, and pandemics have directly contributed to global congestion in ports (Lin et al., 2022).
Regarding port congestion consequences, congestion results in unnecessary petroleum consumption and carbon emissions (Jia et al., 2017). These consequences increase the cargo proprietor/carrier’s shipping costs. In addition, lengthy delays at ports wreak havoc on supply chains, including those in the manufacturing and energy industries, causing disarray in global production. However, in the literature, land and air freight terminal congestion has garnered more attention than port congestion in the maritime industry. Therefore, port congestion research has shifted its concentration to port congestion management. First, ports must implement effective mitigation strategies to address the possibility of congestion (Lin et al., 2022). According to several studies, port alliances or alliances between ports and shipping lines could alleviate port congestion. These studies recommend that ports in the same region establish a comprehensive multi-port system and strengthen cooperation (Li et al., 2022; Shi et al., 2020).
Several studies have also presented the perspective of reducing congestion from port management and construction standpoints. For instance, Leachman and Jula (2011) noted port management must consider assessing infrastructure, managing staffing levels, and arranging operational schedules to reduce congestion. The study concluded that port infrastructure investment and prudent management could alleviate port congestion (Lin et al., 2022). In addition, the study revealed that ports must increase their human resources to reduce port congestion (Asteris et al., 2012). Other studies examined port congestion governance solutions from a modeling perspective. They found queuing models necessary for congestion modeling and analysis in port systems, particularly container port terminals. Thus, numerous studies have utilized queuing models for optimization analyses of port congestion (Peng et al., 2022). Simulation is the second model for addressing port congestion. These studies have solved the actual problem of port congestion by simulating the real situation using simulation models (Ke et al., 2012). The third model uses machine learning—digitalizing container ports has enhanced data quality and accessibility. Thus, big data analytics techniques have become popular in measuring port management (Yang et al., 2019). Big data analysis can accurately estimate and forecast port congestion. However, machine-learning-based research on predicting port congestion is minimal.
In addition, some of the research on port congestion also focuses on port congestion’s effects on regional economies and ports. Port congestion has a particularly significant impact on the global container transportation system due to container transport’s accelerated growth. Container port congestion affects freight prices on liner routes and global container leasing costs (Lin et al., 2022). In addition, port congestion directly contributes to decreased ship capacity turnover, increasing the risk of the shipping alliance transportation system collapsing. Although industry practitioners frequently acknowledge the impact of port congestion on shipping market dynamics, systematic and persuasive academic research on this topic is limited (Steinbach, 2022; Xu et al., 2021). According to a literature review of port congestion problems and mitigation strategies, there are numerous solutions to port congestion; however, applying these solutions depends on specific circumstances. In addition, literature seldom quantifies port congestion’s effect on global ocean freight rates. Specifically, there is no determination yet on how to forecast changes in global container freight rates due to port congestion (Carrier et al., 2023; Wang et al., 2023; Zou et al., 2023; Liu et al., 2024; Ma et al., 2024; Tao et al., 2024; Sheng et al., 2025).
3 Methods
3.1 General structure
This study aims to achieve two key objectives. First, it seeks to predict fluctuations in the SCFI using large-scale port congestion data. Second, it aims to analyze the “transfer effect” of SCFI during periods of severe congestion. To accomplish these goals, we propose two distinct models: one for forecasting SCFI variations and another for verifying the freight rate “transfer effect” across different shipping routes.
For the first objective, we develop an RBF neural network model that leverages port congestion and SCFI data to predict changes in freight rates. For the second objective, we employ a time-lag correlation model to examine how freight rates shift between different routes during congestion. The overall research framework is illustrated in Figure 1, which outlines the three core methodological components: (1) data acquisition and preprocessing, (2) RBF neural network analysis, and (3) hysteresis correlation testing.

Figure 1. Research framework.
3.2 Modeling methods
3.2.1 Radial basis function neural network
The RBF neural network is a three-layer forward neural network; Figure 2 shows the network’s topology. The first layer is the input layer, which is the signal source node. The second layer is the hidden layer; actual needs determine the number of units. The third layer is the output layer, which is the response to the input data. In the structure of the RBF neural network in Figure 2, is the n-dimensional input of the network, is the m-dimensional output of the network, is the matrix formed by the center of the hidden layer basis function, is the hidden layer radial basis function, is the connection weight matrix from the hidden layer to the output layer, and is the threshold vector of the network. This paper uses the Euclidean distance function as the hidden layer node basis function of the RBF neural network, and the activation function adopts the radial basis function. The Gaussian function is the most widely used among the different radial basis functions. It has the characteristics of radial symmetry, good analytical performance, and any order of derivatives (Chen, 2017). Thus, this paper uses the Gaussian function as the radial basis function and expresses the RBF neural network (Figure 2) output as follows:
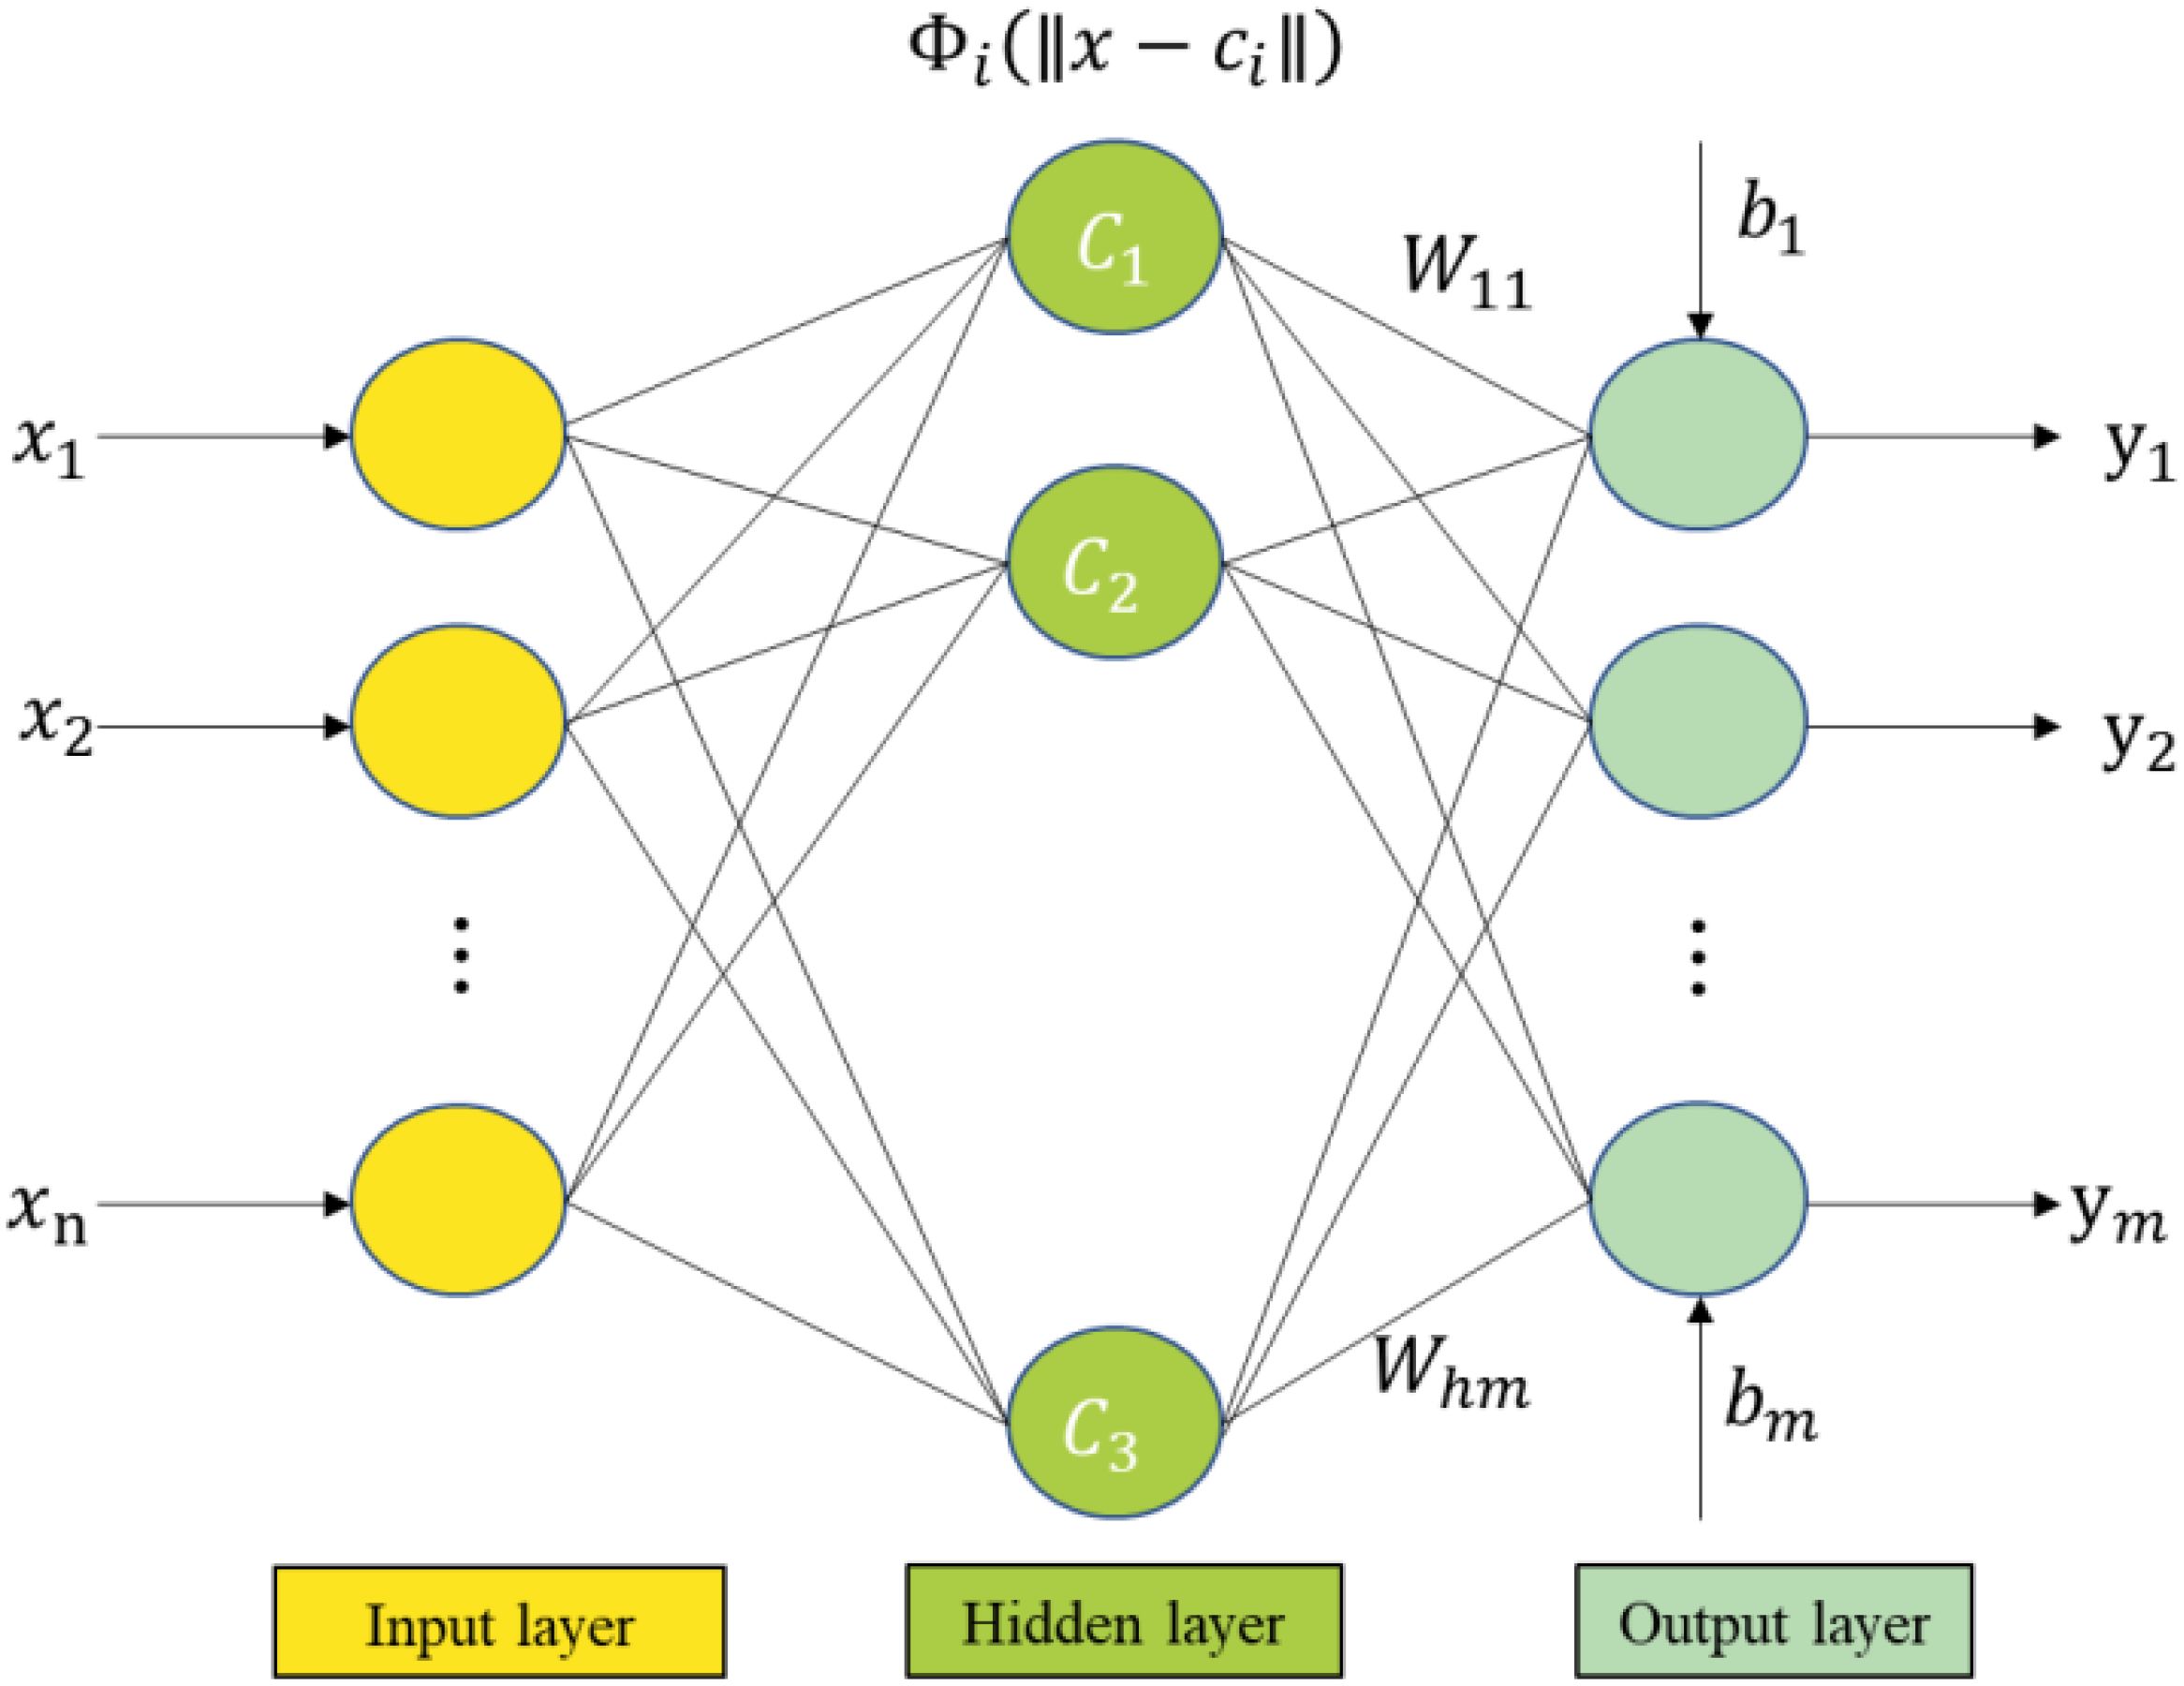
Figure 2. RBF neural network structure diagram.
Where: represents the Euclidean distance between the input vector and the center of the radial basis function.
3.2.2 Time-lag correlation
Time-lag correlation analysis is a powerful tool for examining the temporal relationship between two evolving processes, allowing us to determine whether a specific correlation exists over time. This method helps define the directional influence between two signals, establishing a lead–follow relationship. In this dynamic, the leading signal triggers a response, while the following signal replicates it after a delay. To measure time-lag correlation, a stepwise shifting of a time series vector is performed, followed by iterative correlation computations between the two signals. If the peak correlation appears at the center (offset = 0), it indicates that the two time series are most strongly correlated at the same time. However, if one signal precedes the other, the correlation peak shifts to a different coordinate value, reflecting a time-lagged relationship.The time-lag correlation coefficient quantifies this relationship by comparing the data in one time series with the corresponding values in another after shifting them backward by several time steps (Arreola Hernandez et al., 2015). This coefficient, often referred to as the lagged correlation coefficient, provides valuable insights into the delayed interactions between two time-dependent processes. The mathematical formulation for computing the lagged correlation coefficient is as follows:
Among them, represents the h-order time-lag correlation coefficient between the x and y sequences. is the length of the time series. and are the mean values of the and series, respectively.
3.3 Data description
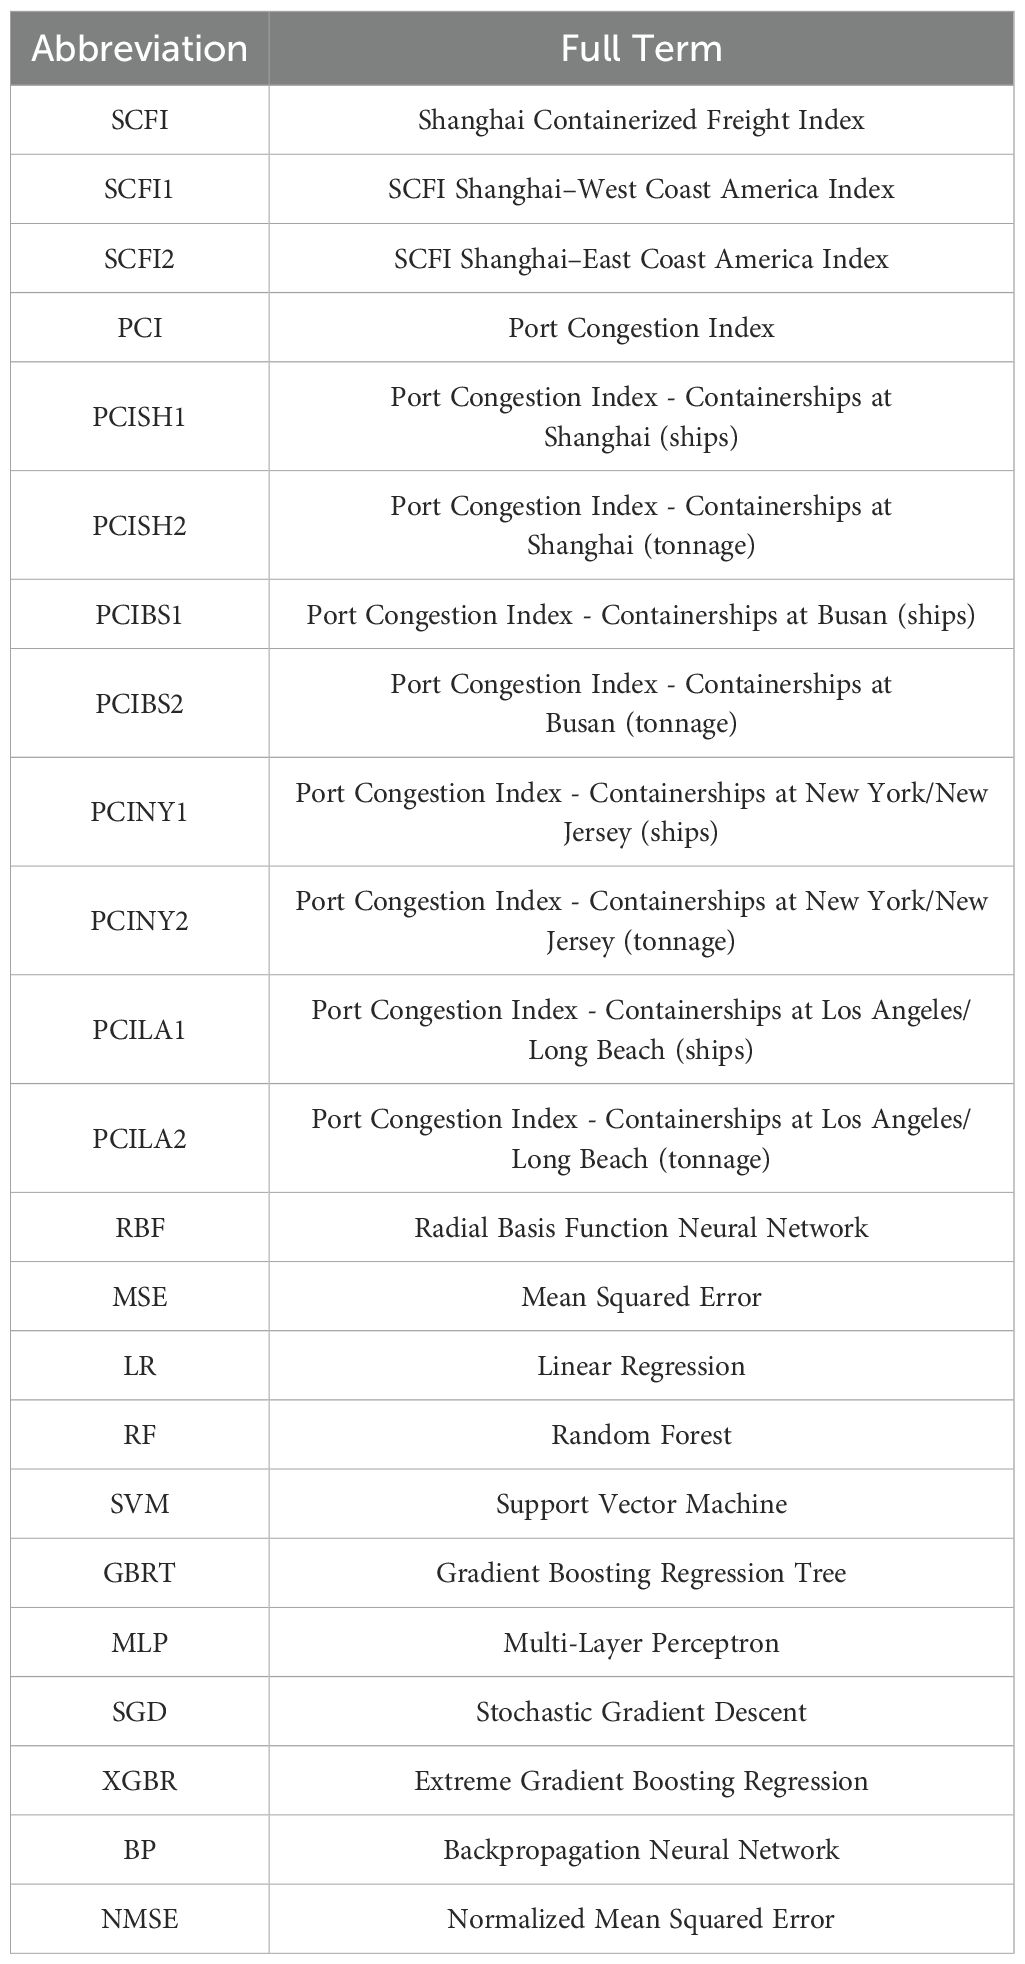
The choice of variables significantly influences the performance of machine learning models (Xu et al., 2021; Dong et al., 2023; Afshari et al., 2022). Various strategies exist for variable selection, including heuristic, nested, and greedy search methods. Therefore, following the objective and scope of this research, we collected three SCFI indices and eight port congestion indicators (Tables 1, 2). The research dataset spans from January 1, 2016 to January 1, 2023. All data for this research is sourced from Shanghai Shipping Exchange and Clarksons—the SCFI data is from the Shanghai Shipping Exchange. In addition, the Shanghai International Shipping Exchange Center officially released SCFI for the first time in December 2005. SCFI provides high-frequency time series data reflecting fluctuations in spot freight rates in the Shanghai export container transportation market. It includes freight rates (indices) for 15 individual routes and a composite index. The comprehensive SCFI is the weighted average of the freight rates of 15 routes. The SCFI2 (Shanghai–New York) has the highest mean value (4361.41) and the largest variation, reflecting the long-haul nature of the route and external economic influences. Port congestion indicators also show substantial fluctuations, particularly PCILA1 (Los Angeles) and PCINY1 (New York), suggesting that U.S. ports experienced more severe congestion volatility. These variations underscore the necessity of predictive modeling to capture the complex dynamics of freight rates and port congestion.
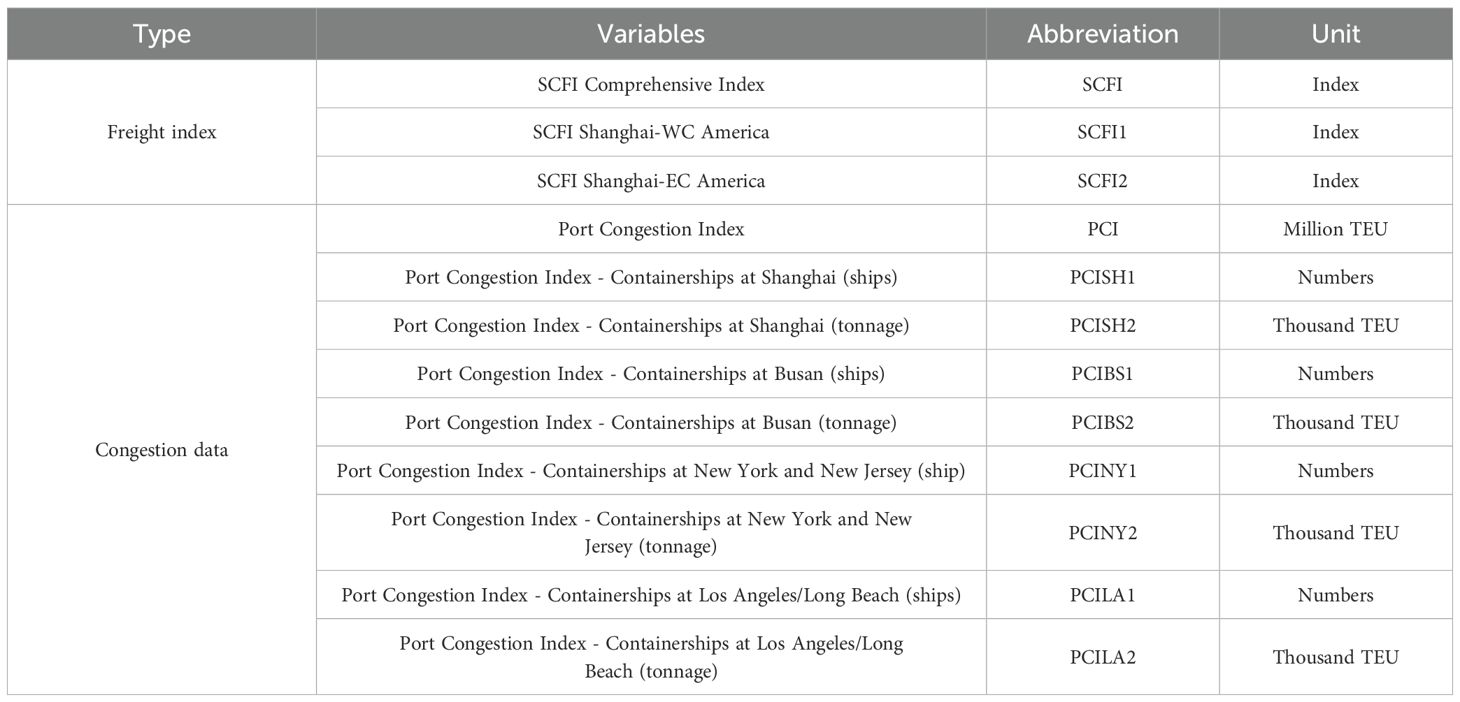
Table 1. Research variables.
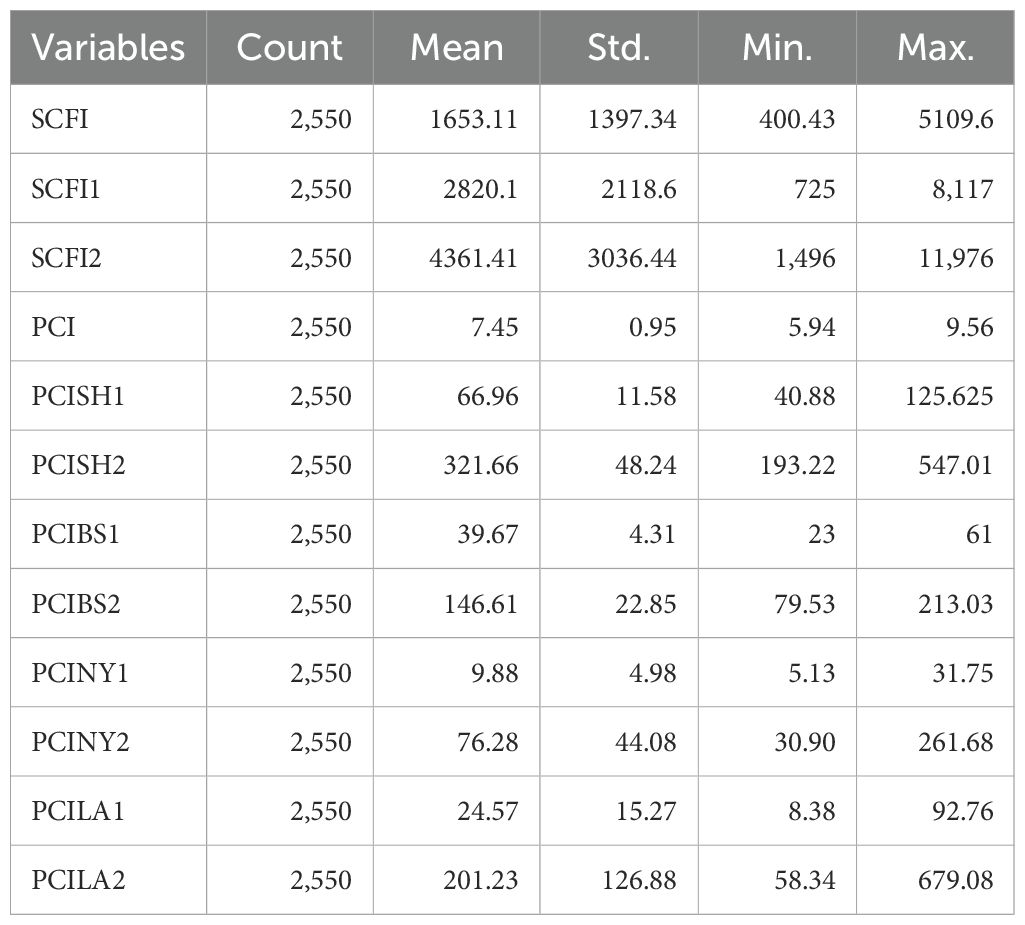
Table 2. Descriptive statistics for SCFI prediction data.
This study focused on predicting and validating the changes in spot freight rates for the combined SCFI and two Shanghai–U.S. routes (Figure 3). SCFI1 is the spot fare for export container freight from Shanghai to the west coast of North America (LA/LB ports, etc.). SCFI2 is the spot fare for export container freight from Shanghai to the east coast of North America (LA/LB ports, etc.). Before 2020, the three SCFIs exhibited a stable trend, as indicated by the graph. However, after 2020, all three SCFIs showed an upward trend that halted in 2022 and reversed downward. Figure 4 shows the port congestion data as the global container port demurrage capacity. Likewise, before 2020, the cargo tonnage of congested ships at container ports continued to increase, but after 2022, it began to decline. This decline can be attributed to the gradual easing of global supply chain disruptions, a slowdown in international trade due to economic uncertainties and inflationary pressures, and improved port operational efficiencies. Additionally, the normalization of container freight rates reduced speculative shipping demand, leading to a stabilization of cargo flows and a decline in congestion-related tonnage.
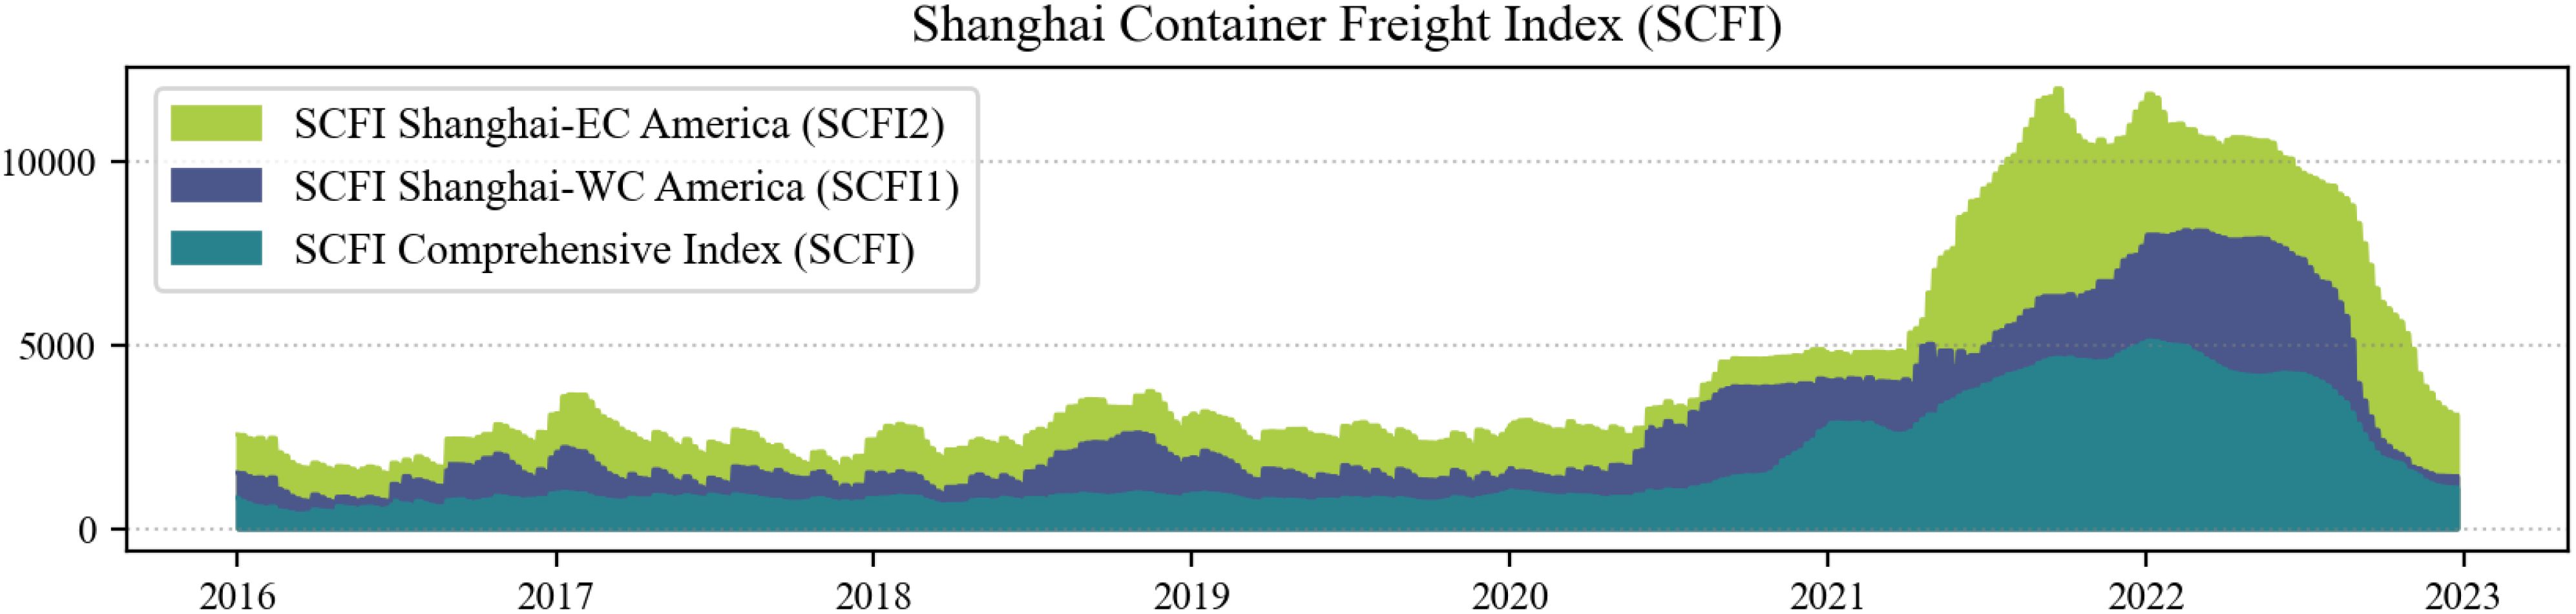
Figure 3. Chart of the Shanghai container freight index trend.
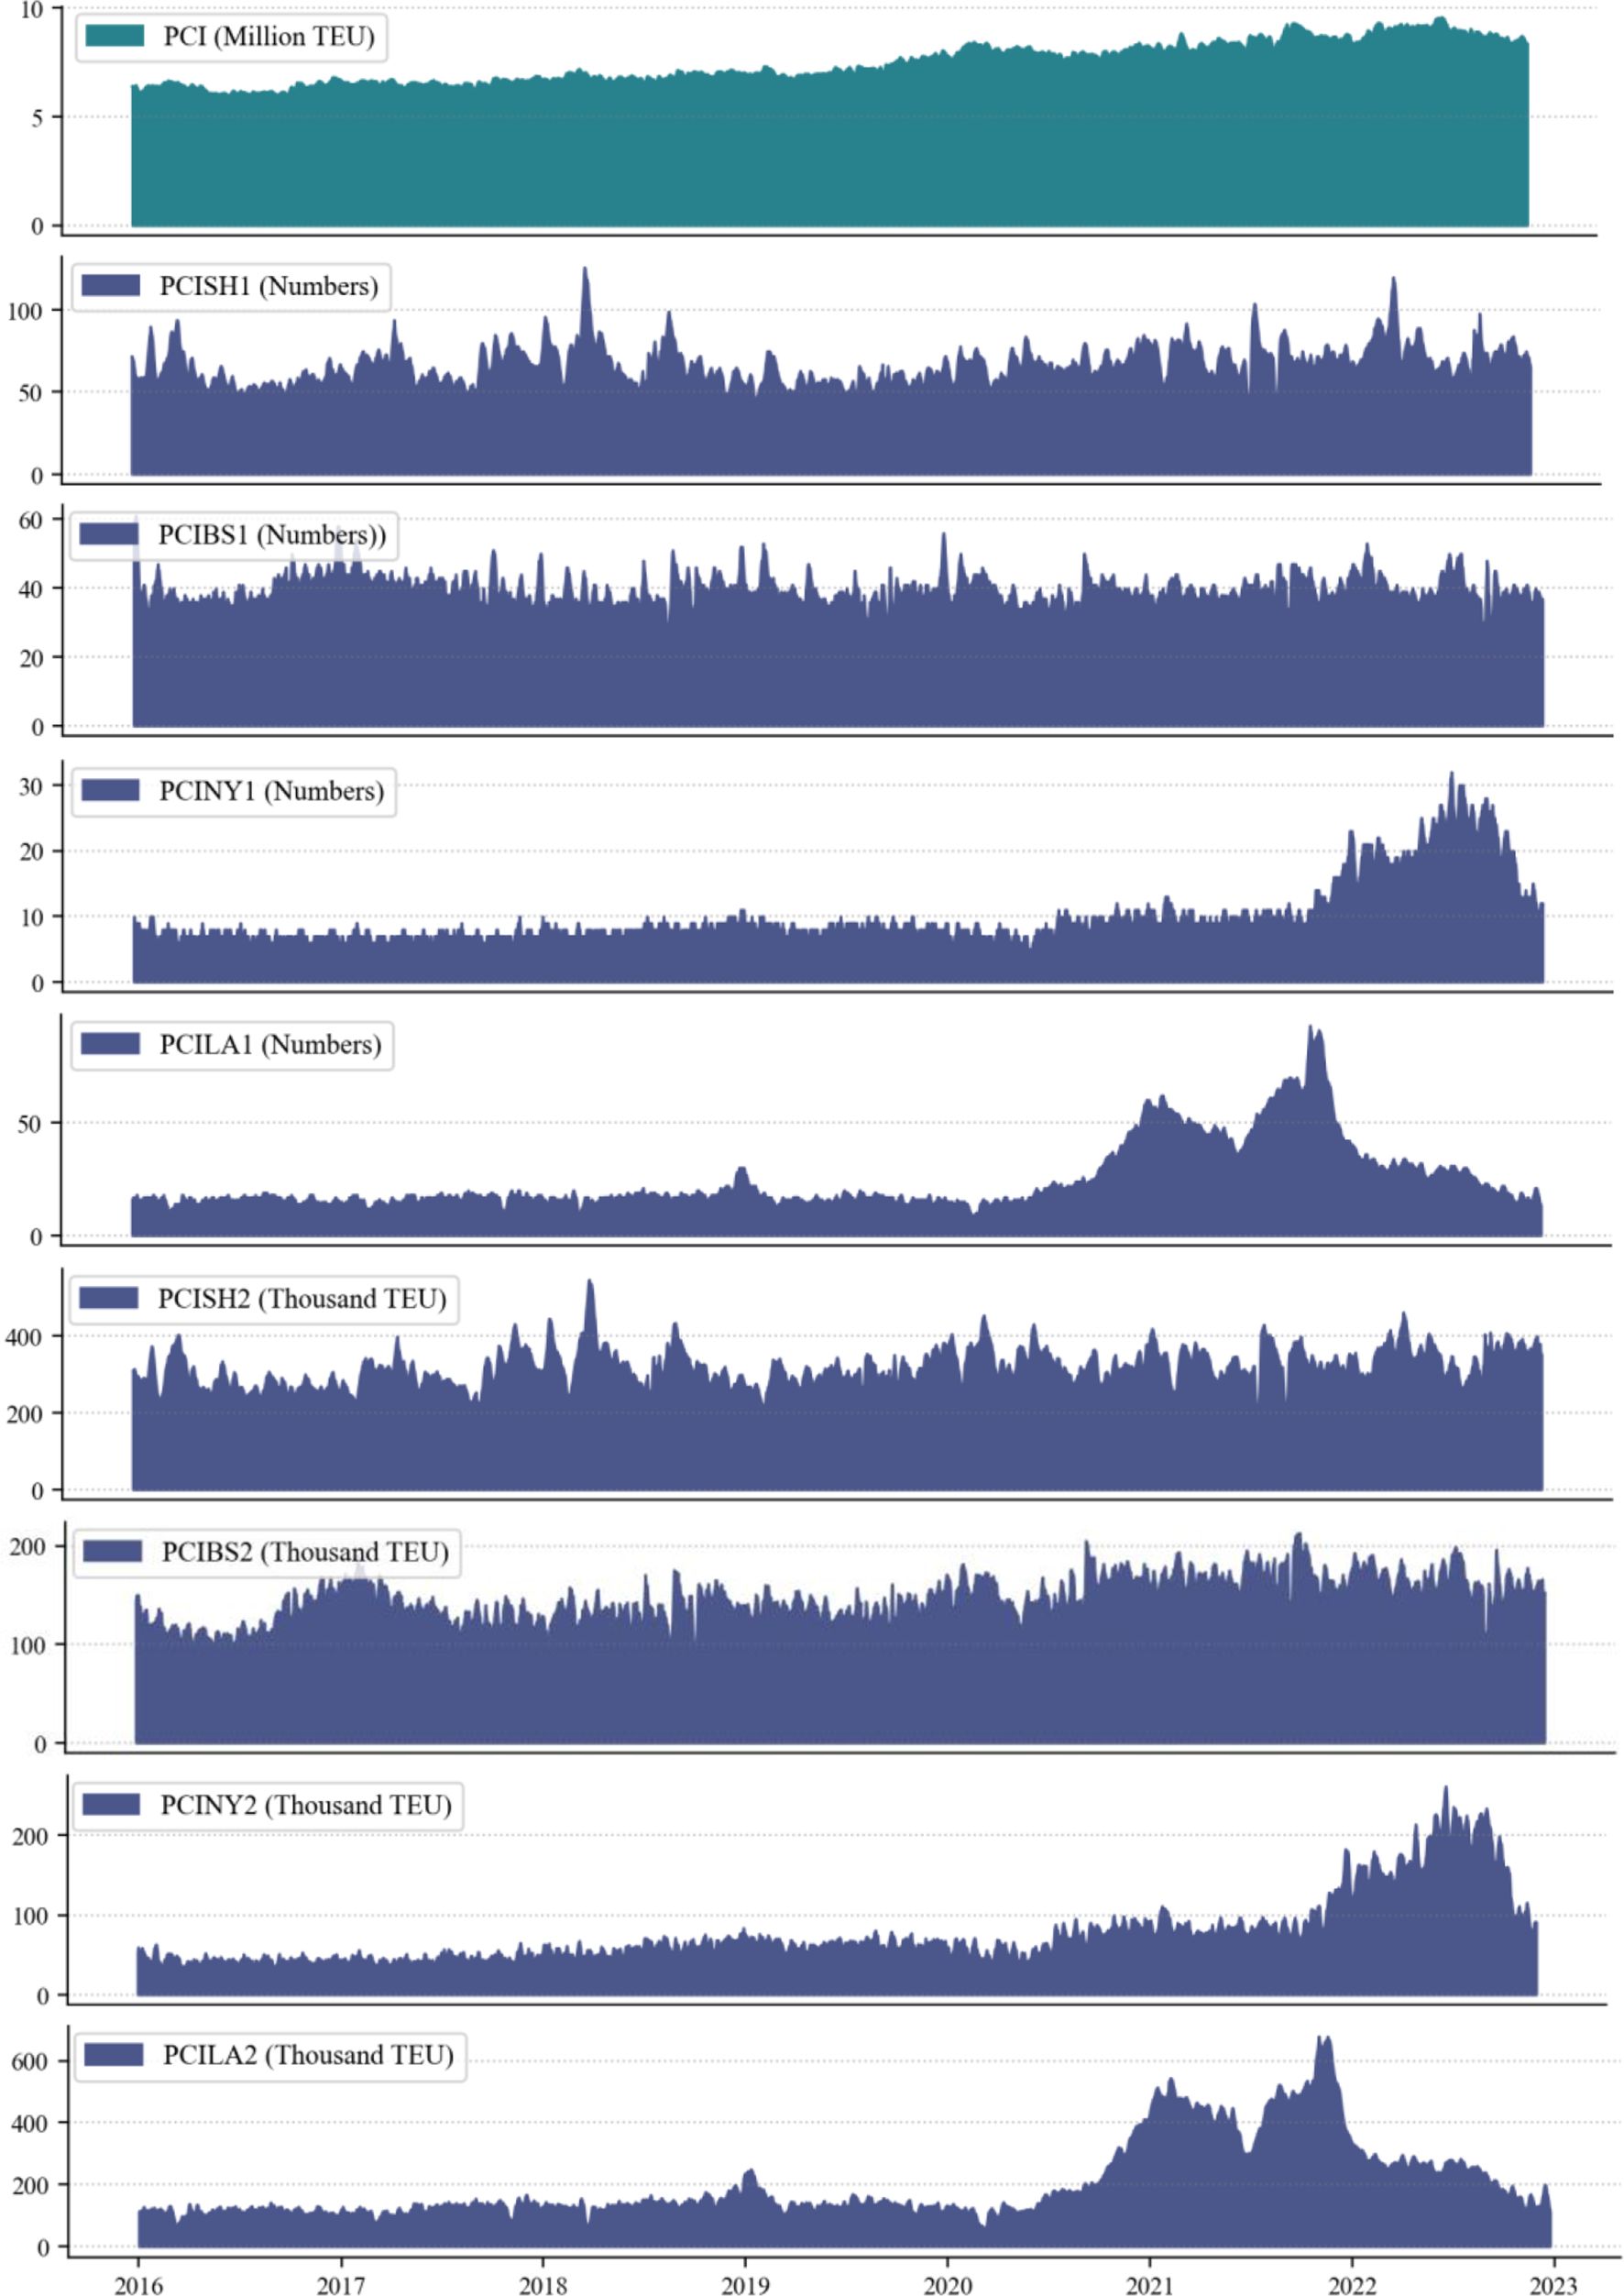
Figure 4. Trend of cargo tonnage and number of congested ships in major container ports: Shanghai, Busan, Los Angeles, and N.
The Port Congestion Index - Containerships at Shanghai represents the vessel deadweight of congested ships at China’s Shanghai container port, reflecting the number of ships experiencing congestion at this major global trade hub. In addition, our variables include the vessel deadweight of congested ships and the number of congested ships at key international ports, namely the U.S. West Coast ports (e.g., Long Beach Port), the U.S. East Coast ports (e.g., New York Port), and Busan Port, South Korea (Figures 4). These ports were selected due to their critical role in global supply chains, serving as major transshipment hubs that are highly interconnected with Shanghai’s shipping routes. Busan Port was specifically included because it functions as a key transshipment hub for container traffic between China, the U.S., and other international markets. Given its geographic proximity to China and its strategic role in handling cargo volumes originating from or destined for Shanghai, congestion at Busan can have spillover effects on trade flows and supply chain efficiency in the region. Figures 4 illustrate that among these ports, congestion at the Port of Los Angeles fluctuated the most around 2022, highlighting the dynamic nature of port congestion and its potential ripple effects on global logistics.
In machine learning, correlation analysis is a common initial technique for establishing relationships between variables and can be key to enhancing the predictive accuracy of models. A correlation heatmap provides a graphical representation of numerical variable correlations, visually illustrating these relationships. Each cell value represents the strength of a correlation, with positive values indicating a positive relationship and negative values showing a negative relationship. By analyzing these correlations, we can determine the impact of independent features on predictions. Generally, a Pearson correlation coefficient greater than 0.7 indicates a strong positive correlation.
In our study, we employed correlation analysis as the primary method for variable selection. According to statistical norms, correlations below 0.3 are considered weak and unlikely to provide meaningful predictive power. Therefore, we selected variables with a correlation greater than 0.3 with the SCF indicators as the independent variables for our model. This approach helped ensure that only relevant features contributing significantly to the predictive model were included.
Figure 5 depicts the correlation between dataset characteristics, highlighting the selected variables used in the analysis.
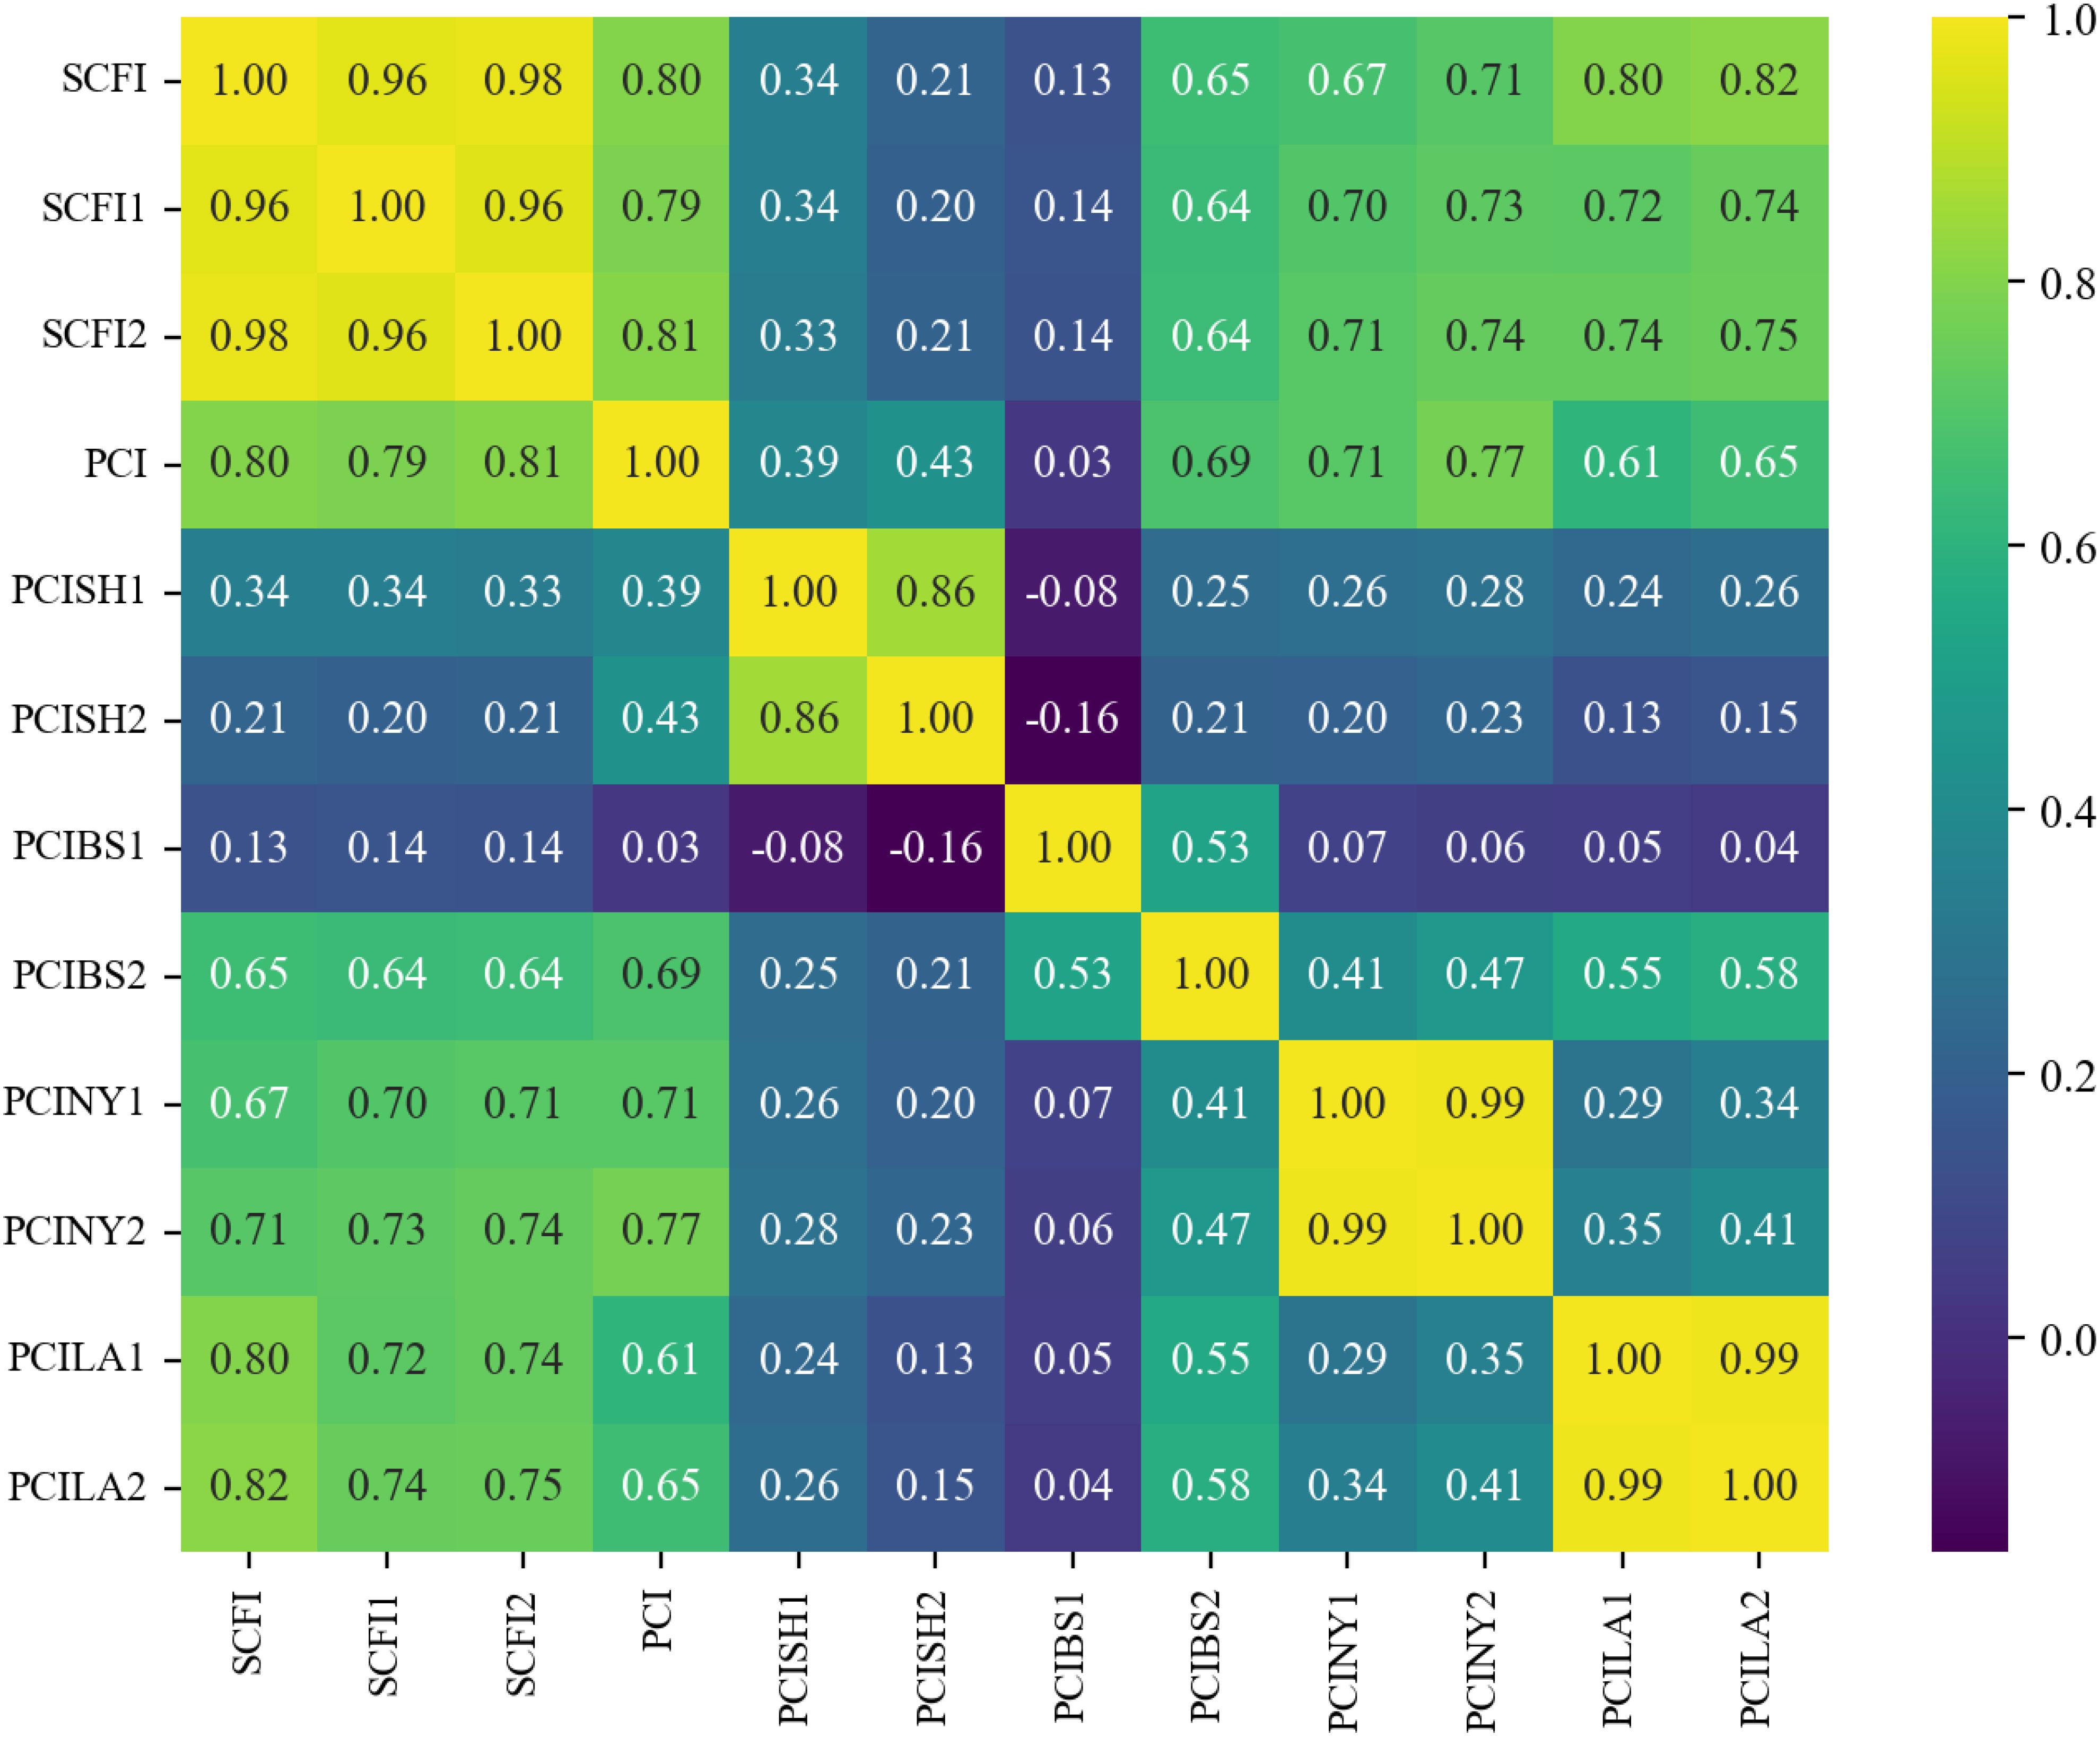
Figure 5. Correlation analysis chart.
Figure 5 highlights the correlation between different variables in our dataset. While most correlations are positive, some negative values are observed, indicating an inverse relationship between certain port congestion indices. For instance, the negative correlation between PCISH1 and PCIBS1 (-0.08) and PCISH2 and PCIBS1 (-0.16) suggests that when congestion in Shanghai increases, some shipments may be rerouted to Busan, reducing congestion there. Similarly, the negative correlation between PCISH2 and PCIBS2 (-0.16) further supports this substitution effect between major ports. These findings imply that port congestion dynamics are influenced by cargo rerouting decisions, regional economic conditions, and port management policies.
4 Result
Like any predictive modeling study, we divided the dataset into training (in-sample) and testing (out-of-sample) epochs. According to past practice, approximately 80% of the samples comprise the training samples, and 20% are the testing samples. The loss curve evaluates the model’s performance in three cases: underfitting, excellent fitting, and overfitting—a decent fit exhibits roughly similar training loss and validation loss curves. The loss function used in this study is the Mean Squared Error (MSE), which measures the average squared differences between predicted and actual values. The abbreviations and their full terms used in this study can be found in the Appendix. Figure 6 depicts the change in the loss function of the training and test sets during the RBF neural network training process. The loss function on the training and test sets is considerable at the outset of training. As the number of training sessions increases, the loss function swiftly decreases. After approximately 200 epoch cycles, the RBF neural network converged.
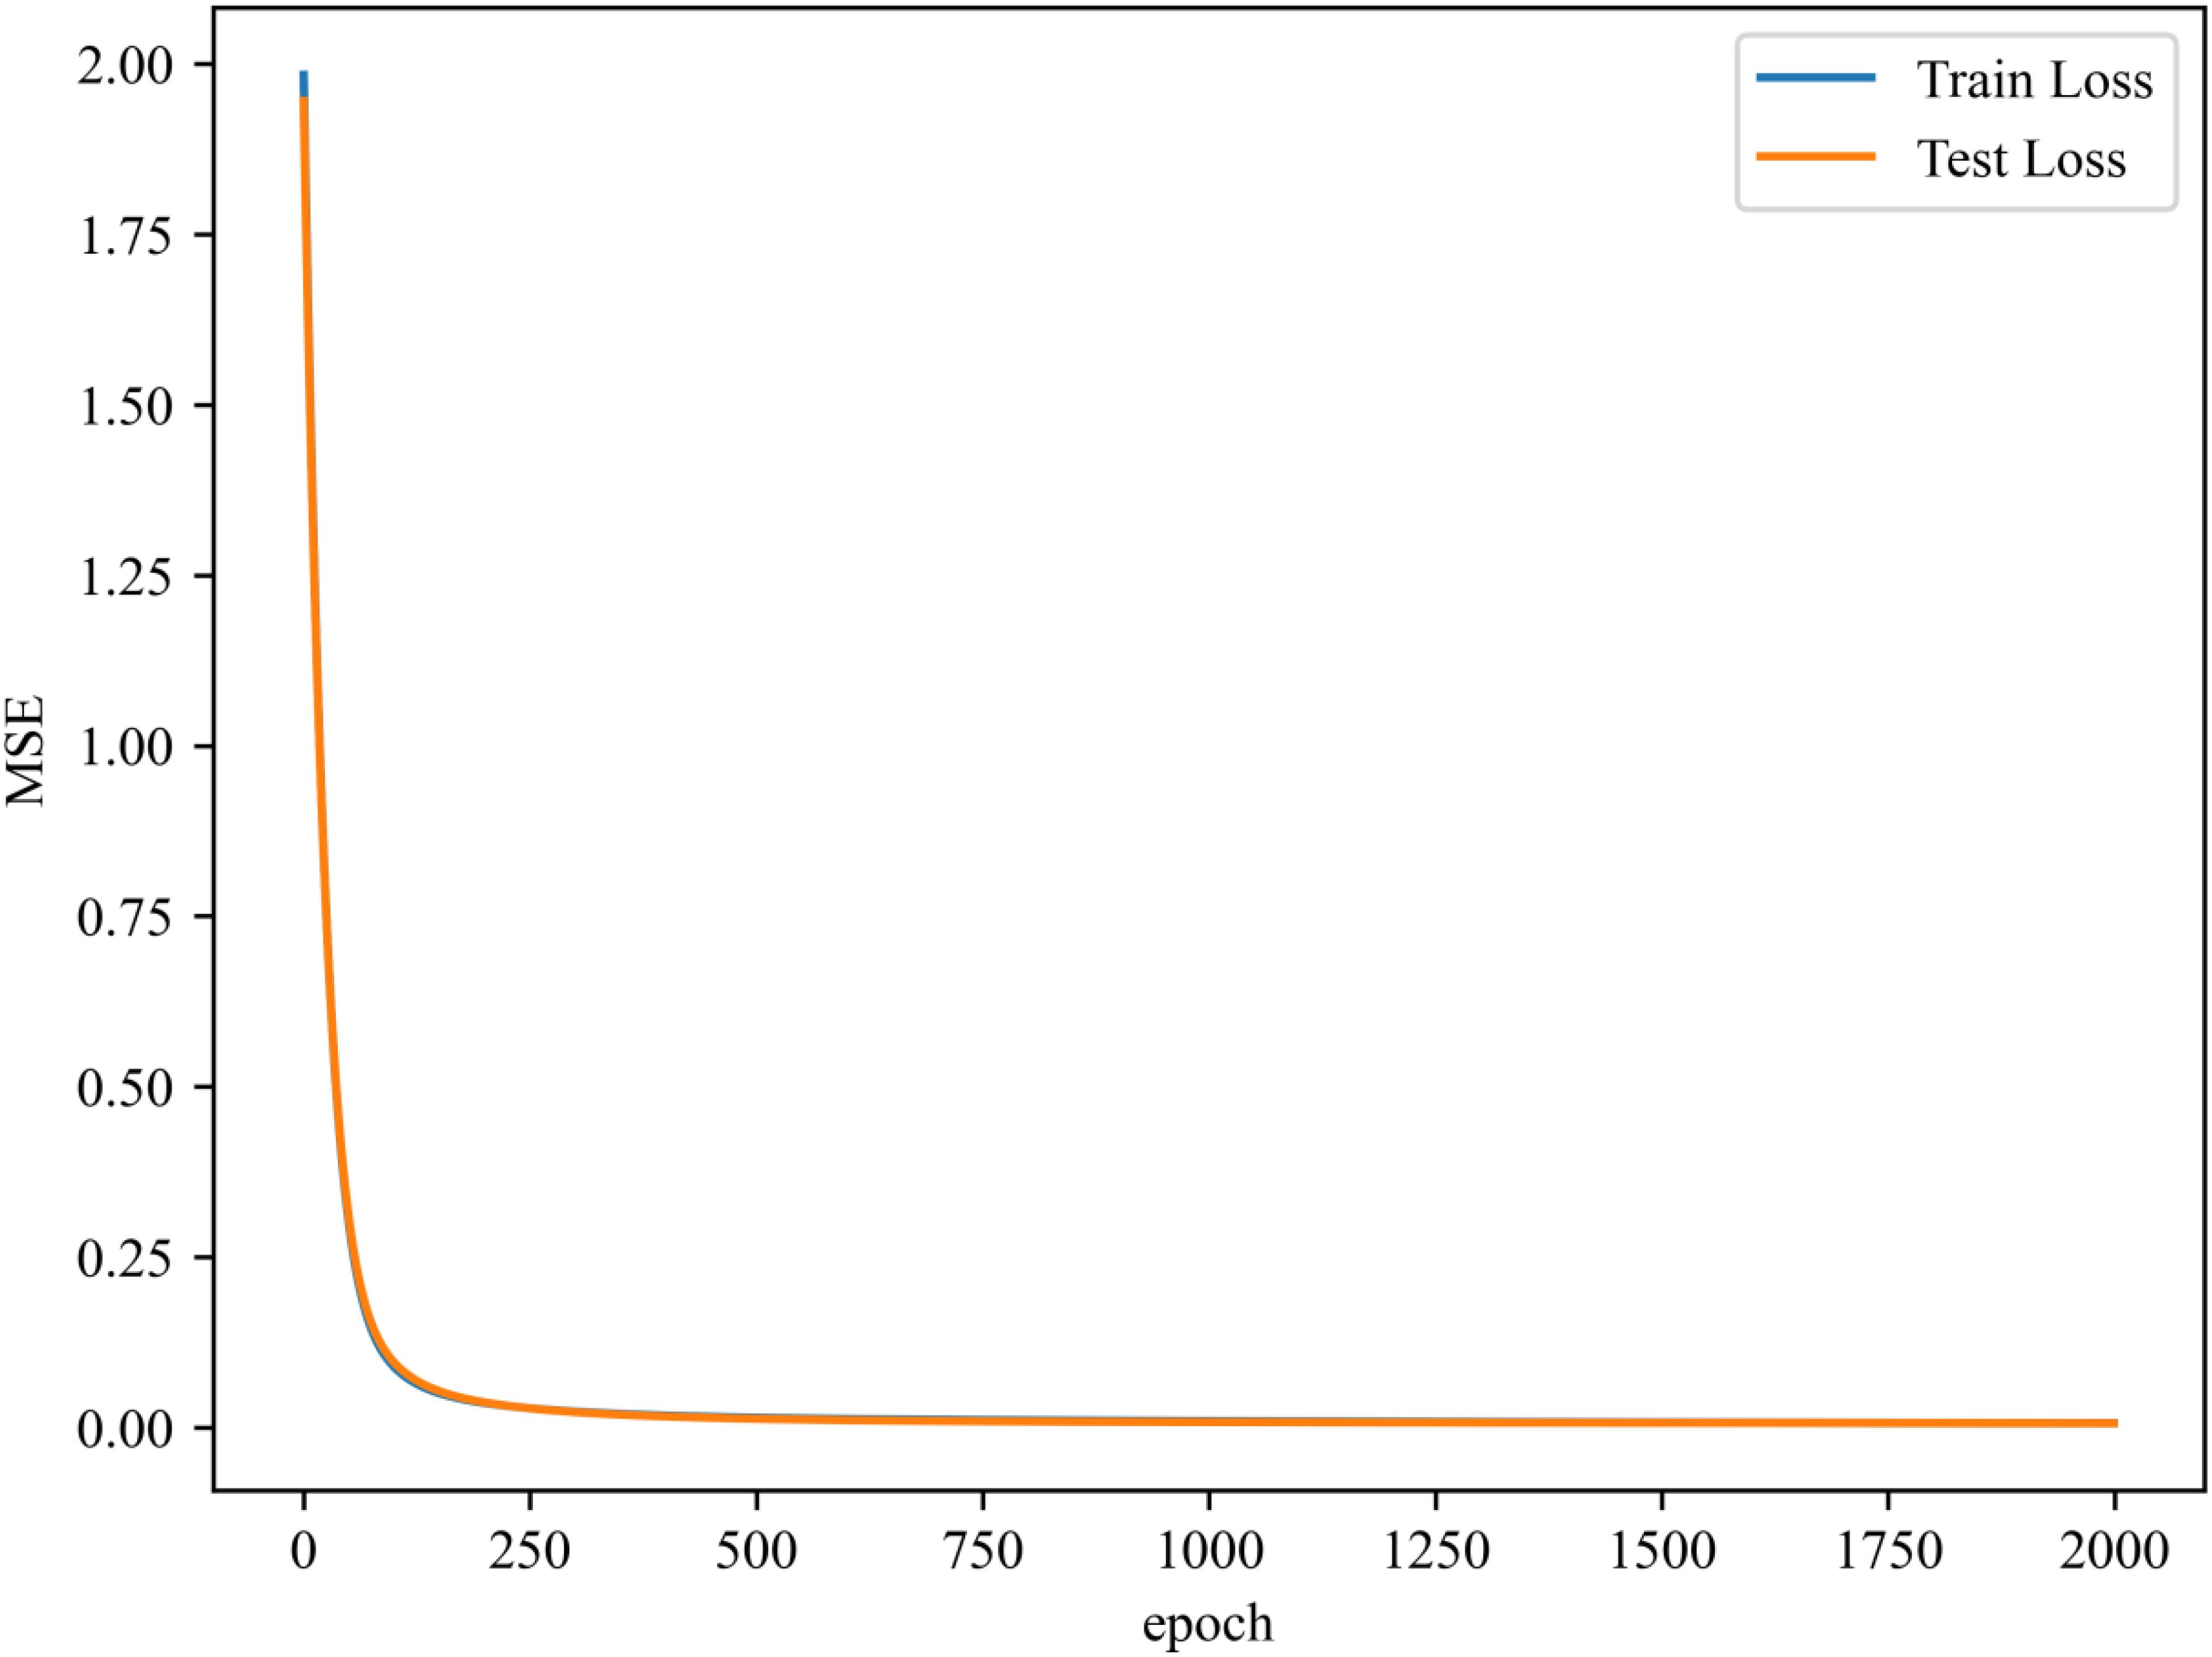
Figure 6. The loss function of the training set and the test set.
4.1 SCFI forecasting
Table 3 presents the results of RBF neural network prediction of SCFI, SCFI1, and SCFI2. Considering all port congestion variables, it is evident that the RBF neural network model is an algorithm capable of accurately predicting SCFI. Furthermore, SCFI, SCFI1, and SCFI2 have test set R2 values of 0.96, 0.93, and 0.94, respectively. Thus, the model’s predicted results correspond well with the actual data.
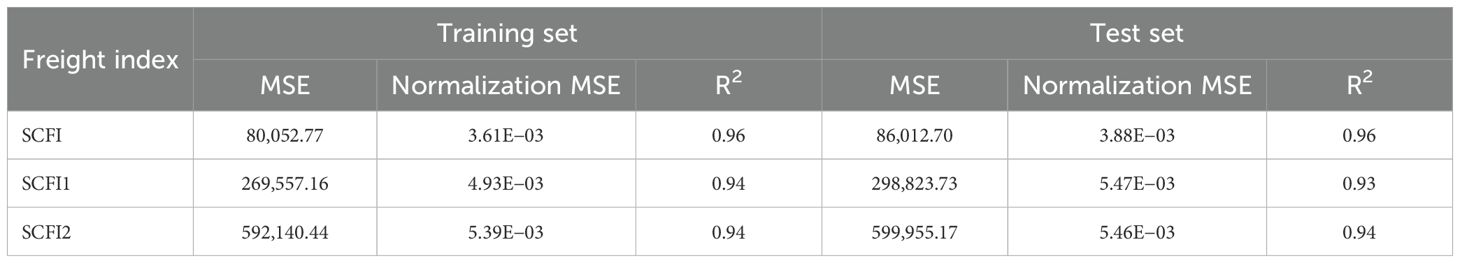
Table 3. SCFI’s forecast results.
Figures 7–9 illustrate the results of the SCFI training and test sets, providing a visual comparison between actual and predicted values. The X-axis represents the sample index, while the Y-axis denotes the corresponding forecasted values. In these figures, the purple line indicates the actual data, whereas the green line represents the model’s predictions. The results demonstrate that the predicted values closely align with the actual values in both the training and test sets. This consistency suggests that the model achieves a high level of fit and effectively generalizes to unseen data. Overall, the constructed RBF neural network model exhibits strong predictive accuracy and robust generalization performance, further validating its effectiveness in forecasting SCFI trends.
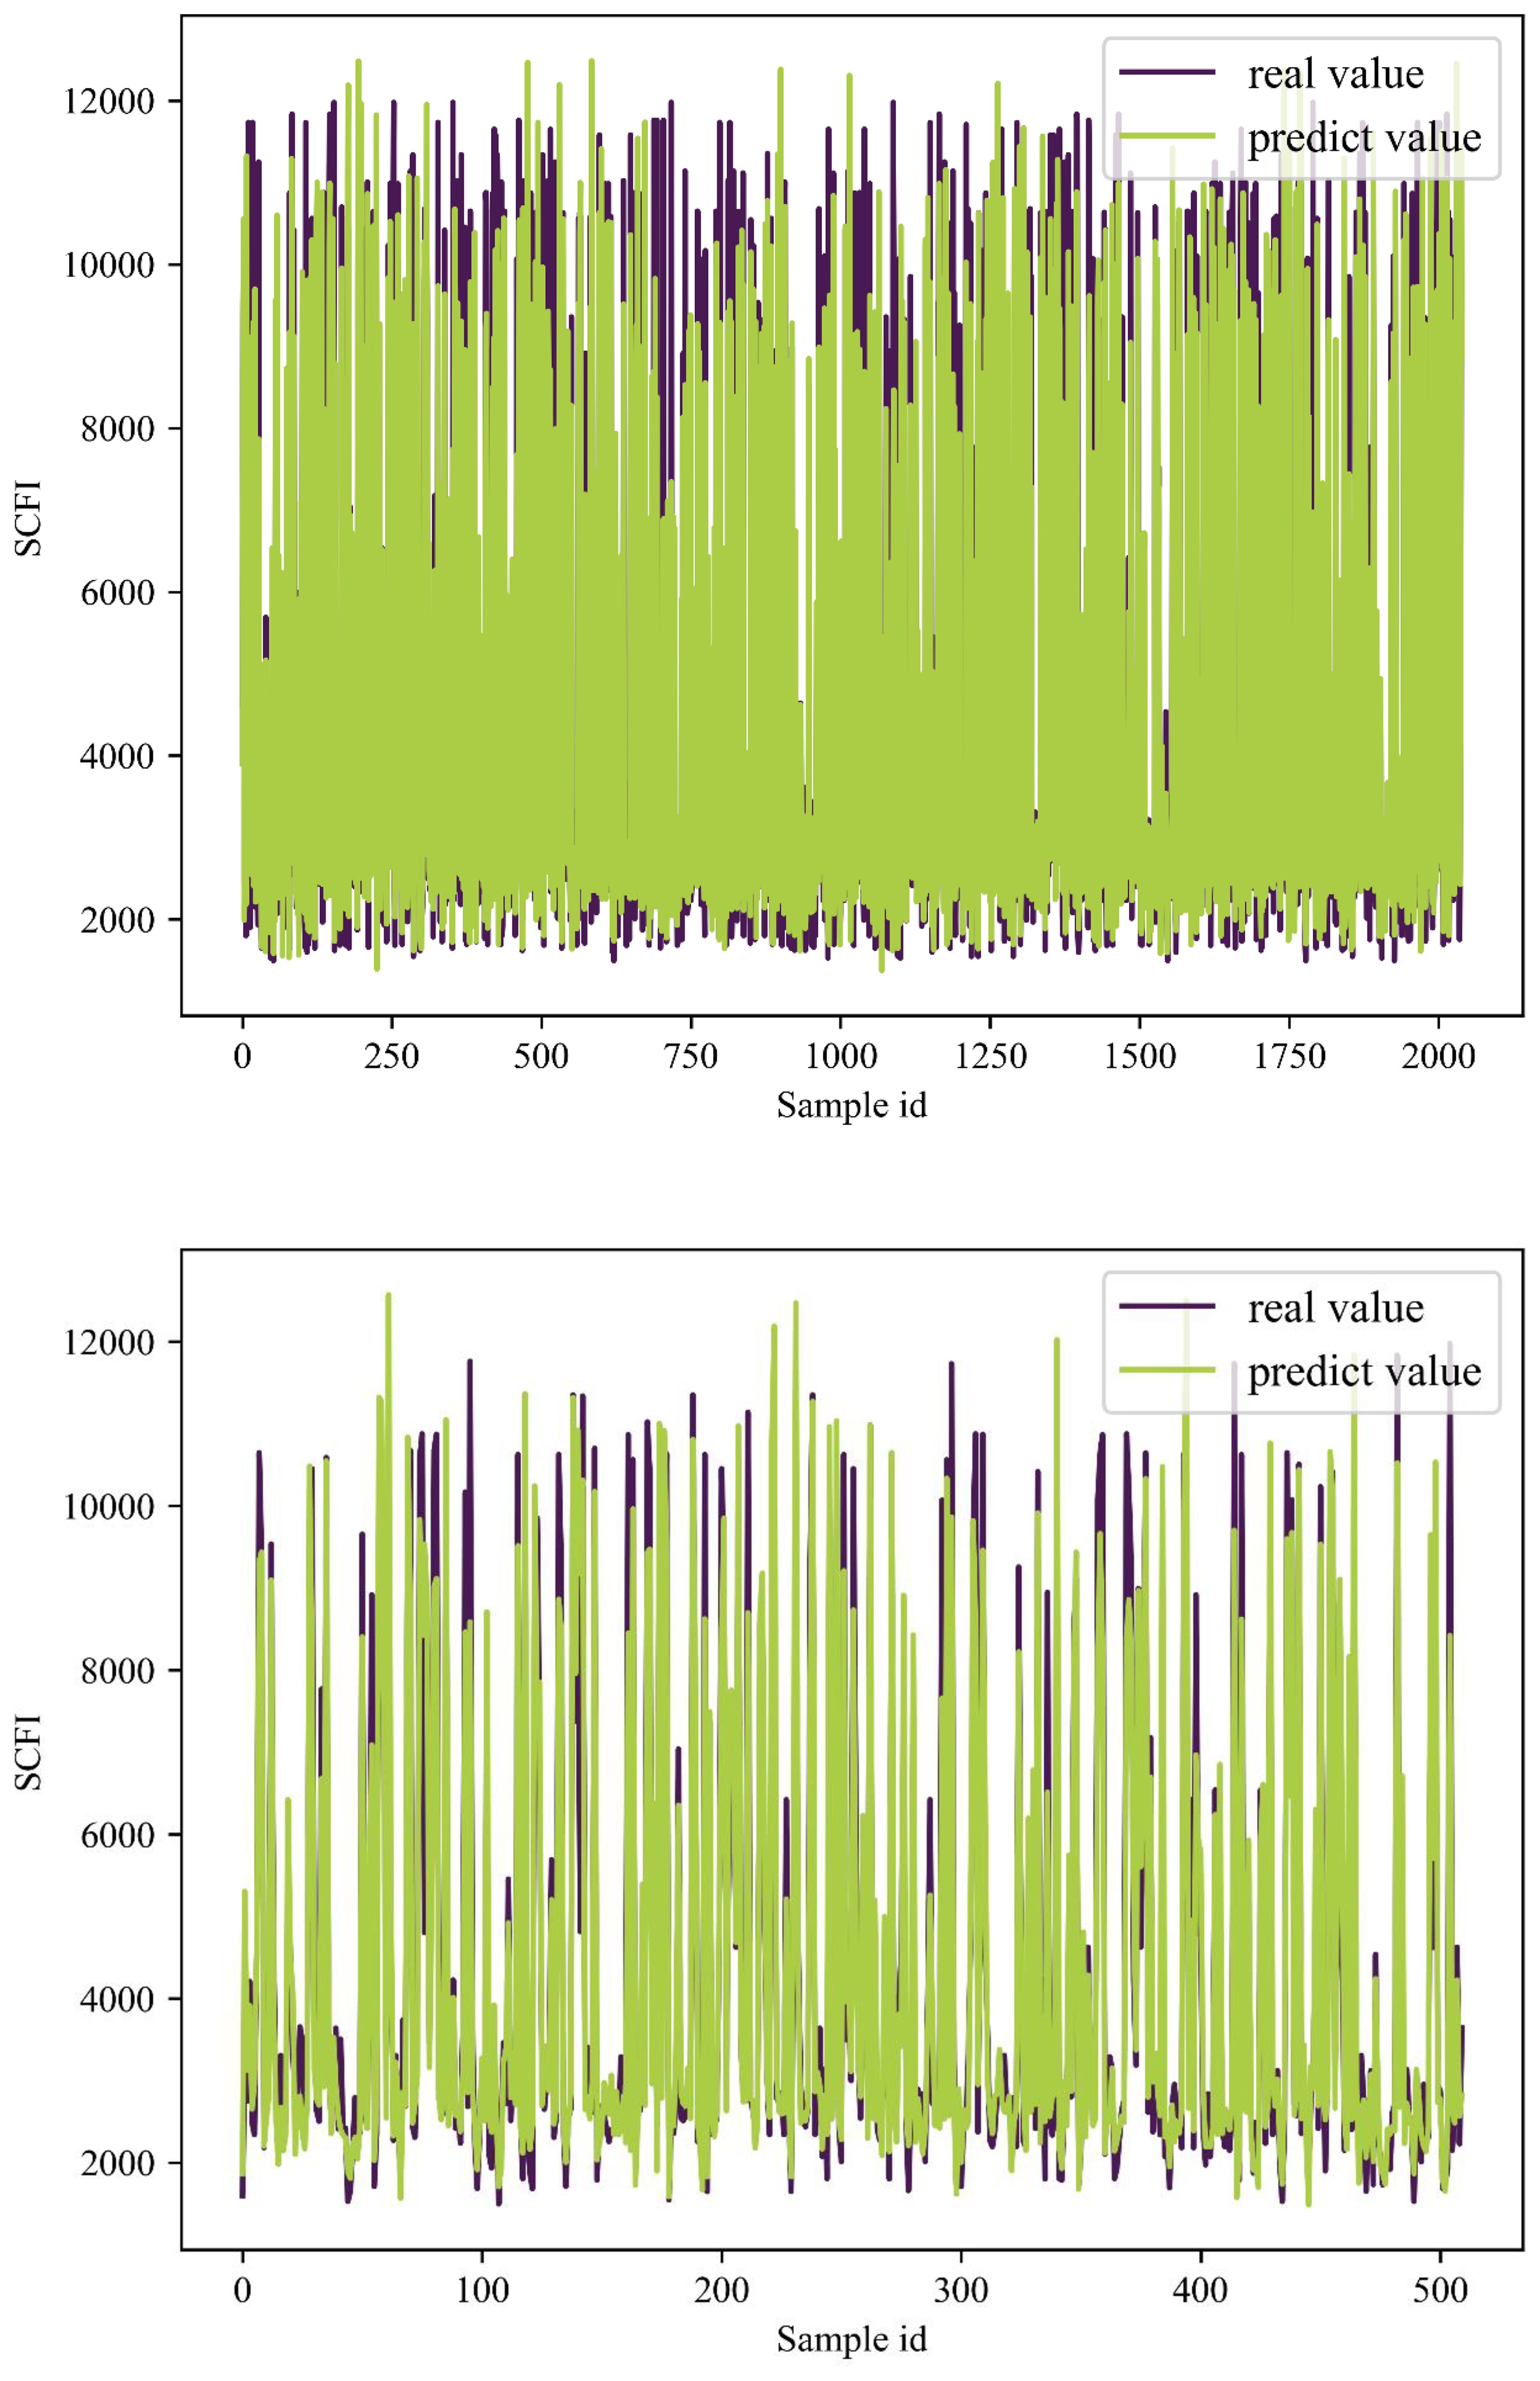
Figure 7. SCFI’s forecast results.
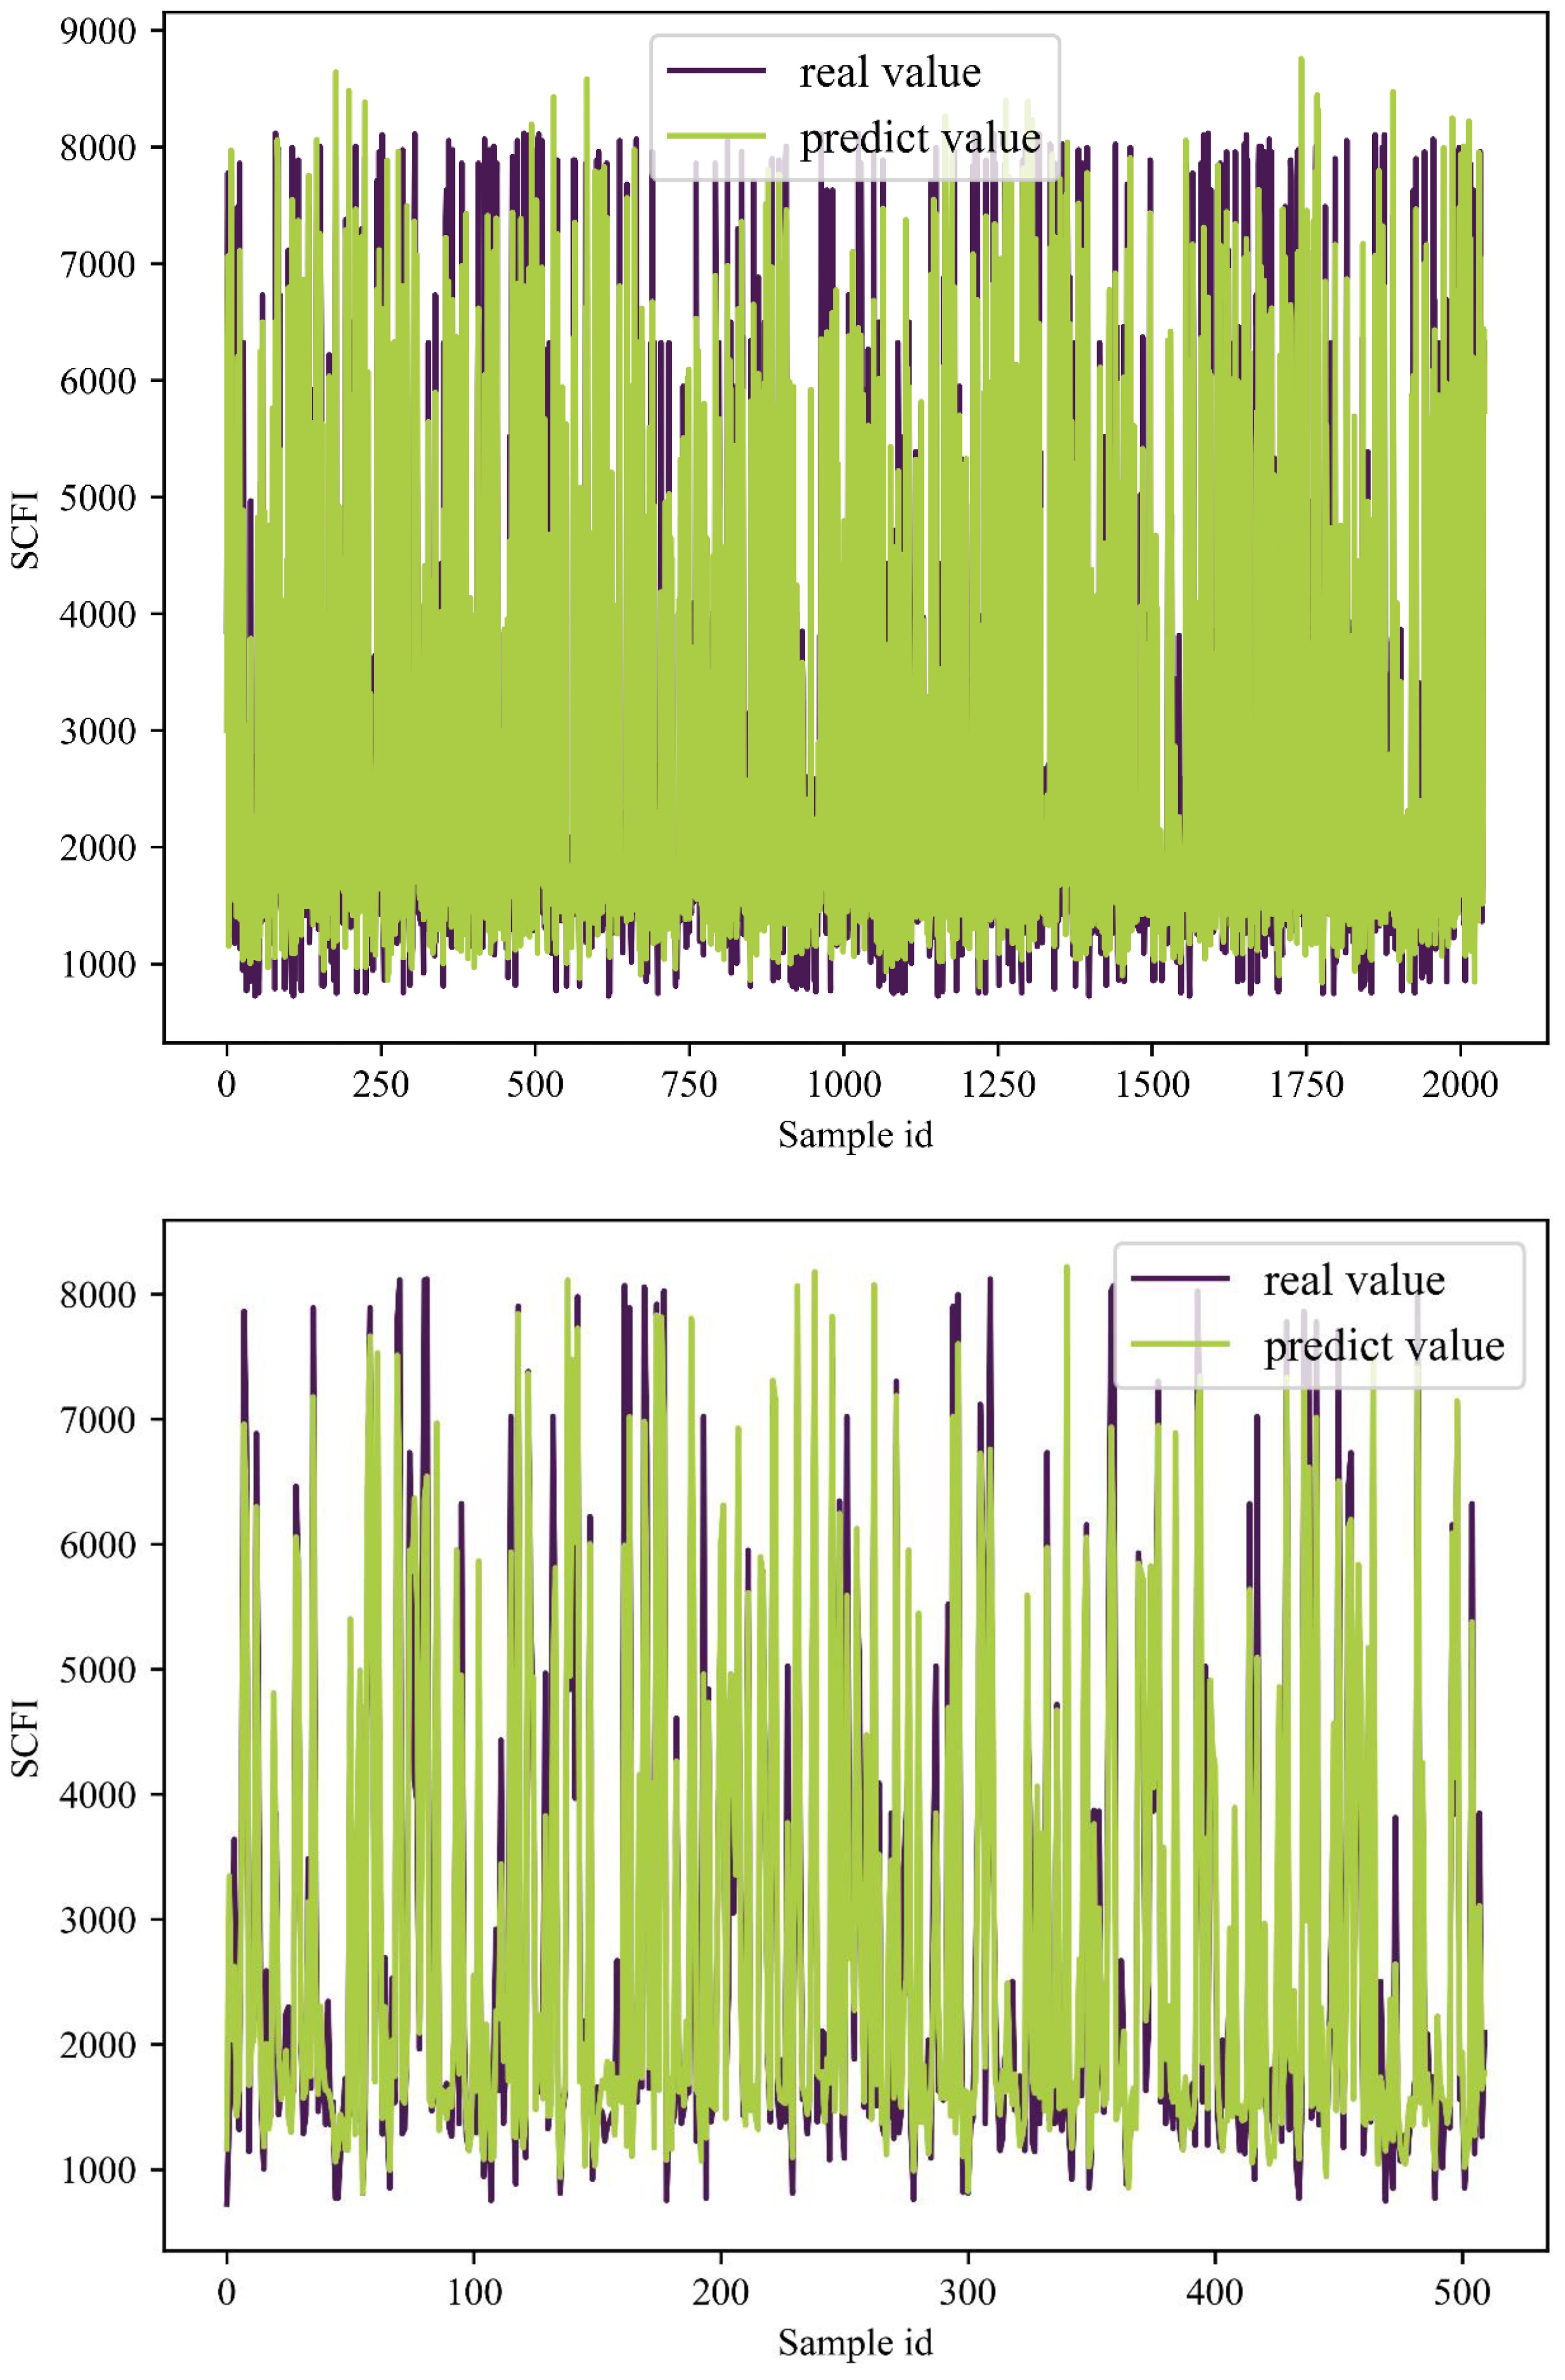
Figure 8. Prediction results of SCFI1.
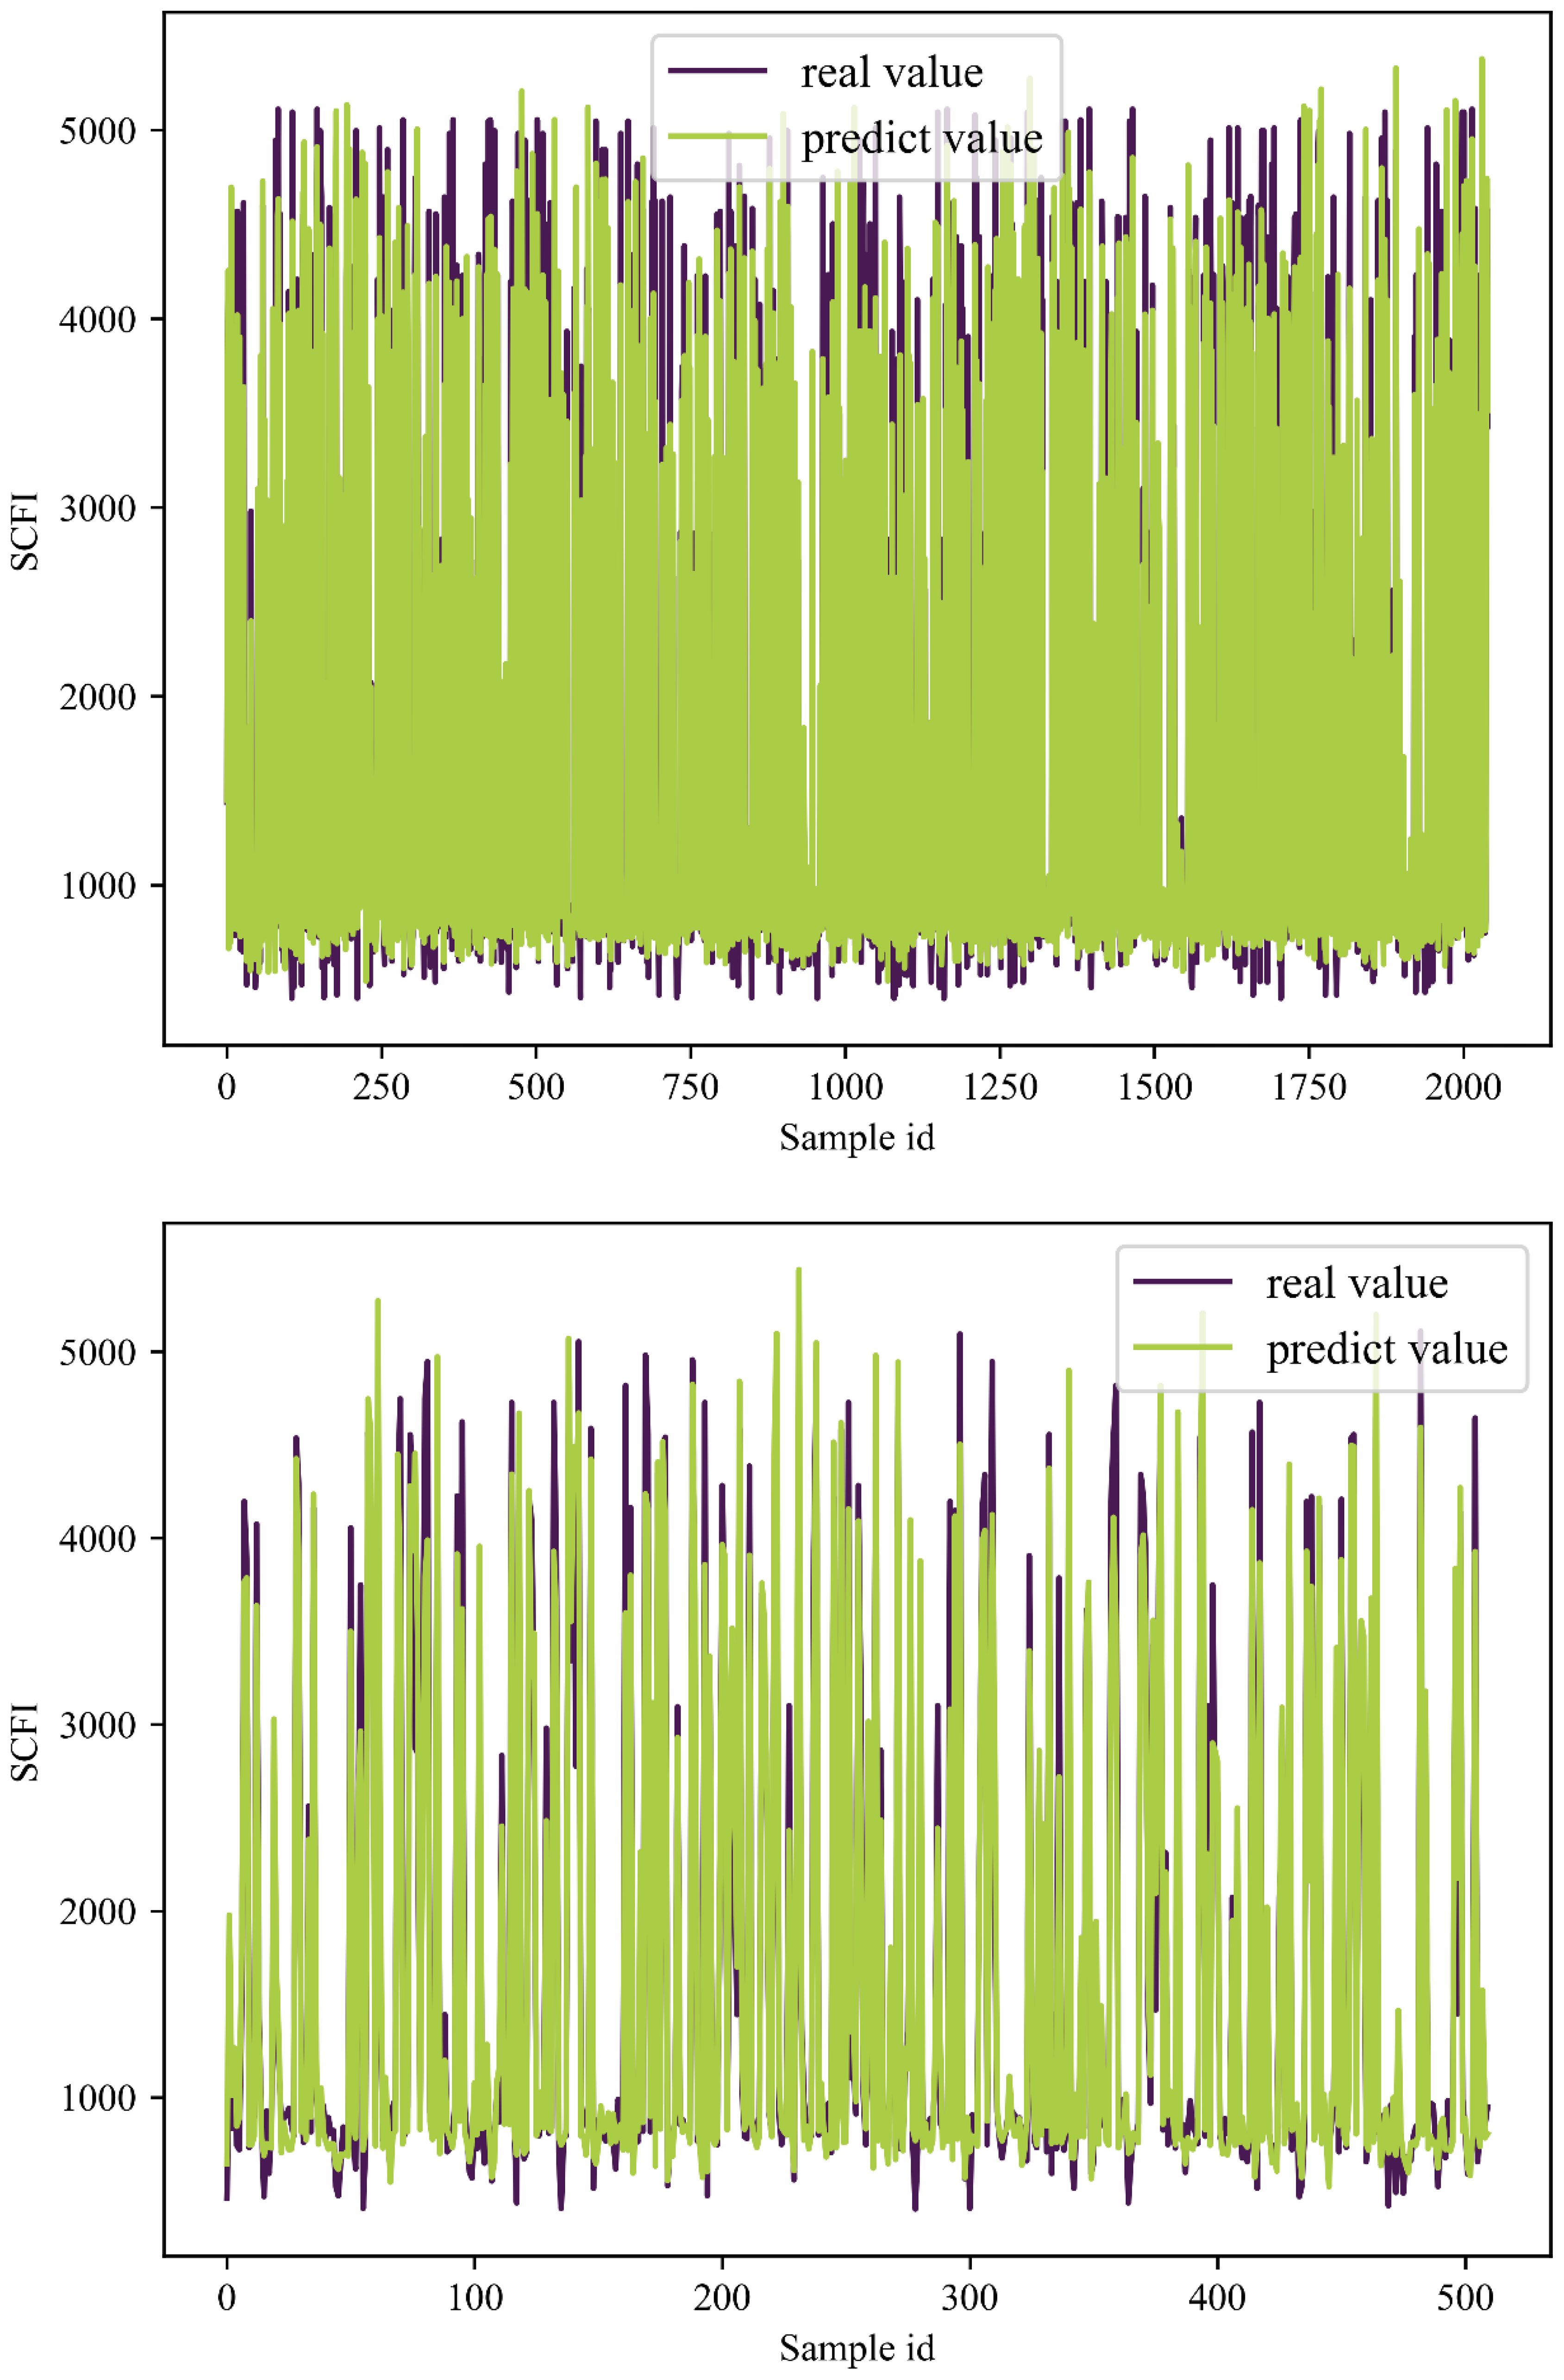
Figure 9. Prediction results of SCFI2.
To strengthen the reliability of the model’s results, we conducted a comprehensive comparison between the RBF neural network and other machine learning models. This study integrates multiple machine learning approaches to train and evaluate the three key indicators, ensuring a robust assessment of predictive performance. The model was trained for 2000 iterations to optimize performance. The results, presented in Table 4, demonstrate that, across all metrics, the RBF neural network consistently outperforms alternative models, exhibiting the highest accuracy and predictive capability for the three indicators.
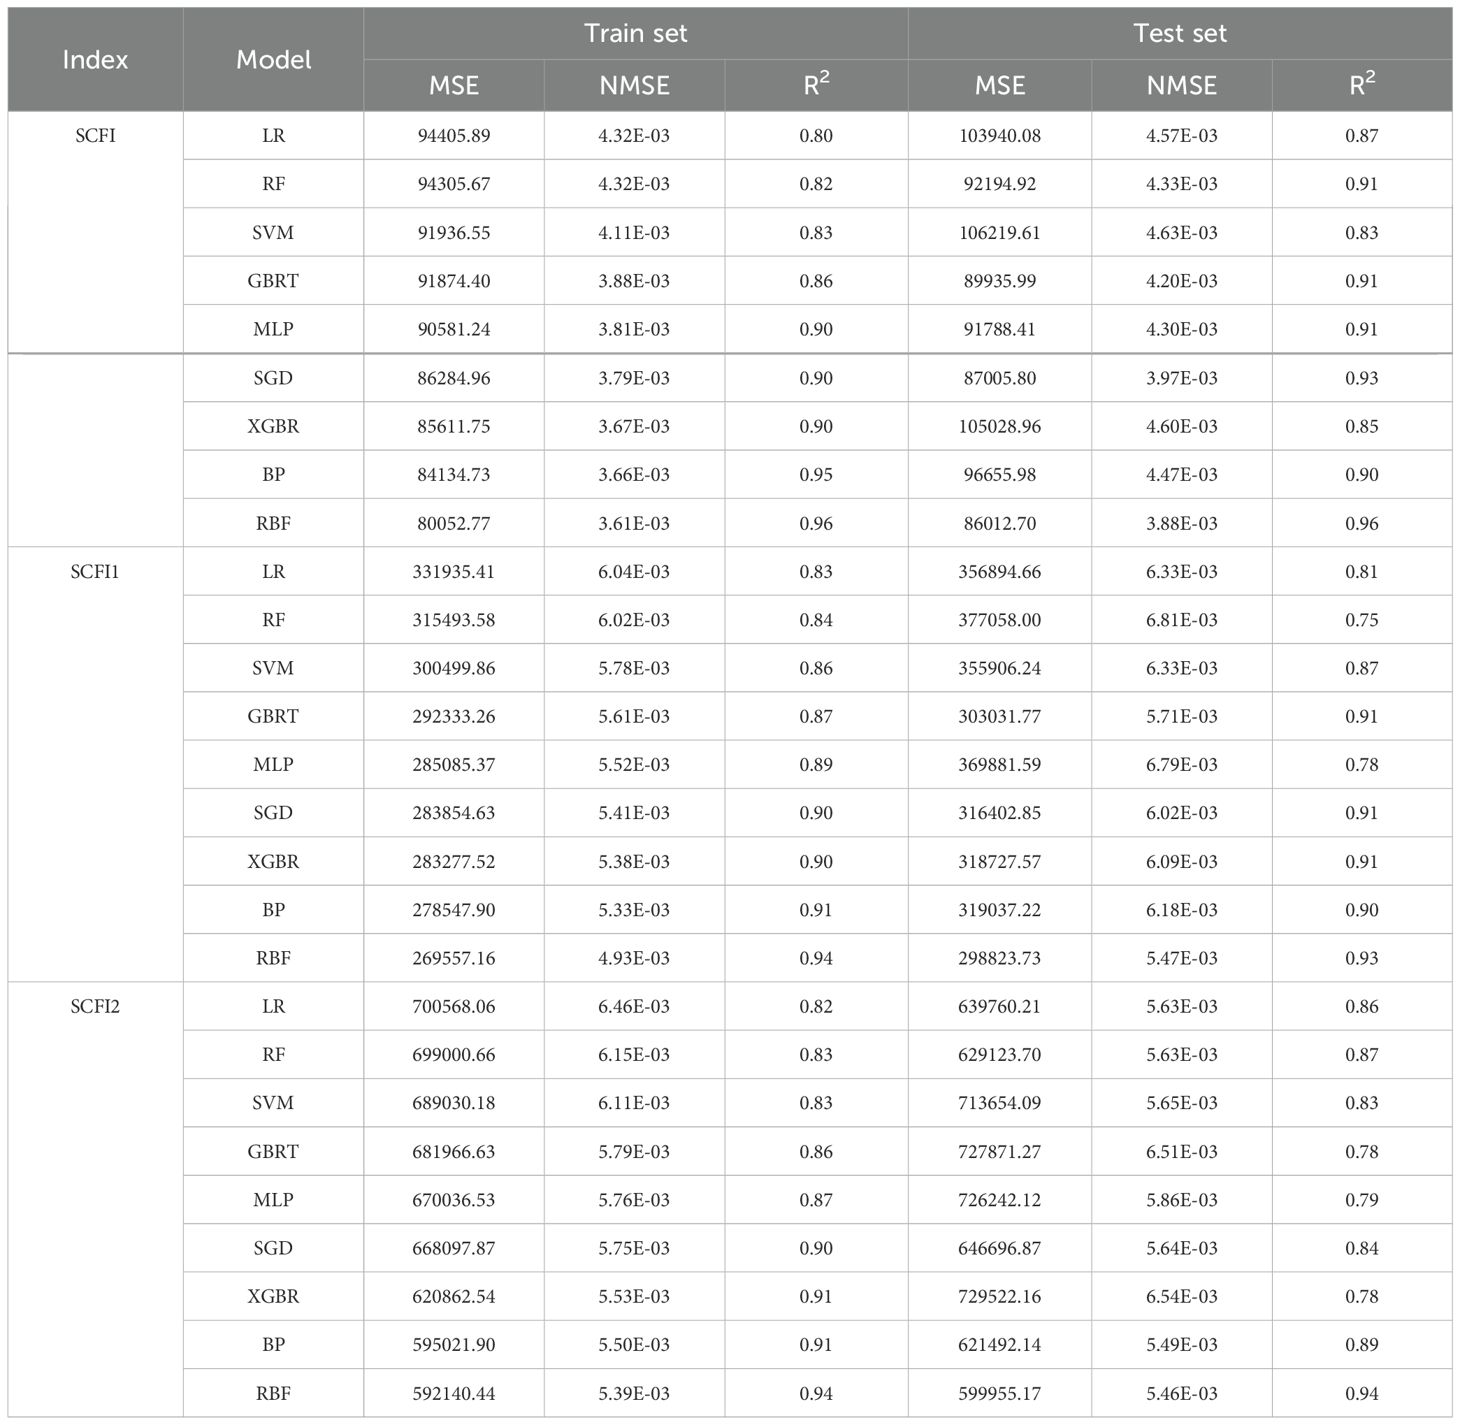
Table 4. Model performance comparison.
4.2 Transfer effect
Figure 10 depicts the change in SCFI for the two routes from Shanghai to the ports of Los Angeles and New York from 2016 to 2013. The figure shows that SCFI1 is substantially higher than SCFI2 over the entire period. Before 2016, the SCFI fluctuations of the two Shanghai-to-Los Angeles Long Beach Port and New York-Port routes were relatively minor. We considered them to have fluctuated around a particular value. In addition, the volatility tendencies of SCFI1 and SCFI2 are highly similar. Table 4 displays the variations in the maximum and minimum values of SCFI1 and SCFI2 around 2020. Figure 10 shows the location of two famous container ports (Los Angeles Container Port and New York Container Port) on the east and west coasts of the United States.
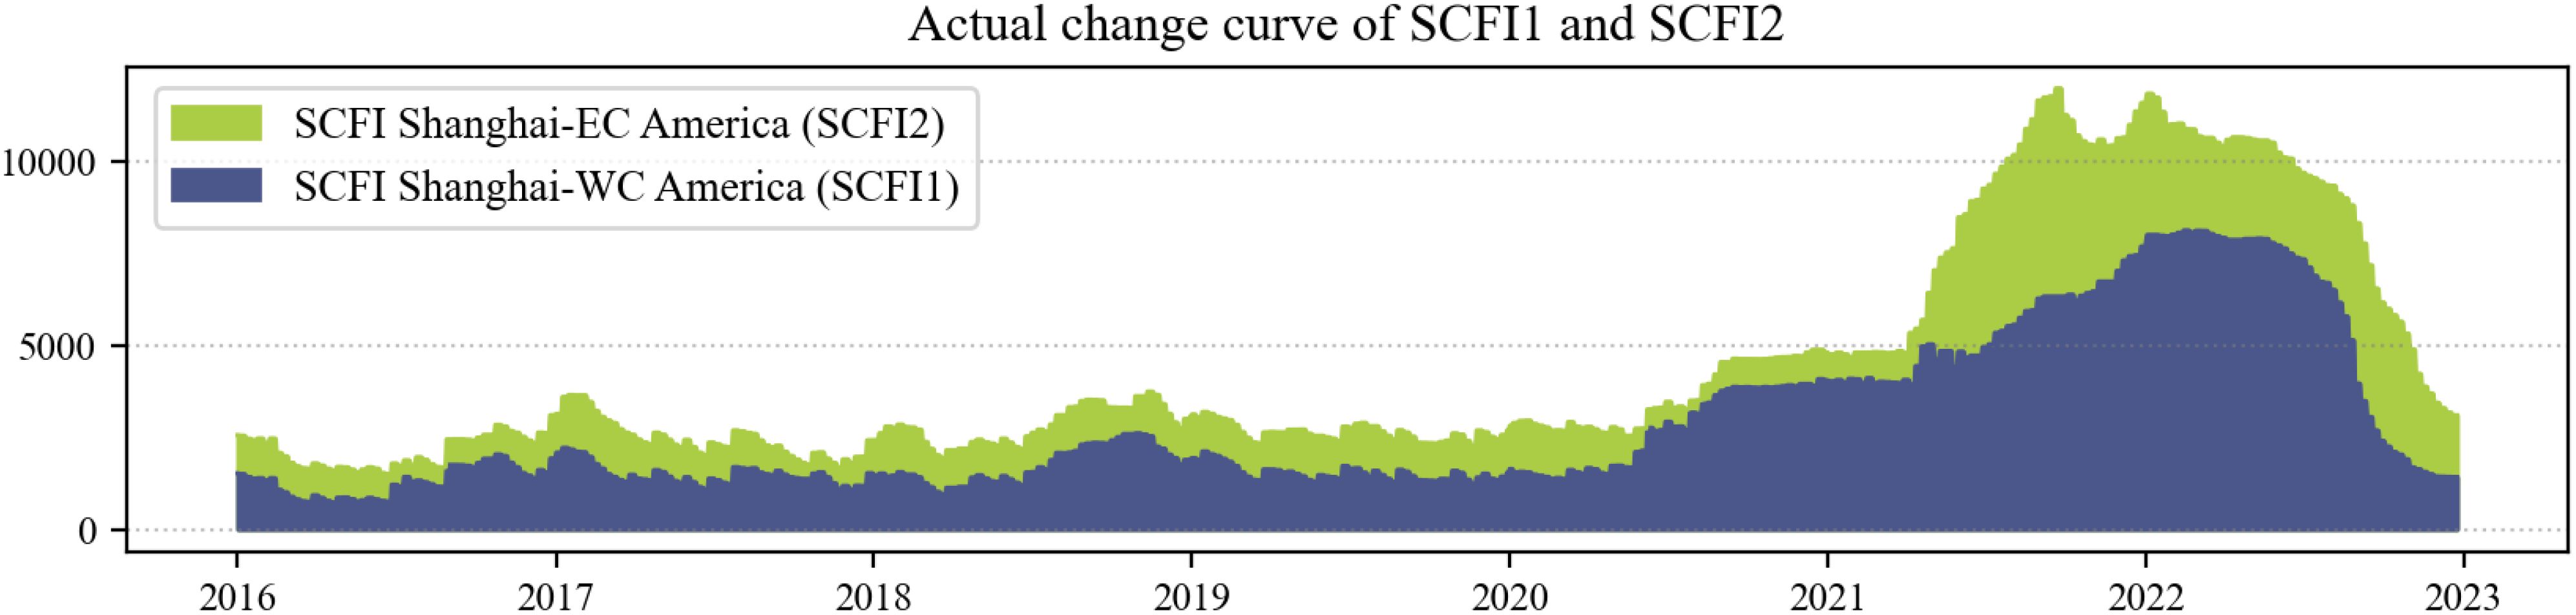
Figure 10. The actual change curve of SCFI1 and SCFI2.
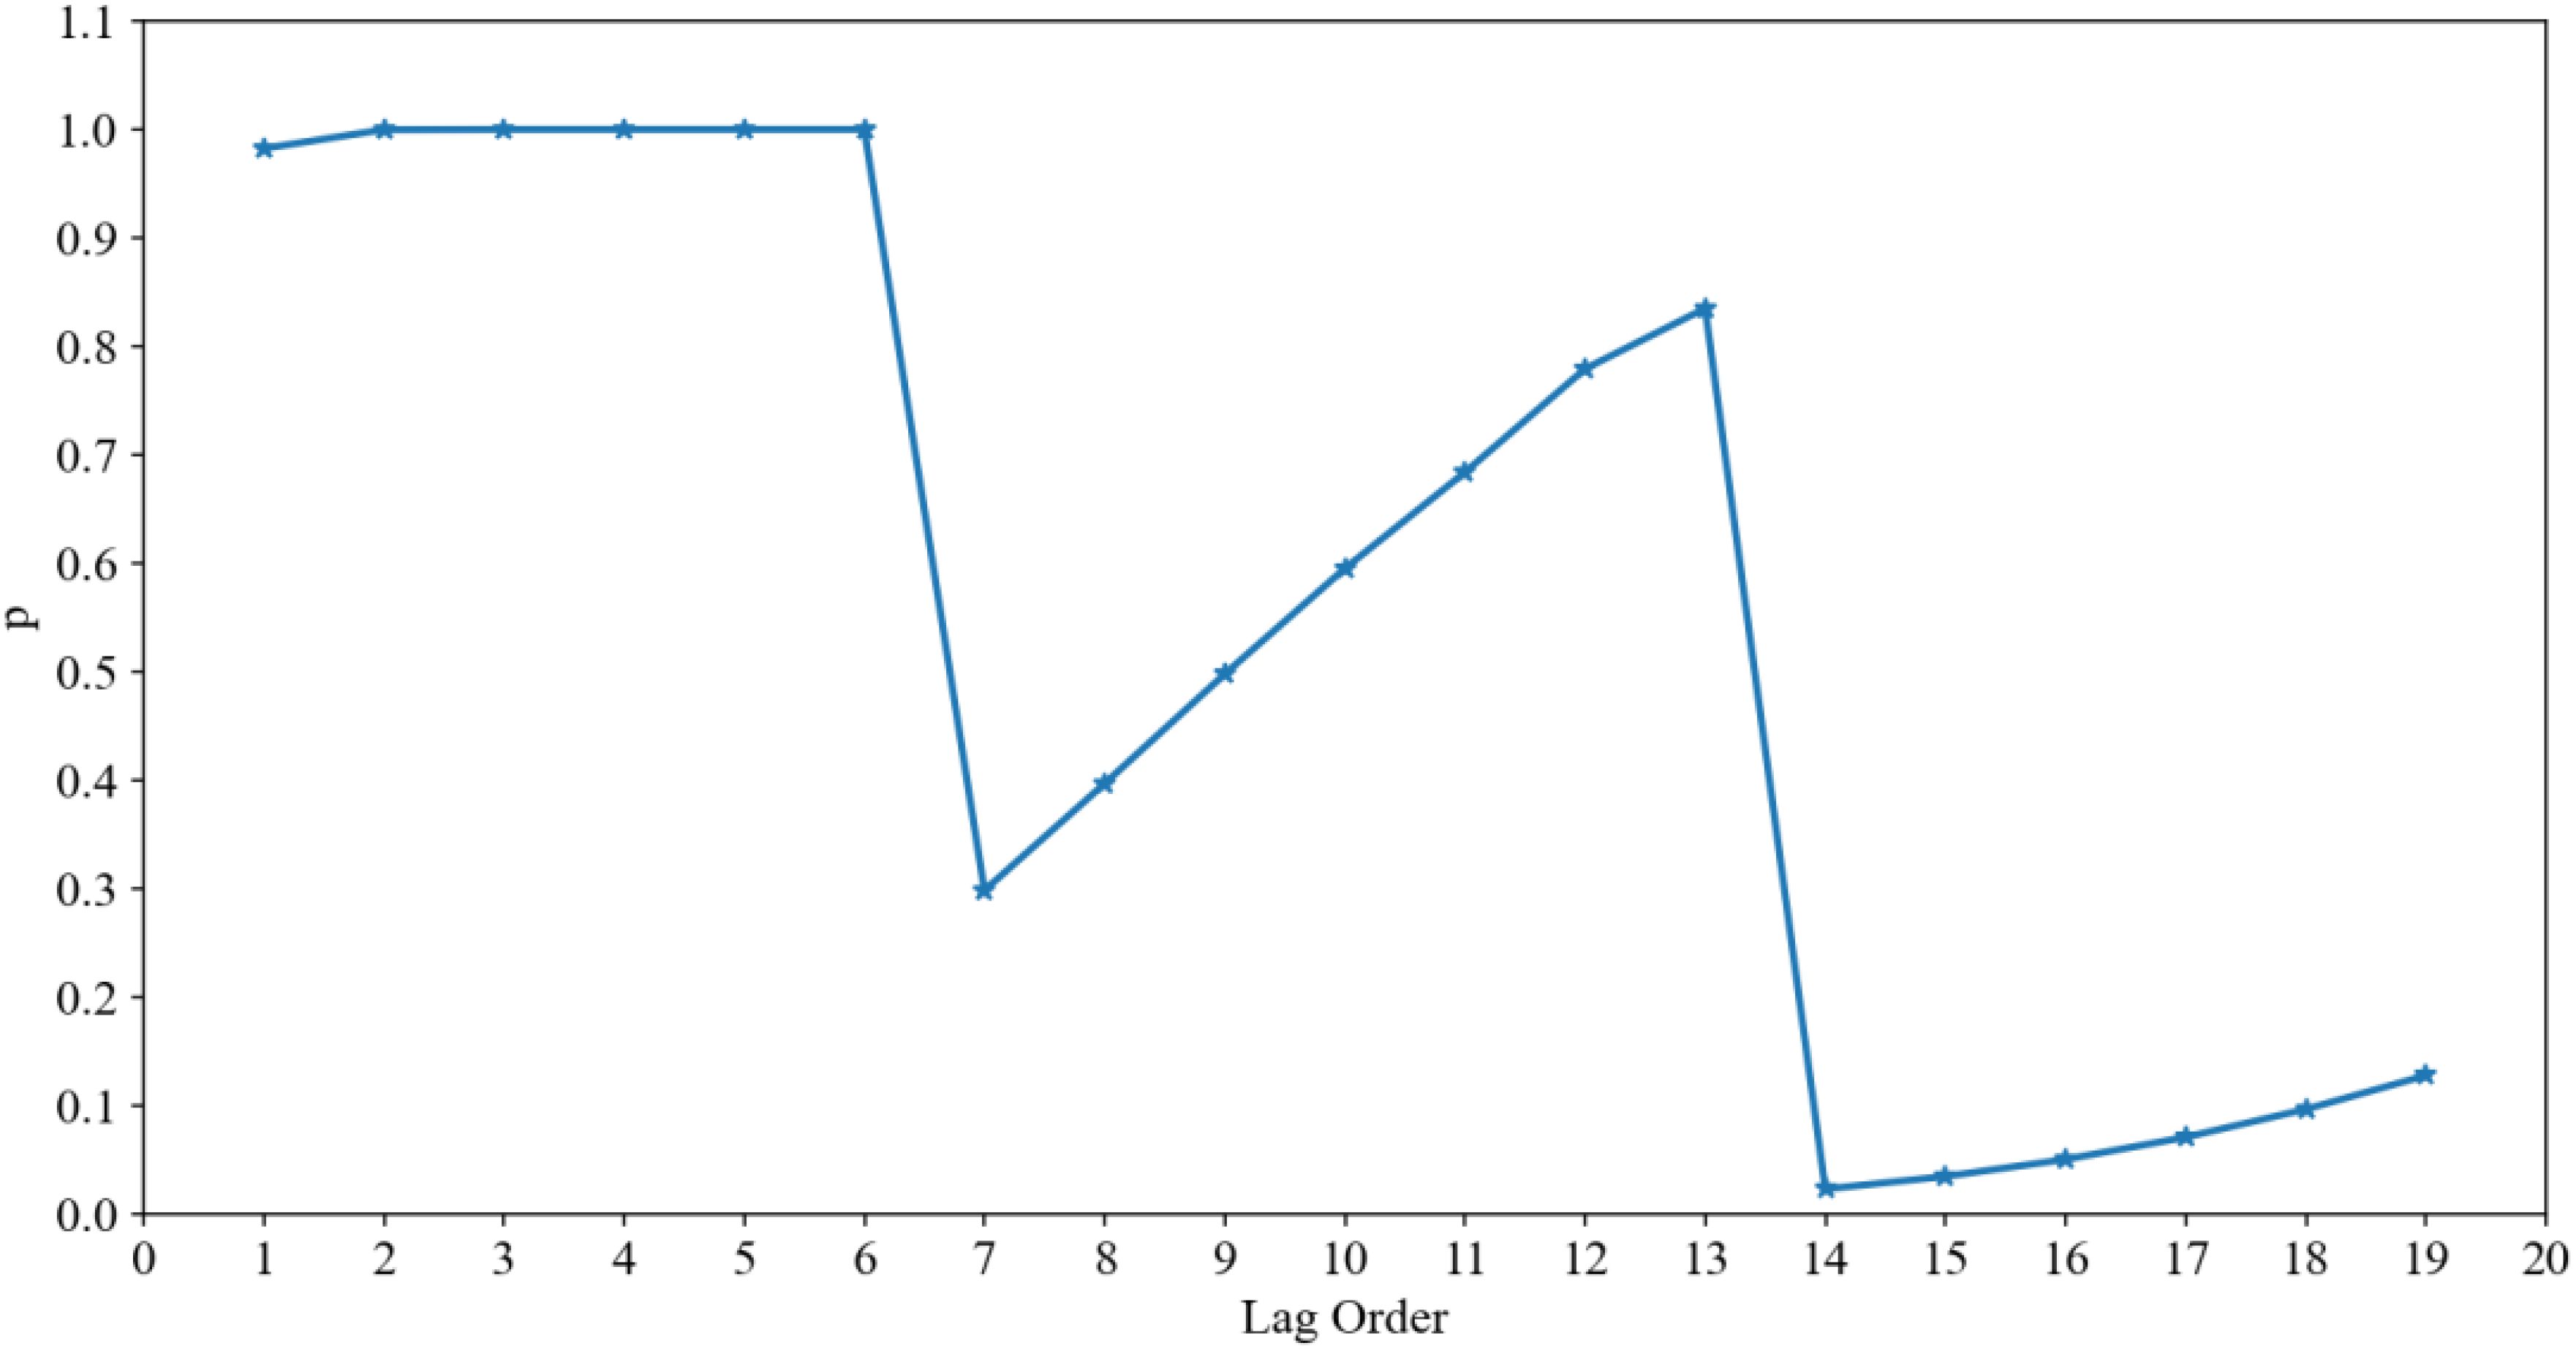
Figure 11. Granger causality results.
4.2.1 Time-lag correlation results
After 2020, SCFI1 and SCFI2 exhibited exponential mutation behavior owing to the pandemic. Between 2016 and 2020, the average value of SCFI1 increased from 2,500.83 to 6,861.56, or 2.74 times the initial value. Additionally, the utmost value of the SCIF1 index increased from 3,739 to 11,976, a 3.20-fold increase over the original. Similarly, between 2016 and 2020, the mean value of SCFI2 increased from 1,510.97 to 4,579.26, a 3.03-fold increase. Additionally, the most significant value of SCIF2 increased from 2,606 to 8,117, a 3.11-fold increase. Around 2020, SCFI1 and SCFI2 more than tripled. In addition, Figure 11 demonstrates that the level of synchronization between SCFI1 and SCFI2 was comparatively high before 2020. The changing trends of SCFI1 and SCFI2 are consistent after 2020, but there is a time-delayed effect (Table 5).
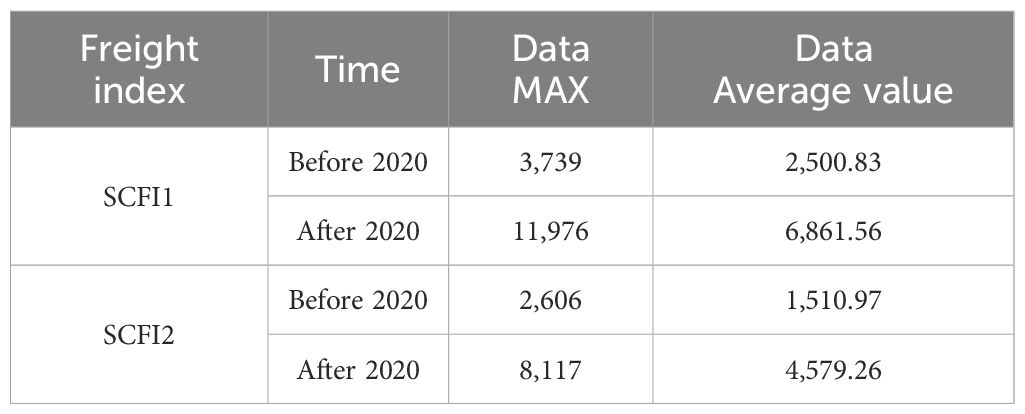
Table 5. Actual changes in SCFI1 and SCFI2.
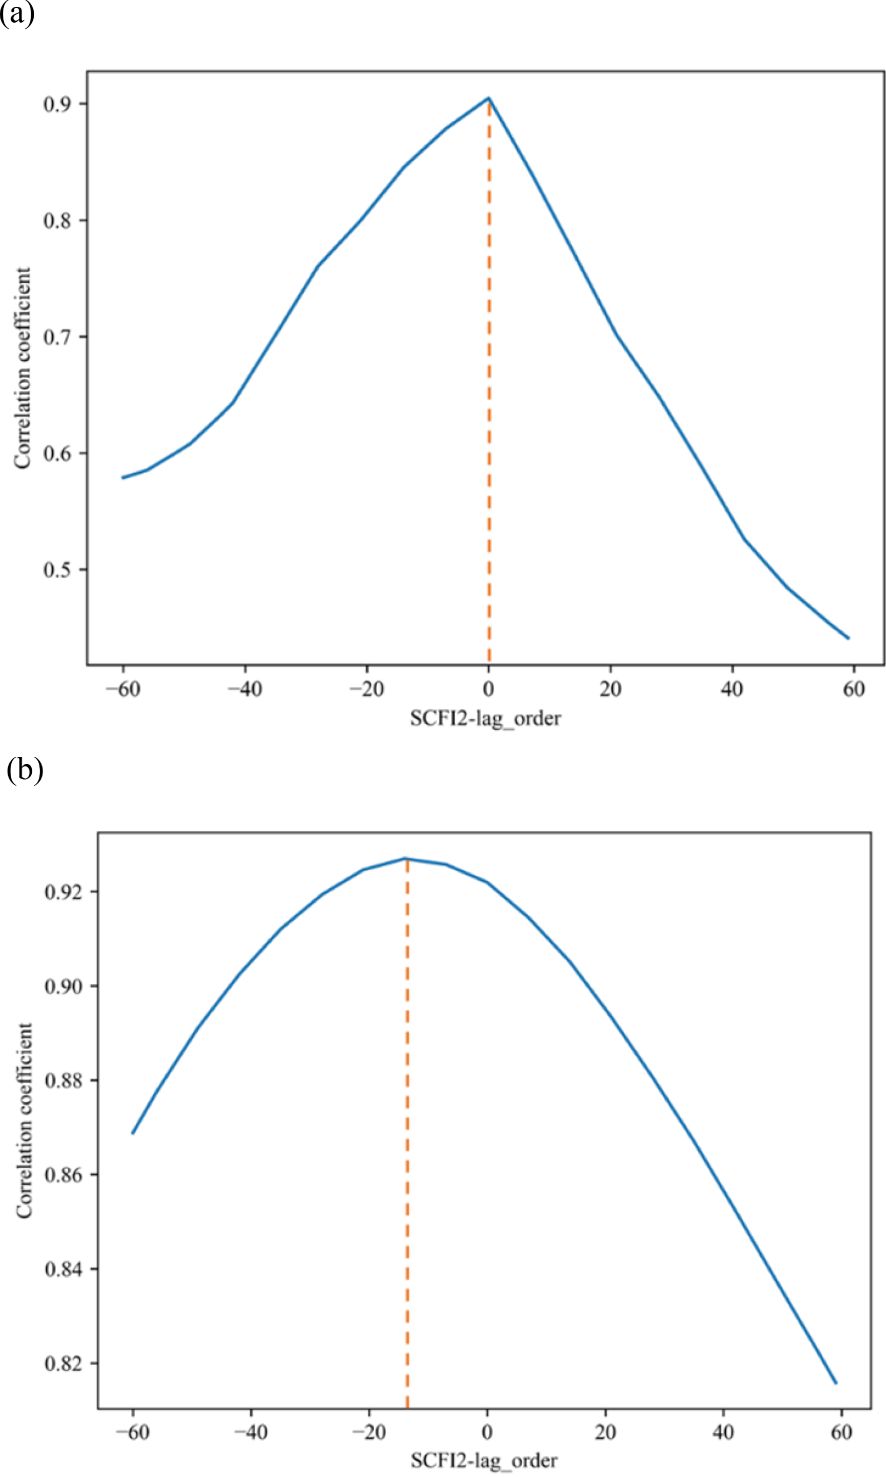
Figure 12. Time-lag correlation results for SCFI1 and SCFI2.
We examined the hysteresis effect of the SCFI indices of the two locations before and after 2020. We performed a lag correlation analysis on the SCFI1 and SCFI2 data before and after 2020 to confirm the time-lag relationship between SCFI1 and SCFI2 during a period of heavy congestion. This study divided the SCFI1 and SCFI2 data into two portions around 2020 and conducted a lag correlation analysis on the data in both groups. Figure 12 illustrates the correlation between the hysteresis correlation coefficient and the hysteresis order between SCFI1 and SCFI2 for the two periods surrounding 2020. Figure 12a demonstrates that when the lag days between SCFI1 and SCFI2 are 0 before 2020, the correlation of the SCFI index of the two ports is at its maximum level of 0.9, indicating that the SCFI of the two ports is highly correlated. After 2020, there is still a substantial correlation between SCFI1 and SCFI2, as shown in Figure 12b. The correlation coefficient between SCFI1 and SCFI2 attained its maximum value of 0.925 when SCFI1 data lagged by −14 days, i.e., when SCFI1 data were 14 days ahead of SCFI2 data.
4.2.2 Granger causality results
To further demonstrate the causal connection between the two indices, a Granger causality test was conducted. The Granger test requires a stationary time series. Therefore, this investigation conducted an ADF test to determine the stationarity of SCFI1 and SCFI2 (Enders, 2008). The ADF statistic for the variable SCFI1 is -1.513 and the p-value is 0.527. As the p-value exceeds the 0.05 significance level, the null hypothesis cannot be rejected. Consequently, SCFI1 is not stationary. The ADF statistic for the variable SCFI2 is -1.189, and the p-value is 0.678%. In addition, because the p-value exceeds 0.05, the null hypothesis cannot be rejected. Consequently, SCFI2 is not stationary. The ADF statistic for the variable SCFI1(-1), which is the first difference of SCFI1, is -3.566, and the p-value is 0.006. In this instance, the p-value is less than 0.05, allowing us to reject the null hypothesis. Consequently, SCFI1(-1) is stationary. The ADF statistic for the variable SCFI2(-1), which is the first difference of SCFI2, is -3.960, and the p-value is 0.002. Similarly, the p-value is less than 0.05, allowing us to reject the null hypothesis. That is, SCFI2(-1) is is stationary (Table 6).
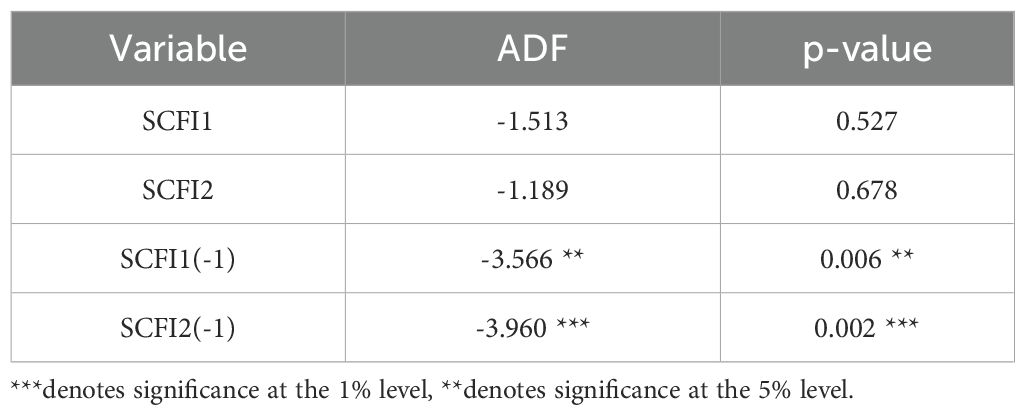
Table 6. Unit root test.
In conclusion, the ADF test indicates that the variables SCFI1 and SCFI2 are not stationary. However, their initial differences SCFI1(-1) and SCFI2(-1) are stationary. According to the results of the lagged correlation analysis, the variables SCFI1 and SCFI2 had the highest correlation When SCFI2 was lagged by 14 days. The maximal lag order is therefore set to 20 and the Granger test is conducted on the first-order difference data of SCFI1 and SCFI2. As depicted in the figures results of Granger indicate, when the delayed order of SCFI2 is 14, the first-order difference sequence of SCFI1 and SCFI2 has a causal relationship. F=1.8976, p=0.0231<0.05 is the smallest among all orders. When the delayed order is 15, F = 1.7662 and p = 0.0347<0.05. However, the results are significantly more significant if the delayed order is 14. This result is consistent with the lagged correlation coefficient test results (Figure 11).
5 Discussion and conclusion
The impact of port congestion on the freight market has caught the industry’s attention. This study developed the RBF neural network model to predict the dynamic changes in the transportation market in a container port congestion environment. This study modeled and predicted SCFI using congestion data from the Shanghai, Busan, New York, and Los Angeles ports. Its objective is to enhance the dependability and consistency of maritime transport system, thus tackling the issues caused by overcrowding in the freight market and guaranteeing durability of worldwide supply chains. This study quantified the predictive influence of container port congestion on the composite index SCFI. It also quantified the predictive impact of container terminal congestion on SCFI1 and SCFI2. The study’s findings indicate that the index of container port congestion can explain and predict future changes in container transportation rates. We also used hysteresis correlation analysis to investigate the “transfer effect” of SCFI1 and SCFI2 freight rates during periods of severe port congestion. Specifically, shifts in SCFI1 and SCFI2 lagged during significant port congestion. During periods of extreme congestion, changes in SCFI2 always follow changes in SCFI1 and follow the same trend of change. Typically, this time-lag relationship occurs after 14 days. This result indicates that there will be a “transfer effect” of SCFI over time between highly correlated routes during periods of severe market fluctuations, particularly periods of significant port congestion.
5.1 Theoretical contributions
This study makes multiple contributions. First, container transportation is one of the most rapidly expanding segments of the global shipping industry (Jiang et al., 2017), contributing hundreds of billions of dollars to the global economy annually and boosting nations’ gross domestic product. Notably, container transportation is a volatile industry susceptible to fluctuations in business cycles and freight rates (Luo et al., 2009). However, there are few empirical and modeling studies on freight volatility. Many methods focus on the research of forecasting container trade volume or port throughput. This research included a freight rate forecast and trend analysis of SCFI. Therefore, this study contributes to forming a body of knowledge about container shipping freight rates.
Second, congestion is a widespread issue in various industries and is particularly significant in container transportation logistics. However, the literature has focused more on land and air freight congestion than container transport. Few studies have quantified port congestion impacts on shipping economics (Hirata and Matsuda, 2022). In addition, port congestion and its effect on the economics of the container transportation market is a relatively unexplored area of study. Our research can function as pilot research in this regard. For instance, discovered that port congestion affects LPG seaborne trade freight rates. Similar to previous findings, our results confirm that congestion at container ports has the same effect on SCFI. Therefore, this study casts light on the impact of port congestion on container freight rates and provides a method for predicting the shifting direction of SCFI. Our research also contributes to developing an interdisciplinary body of scientific knowledge regarding port congestion and shipping economics.
Third, as the availability of large datasets and predictive algorithms increases, machine learning is acquiring popularity in the maritime economy. However, container freight rate analysis has not extensively used deep learning algorithms. Munim and Schramm (2017) accurately determined container shipping freight rates using the ARIMA model in the existing literature. In addition, Koyuncu and Tavacioğlu (2021) examined container freight rates using conventional econometric models. Although we concur with the findings of these studies in container freight rate forecasting, we have some reservations. Container freight indices time series are highly complex, irregular, stochastic, and non-linear. Traditional econometric models cannot attain acceptable accuracy in forecasting. This study successfully used the RBF neural network to develop a model with a high degree of accuracy. Therefore, this research contributes to developing the machine learning knowledge system in container shipping price prediction.
Lastly, our research reveals a “transferring effect” of SCFI in the context of port congestion. Previous research indicated that container port congestion would extend over time across multiple dimensions, including time, space, and facilities (Xu et al., 2021). In other words, congestion at one port creates a domino effect of congestion at the next port (Jiang et al., 2017). Similar to the “knocking effect” between ports, this study also discovered a “transfer effect” between container route SCFI during port congestion. In other words, our findings identified and quantified the effect of SCFI transfer between container lines during port congestion. This perspective, based on the principles of reliability engineering and system stability, provides a thorough comprehension of the complex dynamics within the container shipping freight system during difficult circumstances.
5.2 Management contributions
Our research also provides policymakers with management recommendations, giving governments, carriers, freight forwarders, and shippers improved predictive models for container freight rate volatility management. Amid port congestion, decision-makers can rely on container freight rate forecasts to make business decisions. First, the results of this study’s container freight rate forecast are significant for shipowners. During periods of high port congestion, shipowners can make regular judgments regarding the sale, purchase, and chartering of ships based on predicted trends in container freight rates. According to this study’s results, shipowners can determine the optimal time to purchase, sell, or lease vessels and enhance corporate performance.
Second, based on the rare occurrence of significant port congestion, this study’s findings can assist the shipping industry in observing changes in a shipping market experiencing a unique crisis. It can serve as a reference for vessel planning and revenue management. Further, this study can assist container transportation companies in making swift and lucid decisions in the face of “rare events” and recouping economic losses. Specifically, container shipping companies can rapidly avoid risks in situations such as freight rate fluctuations. With increasing freight rates, management can seize the opportunity and win unsustainable market dividends after the “rare event” period.
Third, when the uncommon occurrence of significant congestion occurs, the long-term port congestion in Shanghai, Busan, Los Angeles, and New York container ports reduces the market’s tonnage supply and impacts port operations’ competitiveness. The findings of this study provide port operations decision-makers with management insights. When the SCFI of highly correlated routes demonstrates an upward trend, port decision-makers must establish a coordination mechanism between ports based on the “transfer effect” of the SCFI of the routes. In addition, decision-makers should collaborate with ports in the same region to maximize the utilization of inactive port berth resources. According to the results of freight rate prediction models, port managers can rapidly organize the port’s available resources and constantly prepare for the possibility of congestion in the future.
Finally, the findings of this study provide a premise for decision-making to assist government agencies in implementing reasonable and practical emergency measures in response to such infrequent port congestion events. To address the issues of fluctuating freight rates and port congestion, the government should actively promote the development of port infrastructure. Based on the results of freight rate forecasts and the SCFI “transfer effect,” government organizations can issue risk alerts in advance. Government agencies must be able to provide complete protection programs to shield container transport companies from market demand shifts precipitated by freight rate fluctuations and reduce the impact of container transportation market instability on the local economy.
6 Limitation and future research
Although this study provides stakeholders in the container transportation industry with a solid foundation for decision-making, it has certain limitations. First, we began by developing predictive models of SCFI using limited congestion data. However, given that the global container transport system is highly interconnected, the limited port congestion data may differ from the predicted results. Therefore, we will acquire additional congestion data to incorporate into the model. Second, the integrated model may have superior fitting performance despite the RBF neural network being an excellent deep-learning model. Future research must establish additional comparison models to enhance the effect of fit.
Data availability statement
The original contributions presented in the study are included in the article/supplementary material, further inquiries can be directed to the corresponding author/s.
Author contributions
MS: Conceptualization, Data curation, Formal analysis, Funding acquisition, Investigation, Methodology, Project administration, Resources, Supervision, Validation, Writing – original draft, Writing – review & editing. SB: Conceptualization, Data curation, Formal analysis, Funding acquisition, Writing – original draft. KP: Data curation, Formal analysis, Funding acquisition, Investigation, Methodology, Resources, Visualization, Writing – original draft, Writing – review & editing.
Funding
The author(s) declare that financial support was received for the research and/or publication of this article. This work was supported by Jungseok Logistics Foundation.
Conflict of interest
The authors declare that the research was conducted in the absence of any commercial or financial relationships that could be construed as a potential conflict of interest.
Generative AI statement
The author(s) declare that no Generative AI was used in the creation of this manuscript.
Publisher’s note
All claims expressed in this article are solely those of the authors and do not necessarily represent those of their affiliated organizations, or those of the publisher, the editors and the reviewers. Any product that may be evaluated in this article, or claim that may be made by its manufacturer, is not guaranteed or endorsed by the publisher.
References
Adland R., Cullinane K. (2006). The non–linear dynamics of spot freight rates in tanker markets. Transportation Res. Part E: Logistics Transportation Rev. 42, 211–224. doi: 10.1016/j.tre.2004.12.001
Adumene S., Khan F., Adedigba S., Zendehboudi S. (2021). Offshore system safety and reliability considering microbial influenced multiple failure modes and their interdependencies. Reliability Eng. System Saf. 215, 107862. doi: 10.1016/j.ress.2021.107862
Afshari S. S., Enayatollahi F., Xu X., Liang X. (2022). Machine learning-based methods in structural reliability analysis: A review. Reliability Eng. System Saf. 219, 108223. doi: 10.1016/j.ress.2021.108223
Arreola Hernandez J., Al Janabi M. A., Hammoudeh S., Khuong Nguyen D. (2015). Time lag dependence, cross-correlation and risk analysis of U.S. energy and non-energy stock portfolios. J. Asset Manage. 16, 467–483. doi: 10.1057/jam.2015.33
Asteris M., Collins A., Jones D. F. (2012). Container port infrastructure in north-west Europe: Policy-level modeling. J. Policy Modeling 34, 312–324. doi: 10.1016/j.jpolmod.2012.01.004
Bai X., Ma Z., Zhou Y. (2023). Data-driven static and dynamic resilience assessment of the global liner shipping network. Transportation Res. Part E: Logistics Transportation Rev. 170, 103016. doi: 10.1016/j.tre.2023.103016
Batchelor R., Alizadeh A., Visvikis I. (2007). Forecasting spot and forward prices in the international freight market. Int. J. Forecasting 23, 101–114. doi: 10.1016/j.ijforecast.2006.07.004
Berle Ø., Asbjørnslett B. E., Rice J. B. (2011). Formal vulnerability assessment of a maritime transportation system. Reliability Eng. System Saf. 96, 696–705. doi: 10.1016/j.ress.2010.12.011
Carrier A. J., Carve M., Shimeta J., Walker T. R., Zhang X., Oakes K. D., et al. (2023). Transitioning towards environmentally benign marine antifouling coatings. Front. Mar. Sci. 10, 1175270. doi: 10.3389/fmars.2023.1175270
Chen D. (2017). Research on traffic flow prediction in the big data environment based on the improved RBF neural network. IEEE Trans. Ind. Inf. 13, 2000–2008. doi: 10.1109/TII.2017.2682855
Chen Y., Liu B., Wang T. (2021). Analysing and forecasting China containerized freight index with a hybrid decomposition–ensemble method based on EMD, grey wave and ARMA. Grey Systems: Theory Appl. 11, 358–371. doi: 10.1108/GS-05-2020-0069
Chen S., Meersman H., Voorde E. V. D. (2012). Forecasting spot rates at main routes in the dry bulk market. Maritime Economics Logistics 14, 498–537. doi: 10.1057/mel.2012.18
Cullinane K., Mason K., Cape M. (1999). A comparison of models for forecasting the Baltic freight index: Box-Jenkins revisited. Int. J. Maritime Economics 1, 15–39. doi: 10.1057/ijme.1999.10
Dong M., Zhang Z., Liu Y., Zhao D. F., Meng Y., Shi J. (2023). Playing Bayesian Stackelberg game model for optimizing the vulnerability level of security incident system in petrochemical plants. Reliability Eng. System Saf. 235, 109237. doi: 10.1016/j.ress.2023.109237
Duru O. (2010). A fuzzy integrated logical forecasting model for dry bulk shipping index forecasting: An improved fuzzy time series approach. Expert Syst. Appl. 37, 5372–5380. doi: 10.1016/j.eswa.2010.01.019
Eslami P., Jung K., Lee D., Tjolleng A. (2017). Predicting tanker freight rates using parsimonious variables and a hybrid artificial neural network with an adaptive genetic algorithm. Maritime Economics Logistics 19, 538–550. doi: 10.1057/mel.2016.1
Fan L., Wilson W. W., Dahl B. (2012). Congestion, port expansion and spatial competition for U.S. container imports. Transportation Res. Part E: Logistics Transportation Rev. 48, 1121–1136. doi: 10.1016/j.tre.2012.04.006
Fung M. K., Cheng L. K., Qiu L. D. (2003). The impact of terminal handling charges on overall shipping charges: an empirical study. Transportation Res. Part A: Policy Pract. 37, 703–716. doi: 10.1016/S0965-8564(03)00026-0
Guerrero D., Letrouit L., Pais–Montes C. (2022). The container transport system during Covid–19: An analysis through the prism of complex networks. Transport Policy 115, 113–125. doi: 10.1016/j.tranpol.2021.10.021
Gui D., Wang H., Yu M. (2022). Risk assessment of port congestion risk during the COVID-19 pandemic. J. Mar. Sci. Eng. 10, 150. doi: 10.3390/jmse10020150
Guo L., Ng A. K., Jiang C., Long J. (2021). Stepwise capacity integration in port cluster under uncertainty and congestion. Transport Policy 112, 94–113. doi: 10.1016/j.tranpol.2021.08.011
Han L., Wan L., Xu Y. (2020). Can the Baltic Dry Index predict foreign exchange rates? Finance Res. Lett. 32, 101157. doi: 10.1016/j.frl.2019.04.014
Han Q., Yan B., Ning G., Yu B. (2014). Forecasting dry bulk freight index with improved SVM. Math. Problems Eng. doi: 10.1155/2014/460684
Hirata E., Matsuda T. (2022). Forecasting Shanghai Container Freight Index: A deep-learning-based model experiment. J. Mar. Sci. Eng. 10, 593. doi: 10.3390/jmse10050593
Huang L., Tan Y., Guan X. (2022). Hub-and-spoke network design for container shipping considering disruption and congestion in the post-COVID-19 era. Ocean Coast. Manage. 225, 106230. doi: 10.1016/j.ocecoaman.2022.106230
Jeon J.-W., Duru O., Yeo G.-T. (2020). Modelling cyclic container freight index using system dynamics. Maritime Policy Manage. 47, 287–303. doi: 10.1080/03088839.2019.1708984
Jia H., Adland R., Prakash V., Smith T. (2017). Energy efficiency with the application of virtual arrival policy. Transportation Res. Part D: Transport Environ. 54, 50–60. doi: 10.1016/j.trd.2017.04.037
Jiang C., Wan Y., Zhang A. (2017). Internalization of port congestion: strategic effect behind shipping line delays and implications for terminal charges and investment. Maritime Policy Manage. 44, 112–130. doi: 10.1080/03088839.2016.1237783
Kamal I. M., Bae H., Sunghyun S., Yun H. (2020). DERN: Deep ensemble learning model for short- and long-term prediction of Baltic Dry Index. Appl. Sci. 10, 1504. doi: 10.3390/app10041504
Katris C., Kavussanos M. G. (2021). Time series forecasting methods for the Baltic Dry Index. J. Forecasting 40, 1540–1565. doi: 10.1002/for.v40.8
Ke G. Y., Li K. W., Hipel K. W. (2012). An integrated multiple criteria preference ranking approach to the Canadian west coast port congestion conflict. Expert Syst. Appl. 39, 9181–9190. doi: 10.1016/j.eswa.2012.02.086
Koyuncu K., Tavacioğlu L. (2021). Forecasting Shanghai containerized freight index by using time series models. Mar. Sci. Technol. Bull. 10, 426–434. doi: 10.33714/masteb.1024663
Leachman R. C., Jula P. (2011). Congestion analysis of waterborne, containerized imports from Asia to the United States. Transportation Res. Part E: Logistics Transportation Rev. 47, 992–1004. doi: 10.1016/j.tre.2011.05.010
Lee T. C., Chang Y. T., Lee P. T. (2013). Economy-wide impact analysis of a carbon tax on international container shipping. Transportation Res. Part A: Policy Pract. 58, 87–102. doi: 10.1016/j.tra.2013.10.002
Leonov Y., Nikolov V. (2012). A wavelet and neural network model for the prediction of dry bulk shipping indices. Maritime Economics Logistics 14, 319–333. doi: 10.1057/mel.2012.10
Li W., Asadabadi A., Miller–Hooks E. (2022). Enhancing resilience through port coalitions in maritime freight networks. Transportation Res. Part A: Policy Pract. 157, 1–23. doi: 10.1016/j.tra.2022.01.015
Li J., Parsons M. G. (1997). Forecasting tanker freight rate using neural networks. Maritime Policy Manage. 24, 9–30. doi: 10.1080/03088839700000053
Lin H., Zeng W., Luo J., Nan G. (2022). An analysis of port congestion alleviation strategy based on system dynamics. Ocean Coast. Manage. 229, 106336. doi: 10.1016/j.ocecoaman.2022.106336
Liu Y., Ning C., Zhang Q., Yuan G., Li C. (2024). Research on ocean buoy attitude prediction model based on multi-dimensional feature fusion. Front. Mar. Sci. 11, 1517170. doi: 10.3389/fmars.2024.1517170
Luo M., Fan L., Liu L. (2009). An econometric analysis for container shipping market. Maritime Policy Manage. 36, 507–523. doi: 10.1080/03088830903346061
Ma R., Zheng X., Wang P., Liu H., Zhang C. (2021). The prediction and analysis of COVID-19 epidemic trend by combining LSTM and Markov method. Sci. Rep. 11, 17421. doi: 10.1038/s41598-021-97037-5
Ma X., Zhang L., Xu W., Li M. (2024). AB-LSTM: a mesoscale eddy feature prediction method based on an improved Conv-LSTM model. Front. Mar. Sci. 11, 1463531.
Mondello G., Salomone R., Saija G., Lanuzza F., Gulotta T. M. (2023). Life Cycle Assessment and Life Cycle Costing for assessing maritime transport: a comprehensive literature review. Maritime Policy Manage. 50, 198–218. doi: 10.1080/03088839.2021.1972486
Montes C. P., Seoane M. J. F., Laxe F. G. (2012). General cargo and containership emergent routes: A complex networks description. Transport Policy 24, 126–140. doi: 10.1016/j.tranpol.2012.06.022
Munim Z. H., Schramm H.–J. (2017). Forecasting container shipping freight rates for the Far East–Northern Europe trade lane. Maritime Economics Logistics 19, 106–125. doi: 10.1057/s41278-016-0051-7
Nielsen P., Jiang L., Rytter N. G. M., Chen G. (2014). An investigation of forecast horizon and observation fits influence on an econometric rate forecast model in the liner shipping industry. Maritime Policy Manage. 41, 667–682. doi: 10.1080/03088839.2014.960499
Orrell D., McSharry P. (2009). System economics: Overcoming the pitfalls of forecasting models via a multidisciplinary approach. Int. J. Forecasting 25, 734–743. doi: 10.1016/j.ijforecast.2009.05.002
Peng W., Bai X., Yang D., Yuen K. F., Wu J. (2022). A deep learning approach for port congestion estimation and prediction. Maritime Policy Manage., 1–26.
Rahman S. A., Adjeroh D. A. (2019). Deep learning using convolutional LSTM estimates biological age from physical activity. Sci. Rep. 9, 11425. doi: 10.1038/s41598-019-46850-0
Regan A. C., Golob T. F. (2000). Trucking industry perceptions of congestion problems and potential solutions in maritime intermodal operations in California. Transportation Res. Part A: Policy Pract. 34, 587–605. doi: 10.1016/S0965-8564(99)00042-7
Saeed N., Nguyen S., Cullinane K., Gekara V., Chhetri P. (2023). Forecasting container freight rates using the Prophet forecasting method. Transport Policy 133, 86–107. doi: 10.1016/j.tranpol.2023.01.012
Schramm H.-J., Munim Z. H. (2021). Container freight rate forecasting with improved accuracy by integrating soft facts from practitioners. Res. Transportation Business Manage. 41, 100662. doi: 10.1016/j.rtbm.2021.100662
Shen J., Ren X., Feng Z., Nie J. (2025). The impact of public environmental concerns on port sustainability: evidence from 44 port cities in China. Front. Mar. Sci. 11, 1454242.
Shi X., Jiang H., Li H., Wang Y. (2020). Upgrading port-originated maritime clusters: Insights from Shanghais experience. Transport Policy 87, 19–32. doi: 10.1016/j.tranpol.2019.11.002
Shoorkand H. D., Nourelfath M., Hajji A. (2024). A hybrid CNN-LSTM model for joint optimization of production and imperfect predictive maintenance planning. Reliability Eng. System Saf. 241, 109707. doi: 10.1016/j.ress.2023.109707
Shuaibu U. (2019). The Economic Impact of Low Sulphur Compliance on Future Fuel Cost and Container Freight Rates: A Case Study of Shanghai–Lagos (World Maritime World University), 1121.
Sirshar M., Paracha M. F. K., Akram M. U., Alghamdi N. S., Zaidi S. Z. Y., Fatima T. (2022). Attention based automated radiology report generation using CNN and LSTM. PloS One 17, e0262209. doi: 10.1371/journal.pone.0262209
Steinbach S. (2022). Port congestion, container shortages and U.S. foreign trade. Economics Lett. 213, 110392. doi: 10.1016/j.econlet.2022.110392
Talley W. K., Ng M. (2016). Port multi-service congestion. Transportation Res. Part E: Logistics Transportation Rev. 94, 66–70. doi: 10.1016/j.tre.2016.07.005
Tao S., Du L., Li J. (2024). Data mining-based machine learning methods for improving hydrological data: a case study of salinity field in the Western Arctic Ocean. Front. Mar. Sci. 11, 1490548. doi: 10.3389/fmars.2024.1490548
Tasdelen A., Sen B. (2021). A hybrid CNN-LSTM model for pre-miRNA classification. Sci. Rep. 11, 14125. doi: 10.1038/s41598-021-93656-0
Tavakoli S., Khojasteh D., Haghani M., Hirdaris S. (2023). A review of the progress and research directions of ocean engineering. Ocean Eng. 272, 113617. doi: 10.1016/j.oceaneng.2023.113617
Tongzon J. L. (2009). Port choice and freight forwarders. Transportation Res. Part E: Logistics Transportation Rev. 45, 186–195. doi: 10.1016/j.tre.2008.02.004
Vega L., Cantillo V., Arellana J. (2019). Assessing the impact of major infrastructure projects on port choice decision: The Colombian case. Transportation Res. Part A: Policy Pract. 120, 132–148. doi: 10.1016/j.tra.2018.12.021
Wang T., Tian X., Wang Y. (2020). Container slot allocation and dynamic pricing of time-sensitive cargoes considering port congestion and uncertain demand. Transportation Res. Part E: Logistics Transportation Rev. 144, 102149. doi: 10.1016/j.tre.2020.102149
Wang Q., Zhang H., Huang J., Zhang P. (2023). The use of alternative fuels for maritime decarbonization: Special marine environmental risks and solutions from an international law perspective. Front. Mar. Sci. 9, 1082453. doi: 10.3389/fmars.2022.1082453
Weimar–Rasmussen H. (2010). Econometric Modeling and Forecasting of Container Freight Rates. Department of Business Studies, Aarhus School of Business, University of Aarhus.
Wu D., Yu C., Zhao Y., Guo J. (2024). Changes in vulnerability of global container shipping networks before and after the COVID-19 pandemic. J. Transport Geogr. 114, 103783. doi: 10.1016/j.jtrangeo.2023.103783
Xiao W., Xu C., Liu H., Liu X. (2021). A hybrid LSTM-based ensemble learning approach for China coastal bulk coal freight index prediction. J. Advanced Transportation 2021, 1–23. doi: 10.1155/2021/5573650
Xu W. (2021). Research on Shanghai export Container Freight Index Fluctuation Based on Arma-Garch-X model (World Maritime University), 1622.
Xu Y., Kohtz S., Boakye J., Gardoni P., Wang P. (2023). Physics-informed machine learning for reliability and systems safety applications: State of the art and challenges. Reliability Eng. System Saf. 230, 108900. doi: 10.1016/j.ress.2022.108900
Xu B., Li J., Liu X., Yang Y. (2021). System dynamics analysis for the governance measures against container port congestion. IEEE Access 9, 13612–13623. doi: 10.1109/ACCESS.2021.3049967
Yang H., Dong F., Ogandaga M. (2008). “Forewarning of freight rate in shipping market based on support vector machine,” in Traffic and Transportation Studies, Aarhus, Denmark 295–303.
Yang D., Wu L., Wang S., Jia H., Li K. X. (2019). How big data enriches maritime research–A critical review of Automatic Identification System (AIS) data applications. Transport Rev. 39, 755–773. doi: 10.1080/01441647.2019.1649315
Yuan C. (2014). Study on Volatility of China Containerized Freight Index Based on GARCH Family Model (World Maritime University).
Zhang X., Chen M., Wang M., Ge Y., Stanley H. E. (2019). A novel hybrid approach to Baltic Dry Index forecasting based on a combined dynamic fluctuation network and artificial intelligence method. Appl. Mathematics Comput. 361, 499–516. doi: 10.1016/j.amc.2019.05.043
Zhang X., Xue T., Stanley H. E. (2018). Comparison of econometric models and artificial neural networks algorithms for the prediction of Baltic Dry Index. IEEE Access 7, 1647–1657. doi: 10.1109/ACCESS.2018.2884877
Zhu F., Ye F., Fu Y., Liu Q., Shen B. (2019). Electrocardiogram generation with a bidirectional LSTM-CNN generative adversarial network. Sci. Rep. 9, 6734. doi: 10.1038/s41598-019-42516-z
Zou W., Yang Y., Yang M., Zhang X., Lai S., Chen H. (2023). Analyzing efficiency measurement and influencing factors of Chinas marine green economy: Based on a two-stage network DEA model. Front. Mar. Sci. 10, 1020373. doi: 10.3389/fmars.2023.1020373
Appendix List of Abbreviations Used in the Study.
Keywords: container transportation, container freight index, container freight rate, shanghai container freight index, RBF neural network
Citation: Su M, Bae S-H and Park K-s (2025) Port congestion and container freight rate dynamics: forecasting with an RBF neural network. Front. Mar. Sci. 12:1545471. doi: 10.3389/fmars.2025.1545471
Received: 15 December 2024; Accepted: 20 March 2025;
Published: 11 April 2025.
Edited by:
Tsz Leung Yip, Hong Kong Polytechnic University, ChinaCopyright © 2025 Su, Bae and Park. This is an open-access article distributed under the terms of the Creative Commons Attribution License (CC BY). The use, distribution or reproduction in other forums is permitted, provided the original author(s) and the copyright owner(s) are credited and that the original publication in this journal is cited, in accordance with accepted academic practice. No use, distribution or reproduction is permitted which does not comply with these terms.
*Correspondence: Keun-sik Park, cGtzaWswMzcxQGRhbmtvb2suYWMua3I=
†These authors share first authorship
‡ORCID: Miao Su, orcid.org/0000-0003-3370-1391
Sung-Hoon Bae, orcid.org/0000-0002-7853-9933
Keun-sik Park, orcid.org/0000-0003-0858-9860