Abstract
The thermal structure of tropical reef systems is shaped by air-sea interactions, turbulent mixing, and subsurface-driven processes, yet their complex dynamics and interactions are not well understood. This study uses in situ observations and global model outputs to investigate the modulation of subsurface ocean properties by wind-driven Ekman transport, turbulent overturning, and semidiurnal temperature fluctuations, along a 70 km-long reef island coastline. Easterly trade winds prevailed for 80% of the year, during which coastal downwelling was favorable along the majority of the leeward coastline, with significant sub-island scale variability. In the surface Ekman layer, coastal downwelling and surface turbulent mixing modulated subsurface warming and mixed layer deepening. During periods of weaker winds, near-surface waters were less turbulent and buoyancy fluxes allowed for restratification. At all times, turbulence and mixing were intensified below the Ekman layer, and isopycnal depths were episodically modulated at semidiurnal frequency. On the reef, temperatures responded to Ekman transport and also varied at sub-inertial time-scales, specifically at semidiurnal frequencies. On the 60 m-deep reefs, semidiurnal temperature fluctuations drove cooling by up to 4°C. Wind and internally driven subsurface turbulence further stimulated vertical fluxes of heat and mass, relevant to local biophysical responses. This work reinforces the need to analyze the dynamic processes that regulate the subsurface biophysical structure in tropical island ecosystems.
1 Introduction
Tropical island reef ecosystems are threatened by heat accumulation in warming oceans (Leahy et al., 2013; Hughes et al., 2017; Wyatt et al., 2020). The upwelling of cooler waters onto the coral reefs at shallow (< 30 m) and mesophotic (30−150 m) depths can provide intermittent and cumulative cooling (Storlazzi et al., 2020; McWhorter et al., 2022; Tavakoli-Kolour et al., 2023). Wind-driven coastal up- and downwelling and air-sea exchanges can dominate near-surface temperature variability (Leahy et al., 2013; McGowan et al., 2022; Salois et al., 2022). Whereas reef islands forced by steady winds are typically generating both upwelling on the windward side and downwelling on the leeward coast by interacting with the Ekman layer, reaching a steady-state within the local inertial period (Spall and Pedlosky, 2013; Kämpf et al., 2023; Farmanara et al., 2018). Wind forcing at time-scales shorter than the inertial period in the near-surface can modulate upper ocean stratification and is herein referred to as sub-inertial forcing. Associated responses on the vertical diffusive transport of heat, mass, and oxygen, which in turn can affect the steady-state Ekman transport (Esters et al., 2018; Gunn et al., 2021; Wenegrat and McPhaden, 2016). Below the Ekman layer, barotropic and baroclinic tides can also influence temperature variability and mixing at periodic frequencies (Storlazzi et al., 2020; Guillaume-Castel et al., 2021). Here, we examine wind-driven coastal upwelling and turbulent mixing to understand spatial variability and key processes influencing heat accumulation at mesophotic depths in a tropical island reef ecosystem.
Through the displacement of waters in the surface Ekman layer, wind fields with a component parallel to the coastline can drive up- or downwelling, the upward transport of deep cool waters or downward sink of surface warm waters, respectively (Bakun, 1973; Jacox et al., 2018). In the northern hemisphere, a steady easterly wind field would be expected to induce an upwelling system on the eastern or windward coast and a downwelling system on the western or leeward side of an island, reaching a steady-state within the local inertial period (Salois et al., 2022; Kämpf et al., 2023; Farmanara et al., 2018). Along a reef island coastline, inhomogeneous responses to steady wind forcing can occur due to orientation, length, or stratification configuration (Jacox et al., 2018; Kämpf et al., 2023; Salois et al., 2022). Coastline orientation respective to the primary wind field dictates the proportion of positive or negative cross-shore Ekman transport, respectively (Bakun, 1973; Jacox et al., 2018).
Wind stress at the ocean surface can generate small-scale shear instabilities and wave breaking, dissipating turbulent kinetic energy and mixing water properties through vertical diffusion (Sutherland et al., 2014; Esters et al., 2018; Giunta and Ward, 2022). The vertical diffusive fluxes of heat and mass driven by small-scale turbulence regulate oxygen and nutrients transport, influencing biophysical interactions in the coastal ocean (Gunn et al., 2021; Sheehan et al., 2023; Zhuang et al., 2021; Becherer et al., 2022). Wind-driven turbulent mixing can directly impact near-surface processes at the local or sub-island scale, as well as at sub-inertial forcing frequencies (Sutherland et al., 2014; Esters et al., 2018; Giunta and Ward, 2022). Both Ekman transport and turbulent mixing control the depth of the surface mixed layer and the strength of the stratification in the thermocline below (Vijith et al., 2016; Sohail et al., 2020). Sub island-scale distribution of wind-driven coastal upwelling and turbulent mixing could be influential in the spatial patterns of heat accumulation at mesophotic depths (Stewart, 2008).
Localized subsurface cooling of reef ecosystems has been generally attributed to large temperature fluctuations from short-term cold water intrusions driven by internal waves (Galland et al., 2019; Wyatt et al., 2020; Guillaume-Castel et al., 2021). Internal baroclinic waves at tidal frequencies, internal tides, are generated as the radiation of stratified fluid oscillations caused by barotropic tide interactions on sloping topography (de Lavergne et al., 2019). Shoaling mechanisms and turbulent breaking can upwell cold, nutrient-rich waters onto the continental shelf and coral reefs as cold water pulses at diurnal and sub-diurnal frequencies (Sevadjian et al., 2012; Lamb, 2014; Woodson, 2017; Guillaume-Castel et al., 2021). Here, the sampling does not allow for the differentiation between barotropic and baroclinic tides, thus, we refer to their combined regulation of temperature fluctuations on reef ecosystems as “semidiurnal temperature fluctuations”, following the approach in Storlazzi et al. (2020).
In the South Caribbean Sea, the “ABC” island group comprises Aruba, Bonaire, and Curaçao. The observations presented here were from the latter, a ∼ 70 km-long reef island. The regional shallow-water structure is a 0−50m atmospheric-affected top layer, above the 50−250 m-deep relatively warm > 15°C and salty > 36 g kg−1 Subtropical Underwater (Gallegos, 1996). The island lies in an easterly trade winds field, intensified above the Caribbean Sea into the Caribbean Low Level Jet, peaking to 13ms−1 during the summer months (Wang, 2007). The wind field sets up a west-northwestward surface Caribbean current, overlying the eastward Caribbean Coastal Undercurrent, centered at ∼ 200m (Andrade et al., 2003). The steady easterly wind field would also be expected to induce an upwelling system on the eastern windward coast and a downwelling system on the western leeward side (Spall and Pedlosky, 2013; Kämpf et al., 2023). Temperatures on the reef along the depth gradient have been monitored intermittently by the Caribbean Research and Management of Biodiversity (CARMABI) since 2013, in 0.5−2.5 km-wide bays [see Section 5, and Bongaerts et al. (2015)]. The spatiotemporal variability of downwelling-favorable winds along the leeward Curaçao coast has not, as far as the authors are aware, been examined, nor the role of reef warming or cooling at mesophotic depths.
In this article, we used in situ observations and global model outputs to investigate the independent roles and interactions of wind and internal processes on subsurface ocean properties and dynamics. Specifically, (1) what is the subsurface response to the trade winds at the island scale? (2) Does wind-driven turbulence regulate local mixing and stratification? (3) What are the subsurface cooling patterns associated with semidiurnal temperature fluctuations? (4) How does each process influence cooling and warming along the reef island coastline? Datasets and methods are provided in Section 2. The wind-driven Ekman transport configuration, the reef temperature variability, and the vertical structure of seawater properties, stratification, and turbulent mixing are detailed in Section 3. The research questions above are discussed in Sections 4.1−4.4.
2 Methods
Two types of in situ oceanographic data were collected on the leeward side of Curaçao. They were: (1) temperature loggers deployed on the reef in 5−60 m depths over a 12-month period, and (2) vessel-based Conductivity-Temperature-Depth (CTD) profiles down to maximum water depths of 200 m over a 20-day sampling period. The long-term data were used to evaluate the temporal temperature trends at each depth and contextualize the high-resolution oceanographic profiling. Ancillary data from satellite observations and global model products were used to contextualize the field observations.
2.1 Field observations
2.1.1 Reef-mounted temperature loggers
In total, 33 HOBO (Onset Computer Corporation) temperature loggers were deployed from May 2022 to April 2023 by CARMABI divers as part of a long-term monitoring program (see Section 5), down the depth gradient: 5, 10, 20, 40, and 60m depths, at seven sites on the leeward side of Curaçao (Figure 1). Data from the 5m loggers at stations Boka Hulu and Water Factory were not recovered. Temperature data were recorded at 1 sample per 15 min, with data at the beginning and end of the deployment removed. Time-series are interpolated into filled contours using the 2014 ContourPy Matplotlib algorithm. In order to differentiate between observations of temperature in the water column from the CTD profiles (see following section) and the long-term temperature data from the reef-mounted HOBO loggers, herein, the logger data are referred to as “reef temperatures”.
Figure 1
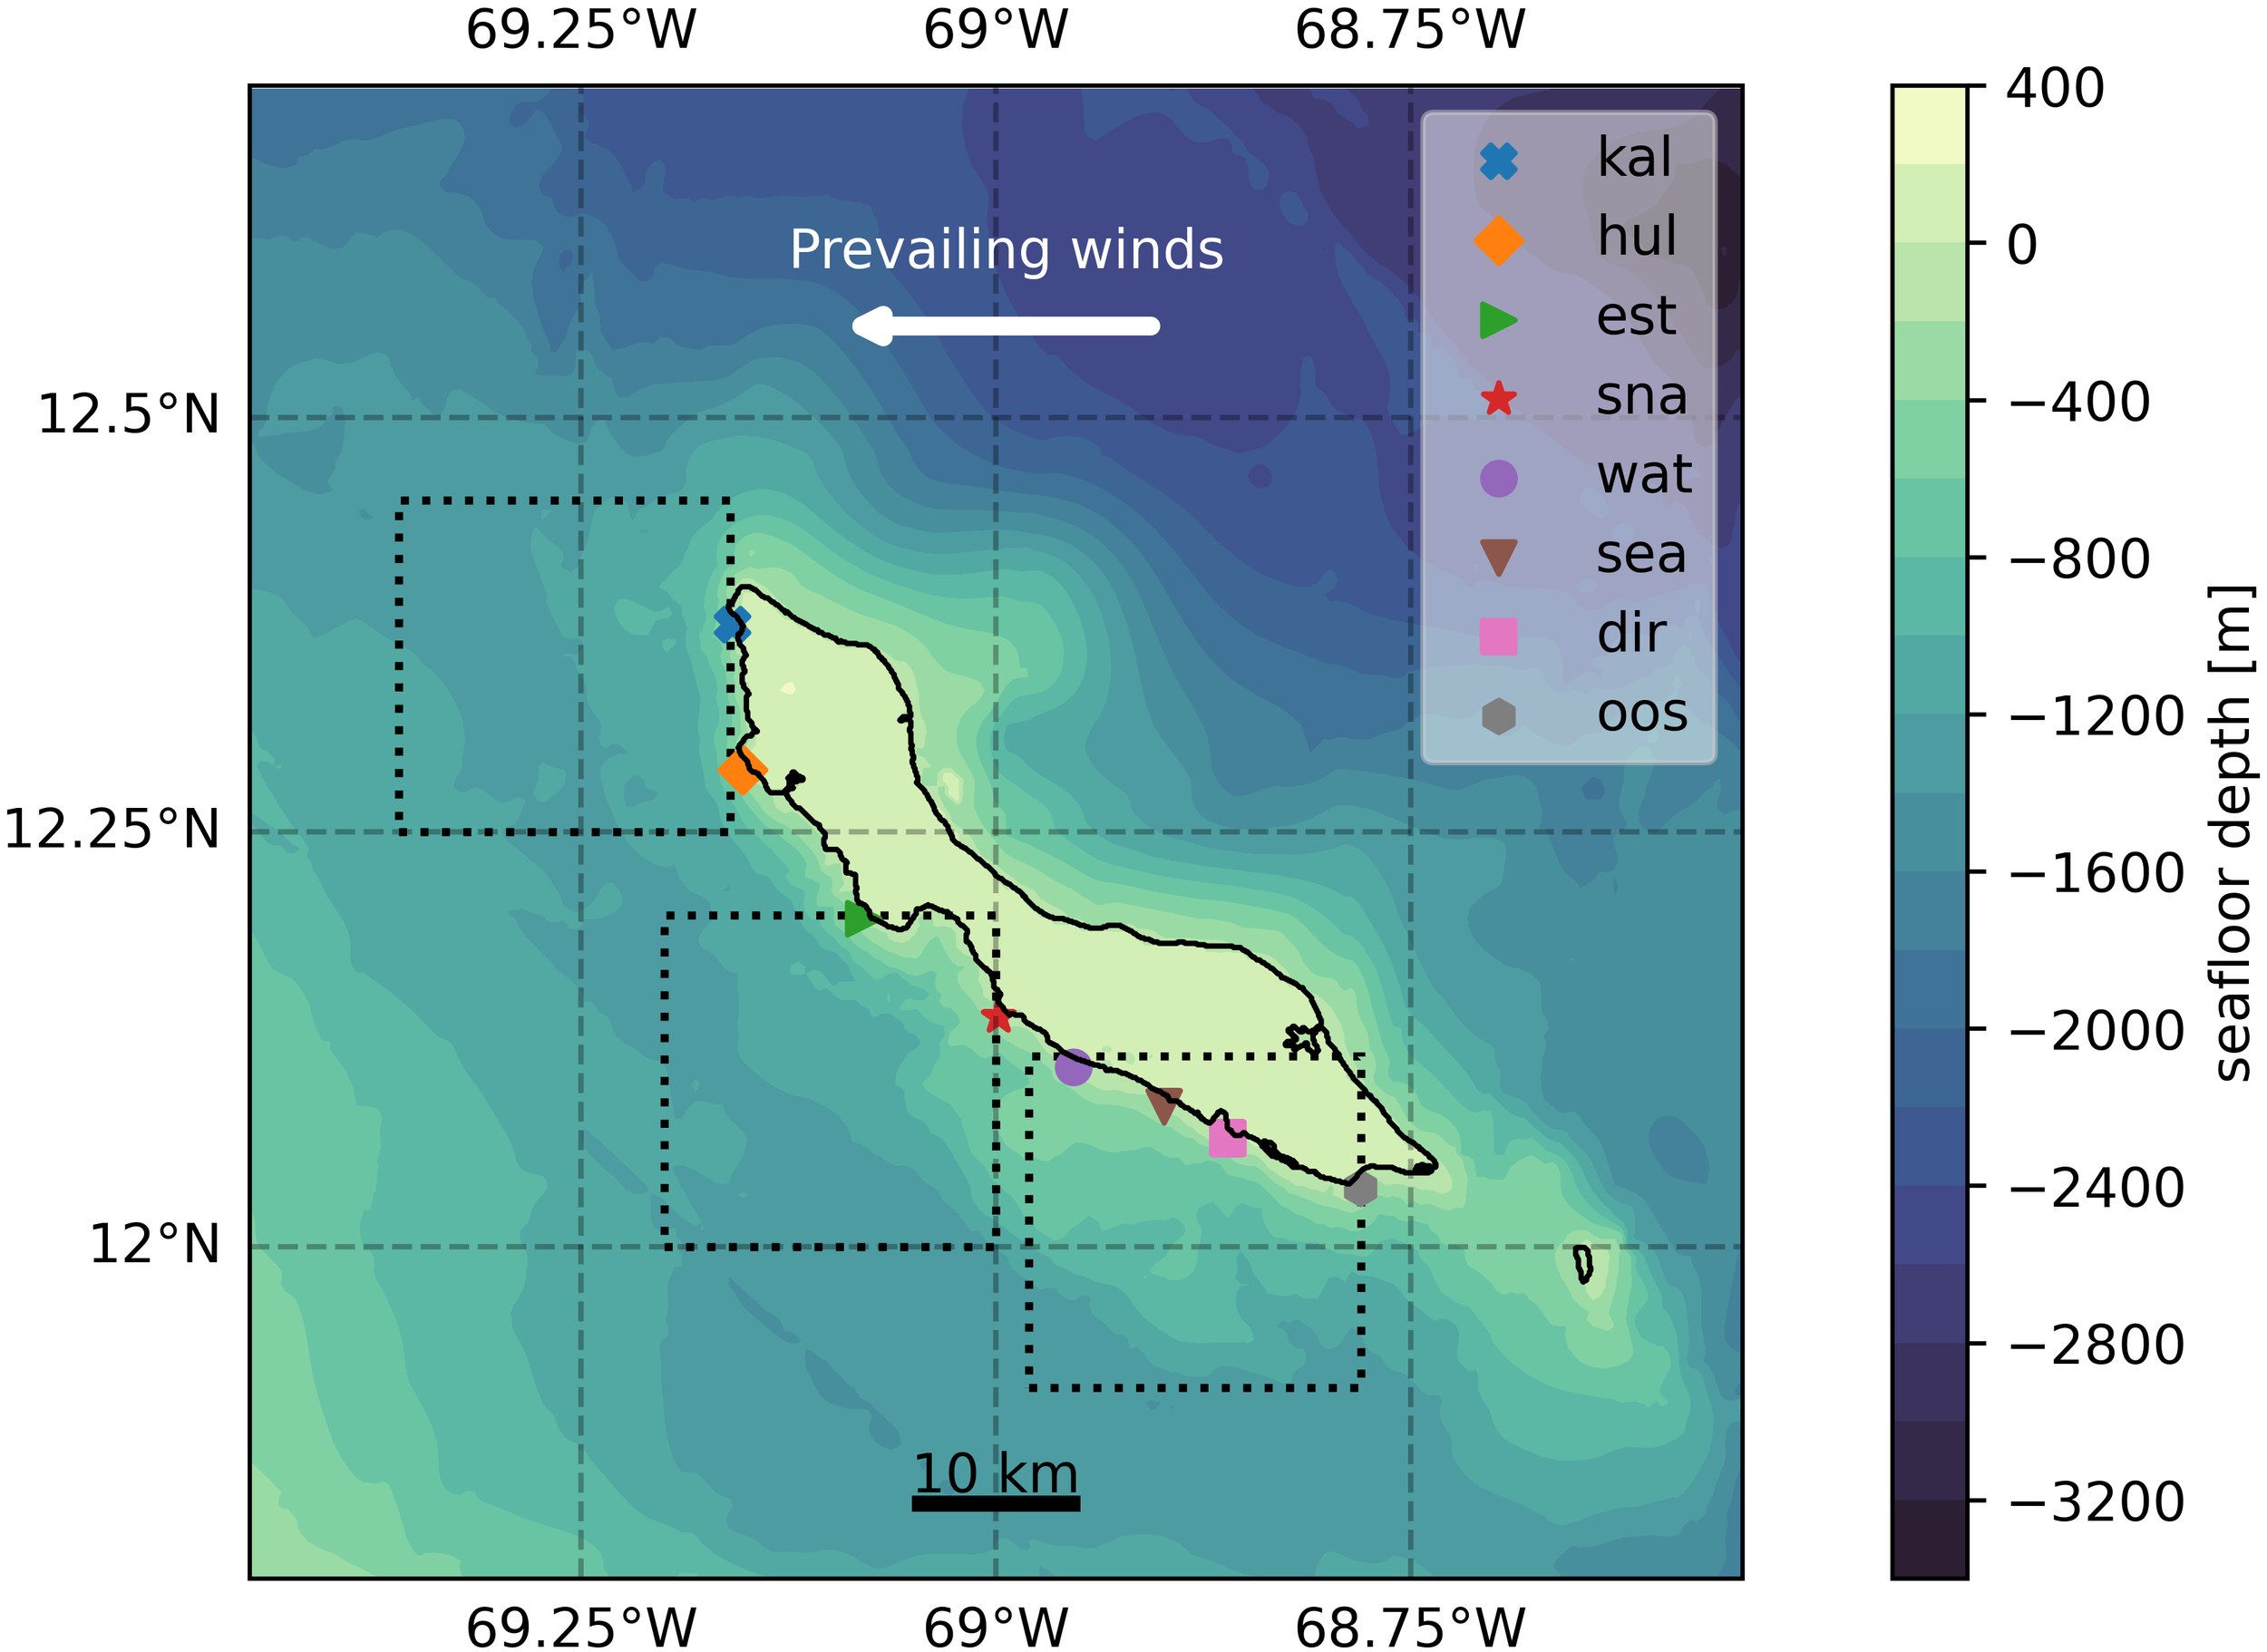
Map of Curaçao with seafloor depth filled contours (GEBCO 2024 Grid, Ince et al. (2024)]. Temperature logger stations were Playa Kalki (kal), Boka Hulu (hul), Coral Estate (est), Snake Bay (sna), Water Factory (wat), Substation Reef (wat), Director’s Bay (dir), and Oostpunt (oos). The black dotted boxes show the northwest, central, and southeast regions for spatial averages of wind and surface currents. CTD observations were collected within 500 m of the temperature logger stations and considered co-located with the colored cross markers. The prevailing wind direction is indicated with a white arrow.
2.1.2 Vessel-based CTD profiling
CTD profiles were collected at five sites from 12−25 April 2023 (Valcarcel and O’Callaghan, 2024). An RBRconcerto³ C.T.D instrument (RBR) equipped with dissolved oxygen (DO) profiled the water column using an electric fishing reel. The sampling sites were offshore from the fringing reef, within 500 m of the long-term temperature logger sites: Playa Kalki, Boka Hulu, Coral Estate, Director’s Bay, and Oostpunt.
In order to evaluate subsurface variations with regard to wind-driven processes along the island length, CTD observations were compared with spatially averaged wind model outputs (presented in Section 2.2). Playa Kalki and Boka Hulu observations are compared to northwest regional wind averages and combined for simplicity as “Northwest” (nor) observations. Coral Estate, Director’s Bay, and Oostpunt casts are compared to central, southeast, and southeast regional wind averages, respectively.
Data were recorded at 2 Hz during 1ms−1 up- and down-casts, yielding a vertical resolution of ∼ 0.5m. Data were averaged in 1m bins. The measurements of conductivity, temperature, and pressure were converted into absolute salinity [SA(g kg−1)], conservative temperature [CT (°C)], and potential density [σ(kg m−3)] using the Gibbs ocean TEOS-10 formulas (Intergovernmental Oceanographic Commission (IOC) et al., 2010). For clarity, CTD-based temperature observations are referred to as “profile temperatures” herein, to distinguish from reef temperatures in the results and discussion sections.
Mixed layer depth (MLD) is calculated as MLD = z(T10 − 0.2°C) (m) with T10 the conservative temperature at the 10 m reference depth (de Boyer Montegut´ et al., 2004). This widely used method avoids the diurnal cycle variations within the surface layer, which are especially strong in the near-equatorial regions (Schneider and Müller, 1990).
Potential density profiles were vertically sorted to increase monotonically (σ*) in order to compute the buoyancy frequency squared , with z increasing downwards (Thorpe and Deacon, 1977; Mater et al., 2015), g the gravitation constant, and the sorted potential density at a reference depth.
Turbulent mixing quantities are computed from estimates of the Thorpe scale, the vertical scale of turbulent overturning. The Thorpe scale, LT, is assumed to amount to the root-mean-square of vertical differences between raw (σ) and sorted (σ*) density samples along a profile (Thorpe and Deacon, 1977). Under the assumption of a fixed ratio between the overturning scale and the largest scale at which a turbulent eddy can grow unimpeded by buoyancy, the Ozmidov scale (LOz), the turbulent dissipation rate associated with an overturn, is (Dillon, 1982; Mater et al., 2015). The diapycnal (∼vertical) diffusivity associated with a turbulent overturn is (Osborn, 1980; Waterhouse et al., 2014; van Haren et al., 2022). Throughout, turbulence quantities are averaged over the extent of the overturns (Mater et al., 2015). To avoid misrepresentation in the averaging background values for mixing are inferred when overturns are not detected (Park et al., 2024). Whereas the minimum detectable Thorpe scale and the lowest buoyancy frequency set the background values for ϵT and Kz. Here, the vertical resolution sets LT above 1 m, and the minimum N2 is 3.3 × 10⁻⁷ s−2 (Supplementary Table S1). Background values for ϵT = 1.2 × 10⁻¹⁰ W kg−1 and Kz= 7.4 × 10⁻⁵ m2 s−1are thus inferred, and are consistent with reported background ranges for the coastal ocean (Masunaga et al., 2016, Masunaga et al., 2022; Tirodkar et al., 2022).
The vertical buoyancy flux is computed as b = KzN2 (Gregg et al., 2018; Zhuang et al., 2021). Under the assumption that heat, salt, and dissolved oxygen diffuse at the same rate as mass, i.e., with a common diffusivity coefficient (Kz), the vertical fluxes of heat, salt, and dissolved oxygen are computed as QT = ρ0cpKz∂z(CT) (W.m−2), QS = 10−3ρ0Kz∂z(SA) (kg.m−2.s−1), and QO = ρ0Kz∂z(c) (kg2.m−5.s−1), respectively, with c the dissolved oxygen concentration (referred to as “DO con.”, hereafter), ρ0 the density at a reference depth, and cp the specific heat of seawater (Gunn et al., 2021; Sheehan et al., 2023; Fischer et al., 2013). For all the above, as z is chosen to increase downwards, a positive value indicates an upward flux.
2.2 Model and satellite wind observations
Hourly global sea surface (level 4) wind fields at 1/4° horizontal spatial resolution from E.U. Copernicus Marine Environment Monitoring Service were analyzed (CMEMS, 2024a). The fields are produced from hourly European Centre for Medium-Range Weather Forecasts (ECMWF) model fields, bias-corrected using temporally averaged fields calculated from Metop-B and Metop-C ASCAT scatterometer observations, and collocated ECMWF operational model variables. Regionally averaged CMEMS data were evaluated against daily Hato airport observations for the month of April 2023, and local variability was captured (data not shown). The monthly climatology of wind speeds and direction for the 08/1999–05/2023 period is also used (CMEMS, 2024b).
Subsequently, three regional wind field subsets are used (Figure 1). Each regional grid is 1/2° × 1/2° in latitude-longitude, which includes four grid points. As the island’s major axis is oriented northwest to southeast, the regions are referred to hereafter as “northwest”, “central”, and “southeast”. Each region represents a distinct coastal orientation from true north, implying contrasting wind responses.
Mean cross-shore Ekman transport [UEk (m2 s−1)] was calculated from along-shore wind speeds [vas (ms−1)] relative to the mean coastline orientations (Bakun, 1973; Jacox et al., 2018) as:
with the bulk along-shore wind stress component, ρa= 1.22kgm−3 the reference air density, and Cd = 2.6×10⁻³ the drag coefficient. The reference ocean density, ρ0 = 1025.5kg m−3, is the mean density at 10 m from the in situ CTD casts. The Coriolis parameter (f) is calculated from the latitude field (May et al., 2022). Three main coastline angles are used to compute along and cross-shore components of Ekman transport (Equation 1): α = 0, 39.8, and 64.4 degrees from true north for the northwest, central, and southeast regions, respectively (see Figure 1). This bulk segmentation of the coastline emerges from the need to detail sub-island scale Ekman responses, which can be substantial over a 70 km length (Lorente et al., 2020). Coastline irregularities at 0.1−1 km scales within the three main regions can be significant, especially in the central region, and could drive a horizontal shear component to the total coastal up- and downwelling (Mazzini and Barth, 2013). This was not addressed here, to focus on the 10−20 km intermediate scale of the Ekman response.
2.3 Modeled currents
Hourly current components from the Operational Mercator global ocean analysis and forecast model at 1/12° horizontal resolution are also included here (CMEMS, 2024c). The current fields are spatially averaged in the same manner as the wind fields, into the northwest, central, and southeast regions. The regional averages are used to contextualize the in situ CTD observations. The profiles obtained at Playa Kalki-Boka Hulu are supplemented with current information from the northwest region averages, the Coral Estate profiles with central region averages, and the Director’s Bay and Oostpunt profiles with southeast region averages.
2.4 Spectral analysis
Spectral decomposition is performed on mean wind and temperature logger raw time series, adapted from Firing’s Ocean Data Analysis tools (Firing and Lukas, 1985). Fast Fourier transform (FFT) of the detrended, quadratic-windowed, boxcar-smoothed raw time series delivers the power spectral density (PSD) of frequencies ∈ [0; fNyquist].
3 Results
3.1 Regional wind forcing
Prevailing easterly trade winds dominated in Curaçao for the May 2022 to May 2023 period, with only occasional short periods of weak north-westerlies (Figure 2a). Wind speeds spatially averaged over the three leeward regions of Curaçao ranged from 0.6 to 14.2 ms−1, with a 7.5 ms−1 mean. Wind speeds were 6−10 ms−1 for most of the year-long data presented here, with only 3 and 9 multiple-day periods of high (> 12 ms−1) and slow (< 6 ms−1) winds, respectively. Wind direction ranged from 7 to 336°, averaging 94° clockwise from true north. Furthermore, 6 week-long periods of relaxed winds were observed, primarily westerlies with diurnal north-to-south direction variations.
Figure 2
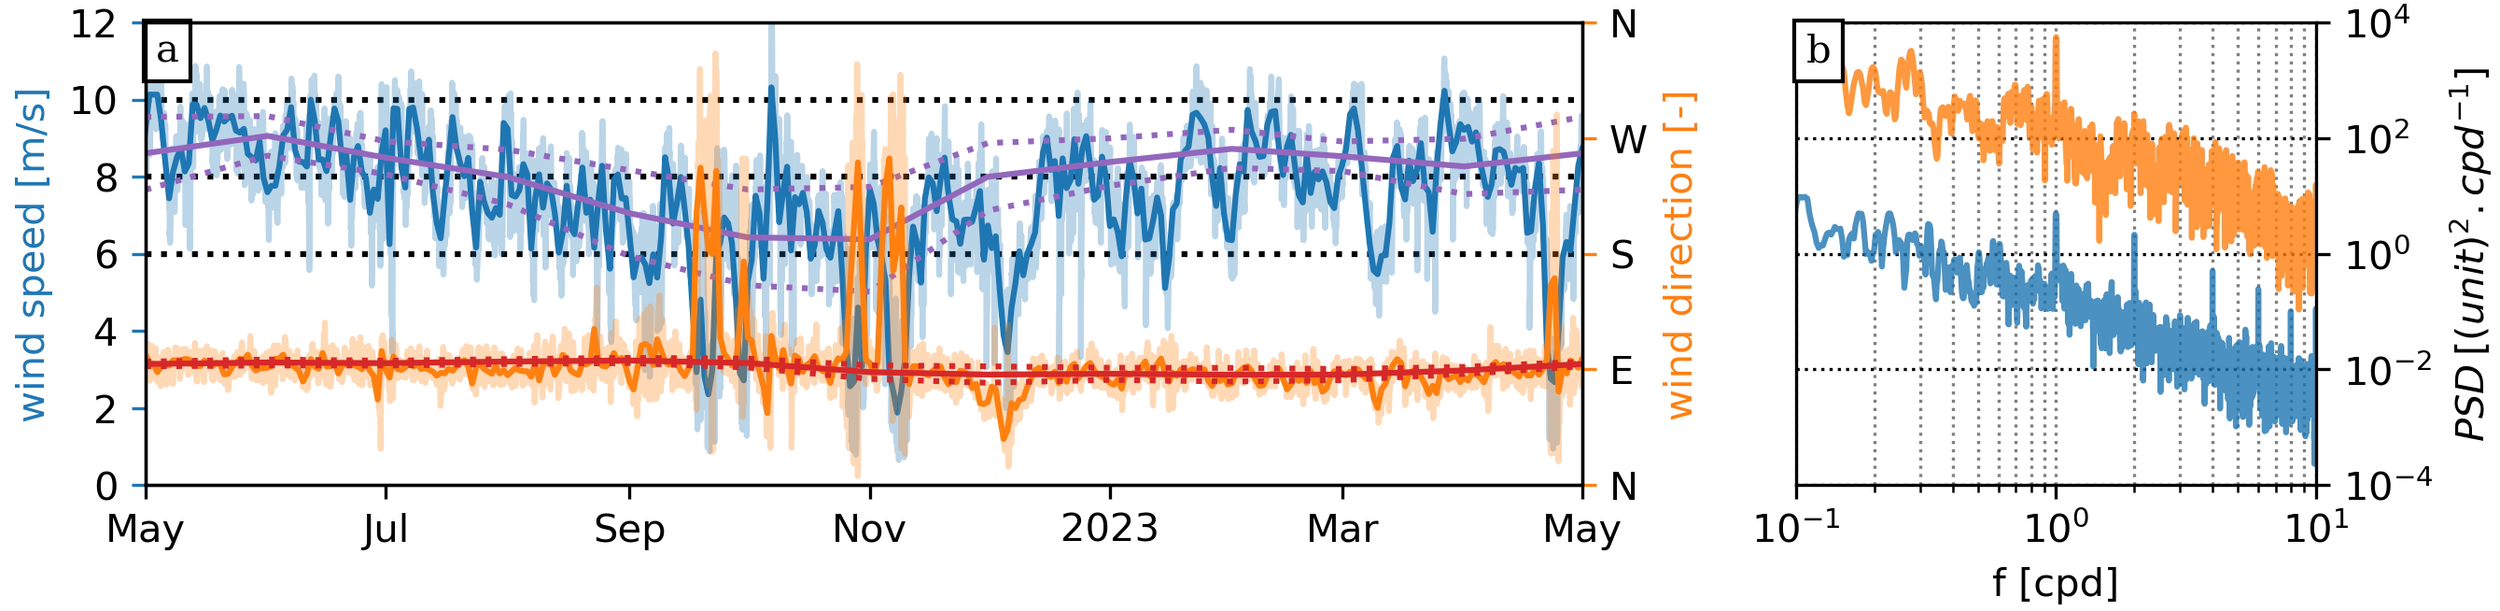
(a) CMEMS global time-series of sea surface wind speed (blue) and direction (orange), spatially averaged (solid line, shaded standard deviation envelope) across the three regions detailed in the text. Monthly climatological averages (solid line, dotted standard deviation envelope) of wind speed (purple) and direction (red) of the August 1999−May 2023 period are also shown. (b) Power spectral density of wind speed {blue, [(m.s−1)2.cpd−1]} and direction [orange, (cpd−1)].
Observed winds for the period May 2022 to May 2023 broadly match the wind climatology (Figure 2a). Mean monthly climatology winds are characterized as easterly trades and range from 6 to 9 ms−1. While the 2022−23 winds showed a similar range and direction, there were 10 occurrences, each lasting approximately 7 days, of weaker north-easterly to north-westerly winds. Wind speeds during these periods dropped by 2 ms−1 or more below the standard deviation from the climatological means. By the end of April 2023, wind speeds dropped to 3 ms−1, below the standard deviation from the climatological mean by ∼ 5 ms−1, with strong direction variations.
Wind speed varied primarily in diurnal and semidiurnal spectral bands (Figure 2b). The highest power was found in the diurnal band, which was also true for wind direction. Wind speed further varied strongly at semidiurnal frequencies, and to a lesser extent at the 4, 6, and 8 cpd harmonics. A broad peak in 0.5−0.6 cpd was also found, of higher power than the 6 and 8 cpd peaks.
Intra-annual wind speed and direction distributions were similar between the northwest, central, and southeast regions along the Curaçao coastline. Significantly different Ekman transport responses occurred due to the varying coastline orientations of these three regions (Figure 3). For all the regions, winds were primarily easterly (> 300 days), peaking at 8 ms−1 (Figures 3a, b). Numerous high wind (> 8ms−1) days were observed in the northwest region, while moderate to slow wind (< 8ms−1) days were primarily found in the southeast region. Ekman cross-shore transport in the northwest region was mostly distributed in the ±1 m2 s−1 bins, totaling ∼ 320 days (Figure 3c). Twice as many moderate to strong upwelling (≤ −2m2 s−1) than downwelling (≥ 2m2 s−1) days were found in this subset. The central and southeast region UEk distributions were normal and significantly downwelling-skewed, peaking with < 100 days in the 4 m2 s−1 and 6 m2 s−1 bins, respectively. Upwelling-favorable conditions only occurred on seven and five occasions for the central and southeast regions, respectively (Supplementary Figure S1). Strong downwelling-favorable transport (UEk ≥ 6 m2 s−1) was observed primarily in the southeast region and for more than 100 days than in the central region.
Figure 3
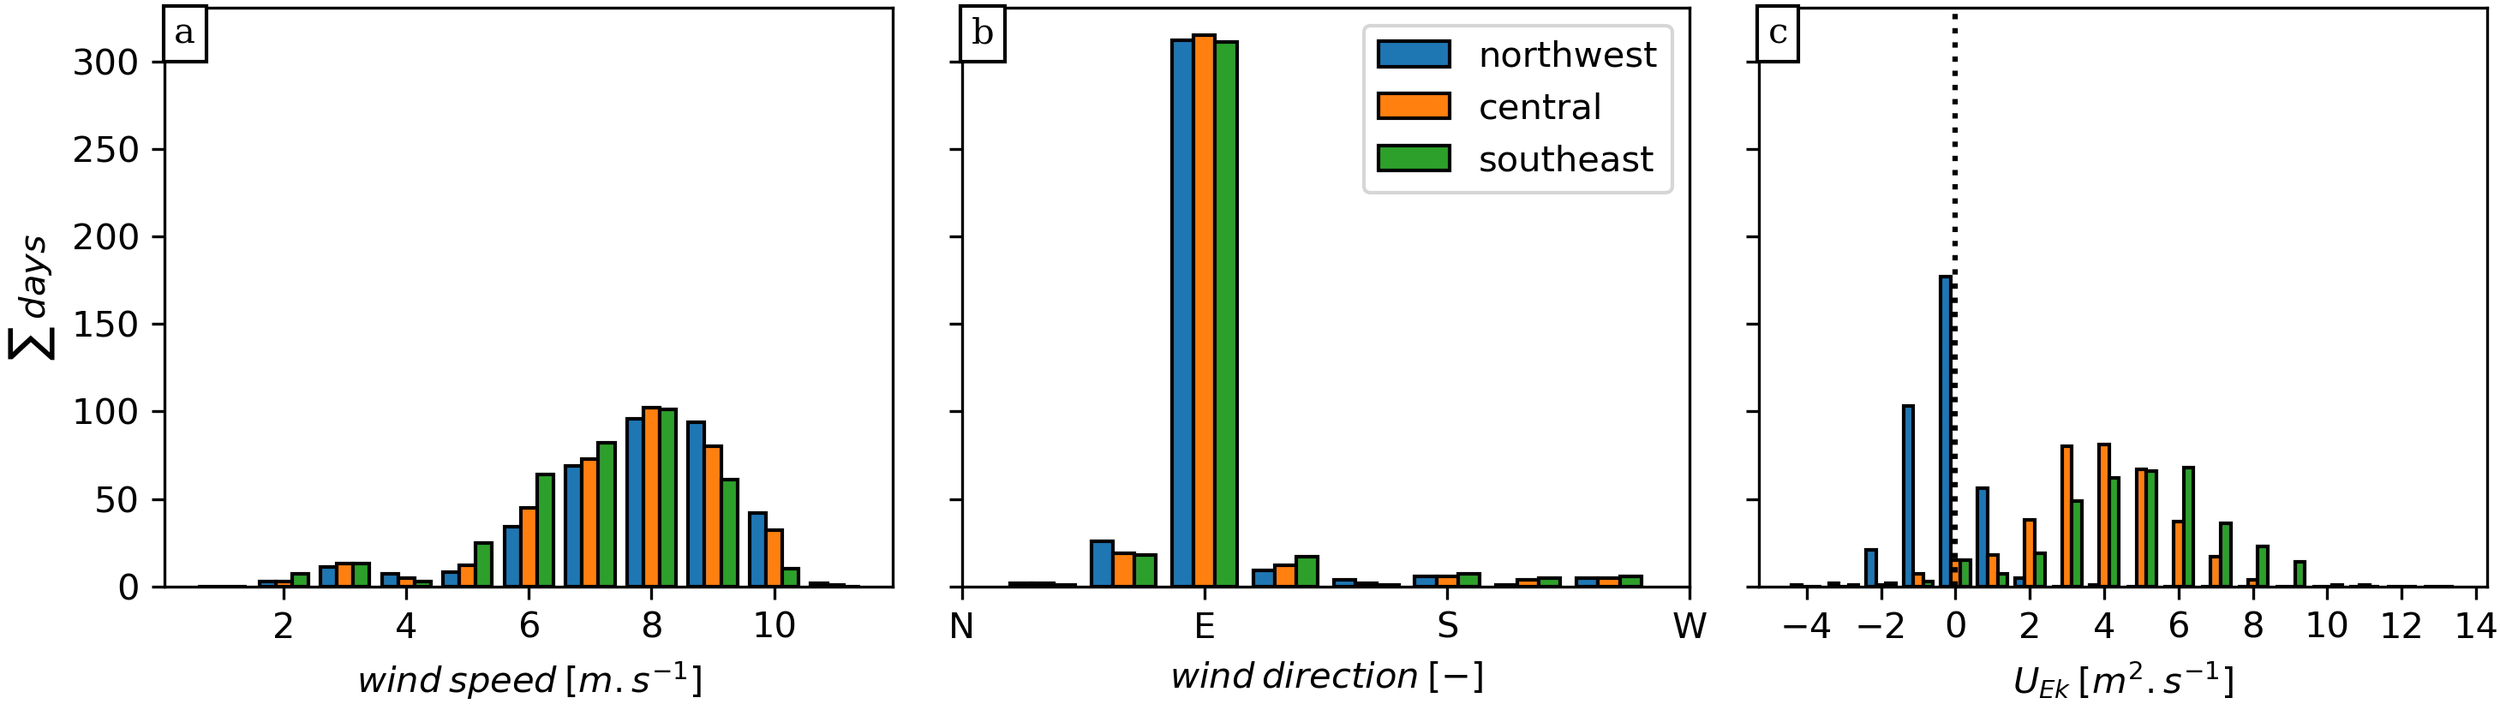
Histograms of mean daily occurrences of (a) wind speed and (b) direction, and (c) cross-shore Ekman transport (UEk). Data are spatial averages of the northwest (blue), central (orange), and southeast (green) regions, as detailed in the text.
3.2 Long-term temperature record
Temperatures ranged from 21.4°C to 30.3°C during the May 2022−May 2023 period (Figure 4). Broadly, temperatures at the 10–40 m depths were similarly distributed northwest to southeast, but strong sub-island differences were evident when comparing data at 40 and 60 m. Subsurface temperatures at 40−60 m decrease sequentially from northwest to southeast, with station averages of 26.3°C−25.9°C. The exception being Director’s Bay, showing a slightly higher mean of 25.9°C than the nearby Substation Reef, which had a mean subsurface temperature of 25.8°C.
Figure 4
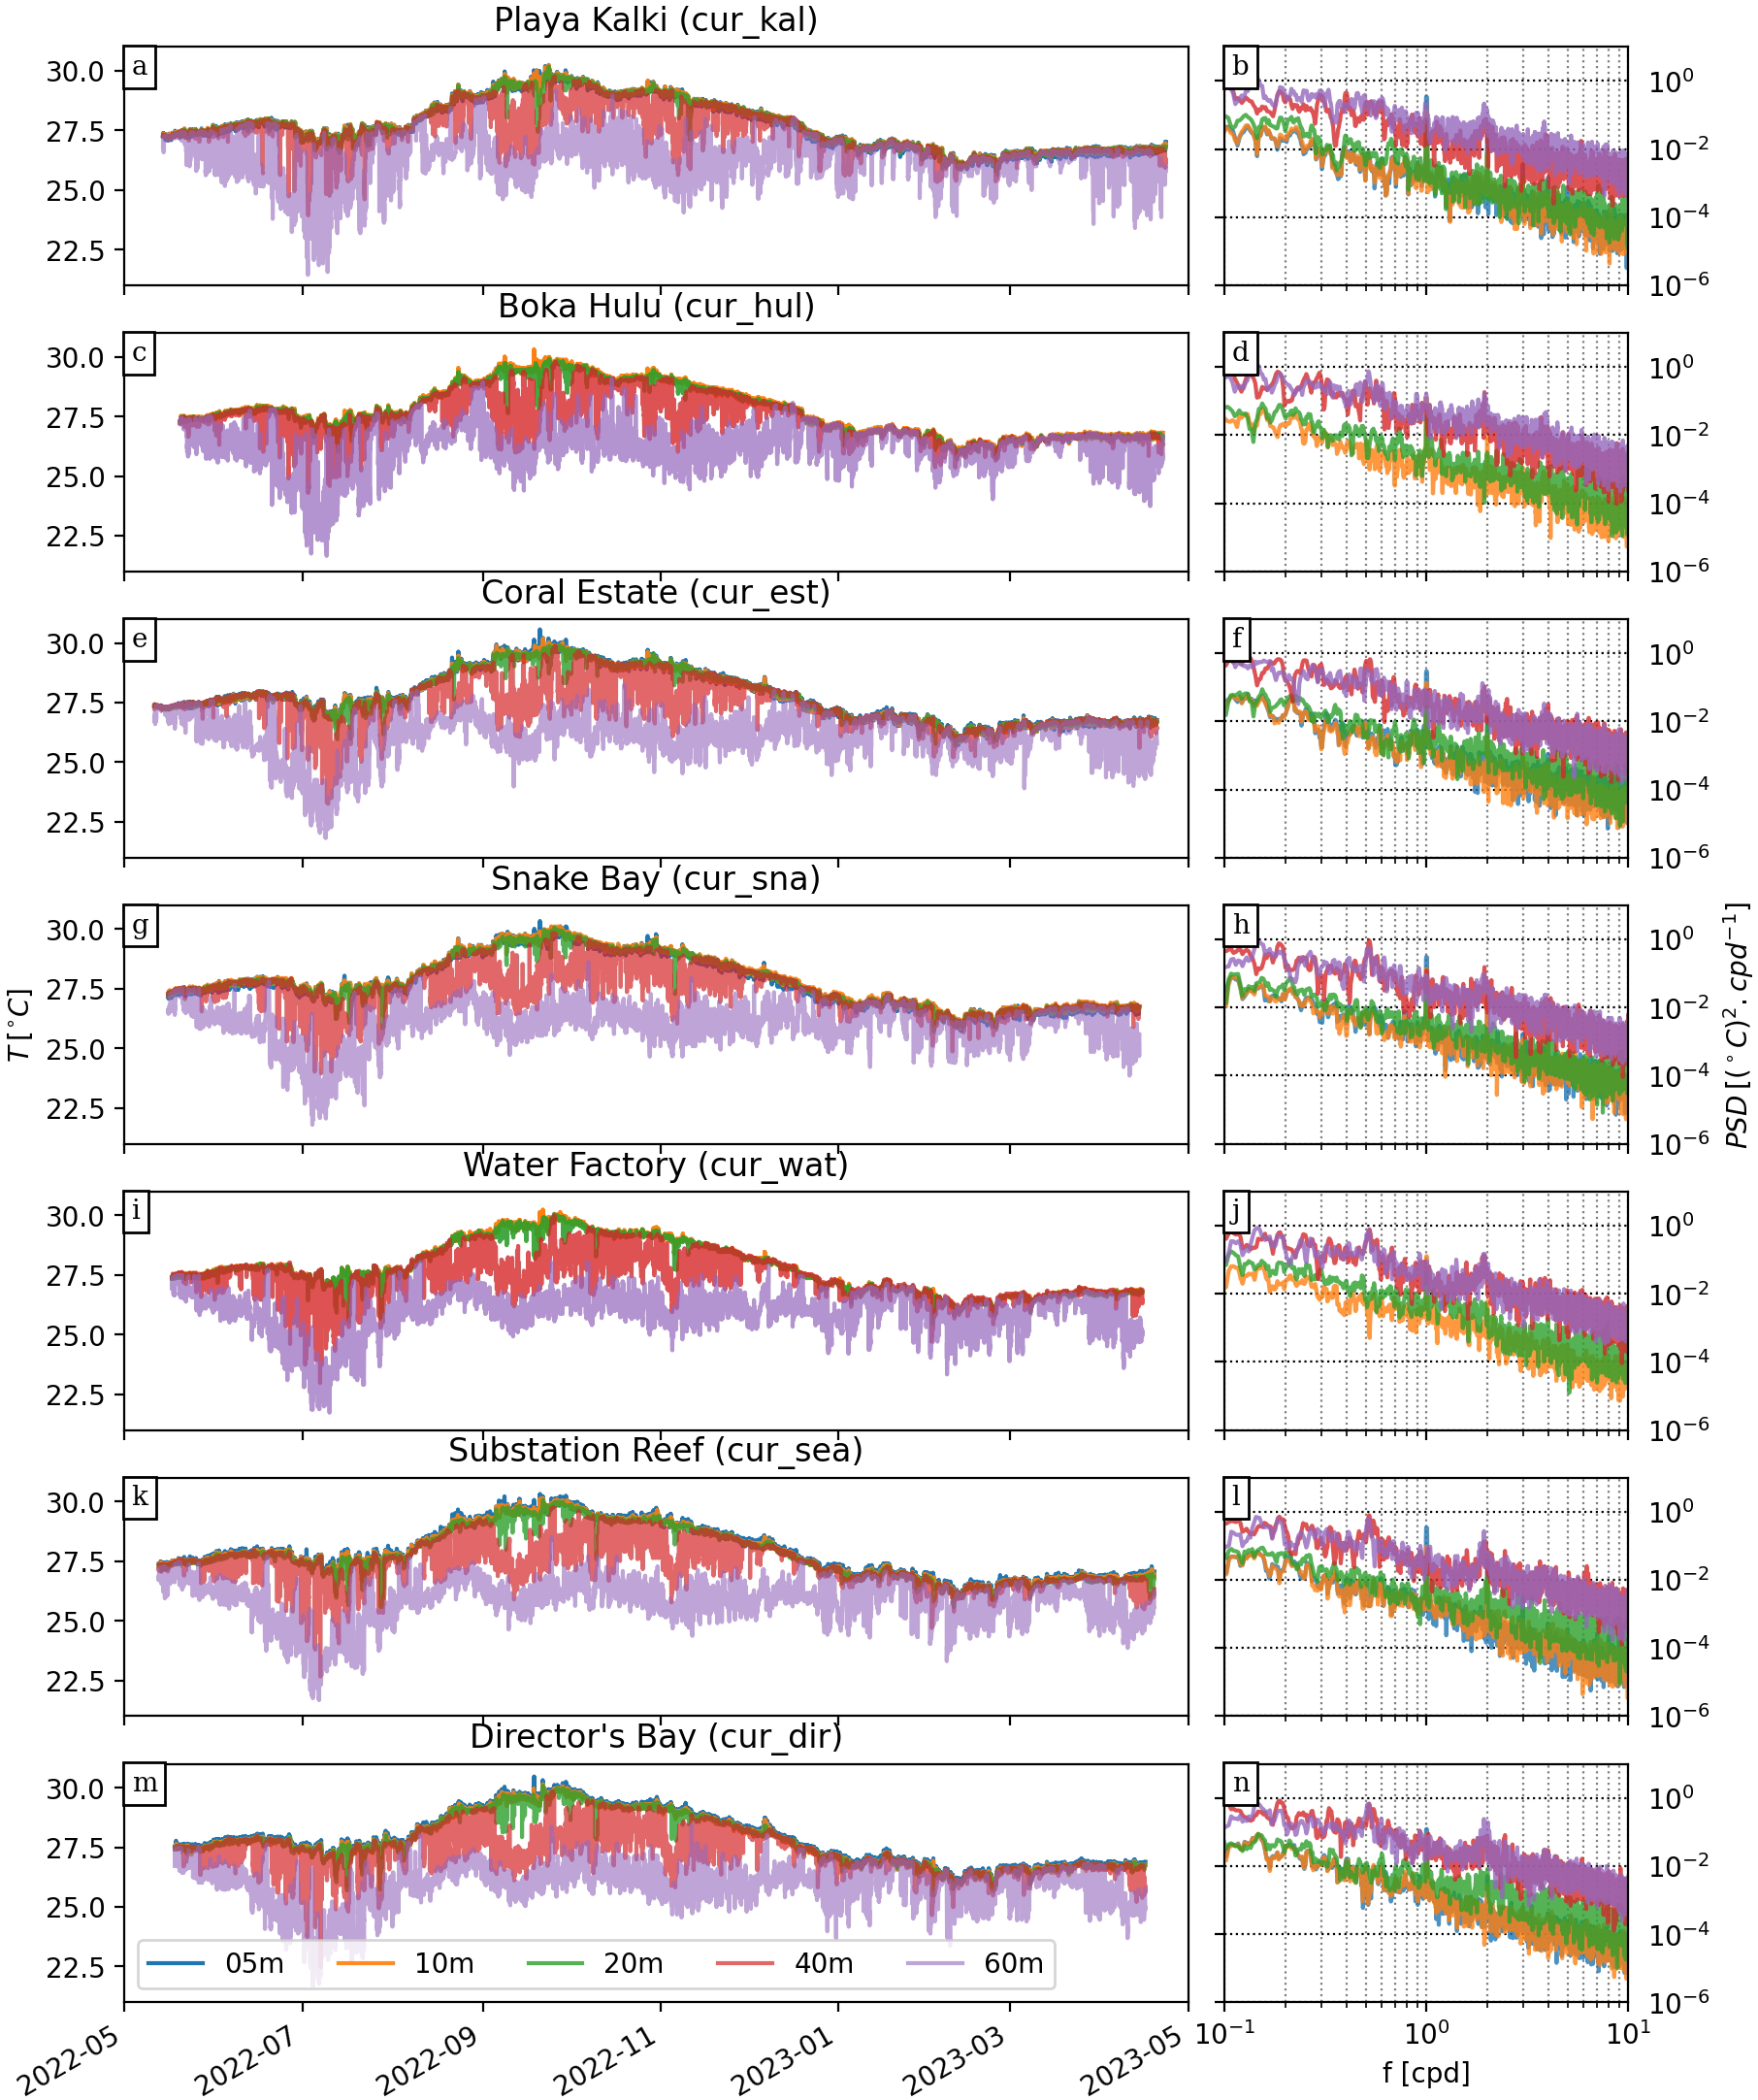
Time-series and power spectral density of temperature logger data in stations (a, b) Playa Kalki, (c, d) Boka Hulu, (e, f) Coral Estate, (g, h) Snake Bay, (i, j) Water Factory, (k, l) Substation Reef, and (m, n) Director’s Bay. Data from 5, 10, 20, 40, and 60 m depths are colored blue, orange, green, red, and purple, respectively.
A large cold water event at 40−60 m depths lasted nearly 2 months from June to August 2022 (Figure 4). Up to 5°C differences were observed between near-surface and 60 m loggers. This event had a slightly different northwest-to-southeast signature. Northwest stations Playa Kalki and Boka Hulu showed the warmest subsurface temperatures of all other stations by 3°C−4°C.
Spectral analysis of the detrended signal showed common features between stations, most notably at 5−10 m depths (Figure 4). Diurnal and semidiurnal peaks were found at all stations, but the 10 m semidiurnal peak was strongly dampened in the Director’s Bay and Water Factory data. A 3 cpd peak at 5m was found in the Playa Kalki, Coral Estate, and Substation Reef data.
At 20 m, diurnal and semidiurnal harmonics were also observed, with a higher power than at 5−10 m depths (Figure 4). The power in those frequency bands was highest in the southeastern stations, Substation Reef and Director’s Bay, potentially highlighting a higher degree of separation between surface and subsurface mechanisms.
At 40−60 m depths, the complete power spectrum envelope was higher than at 5−20 m depths (Figure 4). Most notably, the semidiurnal harmonic was pronounced at all stations. A strong 4 cpd harmonic was also present at all stations, but was highest in the northwest. A sharp 6 cpd peak at 60 m was also found in the Substation Reef data. A low-frequency harmonic at 0.5 cpd was further observed at all stations but Playa Kalki, and increased in power towards the southeast station.
3.3 April 2023 data
During April 2023, reef temperatures ranged from 23.4°C to 27.3°C across all stations and depths, averaging 26.3°C (Figure 5). At 5−40 m depths, near-diurnal warm waters > 27°C were observed in short bursts for Playa Kalki - Boka Hulu - Coral Estate and increased durations for southeast stations, maximal at Substation Reef. At 40−60 m depths, cold water intrusions of < 25.5°C were observed mainly at a semidiurnal frequency, associated with shallower cooling at some stations and extending to depths < 20 m (e.g., on 17 April at Substation Reef). Deep 40−60 m cold water intrusions in northwest stations and not southeast stations were also observed, e.g., on 8−9 April.
Figure 5
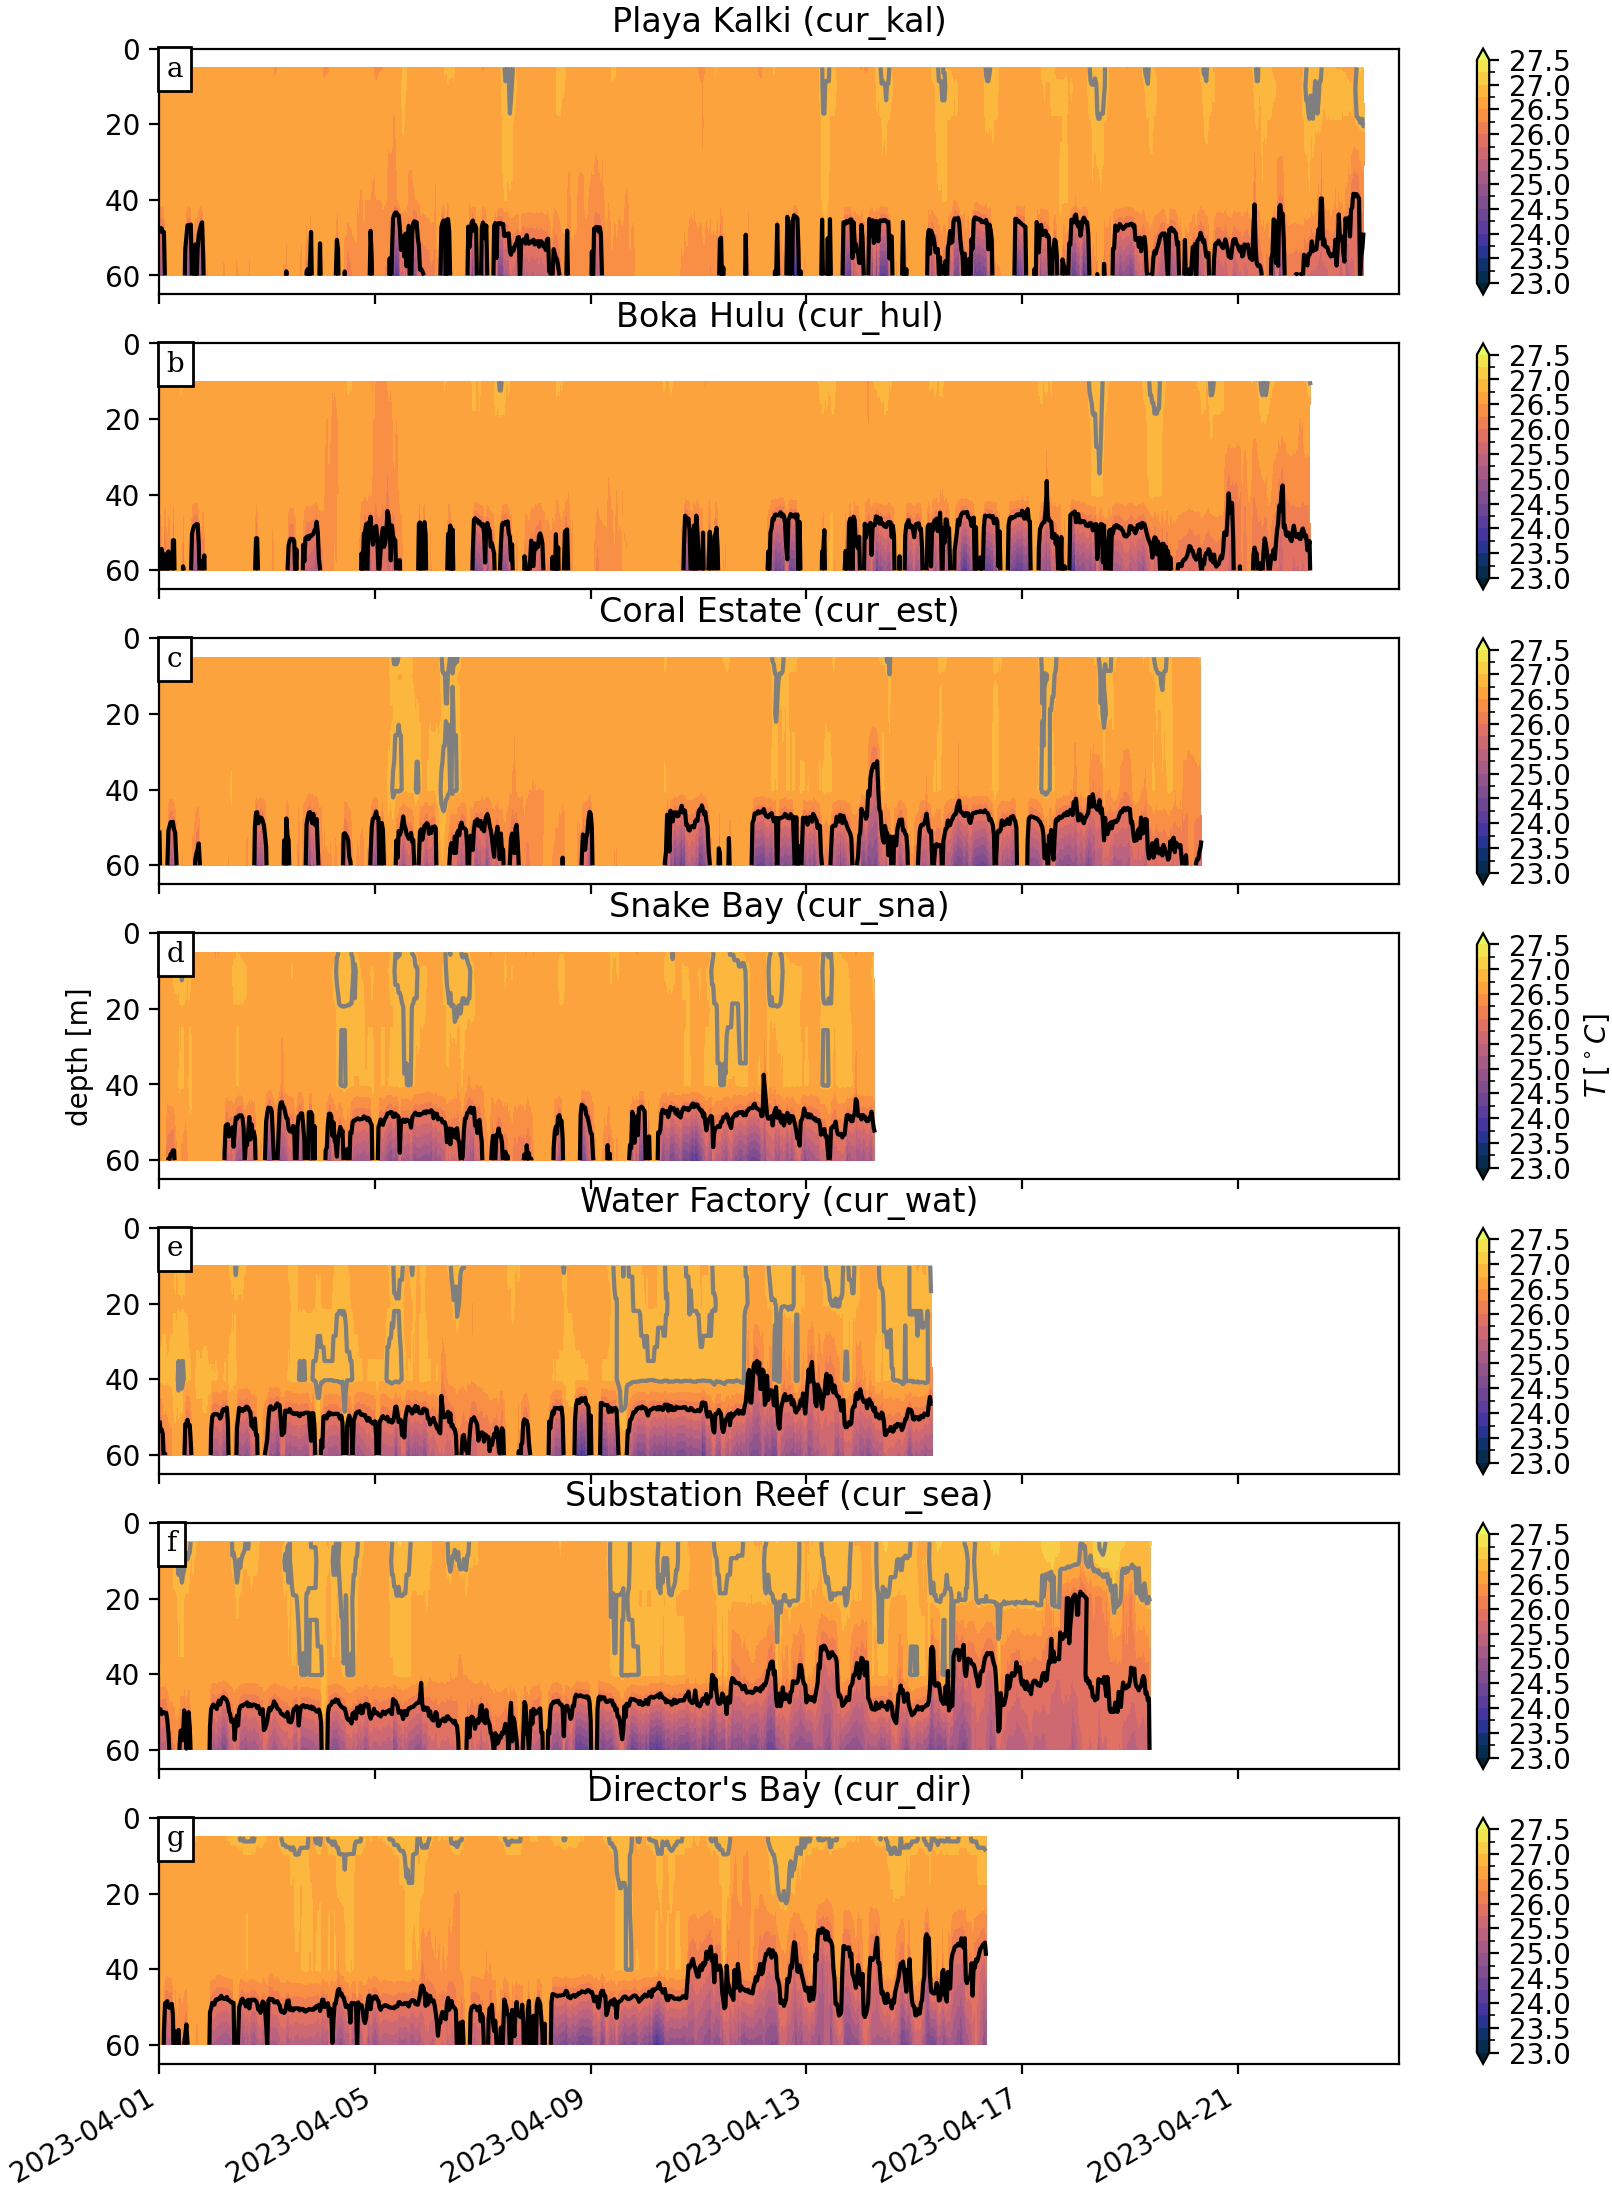
Time-series of April 2023 temperature logger data, concatenated along the depth gradient, for stations (a) Playa Kalki, (b) Boka Hulu, (c) Coral Estate, (d) Snake Bay, (e) Water Factory, (f) Substation Reef, and (g) Director’s Bay. The 26°C and 26.8°C isotherms are indicated by the black and grey contours, respectively.
For the end of April 2023, region-averaged background wind speeds in the relevant subset to CTD stations, e.g., the southeast region for profiles in Director’s Bay, ranged from 0.6 to 8.8 ms−1, averaging 6.2 ms−1 (Figure 6a). Prevailing easterly wind directions were observed, averaging 88° and ranging from 71 to 106° degrees from true north (Figure 6a). A 3-day period of low wind speeds of 0.9 − 1.8 ms−1 in a primarily south-westerly direction of 128 − 335° was also observed.
Figure 6
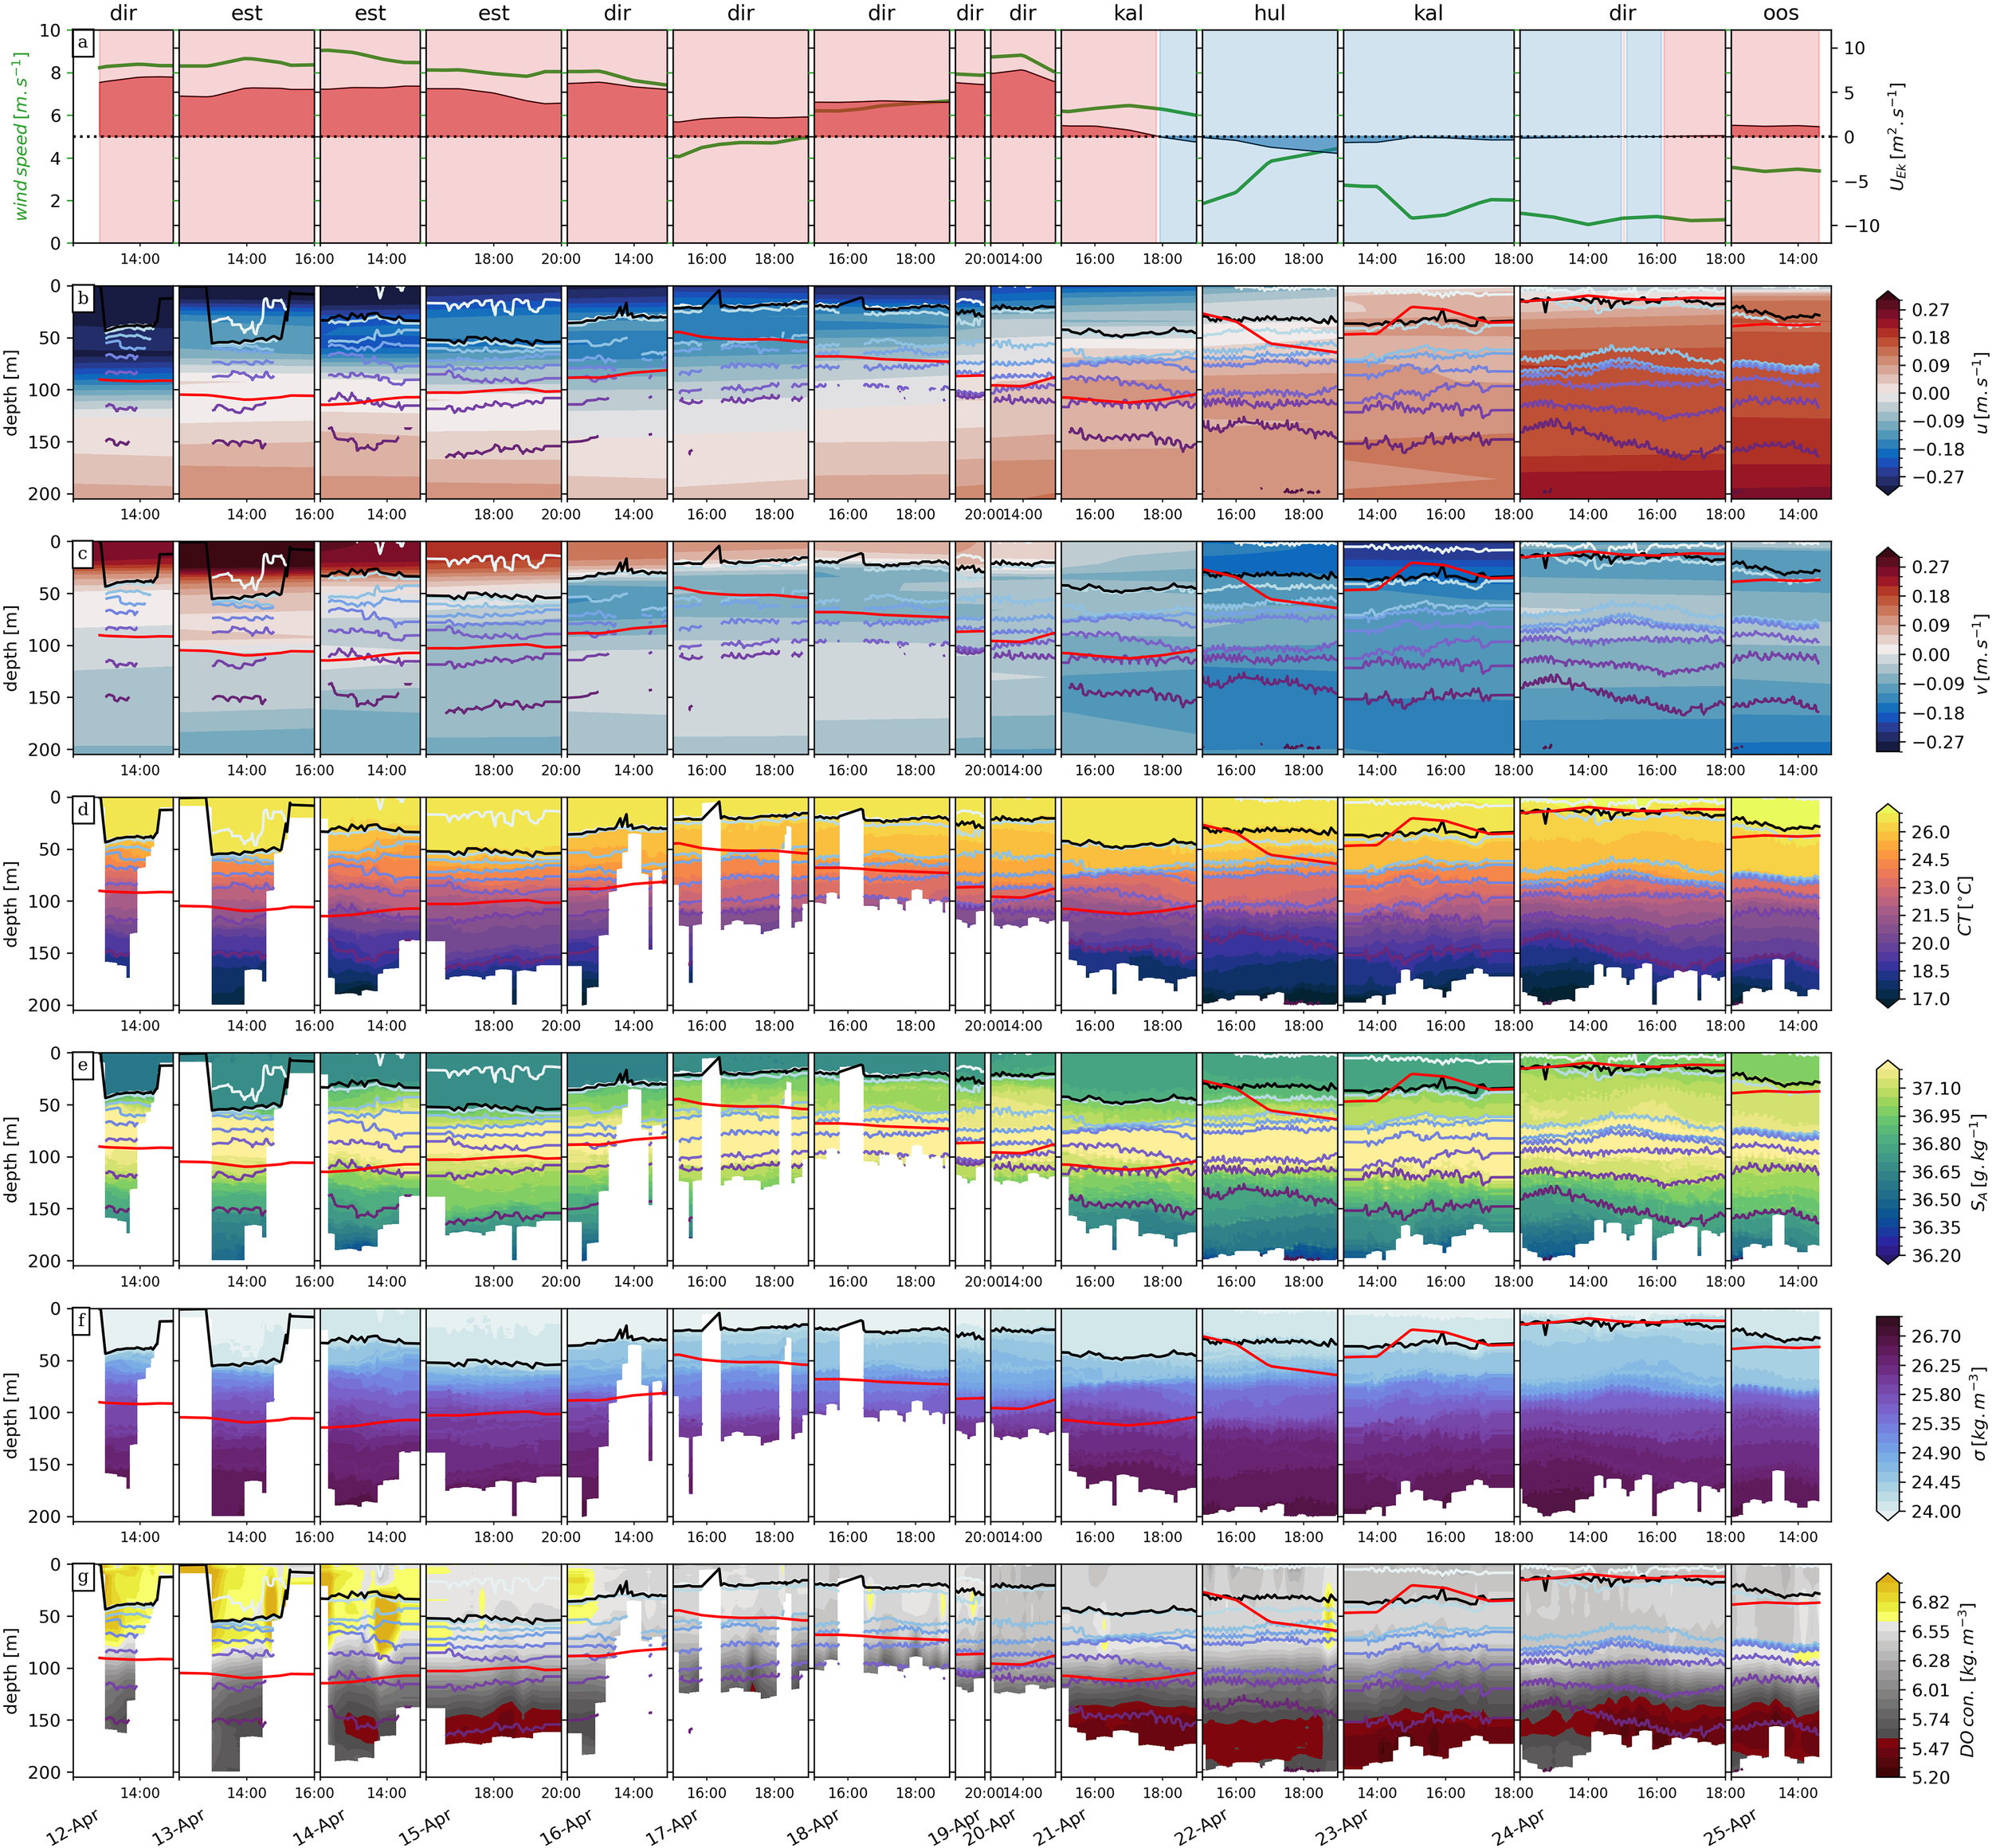
April 2023 (a) time-series of CMEMS regionally averaged wind speed (green) and cross-shore Ekman transport (red and blue), depth-time series of (b, c) modeled eastward and northward current components; and CTD depth-time series of (d) conservative temperature, (e) absolute salinity, (f) potential density, and (g) dissolved oxygen concentration. In panels (b–g), potential density contours (color palette matching panel (f), mixed layer depths (black line), and Ekman-layer depths (red line) are represented.
Spatially averaged eastward (u) and northward (v) current speeds ranged from −0.4 to 0.3 and −0.2 to 0.2ms−1, respectively (Figures 6b, c). During the prevailing trade wind conditions, the 0–30 m waters flowed north-eastward. At 30−100 m depths, the current was sheared, with north-eastward speeds at ∼ 30−50 m depths, southward at ∼ 50–100 m depths. At 100−200 m depths, waters flowed south-westward with small vertical variability. During the 3-day period of low south-westerlies, waters at 0 – 200 m depths flowed south-westward with increasing eastward magnitude with depth and some vertical variation in the southward velocities (Figures 6b, c).
During conditions of prevailing trade winds and strongly sheared currents, the water column was often arranged in three layers (Figures 6d–h). The surface mixed-layer depth ranged from 20 to 58 m, averaging 31m. At those depths, waters were near-homogeneously warm and fresh, with temperatures above 25°C and salinity below 36.5 g kg−1. Mixed-layer waters were also light and concentrated (saturated) in dissolved oxygen, with a density anomaly below 24 kg m−3 and DO concentration (saturation) above 6.5 kg m−3 (95%). Below the MLD, there was increased small-scale thermal-haline-density gradients in the vertical and decreasing DO that extended down to ∼ 100m depths. This layer is referred to herein as the thermocline. At ∼100−200 m depths, waters were cool and salty, with temperatures below 21°C and salinity between 36.5 and 36.7 g kg−1. This region below the thermocline was thus denser, with a density anomaly above 26 kg m−3, and lower DO below 6 kg m−3 (80%).
During conditions of weaker trade winds and therefore weakly sheared currents, a four-layer vertical structure was observed (Figures 6d–h, 7). Surface waters in the first ∼10−20 m were well-mixed, very warm, and salty, with CT > 26.5°C and SA from 36.7 to 36.9 g kg−1. Waters in this depth range were light with σ < 24kg m−3 and concentrated DO (saturated) above 6.2 kg m−3 (97%). At ∼20−70 m depths, a second nearly homogeneous layer was observed, but this was cooler and denser, with CT between 25.5°C and 26.5°C and σ from 24.3 to 24.9 kg m−3. At ∼70−100 m depths, the thermocline was deeper and had sharper temperature-salinity-density-DO gradients compared with the prevailing winds structure. Below, water masses at 100−200 m depths matched those encountered during the prevailing winds configuration at this depth range.
Figure 7
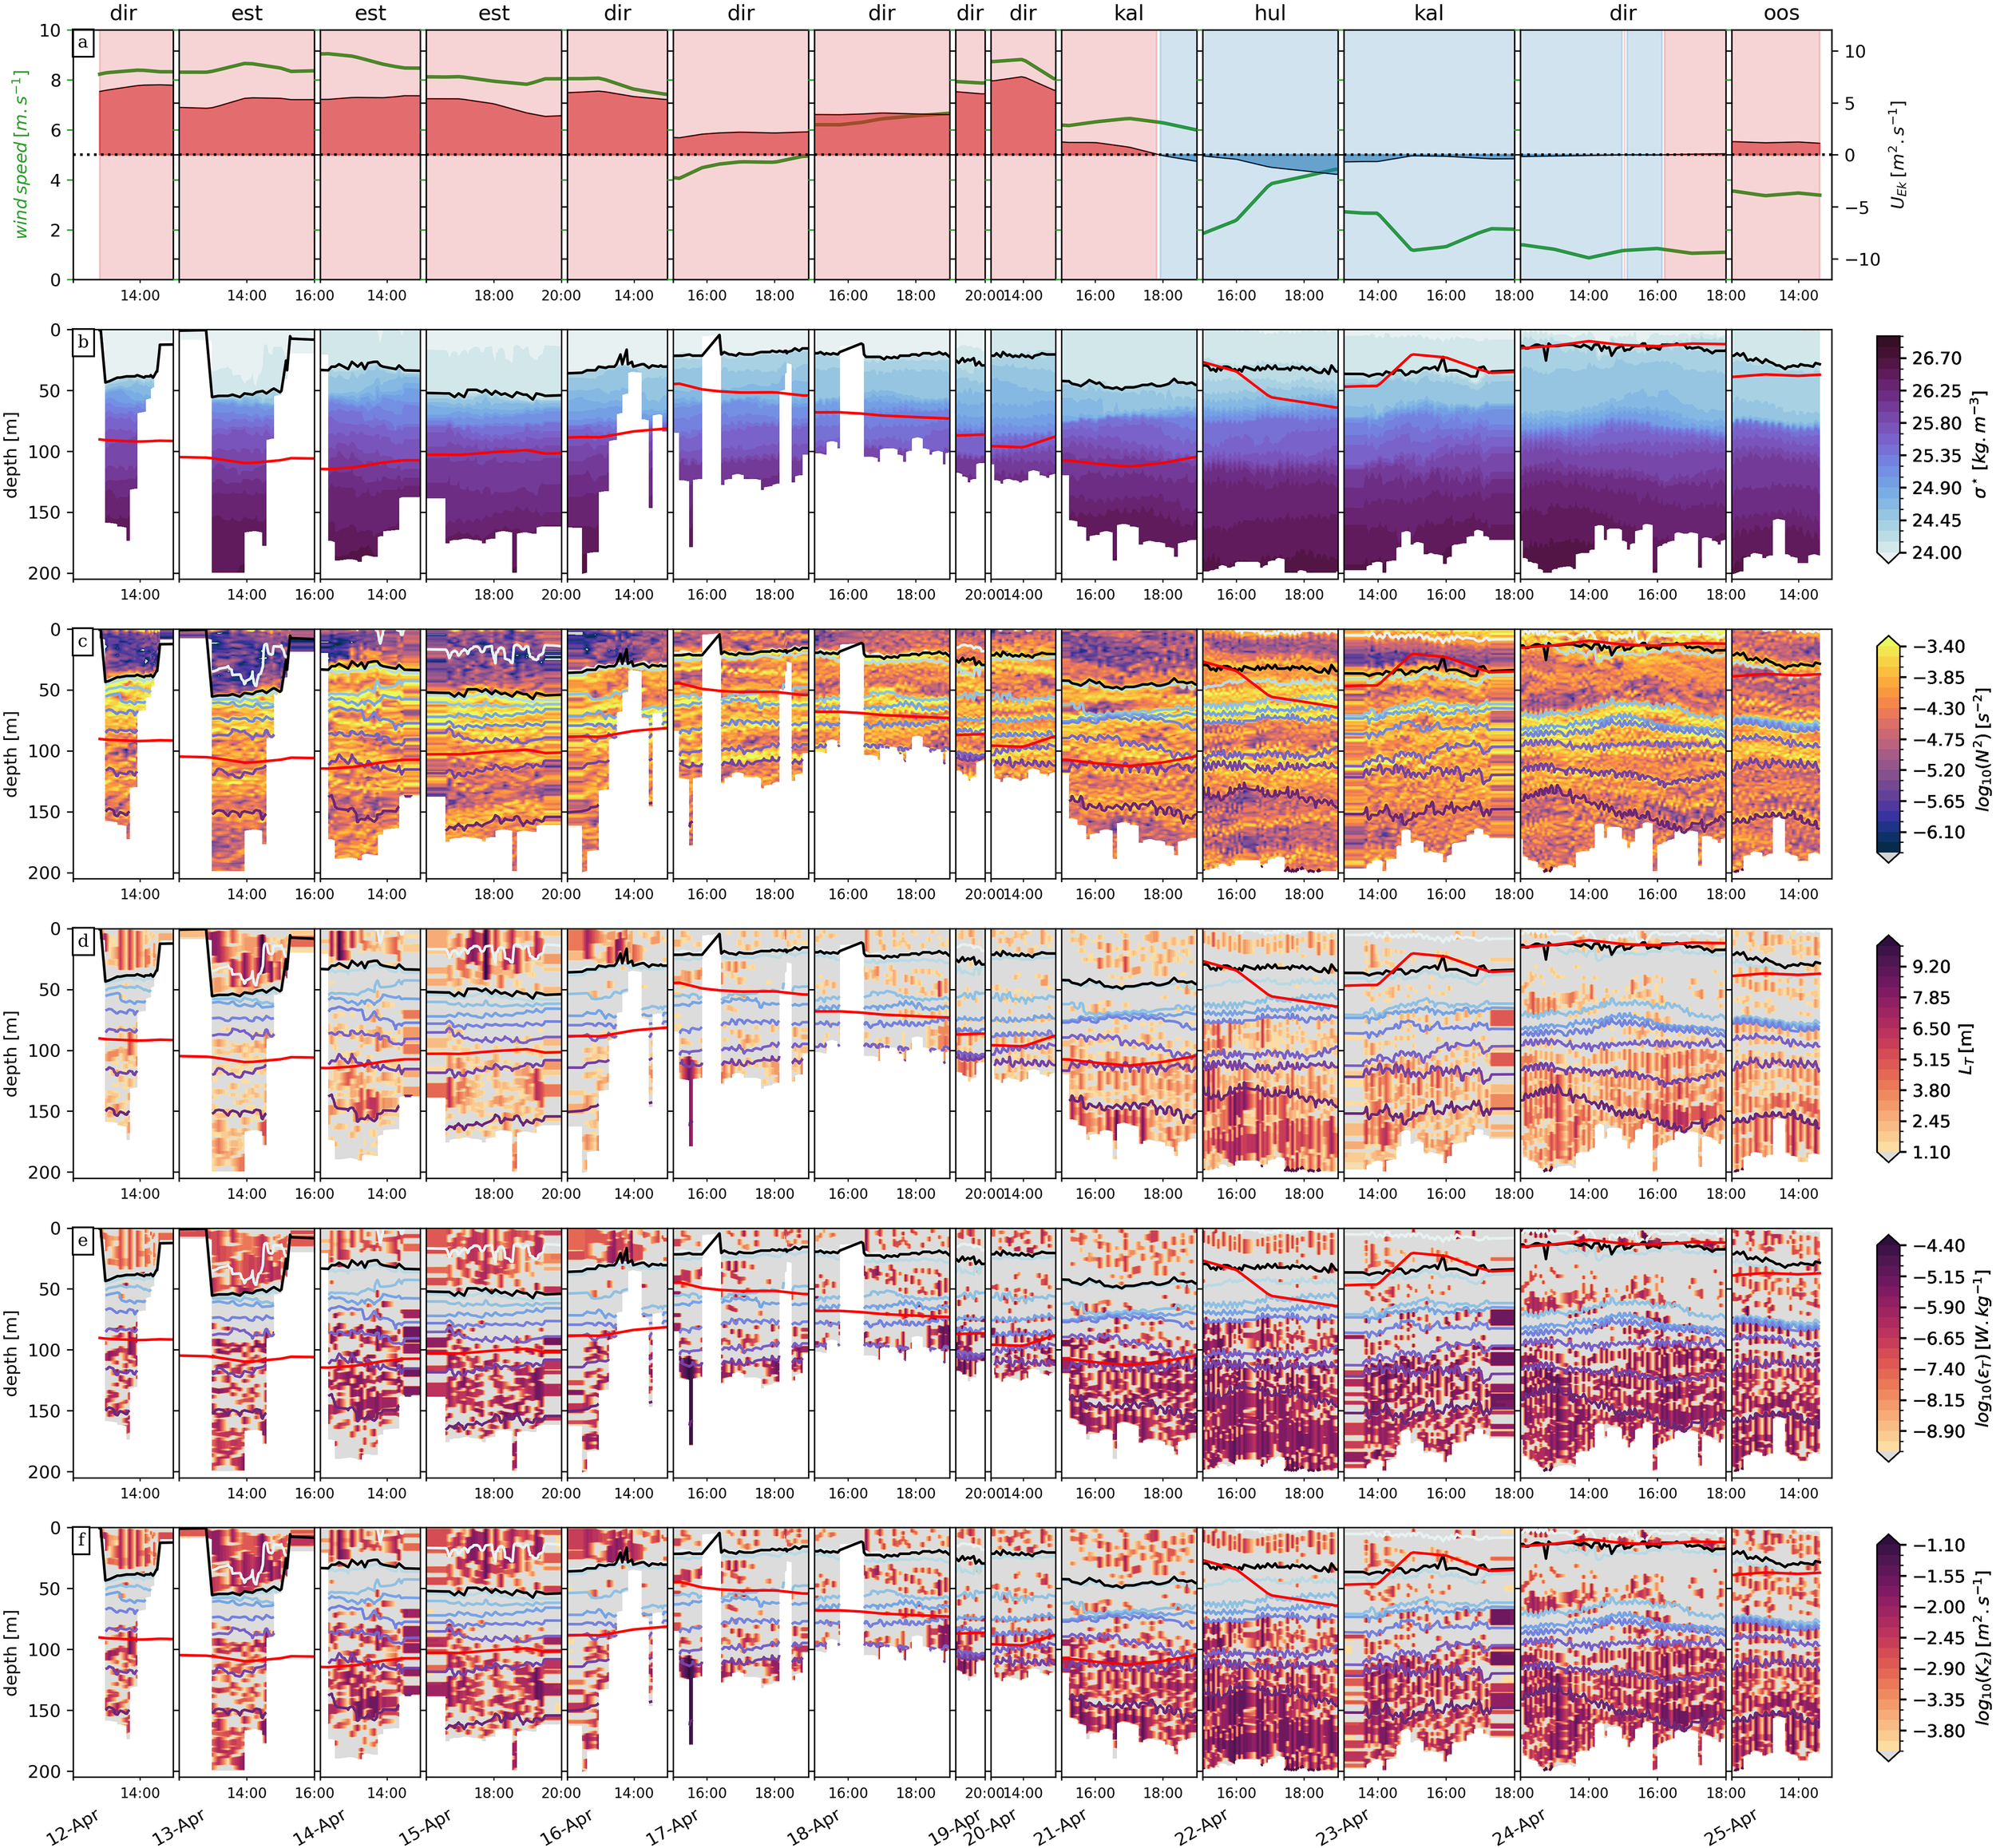
April 2023 (a) time-series of CMEMS regionally averaged wind speed (green) and cross-shore Ekman transport (red and blue); and CTD depth-time series of (b) sorted potential density, (c) buoyancy frequency squared, (d) Thorpe length-scale, (e) dissipation rate, and (f) diapycnal diffusivity. In panels (b–f), potential density contours (color palette matching panel (b), mixed layer depths (black line) and Ekman layer depths (red line) are represented. In panels (d–f), the light grey indicates where no overturns were detected, and background mixing is inferred for the averaging (see Section 2.1.2).
Surface stratification above the MLD was significantly eroded by turbulence activity, with N2 essentially below 10−5s−2, during periods of prevailing winds (Figure 7c). Intensified turbulent overturning, at the 5 − 10m scale, was also observed above the MLD, with many ϵ > 10−7W kg−1 patches, especially in the southeast-central regions (Figures 7d, e). Some shallow high ϵ overturning was also observed during low wind periods in Director’s Bay, elevating ϵ within ±30m of the MLD (Figure 7e). Elevated turbulence patches amounted to high diapycnal diffusivity above the MLD, mostly higher than 10−3 m2 s−1 (Figure 7F) and up to an order of magnitude greater than typical coastal ocean estimates (Masunaga et al., 2022).
Below, in both wind configurations, the strongly stratified and quiescent thermocline was arranged above moderately stratified and strongly turbulent waters (Figure 7). N2 increases to 10−5−10−3 s−2 in the thermocline (Figure 7d). This translates to turbulence suppression in these depths, with very few overturns detected, and ϵT and Kz set to their background values (Figure 7d–f). During periods of relaxed winds, a larger number of overturns were detected in the interior. Beneath the layer, N2 is moderate, and turbulence increases by up to 5 and 2 orders of magnitude for ϵT and Kz, respectively. When the sampling captured longer time periods of a day (22−25 April), oscillation of isopycnals in the thermocline layer was evident. In Director’s Bay on 24 April, sampling over a longer time period than 6 h showed modulation of isopycnals at 50−150 m depths, cycling within a semidiurnal period, nearly 4 h out-of-phase between the top and bottom isopycnal oscillations.
4 Discussion
Strong easterly trade winds are the dominant feature of regional weather in Curaçao. Although Ekman transport dynamics are commonplace along the 70 km-long tropical island, understanding the interplay of wind-driven transport, direct mixing, and subsurface semidiurnal temperature fluctuations is key to understanding heat accumulation or potential cooling mechanisms at mesophotic depths.
4.1 Island-scale wind response patterns
Weak cross-shore Ekman transport alternates between upwelling and downwelling-favorable conditions in the northwest region that modulate reef temperatures and mixed layer depths. Energy in the 0.1−0.6 cpd was evident in both wind and reef temperature PSDs (Figures 2, 4), indicating an effective air-sea energy transfer at frequencies relevant to synoptic weather events (0.1−0.3 cpd) and Ekman transport (0.4−0.6 cpd). The evidence for the latter is the broad spectral peak at 0.4−0.6 cpd in both regional wind and in 40−60m reef temperature PSDs, which matched the local inertial frequency, 0.4−0.45 cpd (inertial period in 55−58 h), except for Playa Kalki. Thus, the extent of Ekman influence from the prevailing winds does not appear to reach the northernmost edge of the Curaçao leeward coast, which is dynamically similar to modeling studies of Ekman layers with idealized islands (Spall and Pedlosky, 2013; Kämpf et al., 2023). At 5−20 m depths, UEk was moderately to strongly correlated (p > 0.4) with reef temperatures for 30%−46% of the year (Supplementary Figure S1, Supplementary Table S1). This represents cooler upper ocean temperatures when negative UEk was intensified, i.e., upwelling-driven cooling, and vice versa. Further, MLD and UEk were near-linearly covarying (Figure 8) and strongly correlated (p = 0.7), indicating that up- and downwelling modulated MLD shoaling and deepening, respectively (Jain et al., 2021; Vijith et al., 2016). Of the upwelling-favorable periods, only 20% were of , strong enough to transport nutrient-enriched water into the euphotic zone to be available for primary production (Kämpf et al., 2023).
Figure 8
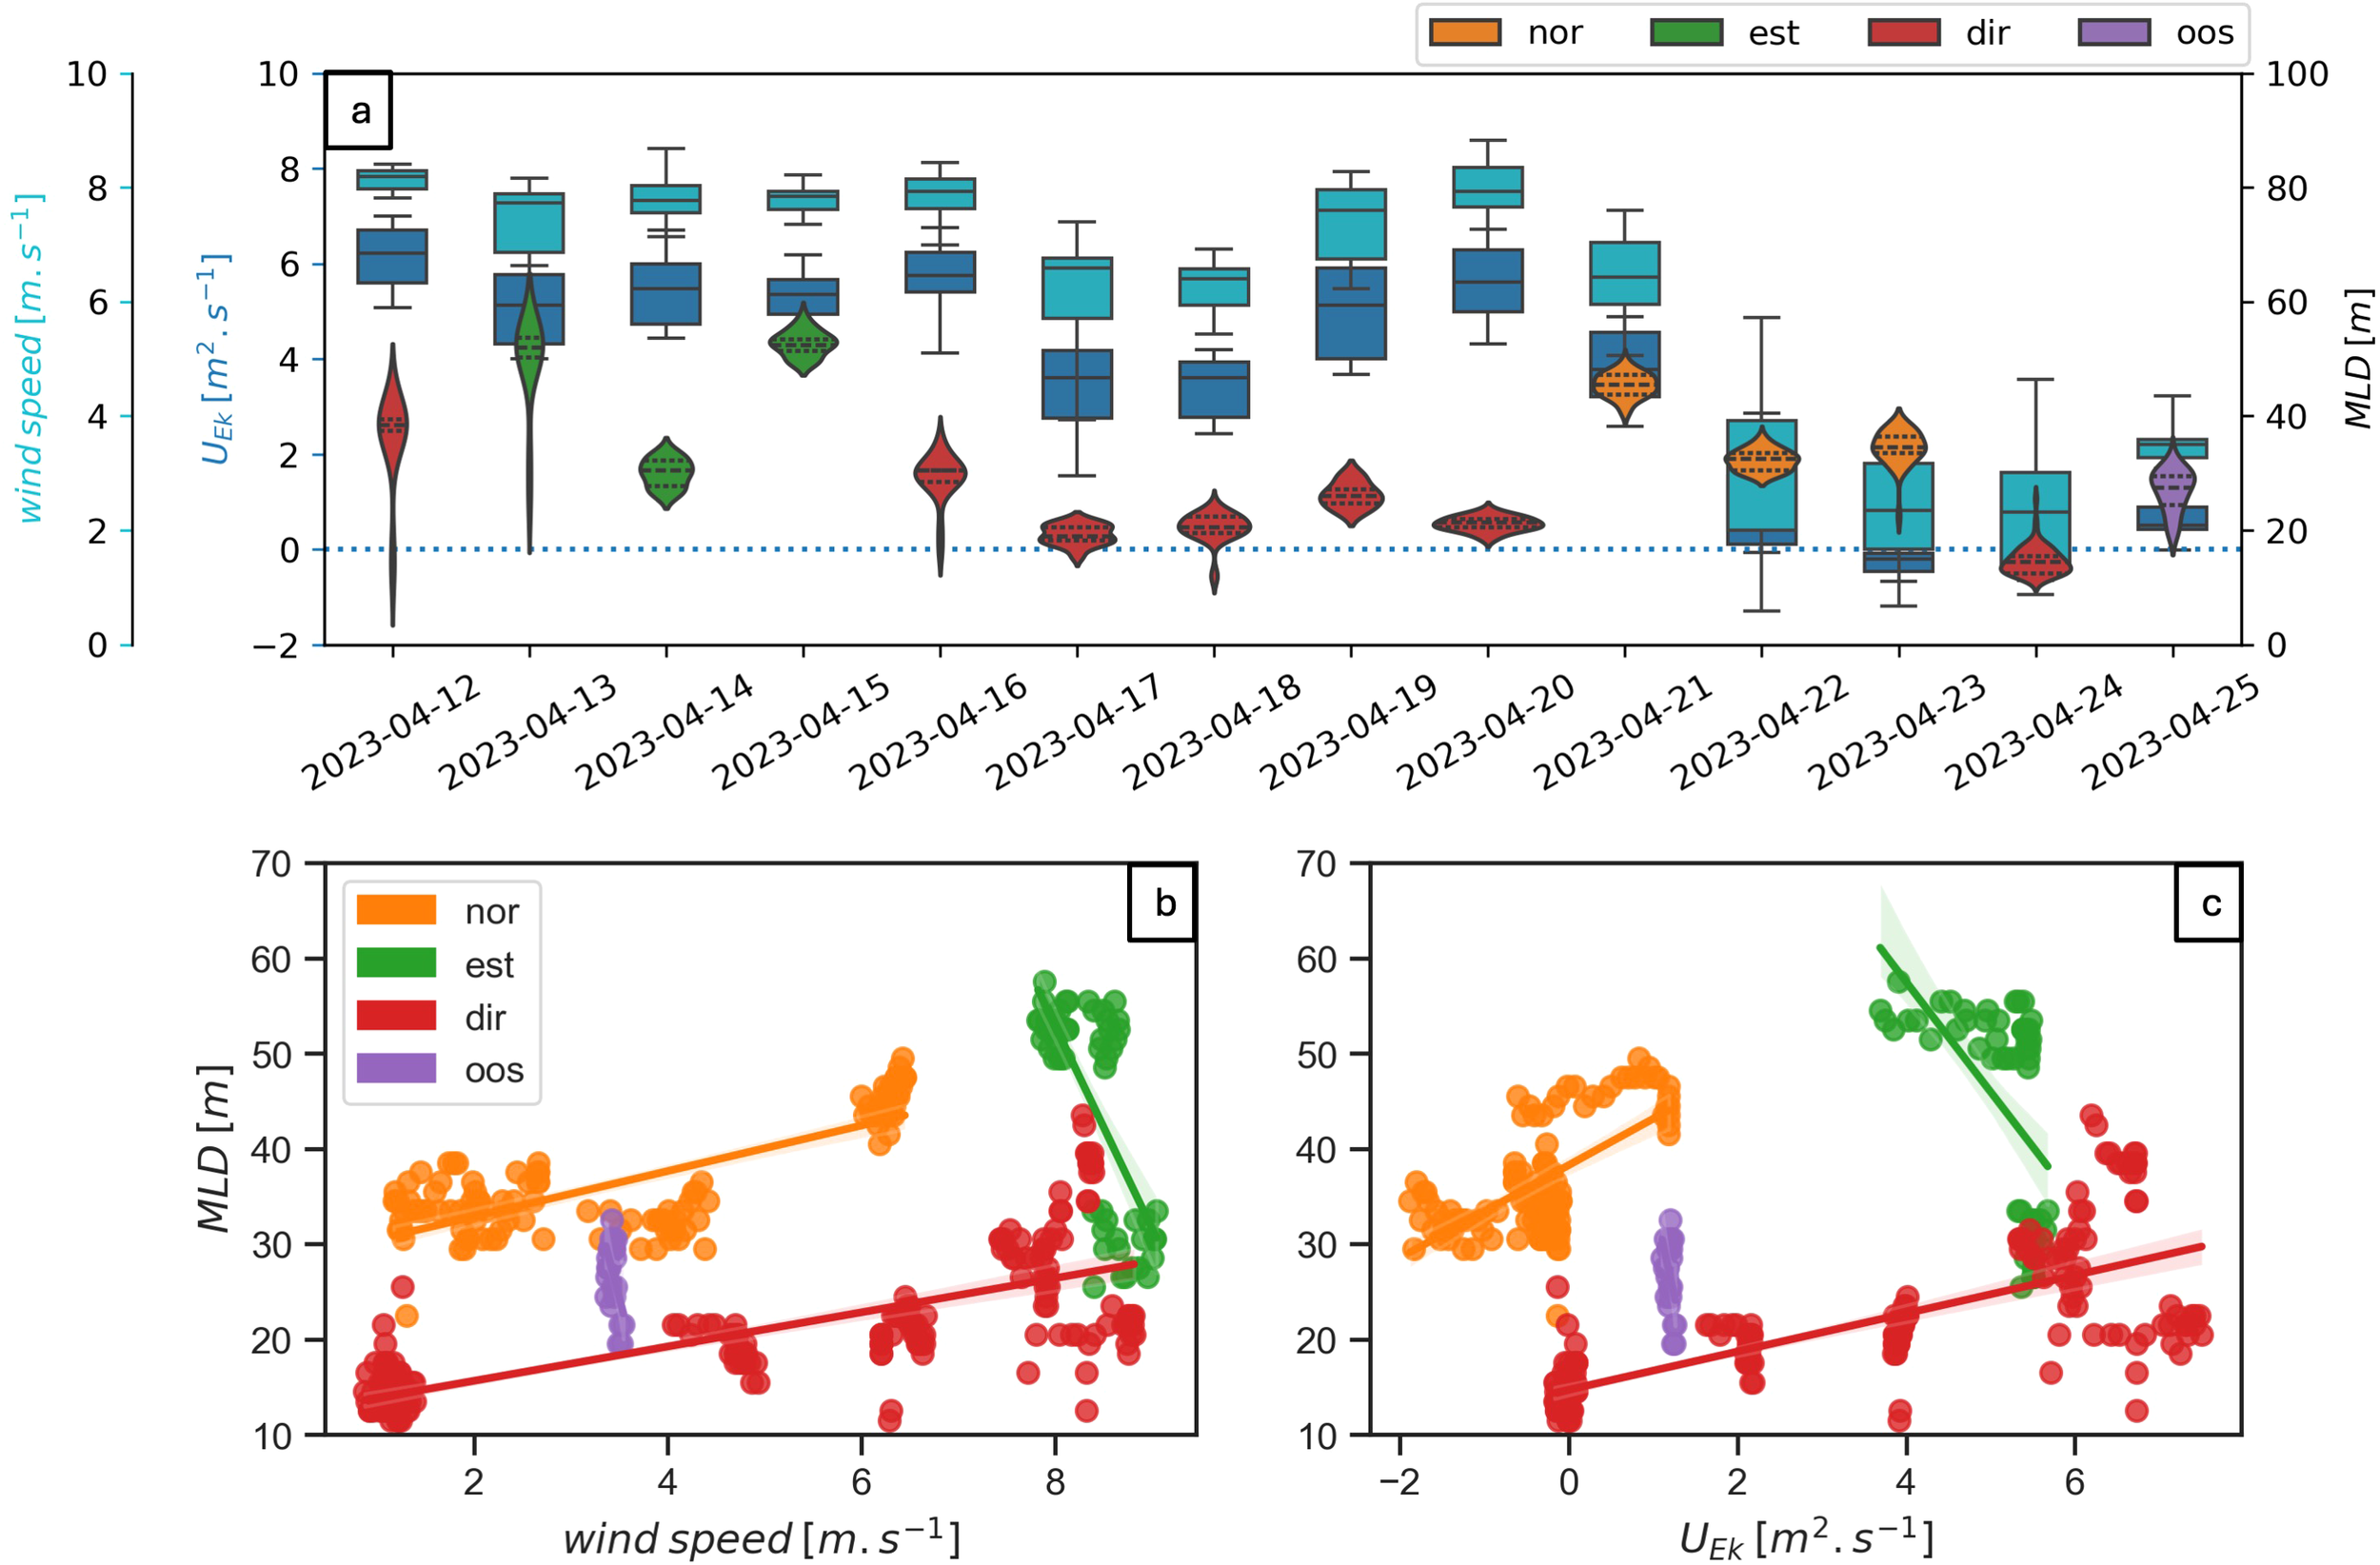
Observed mixed-layer depth (MLD) statistics against regionally averaged CMEMS wind data. (a) Distributions of wind speed (cyan, boxes), cross-shore Ekman transport UEk (blue, boxes) and MLD (colored per station, violin markers). Scatter plot of MLD against (b) wind speed and (c)UEk. In all panels, data from Playa Kalki-Boka Hulu (nor, orange), Coral Estate (est, green), Director’s Bay (dir, red), and Oostpunt (oos, purple) are shown. In panel (a) 0−100th percentiles of the distributions are shown with the box whisker or violin edges, respectively. First-third quartile values are shown with the box edges or dotted violin lines, respectively. Median values are shown with box central lines and violin dashed lines, respectively. In panels (b, c), linear regressions are shown for each data subset.
Downwelling-favorable Ekman transport dominated in the central and southeast regions. Similar to the northwest region, effective air-sea energy transfer was observed (Figures 2, 4). The 0.4−0.6 cpd in both regional wind and at 40−60m identified reef temperature PSDs were pronounced across all stations, indicating a direct thermal response to the establishment of Ekman circulation (Farmanara et al., 2018). The pattern with which reef temperatures correlated to UEk is, however, unclear, as both strong positive and inverse correlations were observed at 5−60 m depths (Supplementary Figure S1, Supplementary Table S1). Reef temperatures and UEk were moderately to strongly correlated or inversely correlated with for 21%−31% and 18%−33% of the year, in the central and southeast region, respectively. The latter implies that enhanced downwelling was associated with decreased reef temperatures for a significant portion of the year, reflecting a complex dynamic response to wind forcing in these regions.
Mixed-layer depths were modulated in the central and southeast regions by contrasting forcing mechanisms. In the southeast region, UEkcorrelated strongly with observed MLD (p = 0.8, Figure 8), indicating MLD deepened during enhanced downwelling conditions (Jain et al., 2021; Vijith et al., 2016). Whereas in the central region, enhanced downwelling was associated with shoaling mixed layers (strong inverse correlation, p = −0.6). The central region of the leeward coastline had a more complicated response to wind forcing, whereby a mixture of physical processes was superimposed and modified MLD differently. Understanding subsurface temperature variability via the framework of Ekman layers interacting with reef islands, usually applied to 20–40 km islands, might be limited by coastline complexity here (Spall and Pedlosky, 2013; Kämpf et al., 2023). Specifically, coastline irregularity at the 0.1−1 km-scale has been shown to drive horizontal shearing and contribute to coastal up- and downwelling (Mazzini and Barth, 2013).
At all stations, pronounced diurnal and semidiurnal peaks in the 5−60 m reef temperature data matched wind harmonics (Figures 2, 4). At 5–40 m, the former can be attributed to the combination of near-surface diurnal mixing as a response to solar heating and the diurnal wind cycle, which has been shown to disrupt the steady-state Ekman transport [see Wenegrat and McPhaden (2016) and references within]. Semidiurnal temperature variations at 5−10 m depths, undetected at 20m, highlight a typical response to semidiurnal variations in zonal winds, generally attributed to atmospheric thermal tides (Deser and Smith, 1998; Dai and Deser, 1999). At 60m, well below the MLD range, diurnal heating would be expected to be minimal (de Boyer Montegut et al., 2004). Reef temperatures also varied at 4−8 cpd, most notably at 40−60 m depths, matching higher wind harmonics. This high-frequency variability indicates short-lived phenomena, reminiscent of tropical instability waves (Jing et al., 2014; Köhler et al., 2018), which cannot be further described with the present data.
4.2 Wind stirring and mixing
Variability of reef temperatures due to direct wind forcing was directly observed along the leeward coastline of Curaçao. The reef temperatures responded to the establishment of steady-state Ekman transport and also varied at higher frequencies, matching wind changes. Short-lived interactions between wind and solar cycles and turbulence-driven mixing are thus expected to impact the subsurface structure (Jing et al., 2014; Köhler et al., 2018; Wenegrat and McPhaden, 2016; Kirincich and Barth, 2009; Farmanara et al., 2018). Across the three regions, 5−40 m reef temperatures were inversely correlated to wind speed for 10%−30% of the year (Supplementary Figure S2), indicating that the wind drives net upwelling of colder waters onto the reef for up to a third of the year. The positive correlation at 40−60 m depths is indicative that variability is also affected by subsurface processes.
Direct wind mixing was only partly responsible for MLD variability (Figure 8). MLD correlates to wind speeds and increases near-linearly with increased wind speeds in the northwest and southeast regions, indicating wind-driven mixing and deepening of the MLD through the homogenization of surface waters (de Boyer Montegut et al., 2004; Giunta and Ward, 2022). However, in the central sites and Oostpunt, MLDs were inversely correlated with wind speeds and decreased near-linearly when wind speeds increased. Thus, direct wind mixing was not the dominant mechanism responsible for MLD variations in central Curaçao.
Stratification in the surface mixed layer and the thermocline both responded to wind mixing and buoyancy flux-driven restratification (Figure 9). The potential energy deficit per unit volume, ϕ/H, was used here to measure bulk stratification as the work required a mixed stratified water column of depth H (Bowman et al., 1983; Valcarcel et al., 2024). Wind-driven turbulence was relatively high during periods of prevailing winds, actively mixing the surface layer and reducing ϕ/H. The direct mixing, aided by the steady-state Ekman-driven downwelling background, increased the MLD and interior ϕ/H, as warmer waters were transported deeper and separated from colder waters below the thermocline over a shallower depth. Fluctuations in wind speed during the prevailing winds forcing (12−20 April) directly translated to variations of interior ϕ/H (Figure 9a). During the relaxation of surface winds (21−25 April), surface buoyancy fluxes contributed to re-stratification (Supplementary Figure S4). The increased surface turbulence above the MLD increased ⟨b⟩ fivefold and allowed for ϕ/H to double on average (Figure 10e). These perturbations to the dominant downwelling regime in Curaçao can, in turn, feed back into the steady-state Ekman circulation, as fluctuations in subsurface stratification have been shown to alter the magnitude of cross-shelf exchanges at a given depth, e.g., reduced downwelling when stratification is weak (Kirincich and Barth, 2009; Farmanara et al., 2018).
Figure 9
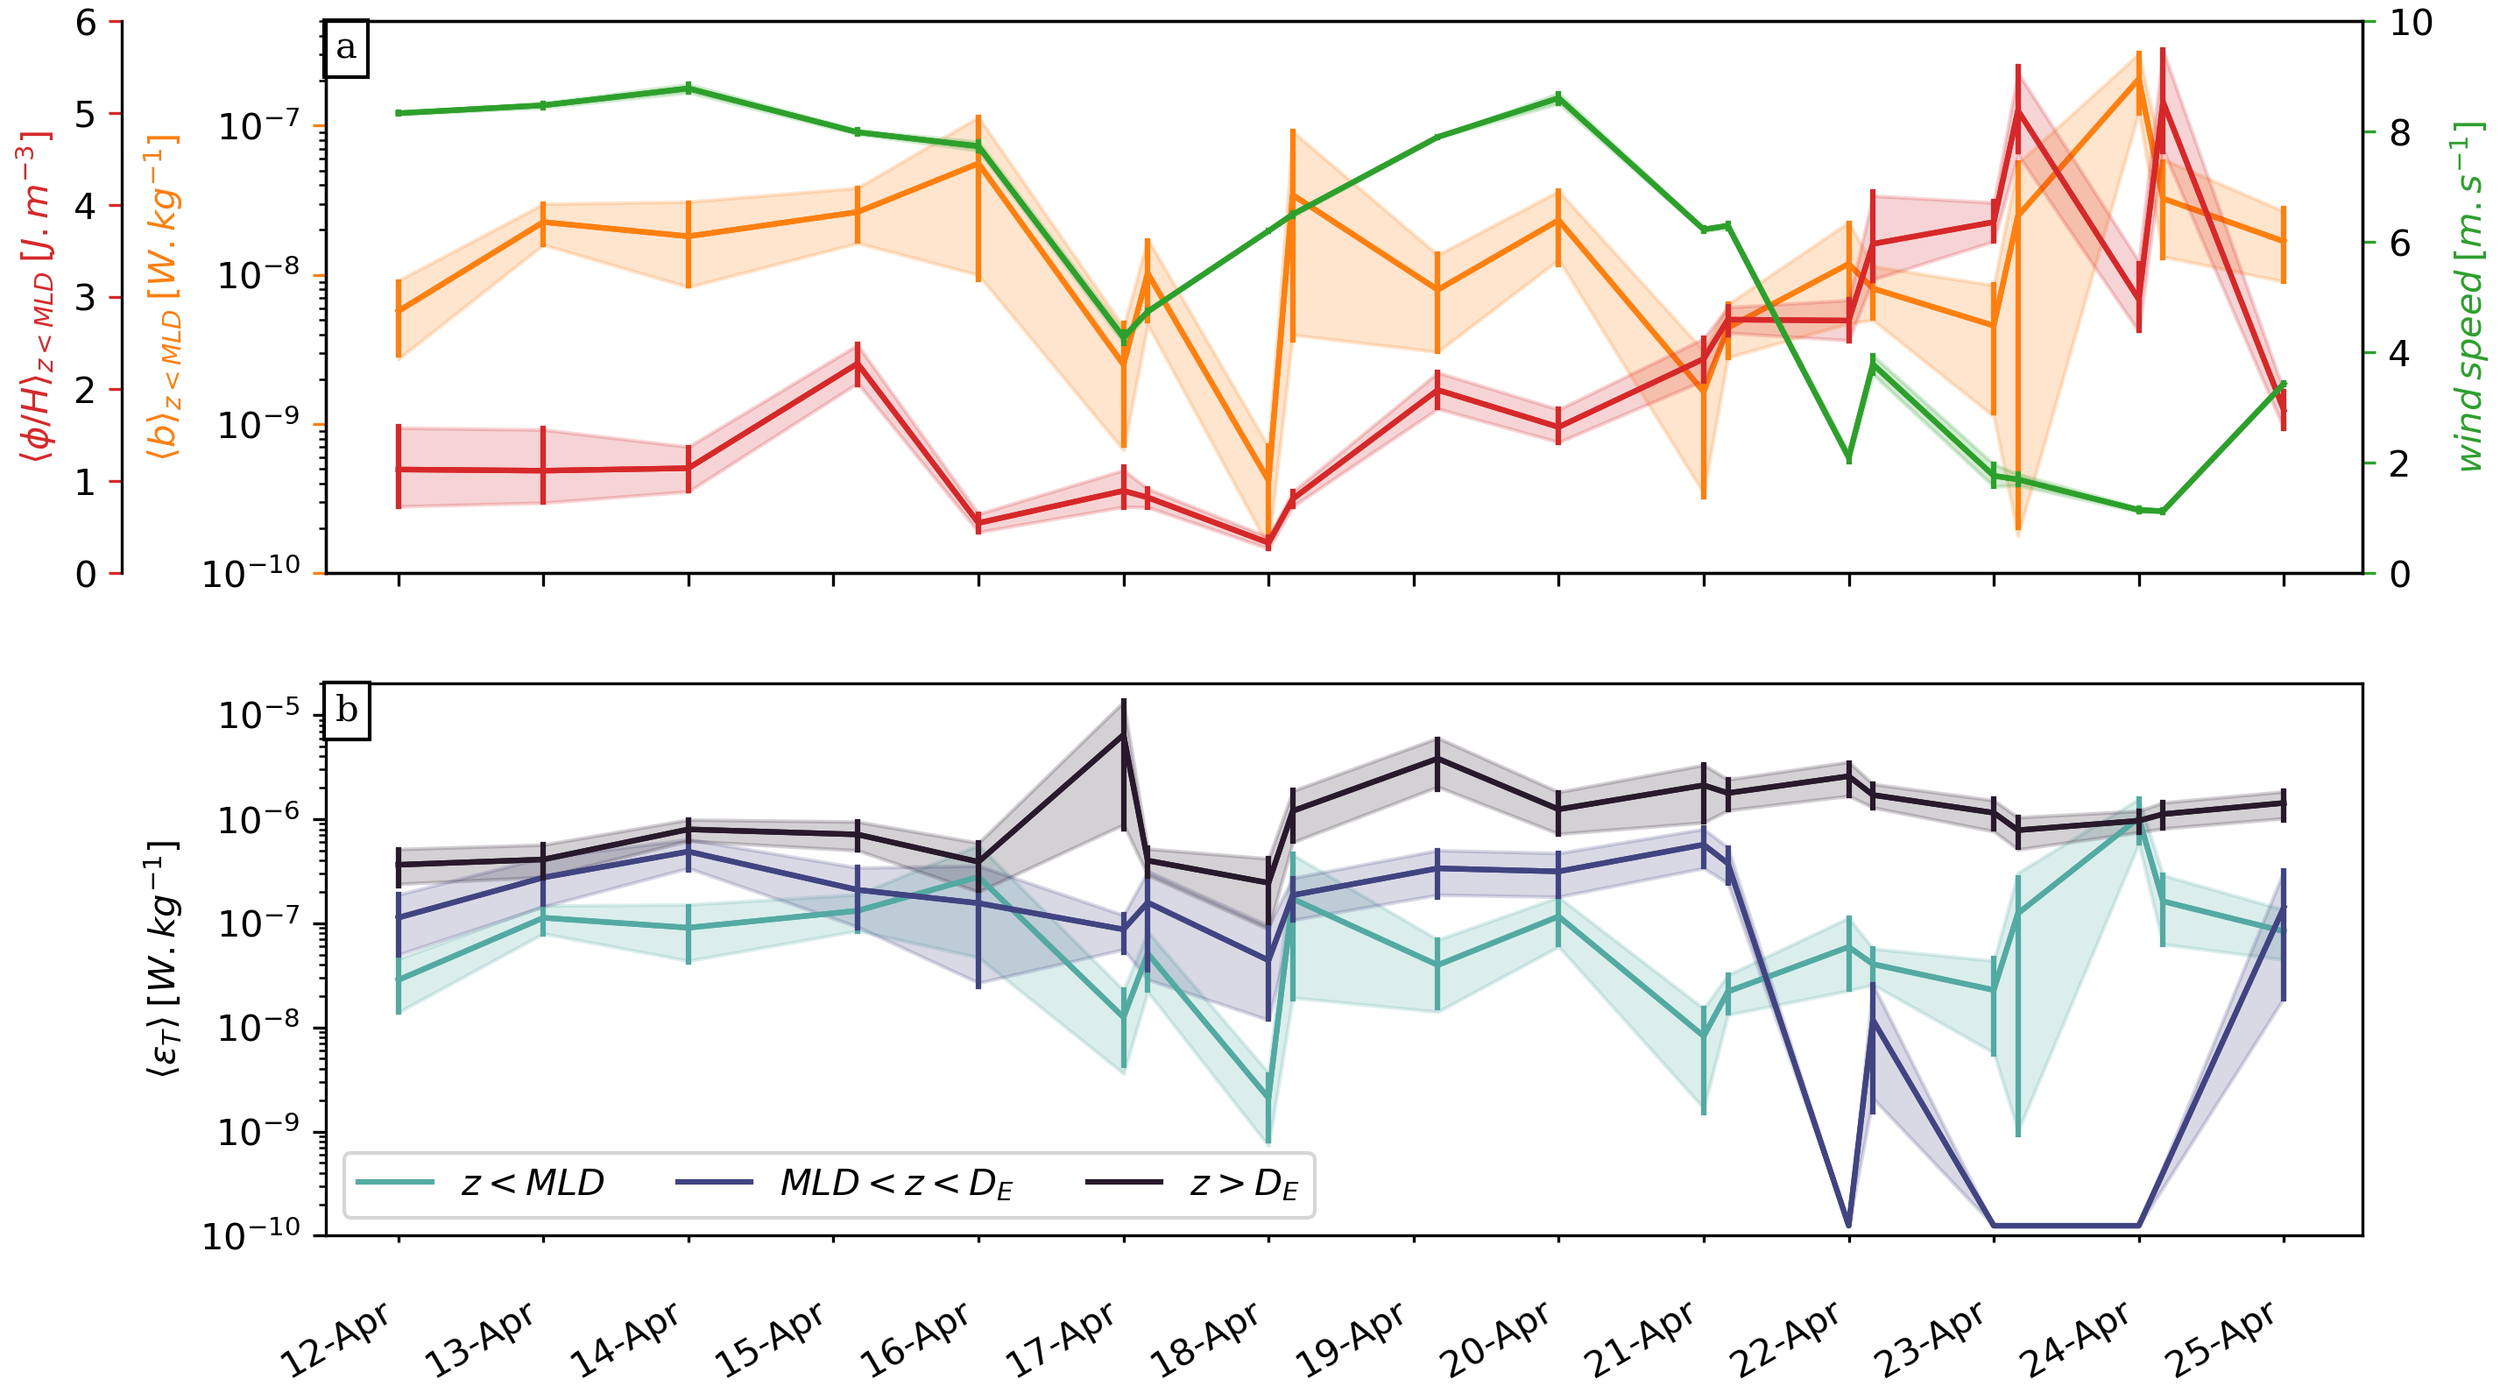
Time-series of mean (a) bulk stratification (red), buoyancy flux (orange) above the MLD, and wind speeds (green); (b) dissipation rates in depths above the MLD (light blue), between MLD and DE (grey blue), and below DE (dark blue). The dark colored lines and barred shading indicate the 4 h mean and 95% bootstrapped confidence interval, respectively.
Figure 10
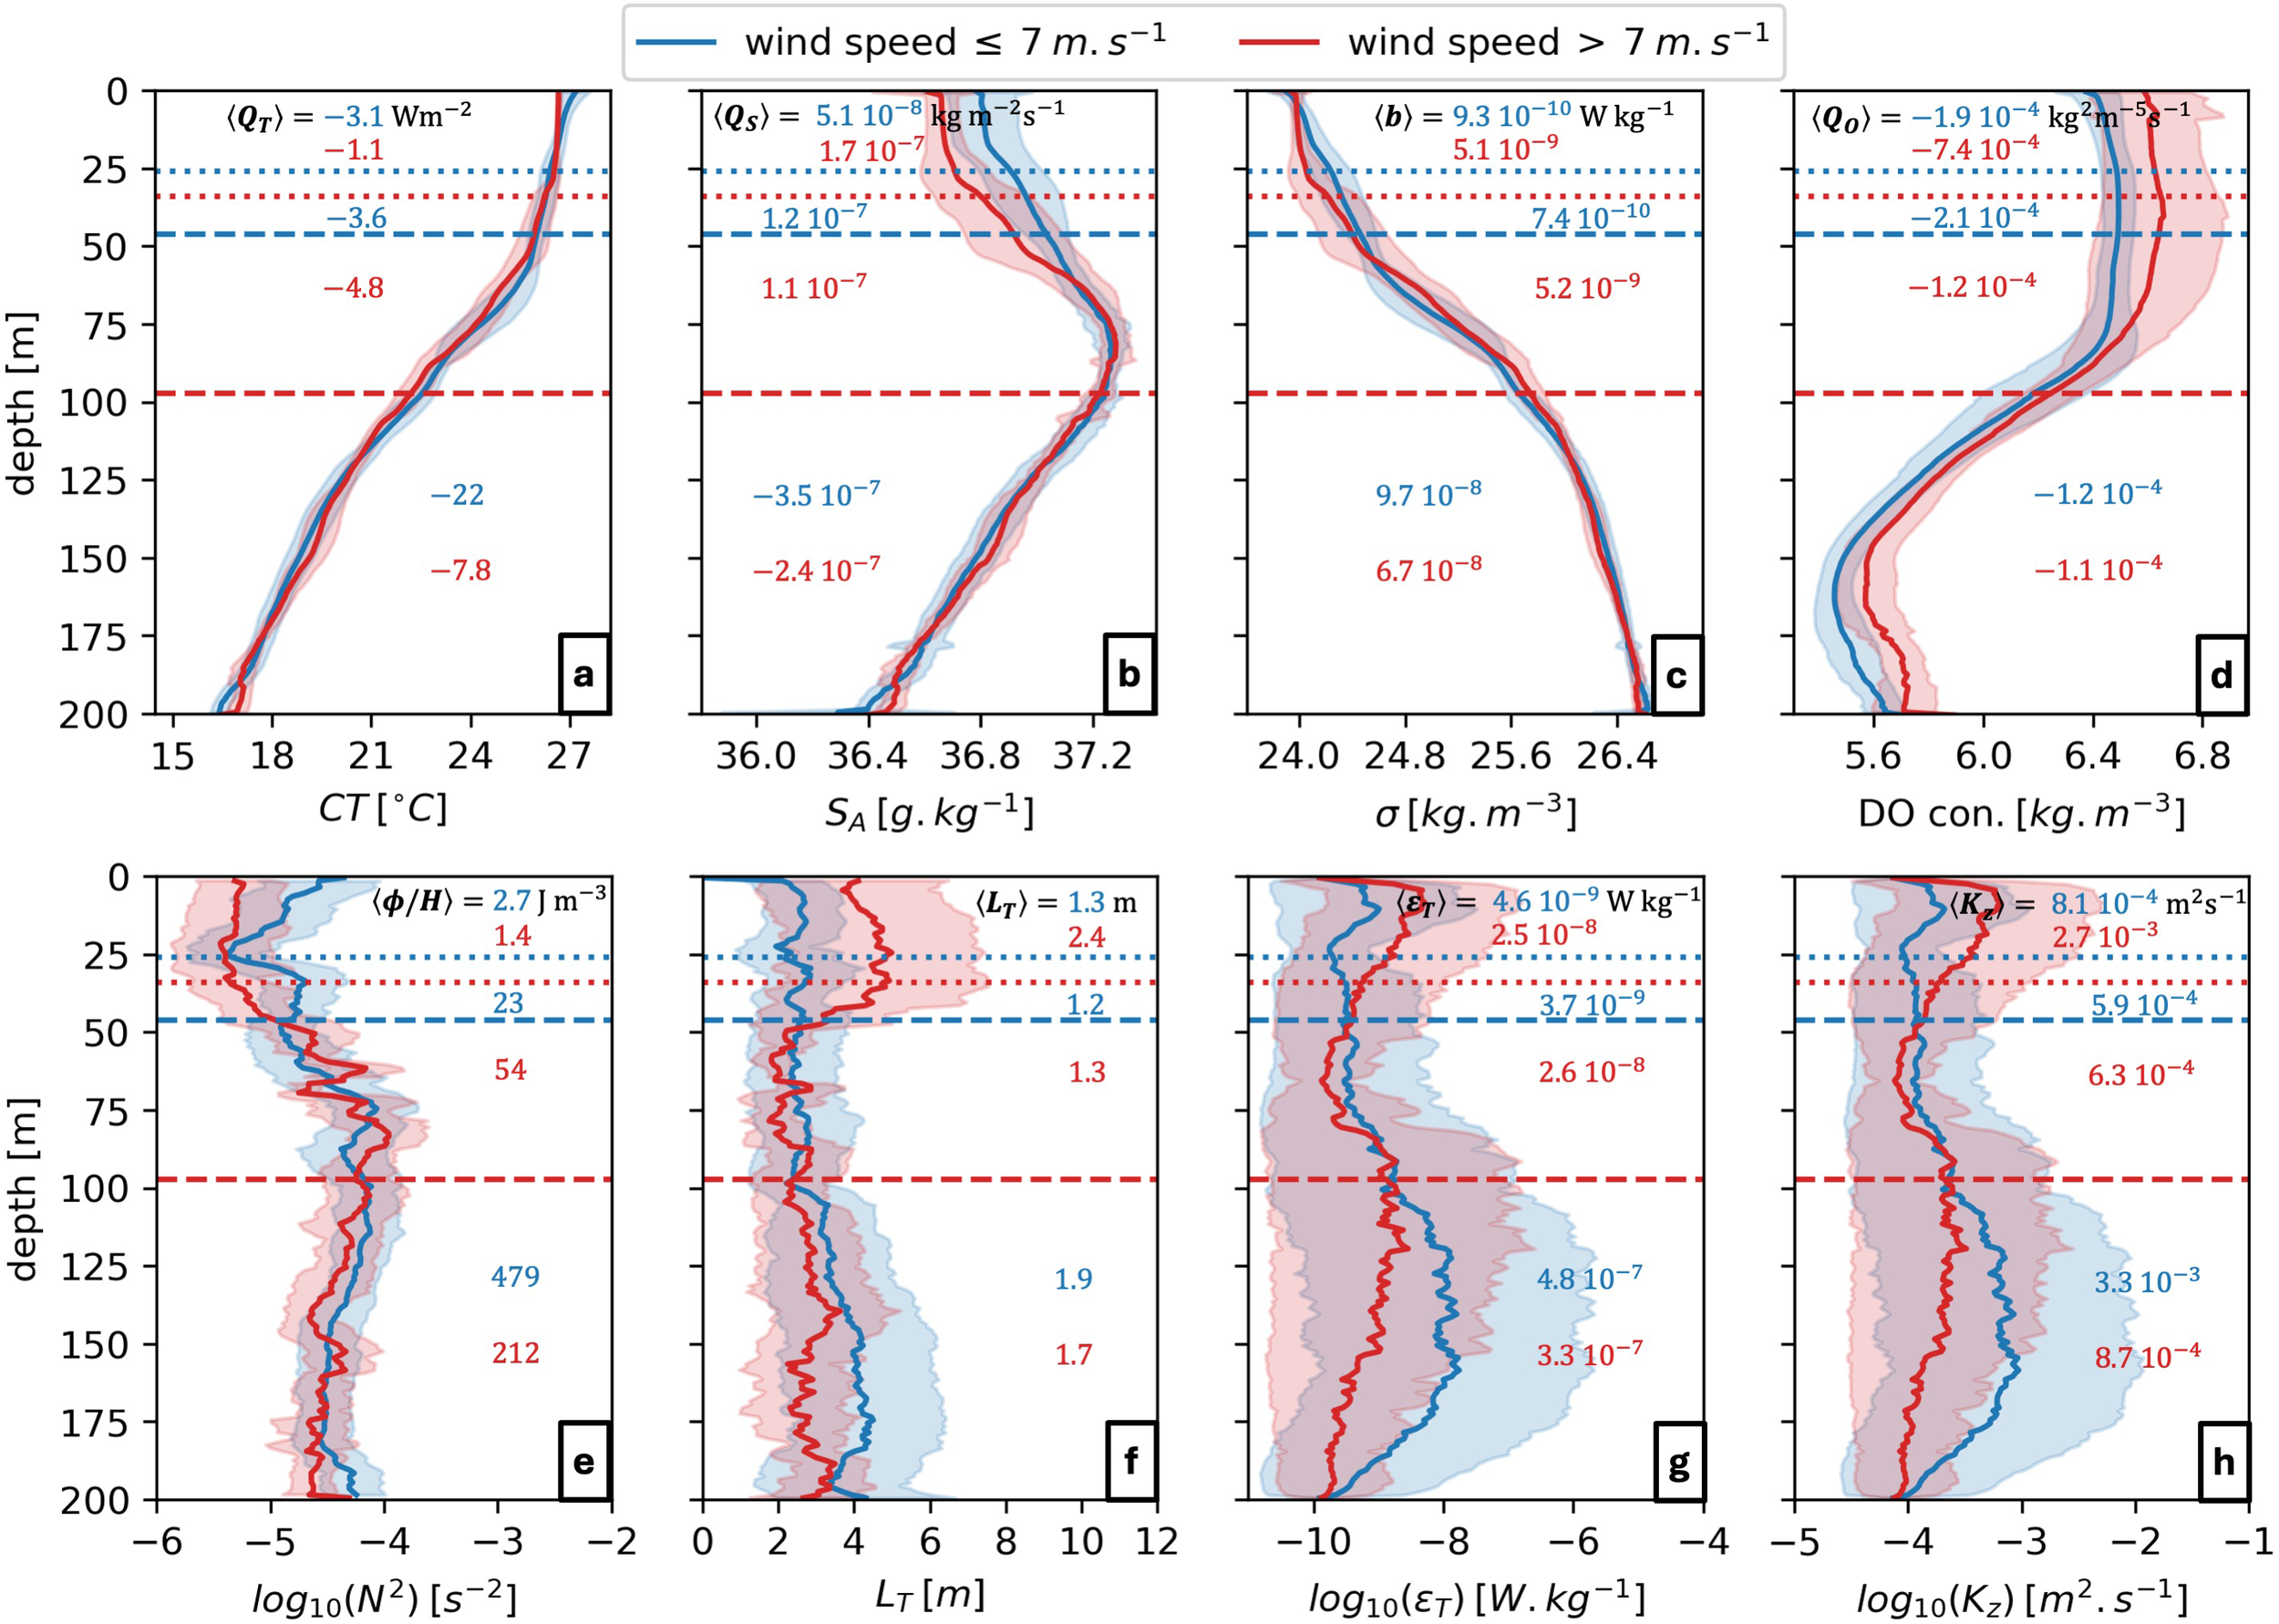
Time-averaged CTD profiles delineated by wind speed range for (a) conservative temperature, (b) absolute salinity, (c) density anomaly, (d) dissolved oxygen saturation, (e) buoyancy frequency squared, (f) Thorpe length-scale, (g) dissipation rate, and (h) diapycnal diffusivity. Data subsets when wind speeds are inferior to or exceed 7ms−1 are colored in blue and red, respectively. Standard deviation envelopes are shaded. Subset-averaged mixed layer and Ekman layer depths are shown in colored dashed and dotted lines, respectively. Depth and wind regime averages are also indicated for (a) heat flux, (b) salt flux, (c) buoyancy flux, (d) oxygen flux, (e) stratification content, (f) Thorpe length-scale, (g) dissipation rate, and (h) diapycnal diffusivity. See Supplementary Figure S4 for the daily distributions of turbulent fluxes.
The transition from prevailing trade winds to the weak westerlies drives variations in vertical turbulent exchanges in and across these three layers (Figures 10 and Supplementary Figure S4). On average, the MLD increased from 26 to 34 m during periods of high wind forcing. During periods of high wind forcing, subsurface salinity was fresher and dissolved oxygen higher at 0−60 m and 0−80 m, respectively, relative to low wind periods (Figures 10a–d). The higher winds generated small-scale turbulent overturning, elevated diapycnal diffusivity, and rearranged the vertical density gradients. The combined outcome was a halved downward heat flux in the wind-affected depths (< DE) (Figure 10h). The average upward vertical flux of salinity and downward oxygen flux quadrupled in the MLD during high winds (Figures 10c, d). The wind forced turbulence variations at 0−30 m depths and below at times, thus shaping the heat, salt, and oxygen content and associated biophysical responses (Gunn et al., 2021; Sheehan et al., 2023).
4.3 Semidiurnal temperature fluctuations
Temperature fluctuations at semidiurnal frequencies significantly dampened seasonal reef temperature variations at 40−60 m depths. Reef temperatures at 40−60 m depths were 1°C−4°C cooler than at shallow depths from June to January (Figure 4). The vertical structure was decorrelated from surface forcing, internally driven, as the semidiurnal peaks in the 40–60 m temperature logger data were not present in the < 20 m data. The cooled waters were transported upwards from 60 to 40−10 m at semidiurnal frequency through April (Figure 5). Although barotropic tides are not expected to drive significant temperature fluctuations (mean tidal range of 0.3m, see Bertoncelj et al. (2024)), sampling limitations prevented us from determining whether the fluctuations originated in the vertical entrainment of the thermocline due to the barotropic tide or the propagation and breaking of internal, baroclinic, tides (Thorpe, 2018; van Haren et al., 2019, van Haren et al., 2022).
Turbulent mixing was intensified below DE and enhanced vertical fluxes of heat and mass. Here, winds influenced subsurface properties at 20−120 m. This included surface turbulence enhancement and stratification strengthening below the MLD. However, regardless of wind forcing, turbulent dissipation below DE was larger than above throughout most of the period, by an order of magnitude or more (Figures 9b, 10g). The associated heat flux was six times higher below DE than above on average. This indicates that internal processes drove turbulent fluxes to a higher proportion than increased wind forcing. For example, on 24 April, modulation of isopycnal depths at 50−150 m was observed, which had a semidiurnal envelope (Figure 7), suggesting the propagation of internal tides (Lamb, 2014; Woodson, 2017). It is highly plausible that the radiation of internal tides, estimated to be generated strongly offshore of the northwest shore (see Supplementary Figure S5), would be supported by the strong mid-water stratification and eventually contribute to the observed semidiurnal fluctuations of reef temperatures (de Lavergne et al., 2019; Wyatt et al., 2020; Guillaume-Castel et al., 2021).
4.4 Warming and cooling
Cold water intrusions have the potential to mitigate heat stress accumulation on the upper-mesophotic coral reefs of Curaçao’s leeward coastline. Reef temperature fluctuations at semidiurnal frequencies of up to 4°C from ambient levels can occur at 20 − 60m water depth (Figures 4, 5). The CTD observations are insufficient to establish the source of the semidiurnal temperature fluctuations. Nevertheless, the thermal fluctuations presented here were comparable to internal wave-driven cooling in depths above 50m in the subtropical-tropical Pacific, where cumulative heat exposure was reduced by up to 88% (Wyatt et al., 2020). Severe heat accumulation, linked with acute coral bleaching and mortality, was also shown to be mitigated by internal tides, and was identified as a primary thermal relief contributor in future climate scenario (Wyatt et al., 2020; Storlazzi et al., 2020).
Wind-driven upwelling from offshore Ekman transport can also contribute to providing transient thermal relief. In northwest sites, positive Ekman transport is expected to drive weak to moderate upwelling (Figure 3). Although Ekman transport is only episodically strong enough to drive nutrient transport (see Section 4.1), isotherms and isopycnals notably shoal during upwelling-favorable winds (Figure 6). The Ekman layer depth ranged from 20 to 100 m, indicating that some cooling would affect reefs at mesophotic depths. The net environmental impact of coastal upwelling-driven thermal relief is, however, cryptic, due to their high spatiotemporal variability (Salois et al., 2022) and was not quantified in this study.
Turbulence can drive diapycnal mixing and upwelling of cooler waters in the upper ocean. On average, winds above 7 ms−1 had an order of magnitude diffusivity increase, associated with an approximately 2°C decrease at depths above 20m (Figure 10). The depth of wind influence for that regime extended to ∼100 m, so it would also affect mesophotic reefs. Reef temperatures correlated with wind speeds (see Section 4.2), indicating that wind mixing significantly contributed to reef cooling. The 9 ms−1 easterly wind conditions observed here were representative of typical large-scale wind forcing on the Curaçao coastline (Figure 3), but likely an underestimate of local wind stress on the reef as shallow water fringing reef sea-air interactions accelerate air current (McGowan et al., 2022). Further, increased winds were associated with increased dissolved oxygen fluxes (Figure 10). This echoes observations in the neighboring Veracruz reef system, where similar wind forcing and wind-driven vertical mixing were found to control temperature, chlorophyll, and dissolved oxygen concentrations at depths above 50 m (Salas-Monreal et al., 2022).
The dominant wind regime for the leeward Curaçao coastline potentially contributes to reef warming. Most of the leeward coastline orientation promotes Ekman-driven downwelling of warmer surface waters (see Section 4.1). During periods of intensified downwelling, shallow temperatures homogenize and the MLD increases, albeit with along-island nuances at depth. At times, this supports 0.5°C −1°C warming in near-surface waters (< 20m) along the entire 70 km of coastline (Figure 5), which aligns with reef island dynamics forced by a steady wind field (Spall and Pedlosky, 2013; Kämpf et al., 2023).
5 Concluding remarks
Time-series of reef temperatures and CTD profiles were obtained along the leeward coastline of the Caribbean reef island Curaçao. The focus of analysis here was the period from May 2022 to 2023, with high-frequency sampling in the latter part. Significant inter-annual variability was found in reef temperatures in various spectral bands, indicating a response to wind and tidal forcing frequencies. Cooling at depth was evident and more pronounced towards the southeast, with semidiurnal temperature fluctuations driving an up to 4°C decrease at 60m from surface warming during summer months. CTD profiles showed subsurface responses to surface-driven mixing and internal turbulence.
Two main wind configurations were observed. First, easterly trade winds ranged from 6−10 ms−1 for 80% of the year (Figure 11a). In this case, the main surface circulation is the westward Caribbean current, which overlays the eastward Caribbean undercurrent. Downwelling-favorable Ekman transport dominates subsurface temperature variability on the leeward side. While direct correlation was observed in shallow depths during periods of the year, much more complexity was identified, due to, e.g., coastline orientation and stratification configurations. Direct response to winds, turbulent mixing at the surface, was more clearly related to the deepening of the mixed layer and the upwelling of cooler waters on the shallow portions of the reef. Second, periods of easing winds, westerlies on average, were directly observed (Figure 11b). In this scenario, the Caribbean countercurrent extended to the surface, and weak Ekman-transport-driven upwelling occurs on the leeward side of Curaçao. Due to a lack of surface mixing, the mixed layer will be shallowest, and re-stratification will be active and buoyancy-flux driven.
Figure 11
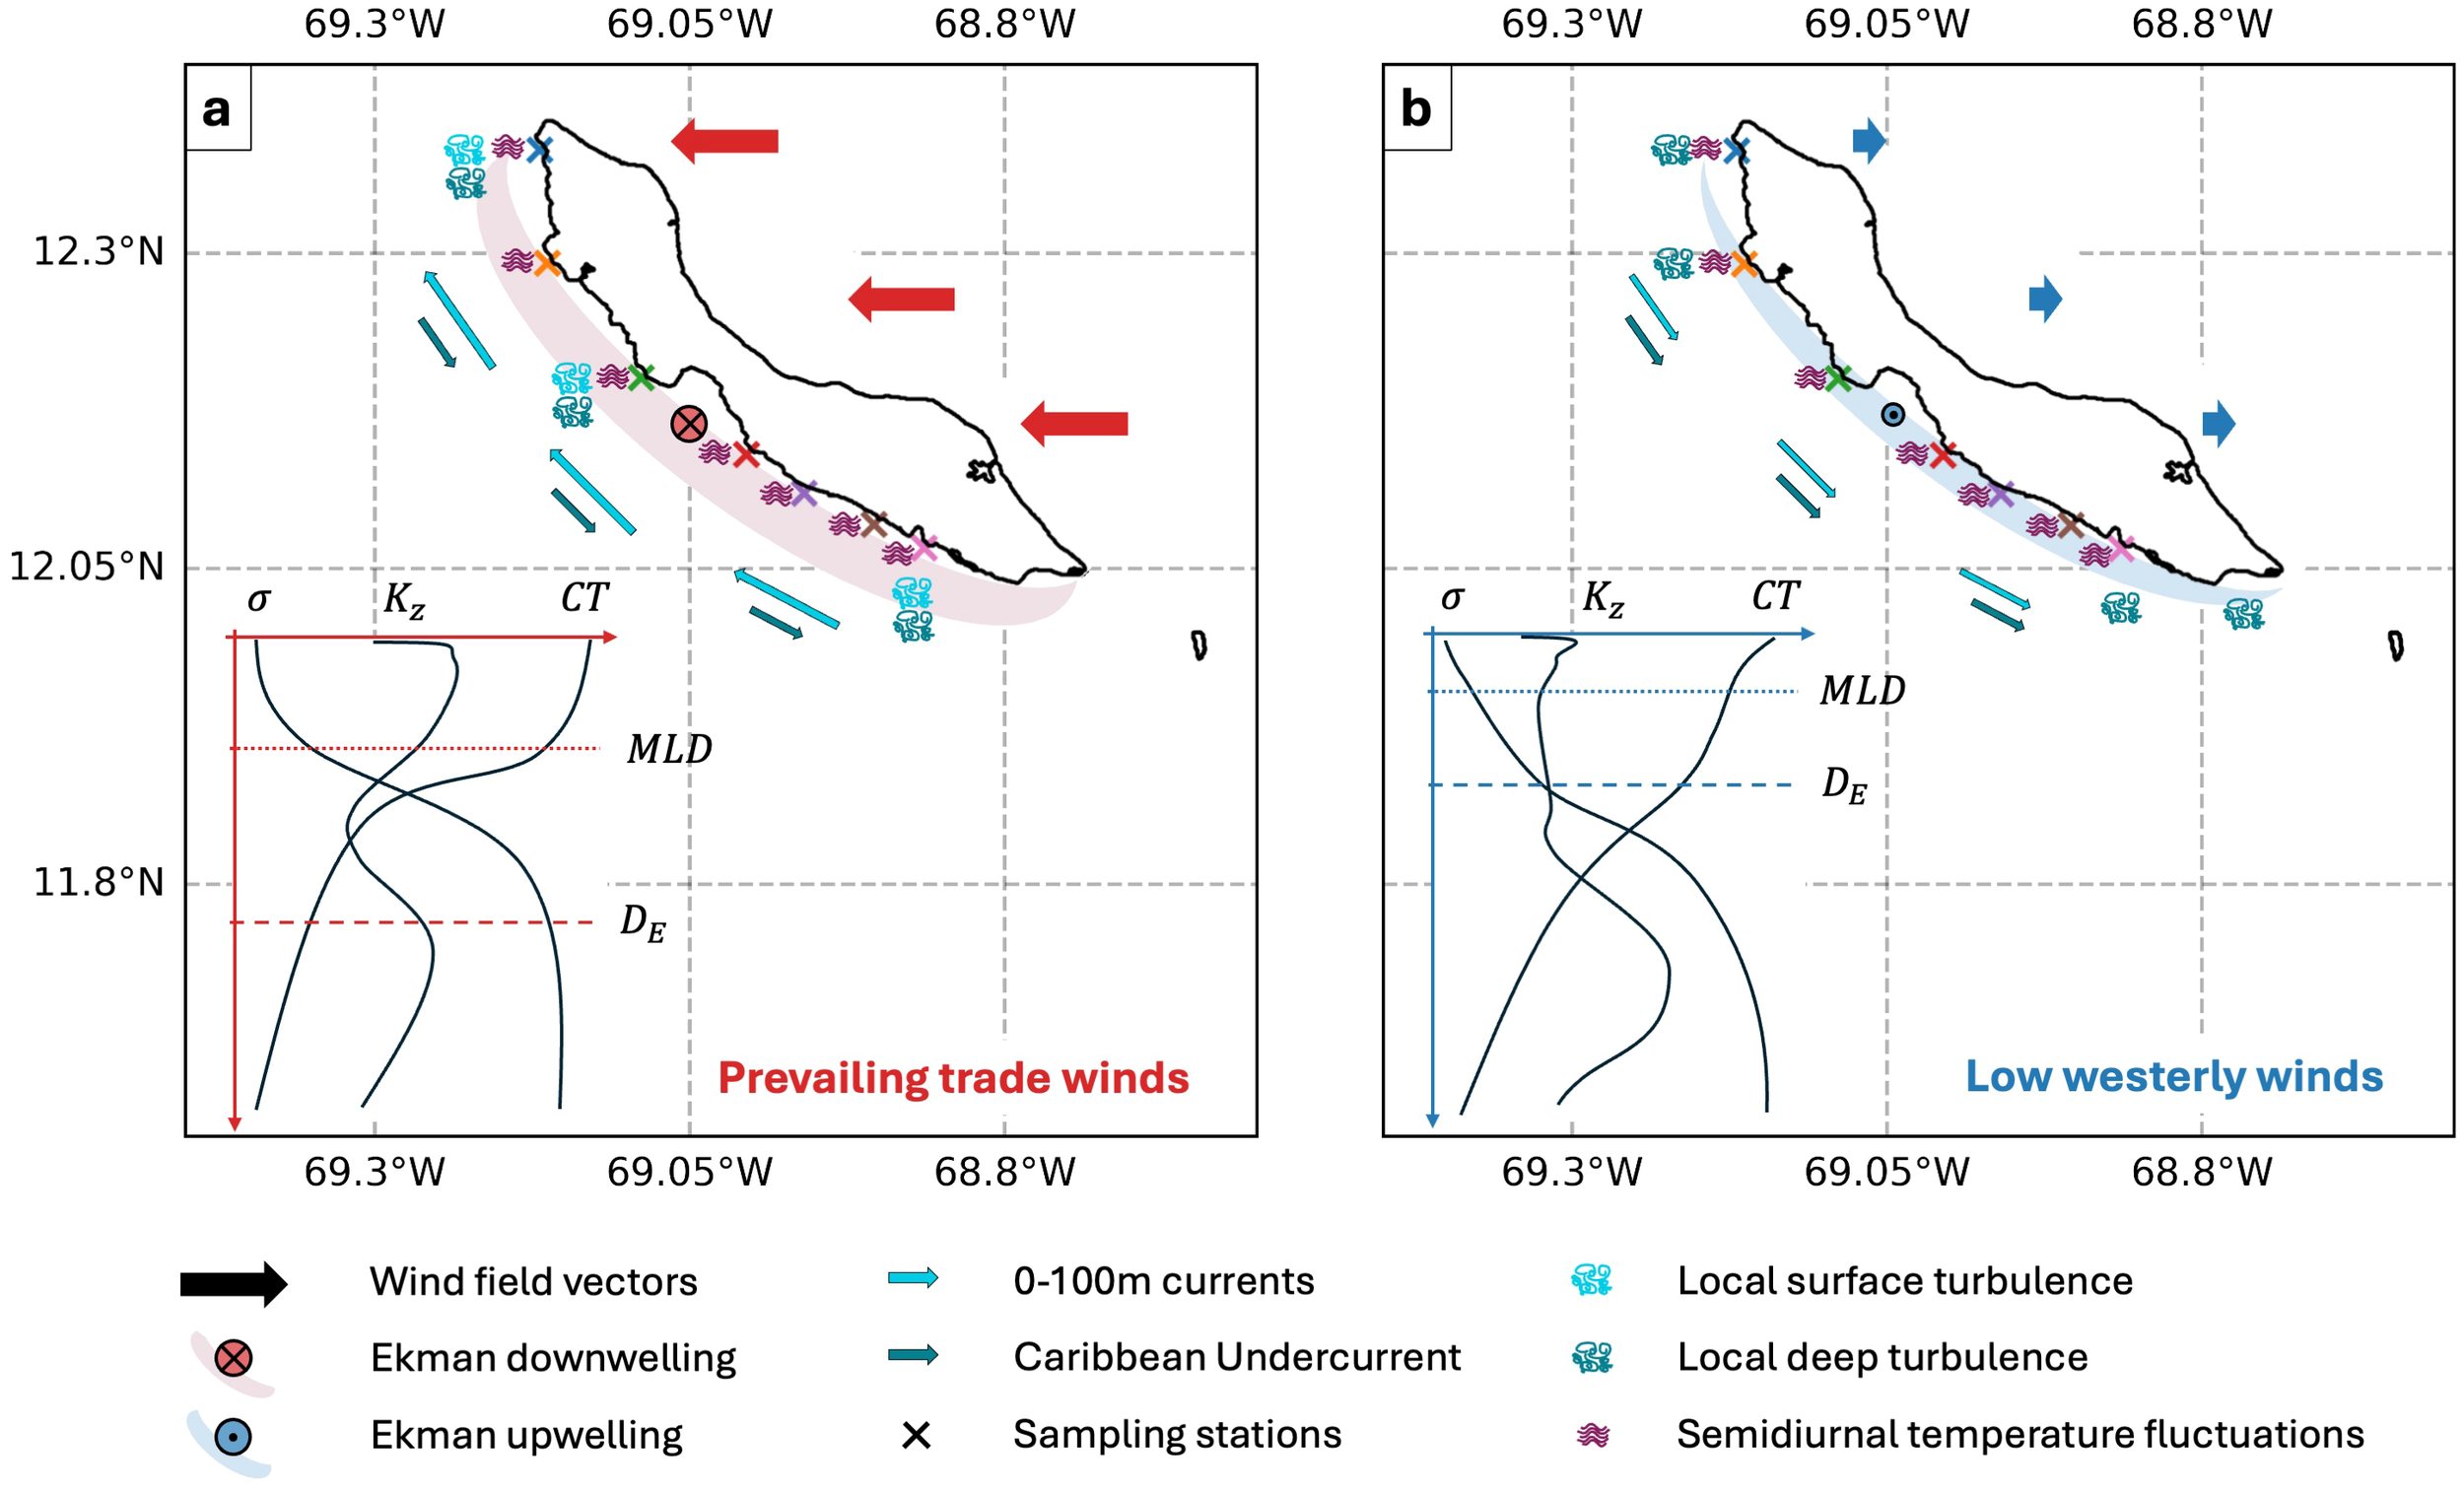
Conceptual sketch of the physical processes at play around Curaçao and mean conservative temperature, potential density, and diapycnal diffusivity profiles during periods of (a) prevailing trade winds and (b) low westerly winds. The figure graphically summarizes the observations made in this study and the conclusions outlined in Section 5.
This study directly observed the dynamic interactions between wind-driven processes and internal processes on a ∼70 km-long island coastline, and encourages further examination of the biophysical drivers that may provide thermal relief to tropical reef ecosystems.
Statements
Data availability statement
The datasets presented in this study can be found in online repositories. The names of the repository/repositories and accession number(s) can be found below: SEANOE link https://github.com/pimbongaerts/monitoring.
Author contributions
AV: Data curation, Formal analysis, Investigation, Methodology, Visualization, Writing – original draft, Writing – review & editing. JO’C: Conceptualization, Funding acquisition, Investigation, Project administration, Resources, Supervision, Writing – original draft, Writing – review & editing. MV: Investigation, Resources, Writing – review & editing.
Funding
The author(s) declare that financial support was received for the research and/or publication of this article. We thank Inkfish LLC (USA) which funded Expedition Curacao. This research was a collaboration between Inkfish and CARMABI. We thank the captains and vessel crew of MY Rocinante, MY Game Changer and MY Dapple for the vessel and expedition support. MV was partly supported through the project “Land, Sea, and Society: Linking terrestrial pollutants and inputs to nearshore coral reef growth to identify novel conservation options for the Dutch Caribbean (SEALINK)” with project number NWOCA.2019.003 of the research program “Caribbean Research: a Multidisciplinary Approach.
Acknowledgments
We acknowledge the funding for the temperature logger data collection from “Hope for Reefs Initiative at the California Academy of Sciences”. The deployments were conducted with assistance from the Inkfish fleet crew. We thank the two reviewers, whose constructive feedback greatly improved the manuscript from its earlier version.
Conflict of interest
Authors AV and JO’C were employed by the company Oceanly Science Limited.
The authors declare that this study received funding from Inkfish LLC. The funder had the following involvement in the study: data collection (operational and vessel support).
The remaining author declares that the research was conducted in the absence of any commercial or financial relationships that could be construed as a potential conflict of interest.
Generative AI statement
The author(s) declare that Generative AI was used in the creation of this manuscript.
Publisher’s note
All claims expressed in this article are solely those of the authors and do not necessarily represent those of their affiliated organizations, or those of the publisher, the editors and the reviewers. Any product that may be evaluated in this article, or claim that may be made by its manufacturer, is not guaranteed or endorsed by the publisher.
Supplementary material
The Supplementary Material for this article can be found online at: https://www.frontiersin.org/articles/10.3389/fmars.2025.1546596/full#supplementary-material
References
1
Andrade C. A. Barton E. D. Mooers C. N. (2003). Evidence for an eastward flow along the central and south american caribbean coast. J. Geophys. Res.108, 3185. doi: 10.1029/2002jc001549
2
Bakun A. (1973). Coastal upwelling indices, west coast of North America, 1946–71. NOAA Technical Report NMFS SSRF-671.
3
Becherer J. Burchard H. Carpenter J. R. Graewe U. Merckelbach L. M. (2022). The role of turbulence in fueling the subsurface chlorophyll maximum in tidally dominated shelf seas. J. Geophysical Research: Oceans127, e2022JC018561. doi: 10.1029/2022JC018561
4
Bertoncelj V. Mienis F. Stocchi P. van Sebille E. (2024). Flow patterns, hotspots and connectivity of land-derived substances at the sea surface of curac¸ao in the southern caribbean. EGUsphere2024, 1–29. doi: 10.5194/egusphere-2024-3112
5
Bongaerts P. Frade P. R. Hay K. B. Englebert N. Latijnhouwers K. R. Bak R. P. et al . (2015). Deep down on a caribbean reef: Lower mesophotic depths harbor a specialized coral-endosymbiont community. Sci. Rep.5, 7652. doi: 10.1038/srep07652
6
Bowman M. J. Kibblewhite A. C. Chiswell S. M. Murtagh R. A. (1983). Shelf fronts and tidal stirring in greater cook strait. Oceanologica Acta6, 119–129.
7
Copernicus Marine Service (CMEMS) (2024a). Global Ocean Hourly Sea Surface Wind and Stress from Scatterometer and Model (WIND_GLO_PHY_L4_NRT_012_004) [Data set]. Copernicus Marine Environment Monitoring Service. doi: 10.48670/moi-00305
8
Copernicus Marine Service (CMEMS) (2024b). Global Ocean Monthly Mean Sea Surface Wind and Stress from Scatterometer and Model (WIND_GLO_PHY_CLIMATE_L4_MY_012_003) [Data set]. Copernicus Marine Environment Monitoring Service. doi: 10.48670/moi-00181
9
Copernicus Marine Service (CMEMS) (2024c). Global Ocean Physics Analysis and Forecast (GLOBAL_ANALYSISFORECAST_PHY_001_024) [Data set]. Copernicus Marine Environment Monitoring Service. doi: 10.48670/moi-00016
10
Dai A. Deser C. (1999). Diurnal and semidiurnal variations in global surface wind and divergence fields. J. Geophysical Res. Atmospheres104, 31109–31125. doi: 10.1029/1999JD900927
11
de Boyer Montegut C. Madec G. Fischer A. S. Lazar A. Iudicone D. (2004). Mixed layer depth over the global ocean: An examination of profile data and a profile-based climatology. J. Geophys. Res.109, C12003. doi: 10.1029/2004JC002378
12
de Lavergne C. Falahat S. Madec G. Roquet F. Nycander J. Vic C. (2019). Toward global maps of internal tide energy sinks. Ocean Modelling137, 52–75. doi: 10.1016/j.ocemod.2019.03.010
13
Deser C. Smith C. A. (1998). Diurnal and semidiurnal variations of the surface wind field over the tropical pacific ocean. J. Climate11 (7), 1730–1748. doi: 10.1175/1520-0442(1998)011<1730:DASVOT>2.0.CO;2
14
Dillon T. M. (1982). Vertical overturns: A comparison of thorpe and ozmidov length scales. J. Geophysical Research: Oceans87, 9601–9613. doi: 10.1029/JC087iC12p09601
15
Esters L. Breivik Øyvind Landwehr S. ten Doeschate A. Sutherland G. Christensen K. H. et al . (2018). Turbulence scaling comparisons in the ocean surface boundary layer. J. Geophysical Res.123 (3), 2098–2112. doi: 10.1002/2017jc013525
16
Farmanara M. Malakooti H. Hassanzadeh S. (2018). Large eddy simulation of the ekman transport in a stratified coastal sea: A case study of the persian gulf. Estuarine Coastal Shelf Sci.212, 372–386. doi: 10.1016/j.ecss.2018.08.003
17
Firing E. Lukas R. (1985). Sampling and aliasing during the norpax hawaii-to-tahiti shuttle experiment. J. Geophysical Research: Oceans90, 11709–11718.
18
Fischer T. Banyte D. Brandt P. Dengler M. Krahmann G. Tanhua T. et al . (2013). Diapycnal oxygen supply to the tropical north atlantic oxygen minimum zone. Biogeosciences10, 5079–5093. doi: 10.5194/bg-10-5079-2013
19
Galland G. R. Hastings P. A. Leichter J. J. (2019). Fluctuating thermal environments of shallow-water rocky reefs in the gulf of california, Mexico. Sci. Rep.9, 18022. doi: 10.1038/s41598-019-53730-0
20
Gallegos A. (1996). Descriptive physical oceanography of the Caribbean Sea. In MaulG. A. Ed. Small Islands: Marine Science and Sustainable Development (Washington, DC: American Geophysical Union) pp. 36–55. doi: 10.1029/ce051p0036
21
Giunta V. Ward B. (2022). Ocean mixed layer depth from dissipation. J. Of Geophysical Research: Oceans127 (4), e2021JC017904. doi: 10.1029/2021jc017904
22
Gregg M. C. D’asaro E. A. Riley J. J. Kunze E. (2018). Mixing efficiency in the ocean. Ann. Rev. Mar. Sci.10, 443–473. doi: 10.1146/annurev-marine-121916
23
Guillaume-Castel R. Williams G. J. Rogers J. S. Gove J. M. Green J. A. (2021). Quantifying upwelling in tropical shallow waters: A novel method using a temperature stratification index. Limnology Oceanography: Methods19, 566–577. doi: 10.1002/lom3.10449
24
Gunn K. L. Dickinson A. White N. J. Cille P. Caulfield C. (2021). Vertical mixing and heat fluxes conditioned by a seismically imaged oceanic front. Front. Marine Sci.8. doi: 10.3389/fmars.2021.697179
25
Hughes T. P. Kerry J. T. Álvarez Noriega M. Álvarez Romero J. G. Anderson K. D. Baird A. H. et al . (2017). Global warming and recurrent mass bleaching of corals. Nature543, 373–377. doi: 10.1038/nature21707
26
Ince E. S. Abrykosov O. Förste C. (2024). Gdemm2024: Global digital elevation merged model 2024 for surface, bedrock, ice thickness, and land-type masks. Sci. Data11, 1087. doi: 10.1038/s41597-024-03920-x
27
Intergovernmental Oceanographic Commission (IOC) Scientific Committee on Oceanic Research (SCOR) International Association for the Physical Sciences of the Oceans (IAPSO) (2010). “The international thermodynamic equation of seawater – 2010: Calculation and use of thermodynamic properties”. in Intergovernmental Oceanographic Commission, Manuals and Guides No. 56, (Paris: UNESCO). 196 pp. Available online at: https://www.teos-10.org/pubs/TEOS-10_Manual.pdf.
28
Jacox M. G. Edwards C. A. Hazen E. L. Bograd S. J. (2018). Coastal upwelling revisited: Ekman, bakun, and improved upwelling indices for the u.s. west coast. J. Geophysical Research: Oceans123, 7332–7350. doi: 10.1029/2018JC014187
29
Jain V. Shankar D. Vinayachandran P. Mukherjee A. Amol P. (2021). Role of ocean dynamics in the evolution of mixed-layer temperature in the bay of bengal during the summer monsoon. Ocean Modelling168, 101895. doi: 10.1016/j.ocemod.2021.101895
30
Jing Z. Wu L. Wu D. Qiu B. (2014). Enhanced 2-h-8-day oscillations associated with tropical instability waves. J. Phys. Oceanography44, 1908–1918. doi: 10.1175/JPO-D-13-0189.1
31
Kämpf J. Möller L. Baring R. Shute A. Cheesman C. (2023). The island mass effect: a study of wind-driven nutrient upwelling around reef islands. J. Oceanography79, 161–174. doi: 10.1007/s10872-022-00673-2
32
Kirincich A. R. Barth J. A. (2009). Time-varying across-shelf ekman transport and vertical eddy viscosity on the inner shelf. J. Phys. Oceanography39, 602–620. doi: 10.1175/2008JPO3969
33
Köhler J. Völker G. S. Walter M. (2018). Response of the internal wave field to remote wind forcing by tropical cyclones. J. Phys. Oceanography48, 317–328. doi: 10.1175/JPO-D-17-0112.1
34
Lamb K. G. (2014). Internal wave breaking and dissipation mechanisms on the continental slope/shelf. Annu. Rev. Fluid Mechanics46, 231–254. doi: 10.1146/annurev-fluid-011212-140701
35
Leahy S. M. Kingsford M. J. Steinberg C. R. (2013). Do clouds save the great barrier reef? satellite imagery elucidates the cloud-sst relationship at the local scale. PloS One8 (7), e70400. doi: 10.1371/journal.pone.0070400
36
Lorente P. Piedracoba S. Montero P. Sotillo M. G. Ruiz M. I. Álvarez Fanjul E. (2020). Comparative analysis of summer upwelling and downwelling events in nw Spain: A model-observations approach. Remote Sens.12 (17), 2762. doi: 10.3390/RS12172762
37
Masunaga E. Fringer O. B. Yamazaki H. Amakasu K. (2016). Strong turbulent mixing induced by internal bores interacting with internal tide-driven vertically sheared flow. Geophysical Res. Lett.43, 2094–2101. doi: 10.1002/2016GL067812
38
Masunaga E. Venayagamoorthy S. K. Wada K. Yamazaki H. (2022). Variability of the diapycnal mixing coefficient in coastal oceans investigated with direct microstructure measurements. J. Marine Syst.230, 103722. doi: 10.1016/j.jmarsys.2022.103722
39
Mater B. D. Venayagamoorthy S. K. Laurent L. S. Moum J. N. (2015). Biases in thorpe-scale estimates of turbulence dissipation. part i: Assessments from large-scale overturns in oceanographic data. J. Phys. Oceanography45, 2497–2521. doi: 10.1175/JPO-D-14-0128.1
40
May R. M. Goebbert K. H. Thielen J. E. Leeman J. R. Camron M. D. Bruick Z. et al . (2022). Metpy: A meteorological python library for data analysis and visualization. Bull. Am. Meteorological Soc.103, E2273–E2284. doi: 10.1175/BAMS-D-21-0125.1
41
Mazzini P. L. Barth J. A. (2013). A comparison of mechanisms generating vertical transport in the Brazilian coastal upwelling regions. J. Geophysical Research: Oceans118, 5977–5993. doi: 10.1002/2013JC008924
42
McGowan H. Lensky N. G. Abir S. Saunders M. (2022). Coral reef coupling to the atmospheric boundary layer through exchanges of heat, moisture, and momentum: Case studies from tropical and desert fringing coral reefs. Front. Marine Sci.9. doi: 10.3389/fmars.2022.900679
43
McWhorter J. K. Halloran P. R. Roff G. Skirving W. J. Mumby P. J. (2022). Climate refugia on the great barrier reef fail when global warming exceeds 3°c. Global Change Biol.28, 5768–5780. doi: 10.1111/gcb.16323
44
Osborn T. (1980). Estimates of the local rate of vertical diffusion from dissipation measurements. J. Phys. Oceanogr.10 (1), 83–89. doi: 10.1175/1520-0485(1980)010<0083:EOTLRO>2.0.CO;2
45
Park Y.-H. Durand I. Lee J.-H. Provost C. (2024). Revisiting thorpe scale analysis and diapycnal diffusivities in drake passage. Front. Marine Sci.11. doi: 10.3389/fmars.2024.1444468
46
Salas-Monreal D. Monreal-Jimenez R. Contreras-Tereza V. K. Monreal-Gomez M. A. de Leon D. A. S. Riveron-Enzastiga M. L. (2022). Hydrographic variation in a tropical coral reef system: The veracruz reef system, gulf of Mexico. Oceanologia64, 473–488. doi: 10.1016/j.oceano.2022.03.002
47
Salois S. L. Gouhier T. C. Helmuth B. Choi F. Seabra R. Lima F. P. (2022). Coastal upwelling generates cryptic temperature refugia. Sci. Rep.12, 19313. doi: 10.1038/s41598-022-23717-5
48
Schneider N. Müller P. (1990). The meridional and seasonal structures of the mixed-layer depth and its diurnal amplitude observed during the hawaii-to-tahiti shuttle experiment. J. Phys. oceanography20, 1395–1404. doi: 10.1175/1520-0485(1990)020<1395:TMASSO>2.0.CO;2
49
Sevadjian J. C. McManus M. A. Benoit-Bird K. J. Selph K. E. (2012). Shoreward advection of phytoplankton and vertical re-distribution of zooplankton by episodic near-bottom water pulses on an insular shelf: Oahu, hawaii. Continental Shelf Res.50-51, 1–15. doi: 10.1016/j.csr.2012.09.006
50
Sheehan P. M. Damerell G. M. Leadbitter P. J. Heywood K. J. Hall R. A. (2023). Turbulent kinetic energy dissipation rate and associated fluxes in the western tropical atlantic estimated from ocean glider observations. Ocean Sci.19, 77–92. doi: 10.5194/os-19-77-2023
51
Sohail T. Gayen B. Hogg A. M. (2020). The dynamics of mixed layer deepening during open-ocean convection. J. Phys. Oceanography50, 1625–1641. doi: 10.1175/JPO-D-19-0264.1
52
Spall M. A. Pedlosky J. (2013). Interaction of ekman layers and islands. J. Phys. Oceanography43, 1028–1041. doi: 10.1175/JPO-D-12-0159.1
53
Stewart R. H. (2008). Introduction to Physical Oceanography. (College Station, TX: Department of Oceanography, Texas A&M University).
54
Storlazzi C. D. Cheriton O. M. van Hooidonk R. Zhao Z. Brainard R. (2020). Internal tides can provide thermal refugia that will buffer some coral reefs from future global warming. Sci. Rep.10, 13435. doi: 10.1038/s41598-020-70372-9
55
Sutherland G. Christensen K. H. Ward B. (2014). Evaluating langmuir turbulence parameterizations in the ocean surface boundary layer. J. Geophysical Res.119 (3), 1899–1910. doi: 10.1002/2013jc009537
56
Tavakoli-Kolour P. Sinniger F. Morita M. Nakamura T. Harii S. (2023). Variability in thermal stress thresholds of corals across depths. Front. Marine Sci.10. doi: 10.3389/fmars.2023.1210662
57
Thorpe S. A. (2018). Models of energy loss from internal waves breaking in the ocean. J. Fluid Mechanics836, 72–116. doi: 10.1017/jfm.2017.780
58
Thorpe S. Deacon G. (1977). Turbulence and mixing in a scottish loch. Philosophical Transactions of the Royal Society of London. Series A. Math. Phys. Sci.286, 125–181. doi: 10.1098/rsta.1977.0112
59
Tirodkar S. Murtugudde R. Behera M. R. Balasubramanian S. (2022). A comparative study of vertical mixing schemes in modeling the bay of bengal dynamics. Earth Space Sci.9, e2022EA002327. doi: 10.1029/2022EA002327
60
Valcarcel A. O’Callaghan J. (2024). Conductivity-Temperature-Depth Profiles in Curaçao [Data set]. SEANOE. doi: 10.17882/103493
61
Valcarcel A. F. Stevens C. L. O’Callaghan J. M. Suanda S. H. (2024). Overlapping turbulent boundary layers in an energetic coastal sea. EGUsphere2024, 1–33. doi: 10.5194/egusphere-2024-3311
62
van Haren H. Duineveld G. Mienis F. (2019). Internal wave observations off saba bank. Front. Marine Sci.5. doi: 10.3389/fmars.2018.00528
63
van Haren H. Voet G. Alford M. H. Torres D. J. (2022). Internal wave breaking near the foot of a steep east-pacific continental slope. Prog. Oceanography205, 102817. doi: 10.1016/j.pocean.2022.102817
64
Vijith V. Vinayachandran P. N. Thushara V. Amol P. Shankar D. Anil A. C. (2016). Consequences of inhibition of mixed-layer deepening by the west India coastal current for winter phytoplankton bloom in the northeastern arabian sea. J. Geophysical Research: Oceans121, 6583–6603. doi: 10.1002/2016JC012004
65
Wang C. (2007). Variability of the caribbean low-level jet and its relations to climate. Climate Dynamics29, 411–422. doi: 10.1007/s00382-007-0243-z
66
Waterhouse A. F. Mackinnon J. A. Nash J. D. Alford M. H. Kunze E. Simmons H. L. et al . (2014). Global patterns of diapycnal mixing from measurements of the turbulent dissipation rate. J. Phys. Oceanography44, 1854–1872. doi: 10.1175/JPO-D-13-0104.1
67
Wenegrat J. O. McPhaden M. J. (2016). A simple analytical model of the diurnal ekman layer. J. Phys. Oceanography46, 2877–2894. doi: 10.1175/JPO-D-16-0031.1
68
Woodson C. B. (2017). doi: 10.1146/annurev-marine-121916
69
Wyatt A. S. Leichter J. J. Toth L. T. Miyajima T. Aronson R. B. Nagata T. (2020). Heat accumulation on coral reefs mitigated by internal waves. Nat. Geosci.13, 28–34. doi: 10.1038/s41561-019-0486-4
70
Zhuang Z. Yuan Y. Zheng Q. Zhou C. Zhao X. Zhang T. (2021). Effects of buoyancy flux on upper-ocean turbulent mixing generated by non-breaking surface waves observed in the south China sea. J. Geophysical Research: Oceans126, e2020JC016816. doi: 10.1029/2020JC016816
Summary
Keywords
trade winds, mixed layer depth, turbulent mixing, semidiurnal, mesophotic reef ecosystems, tropics, subsurface tidal oscillations
Citation
Valcarcel A, O’Callaghan J and Vermeij MJA (2025) Interplay of wind-driven processes and subsurface oscillations along the leeward coastline of a tropical reef island. Front. Mar. Sci. 12:1546596. doi: 10.3389/fmars.2025.1546596
Received
17 December 2024
Accepted
15 April 2025
Published
04 June 2025
Volume
12 - 2025
Edited by
Ricardo Torres, Plymouth Marine Laboratory, United Kingdom
Reviewed by
Phil Hosegood, University of Plymouth, United Kingdom
Nicola Foster, University of Plymouth, United Kingdom
Updates
Copyright
© 2025 Valcarcel, O’Callaghan and Vermeij.
This is an open-access article distributed under the terms of the Creative Commons Attribution License (CC BY). The use, distribution or reproduction in other forums is permitted, provided the original author(s) and the copyright owner(s) are credited and that the original publication in this journal is cited, in accordance with accepted academic practice. No use, distribution or reproduction is permitted which does not comply with these terms.
*Correspondence: Arnaud Valcarcel, arnaud@oceanlyscience.com
Disclaimer
All claims expressed in this article are solely those of the authors and do not necessarily represent those of their affiliated organizations, or those of the publisher, the editors and the reviewers. Any product that may be evaluated in this article or claim that may be made by its manufacturer is not guaranteed or endorsed by the publisher.