 Hongyi Zhao
 Yaru Gao3
 Yifei Sun
- 1Key Laboratory of Ministry of Education for Coastal Disaster and Protection, Hohai University, Nanjing, China
- 2College of Civil Engineering, Qingdao University of Technology, Qingdao, China
- 3College of Harbour, Coastal and Offshore Engineering, Hohai University, Nanjing, China
- 4Key Laboratory of Ministry of Education for Geomechanics and Embankment Engineering, Hohai University, Nanjing, China
Calcareous sand with fines content was often encountered in offshore and onshore engineering. However, most previous research has primarily focused on the mechanical properties of clean calcareous sand. This study conducted a series of drained and undrained triaxial tests on calcareous sand-clay binary mixtures to investigate the impact of fines content on the strength and deformation characteristics of calcareous sand. The results indicate that specimens with varying fines content exhibit both strain hardening and softening behaviors under different confining pressures. With the addition of fines content from 0% to 10%, the extent of dilatancy decreases, resulting in a smaller peak friction angle compared to clean sand specimens. However, when fines content increases further to 25%, both the maximum dilatancy angle and peak friction angle show an increase. A similar trend is observed for the friction angle at the phase transition state (PTS). In the p′ − q plane, the critical state line (CSL) remains constant despite changes in fines content, whereas in the e − p′0.7 plane, the CSL shifts with variations in fines content. A unified CSL in the e − p′0.7 plane can be obtained by applying the concept of equivalent skeleton void ratio. Additionally, the state dependence of the material is analyzed using both the modified state parameter and the state index. It was observed that the friction angles at both the PTS and the peak state (PS) are influenced by the state of the material, with the PTS friction angle showing a stronger correlation with the state index, while the PS friction angle is more closely linked to the state parameter.
1 Introduction
Calcareous sands, primarily composed of calcium carbonate from marine organisms, are found in shallow, warm continental shelf seas worldwide (Alba and Audibert, 1999; King and Lodge, 1988). Distinguished from terrigenous soils, calcareous sands exhibit unique engineering characteristics, including low grain hardness, high intragranular porosity and a pronounced tendency for particle breakage under high external loading conditions (Coop, 1990; Ma et al., 2019; Shahnazari et al., 2016; Liu et al., 2023; Gao et al., 2024). In recent decades, marine engineering projects have extended into more remote oceanic regions where calcareous sands are abundant. It is important to highlight, however, that many of these projects involve mixtures of calcareous sand and fines rather than pure calcareous sand due to practical considerations (Demdoum et al., 2017; Porcino et al., 2020).
Previous research has shown that presence of fines significantly altered the particle contact conditions and the overall mechanical properties of sand-fines mixture (Carrera et al., 2011; Dash and Sitharam, 2011; Karim and Alam, 2016; Lade and Yamamuro, 1997; Papadopoulou and Tika, 2008; Shipton and Coop, 2012). These studies consistently indicate the existence of a transitional fines content (TFC), below which the sand grains retain their contact, and the mechanical properties are primarily governed by the sand skeleton. At a fixed void ratio, increasing the fines content generally improves the compactness and collapsibility of the sand, while reducing its tendency to dilate. This leads to a downward shift of the critical state line (CSL) in e − logp space. However, once the fines content exceeds this threshold, the behavior of the mixture reverses. The literature outlines several approaches for determining the TFC in sand-fines mixtures, which include both experimental and theoretical models (Yang et al., 2006; Zuo and Baudet, 2015). Additionally, the relative sizes of fines and sand particles are considered an important factor influencing the value of TFC.
It is widely acknowledged that sand specimens, under specific combinations of effective stress and void ratio, converge to a unique critical state line (CSL), regardless of their loading history or stress path (Been et al., 1992; Ishihara, 1993; Verdugo and Ishihara, 1996). However, the incorporation of silt or clay fines into clean sand can significantly modify the sand fabric, causing a deviation from the unique critical state line in the e − logp space. To address this, many researchers have proposed the concept of an equivalent granular void ratio, which is referred to by various terms, such as the equivalent inter-granular contact index void ratio (Thevanayagam et al., 2002), equivalent intergranular contact index (Zuo and Baudet, 2015), corrected intergranular void ratio (Papadopoulou and Tika, 2008) and equivalent granular void ratio (Rahman et al., 2008). Among these, the equivalent granular void ratio is particularly useful for quantifying the roles of fines at high fines content, which is why it is commonly used in current research (Raman and Lo, 2012; Ni et al., 2004; Yang et al., 2006). These approaches allow for the data from sand-fines mixtures to be consolidated within a narrow band, facilitating the determination of a best-fit CSL, serving as a valuable reference for the development of advanced constitutive models for composite soils (Rahman et al., 2014; Wei and Yang, 2019).
Calcareous sand–clay mixtures exhibit distinct characteristics compared to quartz sand–clay mixtures, primarily due to the inherent susceptibility of calcareous sands to particle breakage. The fines content can influence this breakage behavior (Shahnazari and Rezvani, 2013; Wang et al., 2017; Wei and Yang, 2019). Particle breakage tends to reduced dilatancy and lower peak strength, which causes shifts and rotations of the critical state line in both the p − q and e − lnp planes (He et al., 2023; Shahnazari et al., 2016; Wu et al., 2021; Yu, 2019). Despite these phenomenon, research into the mechanical behavior of calcareous sand-clay mixtures remains limited. Zheng (2019) examined the permeability and consolidation coefficients of calcareous sand-clay mixtures under incremental loading and found that clay content significantly influences the consolidation coefficient, with an inverse relationship between clay content and permeability coefficient. Li et al. (2022) studied the liquefaction resistance of calcareous sand and highlighted the enhanced resistance with higher fines content. Xu et al. (2020) explored the compression behavior of these mixtures and proposed a conceptual model for predicting the transitional state while accounting for the effect of particle breakage on volume changes. However, the shear characteristics and critical state behavior of these mixtures under both drained and undrained conditions have not been comprehensively studied.
To fill this gap, the present study conducted a comprehensive series of triaxial drained and undrained tests on calcareous sand specimens with varying clay contents (0%, 5%, 10%, and 25%) under different confining pressures. The primary objective was to examine the impact of fines content on the transitional behavior of calcareous sand-clay mixtures, focusing on factors such as initial modulus, peak strength, shear dilation, and critical state. To better understand the shifting of the critical state line in the e − p′ plane due to changes in fines content, the concept of equivalent particle void ratio (e∗) was introduced, providing a unified framework for analyzing the behavior of the critical state line.
1.1 Test material
The calcareous sand utilized in the tests, as depicted in Figure 1a, exhibits irregularly shaped particles with significant internal pore retention. X-ray diffraction (XRD) analyses further revealed that the composition of the calcareous sand primarily consisted of aragonite and calcite, as illustrated in Figure 1b. Undergoing a drying process with the removal of particles larger than 2 mm, the testing material maintains maximum and minimum void ratios of 1.20 and 0.8 respectively, along with a specific gravity of 2.73. The Particle Size Distribution (PSD), conducted in accordance with the Geotechnical Test method Standard (GB/T 50123-2019, 2019), is illustrated in Figure 1c. The results indicate an average particle size of 0.41 mm, a non-uniformity coefficient of 4.17, and a curvature coefficient of 1.22, signifying a relatively uniform particle size distribution and good gradation continuity. In the study of the mechanical behavior of calcareous sand-clay mixtures, commercial kaolin was employed, and its properties are detailed in Table 1.
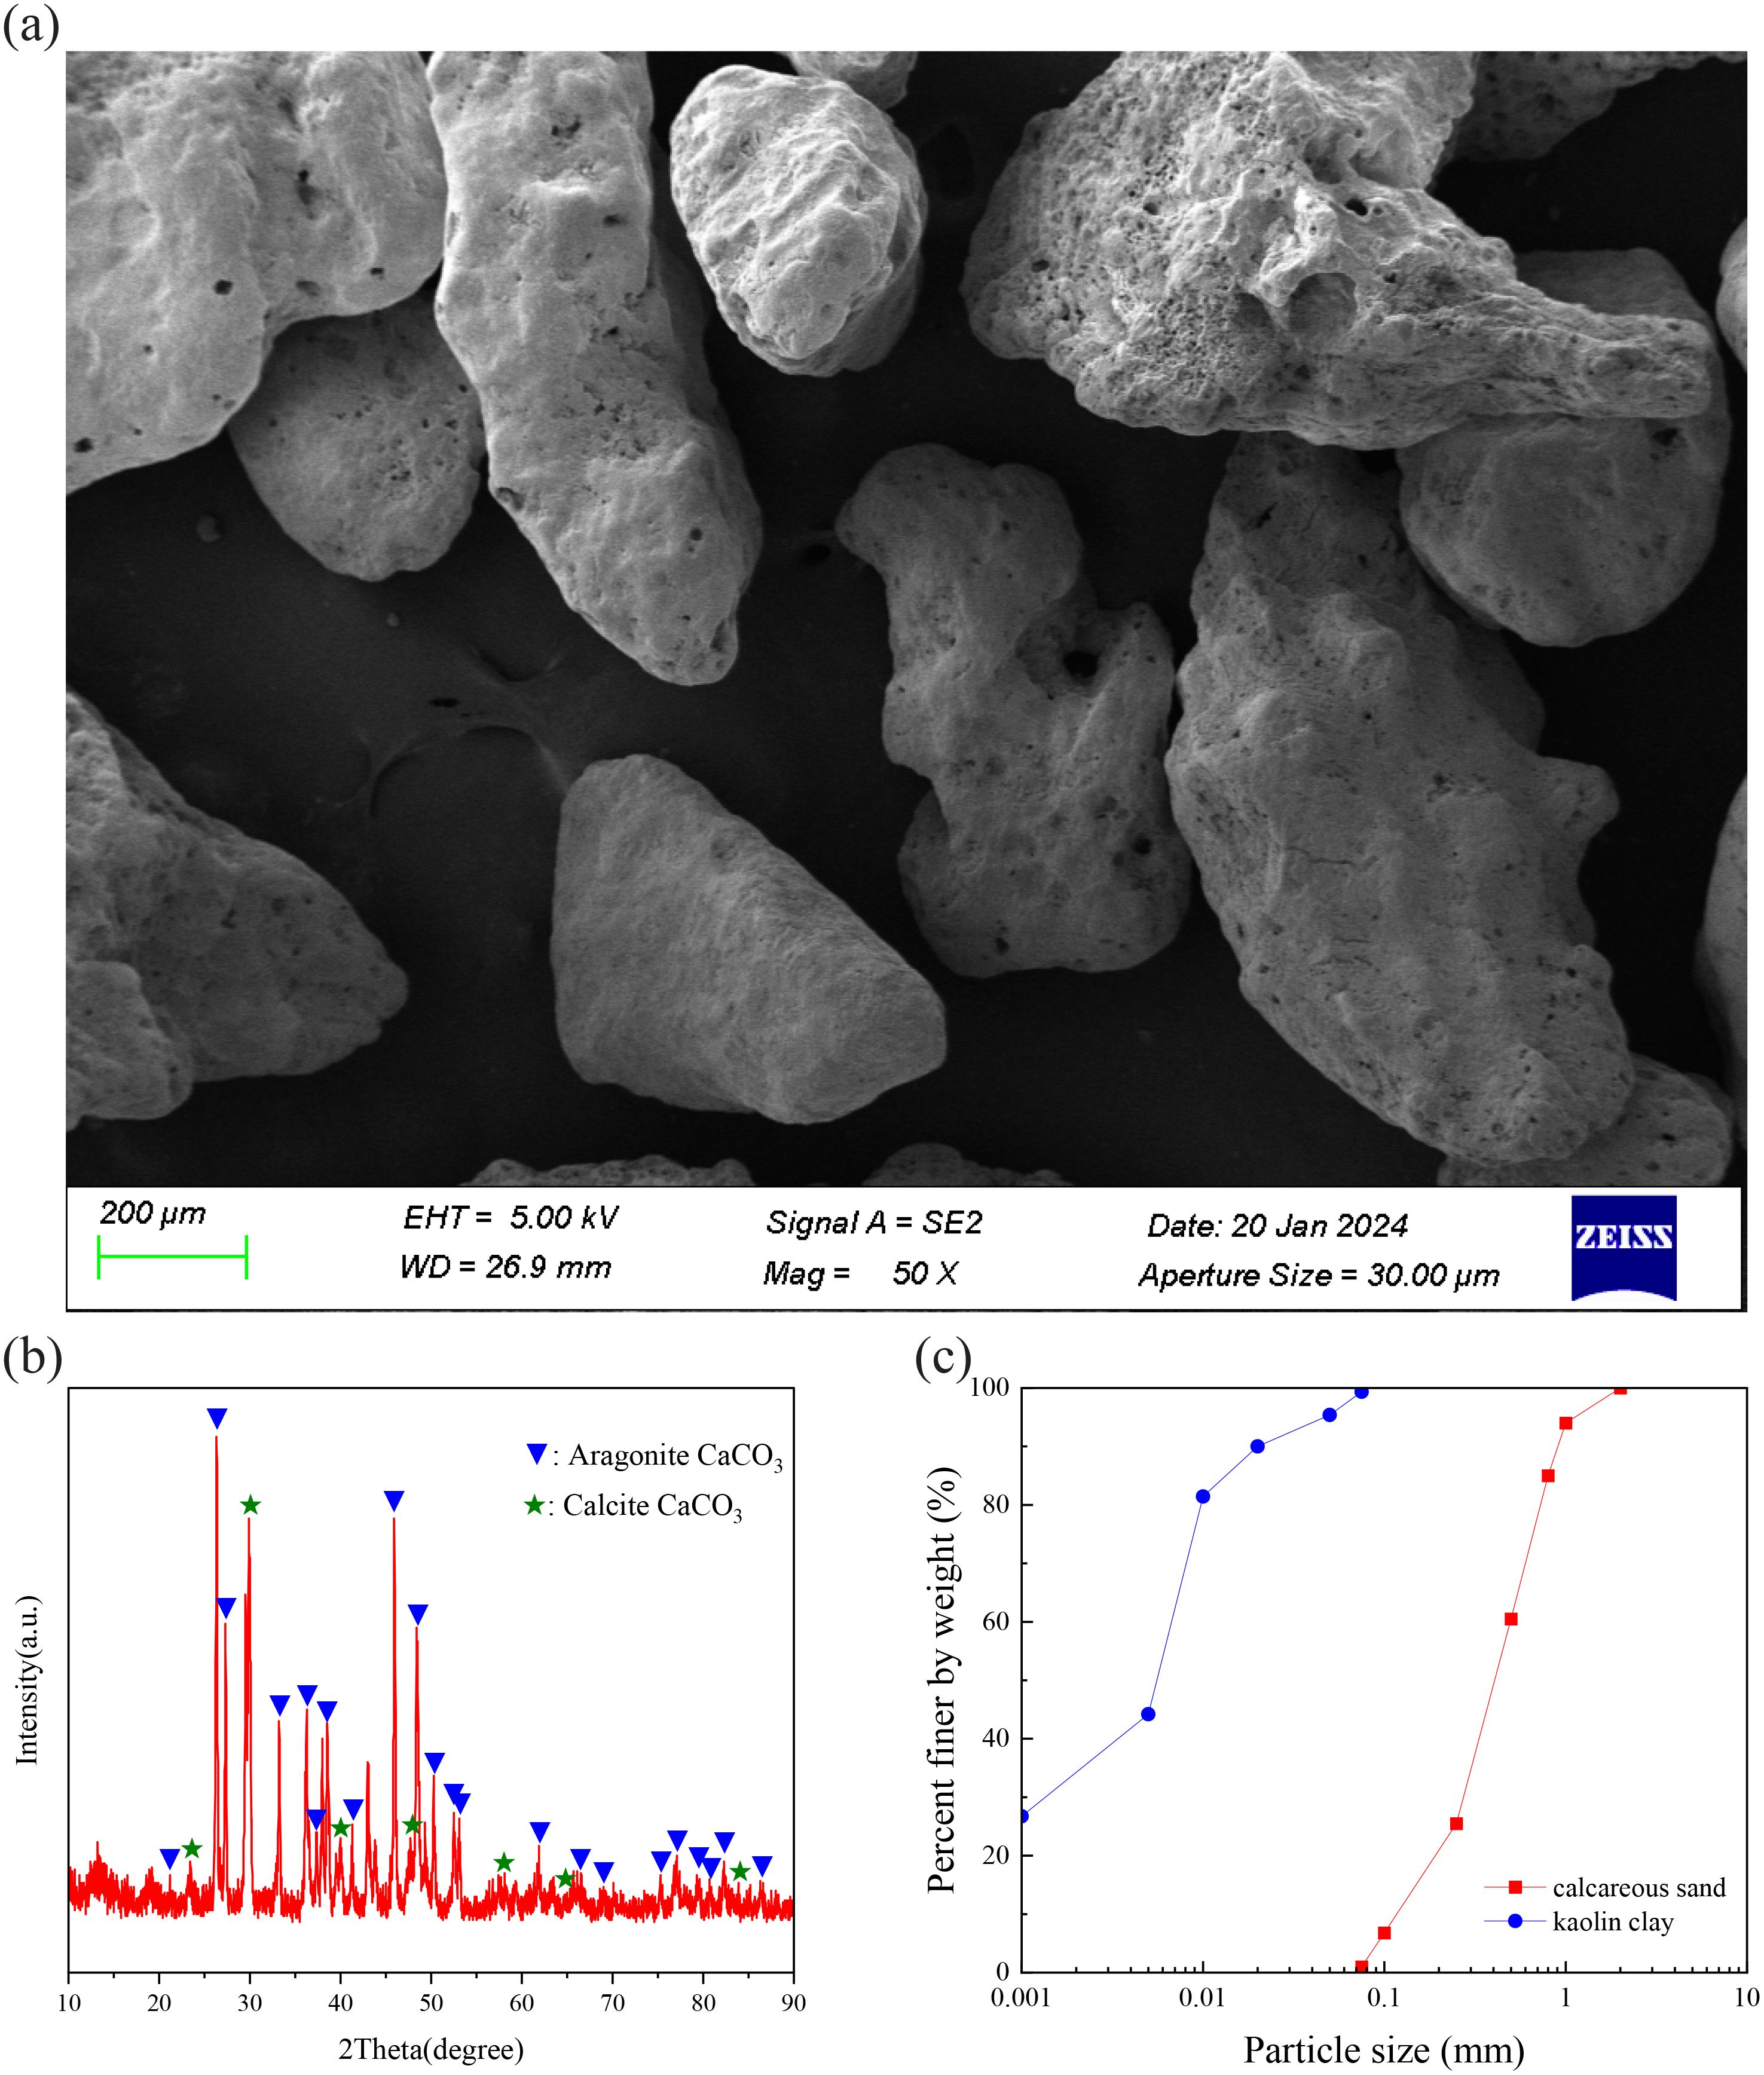
Figure 1. Calcareous sand used in the tests. (a) The SEM images. (b) The XRD analysis. (c) Particle size distribution.
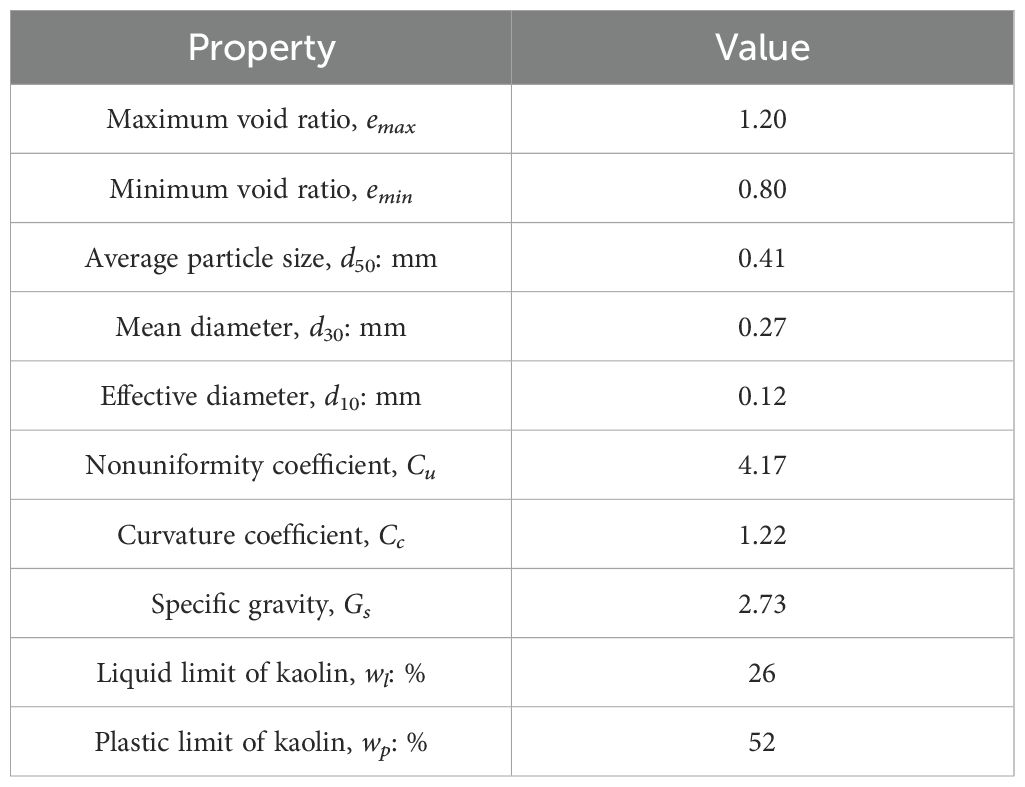
Table 1. Physical properties of calcareous sand.
1.2 Test setup
The experiments were conducted using the GDS triaxial automated system. Hydraulic pressure controllers capable of reaching up to 2 MPa, were utilized to apply the cell and back pressures. A submersible load cell, with a maximum capacity of 15 kN, was employed to deliver the axial force. Axial displacement was measured externally at the top of the specimen with a linear variable differential transformer (LVDT), which had a measurement range of ±100mm. Pore pressure readings were obtained from transducers installed at both end of the specimen, with the average value adopted for the analysis. All instruments were calibrated to ensure an accuracy within 0.10–0.15% of their full-scale output.
A total of 24 triaxial tests, including both drained and undrained conditions, were carried out on isotropically consolidated specimens. The samples contained varying kaolin clay content levels of 0%, 5%, 10%, and 25%, and were subjected to confining pressures between 100 and 400 kPa. Each specimen measured 50 mm in diameter and 95 mm in height, prepared by air-pluviation into a split mold lined with a stretched membrane under vacuum. Due to the friability of the calcareous sand, the initial void ratio (e) of the samples was set at 1.0, resulting in a relative density (Dr) of 50%. After sample preparation, carbon dioxide was used to replace the air in the pores under an effective confining pressure of 20 kPa, followed by water flushing until a stable, bubble-free flow was achieved. Saturation was achieved by incrementally increasing the back pressure over 24 hours to 500 kPa, which was then maintained for more than 12 hours until Skempton’s coefficient B exceeded 0.98. Throughout the consolidation phase, sample volume changes were carefully recorded. Strain-controlled loading was applied at rates of 0.0114 mm/min for drained tests and 0.095 mm/min for undrained tests, with the slower rate selected to avoid excess pore water pressure in drained conditions. The tests were terminated when the axial strain reached 20%. The test results indicated that the variations in volumetric strain and pore water pressure with increasing axial strain were minimal. Accordingly, it was believed that the critical state for the majority of the samples was achieved during the triaxial test. For further details on the triaxial compression tests, please refer to Table 2.
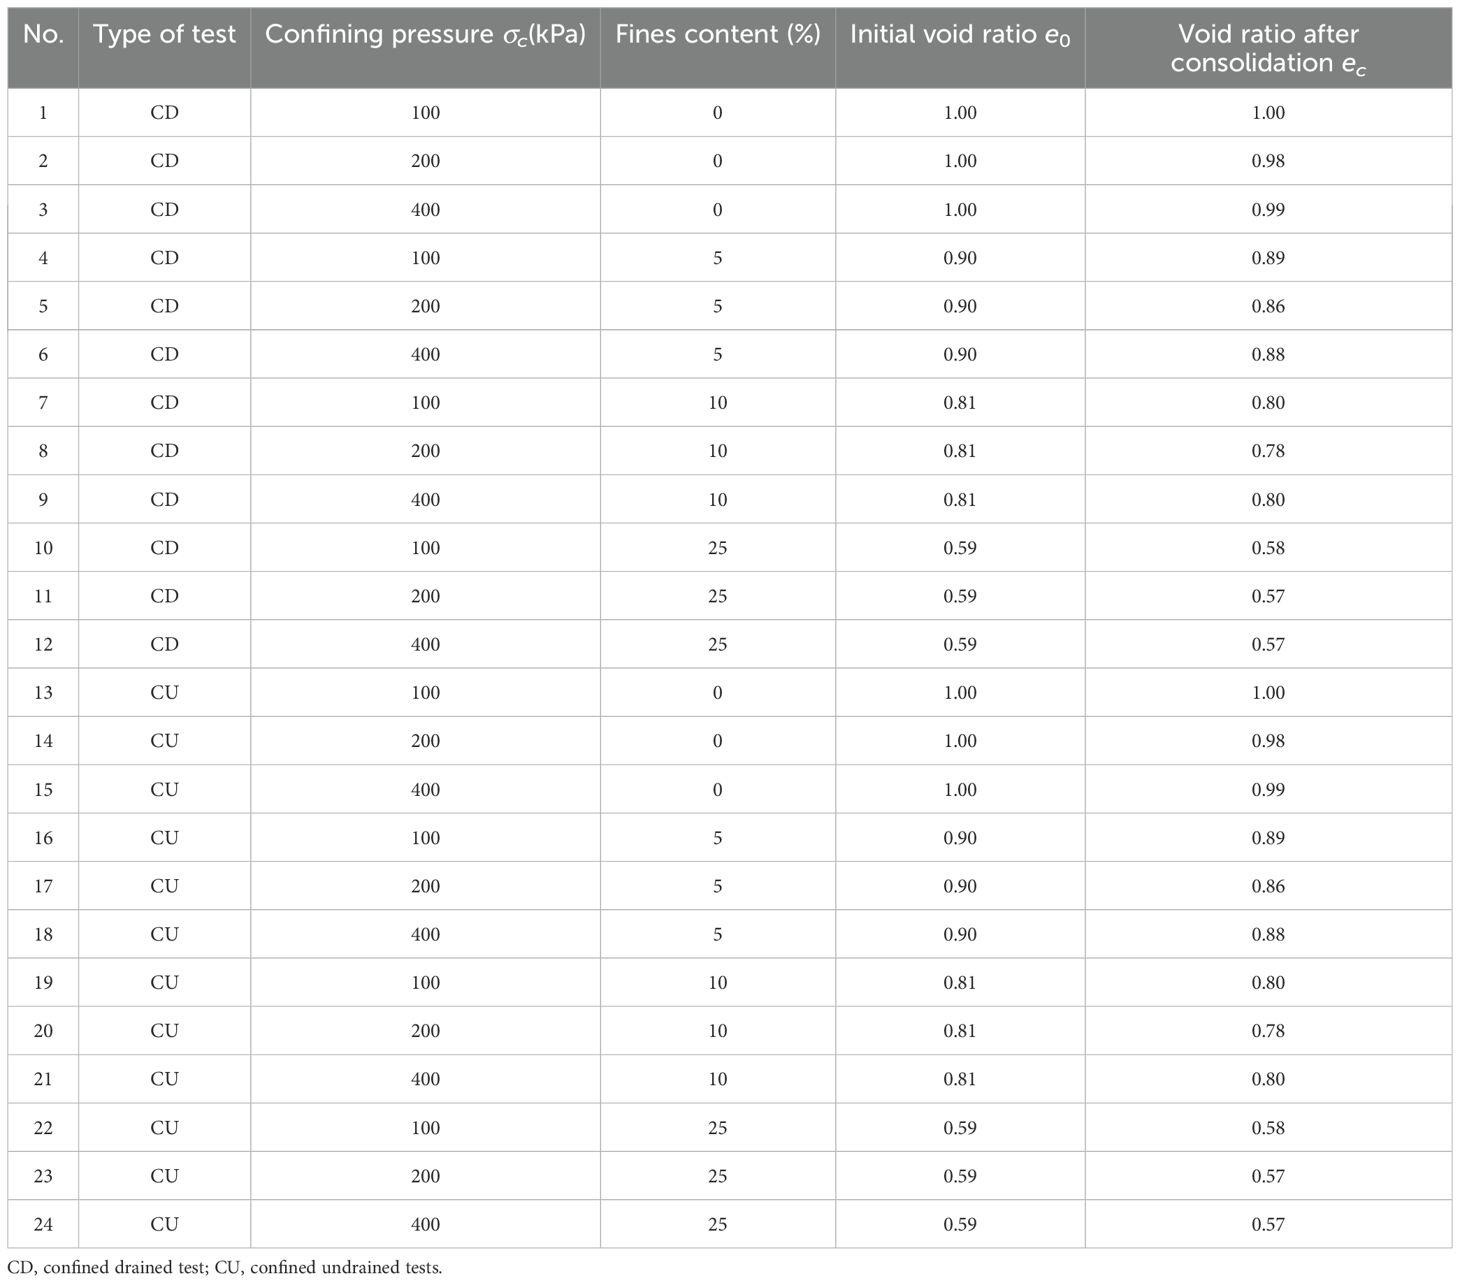
Table 2. Test condition.
2 Test results
2.1 Typical stress-strain behavior
The typical stress-strain behaviors of drained clayed sands are shown in Figure 2. It is evident that all specimens exhibit strain-softening behavior, regardless of variations in confining pressure or clay content. This is characterized by an initial increase followed by a decrease in the deviator stress. An increase in confining pressure enhances the initial stiffness and peak shear strength, while reducing the tendency for volumetric dilation of the specimen. These findings are consistent with test results for both clean and clayey sands reported in the literatures Goudarzy et al. (2022); He et al. (2023); Sarkar et al. (2022). Furthermore, a notable influence of clay content on the stress-strain behavior of the specimens is observed. While the overall stress evolution trend remains generally consistent across specimens with different clay contents, the peak shear strength initially decreases and then increases with increasing clay content. Conversely, the axial strain at the stress peak exhibits an opposite trend. The relationship between volumetric strain and axial strain is also affected by clay content. For instance, under an initial mean effective pressure of 400 kPa, as clay content increases from 0% to 10%, the volumetric response transitions from dilation to pure volumetric contraction. This change, as shown by the micro-scan analysis in Figure 3, is likely due to the lubrication effect of clay, which facilitates sliding between sand particles. However, as the clay content increases further to 25%, the volumetric response shifts from contraction to dilation. This is due to the significant reduction in the initial void ratio caused by the addition of clay, which hinders particle sliding. To resist the applied stress, substantial particle rearrangement, including particle rotation, occurs, resulting in some degree of volumetric dilation.
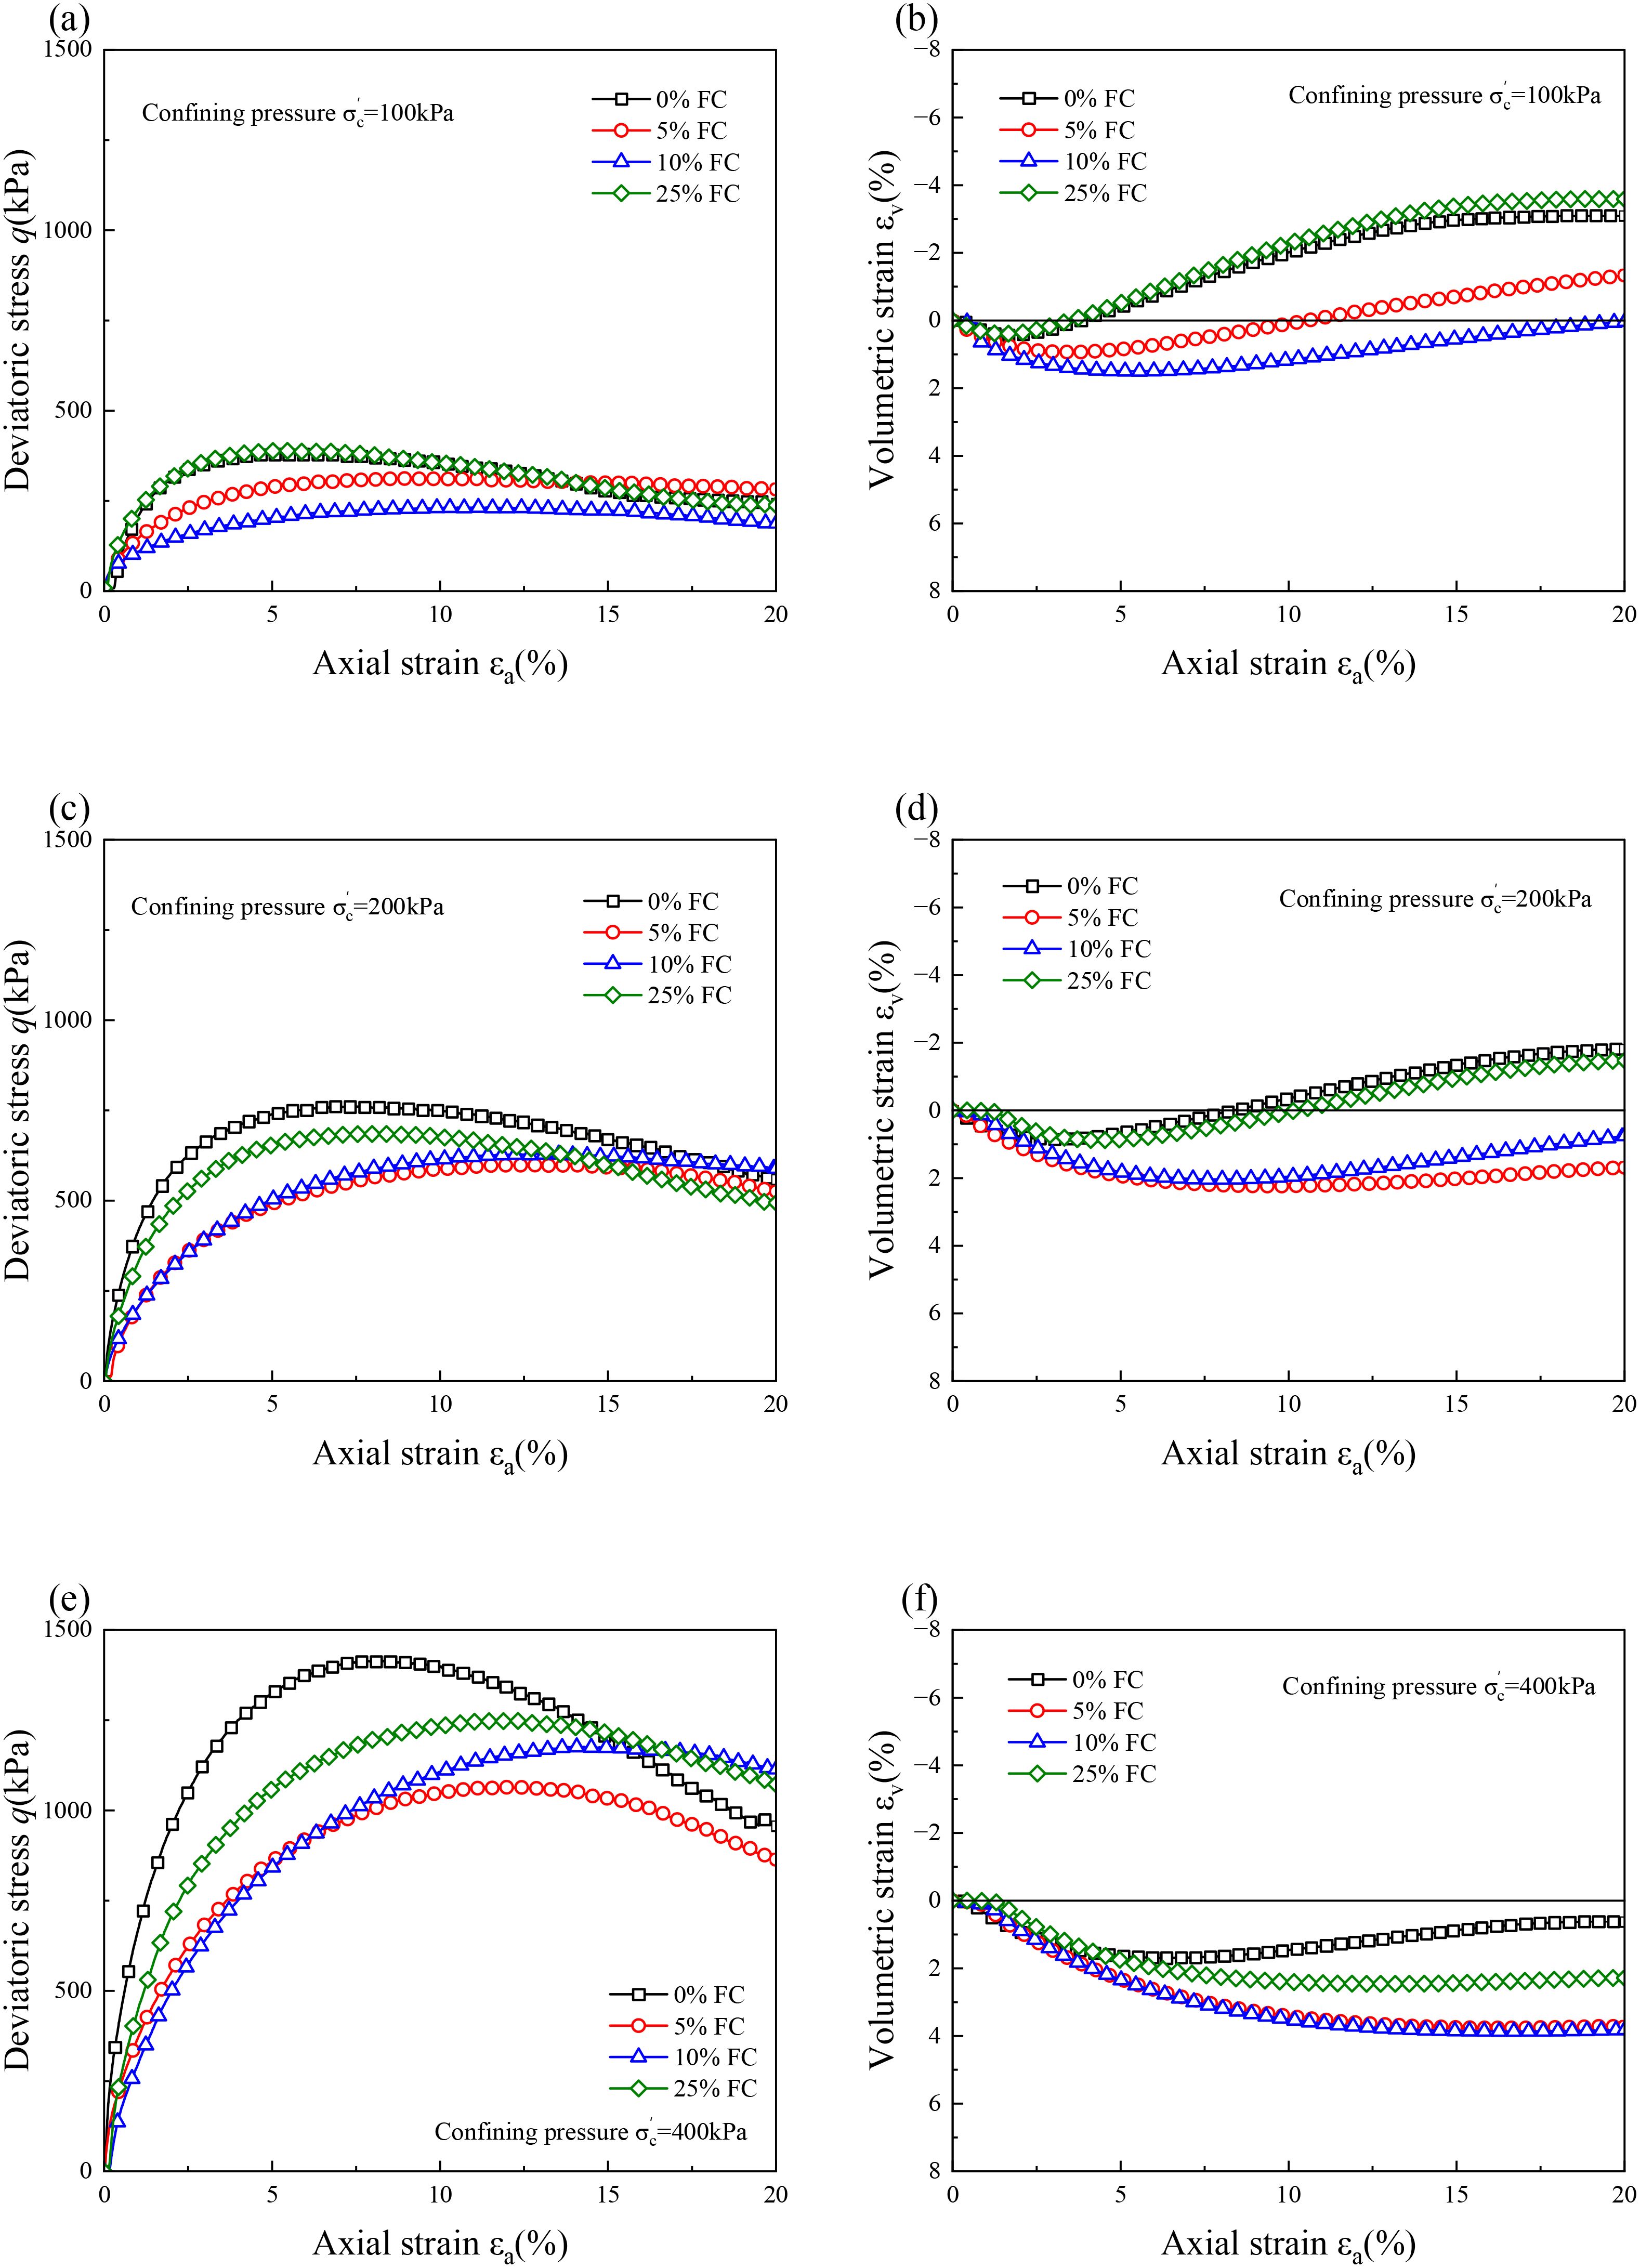
Figure 2. (a–f) Typical drained stress-strain behavior of calcareous sand with different fine contents.
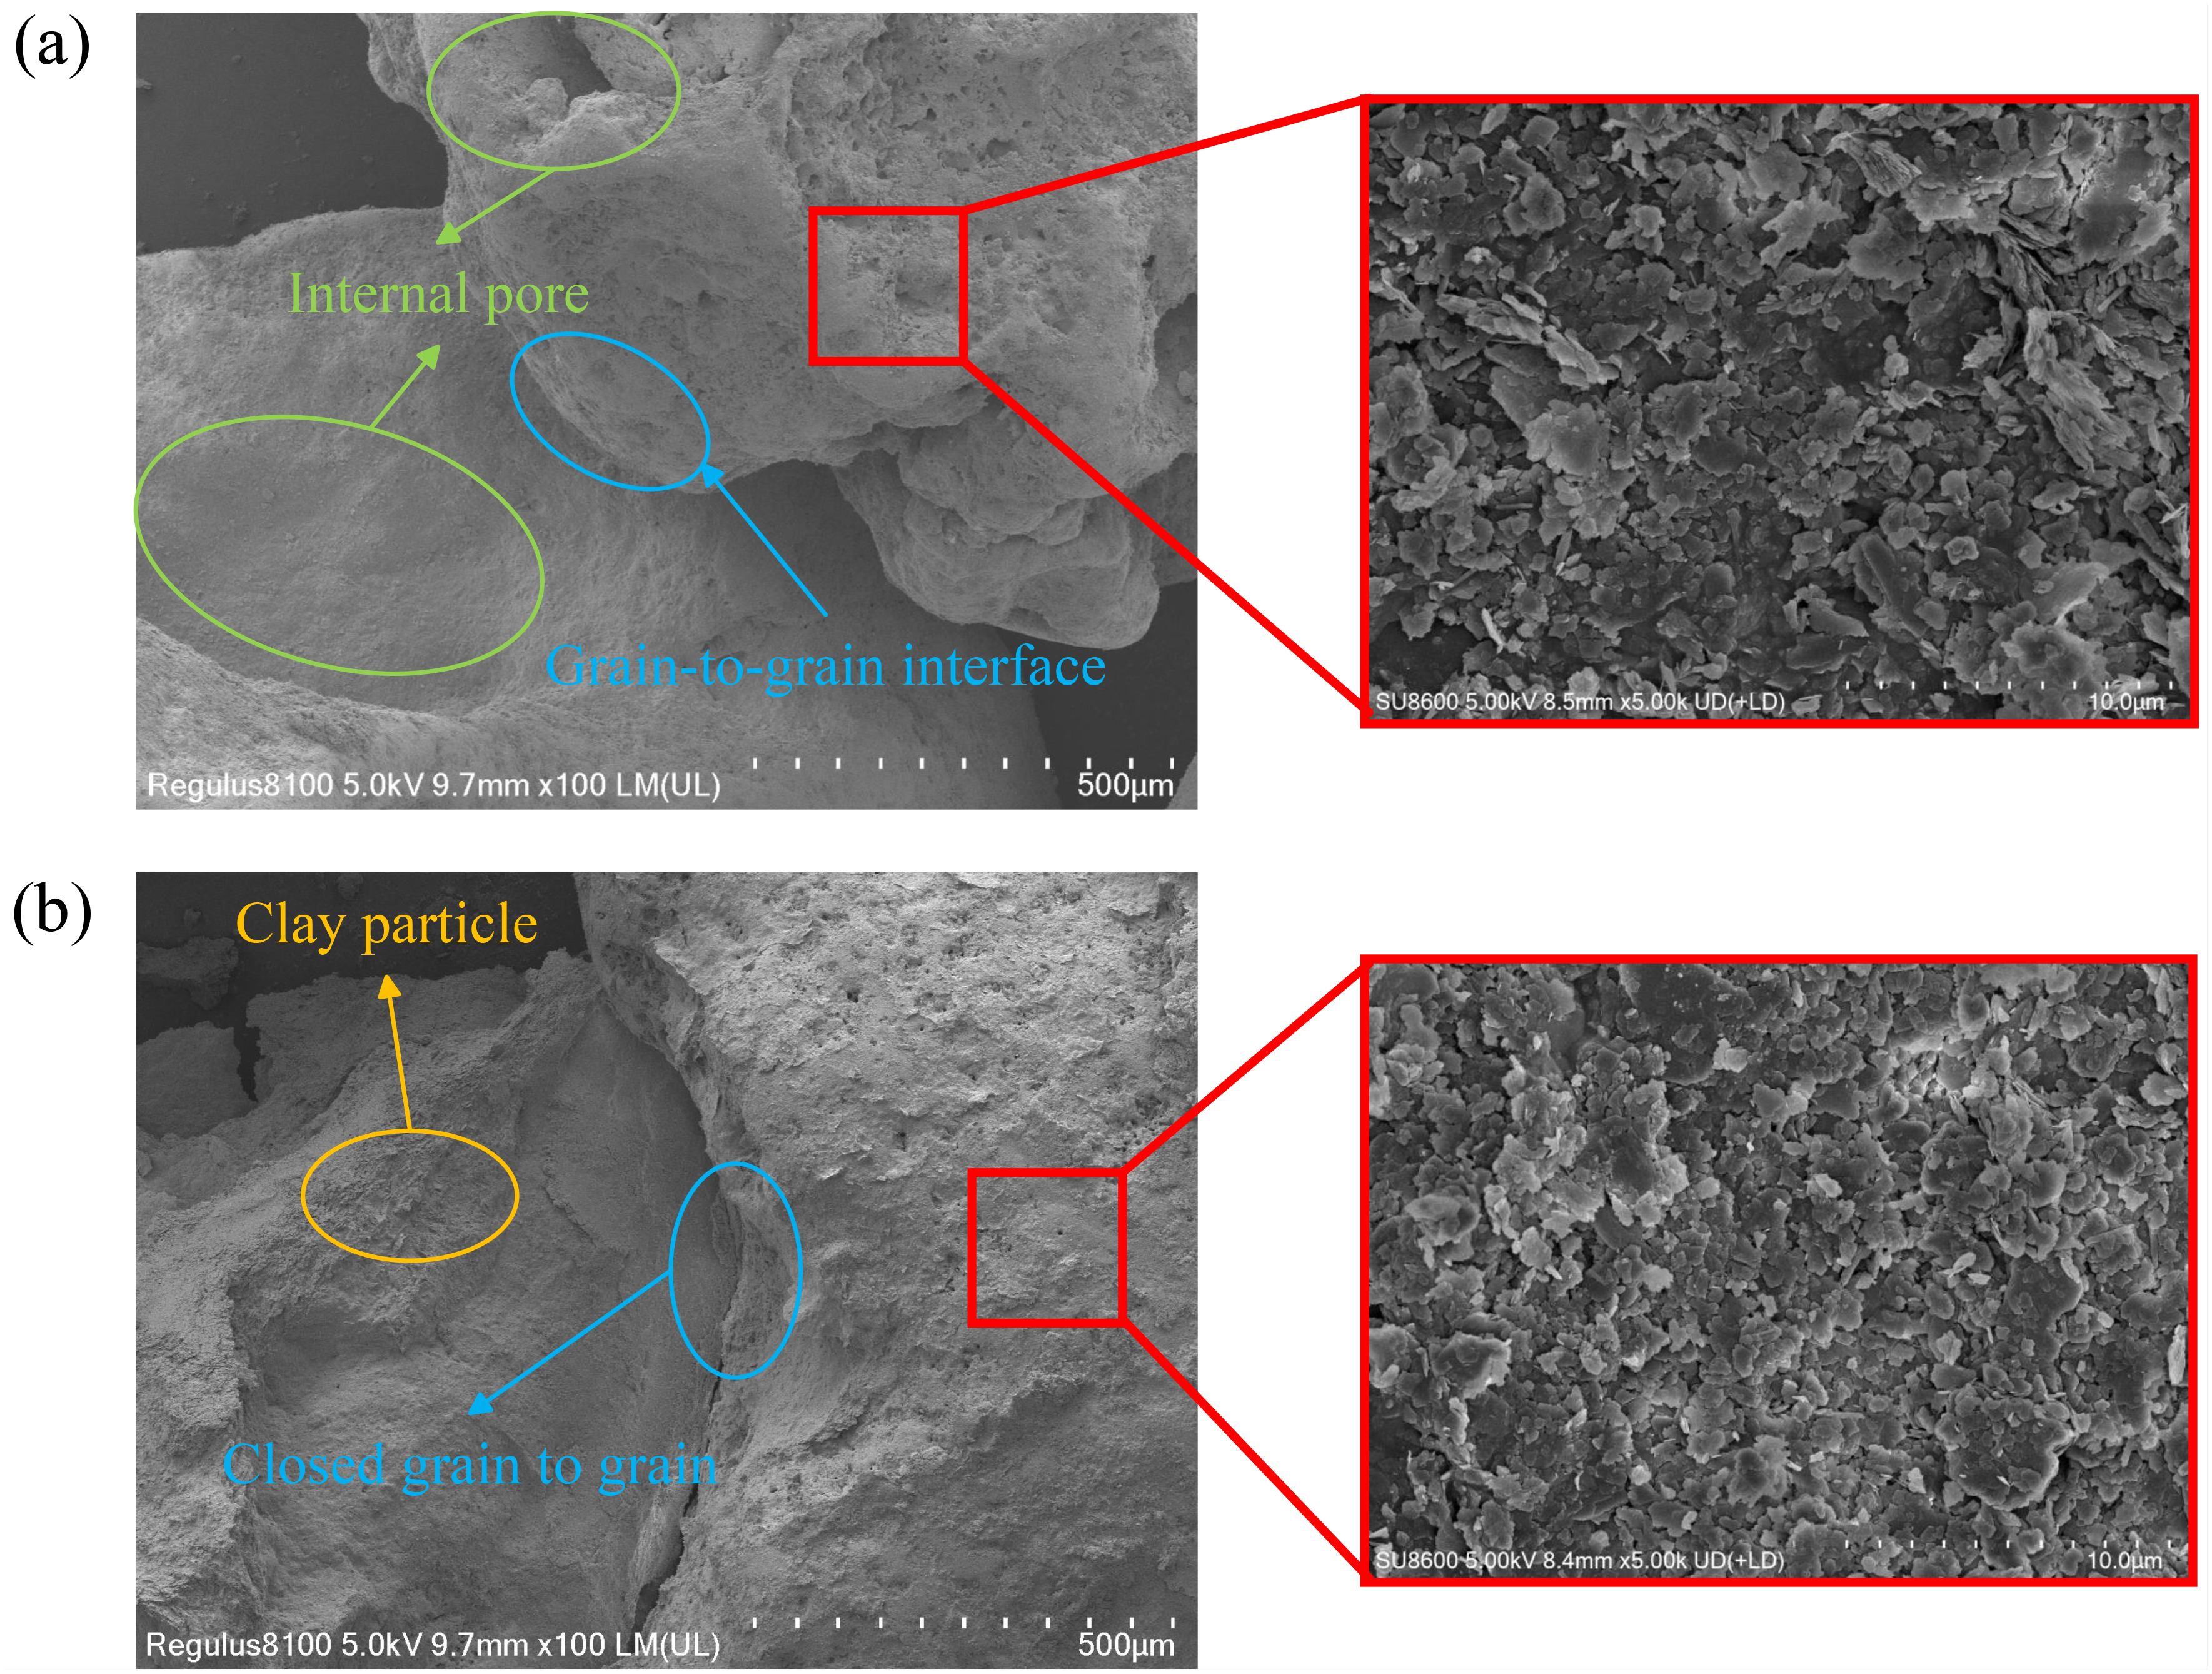
Figure 3. Micro-scan analysis of calcareous-clay mixtures. (a) 5% fines content. (b) 25% fines content.
Figure 4 shows the typical stress-strain behaviors of the specimens tested under undrained triaxial shearing. The deviator stress is found to increase first until it reaches a peak and then decreases with a further increase in the axial strain. The higher the initial mean effective pressure, the higher the deviator stress and the associated stress peak of the specimen. The mean effective pressure decreases and then increases during shearing. Both stresses mobilize after the phase transition state point until they reach the critical state, where the non-flow behavior of each specimen under undrained loading can be observed. Additionally, the clay content significantly influences the undrained behavior of the specimens, similar to its effect under drained loading conditions. Specifically, the stress peak of each specimen initially decreases as clay content increases, but then increases once the clay content reaches 25%. As shown in Figure 5, the dilatancy behavior follows a similar trend: as the clay content increases from 0% to 10%, dilatancy decreases, resulting in a transition of excess pore water pressure from negative to positive values under an initial mean effective pressure of 100 kPa. However, as the clay content further increases to 25%, the dilatancy behavior becomes more pronounced, corresponding to the reappearance of negative pore water pressure values.
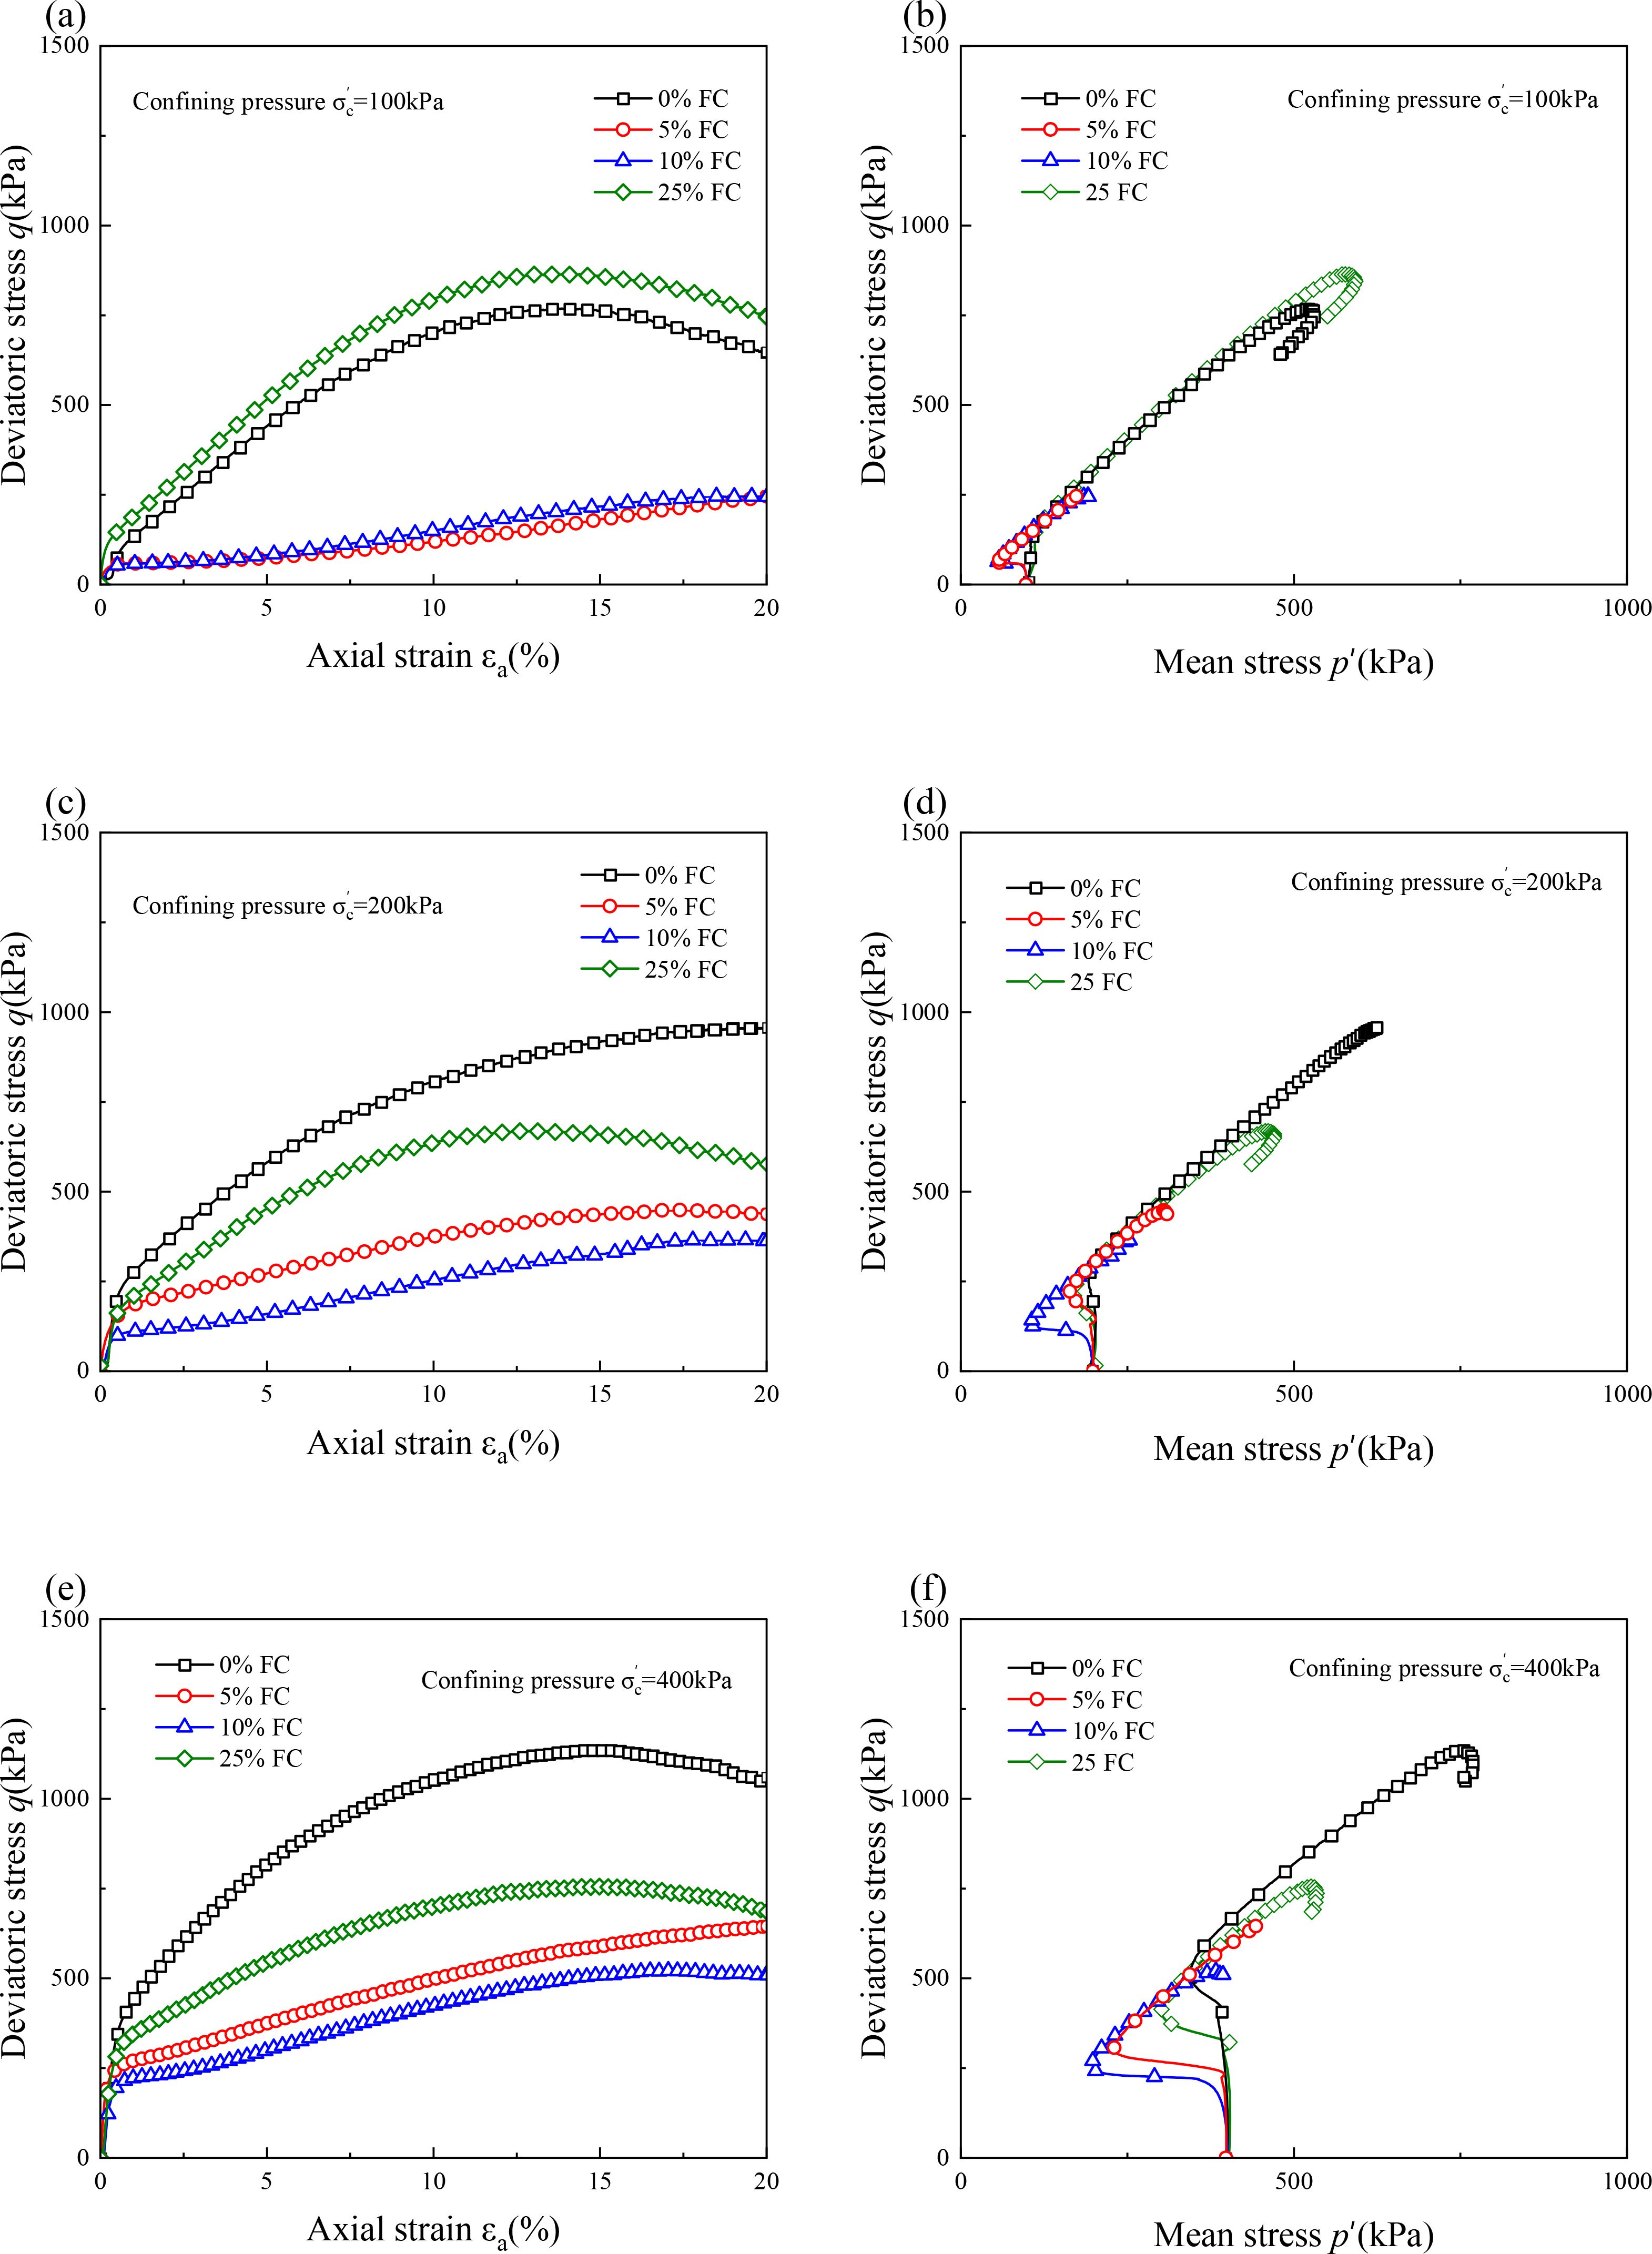
Figure 4. (a–f) Typical undrained stress-strain behavior of calcareous sand with different fine contents.
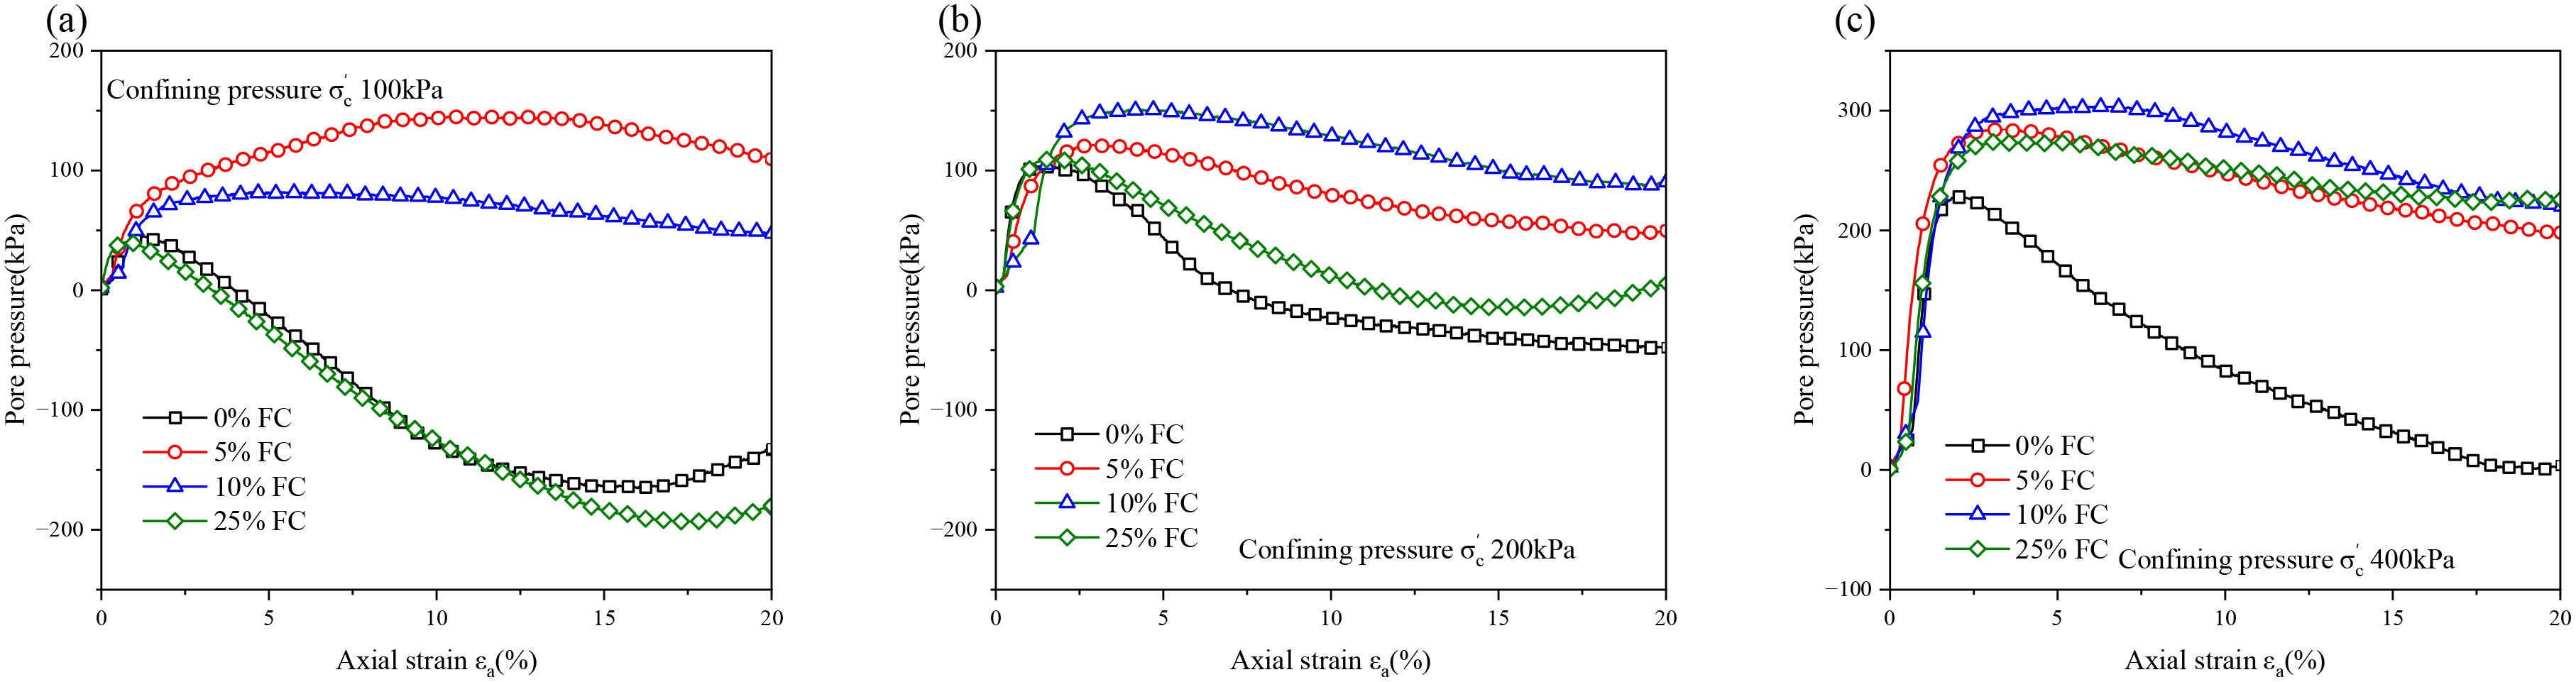
Figure 5. (a–c) Typical pore water pressure behavior of calcareous sand with different fines content.
2.2 Typical stress-dilatancy behavior
Figure 6 shows the typical stress-dilatancy behavior of clayed sand in drained tests. For undrained tests, it is difficult to obtain the accurate plastic volumetric strain increment, thus not presented here for clarity. From Figure 6, it is evident that, after a period of shearing, the stress ratio increases while the dilatancy ratio decreases, reaching a maximum dilatancy point. Subsequently, as the dilatancy ratio increases, the stress ratio decreases toward the critical-state value, regardless of fines content. However, both the initial mean effective pressure and fines content affect the maximum dilatancy ratio and the corresponding peak stress ratio. Specifically, an increase in the initial mean effective pressure leads to a decrease in both the maximum dilatancy ratio and the peak stress ratio. For identical initial mean effective pressures, a fines content of 10% (as shown in Figure 6c) results in a higher peak stress ratio than that observed with 25% clay content (Figure 6d).
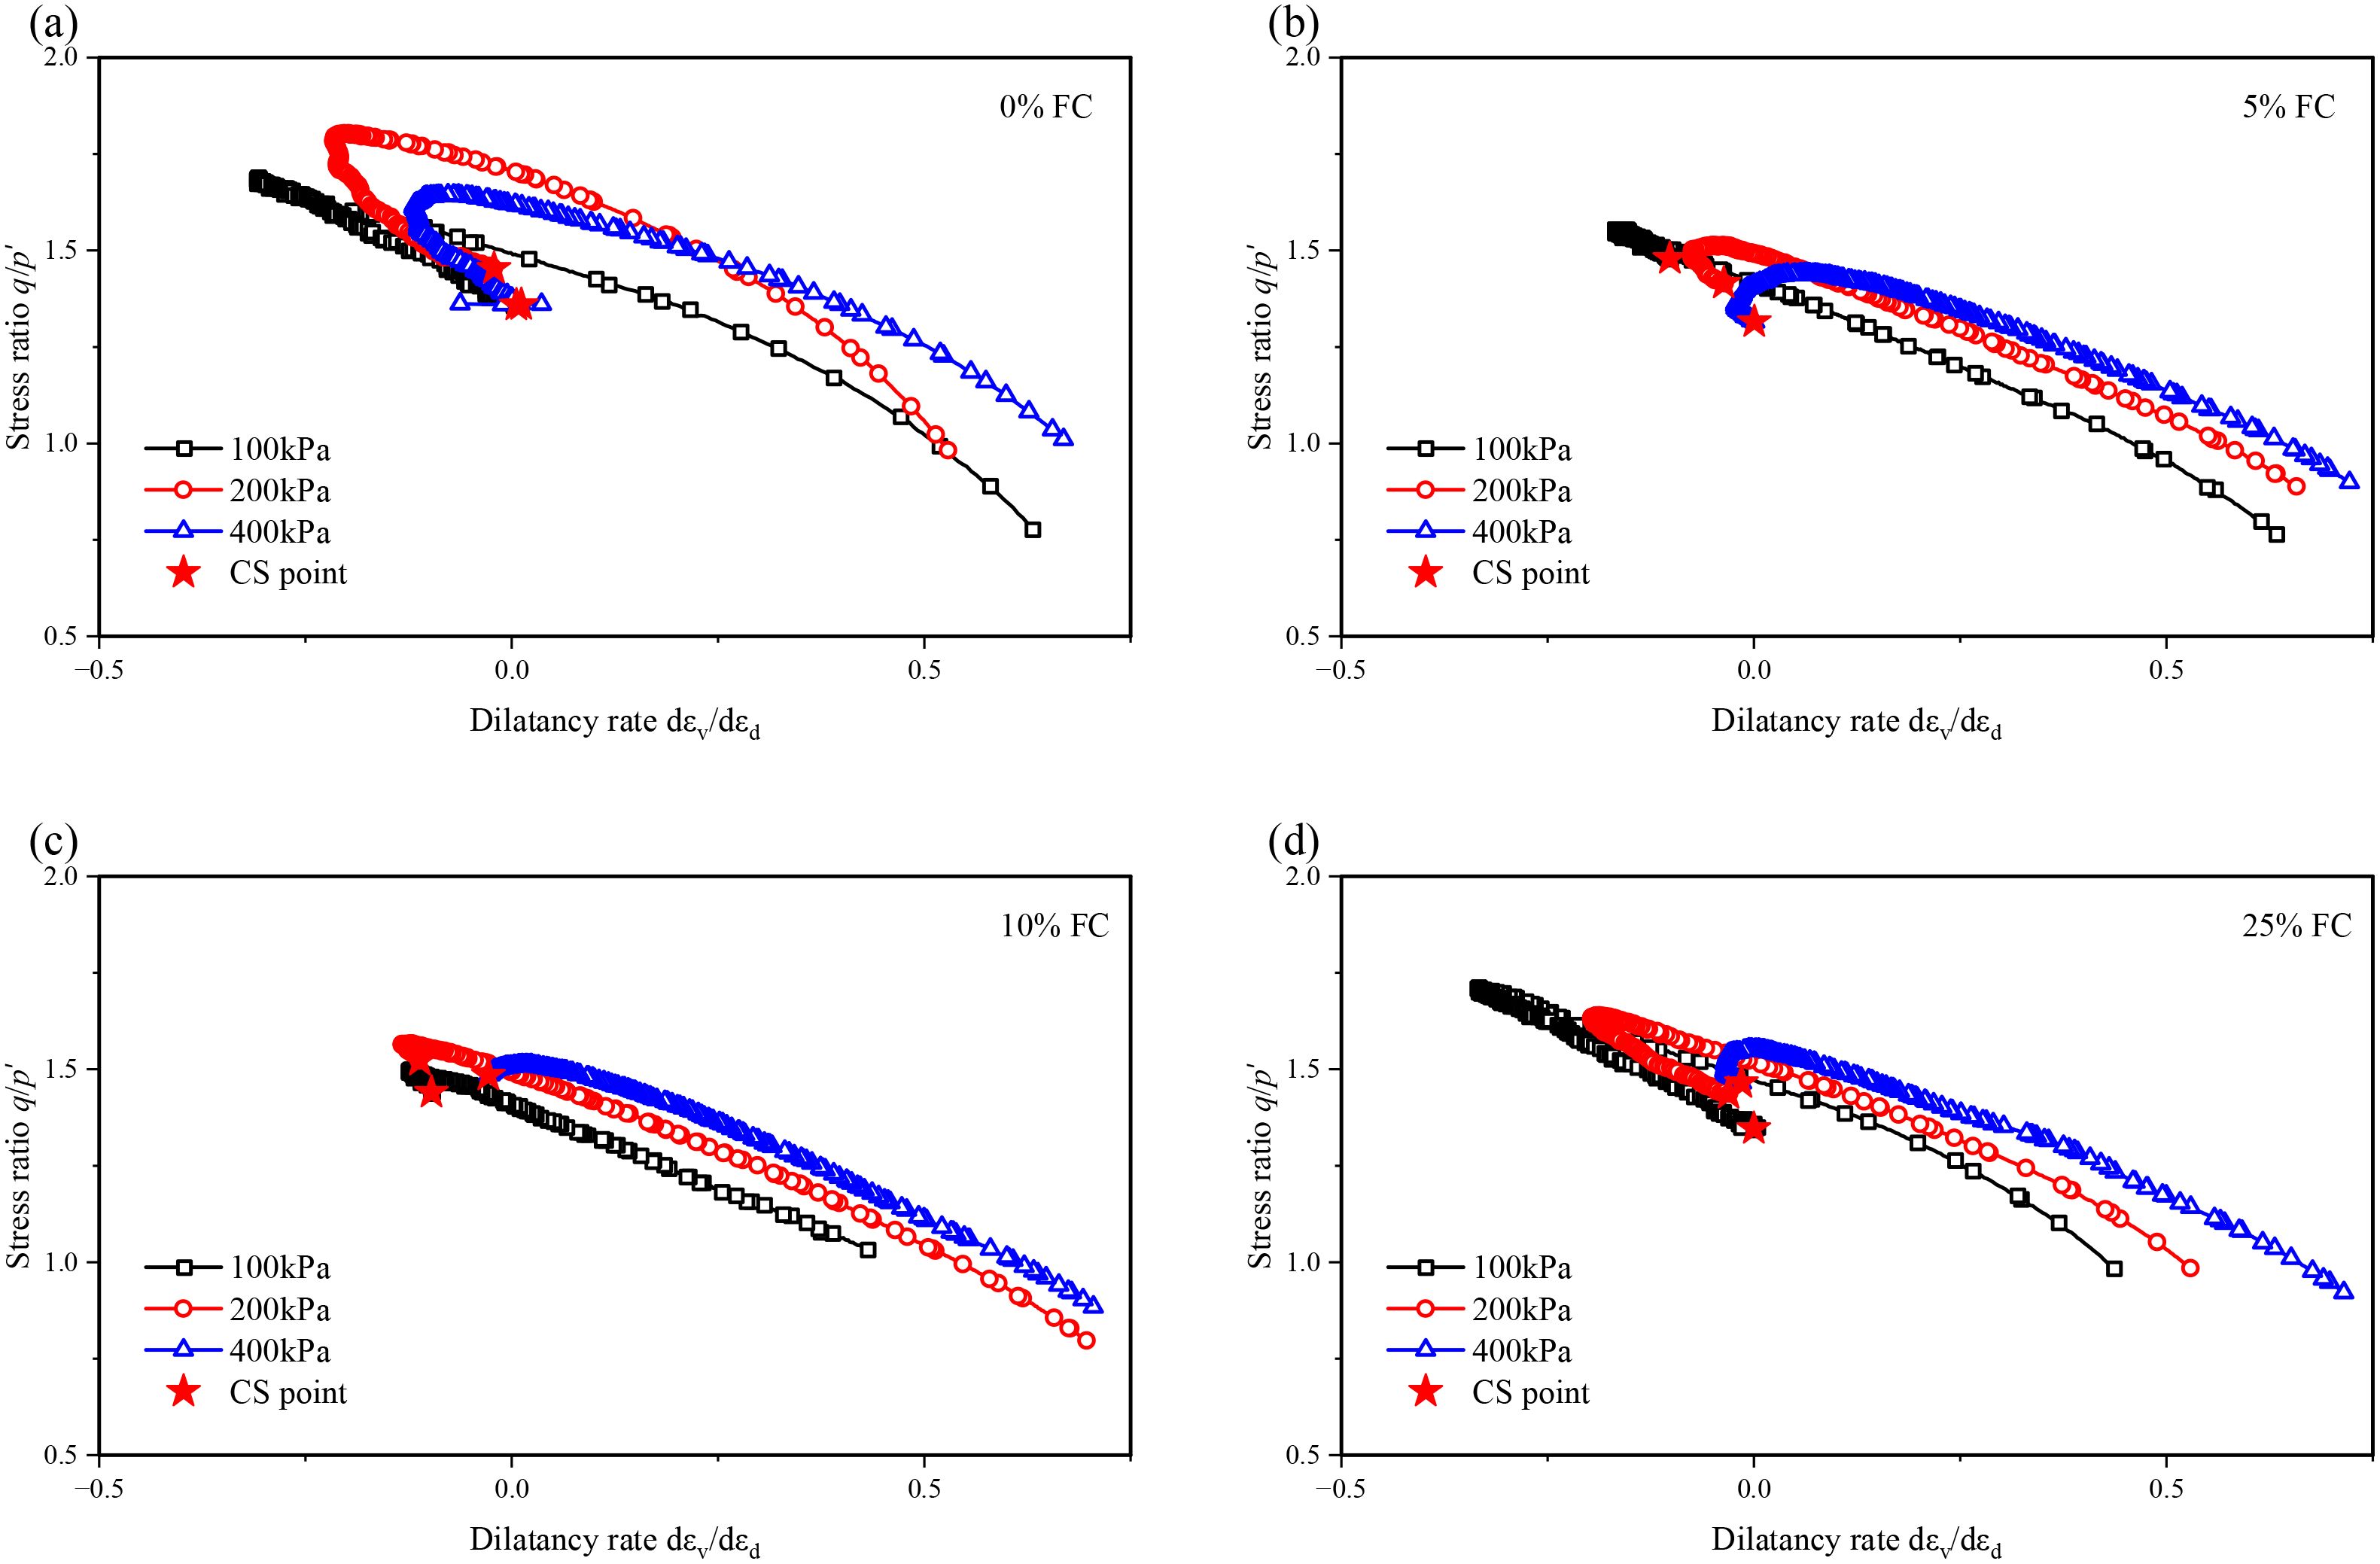
Figure 6. (a–d) Typical undrained stress-dilatancy behavior of calcareous sand with different fines content.
The stress-dilatancy curve allows for the determination of the peak friction angle (ϕp) and the maximum dilatancy angle (ϕd) under drained loading, with their relationship illustrated in Figure 7. Details for determining ϕp and ϕd are provided in Appendix A. In general, ϕd exhibits a positive influence on ϕp, irrespective of the clay content and initial mean effective pressure. ϕp increases monotonically with the increasing ϕd, which can be captured by the Bolton’s dilatancy equation (Bolton, 1986). However, the intercepts and slopes of the fitted dilatancy lines are different, depending on the specific clay content. This is partially different from the study in Xiao et al. (2017), where the slopes of quartz sands with different contents of non-plastic fines were almost constant. The discrepancy could be attributed to the more angular particle shapes and internal pores of the sand used in this study.
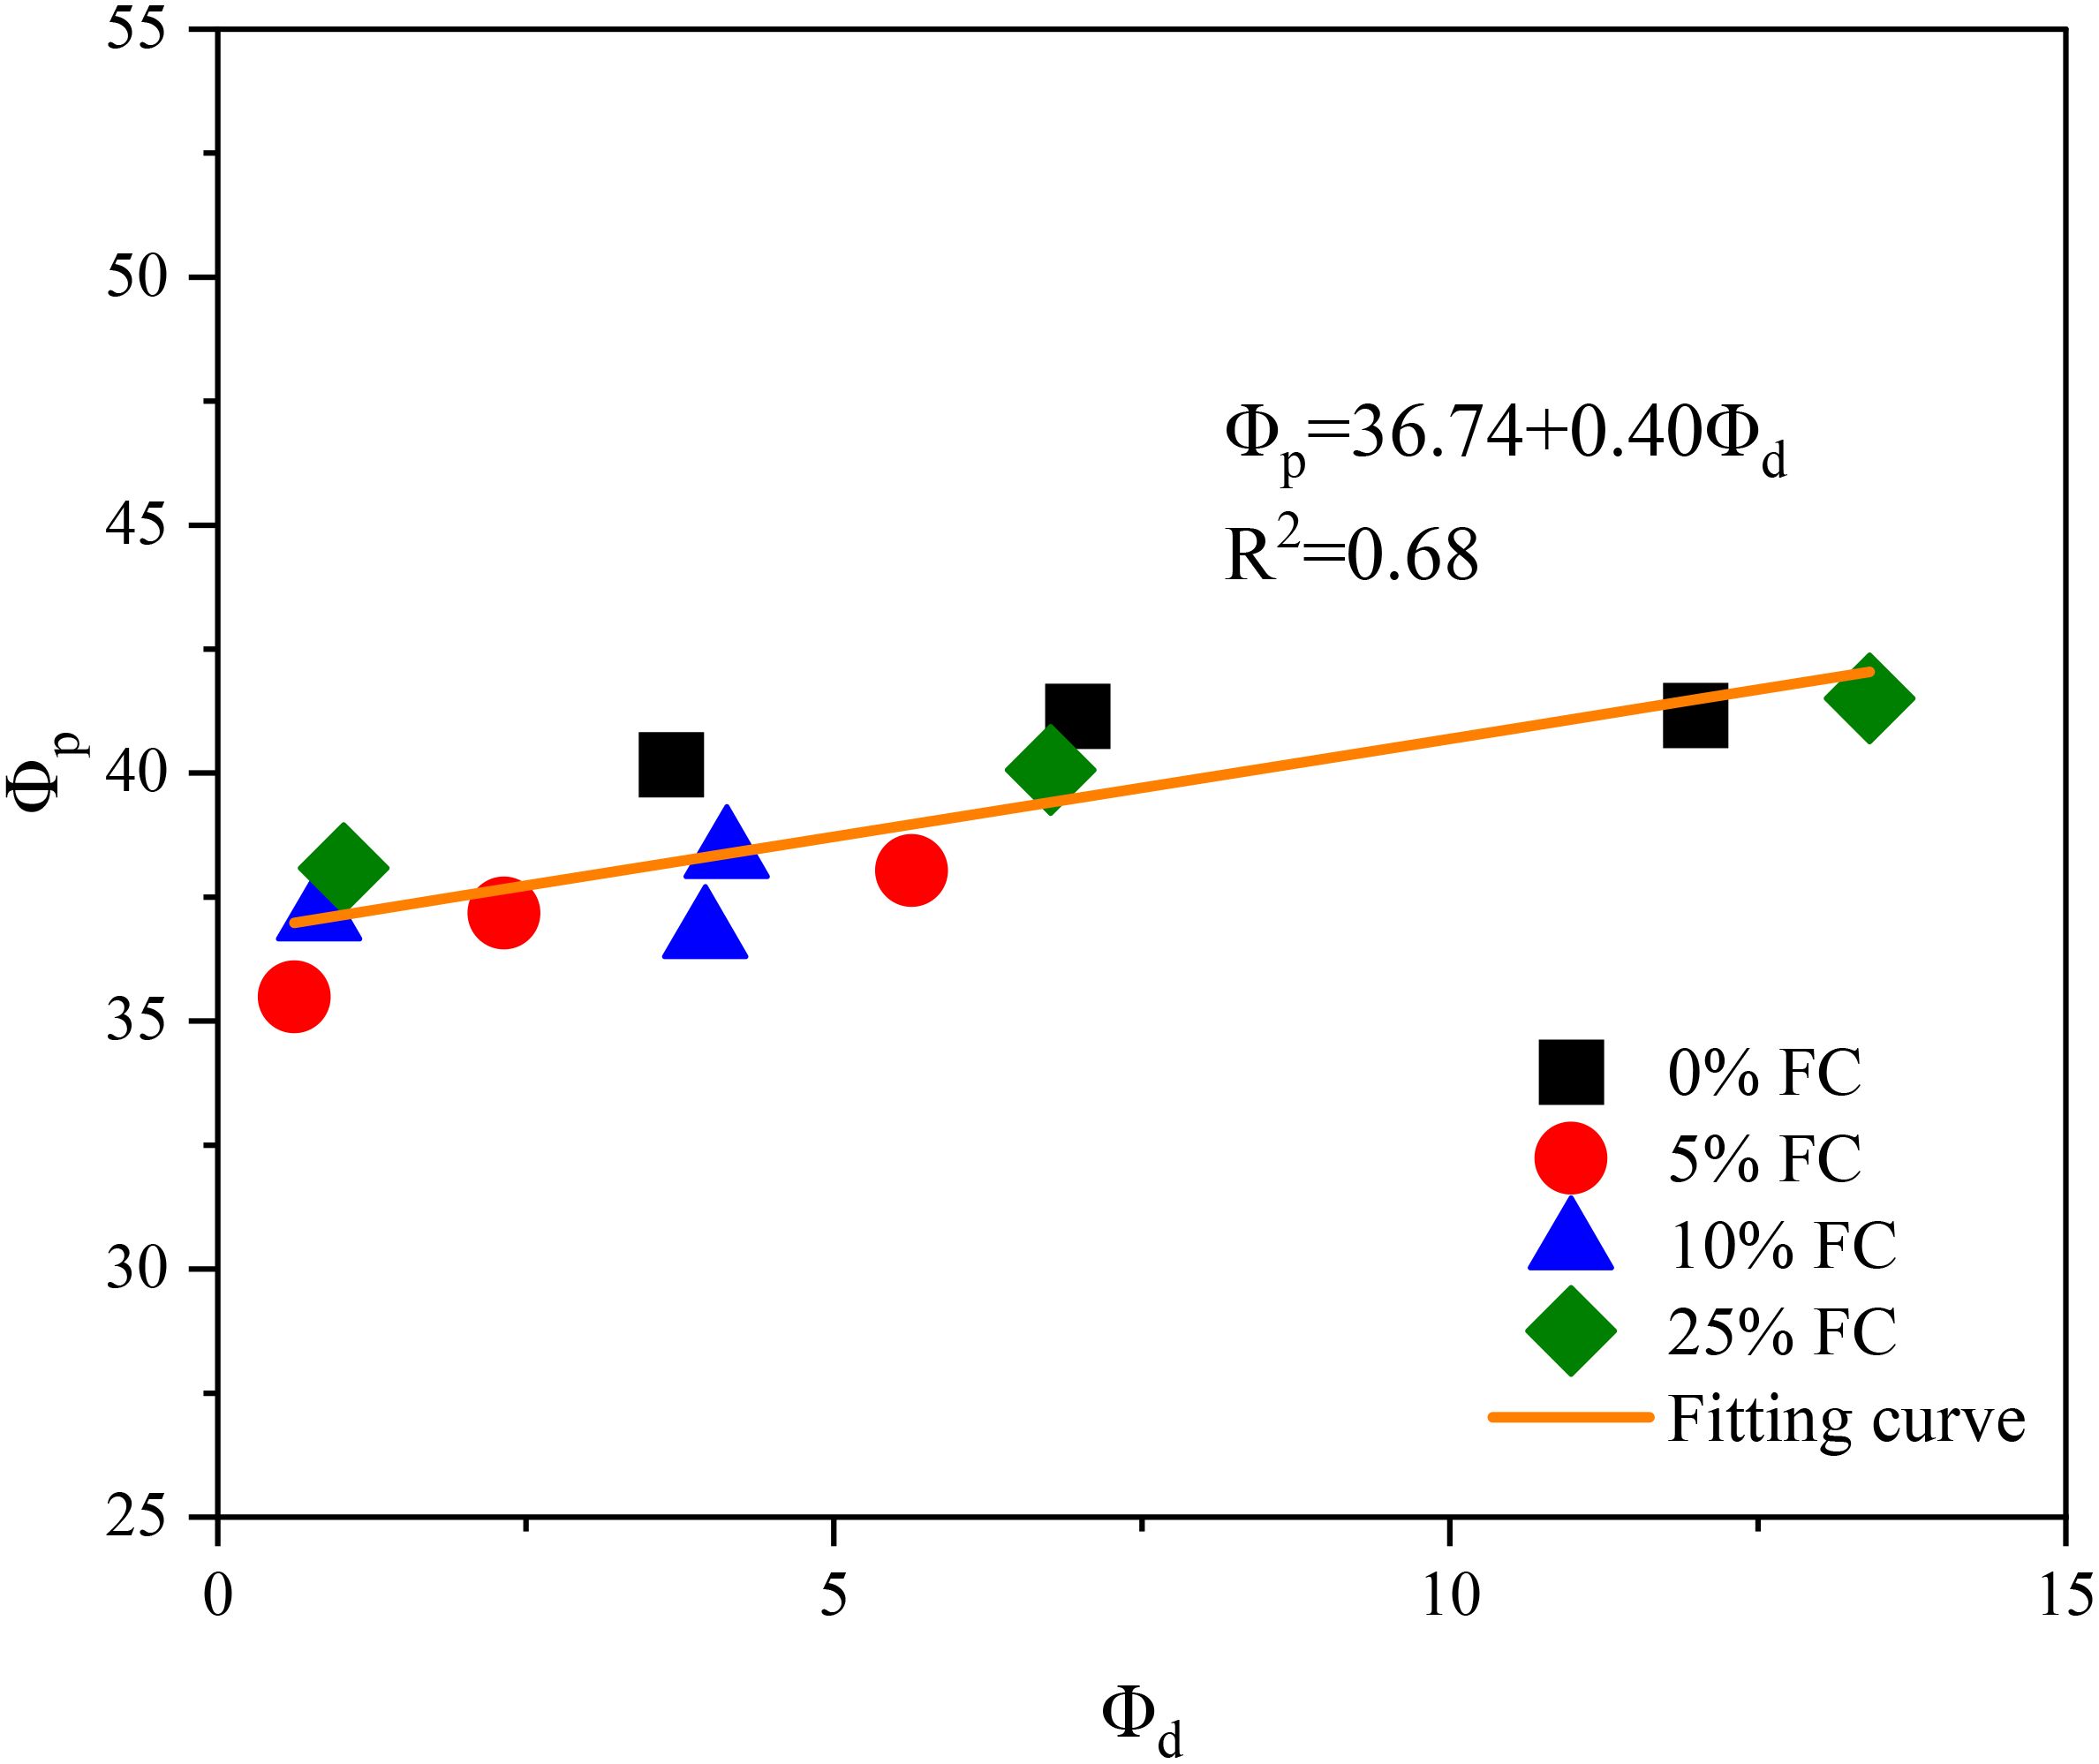
Figure 7. Peak friction angle and maximum dilatancy angle of calcareous sand with different fines content.
3 Analysis and discussions
3.1 Critical state
The critical state behavior of calcareous sand with varying clay contents is presented in Figures 8, 9. Figure 8 displays the data points along with the fitted critical state line (CSL) in the p′ − q plane, where independence of the CSL on clay content can be found. However, as shown in Figure 9, clay content does have a noticeable effect on the CSL in the e − (p′/pa)0.7 plane (with pa=100 kPa), where an evident downward shift of the CSL is observed as clay content increases. Despite this shift, the slopes of the CSLs for different proportions of sand-clay mixtures remain almost constant.
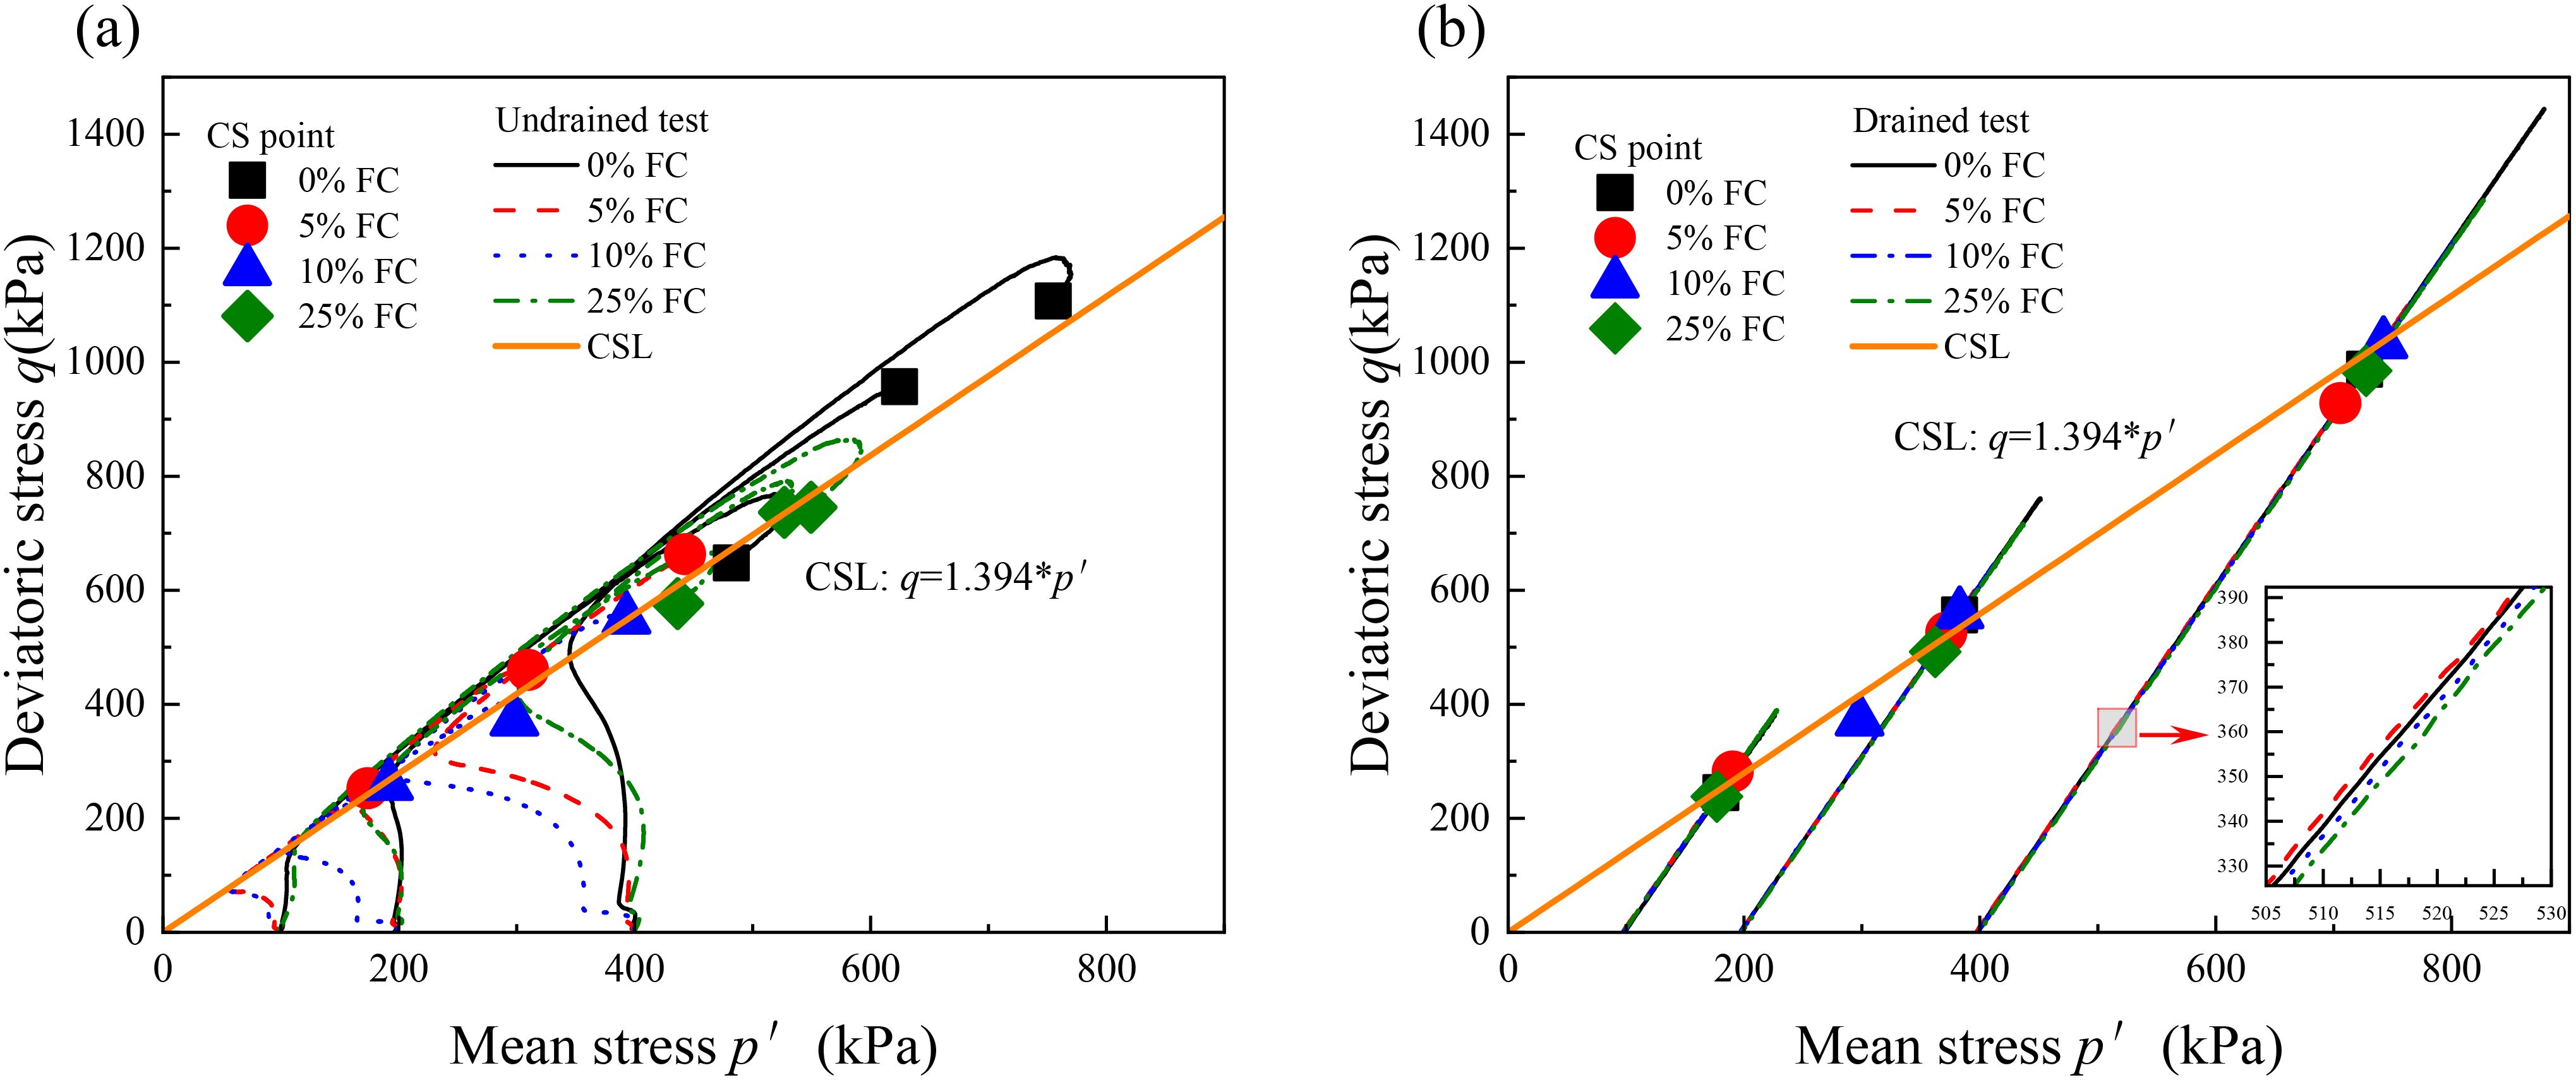
Figure 8. Critical state lines of calcareous sand with different fine contents in p-q plane. (a) undrained test and (b) drained test.
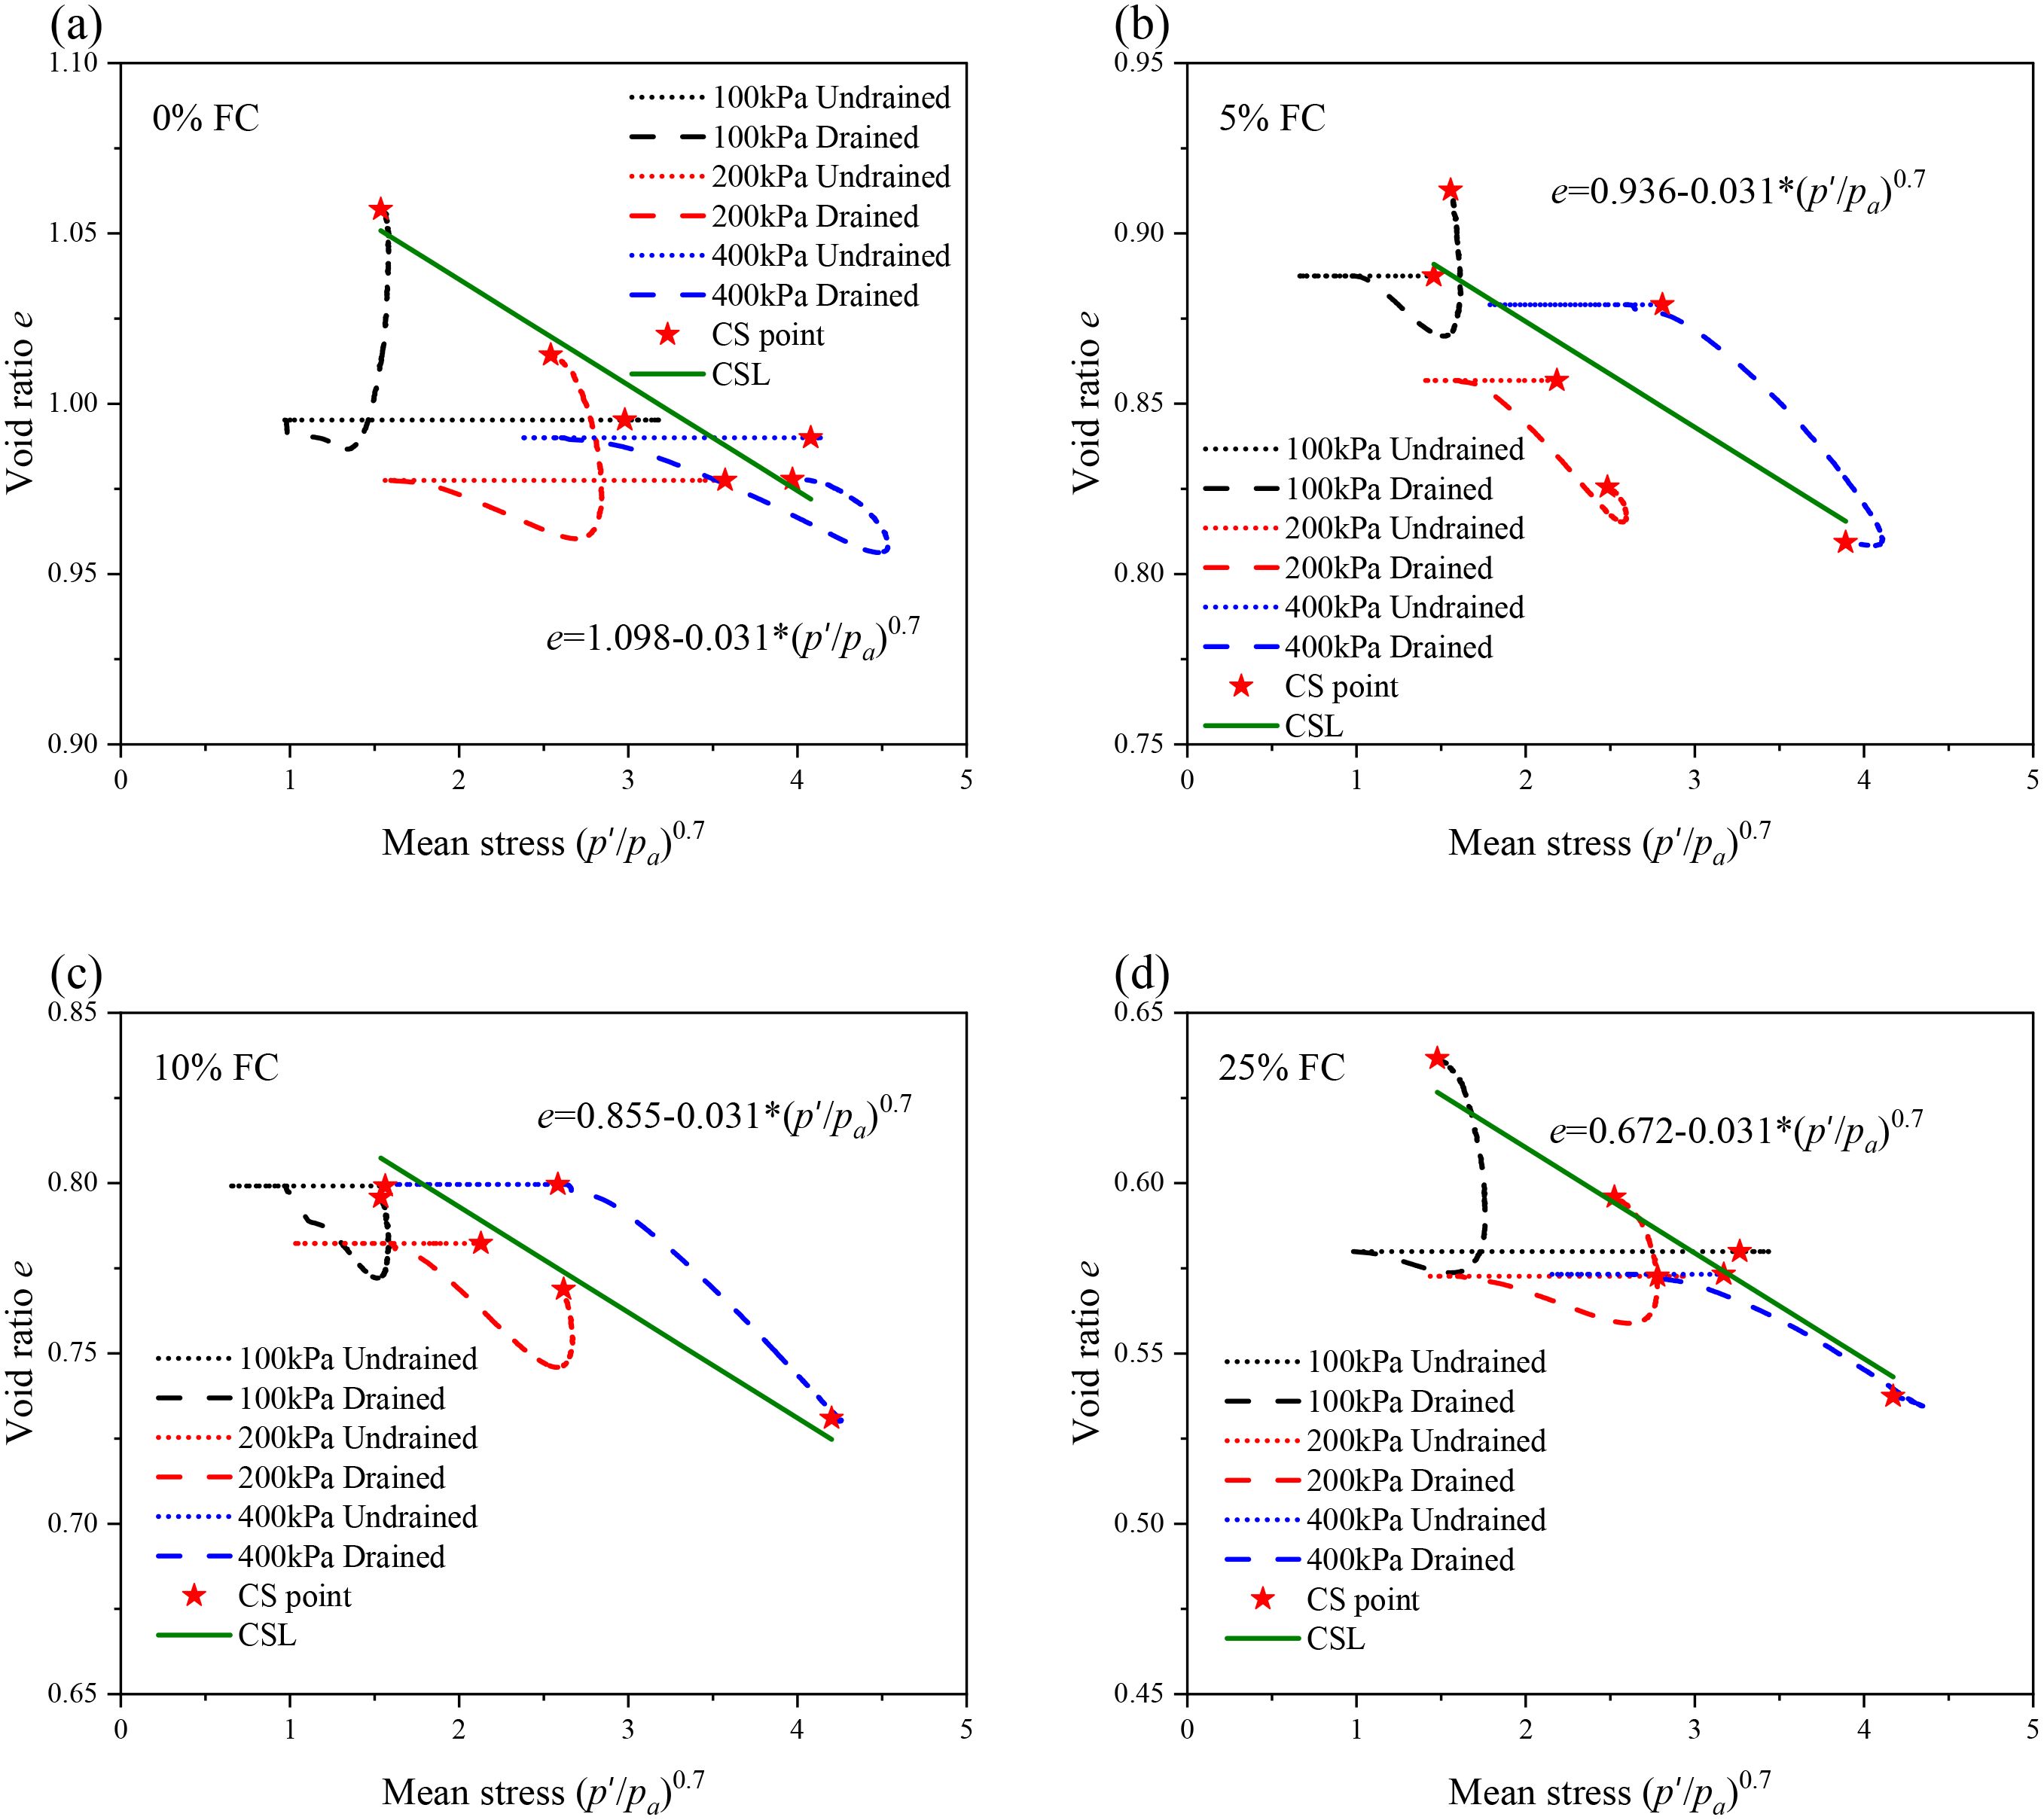
Figure 9. Critical state lines of calcareous sand with different fines content in e − lnp plane. (a) FC=0%, (b) FC=5%, (c) FC=10% and (d) FC=25%.
To consider the effect of fines content on the CSL, the equivalent granular void ratio (e∗), as introduced by Thevanayagam et al. (2002), is employed in place of the global void ratio (e), i.e.,
where b represents the fraction of fines contributing to the internal force chain in the specimen. Specifically, b = 0 when fines do not participate in force transmission, and b = 1 when all fines are active in the force chain. In this study, b is calculated using the formula proposed by Rahman et al. (2008), and the details of this calculation are provided in Appendix A. Using this formulation, the equivalent granular void ratio at critical state for different proportions of sand-clay mixtures is derived, as proposed by Thevanayagam et al. (2002). The critical-state data points in the e∗ − (p′/pa)0.7 plane can be represented as shown in Figure 10. It is evident that a unified CSL can be used to model the critical state of calcareous sands with different clay contents in the e∗ − (p′/pa)0.7 plane, as expressed by the following expression:
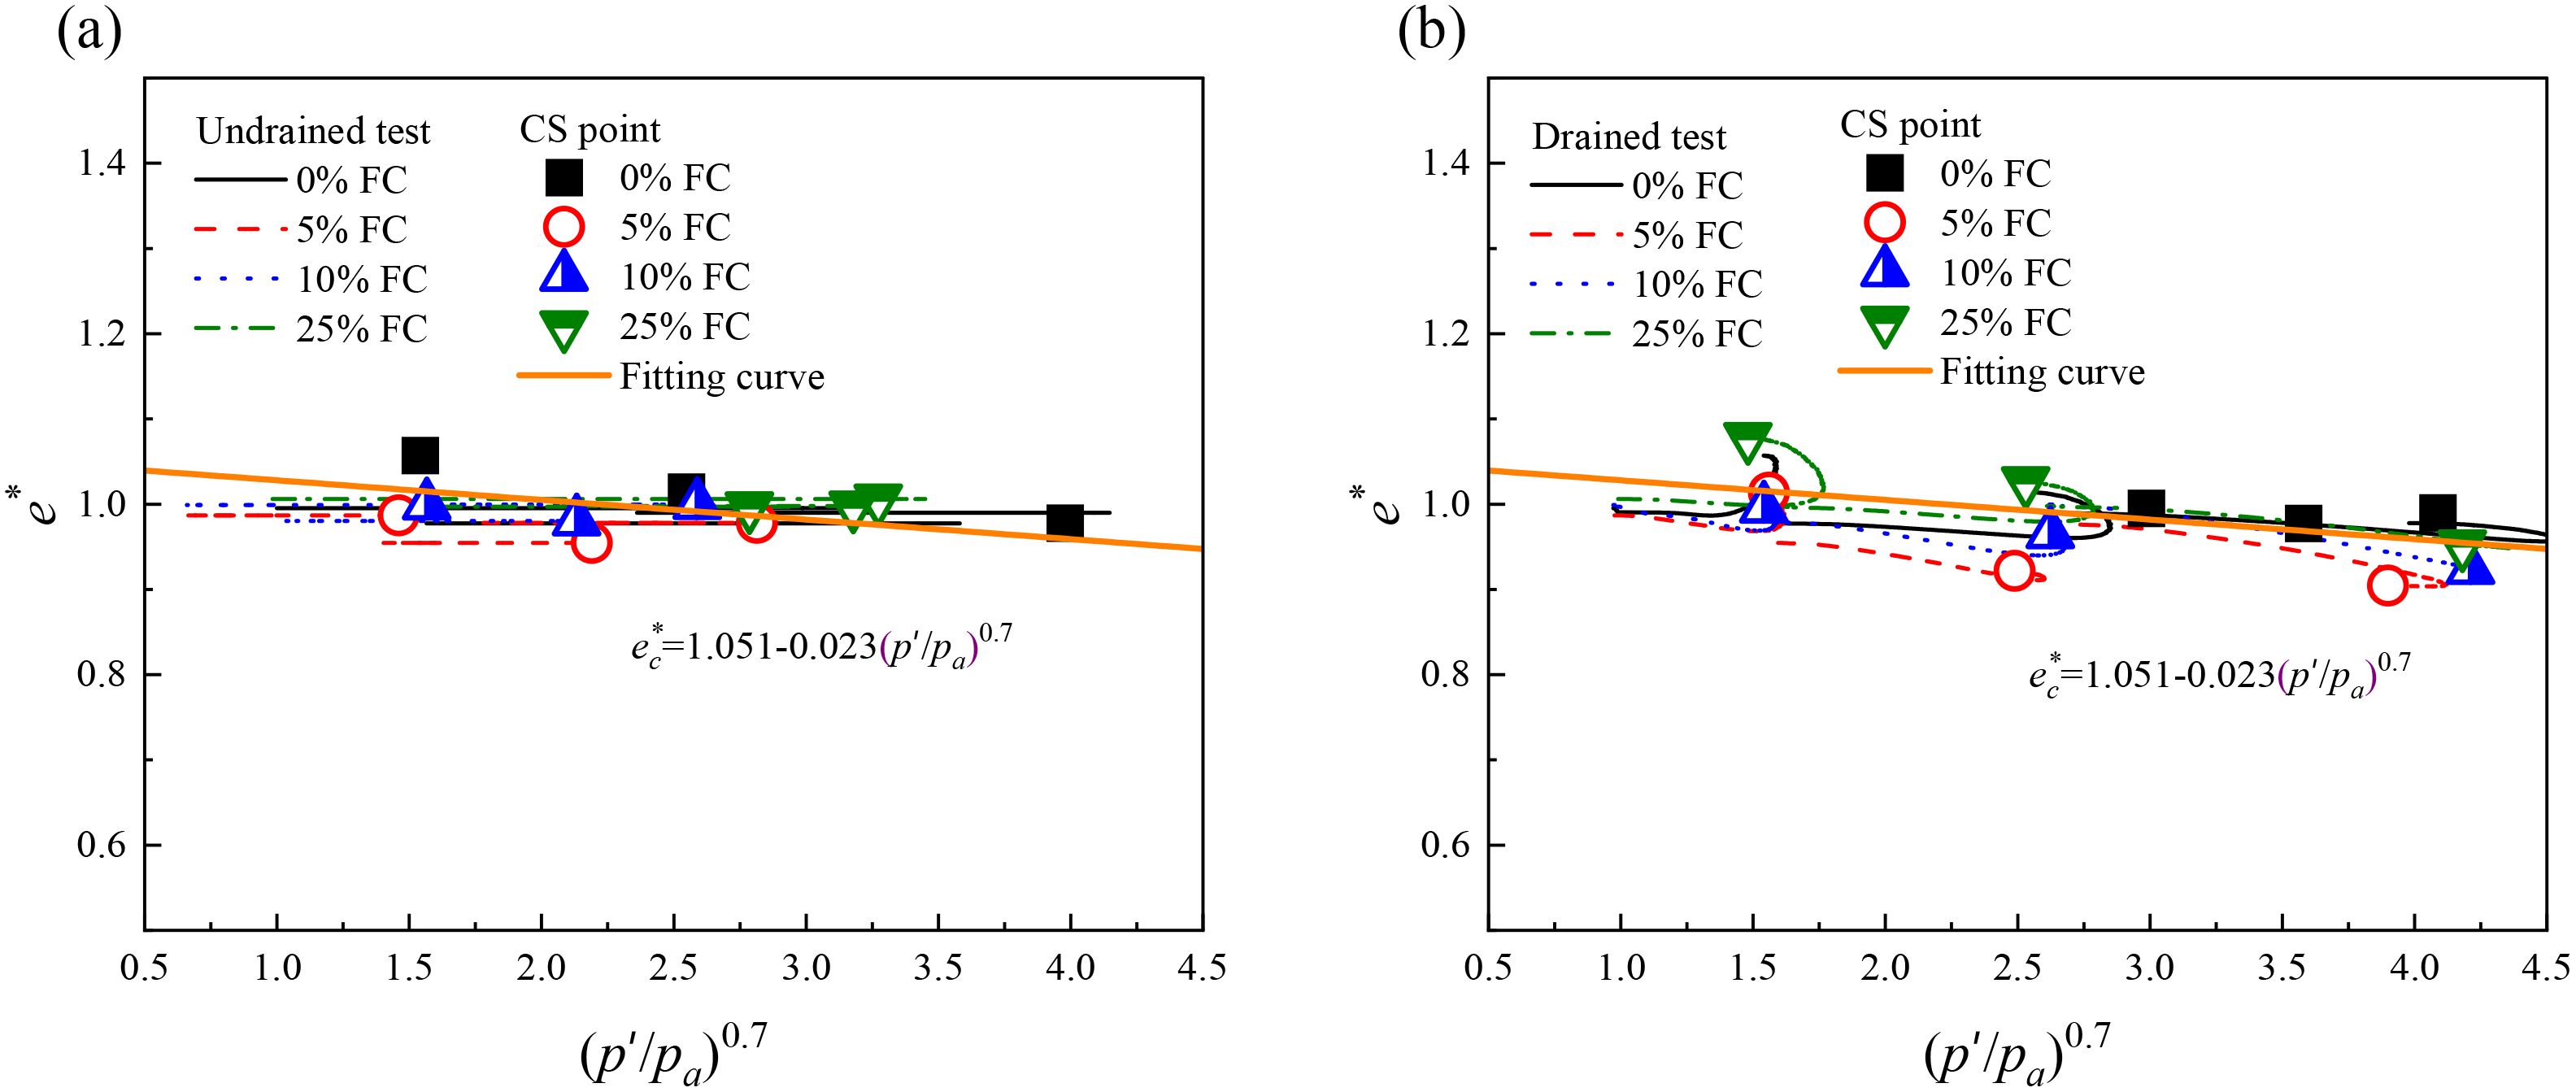
Figure 10. (a, b) Unified critical state line of calcareous sand with different fines content.
where and λ = 0.0025.
Furthermore, to evaluate the state-dependent behavior of calcareous sand with varying clay content, the equivalent state parameter () and the equivalent state index () can be introduced. These parameters are formulated based on Equation 2 and are expressed as follows:
where represents the threshold void ratio, which corresponds to the intercept of the CSL at p′ =0 kPa, as suggested by Ishihara (1993). In the following sections, the state-dependent behavior of calcareous sand with varying clay contents at specific characteristic states will be evaluated.
3.2 Phase transition state
The friction angle (ϕt) of clayed sand at the phase transition state (PTS) is calculated and illustrated in Figure 11. The results reveal an initial reduction in the PTS friction angle with increasing clay content, followed by a subsequent rise. This trend suggests that adding a small amount of clay can reduce the strength of calcareous sand at PTS; however, as more clay is introduced, the strength of blended mixture can increase again. This behavior can be attributed to clay particles filling the pores between sand grains, thereby enhancing the stress transmission network.
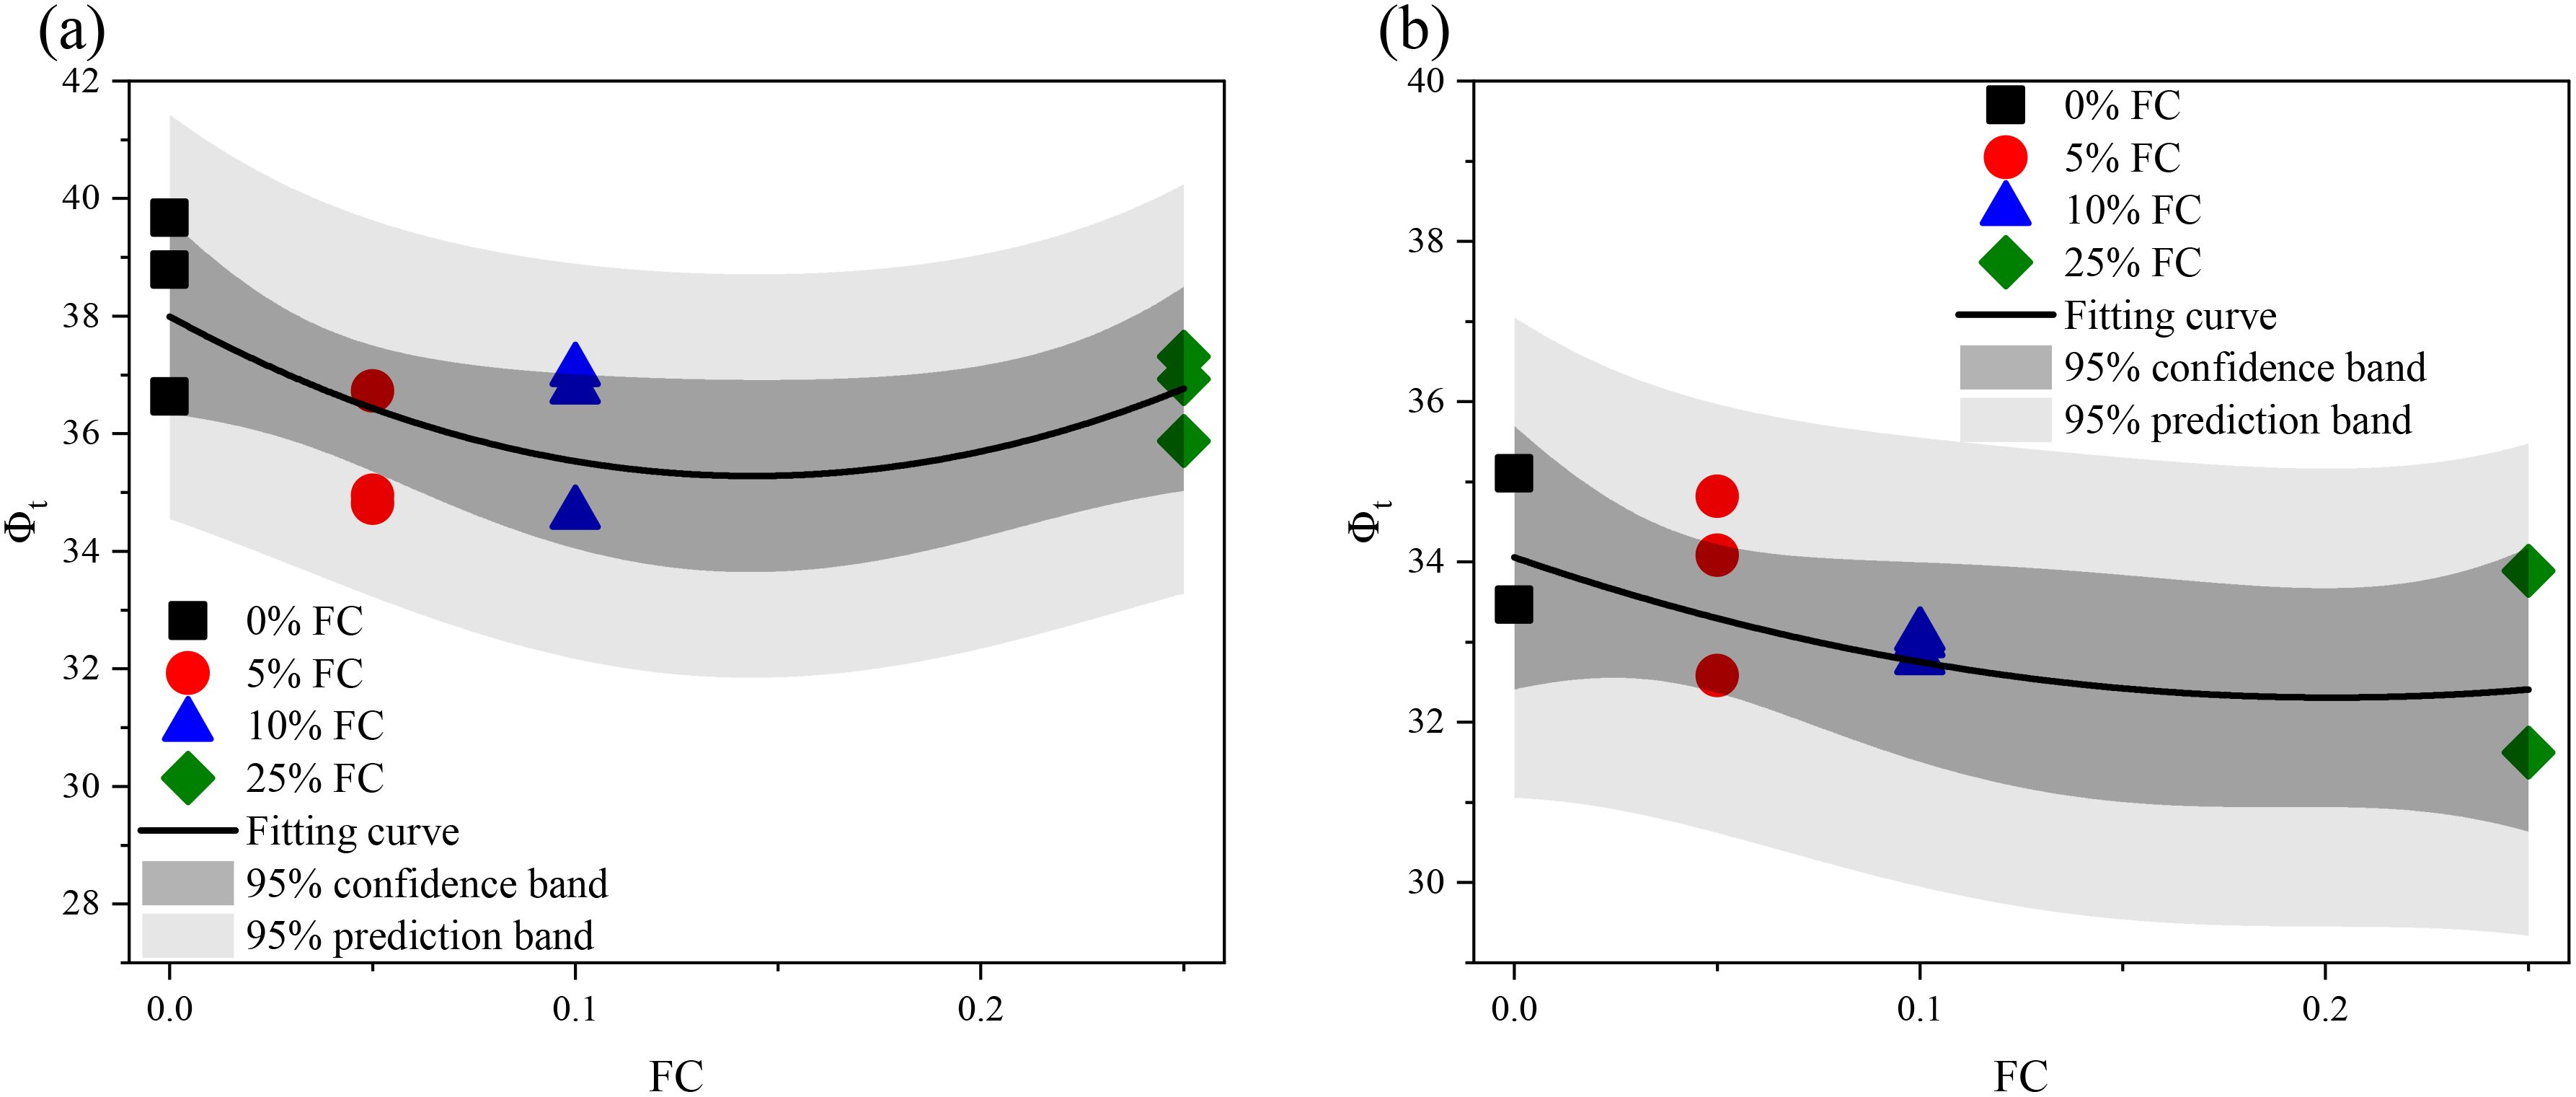
Figure 11. (a, b) Phase transition state friction angle of calcareous sand with different fines content.
The relationship between the PTS friction angle and both the state parameter and state index is presented in Figure 12. From Figure 12a, it is evident that the PTS friction angle increases monotonically with an increase in the state parameter, regardless of the drainage condition or clay content. This relationship can be characterized using a linear function. Conversely, Figure 12b shows a general decline in the PTS friction angle as the state index increases, which can also be approximated with a linear function. Comparing the R2 values of the fitted curves reveals that the PTS friction angle correlates more apparently with the state index.
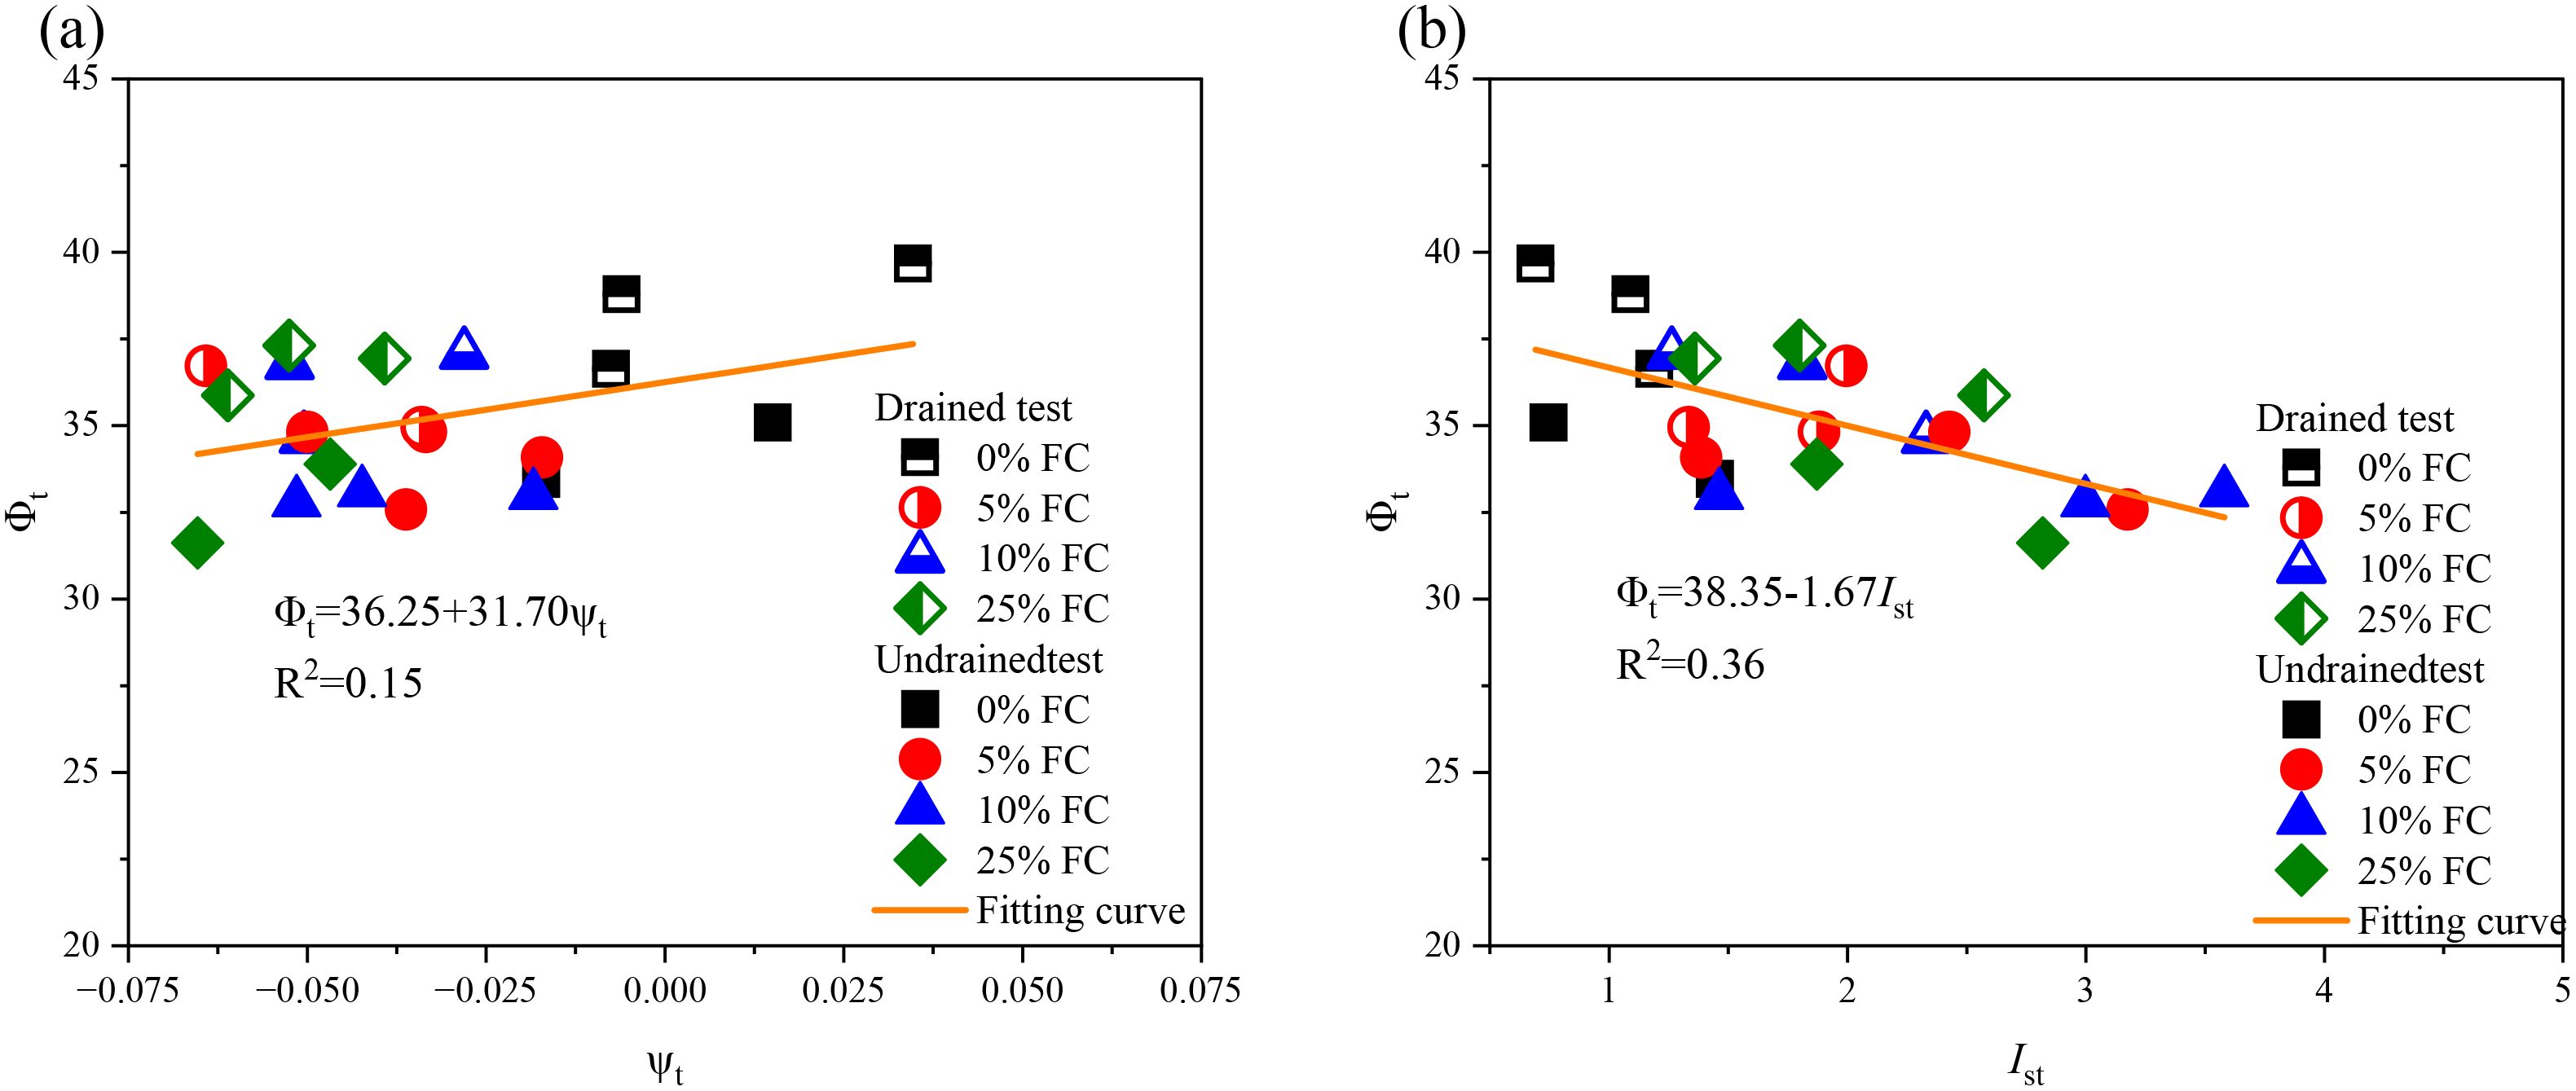
Figure 12. (a, b) State dependence of phase transition state friction angle.
3.3 Peak state
The friction angle (ϕp) of calcareous sand-clay mixtures at the peak state (PS) can be determined based on the peak state shear stress, as illustrated in Figure 13. Similar to the PTS friction angle, the PS friction angle initially decreases and then increases with the increasing clay content. However, a comparison of Figures 11, 13 indicates that clay addition exerts a more pronounced effect on the peak state behavior. The changes in the PS friction angle, whether decreasing or increasing, are sharper compared to those in the PTS friction angle.
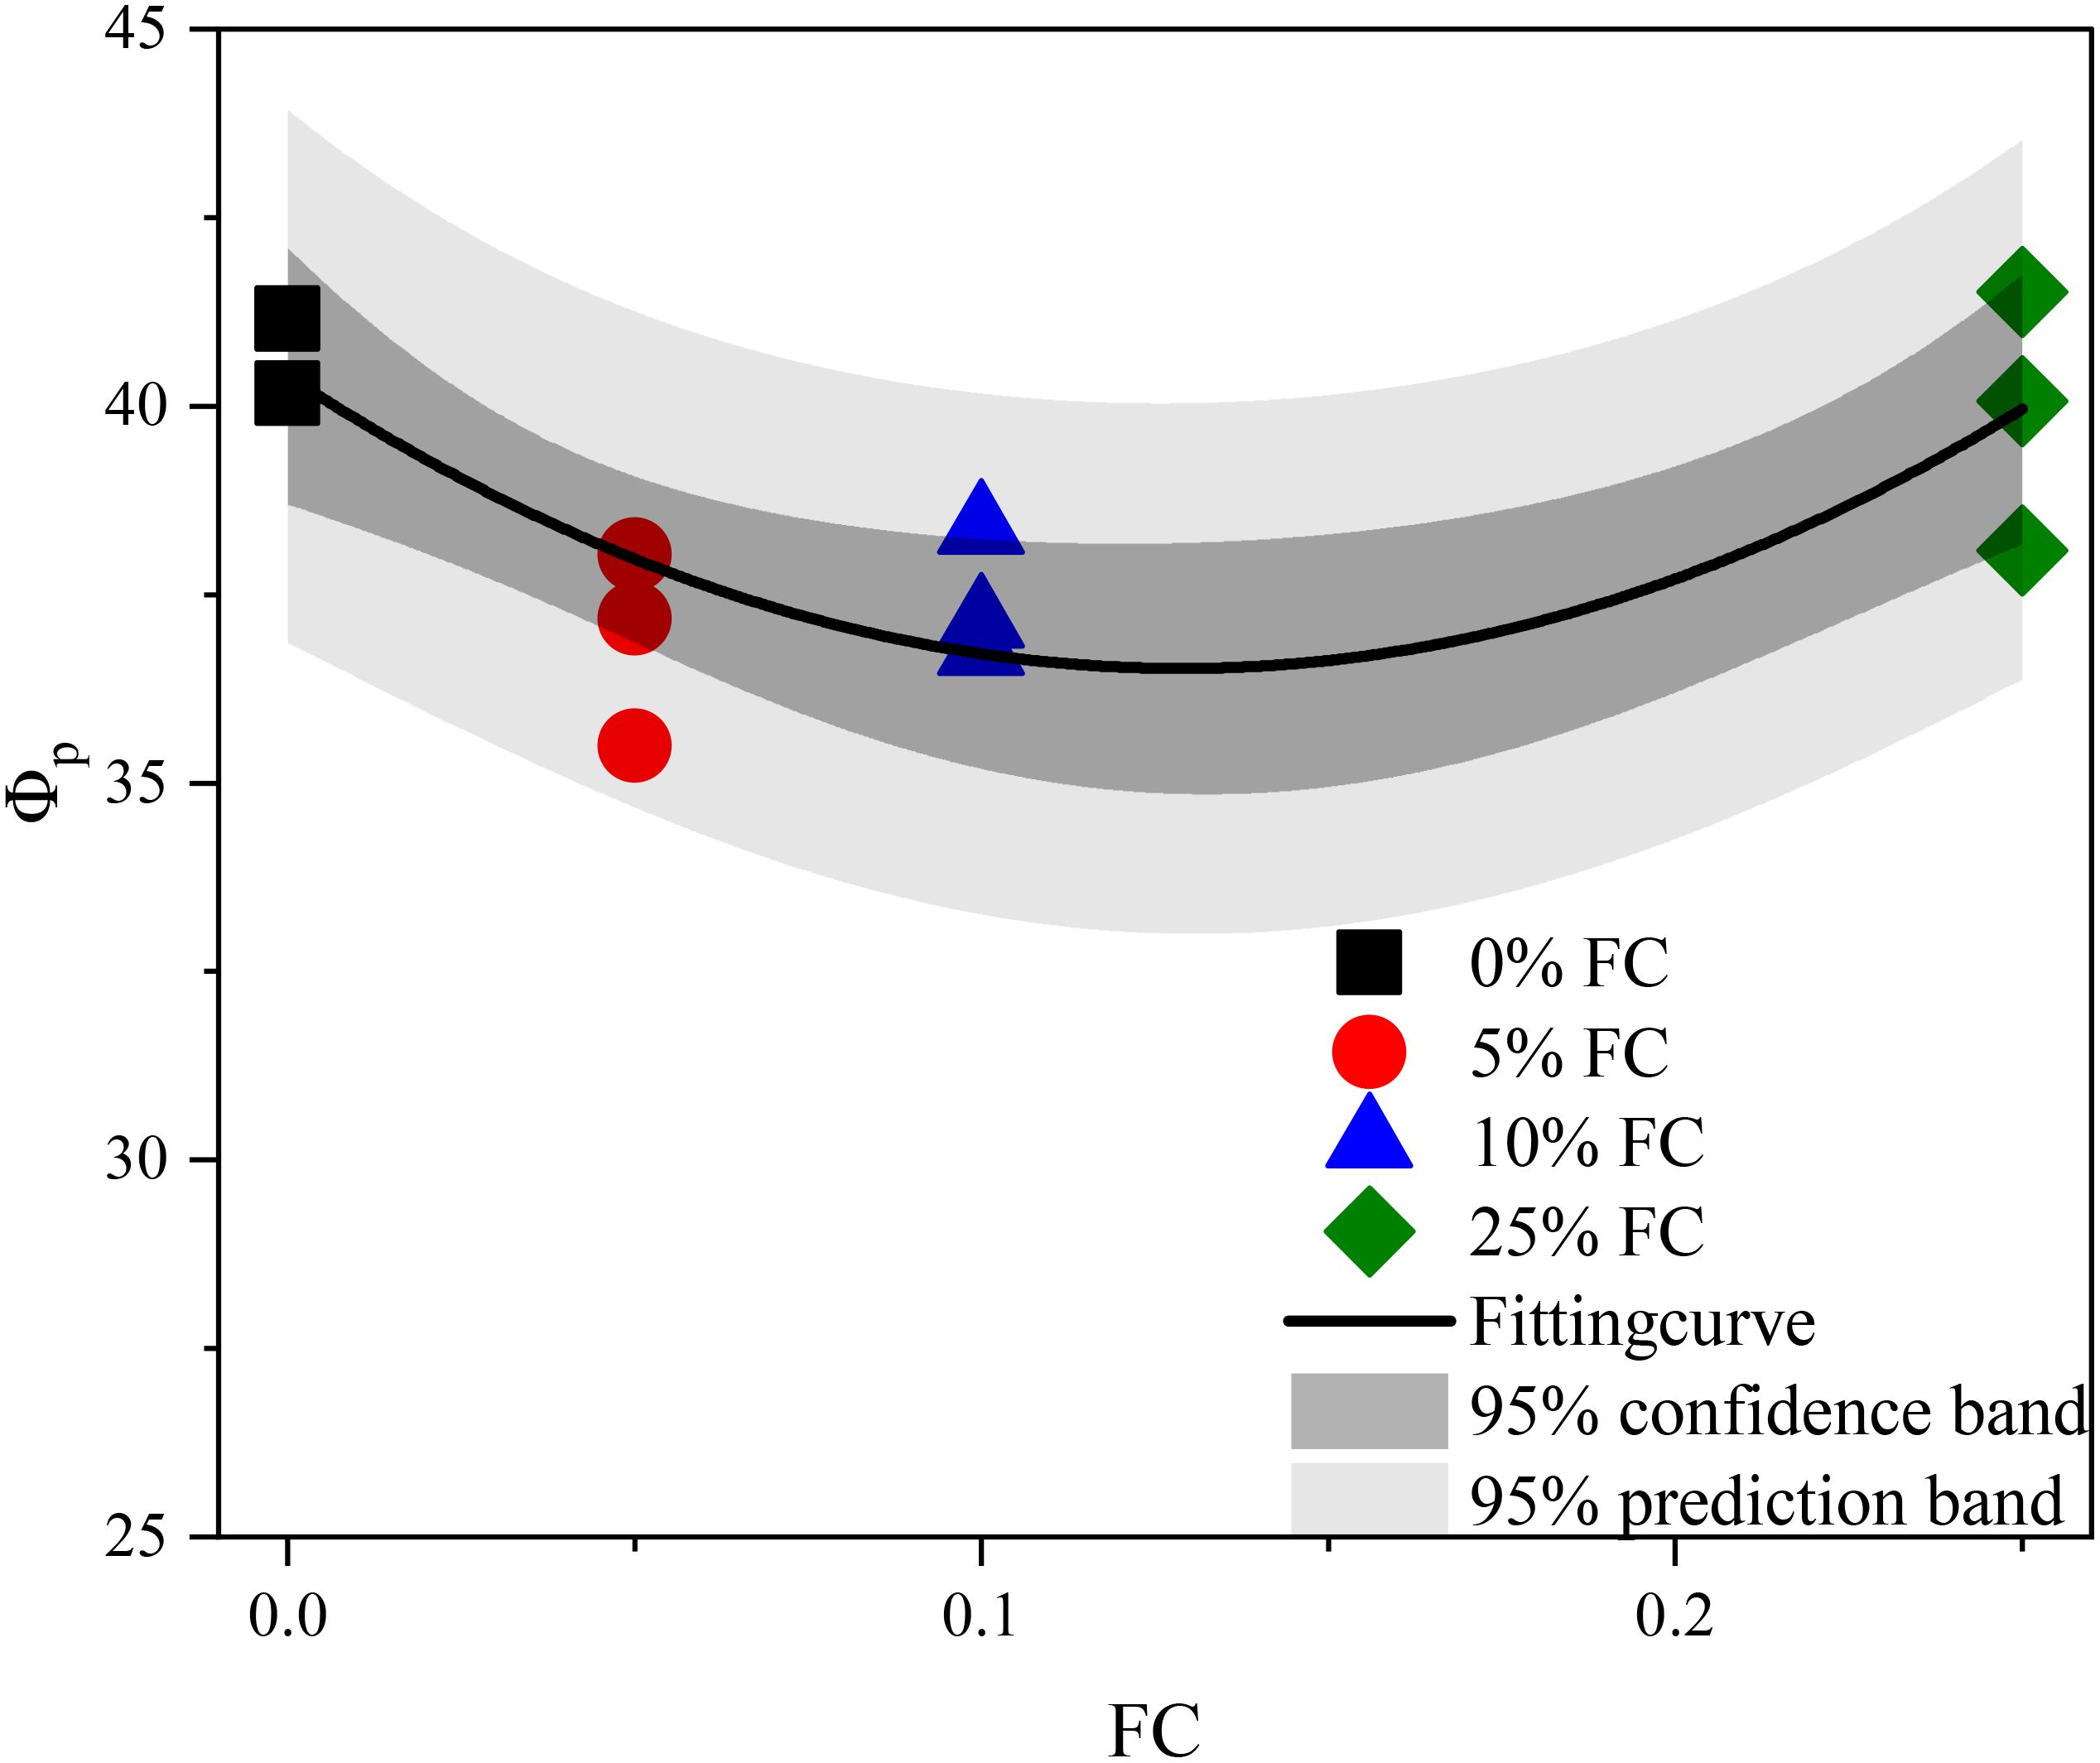
Figure 13. Peak state friction angle of calcareous sand with different fines content.
In addition, Figure 14 depicts the relationship between the PS friction angle and both the state parameter and state index. As shown in Figure 14a, the PS friction angle generally increases with the state parameter, and this trend can be represented by a linear function. However, further investigations into results with varying clay contents reveals distinct patterns. For clean calcareous sand (FC = 0%), the PS friction angle decreases with the state parameter, whereas for specimen with FC = 25%, the trend reverses. Specimens with FC = 5% and 10% exhibits a combination of both trends: an initial reduction followed by an increase in the PS friction angle as the state parameter increases. This indicates a transitional response in peak state behavior as clay content increases from 0 to 25%, highlighting the role of clay intrusion in modifying the strength of calcareous sand. Furthermore, Figure 14b shows an overall decline in the PS friction angle with increasing state index, which can also be approximated using a linear function. A comparison between Figures 14a, b, reveals that PS friction angle exhibits a stronger correlation with the state parameter than with the state index.

Figure 14. (a, b) State dependence of peak state friction angle.
4 Conclusions
Calcareous sand is commonly used in reclamation projects in oceanic areas, where the intrusion of fines is often a concern. This study aimed to investigate the impact of fines content on the strength and deformation characteristics of calcareous sand under both drained and undrained triaxial loading conditions. The main findings of the study are summarized as follows:
1. Strain hardening and softening responses were observed in both clean calcareous sand and sand-clay mixtures under different confining pressures. At low confining pressures, distinct strain softening and volumetric dilatancy were evident. In contrast, under high confining pressures, strain softening and dilatancy were much less pronounced.
2. When the fines content increased from 0 to 10%, the degree of volumetric dilatancy and the maximum dilatancy angle decreased, which in turn led to a reduction in the peak state friction angle. However, as the fines content further increased to 25%, both the volumetric dilatancy and the maximum dilatancy angle increased, resulting in an enhanced peak strength for the calcareous sand-clay mixture. Similar observations were observed in the relationship between the phase transition state friction angle and fines content.
3. Although fines content significantly affected the stress-strain relation of the specimens, it had little influence on the critical state lines of each specimen in the p′ − q plane.
4. As fines content increased, the critical state lines of the calcareous sand-clay mixtures in the e − p′0.7 plane shifted downwards. However, a unified critical state line could be established by adopting the concept of the equivalent skeleton void ratio.
5. Using the unified critical state line, the state dependence of the calcareous sand and clay mixtures was further evaluated using the modified state parameter and state index. The results showed that the friction angles at the phase transition state and peak state were both dependent on the material state. As the state parameter increased, the friction angle at the phase transition state increased, while the friction angle at the peak state with a higher state index. A better correlation was observed when the state index was used. However, the variation in the peak state friction angle with material state was not entirely consistent, as its evolution depended on the fines content.
Data availability statement
The raw data supporting the conclusions of this article will be made available by the authors, without undue reservation.
Author contributions
HZ: Conceptualization, Formal Analysis, Funding acquisition, Investigation, Methodology, Writing – original draft. YG: Data curation, Investigation, Writing – review & editing. FL: Data curation, Investigation, Writing – review & editing. JZ: Supervision, Writing – review & editing. D-SJ: Supervision, Writing – review & editing. SH: Formal Analysis, Writing – review & editing. JL: Writing – review & editing. YS: Conceptualization, Formal Analysis, Methodology, Writing – review & editing.
Funding
The author(s) declare that financial support was received for the research and/or publication of this article. This study was supported by the National Natural Science Foundation of China (grant no. 52301318), and the Taishan Scholars Project Funding (grant no. TSQN202312221). We thank all the authors, reviewers, editors, staff who have participated in this Research Topic.
Conflict of interest
The authors declare that the research was conducted in the absence of any commercial or financial relationships that could be construed as a potential conflict of interest.
The author(s) declared that they were an editorial board member of Frontiers, at the time of submission. This had no impact on the peer review process and the final decision.
Generative AI statement
The author(s) declare that no Generative AI was used in the creation of this manuscript.
Publisher’s note
All claims expressed in this article are solely those of the authors and do not necessarily represent those of their affiliated organizations, or those of the publisher, the editors and the reviewers. Any product that may be evaluated in this article, or claim that may be made by its manufacturer, is not guaranteed or endorsed by the publisher.
References
Alba J., Audibert J. (1999). “Pile design in calcareous and carbonaceous granular materials, and historic review,” in Proceedings of the 2nd international conference on engineering for calcareous sediments. Rotterdam: AA Balkema, 29–44.
Been K., Jefferies M., Hachey J. (1992). Discussion: The critical state of sands. Géotechnique 42, 655–663. doi: 10.1680/geot.1992.42.4.655
Bolton M. D. (1986). The strength and dilatancy of sands. Géotechnique 36, 65–78. doi: 10.1680/geot.1986.36.1.65
Carrera A., Coop M., Lancellotta R. (2011). Influence of grading on the mechanical behaviour of stava tailings. Géotechnique 61, 935–946. doi: 10.1680/geot.9.P.009
Coop M. (1990). The mechanics of uncemented carbonate sands. Géotechnique 40, 607–626. doi: 10.1680/geot.1990.40.4.607
Dash H., Sitharam T. (2011). Undrained monotonic response of sand–silt mixtures: effect of nonplastic fines. Geomechanics Geoengineering: Int. J. 6, 47–58.
Demdoum A., Gueddouda M. K., Goual I. (2017). Effect of water and leachate on hydraulic behavior of compacted bentonite, calcareous sand and tuff mixtures for use as landfill liners. Geotechnical Geological Eng. 35, 2677–2696. doi: 10.1007/s10706-017-0270-4
Gao J., Mi C., Song Z., Liu Y. (2024). Transient gap resonance between two closely-spaced boxes triggered by nonlinear focused wave groups. Ocean Eng. 305, 117938. doi: 10.1016/j.oceaneng.2024.117938
GB/T 50123-2019 (2019). Analysis on the relevant test methods of “Standard of Geotechnical Test Methods”.
Goudarzy M., Sarkar D., Lieske W., Wichtmann T. (2022). Influence of plastic fines content on the liquefaction susceptibility of sands: monotonic loading. Acta Geotechnica 17, 1719–1737. doi: 10.1007/s11440-021-01283-w
He S., Goudarzy M., Ding Z., Sun Y. (2023). Strength, deformation, and particle breakage behavior of calcareous sand: Role of anisotropic consolidation. J. Geotechnical Geoenvironmental Engineering ASCE 149, 04023002. doi: 10.1061/JGGEFK.GTENG-10501
Ishihara K. (1993). Liquefaction and flow failure during earthquakes. Géotechnique 43, 351–345. doi: 10.1680/geot.1993.43.3.351
Karim M., Alam M. (2016). Undrained monotonic and cyclic response of sand–silt mixtures. Int. J. Geotechnical Eng. 10, 223–235.
King R., Lodge M. (1988). “North west shelf development-the foundation engineering challenge,” in International conference on calcareous sediments. Netherlands: AA Balkema, Rotterdam Publication 333–341.
Lade P. V., Yamamuro J. A. (1997). Effects of nonplastic fines on static liquefaction of sands. Can. Geotechnical J. 34, 918–928. doi: 10.1139/t97-052
Li X., Liu J., Nan J. (2022). Prediction of dynamic pore water pressure for calcareous sand mixed with fine-grained soil under cyclic loading. Soil Dynamics Earthquake Eng. 157, 107276. doi: 10.1016/j.soildyn.2022.107276
Liu Q., Cui J., Shang X., Xie X., Wu X., Gao J., et al. (2023). Observation of near-inertial internal gravity waves in the southern South China Sea. Remote Sens. 15, 368. doi: 10.3390/rs15020368
Ma L., Li Z., Wang M., Wei H., Fan P. (2019). Effects of size and loading rate on the mechanical properties of single coral particles. Powder Technol. 342, 961–971. doi: 10.1016/j.powtec.2018.10.037
Ni Q., Tan T., Dasari G., Hight D. (2004). Contribution of fines to the compressive strength of mixed soils. Géotechnique 54, 561–569. doi: 10.1680/geot.2004.54.9.561
Papadopoulou A., Tika T. (2008). The effect of fines on critical state and liquefaction resistance characteristics of non-plastic silty sands. Soils Foundations 48, 713–725. doi: 10.3208/sandf.48.713
Porcino D., Diano V., Triantafyllidis T., Wichtmann T. (2020). Predicting undrained static response of sand with non-plastic fines in terms of equivalent granular state parameter. Acta Geotechnica 15, 867–882. doi: 10.1007/s11440-019-00770-5
Rahman M. M., Lo S., Dafalias Y. (2014). Modelling the static liquefaction of sand with low-plasticity fines. Géotechnique 64, 881–894. doi: 10.1680/geot.14.P.079
Rahman M. M., Lo S., Gnanendran C. (2008). On equivalent granular void ratio and steady state behaviour of loose sand with fines. Can. Geotechnical J. 45, 1439–1456. doi: 10.1139/T08-064
Raman M. M., Lo S. (2012). Predicting the onset of static liquefaction of loose sand with fines. J. Geotechnical Geoenvironmental Engineering ASCE 138, 1037–1041.
Sarkar D., Goudarzy M., Wichtmann T. (2022). Influence of particle size on the small-strain stiffness in granular soils: experimental observations and micromechanical interpretation. Géotechnique 72, 1–15.
Shahnazari H., Jafarian Y., Tutunchian M. A., Rezvani R. (2016). Undrained cyclic and monotonic behavior of hormuz calcareous sand using hollow cylinder simple shear tests. Int. J. Civil Eng. 14, 209–219. doi: 10.1007/s40999-016-0021-6
Shahnazari H., Rezvani R. (2013). Effective parameters for the particle breakage of calcareous sands: An experimental study. Eng. Geology 159, 98–105. doi: 10.1016/j.enggeo.2013.03.005
Shipton B., Coop M. (2012). On the compression behaviour of reconstituted soils. Soils Foundations 52, 668–681. doi: 10.1016/j.sandf.2012.07.008
Thevanayagam S., Shenthan T., Mohan S., Liang J. (2002). Undrained fragility of clean sands, silty sands, and sandy silts. J. Geotechnical Geoenvironmental Engineering ASCE 128, 849–859. doi: 10.1061/(ASCE)1090-0241(2002)128:10(849)
Verdugo R., Ishihara K. (1996). The steady state of sandy soils. Soils foundations 36, 81–91. doi: 10.3208/sandf.36.2_81
Wang X., Wang X., Jin Z., Meng Q., Zhu C., Wang R. (2017). Shear characteristics of calcareous gravelly soil. Bull. Eng. Geology Environ. 76, 561–573. doi: 10.1007/s10064-016-0978-z
Wei X., Yang J. (2019). A critical state constitutive model for clean and silty sand. Acta Geotechnica 14, 329–345. doi: 10.1007/s11440-018-0675-0
Wu Y., Li N., Wang X., Cui J., Chen Y., Wu Y., et al. (2021). Experimental investigation on mechanical behavior and particle crushing of calcareous sand retrieved from south China sea. Eng. Geology 280, 105932. doi: 10.1016/j.enggeo.2020.105932
Xiao Y., Xiang J., Liu H., Ma Q. (2017). Strength–dilatancy relation of sand containing non-plastic fines. Géotechnique Letter 7, 204–210. doi: 10.1680/jgele.16.00144
Xu D., Huang M., Zhou Y. (2020). One-dimensional compression behavior of calcareous sand and marine clay mixtures. Int. J. Geomechanics 20, 04020137. doi: 10.1061/(ASCE)GM.1943-5622.0001763
Yang S., Sandven R., Grande L. (2006). Steady-state lines of sand–silt mixtures. Can. Geotechnical J. 43, 1213–1219. doi: 10.1139/t06-069
Yu F. (2019). Influence of particle breakage on behavior of coral sands in triaxial tests. Int. J. Geomechanics 19, 04019131. doi: 10.1061/(ASCE)GM.1943-5622.0001524
Zheng X. (2019). The experimental study of the permeation consolidation characteristics of calcium-sandclay mixtures. Wuhan: Wuhan University of Technology.
Zuo L., Baudet B. A. (2015). Determination of the transitional fines content of sand-non plastic fines mixtures. Soils foundations 55, 213–219. doi: 10.1016/j.sandf.2014.12.017
Appendix A
The peak state friction angle (ϕP), phase transition state friction angle (ϕt), and the maximum dilatancy angle (ϕd) can be determined using Mp, Mdand as follows:
where Mp and Md represent the stress ratios at the peak and phase transition states, respectively, and corresponds to the maximum value of the ratio .
For clean calcareous sand, the root mean square deviation (RMSD) for samples with different clay contents (5%, 10%, and 25%) was calculated. By varying the parameter b from 0 to 1 in intervals of 0.05, the corresponding changes in RMSD could be determined. The optimal value of b corresponds to the minimum RMSD, which was used to determine the optimal b values for the different clay content levels in this study.
Here, T represents the total number of tests, is the void ratio of clean calcareous sand at the critical state; and is the void ratio of the specimens with varying clay contents (5%, 10%, and 25%) at the critical state.
Keywords: strength, transitional behavior, binary mixture, calcareous sand, clay
Citation: Zhao H, Gao Y, Lin F, Zheng J, Jeng D-S, Han S, Liu J and Sun Y (2025) Transitional behavior of calcareous sand with different clay contents. Front. Mar. Sci. 12:1549597. doi: 10.3389/fmars.2025.1549597
Received: 21 December 2024; Accepted: 28 February 2025;
Published: 11 April 2025.
Edited by:
Giandomenico Foti, Mediterranea University of Reggio Calabria, ItalyReviewed by:
Junliang Gao, Jiangsu University of Science and Technology, ChinaXianwei Zhang, Chinese Academy of Sciences (CAS), China
Copyright © 2025 Zhao, Gao, Lin, Zheng, Jeng, Han, Liu and Sun. This is an open-access article distributed under the terms of the Creative Commons Attribution License (CC BY). The use, distribution or reproduction in other forums is permitted, provided the original author(s) and the copyright owner(s) are credited and that the original publication in this journal is cited, in accordance with accepted academic practice. No use, distribution or reproduction is permitted which does not comply with these terms.
*Correspondence: Yifei Sun, eWlmZWkuc3VuQGhodS5lZHUuY24=