Abstract
Introduction:
Marine data is typically large-scale and complex, requiring effective visualization recommendation systems for data filtering and value extraction. The primary challenge in visualization automatic recommendation lies in the conflict between the inherent ambiguity of user intentions and the limitations of precise interaction methods. In the initial phase, users often lack well-defined analytical goals for the dataset, necessitating a cold-start and iterative interaction to clarify their goals. Moreover, although existing interaction methods are diverse, their precise control fails to effectively convey users' ambiguous intentions.
Methods:
To address these issues, we introduce a novel cold-start visualization recommendation system that integrates a Large Language Model (LLM) and a Grammar Variational Autoencoder (GVAE). The LLM generates initial exploratory goals and visualization recommendations based on data descriptions, while the GVAE produces visual summary projections to verify the extent of user intent fulfillment. Additionally, users can roll back to previous record point to establish new analytical paths. This forms a comprehensive analysis framework for observation, reasoning, and backtracking. Users can adjust their exploration goals and refine their intent expressions based on projections through the LLM, iterating until the analysis is complete. The GVAE analyzes chart correlations and latent patterns, while the LLM converts ambiguous intentions into precise representations, with both working together to address the cold-start problem.
Results and discussion:
The effectiveness of this method in cold-start visualization recommendations and semantic-driven interactions has been validated through case studies and evaluations.
1 Introduction
Ocean data is vast and highly complex, containing substantial latent valuable information. However, extracting such information is often impeded by redundant and noisy data (Speich et al., 2019). To tackle this challenge, Visualization Recommendation Systems (VRS) are widely adopted to aid in filtering information and extracting value. Nevertheless, during visualization recommendation, the massive data scale, combined with irrelevant or low-value information and users’ unclear intentions or ambiguous exploration goals, exacerbates the cold-start problem. In such cases, traditional interactive data visualization tools like Tableau and Qlik require user expertise. Thereby, users often find it challenging to clearly express their intentions, which hinders the system from recommending suitable visualizations for ocean data.
Ocean data often contains numerous complex variables, and its high-dimensional nature complicates data analysis (Moore et al., 2019). In the early stages of analysis, users often lack clear analytical goals or guidance, a challenge commonly known as the “cold start problem.” Recent research has proposed models based on Variational Autoencoders (VAE) to address this issue, leveraging clustering and projection analysis for more effective visualization. VAEs enhance users’ overall comprehension by constructing vectors and applying dimensionality reduction techniques to visually represent the distribution of recommended outcomes. However, during the exploration phase, users can only interact with VAEs using traditional precise control methods, which fail to accurately convey their specific intentions (Li et al., 2024).
Natural language is the most effective way to express human intentions (Subramonyam et al., 2023). VRS such as DEEPEYE (Luo et al., 2018) and ChartGPT (Tian et al., 2023) utilize natural language processing to interpret user instructions and translate them into visualization specifications. Although natural language interaction is convenient and intuitive, it can easily cause users to focus too much on specific details, leading to a loss of the overall perspective on analytical goals (Lawless et al., 2023).
In summary, despite notable progress in automation and user-friendliness made by recent advancements in visualization recommendation methodologies, several challenges persist:
C1: the cold-start problem. In the initial phase, unclear analytical objectives often prevent the system from gathering enough information to generate accurate visualization recommendations.
C2: user intent effectiveness. Ambiguous user intentions lead to precise interaction methods in existing systems struggling to capture implicit user requirements, potentially causing misaligned recommendations.
C3: user intent fulfillment. Users lack effective mechanisms to verify if their intent is accurately captured. Moreover, the lack of flexible feedback options hinders the system’s ability to refine recommendations to better meet user expectations.
To overcome these challenges, this paper introduces a cold-start visualization recommendation approach that integrates Large Language Models (LLM) with Grammar Variational Autoencoders (GVAE). Initially, the LLM analyzes dataset attributes to generate comprehensive data summaries and exploration goals, followed by preliminary visualization recommendations. GVAE utilizes dimensionality reduction to create visual summaries. This process effectively solves the cold-start problem (C1). The LLM interprets users’ natural language intentions to generate precise visualization recommendations, ensuring an effective transmission of user intentions (C2). Additionally, visual summaries helping users to verify the extent of intent fulfillment. Users can adjust geometric layout of visual summaries and transmit their intentions to LLM, iteratively refining recommendation outputs(C3). Even if users find that current state fails to achieve their exploration goals, they can roll back to a previous record point to restart their exploration. Our contributions are categorised as follows:
-
We propose a cold-start visualization recommendation method that combines the intention transmission capabilities of LLM with the visual summaries provided by GVAE. This iterative exploration helps users clarify their intentions and achieve optimal recommendation outputs.
-
We leverage LLM to generate data summaries, exploration goals, and visualization recommendations, as natural language helps users transmit their intentions accurately.
-
GVAE constructs visual summaries to enable users to progressively clarify ambiguous intentions, establishing an iterative exploration for visualization recommendation.
-
The effectiveness of the proposed method is validated through comprehensive case studies and evaluation experiments, demonstrating its practical utility.
2 Related work
2.1 Visualization recommendation
Automatically recommending suitable visualizations in scenarios with extensive analytical possibilities presents a significant challenge (Jankun-Kelly et al., 2007). Heuristic-based approaches generally follow a standard process: first, analyzing the dataset; then, generating a search space of potential visualizations (Wongsuphasawat et al., 2017); and finally, ranking these visualizations based on quality attributes before presenting them to the user (Moritz et al., 2019). For instance, DeepEye (Luo et al., 2018) systematically evaluates all potential visualizations and categorizes them as either “good” or “bad,” while Voyager (Wongsuphasawat et al., 2017) employs heuristic methods to explore the space of visualizations.
However, heuristic methods, being dependent on predefined rules and heuristics, often lack the necessary flexibility to adapt to varying datasets and user needs. In contrast, end-to-end learning approaches have emerged as an alternative, enabling the automatic learning of mappings directly from data to the corresponding visualizations. For example, Data2Vis (Dibia and Demiralp, 2019) uses a sequence-tosequence model to learn how to map raw JSON data, sampled from datasets, to Vega-Lite (Satyanarayan et al., 2017) specifications, effectively automating the visualization recommendation process. Similarly, ChartSeer (Zhao et al., 2022) utilizes deep learning to convert charts into semantic vectors and vice versa, thereby creating visual summaries of visualizations. Despite the advancements, current visualization recommendation methods often exhibit limitations, such as insufficient mechanisms for fine control over the generated visualizations and the absence of robust strategies for error detection and correction.
2.2 Visualization similarity
In the generation of visual summaries to represent charts, assessing the similarity of visualization results is crucial. Existing studies (Xu et al., 2018) have focused on generating visual summaries of two-dimensional charts using similarity metrics or dimensionality reduction methods, such as Multidimensional Scaling (MDS) (Douglas Carroll and Arabie, 1998) and t-SNE (van der Maaten and Hinton, 2008).
Another approach to measuring visualization similarity involves evaluating the operational or transformation costs between visualizations. For example, Hullman et al (Zhang et al., 2024). proposed an objective function to minimize the transformation cost for displaying a sequence of charts. GraphScape (Kim et al., 2017) introduced a generative model to infer the similarity and sequence of visualizations. Chart Constellation (Xu et al., 2018) represented user-generated charts in a 2D space based on the similarity of four elements. ChartSeer (Zhao et al., 2022) employed deep learning techniques to map charts into semantic vectors, thereby measuring chart similarity and generating visualizations. Inspired by ChartSeer, this study utilizes GVAE to assess chart similarity and generate visualizations.
2.3 Large language models for data analysis
Large Language Models (LLMs) have achieved remarkable progress in recent years, with prominent examples such as Codex (Chen et al., 2021), GPT-3 (Brown, 2020), and GPT-4 (Cheng et al., 2023), as well as open-source models like Flan-T5 (Chung et al., 2024), LLaMa (Touvron et al., 2023a), and LLaMa2 (Touvron et al., 2023b). LLMs have seen widespread applications across various domains, including code generation (Chen et al., 2021), story generation (Chung et al., 2022) (He et al., 2024), and web design (Kim et al., 2022).
Several studies have focused on leveraging LLMs to generate visualization code. For instance, CHAT2VIS (Maddigan and Susnjak, 2023) generates Python visualization code by providing LLMs with table schemas, column types, and natural language queries. LIDA (Dibia, 2023) conceptualizes visualization generation as a four-phase process to systematically generate visualization code.
Moreover, research has also explored the application of LLMs in data analysis. GPT4-Analyst (Maddigan and Susnjak, 2023) utilizes prompts to guide GPT-4 in performing tasks such as data collection, visualization, and analysis. Data-Copilot (Zhang et al., 2024) can execute appropriate interface tools either sequentially or in parallel, enabling zero-code analysis for the user. However, these models exhibit limitations in controllability and stability (Achiam et al., 2023), and their intrinsic hallucination issue occasionally results in unstable outputs and incorrect responses (Singh et al., 2024).
3 System overview
This section outlines the design principles of our system, followed by a high-level overview of our approach. Detailed technical information is provided in Section 4.
3.1 Design considerations
The primary objective of this system is to facilitate cold-start visualization recommendations using large language models and to employ a Grammar Variational Autoencoder (GVAE) to project recommended results into two-dimensional visual summaries, thereby guiding users through iterative analysis. The system design incorporates principles from data analysis, visualization recommendation, and automatic recommendation systems, leading to the following key design points:
D1: support for fuzzy search in user intent expression. The system can interpret and handle ambiguous queries in natural language input, using large language models to parse user intent and provide accurate visualization chart recommendations.
D2: provision of visual summaries to mitigate the cold-start challenge. The system generates visual summaries to assist users in understanding the visualization charts produced by the large language model, thereby clarifying the scope of recommendations and effectively addressing the cold-start challenge.
D3: iterative recommendations based on semantic interaction. The system captures users’ natural language interactions and view manipulations, iteratively refining recommendations to deliver visualizations that more precisely align with user needs.
D4: support for the roll back option. The system provides users with a roll back option, enabling them to return to a previous state and explore new analytical paths.
3.2 System design
The system is structured around three core modules: LLM-powered visualization generation, GVAEenabled dimensionality reduction, and semantically-driven interactive exploration, as depicted in Figure 1. The visualization generation module uses LLM to overcome cold-start challenges by generating initial exploration goals from data summaries, interpreting users’ natural language inputs, and recommending relevant visualizations (D1).
Figure 1

Schematic of the overall architecture. Our method consists of three key components: LLM-driven visualization generation, VAE-based dimensionality reduction, and semantic-driven exploration. This figure illustrates how these components integrate to address the cold-start problem and facilitate iterative user interaction.
The dimensionality reduction module utilizes GVAE to project recommended visualizations into a lowerdimensional space, creating visual summaries that enable users to effectively view chart distributions within a two-dimensional interface (D2), thus mitigating cold-start issues. The semantically-driven interaction module captures user interactions and interprets natural language intents, providing personalized iterative recommendations (D3). The system also includes a roll back feature, allowing users to return to a previous state if the current one does not meet their exploration goals, enabling them to restart their exploration (D4).
4 A cold-start visualization recommendation and iterative exploration method
This section offers a detailed explanation of the technical aspects of the system architecture, focusing on key components like LLM-powered visualization recommendation, GVAE-based dimensionality reduction, and the integration of semantically-driven interactive exploration.
4.1 LLM-driven visualization generation
This section explores the application of LLM in visualization generation, analyzing how LLM constructs data summaries from datasets and establishes initial exploration goals to support visualization recommendations. Drawing inspiration from LIDA (Dibia, 2023), this paper introduces three key modules for generating visualization recommendations: data summary generation, exploration goal formulation, and visualization creation (Zhou et al., 2022).
4.1.1 Generation of dataset summaries
Even without prior visualization examples, the LLM can generate various types of charts. However, the absence of contextual information may result in visualizations that seem reasonable initially but fail to effectively convey the intended insights. To address this issue, this paper adopts the LIDA approach (Dibia, 2023), which involves providing contextual information, establishing strict constraints, and incorporating post-processing mechanisms to refine visual outputs. Specifically, data analysis tools are used to extract key attributes from the dataset, which are then systematically organized into a structured summary, including the dataset name, size, and column descriptions. This summary is subsequently transformed into descriptive text, serving as input prompts for the LLM to ensure the accuracy and relevance of the generated content.
4.1.2 Generation of visualization goals
Utilizing the generated dataset summary, the LLM identifies potential avenues for data exploration and formulates corresponding exploration goals. For example, the model might determine that “The average temperature in North America has shown a year-on-year increase over the past decade.” Subsequently, for each identified goal, the model generates potential visualization implementation plans, supported by logical justifications. For instance, “A time series chart is recommended to depict the annual trend in temperature changes, clearly illustrating the temporal relationship with temperature.” This approach ensures that the exploration goals are grounded in scientific rigor and logical coherence.
4.1.3 Generation of visualization charts
After formulating exploration goals, the next step is generating the actual visualizations. This paper uses Vega-Lite for rendering charts, with the LLM guided by Vega-Lite code specifications. The process is further refined through a series of post-processing steps to ensure the validity and quality of the visualizations. The workflow begins by providing the LLM with standardized Vega-Lite templates. Based on the dataset summary and formulated exploration goals, the LLM generates multiple Vega-Lite codes, each accompanied by an explanatory rationale for the corresponding visualization. These Vega-Lite codes undergo thorough post-processing and validation, ultimately resulting in verified Vega-Lite specifications that align with the users’ analytical needs. This approach ensures that the generated visualizations are both effective and meet the users’ requirements. To mitigate biases and hallucinations commonly associated with LLMs, the system implements rigorous post-processing validation to ensure that generated visualizations are grounded in the dataset and free from errors or misleading outputs.
4.2 GVAE-based visual summary generation
This paper uses GVAE for dimensionality reduction and projection on charts generated by LLM, constructing a visual summary that effectively presents recommended visualizations and addresses coldstart challenges. GVAE is employed to learn and generate graph-structured data, enabling the clustering of charts and the automation of data visualization through chart embedding and generation. During the encoding phase, GVAE processes the design attributes of the charts, while the LLM supplements the data attributes. The final visualizations are rendered using Vega-Lite, a widely adopted visualization language, ensuring that the generated charts are both accurate and contextually relevant.
4.2.1 Chart embedding representations
In the encoder component of this study, the GVAE architecture leverages Convolutional Neural Networks (CNN) and Recurrent Neural Networks (RNN) to process the structural elements of Vega-Lite charts, embedding these components into a latent space. As illustrated in Figure 2, Vega-Lite rules are transformed into a parse tree, represented as one-hot vectors, and fed into the RNN model. The encoder maps the high-dimensional chart structures into lower-dimensional latent vectors, capturing the similarities and differences between various charts.
Figure 2
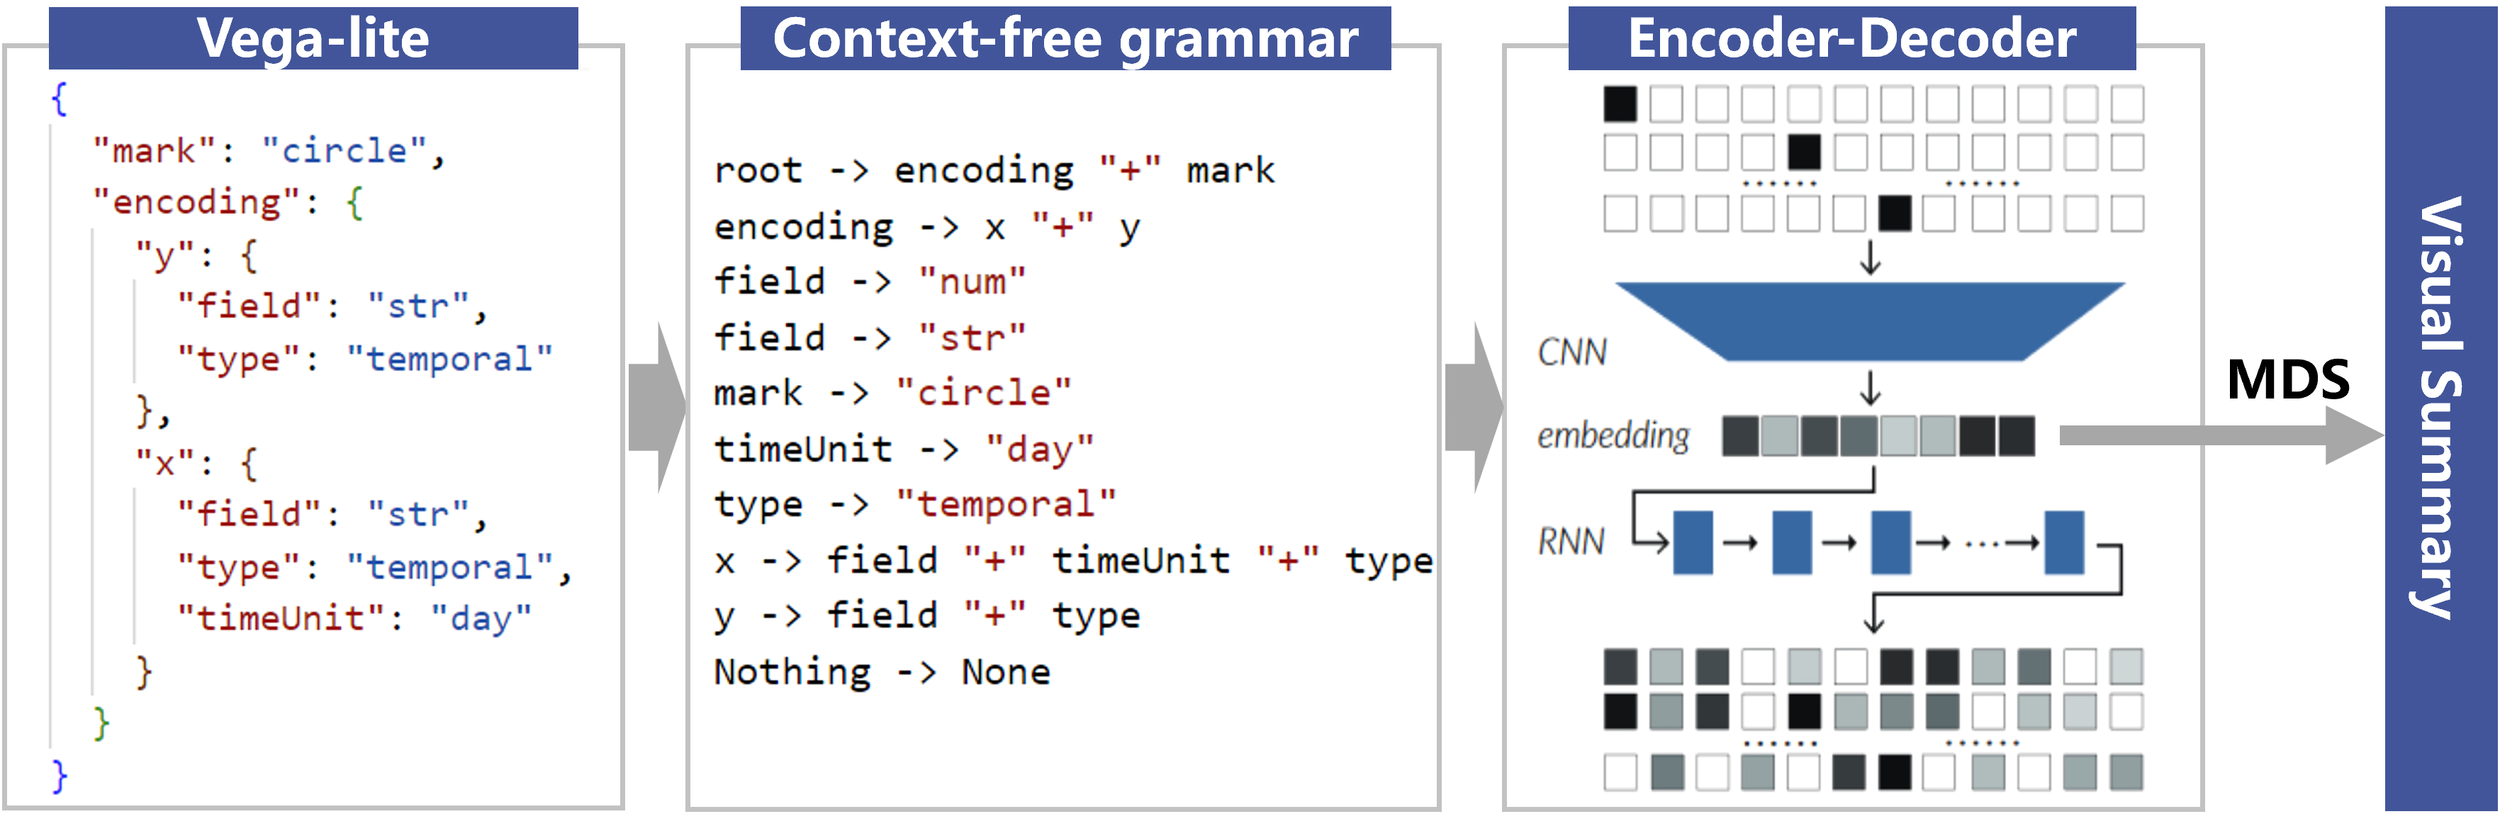
Visualization chart dimensionality reduction based on GVAE. This figure illustrates the process of using Grammar Variational Autoencoder (GVAE) to project high-dimensional visualization charts into a two-dimensional space, enabling clustering and visual summarization.
In the decoder component, the latent vectors are decoded into rule vectors and then reconstituted into specific Vega-Lite chart representations. Additionally, new charts can be generated to meet particular analytical needs. By minimizing reconstruction loss, the GVAE model ensures that the generated charts maintain strong semantic and structural alignment with the original charts, thereby preserving the integrity of the visual representation.
4.2.2 Chart clustering
Chart clustering is conducted by measuring similarity within the latent space, where the similarity between charts is quantified by calculating the Euclidean distances between their embedding vectors. Charts with similar designs are positioned close to each other in this latent space, forming visual summary clusters, as illustrated in Figure 2. These clustering results effectively facilitate user-driven exploration by recommending charts that are either similar to or contextually related to the current visualization. This study builds on the frameworks of ChartSeer and GVAE, training a GVAE model to learn both the encoding and decoding processes for charts. The model is further trained on an expanded version of the ChartSeer dataset, enhancing its generalization capabilities and enabling it to generate diverse visualization recommendations, even under cold-start conditions.
In the projection and layout phase, this paper employs a 20-dimensional Multidimensional Scaling (MDS) technique to construct a visual summary of the charts. Drawing from the methodologies of ChartSeer (Zhao et al., 2022) and GotreeScape (Li and Yuan, 2023), MDS projection is used to preserve local features by weighting the Euclidean distances between embedding vectors, thereby reflecting the influence of design attributes on these distances. As a result, charts with similar design attributes cluster more closely together, while those with differing attributes are positioned further apart, achieving a clear clustering effect. Finally, this paper presents a visual summary designed for visualization recommendation projection, as depicted in Figure 2. This summary not only effectively clusters and displays the recommended charts but also supports user interactions within the visual summary interface.
4.3 Semantic-driven interactive exploration
After generating visualizations with LLM and obtaining cold-start recommendations through GVAE projection, the next step is to combine LLM and GVAE to enable semantic-driven interactions through natural language and graphical interfaces, completing the visualization recommendation process. Further analysis relies on semantic-driven interactive exploration, where users can iteratively refine their actions based on system recommendations, achieving incremental visualization exploration (Singh et al., 2024). The system integrates user interactions, semantics, and chart positions to deliver more precise visualization recommendations.
Throughout the visualization generation process, the system remains focused on the users’ analytical goals. During iterations, the system ensures that users can clearly refine their intentions at each step, guiding the recommendation generation. By integrating user intent with 2D distance factors, the system provides more accurate visualization recommendations, enabling users to backtrack and adjust exploration goals during the analysis.
4.3.1 Initial visualization generation
The initial generation of visualizations is a critical phase in addressing the cold-start problem. Upon receiving a dataset uploaded by the user (Figure 3A), the system first leverages the LLM, as discussed in Section 4.1, to generate preliminary visualization exploration goals (Figure 3D). Following this, the system creates visual charts aligned with these goals and maps them into a two-dimensional space using GVAE, thereby completing the initial cold-start visualization recommendations (Figure 3E). This approach allows users to intuitively and simultaneously view multiple exploration goals alongside their corresponding charts, enabling them to quickly comprehend the key aspects and data distributions across various exploration directions. Users can refine the exploration goals proposed by the LLM according to their needs, such as by modifying keywords, sharpening analytical focus, or altering the scope of the exploration goals (Figure 3D). The system then regenerates the corresponding visualizations based on this user feedback.
Figure 3

The user interface consists of (A) data upload and function buttons, (B) the data table view, (C) the data table filtering view, (D) the exploration goals panel, (E) the visual summary panel, (F) the chart inspection panel, and (G) the backtracking panel. This figure showcases the system’s interactive design, enabling users to explore, refine, and backtrack during data analysis.
4.3.2 Visualization recommendation based on spatial distance and user semantics
After completing the projection of visualizations and constructing the two-dimensional view, users can guide the system in chart recommendations by interacting through clicks and specifying their intent. The system then uses GVAE and LLM to generate the final recommended visualizations, as depicted in Figure 3E. The process unfolds as follows:
-
Interaction Capture: When a user clicks within the two-dimensional view, a coordinate is generated. After constructing the two-dimensional projection, the system calculates the vector distance from the user’s click location and selects a random set of samples within a radius r in the projection space as candidates for the attributes of the newly generated visual charts.
-
Sample Selection and Distance Calculation: As shown in Figure 4A, each selected sample’s two-dimensional position is converted into a high-dimensional vector interpretable by the chart decoder. The weighted distance Dwis calculated as follows:
Figure 4
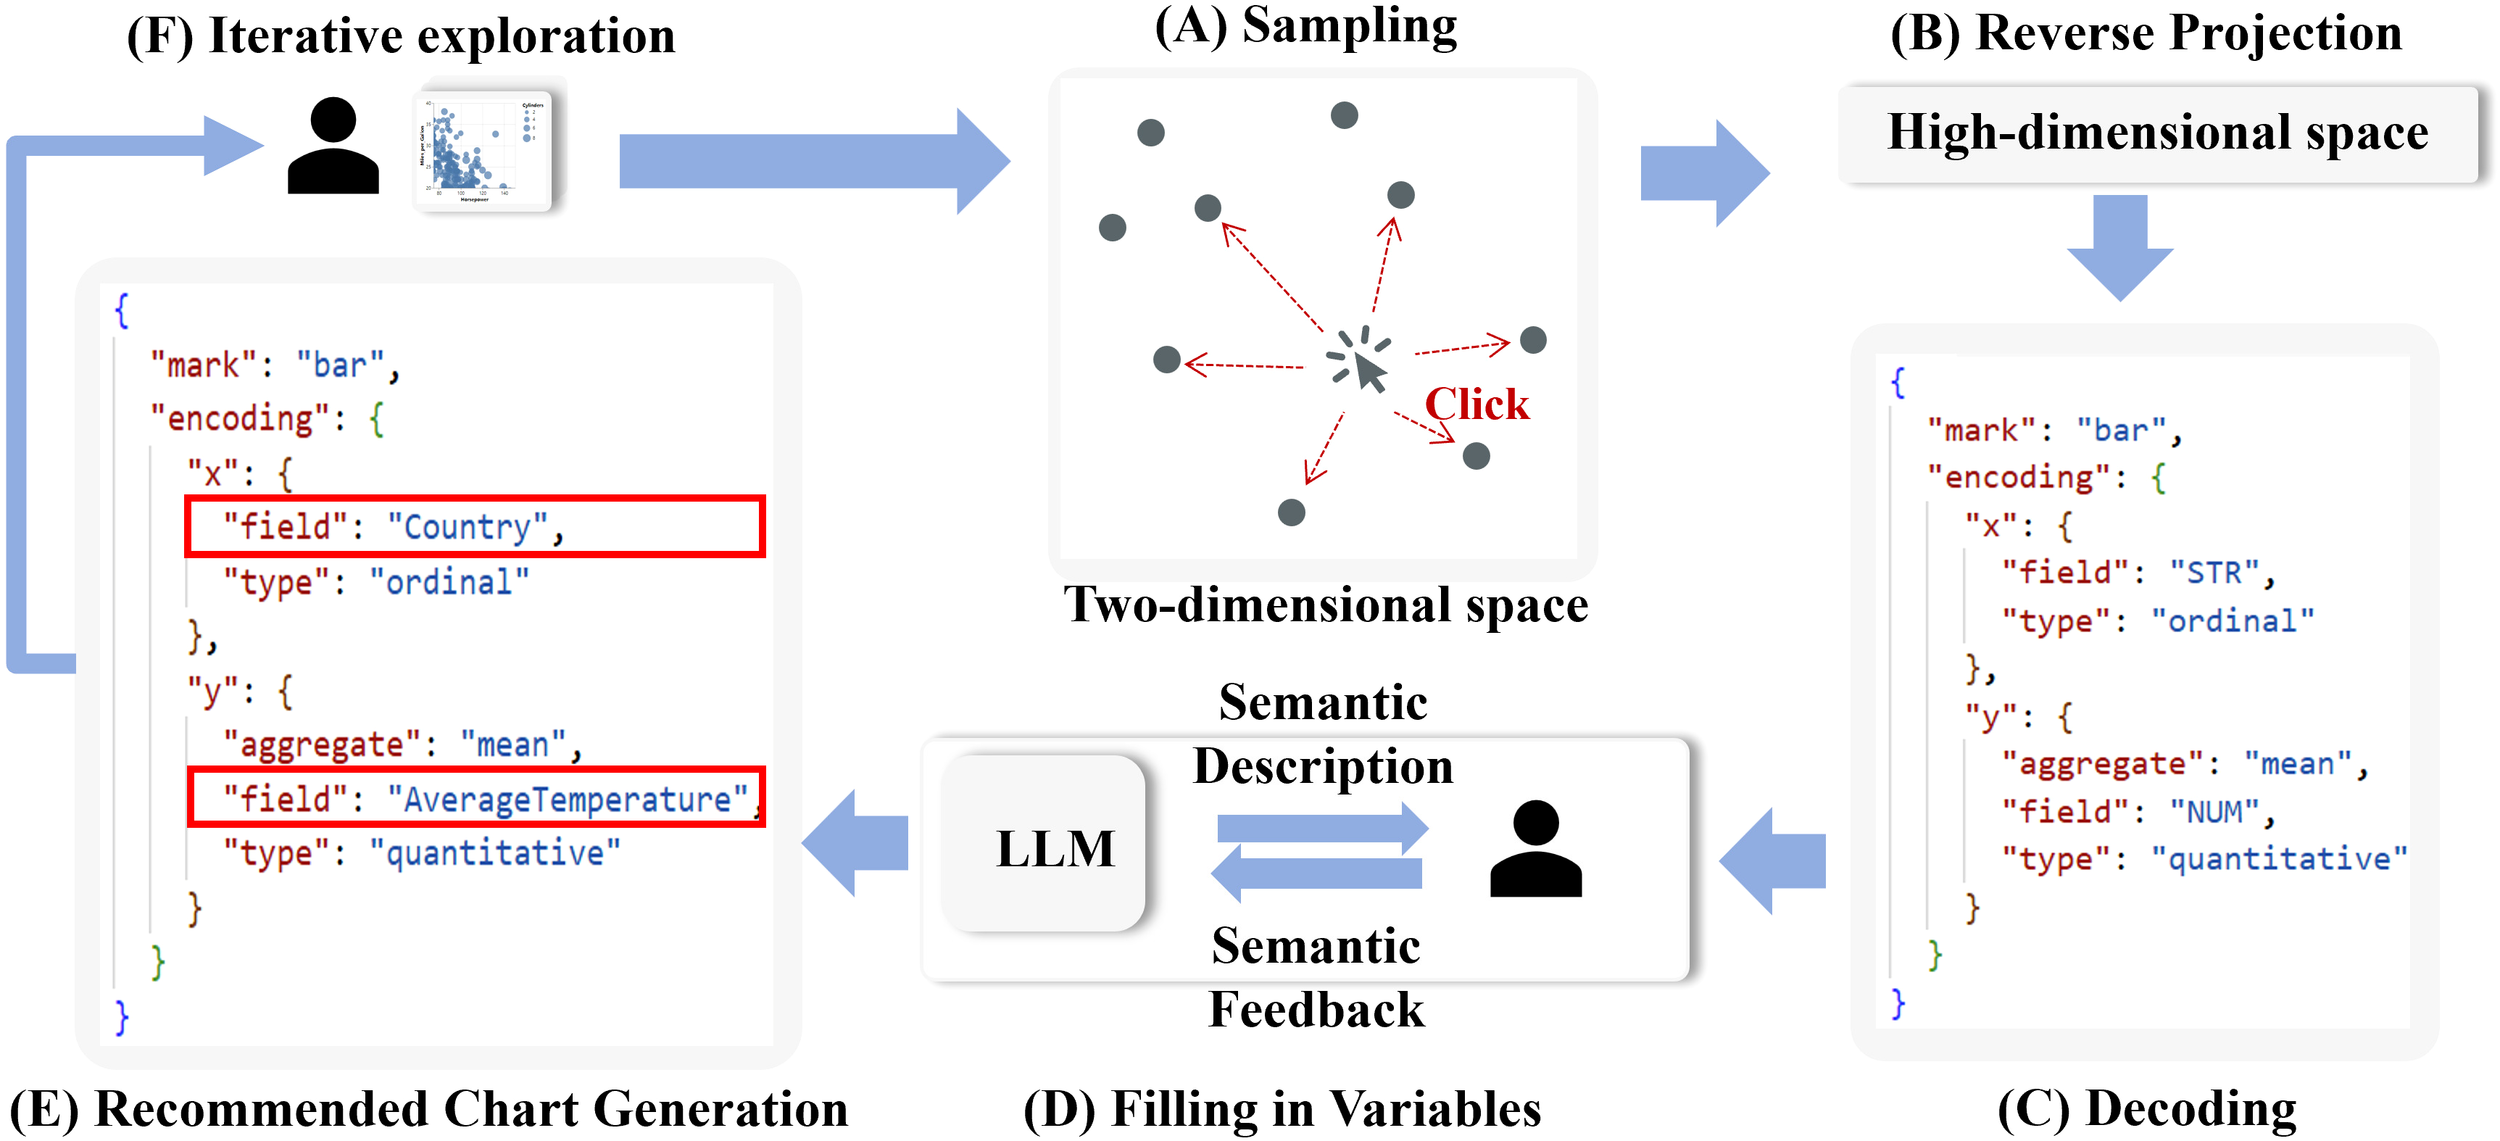
The flowchart of distance-based and user-semantics-driven visualization recommendation. This figure demonstrates the process of generating visualizations by combining spatial distance calculations with user semantics, highlighting the role of GVAE and LLM in recommendation refinement. The components of the flowchart are as follows: (A) Sampling, (B) Reverse Projection, (C) Decoding, (D) Filling in Variables, (E) Recommended Chart Generation, (F) Iterative Exploration.
-
sl and sh represent the two-dimensional projection point of the chart and its corresponding high-dimensional vector. The objective function in Equation 1 quantifies the discrepancies between the high-dimensional and low-dimensional distances of the sample relative to all other m existing charts, with the only unknown variable sh. However, the low-dimensional distance in Equation 1 cannot be directly applied, as it is crucial to ensure that the distance excludes any data variable information. Consequently, the Jaccard distance term must be omitted, as shown in Equation 2.
-
High-Dimensional Vector Calculation: As illustrated in Figures 4B, C, after the highdimensional vector is calculated, it is input into the trained GVAE chart decoder, which maps the vector back to a Vega-Lite format chart.
-
Data Variable Completion: For each generated Vega-Lite chart with common tokens, as depicted in Figures 4D, E, the system employs LLM to populate the actual data variables. The LLM parses the chart specifications, identifies placeholders (e.g., NUM and STR), and replaces them with real data variables.
-
Recommended Chart Generation and Validation: The system verifies the validity of the generated Vega-Lite specifications and then returns a predefined number of recommended charts.
This approach effectively integrates spatial distance with natural language interaction data to enhance cold-start visualization recommendations.
4.3.3 Distance-based visualization recommendation
In the click-based recommendation process, users can generate visualizations by simply interacting with specific regions within the two-dimensional projection view, without the need for natural language input. This approach is similar to the method described in Section 4.3.2, with the key difference being that, instead of using an LLM to complete the data attributes for the chart with common tokens, the K-nearest neighbors (KNN) method recommended by ChartSeer is employed to supplement these attributes. After capturing user interactions, sample selection, and distance calculation, the system utilizes the KNN method to extract relevant data variables from adjacent charts. These variables replace the generic placeholders (e.g., NUM and STR) in the Vega-Lite specification, thereby ensuring that the resulting visualizations are both data-driven and contextually meaningful. If adjacent charts do not provide sufficient data, the system will select new, unexplored variables from the dataset, ensuring the diversity and comprehensiveness of the visualizations.
4.3.4 Chart inspection and backtracking
The system allows data analysts to edit the charts it recommends. Upon selecting a chart, the inspection panel displays the chart’s visualization, explanation, and corresponding Vega-Lite code. Analysts can modify the chart using natural language commands or by directly editing the Vega-Lite code, preview the changes, and then choose to update the existing chart or add it as a new one.
During analysis, analysts can check at any time if the recommended charts meet their exploration goals. If they do not, the backtracking feature allows them to review and adjust their goals. After backtracking, the visual summary panel displays historical summaries based on the results.
5 Case study: cold-start visualization recommendation
In this section, we assess the practical utility of the system through a case study. We enlisted an expert user, Z, who has over five years of experience in data analysis, to participate in the evaluation. After introducing Z to the system interface and basic operations, we provided a ocean dataset consisting of 4068 records and 7 attributes (including dt, AverageTemperature, AverageTemperatureUncertainty, City, Country, Latitude, Longitude). Z was then tasked with performing a visualization analysis on this dataset.
At the beginning of the analysis, User Z lacked clear goals but required high accuracy in the results, which led to continuous optimization during the process. Upon uploading the data, the system automatically recognized and presented the dataset, offering filtering options (Figures 3A, B) that allowed Z to gain an initial understanding of the data attributes through a summary view. The system then guided Z from an exploratory, goal-free phase to a more focused, goal-oriented analysis by suggesting visualization goals (Figure 3D), producing initial charts that helped Z quickly grasp data relationships via two-dimensional projections.
During the early exploration phase, Z began to develop a tentative direction and identified a new analysis goal: exploring the variations in temperature over time and geographical distribution, which was not addressed by the existing recommended charts. The system leveraged a natural language processing model (LLM) to interpret this requirement, generating highly relevant line and bar charts.
After establishing a clearer analytical direction, Z became interested in the temperature uncertainty analysis and engaged with the system through clicks and natural language (Figure 3E). The system, in turn, generated appropriate visualizations to cater to Z’s evolving needs. This dynamic adaptability contrasts with traditional static recommendation systems. Ultimately, Z fine-tuned the generated charts (Figure 3F) and further optimized them using natural language commands.
During the analysis, Z recognized the significance of a previously discarded goal. Using the system’s roll back feature, Z returned to an earlier state and continued the analysis, avoiding the need to start over (Figure 3G). This feature, by recording and replaying earlier exploration steps, allows users to flexibly adjust their strategies, ensuring that critical analytical insights are thoroughly explored and utilized.
Z remarked, “The system’s suggested exploration goals were incredibly helpful when I was short on ideas. As my analysis direction became clearer, the system-generated charts matched my needs perfectly, significantly enhancing my efficiency. The system’s ability to adapt to changing requirements without manual adjustments is extremely practical.”
Compared to previous visualization systems like ChartSeer, the framework proposed in this paper is more responsive to evolving user intentions, offering a broader range of insightful and diverse marine domain charts. Figure 5 presents a comparison between the visualizations generated by this system and those from ChartSeer, demonstrating that our system significantly outperforms in terms of visualization recommendation based on spatial distance. It surpasses the limitations of the typical six chart types, covering a wider data range and providing deeper design insights. In contrast, ChartSeer (Zhao et al., 2022), which lacks user intent guidance, produces a limited variety of charts with insufficient design insights, thereby increasing the risk of errors, such as heavy overlap of chart elements (Figure 5A) and the generation of meaningless visualizations (Figure 5B).
Figure 5
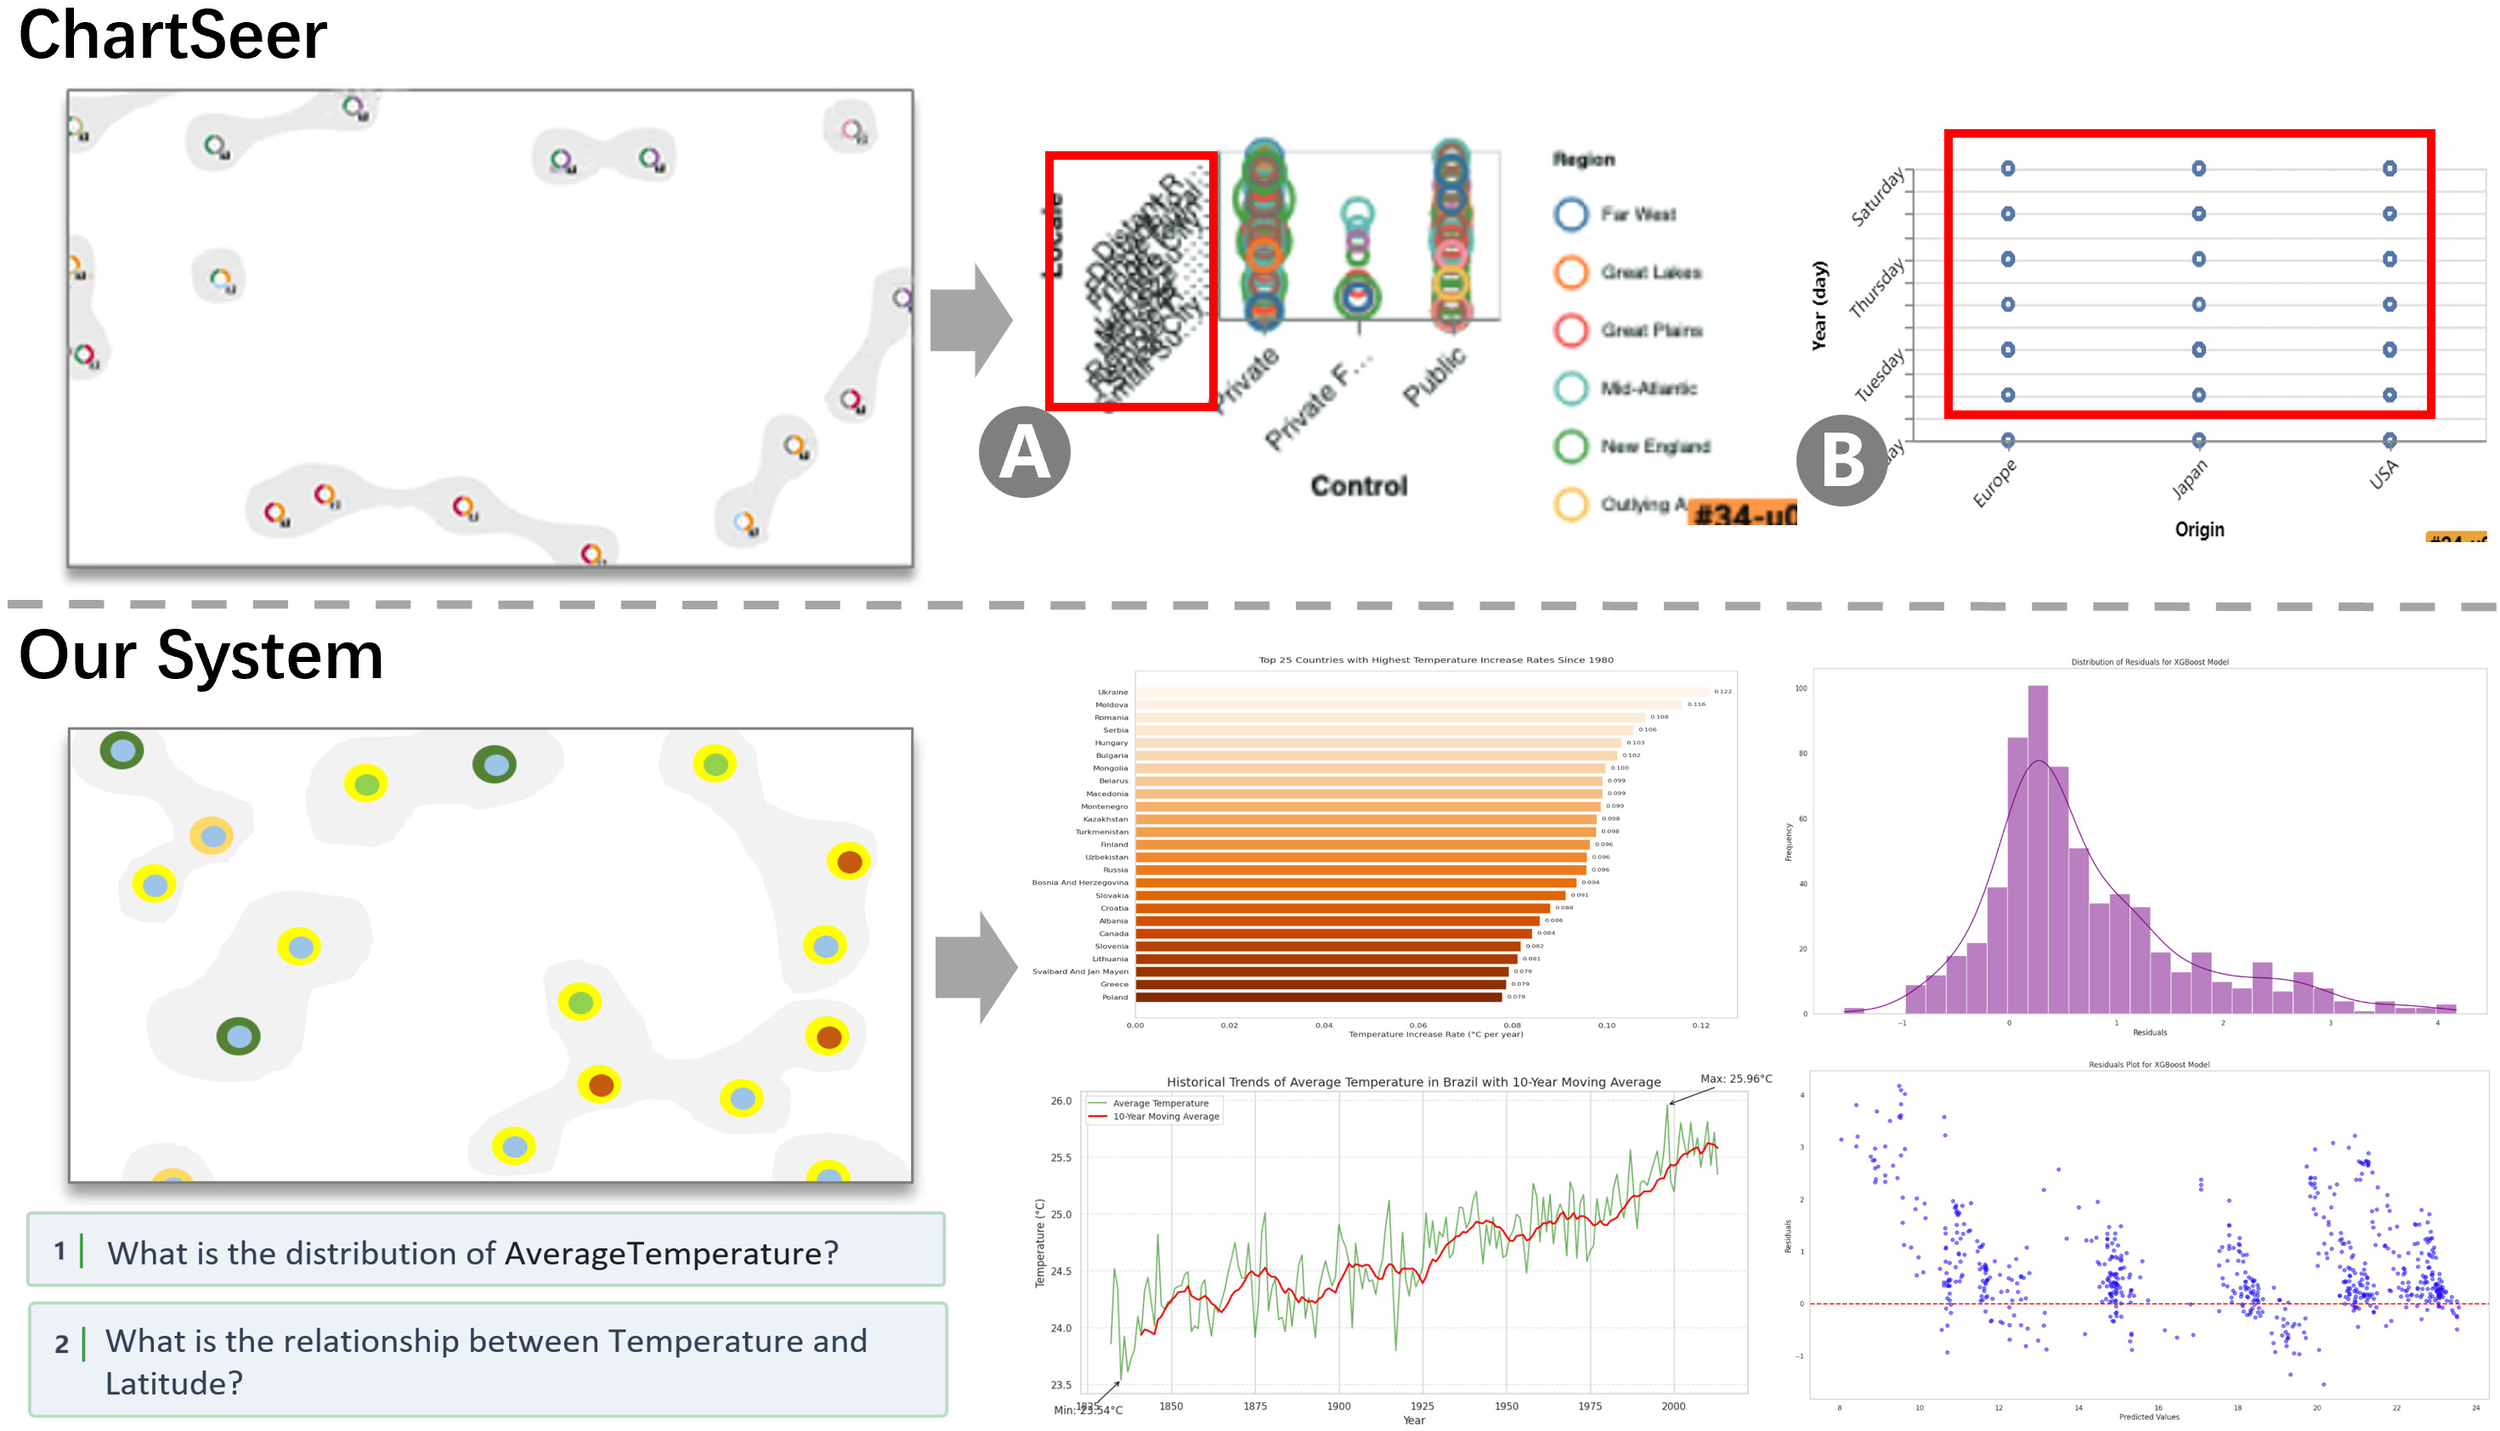
A comparison between the previous visualization system and the proposed system, which incorporates user semantics, demonstrates that the latter addresses several shortcomings of the former. These include (A) significant overlap of chart elements and (B) the generation of meaningless visualizations.
In terms of scalability, although the case study employed a dataset containing 4,068 records and 7 attributes, the system architecture is designed to accommodate larger and more complex datasets. The LLM component can efficiently process large-scale data summaries. Additionally, the GVAE’s dimensionality reduction scales effectively with increased data dimensions, utilizing efficient clustering and projection techniques like Multidimensional Scaling (MDS). However, extremely large datasets may pose challenges, including increased computational costs and potential delays in real-time interactions. Future research could explore optimizations such as distributed computing or precomputed embeddings to further enhance scalability.
To ensure practical applicability, the system’s user interface (Figure 3) was designed for optimal usability. Its effectiveness was informally validated in a case study with expert user Z, who found the interface intuitive and efficient. Although formal usability testing with a diverse user base is pending, the system is designed to accommodate users with varying levels of expertise. For instance, novice users can rely on LLM-generated exploration goals and visual summaries for guidance, whereas expert users, such as Z, can utilize advanced features like natural language refinements and chart editing to achieve precise analytical outcomes. Future research will involve formal usability studies to validate and refine the interface for broader user groups.
6 Evaluation
This paper evaluates a cold-start visualization recommendation system using two key metrics: availability and diversity of visualization types. To simulate real-world usage scenarios, multiple users conducted 20 recommendation tests on both the ChartSeer system and the system proposed in this study.
6.1 Availability
Availability assesses the proportion of usable visualizations generated during the recommendation process. For a visualization to be considered usable, it must be reasonable and meaningful regarding data attribute selection and display effects. This metric evaluates the reliability of the system-generated code and its overall performance. The calculation formula is as shown in Equation 3:
where E represents the number of error-free and meaningful visualizations generated, and T represents the total number of visualizations generated. The results of 20 experiments are shown in Table 1 ChartSeer, due to its use of the KNN method for filling in data attributes, is prone to anomalies. In contrast, the system proposed in this paper utilizes LLM for data attribute completion, resulting in fewer errors and more meaningful visualizations.
Table 1
| System | Availability | Diversity |
|---|---|---|
| ChartSeer | 23 | 6 |
| Ours | 47 | 9 |
Evaluation result.
6.2 Diversity
During the recommendation tests, we counted the total number of different types of visualizations generated by the two systems to evaluate the diversity of the recommendations. The results in Table 1 show that the generation methods using LLM and GVAE proposed in this paper can produce a wider variety of visualizations, demonstrating greater diversity in recommendations.
Enhancements in availability and diversity have substantial real-world implications for user experience. Higher availability scores reduce the occurrence of erroneous or meaningless visualizations, thereby minimizing user frustration and enhancing trust in the system, especially during the critical cold-start phase. Enhanced diversity ensures a broader range of visualization options, facilitating comprehensive data exploration and accommodating diverse analytical needs, particularly for users with undefined initial goals.
7 Conclusion
This paper introduces a framework for visualization recommendation and exploration in cold-start scenarios, integrating LLM with GVAE. This framework is designed to tackle the challenges of understanding and conveying user intent during cold-starts. The LLM generates exploration goals and recommendations, while the GVAE handles dimensionality reduction to create a two-dimensional interactive interface, enabling users to analyze data more efficiently. Case studies and evaluations demonstrate that this approach significantly improves the accuracy of recommendations and their alignment with user intent in cold-start situations, while also enhancing the interactivity and flexibility of data analysis.
Statements
Data availability statement
Publicly available datasets were analyzed in this study. This data can be found here: https://www.kaggle.com/code/gallo33henrique/foresct-temperature-ocean-arima-sarima.
Author contributions
XL: Conceptualization, Data curation, Investigation, Methodology, Writing – original draft, Writing – review & editing. JL: Conceptualization, Investigation, Methodology, Writing – original draft, Writing – review & editing. WL: Investigation, Methodology, Writing – original draft, Writing – review & editing. YM: Software, Writing – review & editing. LW: Project administration, Visualization, Writing – review & editing. SS: Validation, Writing – review & editing.
Funding
The author(s) declare that financial support was received for the research and/or publication of this article. This work was supported in part by the National Key Research and Development Project of China under Grant 2021YFA1000103; in part by the Natural Science Foundation of Shandong Province of China under Grant ZR2024MF048; and in part by the Key Laboratory of Marine Hazard Forecasting, Ministry of Natural Resources, under Grant LOMF2202.
Conflict of interest
The authors declare that the research was conducted in the absence of any commercial or financial relationships that could be construed as a potential conflict of interest.
Generative AI statement
The author(s) declare that no Generative AI was used in the creation of this manuscript.
Publisher’s note
All claims expressed in this article are solely those of the authors and do not necessarily represent those of their affiliated organizations, or those of the publisher, the editors and the reviewers. Any product that may be evaluated in this article, or claim that may be made by its manufacturer, is not guaranteed or endorsed by the publisher.
References
1
Achiam J. Adler S. Agarwal S. Ahmad L. Akkaya I. Aleman F. L. et al . (2023). Gpt-4 technical report. arXiv preprint arXiv:2303.08774. arXiv preprint.
2
Brown T. B. (2020). Language models are few-shot learners. Advances in neural information processing systems. 33, 1877–1901.
3
Chen M. Tworek J. Jun H. Yuan Q. Pinto H. P. D. O. Kaplan J. et al . (2021). Evaluating large language models trained on code. arXiv preprint. arXiv:2107.03374.
4
Cheng L. Li X. Bing L. (2023). Is GPT-4 a good data analyst? arXiv preprintarXiv:2305.15038. doi: 10.18653/v1/2023.findings-emnlp
5
Chung H. W. Hou L. Longpre S. Zoph B. Tay Y. Fedus W. et al . (2024). Scaling instruction-finetuned language models. J. Mach. Learn. Res.25, 1–53.
6
Chung J. J. Y. Kim W. Yoo K. M. Lee H. Adar E. Chang M. (2022). “TaleBrush: Sketching Stories with Generative Pretrained Language Models,” in CHI Conference on Human Factors in Computing Systems (ACM, New Orleans LA USA), 1–19. doi: 10.1145/3491102.3501819
7
Dibia V. (2023). ). LIDA: A Tool for automatic generation of grammar-agnostic visualizations and infographics using large language models. arXiv preprintarXiv:2303.02927.
8
Dibia V. Demiralp (2019). Data2vis: Automatic generation of data visualizations using sequenceto-sequence recurrent neural networks. IEEE Comput. Graphics Appl.39, 33–46. doi: 10.1109/MCG.2019.2924636
9
Douglas Carroll J. Arabie P. (1998). “Chapter 3 - multidimensional scaling,” in Measurement, Judgment and Decision Making. Ed. BirnbaumM. H. (Academic Press, San Diego), 179–250. Handbook of Perception and Cognition (Second Edition). doi: 10.1016/B978-012099975-0.50005-1
10
He Y. Cao S. Shi Y. Chen Q. Xu K. Cao N. (2024). Leveraging large models for crafting narrative visualization: a survey. arXiv preprintarXiv:2401.14010.
11
Jankun-Kelly T. Ma K.-l. Gertz M. (2007). A model and framework for visualization exploration. IEEE Trans. Visualization Comput. Graphics13, 357–369. doi: 10.1109/TVCG.2007.28
12
Kim T. S. Choi D. Choi Y. Kim J. (2022). “Stylette: Styling the Web with Natural Language,” in CHI Conference on Human Factors in Computing Systems (ACM, New Orleans LA USA), 1–17. doi: 10.1145/3491102.3501931
13
Kim Y. Wongsuphasawat K. Hullman J. Heer J. (2017). “GraphScape: A Model for Automated Reasoning about Visualization Similarity and Sequencing,” in Proceedings of the 2017 CHI Conference on Human Factors in Computing Systems (ACM, Denver Colorado USA), 2628–2638. doi: 10.1145/3025453.3025866
14
Lawless C. Schoeffer J. Le L. Rowan K. Sen S. Hill C. S. et al . (2023). i want it that way”: Enabling interactive decision support using large language models and constraint programming. ACM Transact. Interact. Intellig. Syst. 14 (3), 1–33.
15
Li G. Yuan X. (2023). Gotreescape: Navigate and explore the tree visualization design space. IEEE Trans. Visualization Comput. Graphics29, 5451–5467. doi: 10.1109/TVCG.2022
16
Li H. Wang Y. Qu H. (2024). Where are we so far? understanding data storytelling tools from the perspective of human-ai collaboration (New York, NY, USA: Association for Computing Machinery). doi: 10.1145/3613904.3642726
17
Luo Y. Qin X. Tang N. Li G. Wang X. (2018). “DeepEye: Creating Good Data Visualizations by Keyword Search,” in Proceedings of the 2018 International Conference on Management of Data (ACM, Houston TX USA), 1733–1736. doi: 10.1145/3183713.3193545
18
Maddigan P. Susnjak T. (2023). Chat2VIS: generating data visualizations via natural language using chatGPT, codex and GPT-3 large language models. IEEE Access11, 45181–45193. doi: 10.1109/ACCESS.2023.3274199
19
Moore A. M. Martin M. J. Akella S. Arango H. G. Balmaseda M. Bertino L. et al . (2019). Synthesis of ocean observations using data assimilation for operational, real-time and reanalysis systems: A more complete picture of the state of the ocean. Front. Marine Sci.6. doi: 10.3389/fmars.2019.00090
20
Moritz D. Wang C. Nelson G. L. Lin H. Smith A. M. Howe B. et al . (2019). Formalizing visualization design knowledge as constraints: Actionable and extensible models in draco. IEEE Trans. Visualization Comput. Graphics25, 438–448. doi: 10.1109/TVCG.2018.2865240
21
Satyanarayan A. Moritz D. Wongsuphasawat K. Heer J. (2017). Vega-lite: A grammar of interactive graphics. IEEE Trans. Visualization Comput. Graphics23, 341–350. doi: 10.1109/TVCG.2016.2599030
22
Singh C. Inala J. P. Galley M. Caruana R. Gao J. (2024). Rethinking interpretability in the era of large language models. arXiv preprintarXiv:2402.01761.
23
Speich S. Lee T. Muller-Karger F. Lorenzoni L. Pascual A. Jin D. et al . (2019). Editorial: Oceanobs’19: An ocean of opportunity. Front. Marine Sci.6. doi: 10.3389/fmars.2019.00570
24
Subramonyam H. Pondoc C. L. Seifert C. Agrawala M. Pea R. (2023). Bridging the gulf of envisioning: Cognitive design challenges in llm interfaces. arXiv preprintarXiv:2309.14459.
25
Tian Y. Cui W. Deng D. Yi X. Yang Y. Zhang H. et al . (2023). ChartGPT: leveraging LLMs to generate charts from abstract natural language. IEEE Transactions on Visualization and Computer Graphics.
26
Touvron H. Lavril T. Izacard G. Martinet X. Lachaux M.-A. Lacroix T. et al . (2023a). LLaMA: open and efficient foundation language models. arXiv preprintarXiv:2302.13971.
27
Touvron H. Martin L. Stone K. Albert P. Almahairi A. Babaei Y. et al . (2023b). Llama 2: Open foundation and fine-tuned chat models. arXiv preprintarXiv:2307.09288.
28
van der Maaten L. Hinton G. (2008). Visualizing data using t-sne. J. Mach. Learn. Res.9, 2579–2605.
29
Wongsuphasawat K. Qu Z. Moritz D. Chang R. Ouk F. Anand A. et al . (2017). Voyager 2: Augmenting visual analysis with partial view specifications (New York, NY, USA: Association for Computing Machinery). doi: 10.1145/3025453.3025768
30
Xu S. Bryan C. Li J. K. Zhao J. Ma K.-L. (2018). Chart constellations: effective chart summarization for collaborative and multi-user analyses. Comput. Graphics Forum37, 75–86. doi: 10.1111/cgf.13402
31
Zhang W. Shen Y. Lu W. Zhuang Y. (2024). Data-copilot: bridging billions of data and humans with autonomous workflow. arXiv preprintarXiv:2306.07209.
32
Zhao J. Fan M. Feng M. (2022). ChartSeer: interactive steering exploratory visual analysis with machine intelligence. IEEE Trans. Visualization Comput. Graphics28, 1500–1513. doi: 10.1109/TVCG.2020.3018724
33
Zhou D. Schärli N. Hou L. Wei J. Scales N. Wang X. et al . (2022). Least-to-Most Prompting Enables Complex Reasoning in Large Language Models. doi: 10.48550/arXiv.2205.10625
Summary
Keywords
large language model, visualization recommendation, machine learning, cold-start recommendation, ocean data
Citation
Li X, Liao J, Liu W, Miao Y, Wang L and Sun S (2025) Cold-start visualization recommendation driven by large language models for ocean data analysis. Front. Mar. Sci. 12:1554241. doi: 10.3389/fmars.2025.1554241
Received
01 January 2025
Accepted
30 April 2025
Published
04 June 2025
Volume
12 - 2025
Edited by
Huiyu Zhou, University of Leicester, United Kingdom
Reviewed by
Lei Zhang, Henan University, China
Ning Li, Harbin Institute of Technology, China
Updates
Copyright
© 2025 Li, Liao, Liu, Miao, Wang and Sun.
This is an open-access article distributed under the terms of the Creative Commons Attribution License (CC BY). The use, distribution or reproduction in other forums is permitted, provided the original author(s) and the copyright owner(s) are credited and that the original publication in this journal is cited, in accordance with accepted academic practice. No use, distribution or reproduction is permitted which does not comply with these terms.
*Correspondence: Wen Liu, z22070059@s.upc.edu.cn
Disclaimer
All claims expressed in this article are solely those of the authors and do not necessarily represent those of their affiliated organizations, or those of the publisher, the editors and the reviewers. Any product that may be evaluated in this article or claim that may be made by its manufacturer is not guaranteed or endorsed by the publisher.