Abstract
In this study, the spatial variations in total organic carbon (TOC), stable carbon isotopes (δ¹³Corg), C/N ratios, and nitrogen isotopes (δ¹⁵Norg) in East Sea sediments are examined to elucidate the sources, preservation, and diagenetic processes of organic matter. To this end, surface sediment samples were collected from the coastal regions of the East Sea using a box corer and analyzed for TOC, TON, stable isotopes (δ¹³C, δ¹⁵N), and grain size. The study region is categorized into three zones based on sediment characteristics: Zone A (straits), Zone B (northern coastal regions), and Zone C (central Ulleung Basin). Zone A, characterized by coarse sediments and dynamic hydrodynamic conditions, exhibits the lowest TOC (0.67%) and enriched δ¹³Corg values (-20.67‰). Zone B, influenced by coastal inputs, has moderate TOC (2.09%), slightly depleted δ¹³Corg (-21.09‰), and higher C/N ratios (6.30). Zone C, dominated by fine-grained mud sediments, features slightly lower TOC (1.96%), along with the most depleted δ¹³Corg (-21.86‰). Stable isotope analyses reveal that autochthonous particulate organic matter (POM) from marine phytoplankton is the primary source of organic matter in the East Sea. δ¹³Corg values (-23.15‰ to -20.33‰) align with phytoplankton-derived POM (-25‰ to -22‰), highlighting significant marine primary production contributions. In contrast, allochthonous inputs from atmospheric deposition, the Tsushima Warm Current, and rivers contribute approximately 82 gC/m²/year compared to 273 gC/m²/year from autochthonous sources. Seasonal δ¹³C variations are strongly correlated with peaks in primary productivity during spring and autumn. The study reveals differences between coastal (Zone B) and offshore (Zone C) regions in productivity regimes, nutrient utilization, and depositional settings. Coastal regions with high productivity show enriched δ¹³Corg, while offshore areas preserve isotopically lighter organic matter owing to stable depositional environments. Understanding the biogeochemical processes in the East Sea is essential for elucidating carbon cycling and its ecosystem implications. As a marginal sea with unique sedimentary dynamics, the East Sea serves as a natural laboratory for studying organic matter preservation. The findings provide insights into past and present carbon cycling and support predictions of future environmental changes under shifting climatic conditions.
1 Introduction
Sedimentary organic matter (SOM) in marine sediments primarily consists of particulate organic matter (POM) that settles from the surface layer (Wakeham and Lee, 1993). Marine POM can be categorized into two broad sources: allochthonous POM, derived from terrestrial inputs via rivers or atmospheric deposition, and autochthonous POM, synthesized by phytoplankton through photosynthesis in the surface ocean. The stable isotopic composition of carbon (δ¹³Corg) and nitrogen (δ15Norg) in marine sediments serves as a valuable archive of processes occurring during particle sinking and deposition. As a result, these isotopic proxies are extensively employed to investigate biological and geological mechanisms in marine environments.
Studies on δ¹³Corg in marine sediments have primarily focused on identifying organic matter sources (e.g., Sackett and Thompson, 1963; Minoura et al., 1997) and examining variations in CO2 concentrations in surface water (e.g., Jasper and Hayes, 1990; Rau et al., 1992). Terrestrial plants primarily utilize atmospheric CO2 (δ¹³CCO2 ≈ −8‰) for photosynthesis, whereas marine phytoplankton rely on dissolved bicarbonate (δ¹³CHCO₃ ≈ +1‰) as their primary carbon source. Consequently, marine-derived organic matter exhibits δ¹³Corg values that are 6–7‰ higher than terrestrial-derived organic matter. In this study, these isotopic differences were used to distinguish terrestrial versus marine sources of organic matter. Although freshwater sediment samples were not directly analyzed, source identification was based on isotopic endmember values reported in previous studies. Additionally, the fractionation factor during photosynthesis for marine phytoplankton (ϵphyto-DIC) ranges from -36‰ to -22‰ (Wong and Sackett, 1978), influenced by factors such as CO2(aq) concentration (e.g., Degens et al., 1968; Rau et al., 1989; Hinga et al., 1994), growth rates and productivity (e.g., Laws et al., 1995; Popp et al., 1999), water temperature (e.g., Sackett et al., 1965; Mook et al., 1974; Wong and Sackett, 1978), and species composition (e.g., Descolas-Gros and Fortugne, 1985, 1990). Therefore, δ¹³Corg in marine sediments serves as an effective indicator of the relative contributions of terrestrial and marine organic matter to the depositional environment.
Similarly, δ15Norg in marine sediments is widely employed in studies related to nitrate (NO₃⁻) utilization within the photic zone (e.g., Altabet and Francois, 1994; Farrell et al., 1995; Francois et al., 1992; Altabet et al., 1999). The primary processes influencing δ15Norg include phytoplankton photosynthesis, vertical mixing of water masses, and denitrification. During photosynthesis, marine phytoplankton preferentially assimilates 14NO₃⁻ (Wada and Hattori, 1978; Waser et al., 1998), leading to an enrichment of δ15NNO₃ in the remaining nitrate pool in surface water (Wada, 1980; Altabet, 1996; Altabet et al., 1999). Vertical mixing introduces nitrate from deeper waters, which typically have lower δ15NNO₃ values, thereby reducing δ15NNO₃ values in the photic zone. Furthermore, denitrification in oxygen-depleted deep waters preferentially removes 14NO₃⁻, increasing δ15NNO₃ in the residual nitrate pool (Cline and Kaplan, 1975).
While significant progress has been made in the use of δ¹³Corg and δ15Norg to study organic matter sources and biogeochemical processes, several unresolved questions remain, particularly in marginal seas like the East Sea. Most previous studies have primarily focused on open ocean systems or other marginal seas with distinct hydrodynamic settings. However, the East Sea, with its semi-enclosed configuration, high primary productivity, and complex external inputs from rivers, atmospheric deposition, and ocean currents remains underexplored in terms of isotopic geochemistry. Specifically, the relative contributions of terrestrial versus marine organic matter to the Ulleung Basin’s carbon pool, and the influence of environmental factors (e.g., seasonal variability, nutrient availability, and sedimentation dynamics) on isotopic signatures, have not been systematically addressed. Understanding the spatial variability of organic matter sources and preservation in marginal seas such as the East Sea is essential for improving global carbon cycle models and predicting responses to environmental change. Despite their ecological and climatic importance, such systems remain under-characterized in terms of biogeochemical dynamics.
The aim of this study was to fill these knowledge gaps through the investigation of the primary controls on δ¹³Corg and δ15Norg values in surface sediments of the East Sea. Unlike in previous studies, where researchers have largely emphasized either bulk isotopic patterns or single-parameter interpretations, our approach uniquely integrates multiple geochemical proxies across spatially defined depositional zones to assess preservation efficiency. The East Sea exhibits exceptionally high productivity (270 g/m²/yr) and organic carbon fluxes (9.6 gC/m²/yr), exceeding global oceanic averages (Kwak et al., 2013; Kim et al., 2017). By evaluating spatial variations in isotopic compositions and depositional conditions, this research study provides new insights into the preservation and transformation of organic matter in a climatically and ecologically significant marginal sea.
2 Study area and methodology
2.1 Geological setting
The East Sea (Sea of Japan) is a semi-enclosed marginal sea with an average depth of approximately 1,350 m and a surface area of approximately 1,000,000 km². The Tsushima Warm Current (TWC), a mixture of the warm, saline Kuroshio current and freshwater from the East China Sea Coastal Water (ECSCW), enters the East Sea through the Korea Strait and exits into the Pacific Ocean via the Tsugaru Strait. Upon entering the East Sea, the TWC splits into three distinct branches (Figure 1A).
Figure 1
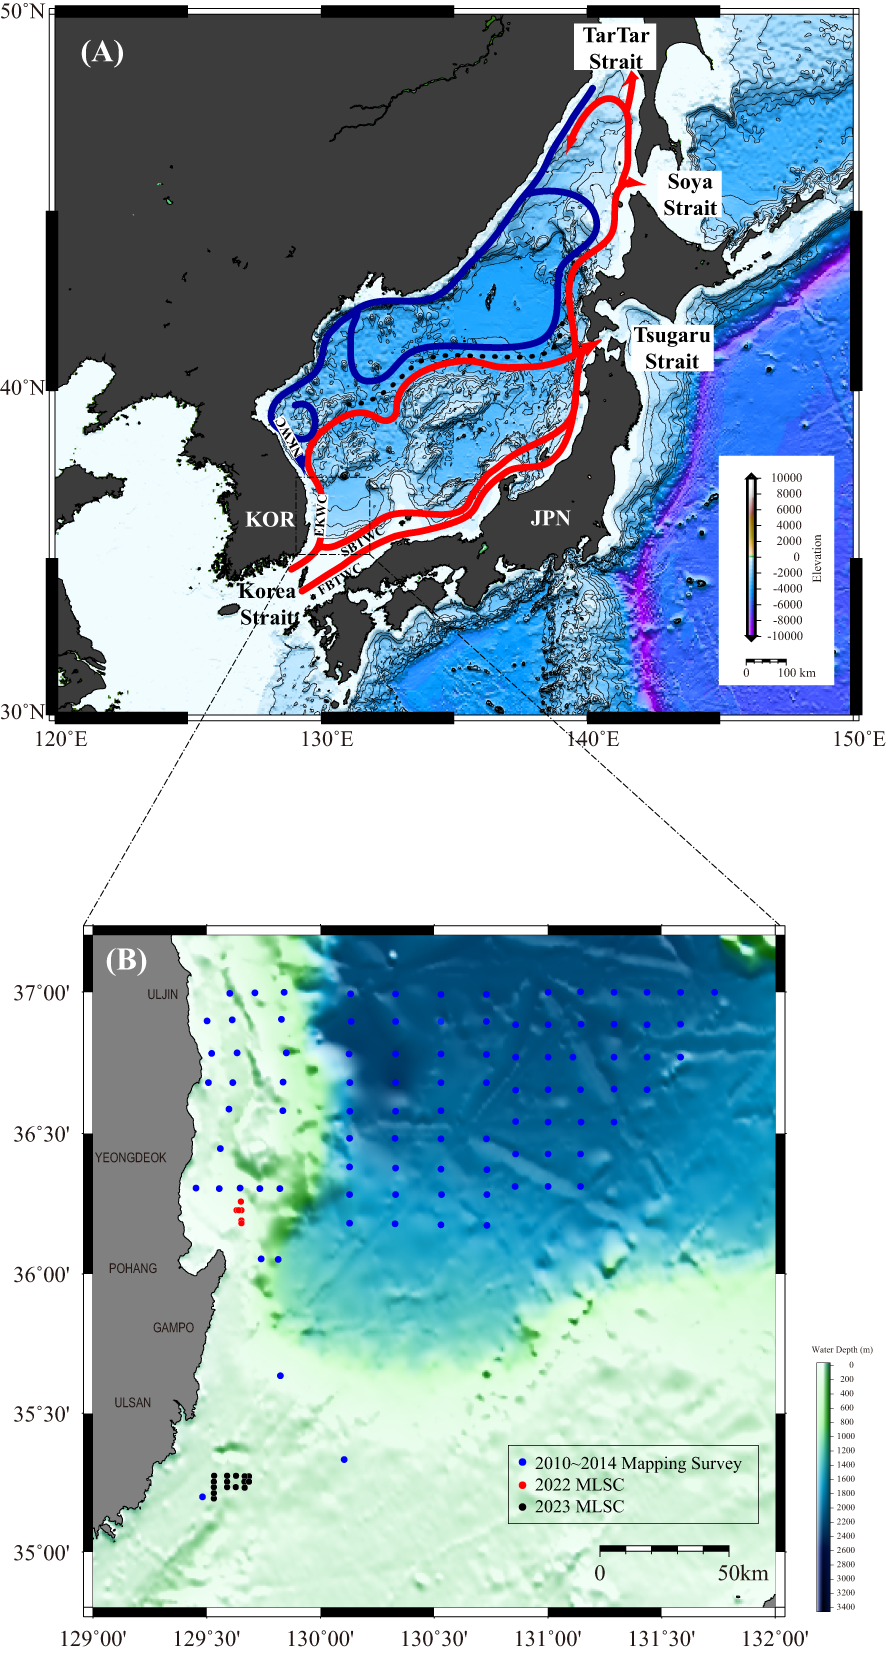
(A) Bathymetric map showing the core location of this study and surface current systems (modified from Lee and Niiler, 2005). Red arrows represent warm currents, blue arrows indicate cold currents, and the dashed line marks the sub-polar front (SPF). (B) Map illustrating the study stations and delineated zones within the research area. Blue dots represent data from the 2010–2014 mapping survey, red dots indicate the locations of the 2022 MLSC, and black dots show the 2023 MLSC survey sites.
The First Branch Tsushima Warm Current (FBTWC) enters through the eastern channel of the Korea Strait and flows northeastward along the western coast of Japan. The second branch, Tsushima Warm Current (SBTWC) enters through the western channel of the Korea Strait, flowing northward along the continental shelf and sloping west of the FBTWC. The Third Branch, the East Korean warm current (EKWC), flows northward along the eastern coast of Korea after entering through the western channel of the Korea Strait. Upon encountering the southward-flowing North Korea Cold Current (NKCC) along the eastern coast of Korea, the EKWC turns eastward across the East Sea, forming the sub-polar front near 40°N. Some portions of the TWC flow northward along the western coast of Hokkaido Island and exit into the Sea of Okhotsk through the Soya Strait. Another portion moves further north within the East Sea, where cooling and brine rejection increase its density sufficiently to cause sinking to the seafloor (Talley et al., 2003).
The study area, the Ulleung Basin, is located in the southwestern part of the East Sea, where the EKWC and NKCC converge. This region exhibits significant seasonal variations in temperature, nutrients, and primary productivity. According to the World Ocean Atlas 2013 (1955–2013), surface water temperature in the Ulleung Basin ranges from a maximum of 23.3°C in summer to a minimum of 11.8°C in winter. Observed chlorophyll-a concentrations between 2008 and 2011 range from 0.3 to 3.1 mg/m³, peaking in spring and reaching their lowest levels in summer (Lee et al., 2014). Consequently, primary productivity in the Ulleung Basin is highest during spring. Primary productivity in this region (273 gC/m²/yr; Kwak et al., 2013) and organic carbon fluxes (7.9–11.1 gC/m²/yr; Lee et al., 2010; Kim et al., 2017) are notably higher than global oceanic averages for primary productivity (55–102 gC/m²/yr; Eppley and Peterson, 1979) and organic carbon fluxes (1.6–3.0 gC/m²/yr; Lutz et al., 2002). These findings underscore the ecological and biogeochemical significance of the Ulleung Basin within the East Sea.
2.2 Core sampling
Surface marine sediment samples were collected using a box corer onboard the research vessel R/V Tamhae II during three periods: 2010–2014, 2022, and 2023. In total, 93 samples were obtained during the 2010–2014 mapping surveys, while 6 and 15 samples were collected in 2022 and 2023, respectively (Figure 1B). Sediment samples were subsampled from the uppermost 0–5 cm layer of the recovered cores to ensure sufficient volume for TOC, TON, and stable isotope analysis. This interval also captures recent depositional material while minimizing the effects of early diagenesis. The 2010–2014 mapping samples were collected from a wide depth range between approximately 79 m and 2,224 m. The 2022 and 2023 MLSC samples were primarily collected from shallower depths, ranging from 105 m to 178 m, reflecting coastal and shelf environments.
The 2023 Machine Learning Seabed Classification (MLSC) samples were collected from coastal areas near the straits, reflecting the influence of water masses entering the East Sea through narrow channels. In contrast, the 2022 MLSC samples were obtained from locations farther north along the coastline, providing comparative data from relatively higher latitudes. The 2010–2014 mapping samples covered a broad geographic range, from the northern coastline of the study area to the Ulleung Basin. This comprehensive sampling strategy facilitates a detailed investigation of regional variations in sedimentary organic matter characteristics and offers valuable insights into the biogeochemical processes within the East Sea.
The 2010–2014 mapping survey was designed to assess broad-scale sedimentological and geochemical patterns, which led to a relatively large number of samples covering a wide region. In contrast, the 2022 and 2023 MLSC campaigns targeted smaller areas with higher sampling density. For the purpose of this study, which focuses on regional-scale spatial variability, a larger proportion of 2010–2014 samples was retained, while representative samples were selected from the 2022 and 2023 datasets to reduce spatial clustering bias.
2.3 Sediment analysis
Total organic carbon (TOC) and total organic nitrogen (TON) contents were measured using a Leco CHN-900 analyzer. In total, 114 surface sediment samples were analyzed for TOC and TN: 93 samples from the 2010–2014 mapping surveys, 6 from the 2022 MLSC campaign, and 15 from the 2023 MLSC campaign. Sediment samples were prepared by treating crushed sediment with 3N hydrochloric acid (HCl) to remove inorganic carbonates and nitrogen compounds. After acid treatment, the samples were rinsed 4–5 times with triple-distilled water and dried in an oven at 65°C for 24 h. Approximately 2 mg of the pretreated powdered sample was placed in a combustion chamber, where ultra-high-purity oxygen (99.9999%) was introduced. The sample was combusted at approximately 900°C to determine the TOC and TON contents in the sediment. A certified soil standard containing 2.1 wt% TOC and 0.2 wt% TON was used as the reference material. The detection limits for TOC and TON were 0.001% and 0.01%, respectively.
To measure the stable isotopic composition of carbon and nitrogen in organic matter, sediment samples were pretreated with 3N HCl to remove inorganic carbonates. Stable isotope analyses (δ13Corg and δ15Norg) were performed on a total of 60 sediment samples: 41 from the 2010–2014 mapping surveys, 7 from the 2022 MLSC campaign, and 12 from the 2023 MLSC campaign. Analyses were conducted at the National Instrument Center for Environmental Management (NICEM) at Seoul National University using an isotope ratio mass spectrometer (IsoPrime-EA, Micromass, UK). δ13C values are reported relative to the Vienna Pee Dee Belemnite (V-PDB) standard, and δ15N values are reported relative to atmospheric N2 (Air). The stable isotope ratios of carbon (δ13C) and nitrogen (δ15N) were calculated using the following equation:
Here, R represents the 13C/12C or 15N/14N ratios of the sample and the standard reference material. The reproducibility of the stable isotope measurements was< 0.1‰ for carbon and< 0.2‰ for nitrogen.
2.4 Grain size analysis
Grain-size analysis was conducted on sediment samples taken 5 cm below the top of the working core halves to minimize the influence of disturbed sediment. Grain-size distribution was measured using the pipette method after the removal of organic matter with 30% H2O2 and carbonates with 2N HCl. Before grain-size analysis, the samples were disaggregated in a 2% dispersant solution ((NaPO3)6), and wet-sieved through a 4 phi (63 μm) sieve to separate the sand and mud fractions. The sand fraction (>63 μm) was dry sieved at 1 phi intervals, while the mud fraction (<63 μm) was analyzed using a particle size analyzer (Sedigraph 5120). Weight percentage data were processed using the logarithmic method of moments (in phi units) in Gradistat v.9.1 (Blott and Pye, 2001) to derive grain-size distribution statistics.
3 Results
3.1 TOC, C/N ratio, δ13Corg, and δ15Norg results
The values of TOC, C/N ratio, δ13Corg, and δ15Norg are visually represented in Figure 2 and detailed in Appendix 1. The results are presented here according to zonation defined as: Zone A (straits), Zone B (coastal), and Zone C (offshore basin) (Figure 3).
Figure 2
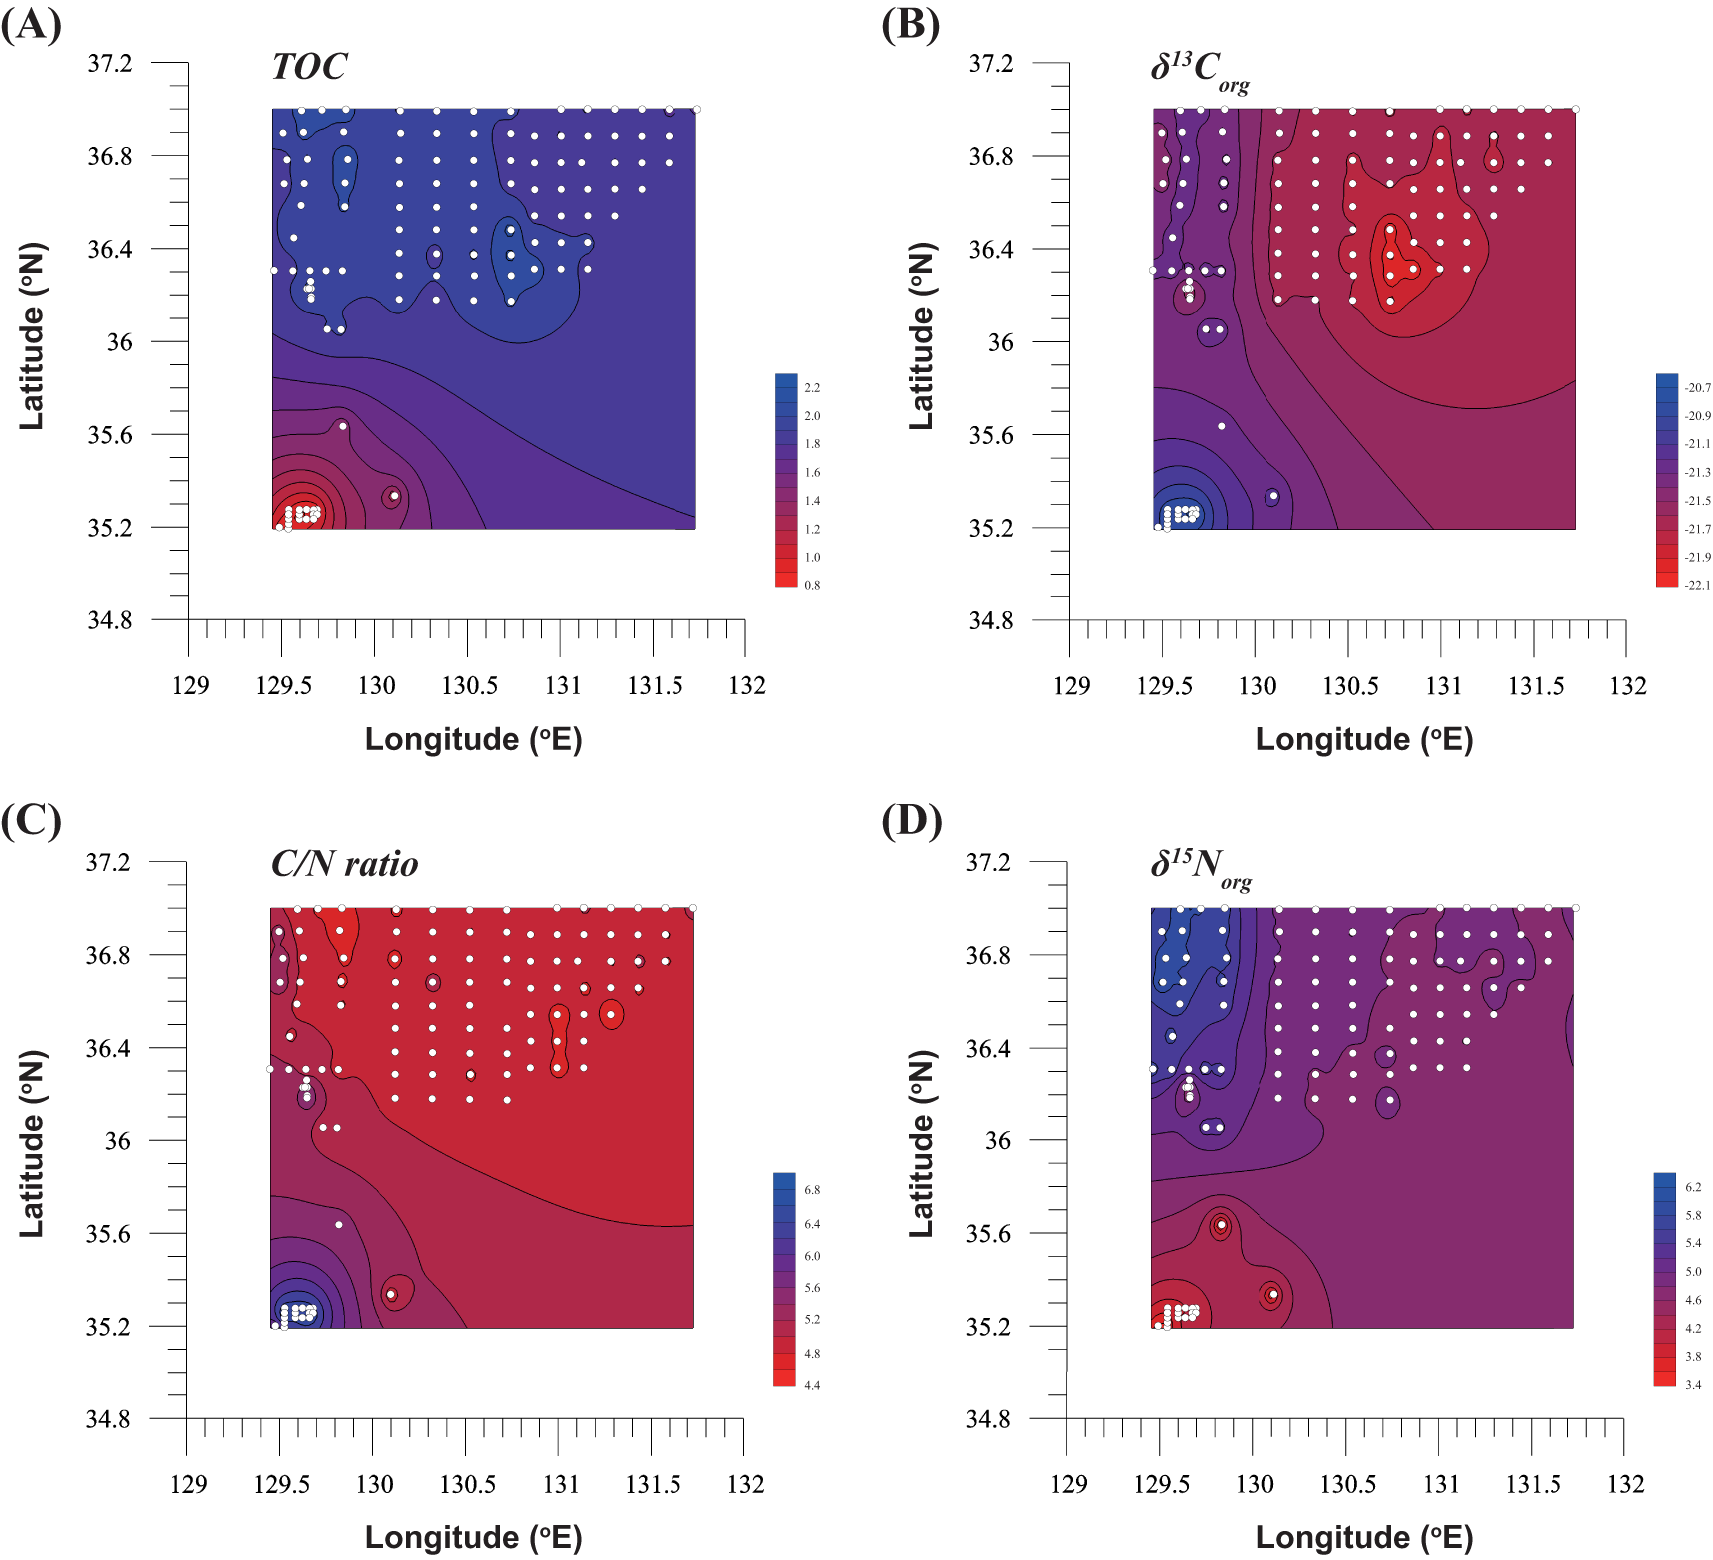
Spatial distribution maps of sedimentary and geochemical parameters in the East Sea: (A) TOC (wt%) shows higher concentrations in northern coastal areas and the central basin, with lower values near the straits. (B) δ¹³Corg (‰) displays more enriched values near the straits, with progressively more depleted values offshore. (C) C/N ratio highlights higher values in northern coastal areas compared to offshore regions. (D) δ15Norg (‰) exhibits the highest values near the straits and lower values in northern coastal and offshore areas.
Figure 3
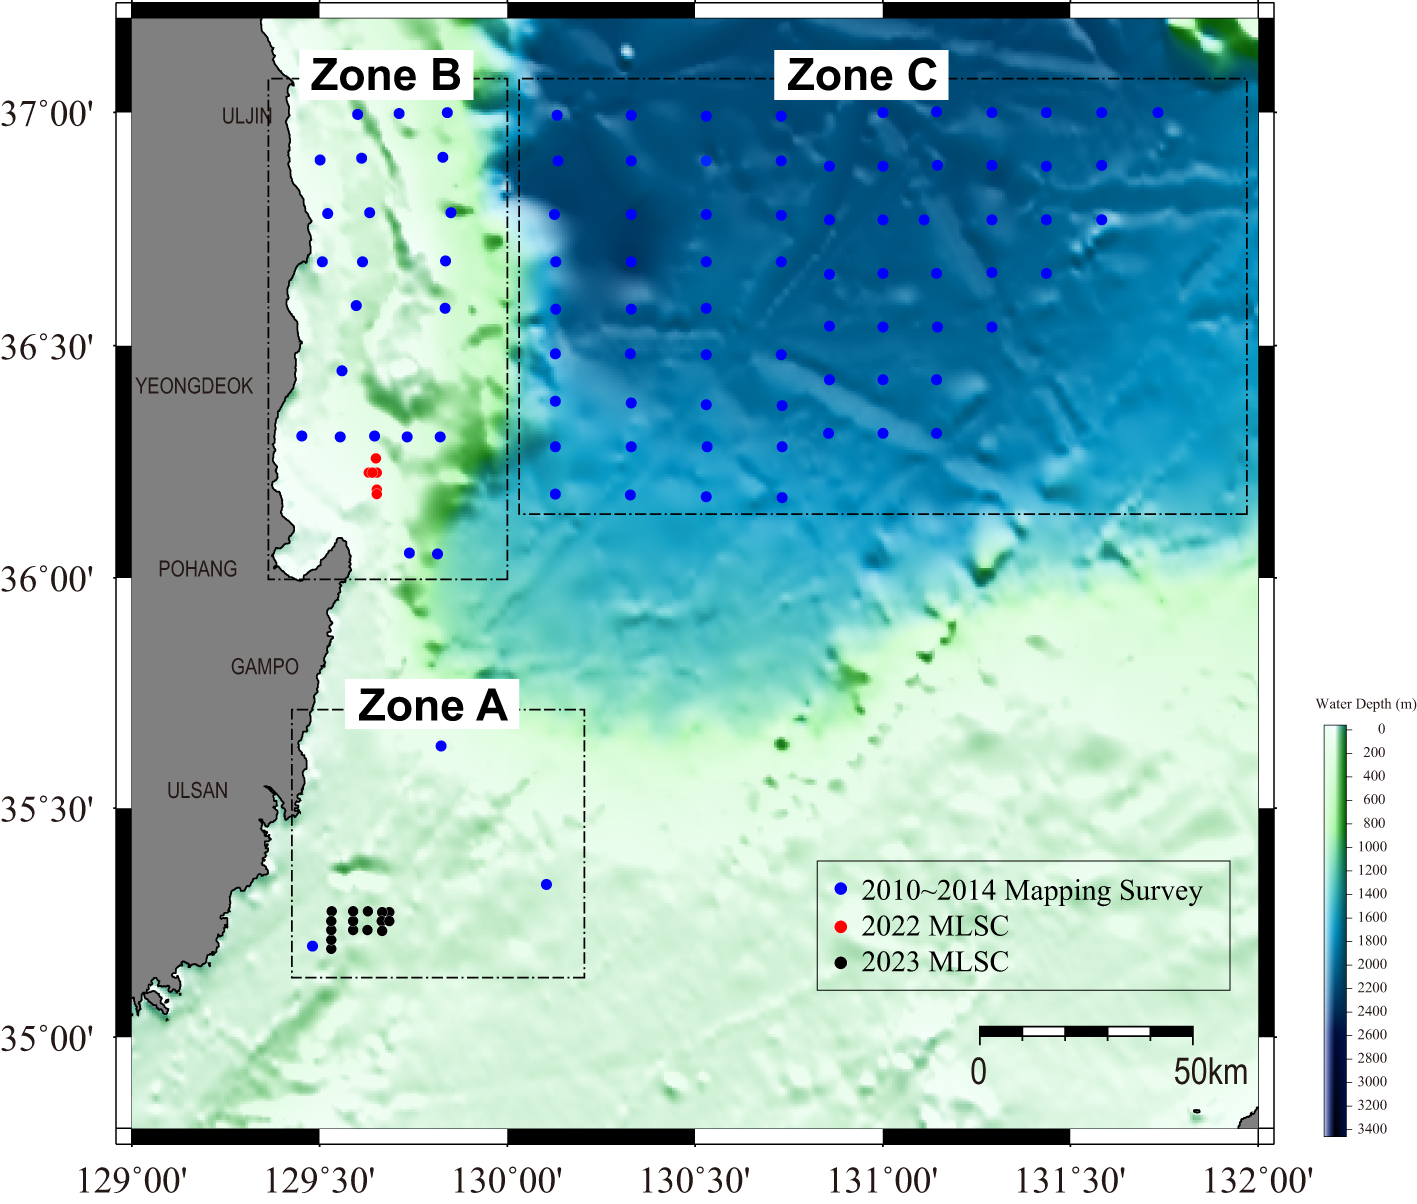
Spatial distribution of survey points across Zones A, B, and C in the southeastern offshore region of Korea. The zones are delineated to focus on specific areas of interest: Zone A (southern region), Zone B (central region near Yeongdeok and Pohang), and Zone C (offshore region to the east).
Zone A includes sites near the Korea Strait and Tsushima Strait, mostly from the 2010–2014 mapping survey. TOC values in this zone were the lowest, ranging from 0.32 to 1.01 wt%, with an average of 0.67 wt%. C/N ratios ranged from 3.2 to 9.1, with an average of 6.5, reflecting a relatively marine origin. δ13Corg values ranged from −21.14‰ to −20.33‰ (average: −20.67‰), and δ15Norg values were the highest among the zones, averaging 6.55‰, indicating strong isotopic enrichment associated with dynamic depositional conditions.
Zone B includes stations primarily from the 2022 MLSC and a portion of the mapping sites. TOC values ranged from 1.34 to 2.53 wt%, with a mean of 2.09 wt%, showing the highest TOC concentration among the zones. C/N ratios ranged from 4.1 to 6.5, averaging 4.7, suggesting a mixture of terrestrial and marine organic matter. δ13Corg values ranged from −22.03‰ to −20.42‰ (average: −21.09‰), while δ15Norg values ranged from 3.48‰ to 7.81‰ (average: 5.02‰), indicative of moderate nitrate utilization and higher productivity.
Zone C includes offshore sites, particularly from the 2023 MLSC and parts of the mapping dataset. TOC values ranged from 1.45 to 3.30 wt%, averaging 1.96 wt%, reflecting good preservation despite lower productivity. C/N ratios ranged from 3.5 to 7.8, with a mean of 5.0, indicating dominant marine phytoplankton contribution. δ13Corg values ranged from −23.15‰ to −21.34‰, with an average of −21.86‰, showing the most isotopically depleted carbon. δ15Norg values ranged from 4.06‰ to 5.48‰ (average: 4.68‰), lower than Zone B, possibly owing to reduced nitrate utilization or nitrogen fixation input.
Zone B (coastal) exhibited the highest TOC and δ15Norg values, along with elevated C/N ratios and enriched δ13Corg, suggesting strong productivity and terrestrial input. In contrast, Zone C (offshore) showed lower δ15Norg and more depleted δ13Corg, reflecting low productivity and possible nitrogen fixation. Zone A presented low TOC and C/N values with enriched δ15Norg, corresponding to hydrodynamically active environments.
3.2 Grain size results
Grain size variations are visually represented in Figure 2 and summarized in Appendix 1. The results are described below by spatial zonation (Figure 3).
Zone A samples are located near the Korea and Tsushima Straits, where hydrodynamic energy is relatively high. The mean grain size (Mz) in this zone was 3.93, with values ranging from 2.97 to 4.98, indicating the presence of both coarse and fine sediments. The mud content ranged from 15.16% to 66.98%, with an average of 31.74%, reflecting a dominance of sand-sized material and more dynamic depositional environments.
Zone B includes stations primarily sampled during the 2022 MLSC. The mean grain size (Mz) was 8.13, with a broad range from 5.75 to 9.70, indicating predominance of fine-grained sediments, such as clay and silt. Mud content ranged from 66.45% to 99.95%, with an average of 95.87%, consistent with quiescent coastal depositional environments with limited current energy.
Zone C comprises mostly 2023 MLSC and some mapping survey stations located in deeper offshore regions. The mean grain size (Mz) was 8.46, with a relatively narrow range from 7.44 to 9.55, indicating a uniform fine-grained sediment texture. Mud content ranged from 92.47% to 99.96%, with an average of 99.78%, suggesting very stable and low-energy depositional settings that favor the accumulation of fine materials.
Overall, grain size and mud content exhibited distinct spatial patterns across the three zones. Zone A, located near the straits, was characterized by coarser sediments and the lowest mud content, indicative of high-energy depositional environments shaped by strong hydrodynamic conditions. In contrast, Zone B (coastal) showed predominantly fine-grained sediments with consistently high mud content, reflecting reduced current energy and more quiescent sedimentation. Zone C, representing the offshore basin, displayed the finest and most homogeneous sediments, with nearly complete mud dominance across all samples. These patterns suggest a clear gradient in depositional energy and sediment texture from dynamic coastal straits to stable offshore basin environments.
4 Discussion
4.1 Spatial distribution of TOC and its stable isotopic composition (δ¹³Corg and δ15Norg)
The study area is classified into three zones—Zone A (near the straits), Zone B (northern coastal regions), and Zone C (central Ulleung Basin)—based on differences in sediment characteristics, hydrodynamic energy, and depositional environments. These distinctions are reflected in the spatial distribution of TOC, δ¹³Corg, C/N ratios, δ15Norg, and other sedimentary properties. The observed patterns highlight regionally distinct depositional settings and sedimentary dynamics across the zones, underscoring the influence of local environmental conditions (Figure 4; Table 1).
Figure 4
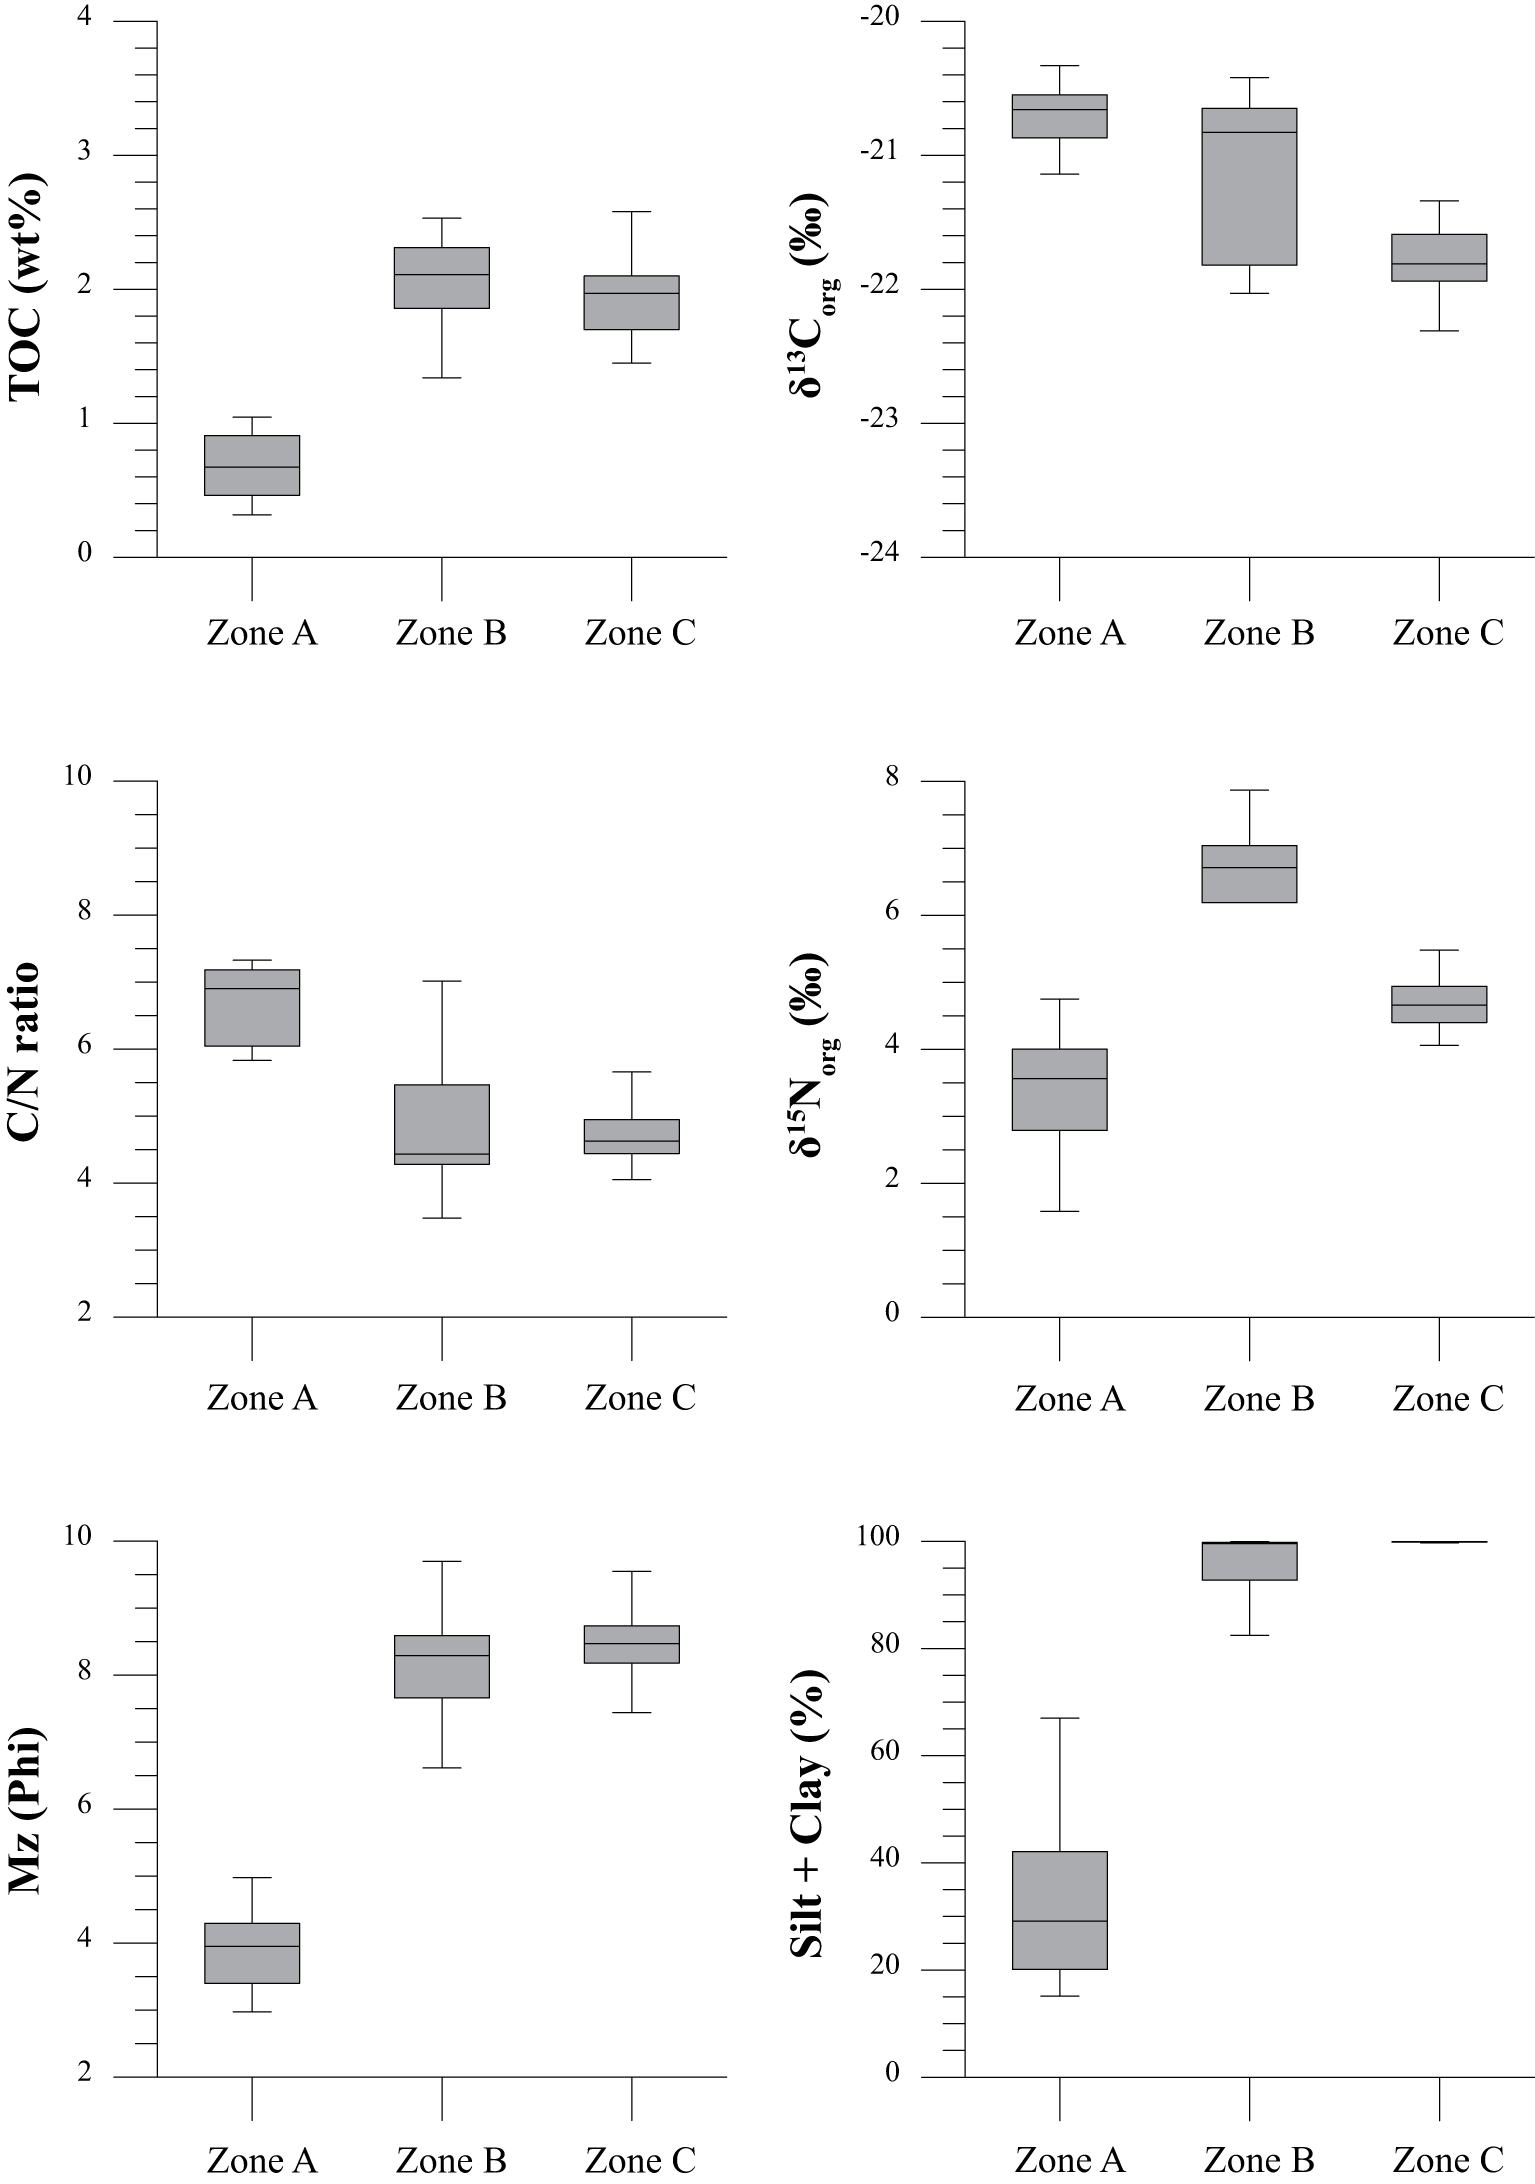
Boxplots depicting spatial variations of sedimentary and geochemical parameters across Zones A, B, and C.
Table 1
| Area | n | TOC | δ13Corg | TON | δ15Norg | C/N Ratio | Mz | Mud% | |
|---|---|---|---|---|---|---|---|---|---|
| (%) | (‰) | (%) | (‰) | (Ф) | (%) | ||||
| A | near the Straits | 18 | 0.32 ~ 1.05 (0.67) |
-21.14 ~ -20.33 (-20.67) |
0.45 ~ 4.75 (3.30) |
3.22 ~ 9.10 (6.55) |
3.2 ~ 9.1 (6.5) |
2.97 ~ 4.98 (3.93) |
15.16 ~ 66.98 (31.74) |
| B | Northern coastal regions | 68 | 1.34 ~ 2.53 (2.09) |
-22.03 ~ -20.42 (-21.09) |
3.44 ~ 7.87 (6.30) |
3.48 ~ 7.81 (5.02) |
4.1 ~ 6.5 (4.7) |
5.75 ~ 9.70 (8.13) |
66.45 ~ 99.95 (95.87) |
| C | Central UB | 28 | 1.45 ~ 3.30 (1.96) |
-23.15 ~ -21.34 (-21.86) |
4.06 ~ 5.48 (4.68) |
4.05 ~ 6.50 (4.75) |
3.5 ~ 7.8 (5.0) |
7.44 ~ 9.55 (8.46) |
92.47 ~ 99.96 (99.78) |
Ranges of geochemical and sedimentological properties across the Zones in the study area.
In Zone A, near the straits, TOC concentrations are the lowest, averaging 0.67%, and are accompanied by the most enriched δ¹³Corg values (-20.67‰ on average) and the lowest C/N ratios (3.30). These features align with coarse-grained sediments (mean Mz 4.98) and low mud content (31.74%), indicating dynamic depositional conditions. δ15Norg values are the highest in this zone, averaging 6.55‰, which reflects distinct differences in organic matter composition compared to the other zones.
Zone B, along the northern coastline, exhibits increased TOC concentrations, with an average of 2.09%, slightly more depleted δ¹³Corg values (-21.09‰ on average), and higher C/N ratios (6.30). The sediments in this zone are finer (Mz 8.13) with a higher mud content (95.87%), supporting enhanced organic matter accumulation compared to Zone A. The δ15Norg values in this zone average 5.02‰, representing intermediate levels and reflecting a transitional depositional environment influenced by finer sediments.
In Zone C, the central Ulleung Basin, TOC concentrations are the highest, averaging 1.96%, with slightly more depleted δ¹³Corg values (-21.86‰ on average) and moderate C/N ratios (4.68). The sediments in this zone are the finest (Mz 8.46), with nearly 100% mud content (99.78%), providing an optimal environment for organic matter preservation. δ15Norg values averaging 4.75‰ remain stable, reflecting the deep, low-energy depositional conditions of the basin.
To better understand preservation efficiency, we considered multiple geochemical and sedimentological parameters in an integrated manner. While each parameter provides unique insight, their relative contributions were not explicitly weighted, as doing so was beyond the scope of this study. Pearson correlation analysis using all surface sediment samples showed a significant negative relationship between TOC and mean grain size (r = 0.81, p< 0.001), supporting the interpretation that finer sediments are more conducive to organic matter preservation (Figure 5). In addition to variations in organic geochemistry, sediment composition also exhibited a systematic spatial trend with respect to distance from the coastline. Coarser-grained sediments with lower mud content were observed in nearshore areas (Zones A and B), while fine-grained, mud-rich sediments dominated the offshore Ulleung Basin (Zone C). This trend reflects the decreasing influence of hydrodynamic energy and the increasing depositional stability toward deeper, offshore environments. This multi-indicator approach was intended to minimize interpretive uncertainty that may arise when relying on a single proxy. Beyond organic geochemistry, the spatial distribution of sediment texture also reflects underlying provenance and transport processes. In coastal regions (Zone B), relatively coarser sediments with lower mud content are observed, indicating stronger hydrodynamic conditions and influence from terrestrial inputs such as riverine discharge (e.g., Nakdong River). In contrast, the fine-grained sediments dominating the offshore Ulleung Basin (Zone C) suggest deposition primarily from suspended material delivered by lateral advection and settling from distant sources. These observations point to a continental-to-marine sediment delivery system, where hydrodynamic sorting and transport distance govern the sedimentary and geochemical characteristics across the shelf-to-basin gradient.
Figure 5
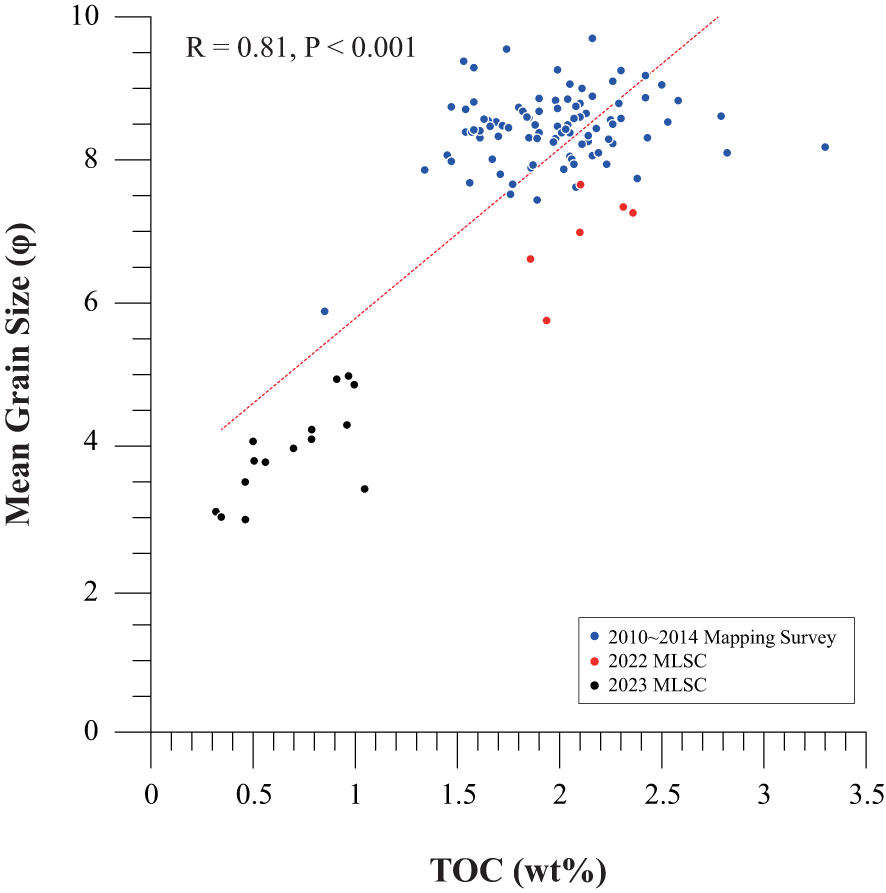
Scatter plot showing the relationship between Total Organic Carbon (TOC, wt%) and mean grain size (Mz, Phi). A significant positive correlation is observed (r = 0.81, p< 0.001), with the red line representing the linear regression fit.
4.2 Sources of organic matter
The study area was previously classified into three zones—Zone A (near the straits), Zone B (northern coastal regions), and Zone C (central Ulleung Basin)—based on differences in sediment characteristics, hydrodynamic energy, and depositional environments. By comparing and analyzing δ13Corg values, TOC concentrations, C/N ratios, and other geochemical indicators across these zones, the relative contributions of autochthonous and allochthonous organic matter were evaluated.
Interestingly, in Zone A, where TOC concentrations are the lowest and the influence of terrestrial allochthonous organic matter was expected to be the greatest, the highest δ13Corg value (-20.67‰) was observed. This result suggests that autochthonous organic matter of marine origin may exert a relatively stronger influence than previously anticipated, outweighing the contribution of allochthonous sources. These findings underscore the need for an in-depth discussion of the factors influencing δ13Corg values in the study area. Accordingly, this study examines the primary factors affecting δ13Corg values in each zone, including sediment characteristics, hydrodynamic conditions, and the differential contributions of autochthonous and allochthonous organic matter.
In this study, the origins of organic matter in East Sea sediments were analyzed using δ13Corg values as a key indicator. δ13Corg values are a critical tool for identifying the primary sources of marine organic matter and assessing the relative contributions of autochthonous particulate organic matter (POM) and allochthonous POM. The δ13Corg values measured in this study (-23.15‰ to -20.33‰) align with the isotopic range of autochthonous POM synthesized by marine phytoplankton (-25‰ to -22‰; Bae et al., 2015). These findings strongly indicate that the organic matter in East Sea sediments predominantly originates from marine sources.
Allochthonous POM enters the East Sea through atmospheric deposition, the TWC, and riverine inputs such as the Nakdong River (Table 2). The input of POM via atmospheric deposition was estimated using the particulate organic carbon concentration (6 μgC/m³) measured at the Gosan site on Jeju Island (Kawamura et al., 2004). Following the method described by Duce et al. (1991), the total atmospheric flux was calculated as the sum of dry deposition (Fp) and wet deposition (Fr) using the following equations:
Table 2
| Source | POC Flux | δ13C | PON Flux | δ15N |
|---|---|---|---|---|
| (gC/m2/yr) | (‰) | (gN/m2/yr) | (‰) | |
| Ocean Primary Productivity | 2731 | -232 | 631 | 63 |
| Regenerated | – | – | 491 | 54 |
| Aeorosol5 | 11 | -24 | 5 | 4.2 |
| Nakdong River | 166 | -257 | 1.26 | 127 |
| Tsushima Warm Current | < 558 | -229 | < 8 | 69 |
POC and PON flux and δ13C and δ15N values in autochthonous and allochthonous source regions around the East Sea.
where Cpa represents the POM concentration, Vd is the settling velocity (2 cm/s; Hsu et al., 2009), P is the annual precipitation (1,369 mm/year, KMA data), S is the scavenging ratio (1,000), and ρ is the air density (1,200 g/m³). The scavenging ratio reflects the removal efficiency of atmospheric components under varying environmental and meteorological conditions, typically ranging from 500 to 2,000 in coastal regions (Hsu et al., 2009). Using these parameters, dry deposition was estimated at 4 gC/m²/year, and wet deposition at 7 gC/m²/year, resulting in a total atmospheric flux of 11 gC/m²/year.
POM input from the TWC comprises East China sea coastal water and Kuroshio water, which flow into the East Sea via the Korea Strait. Sediment trap data indicate that the POM flux at the Yangtze River estuary is 2,665 gC/m²/year, but it decreases significantly to 55 gC/m²/year in the eastern East China Sea, where coastal water interacts with the Kuroshio current (Hung et al., 2013). Thus, the contribution of POM from the TWC to the East Sea is estimated to be less than 55 gC/m²/year.
The POM input from the Nakdong River is estimated based on its annual discharge of approximately 4.6 × 10⁶ tons of suspended particles, 98% of which settle in coastal areas (Park et al., 1999). Assuming that only 2% of the synthesized organic matter (810 gC/m²/year; Park et al., 2009) reaches offshore areas, the contribution of POM from the Nakdong River to the East Sea is approximately 16 gC/m²/year.
Combining these contributions, the total input of allochthonous POM to the East Sea is estimated to be approximately 82 gC/m²/year, with atmospheric deposition contributing 11 gC/m²/year, the TWC contributing up to 55 gC/m²/year, and the Nakdong River contributing 16 gC/m²/year. This total is significantly lower than the production of autochthonous POM by marine phytoplankton, estimated at 273 gC/m²/year (Table 2). These findings confirm that organic matter in East Sea sediments predominantly originates from autochthonous POM.
The pattern of δ13C values in East Sea sediments further emphasizes the dominance of autochthonous POM over allochthonous sources (Figure 6). The δ13C values of allochthonous POM from atmospheric deposition (-27‰ to -18‰; Kawamura et al., 2004), the TWC (-22‰; Gao et al., 2014), and the Nakdong River (-28‰ to -22‰; Kang et al., 2007) exhibit mixed isotopic signatures compared to the more consistent δ13C values of marine phytoplankton-derived POM. The δ13C values recorded in East Sea sediment traps (-25‰ to -22‰; Kim et al., 2017) closely align with those of marine phytoplankton-derived POM, indicating that autochthonous sources exert a stronger influence on sedimentary δ13C values than allochthonous inputs.
Figure 6
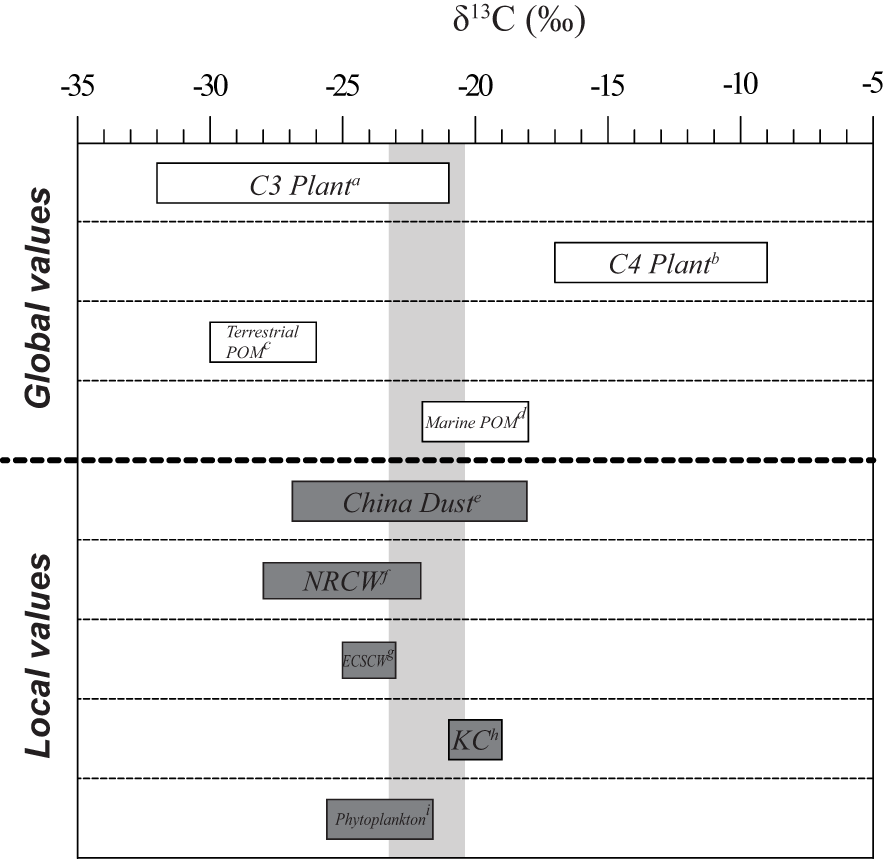
Range of δ13C values for: a) C3 plant (Deines, 1980) b) C4 plant (Deines, 1980), c) Terrestrial POM (Lamb et al., 2006), d) Marine POM (Lamb et al., 2006), e) China Dust (Kawamura et al., 2004), f) Nakdong River (Kang et al., 2007), g) ECSCW (Wu et al., 2003), h) Kuroshio current (Wu et al., 2003), and i) Phytoplankton pigment (C37:2 alkenone) in the East Sea (Bae et al., 2015). The gray-shaded area represents the range of δ13Corg values observed in this study.
Globally, increased primary productivity in marine phytoplankton leads to an increase in intracellular carbon demand, resulting in increased carbon flux into phytoplankton cells. As a result, the δ13C values of organic matter synthesized by phytoplankton tend to increase (Rau et al., 1996; Popp et al., 1999). In the East Sea, POM fluxes peak during spring and autumn, coinciding with increases in δ13CPOM values (Figures 7A, B) (Kim et al., 2017). This pattern corresponds to periods of elevated chlorophyll-a concentrations, which act as a proxy for primary productivity (Figure 7C) (Lee et al., 2014). Thus, the seasonal increases in δ13CPOM values observed in the East Sea are likely driven by heightened primary productivity during these periods.
Figure 7
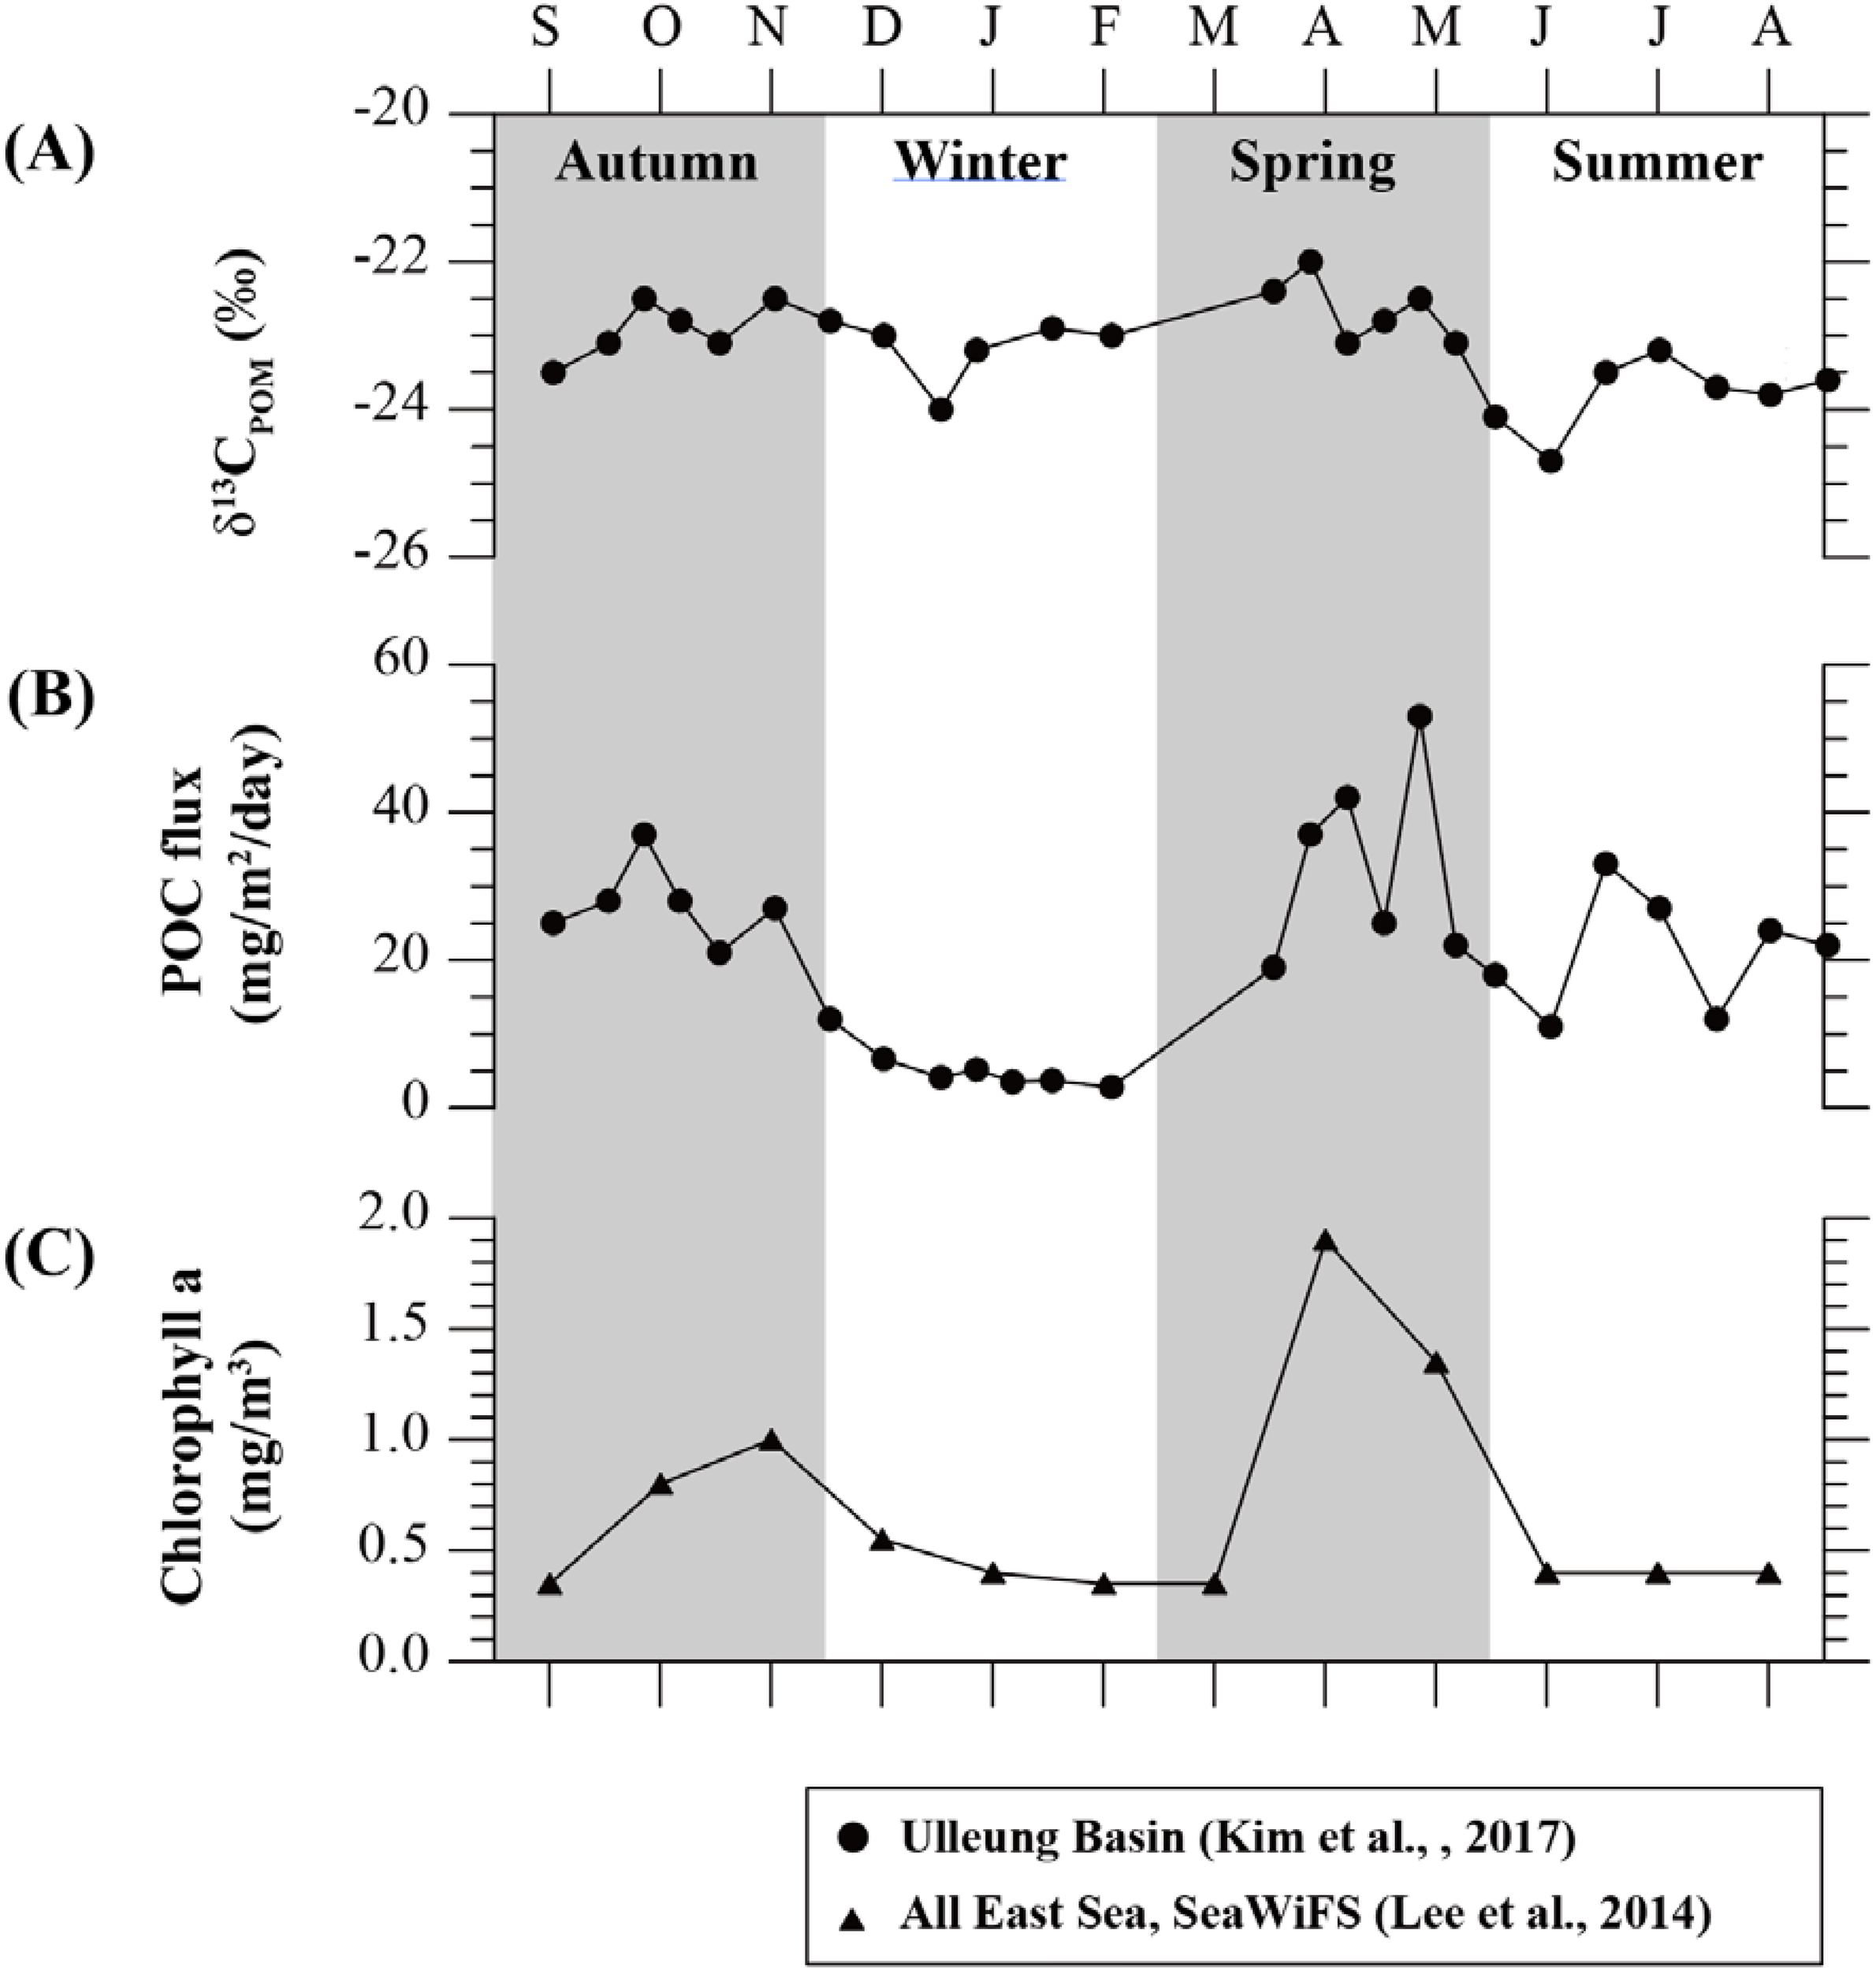
Seasonal variation of (A) δ13Cpom values and (B) POC flux from sediment trap data (Kim et al., 2017), and (C) Chlorophyll-a concentrations (Lee et al., 2014) in the East Sea. These data are not from the present study but are cited from previous literature to support interpretation of seasonal trends in organic matter dynamics. Seasons are defined as Spring (Mar–May), Summer (Jun–Aug), Autumn (Sep–Nov), and Winter (Dec–Feb).
Interestingly, although autochthonous POM dominates in the East Sea, its δ13C values (-25‰ to -22‰) are relatively lighter than the typical range of marine phytoplankton-derived POM (-22‰ to -18‰) (e.g., Lamb et al., 2006). Globally, primary productivity, as indicated by POC flux, is higher in the subarctic Northwest Pacific (up to 50 mg/m²/day) compared to the western equatorial Pacific (maximum ~8 mg/m²/day). Despite this, δ¹³CPOM values are lower in the subarctic waters (-24‰ to -26‰) than in equatorial regions (-20‰ to -24‰) (Nakatsuka et al., 1997; Yasuda et al., 2016). This discrepancy is likely due to the higher [CO2(aq)] concentrations in subarctic regions, which induce greater isotopic fractionation. In surface water, [CO2(aq)] levels are highest in subarctic regions, reaching approximately 20 µmol/L, whereas in equatorial regions, [CO2(aq)] levels are significantly lower, around 5–10 µmol/L (Broecker et al., 1982). Consequently, δ13CPOM values in the subarctic Pacific range from -26‰ to -30‰, while in equatorial regions, δ13CPOM values are higher, ranging from -20‰ to -22‰ (Sackett et al., 1965; Nakatsuka et al., 1997; Guo et al., 2004; Yasuda et al., 2016). This pattern highlights the influence of higher [CO2(aq)] concentrations in subarctic water, which lead to greater isotopic fractionation and lower δ¹³CPOM values, whereas lower [CO2(aq)] levels in equatorial regions result in relatively higher δ¹³CPOM values.
These global patterns contrast with the δ13CPOM distribution in the East Sea. In the East Sea, δ13CPOM values are lower than those observed in the open ocean and are strongly influenced by seasonal variations in primary productivity. This underscores the distinctive characteristics of δ13CPOM values in the East Sea, which are primarily driven by local phytoplankton productivity and regional environmental factors.
This study demonstrates that δ13C values in East Sea sediments are predominantly influenced by autochthonous POM synthesized by marine phytoplankton. Seasonal variations in δ13C values are closely linked to primary productivity, as evidenced by changes in chlorophyll-a concentrations and POM fluxes. Additionally, regional environmental factors, such as surface water [CO2(aq)], play a critical role in shaping δ13CPOM values, distinguishing the East Sea from global patterns. These findings highlight the critical role of local and regional dynamics in controlling the biogeochemical cycling of organic matter in marginal seas and offer valuable insights for reconstructing past environmental changes in similar marine systems.
4.3 Biogeochemical drivers of organic matter isotopic variability
The spatial variations in δ13C values of organic matter in the East Sea reflect differences in organic matter sources, nitrogen dynamics, primary productivity, and depositional environments between coastal and offshore regions. Both Zone B (coastal) and Zone C (offshore) exhibit high TOC values; however, δ13C values in offshore areas are approximately 1‰ lower than those in coastal regions. These differences are likely driven by the complex interplay of carbon and nitrogen cycling, where enhanced nitrate utilization increases primary productivity, leading to δ13C enrichment in organic matter through preferential uptake of 12C by phytoplankton.
The particulate organic nitrogen (PON) flux from autochthonous sources (63 gN/m²/year) is nearly five times higher than that from allochthonous sources (14 gN/m²/year) (Table 2) (Kawamura et al., 2004; Park et al., 2009; Kwak et al., 2013). The δ15NPOM values in the East Sea, ranging from 3‰ to 7‰ annually, align more closely with the δ15N values of marine phytoplankton (<200 μm; 3‰–6‰) than with allochthonous inputs such as atmospheric deposition (-4‰ to 12‰; Kawamura et al., 2004), the Korea Strait (3‰; Gao et al., 2014), or the Nakdong River (8‰ to 14‰; Kang et al., 2007). These findings indicate that the nitrogen in POM is predominantly influenced by autochthonous sources synthesized in the surface ocean, which plays a significant role in shaping the δ13C values in the region.
In Zone B, higher δ13C values (-21.09‰) are observed, reflecting elevated primary productivity supported by nutrient inputs from riverine discharge, atmospheric deposition, and vertical mixing. These nutrient sources stimulate phytoplankton growth, increasing carbon demand and promoting the preferential uptake of the lighter 12C isotope. Consequently, this process enriches the remaining dissolved inorganic carbon (DIC) pool in 13C, resulting in higher δ13C values in organic matter (Rau et al., 1996; Popp et al., 1999). The moderate C/N ratio (6.30) in Zone B supports the dominance of marine phytoplankton-derived organic matter. Additionally, the δ15N values (5.02‰) in this zone indicate significant nitrate utilization, with isotopic fractionation during nitrate assimilation leading to higher δ15N values. This pattern reflects strong nitrogen demand and high productivity, which collectively explain the elevated δ13C values in coastal regions.
In contrast, Zone C exhibits lower δ13C values (-21.86‰) despite its high TOC content (1.96%), suggesting reduced primary productivity and distinct biogeochemical influences. The low C/N ratio (4.68) indicates that organic matter is primarily derived from marine phytoplankton, but the depositional and nutrient environments differ significantly from those in coastal regions. The δ15N value (4.75‰) is lower than in Zone B, suggesting weaker nitrate consumption or a dilution effect from nitrogen fixation. Nitrogen fixation introduces isotopically lighter nitrogen (-4‰ to -1‰; Sigman and Casciotti, 2001), which may contribute to the lower δ15N values in offshore regions. Furthermore, the stable depositional environment in Zone C, characterized by high mud content (99.78%), facilitates the preservation of isotopically lighter organic matter, contributing to the observed δ13C values. The reduced productivity in Zone C also results in reduced carbon demand, leaving a larger proportion of isotopically lighter DIC available for phytoplankton assimilation, further decreasing δ13C values. The enhanced preservation in Zone C may also be supported by low oxygen conditions and reduced microbial degradation in fine-grained, stable sediments. Although not directly measured, such conditions are typical in deep basin settings and should be evaluated in future studies through microbial and compositional analyses of organic matter.
The active vertical mixing in the East Sea helps explain the spatial isotopic patterns observed between Zones B and C. While mixing enhances nutrient supply in both regions, it is more effective in coastal areas such as Zone B, where it sustains higher primary productivity and contributes to enriched δ13C values. In contrast, offshore Zone C experiences more limited nutrient replenishment, resulting in lower productivity and more depleted isotopic signatures.
Although this study is based on short-term surface sediment data, we incorporated published seasonal sediment trap records to infer temporal trends in organic matter isotopic composition. We acknowledge the limitations of our temporal resolution and recommend future studies that integrate sediment cores and long-term observations to better constrain the seasonal and interannual dynamics of carbon and nitrogen cycling.
Overall, our results emphasize the importance of integrating δ13C, δ15N, and C/N ratios to characterize organic matter dynamics. The contrasting isotopic patterns between Zones B and C reflect differences in productivity, nitrate utilization, and depositional conditions. While environmental variables such as temperature, salinity, and oxygen were not directly measured, they likely affect microbial degradation and preservation, and should be incorporated into future research to provide a more mechanistic understanding of organic matter cycling in the East Sea. Compared to other marginal seas such as the Yellow Sea and the South China Sea, the East Sea exhibits distinctive biogeochemical and sedimentological features due to its semi-enclosed geometry, greater water depth, and pronounced vertical mixing. While the Yellow Sea is characterized by high riverine input, shallow depths, and extensive mudflats that promote terrestrial organic matter deposition, the East Sea supports higher primary productivity and more efficient organic matter preservation in deeper, low-energy environments. These regional differences underscore the need to consider local environmental settings when assessing organic matter sources and cycling across marginal marine systems.
5 Conclusion
This study presents a comprehensive analysis of organic matter dynamics in East Sea sediments, focusing on spatial variations in TOC, δ13Corg, C/N ratios, and δ15Norg. The findings reveal that autochthonous POM derived from marine phytoplankton is the primary source of organic matter, with δ13C values (-23.15‰ to -20.33‰) closely aligning with isotopic signatures of phytoplankton. Contributions from allochthonous POM—primarily via atmospheric deposition, the TWC, and riverine inputs—are relatively minor compared to the dominant autochthonous production.
Distinct regional differences were observed, with Zone B (coastal regions) exhibiting higher primary productivity, enriched δ13Corg values (-21.09‰), and significant nitrate utilization, as reflected by δ15Norg values (5.02‰). In contrast, Zone C (central Ulleung Basin) displayed more depleted δ13Corg values (-21.86‰), indicative of reduced productivity, weaker nutrient utilization, and the preservation of isotopically lighter organic matter under stable depositional conditions.
Seasonal variability in δ13Corg values aligns with periods of elevated primary productivity during spring and autumn, underscoring the influence of chlorophyll-a concentrations and nutrient dynamics on isotopic signatures. Moreover, global patterns of δ13C and δ15N variations highlight the significance of local environmental factors, such as surface water concentrations [CO2(aq)] and hydrodynamic energy, in shaping the isotopic composition of organic matter.
To further expand on these insights, other marginal seas with differing hydrodynamic and depositional settings can be explored in future research to test the applicability of the observed patterns. Investigating the impacts of climate change on POM dynamics, particularly regarding changes in productivity and nutrient availability, would also be crucial. Furthermore, advancing isotopic measurement techniques and conducting high-resolution sediment core studies could refine our ability to trace past environmental changes and improve our understanding of biogeochemical processes in diverse marine environments.
Future oceanographic changes, including warming-induced stratification and acidification, may alter productivity regimes and organic matter preservation efficiency in the East Sea. These changes could impact δ13C and δ15N signatures, highlighting the need for long-term monitoring and modeling efforts.
Statements
Data availability statement
The original contributions presented in the study are included in the article/Supplementary Material. Further inquiries can be directed to the corresponding author.
Author contributions
JC: Data curation, Formal analysis, Methodology, Writing – original draft, Writing – review & editing. B-YY: Data curation, Funding acquisition, Investigation, Project administration, Resources, Writing – review & editing. YK: Data curation, Formal analysis, Investigation, Methodology, Writing – review & editing. E-JJ: Data curation, Formal analysis, Investigation, Methodology, Writing – review & editing. I-KU: Data curation, Investigation, Methodology, Project administration, Writing – review & editing.
Funding
The author(s) declare that financial support was received for the research and/or publication of this article. This study was supported by Korea Institute of Marine Science & Technology Promotion (KIMST) funded by the Ministry of Oceans and Fisheries (RS-2022-KS221578). This study was also supported by Digital transformation (DX) of national geological thematic maps and research on promising and hazardous elements from bedrock (GP2025-037) of the Korea Institute of Geoscience and Mineral Resources.
Conflict of interest
The authors declare that the research was conducted in the absence of any commercial or financial relationships that could be construed as a potential conflict of interest.
Generative AI statement
The author(s) declare that no Generative AI was used in the creation of this manuscript.
Publisher’s note
All claims expressed in this article are solely those of the authors and do not necessarily represent those of their affiliated organizations, or those of the publisher, the editors and the reviewers. Any product that may be evaluated in this article, or claim that may be made by its manufacturer, is not guaranteed or endorsed by the publisher.
Supplementary material
The Supplementary Material for this article can be found online at: https://www.frontiersin.org/articles/10.3389/fmars.2025.1571191/full#supplementary-material
References
1
Altabet M. A. (1996). “Nitrogen and carbon isotopic tracers of the source and transformation of particles in the deep-sea,” in Particle Flux in the Ocean. Eds. IttekkotV.SchäferP.HonjoS.DepetrisP. J. (Wiley, London), 155–184.
2
Altabet M. A. Francois R. (1994). Sedimentary nitrogen isotopic ratio as a recorder for surface ocean nitrate utilization. Global Biogeochemical Cycles8, 103–116. doi: 10.1029/93GB03396
3
Altabet M. A. Pilskaln C. Thunell R. Pride C. Sigman D. Chavez F. et al . (1999). The nitrogen isotope biogeochemistry of sinking particles from the margin of the eastern North Pacific. Deep-Sea Res. Part I46, 655–679. doi: 10.1016/S0967-0637(98)00084-3
4
Bae S. W. Lee K. E. Kim K. (2015). Use of carbon isotopic composition of alkenone as a CO2 proxy in the East Sea/Japan Sea. Continental Shelf Res.107, 24–32. doi: 10.1016/j.csr.2015.07.010
5
Blott S. J. Pye K. (2001). GRADISTAT: A grain size distribution and statistics package for the analysis of unconsolidated sediments. Earth Surface Processes and Landforms26 (11), 1237–1248. doi: 10.1002/esp.261
6
Broecker W. S. Spencer D. W. Craig H. (1982). GEOSECS Pacific Expedition: Hydrographic data 1973-1974. (Washington, D.C.: National Science Foundation, US Government Printing Office), 1–137. Available online at: https://hdl.handle.net/10013/epic.42895.d001.
7
Cline J. D. Kaplan I. R. (1975). Isotopic fractionation of dissolved nitrate during denitrification in the Eastern Tropical North Pacific. Marine Chem.3, 271–299. doi: 10.1016/0304-4203(75)90009-2
8
Degens E. T. Guillard R. R. L. Sackett W. M. Hellebust J. A. (1968). Metabolic fractionation of carbon isotopes in marine plankton—I. Temperature and respiration experiments. Deep-Sea Res.15, 1–9. doi: 10.1016/0011-7471(68)90024-7
9
Deines P. (1980). “The isotopic composition of reduced organic carbon,” in Handbook of Environmental Isotope Geochemistry, Volume 1, The Isotopic Composition of Reduced Organic Carbon. Eds. FritzP.Ch. FontesJ. (New York: Elsevier Science), 329–406. doi: 10.1016/B978-0-444-41780-0.50015-8
10
Descolas-Gros C. Fontugne M. R. (1990). Stable carbon isotope fractionation by marine phytoplankton during photosynthesis. Plant Cell Environ.13, 207–218. doi: 10.1111/j.1365-3040.1990.tb01305.x
11
Descolas-Gros C. Fortugne M. R. (1985). Carbon fixation in marine phytoplankton: carboxylase activities and stable carbon isotope ratios; physiological and paleoclimatological aspects. Marine Biol.87, 1–6. doi: 10.1007/BF00396999
12
Duce R. A. Liss P. Merrill J. Atlas E. Buat-Menard P. Hicks B. et al . (1991). The atmospheric input of trace species to the world ocean. Global Biogeochemical Cycles5, 193–259. doi: 10.1029/91GB01778
13
Eppley R. W. Peterson B. J. (1979). Particulate organic matter flux and planktonic new production in the deep ocean. Nature282, 677–680. doi: 10.1038/282677a0
14
Farrell J. W. Pedersen T. F. Calvert S. E. Nielsen B. (1995). Glacial-interglacial changes in nutrient utilization in the equatorial Pacific Ocean. Nature377, 514–518. doi: 10.1038/377514a0
15
Francois R. Altabet M. A. Burckle L. H. (1992). Glacial to interglacial changes in surface nitrate utilization in the Indian sector of the Southern Ocean as recorded by sediment δ15N. Paleoceanography7, 589–606. doi: 10.1029/92PA01573
16
Gao L. Li D. Ishizaka J. (2014). Stable isotope ratios of carbon and nitrogen in suspended organic matter: Seasonal and spatial dynamics along the Changjiang (Yangtze River) transport pathway. J. Geophysical Research: Biogeosciences119, 1717–1737. doi: 10.1002/2013JG002487
17
Guo L. Tanaka T. Wang D. Tanaka N. Murata A. (2004). Distributions, speciation and stable isotope composition of organic matter in the southeastern Bering Sea. Marine Chem.91, 211–226. doi: 10.1016/j.marchem.2004.07.002
18
Hinga K. R. Arthur M. A. Pilson M. E. Q. Whitaker D. (1994). Carbon isotope fractionation by marine phytoplankton in culture: the effects of CO2 concentration, pH, temperature and species. Global Biogeochemical Cycles8, 91–102. doi: 10.1029/93GB03393
19
Hsu S. C. Liu S. C. Arimoto R. Liu T. H. Huang Y. T. Tsai F. et al . (2009). Dust deposition to the East China Sea and its biogeochemical implications. J. Geophysical Res.114, D15304. doi: 10.1029/2008JD011223
20
Hung C. C. Tseng C. W. Gong G. C. Chen K. S. Chen M. H. Hsu S. C. (2013). Fluxes of particulate organic carbon in the East China Sea in summer. Biogeosciences10, 6469–6484. doi: 10.5194/bg-10-6469-2013
21
Im D. H. Wi J. H. Suh H. L. (2015). Evidence for ontogenetic feeding strategies in four calanoid copepods in the East Sea (Japan Sea) in summer, revealed by stable isotope analysis. Ocean Science Journal50, 481–490. doi: 10.1007/s12601-015-0044-y
22
Jasper J. Hayes J. (1990). A carbon isotope record of CO2 levels during the late Quaternary. Nature347, 462–464. doi: 10.1038/347462a0
23
Kang C. K. Choy E. J. Paik S. K. Park H. J. Lee K. S. An S. (2007). Contributions of primary organic matter sources to macroinvertebrate production in an intertidal salt marsh (Scirpus triqueter) ecosystem. Marine Ecol. Prog. Ser.334, 131–143. doi: 10.3354/meps334131
24
Kawamura K. Kobayashi M. Tsubonuma N. Mochida M. Watanabe T. Lee M. (2004). “Organic and inorganic compositions of marine aerosols from east Asia: Seasonal variations of water-soluble dicarboxylicacids, major ions, total carbon and nitrogen, and stable C and N isotopic composition,” in Geochemical Investigations in Earth and Space Science: A Tribute to Isaac R. Kaplan. Eds. HillR. J.LeventhalJ.AizenshtatZ.BaedeckerM. J.GlaypoolG.EganhouseR.GoldhaberM.PetersK. (The Geochemical Society, Elsevier, New York), 243–265.
25
Kim M. Hwang J. Rho T. Lee T. Kang D. J. Chang K. I. et al . (2017). Biogeochemical properties of sinking particles in the southwestern part of the East Sea (Japan Sea). J. Marine System167, 33–42. doi: 10.1016/j.jmarsys.2016.11.001
26
Kwak J. H. Lee S. H. Park H. J. Choy E. J. Jeong H. D. Kim K.-R. et al . (2013). Monthly measured primary and new productivities in the Ulleung Basin as a biological “hot spot” in the East/Japan Sea. Biogeosciences10, 4405–4417. doi: 10.5194/bg-10-4405-2013
27
Lamb A. L. Wilson G. P. Leng M. J. (2006). A review of coastal palaeoclimate and relative sea-level reconstructions using δ13C and C/N ratios in organic material. Earth-Science Rev.75, 29–57. doi: 10.1016/j.earscirev.2005.10.003
28
Laws E. A. Popp B. N. Bidigare R. R. Kennicutt M. C. Macko S. A. (1995). Dependence of phytoplankton carbon isotopic composition on growth rate and [CO2]aq: theoretical considerations and experimental results. Geochimica Cosmochimica Acta59, 1131–1138. doi: 10.1016/0016-7037(95)00030-4
29
Lee T. Kim D. Khim B. K. Choi D. L. (2010). Organic carbon cycling in Ulleung Basin sediments, East Sea. Ocean Polar Res.32, 145–156. doi: 10.4217/OPR.2010.32.2.145
30
Lee S. H. Son S. Dahms H. U. Park J. W. Lim J. H. Noh J. H. et al . (2014). Decadal changes of phytoplankton chlorophyll-a in the East Sea/Sea of Japan. Oceanology54, 771–779. doi: 10.1134/S0001437014060058
31
Lee D. K. Niiler P. (2005). The energetic surface circulation of the Japan/East Sea. Deep-Sea Research II52, 1547–1563. doi: 10.1016/j.dsr2.2003.08.008
32
Lutz M. Dunbar R. Caldeira K. (2002). Regional variability in the vertical flux of particulate organic carbon in the ocean interior. Global Biogeochemical Cycles16, 1037. doi: 10.1029/2000GB001383
33
Minoura K. Hoshino K. Nakamura T. Wada E. (1997). Late Pleistocene–Holocene paleoproductivity circulation in the Japan Sea: sea-level control on δ13C and δ15N records of sediment organic material. Palaeography Palaeoclimatology Palaeoecol.135, 41–50. doi: 10.1016/S0031-0182(97)00026-6
34
Mook W. G. Bommerson J. C. Staverman W. H. (1974). Carbon isotope fractionation between dissolved bicarbonate and gaseous carbon dioxide. Earth Planetary Sci. Lett.22, 169–176. doi: 10.1016/0012-821X(74)90078-8
35
Nakatsuka T. Handa N. Harada N. Sugimoto T. Imaizumi S. (1997). Origin and decomposition of sinking particulate organic matter in the deep water column inferred from the vertical distributions of its δ15N, δ13C and δ14C. Deep-Sea Res. I44, 1957–1979. doi: 10.1016/S0967-0637(97)00051-4
36
Ohashi M. (1999). The origin of nitrogen in the marginal sea using stable isotope analysis. Master’s Thesis, Hokkaido University, pp. 73 (in Japanese).
37
Park S. R. Kim J. H. Kang C. K. An S. Chung I. K. Kim J. H. et al . (2009). Current status and ecological roles of Zostera marina after recovery from large-scale reclamation in the Nakdong River estuary, Korea. Estuarine Coastal Shelf Sci.81, 38–48. doi: 10.1016/j.ecss.2008.10.003
38
Park S. C. Yoo D. G. Lee K. W. Lee H. H. (1999). Accumulation of recent mud associated with coastal circulations, southeastern Korea Sea (Korea Strait). Continental Shelf Res.19, 589–608. doi: 10.1016/S0278-4343(98)00106-X
39
Popp B. N. Trull T. Kenig F. Wakeham S. G. Rust T. M. Tilbrook B. et al . (1999). Controls on the carbon isotopic composition of Southern ocean phytoplankton. Global Biogeochemical Cycles13, 827–843. doi: 10.1029/1999GB900041
40
Rau G. H. Riebesell U. Wolf-Gladrow D. (1996). A model of photosynthetic 13C fractionation by marine phytoplankton based on diffusive molecular CO2 uptake. Marine Ecol. Prog. Ser.133, 275–285. doi: 10.3354/meps133275
41
Rau G. H. Takahashi T. Des Marais D. J. Repeta D. J. Martin J. H. (1992). The relationship between δ13C of organic matter and [CO2(aq)] in ocean surface water: Data from a JGOFS site in the northeast Atlantic Ocean and a model. Geochimica Cosmochimica Acta56, 1413–1419. doi: 10.1016/0016-7037(92)90073-R
42
Rau G. H. Takahashi T. Des Maris D. J. (1989). Latitudinal variations in plankton δ13C: Implications for CO2 and productivity in past oceans. Nature341, 516–518. doi: 10.1038/341516a0
43
Sackett W. M. Eckelmann W. R. Bender M. L. Be A. W. H. (1965). Temperature dependence of carbon isotopie composition in marine plankton and sediments. Science148, 235–237. doi: 10.1126/science.148.3667.235
44
Sackett W. M. Thompson R. R. (1963). Isotope organic carbon composition of recent continental derived clastic sediments of the eastern Gulf of Mexico. AAPG Bull.47, 525–531. Available online at: https://www.scirp.org/journal/paperinformation?paperid=79935.
45
Sigman D. M. Casciotti K. L. (2001). “Nitrogen isotopes in the ocean,” in Encyclopedia of Ocean Sciences. Eds. SteeleJ. H.TurekianK. K.ThorpeS. A. (Elsevier, New York), 1884–1894.
46
Talley L. D. Lobanov V. Ponomarev V. Salyuk A. Tishchenko P. Zhabin I. et al . (2003). Deep convection and brine rejection inthe Japan Sea. Geophysical Res. Lett.30, 1159. doi: 10.1029/2002GL016451
47
Wada E. (1980). “Nitrogen isotope fractionation and its significance in biogeochemical processes occurring in marine environments,” in Isotope Marine Chemistry. Eds. GoldbergE. D.HoribeY. (Uchida Rokakuho, Tokyo), 375–398.
48
Wada E. Hattori A. (1978). Nitrogen isotope effects in the assimilation of inorganic nitrogenous compounds by marine diatoms. Geomicrobiology J.1, 85–101. doi: 10.1080/01490457809377725
49
Wakeham S. G. Lee C. (1993). “Production, transport, and alteration of particulate organic matter in the marine water column,” in Organic Geochemistry, Principles and applications. Eds. EngelM. H.MackoS. A. (Plenum Press, New York), 145–169.
50
Waser N. A. D. Harrison P. J. Nielson B. Calvert S. E. Turpin D. H. (1998). Nitrogen isotope fractionation during the uptake and assimilation of nitrate, nitrite, ammonium, and urea by a marine diatom. Limnology Oceanography43, 215–224. doi: 10.4319/lo.1998.43.2.0215
51
Wong W. W. Sackett W. M. (1978). Fractionation of stable carbon isotopes by marine phytoplankton. Geochimica Cosmochimica Acta42, 1809–1815. doi: 10.1016/0016-7037(78)90236-3
52
Wu Y. Zhang J. Li D. J. Wei H. Lu R. X. (2003). Isotope variability of particulate organic matter at the PN Section in the East China Sea. Biogeochemistry65, 31–49. doi: 10.1023/A:1026044324643
53
Yasuda S. Akagi T. Naraoka H. Kitajima F. Takahashi K. (2016). Carbon isotope ratios of organic matter in Bering Sea settling particles: Extremely high remineralization of organic carbon derived from diatoms. Geochemical J.50, 241–248. doi: 10.2343/geochemj.2.0411
Summary
Keywords
marginal seas, organic matter, primary productivity, sedimentary processes, biogeochemical cycling
Citation
Choi J, Yi B-Y, Kim Y, Jeong E-J and Um I-K (2025) Spatial variations in organic matter sources and biogeochemical processes in the East Sea. Front. Mar. Sci. 12:1571191. doi: 10.3389/fmars.2025.1571191
Received
05 February 2025
Accepted
28 April 2025
Published
22 May 2025
Volume
12 - 2025
Edited by
Armstrong-Altrin John S., National Autonomous University of Mexico, Mexico
Reviewed by
Siddhartha Sarkar, University of Antwerp, Belgium
Qian Tian, Chinese Academy of Sciences (CAS), China
Mayla Ramos, Instituto Potosino de Investigación Científica y Tecnológica (IPICYT), Mexico
Updates
Copyright
© 2025 Choi, Yi, Kim, Jeong and Um.
This is an open-access article distributed under the terms of the Creative Commons Attribution License (CC BY). The use, distribution or reproduction in other forums is permitted, provided the original author(s) and the copyright owner(s) are credited and that the original publication in this journal is cited, in accordance with accepted academic practice. No use, distribution or reproduction is permitted which does not comply with these terms.
*Correspondence: Jiyoung Choi, jychoi@kigam.re.kr
Disclaimer
All claims expressed in this article are solely those of the authors and do not necessarily represent those of their affiliated organizations, or those of the publisher, the editors and the reviewers. Any product that may be evaluated in this article or claim that may be made by its manufacturer is not guaranteed or endorsed by the publisher.