Abstract
Long-term change monitoring of marine floating raft aquaculture (MFRA) in Jiangsu Province is urgently needed to support aquaculture restructuring and protect the regional marine environment. Optical remote sensing images have been widely used in the extraction of MFRA but are usually limited by cloudy and rainy weather conditions. Compared with optical images, Synthetic Aperture Radar (SAR) can acquire images even under dense cloud cover, offering a reliable alternative. However, existing studies mainly focused on limited geographic areas and didn’t consider different types of MFRA. This study proposes an automatic framework for monitoring MFRA based on multi-source SAR imagery. To achieve a better extraction of MFRA, two key enhancements were introduced. First, the SDWI and SDRI indices were utilized to effectively differentiate MFRA from seawater. Second, a deep learning framework termed Boundary-Enhancing Swin Transformer (BE-Swin) was developed for extracting different types of MFRA. Results showed that (1) Combining ALOS-1 and Sentinel-1 data enabled mapping the long-term dynamics of the MFRA in Jiangsu province, China. (2) Compared with other deep neural network models, the BE-Swin model improved the extraction accuracy by incorporating 3 key modules within the Swin Transformer. The BE-Swin model enhances boundary extraction, reducing errors, omissions, and adhesion issues. (3) MFRA in Jiangsu Province is distributed in Haizhou Bay of Lianyungang, the radial ridge group region of Yancheng, and the northern coast of Nantong. From 2008 to 2022, raft aquaculture in the coastal region of Jiangsu Province experienced rapid expansion followed by gradual contraction. (4) MFRA in Jiangsu Province can be categorized into three types, pole-pixed, semi-floating, and full-floating raft aquaculture. The area of pole-fixed raft aquaculture steadily increased, reaching 171.38 km2 in 2022. Semi-floating raft aquaculture peaked at 318.36 km2 in 2015 but was reduced by nearly half in 2022. Full-floating raft aquaculture was initially absent but has shown a trend toward large-scale adoption, reaching 78.42 km2 in 2022.
1 Introduction
Over the past decade, marine aquaculture has been recognized as a pivotal strategy for sustainable development by ensuring food security through high-yield protein production, stimulating coastal economies with diversified aquatic species, and mitigating ecological pressures via integrated bioremediation. According to the Food and Agriculture Organization (FAO, 2022), global aquaculture production increased by 609% between 1990 and 2020, corresponding to a compound annual growth rate (CAGR) of 6.7%. The total live weight was 122.6 million tons and marine aquaculture accounted for 33.6 million tons in 2020. The expansion of aquaculture production within the context of fishery production is occurring at a rate that outpaces that of capture fisheries. Aquaculture represented 49% of global aquatic food production in 2022, making it the second-largest contributor after capture fisheries and a major source of food for human consumption. China is a key player in global seafood production, consumption, and trade, with aquaculture production accounting for 60% of total global exports (Crona et al., 2020). However, the rapid expansion of aquaculture has brought huge economic effects to coastal areas while at the same time triggering a series of ecological trade-offs, resulting in adverse consequences such as water pollution (Anh et al., 2010), heavy metal contamination (Emenike et al., 2022), the shrinkage or disappearance of natural wetlands (Sun et al., 2020), and the destruction of natural habitats (Duan et al., 2021). Aquaculture monitoring is a critical prerequisite for mitigating the ecological externalities of its rapid development.
As a critical offshore aquaculture system, marine floating raft aquaculture (MFRA) enables high-density cultivation across diverse coastal zones and supports the growth of multiple species of marine organisms. It is one of the types of aquaculture activities commonly found in coastal zone areas. The coastal zone typically encompasses the marine area near the land and the adjacent land, serving as an ecotone between terrestrial and marine ecosystems. It is rich in blue carbon and plays a vital role in maintaining biodiversity and biogeochemical cycles. Jiangsu Province is located in the middle of the coastal area of mainland China and the Yangtze and Huai River deltas, with vast intertidal mudflats and inland and coastal waters that provide unique conditions for the development of aquaculture. In the coastal zone of Jiangsu Province, aquaculture is widely distributed, with MFRA being one of the key types. Each type of MFRA exhibits distinct structural characteristics, cultured species, environmental impacts, and management requirements. The growing diversity of aquaculture types has increased the complexity of scientific monitoring and policy management for MFRA, highlighting the need for the further refinement of MFRA classification. To effectively restructure aquaculture and protect the marine environment, it is essential to understand the spatial distribution and dynamic change patterns of marine aquaculture in the Jiangsu Province.
Initially, marine aquaculture monitoring relied on manual surveys, which were time-consuming, laborious, and time-sensitive. The widespread application of remote sensing technology in this field highlights the advantages of new technologies, offering large-scale, highly efficient, and dynamic monitoring services. These technologies are particularly useful for monitoring and extracting information on the widely dispersed aquaculture in coastal areas. Currently, a significant number of optical remote sensing images have been widely used in the extraction of MFRA. Traditional methods were commonly used in this field in the early days, Liu et al. (2020) used an unsupervised classification algorithm and visual interpretation combined method to extract the area of Chinese coastal raft cage aquaculture in 2018 from Landsat 8 imagery. Román (Román et al. (2023) utilized a novel GIS-based analysis method to assess the potential of high-resolution unmanned aerial vehicle (UAV) multispectral data for retrieving spatial information on oyster farming structures, using Bourgneuf Bay as a case study. With the development of the algorithmic field, automated techniques have been introduced for mariculture monitoring, for example, Quaade et al. (2024) proposed an efficient and scalable computer vision method by fine-tuning the YOLOv5 model to successfully quantify the spatial and temporal distribution and production of mariculture cages in the French Mediterranean using Google Earth imagery and the BD ORTHO series of aerial images.
However, in cloudy regions, particularly in tropical and coastal areas, obtaining large-scale, long-term time series optical remote sensing images is challenging due to the limited ability of optical imagery to penetrate clouds, rain, and fog. Compared with optical images, Synthetic Aperture Radar (SAR) can acquire image data from any site around the clock, even in the presence of dense cloud cover. Furthermore, radar waves generate a higher backscatter response from aquaculture structures compared to surrounding water surfaces (Travaglia et al., 2004), enabling the identification and distinction of aquaculture structures from other natural and man-made features. Therefore, various SAR data have also been employed to extract marine aquaculture information. Lee et al. (2006) employed Airborne Synthetic Aperture Radar (AIRSAR) data and Japanese Earth Resources Satellite (JERS-1) data to examine the unique structure of oyster farms located in Korea. Choe et al. (2012) used RADARSAT-2 and ALOS-1 full-polarimetric SAR data to monitor the distribution of oyster reefs in the intertidal zones of Jebu Island and Hampyung Bay off the west coast of Korea. Zhang et al. (2020) proposed a segmentation network combined with a non-subsampling contour transform (NSCT) separation network, which effectively extracted MFRA from Sentinel-1 images. Gao et al. (2022) proposed a D-ResU-Net semantic segmentation model to extract MFRA in Changhai County, Liaoning Province, China. Liu et al. (2023) proposed a dual-branch hybrid coding network (DBHE-Net) segmentation method based on GF-3 full polarimetric SAR images, which effectively integrates the local perceptive ability of CNN and the global expressive ability of Transformer for raft aquaculture type recognition. Chen and Li (2024) proposed a specially tailored deep learning-based network (MAZNet) for the problem of automatically extracting MAZs from the Sentinel-1 C band, which performs input optimization and model structure enhancement based on polarization and raft structure features. Despite the considerable enhancement in monitoring capability that has been achieved in cloudy areas by the SAR technique, its resolution limitation and model generalization problem constrain the large-scale application of the technique. Consequently, there is a necessity for the future integration of multi-source data fusion and time series analysis in order to construct a dynamic monitoring framework that achieves a balance between accuracy and timeliness. Additionally, many existing studies didn’t consider different types of MFRA. However, long-term change monitoring of MFRA in Jiangsu Province is urgently needed to effectively restructure aquaculture and protect the marine environment in the region.
To address these issues, the specific objectives of this research were as follows:(1) to verify the reliability of using ALOS-1 and Sentinel-1 SAR images for dynamic monitoring of MFRA in Jiangsu Province from 2008 to 2022; (2) to develop a deep neural network tailored for extracting different types of the MFRA from dual-polarized SAR imagery; (3) to obtain MFRA datasets and analyze the distribution and change in marine aquaculture in Jiangsu Province from 2008 to 2022. The research results are expected to provide reference and insight for the green development of marine aquaculture and marine ecological environment protection.
2 Study area and data
2.1 Study area
As a pivotal coastal province in eastern China, Jiangsu features a 954-kilometer coastline, with its jurisdictional waters strategically positioned at the intersection of the southern Yellow Sea and the northern East China Sea (Xu et al., 2022). Along this coastline lie approximately 500,000 hectares of developed coastal wetlands and intertidal mudflats, forming an exceptional natural foundation for modern mariculture development. Three coastal cities—Lianyungang, Yancheng, and Nantong—are situated sequentially from north to south. Our study focused on the MFRA and the distance between the farthest floating raft aquaculture area and the coastline is about 40 km. Thus, the study area was defined as a 40-km wide offshore buffer established in the direction of the deep sea based on the year-by-year administrative coastline of Jiangsu Province.
The study area predominantly features three mariculture configurations (Figure 1): (1) Pole-fixed raft culture employs bamboo or wooden stakes as supporting structures, securing cages or cultivation panels via synthetic fiber cables. This configuration demonstrates enhanced wave resistance, making it suitable for high-energy coastal waters with sandy or rocky substrates; (2) Semi-floating raft culture integrates raft frames with mesh panels, achieving tidal-level self-adaptation through polyurethane buoys and adjustable support poles. This system optimizes production efficiency in intertidal zones, maintaining 4–6 hours daily emersion periods; (3) Full-floating raft culture adopts an anchored storm-resistant configuration comprising high-density polyethylene frameworks, polyurethane floaters and depth-adjustable cultivation cages. The corresponding cultured species for each type of MFRA as illustrated in Table 1.
Figure 1
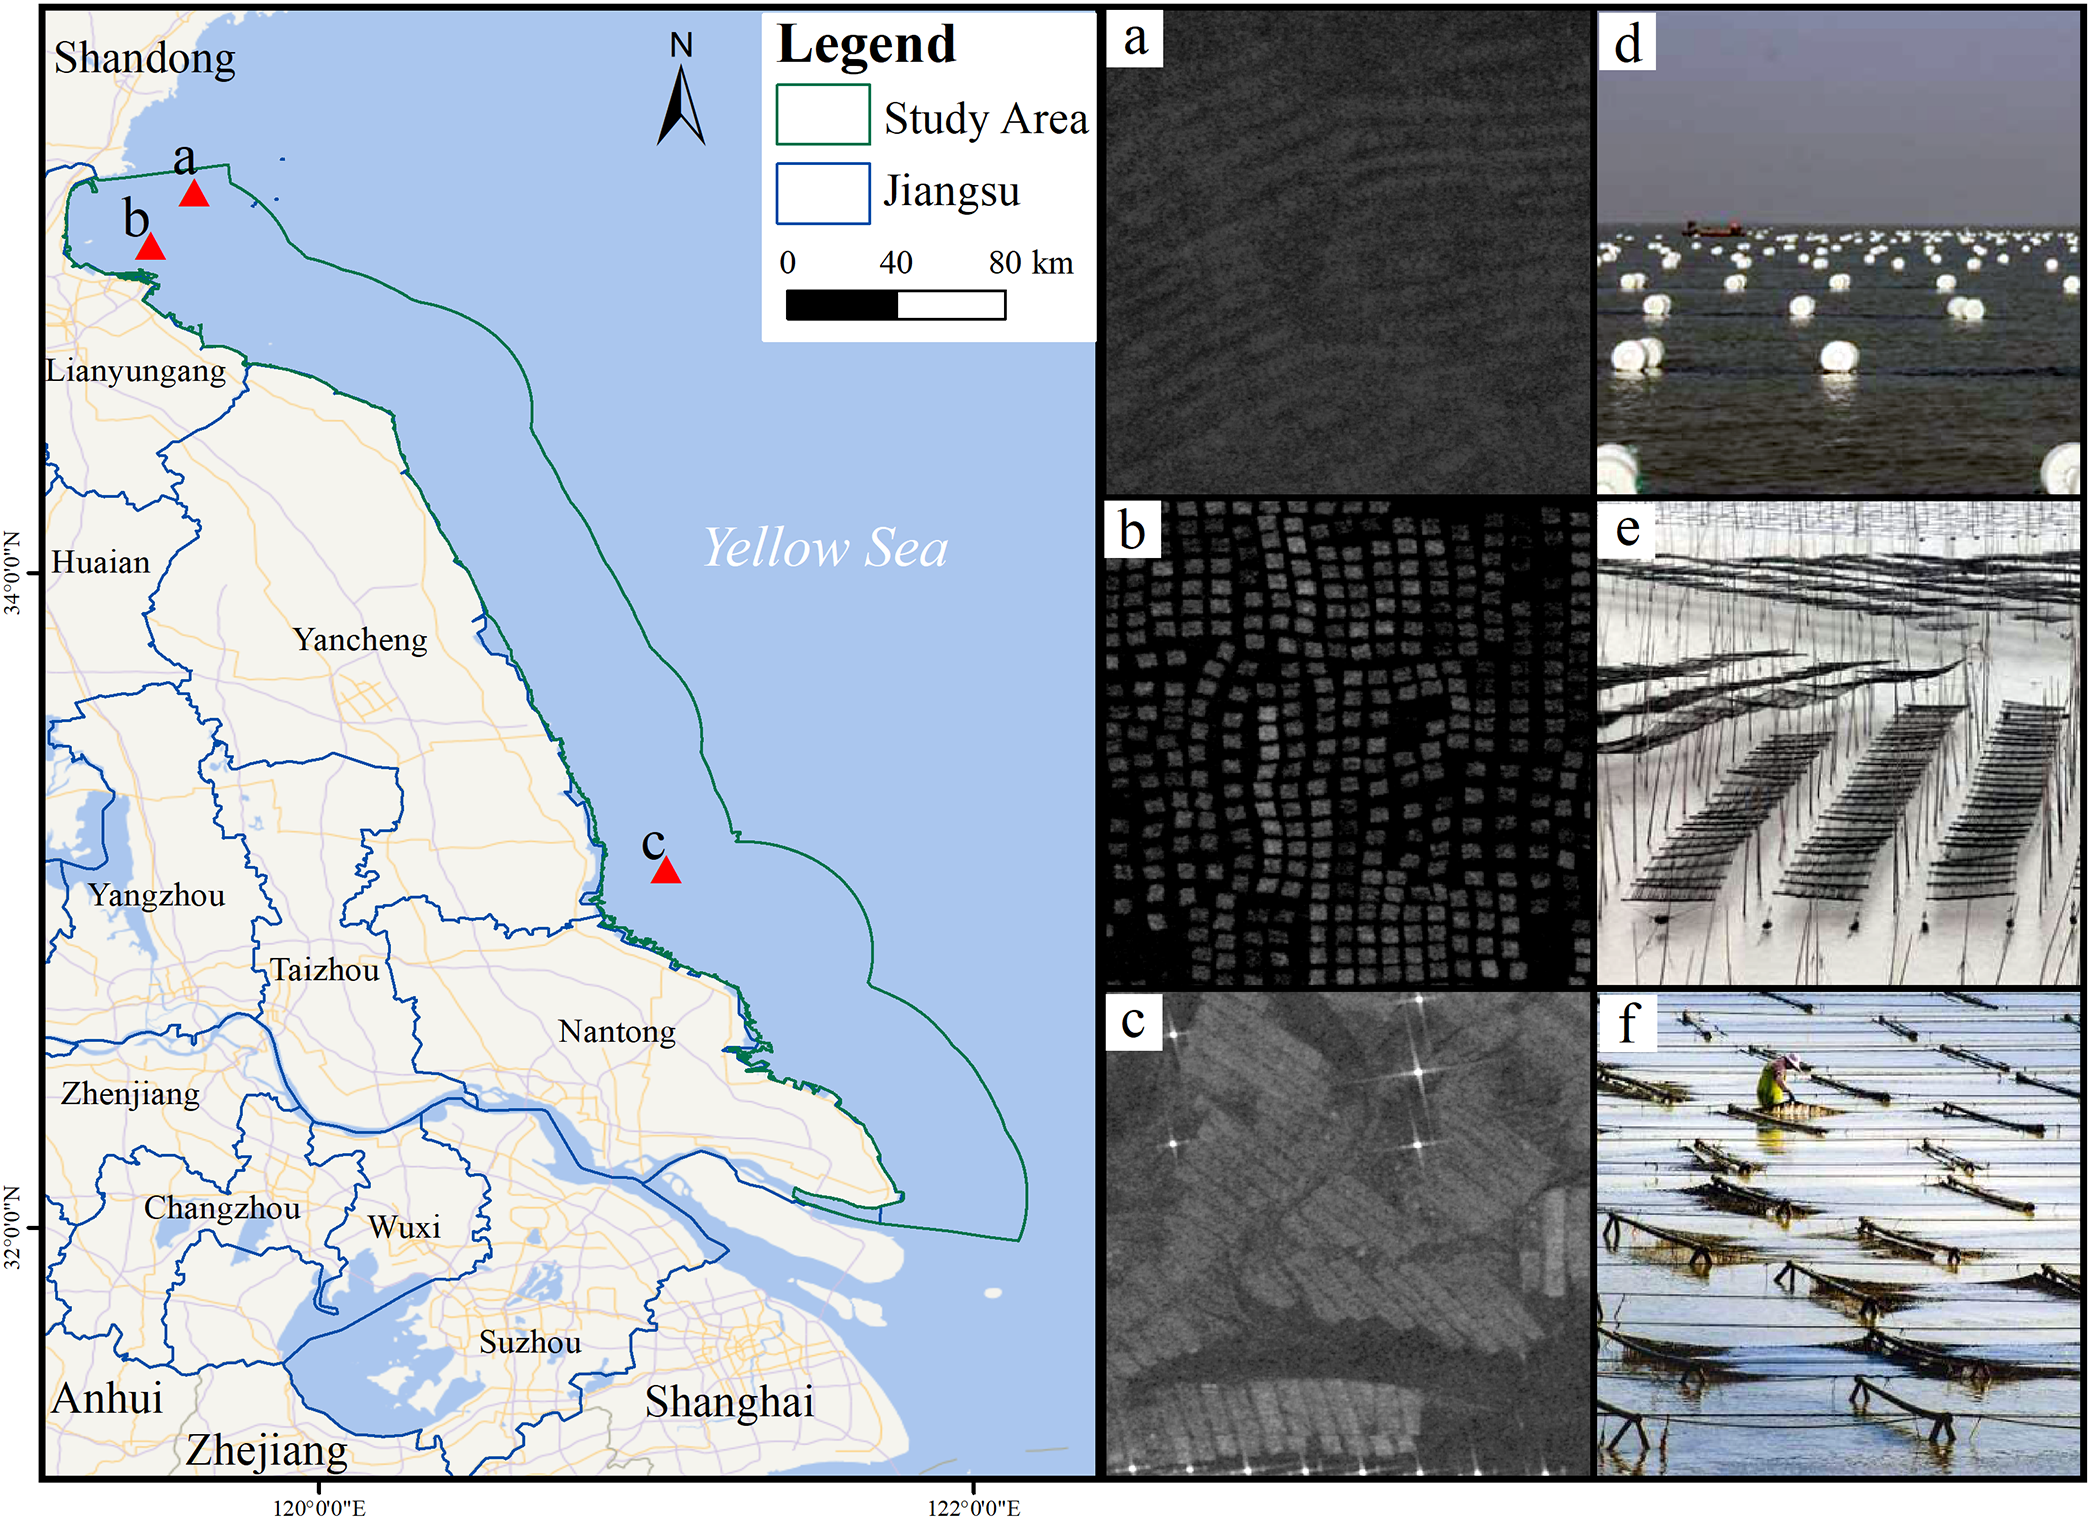
The scope of the study area (Left) and three types of MFRA: (Right b, e)Pole-pixed raft aquaculture, (Right c, f)semi-floating raft aquaculture, and (Right a, d)full-floating raft aquaculture.
Table 1
| Type of MFRA | Cultured Species |
|---|---|
| Pole-fixed Raft Culture | Laver |
| Semi-floating Raft Culture | Laver |
| Full-floating Raft Culture | Mussel, oyster and rapana venosa |
The corresponding cultured species for each type of MFRA.
2.2 Data
2.2.1 ALOS-1 data
The Advanced Land Observing Satellite-1 (ALOS-1), launched by the Japan Aerospace Exploration Agency (JAXA) in January 2006, retired in 2011, was equipped with two optical instruments and a phased Array L-band SAR (PALSAR). PALSAR sensor is capable of being operated in five different observing modes: fine beam single polarization (FBS), fine beam double polarization (FBD), quad polarization mode (POL), ScanSAR mode, and direct transmission (DT) mode (Rosenqvist et al., 2007). The ALOS-1 PALSAR images used in this study have a spatial resolution of 15 meters and a revisit period of approximately 46 days. a total of 249 dual-polarization (HH and HV) images, selected from January to March 2008, were obtained. ENVI SARscape software was used for pre-processing, including orbit correction, thermal noise removal, radiometric calibration, speckle filtering, terrain correction, geocoding, and conversion to dB.
2.2.2 Sentinel-1 data
The Sentinel-1 mission, managed by the European Space Agency (ESA), comprises a constellation of two satellites, the first of which was launched on 3 April 2014, each equipped with a C-band synthetic aperture radar (SAR). This configuration enables the satellites to provide all-weather, day-and-night imagery of Earth’s surface. There are four modes of Sentinel-1 operational imaging: interferometric wide swath mode (IW), wave mode (WV), stripmap(SM), and ultra-wide swath mode (EW). A total of 63 and 48 dual-polarized (VV and VH) interferometric wide swath (IW) GRD images from January to March 2015 and 2022, respectively, were acquired via Google Earth Engine (GEE). The Sentinel-1 SAR GRD images used in this study have a spatial resolution of 10 meters and a revisit period of approximately 12 days. All images underwent standard pre-processing steps, including orbit correction, thermal noise removal, radiometric calibration, speckle filtering, terrain correction, geocoding, and conversion to decibel (dB).
2.2.3 Other auxiliary data
Coastline data for Jiangsu Province were derived from the East Asian Monsoon Eco-geographic Zone Boundary dataset published by the Institute of Geographic Sciences and Natural Resources Research, Chinese Academy of Sciences (Liu and Shi, 2015). Mariculture data from the Fishery Statistical Yearbook of Jiangsu Province for 2015 to 2022 was collected from the Ministry of Agriculture and Rural Affairs of the People’s Republic of China(https://www.moa.gov.cn/), to evaluate the accuracy of the extraction results for MFRA.
3 Model and methodology
In this study, an automatic framework for monitoring of MFRA based on multi-source SAR imagery was proposed. The framework is described in Figure 2, which includes four main steps: (1) Data collection and preprocessing, (2) Model training and accuracy assessment, (3) Result prediction and MFRA extraction, (4) Spatial analysis and dynamic monitoring. To achieve a better extraction of MFRA, two improvements were introduced in the framework. Firstly, the SDWI and SDRI indices were introduced to accurately distinguish MFRA and seawater. Secondly, a deep learning-based network was developed for extracting different types of MFRA from dual-polarized SAR imagery. To further explain the workflow, the model and methodology are described in detail below.
Figure 2
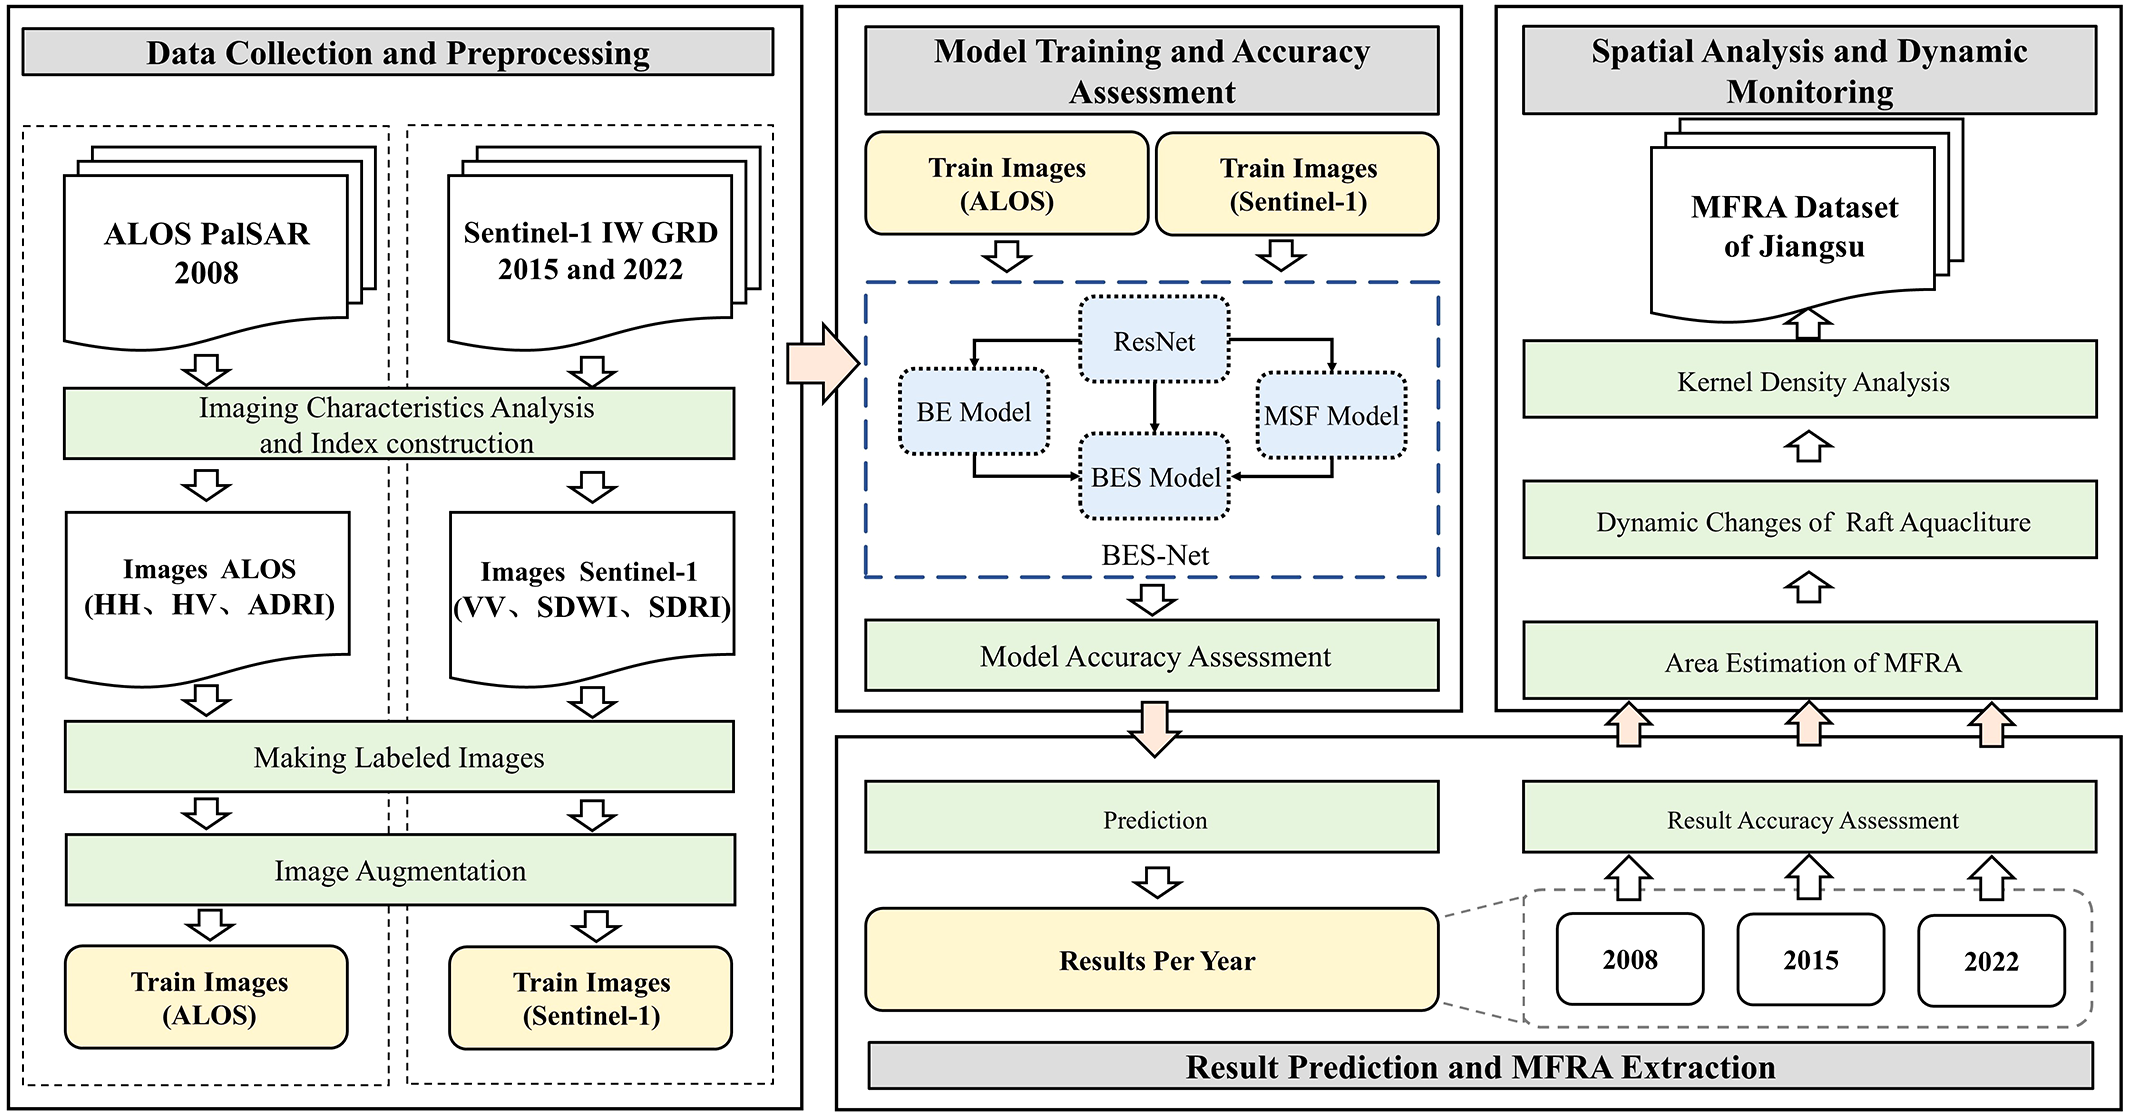
Workflow of raft aquaculture extraction.
3.1 Imaging characteristics analysis and index selection
Synthetic Aperture Radar (SAR) images exhibit four common polarizations: HH, HV, VH, and VV. The backscatter characteristics of radar signals vary with polarization, which can influence the accuracy of MFRA extraction. In this study, the imaging mode of Sentinel-1 is interferometric wide (IW) with two polarizations, including VV polarization and VH polarization. The image mode of ALOS-1 is fine beam double polarization (FBD) with two polarizations, including HH polarization and HV polarization. To improve monitoring accuracy, target imaging characteristics analysis, and index construction are very important. Based on the observation of the performance of MFRA in the study area under different polarization types (Figure 3), the HV polarization band of ALOS-1 enables only limited visual interpretation of pole-type raft aquaculture (a2). Similarly, the VH band of Sentinel-1 reveals only part of the pole-type raft aquaculture (c2), while it entirely fails to capture the fully floating raft aquaculture (e2). In contrast, the isotropic polarization images showed more prominent characteristic information of MFRA. To exploit the benefits of double polarization features, a variety of radar indices were calculated to determine which combination of polarizations is most suitable for distinguishing between MFRA and seawater. Considering the performance of MFRA in different index feature images and the value of feature importance of each Radar index in Table 2, the SDRI and SDWI indices were chosen for MFRA extraction. The Sentinel-1 dual-polarized water index (SDWI) proposed by Jia et al. (2019) multiplies the VV and VH polarization images and multiplies them by 10, thereby enhancing the water bodies and eliminating other influences. The Sentinel-1 dual-polarized raft index (SDRI) proposed by Liu et al. (2023) also multiplies the VV and VH polarization images to increase the difference between MFRA and seawater. To correspond to Sentinel-1, ALOS-1 dual-polarized water index (ADWI) and ALOS-1 dual-polarized raft index (ADRI) were calculated by replacing VV and VH polarization with HH and HV polarization respectively.
Table 2
| Radar Index | Parameters | Formula |
|---|---|---|
| Normal Difference Index | NDI | |
| Normalized Difference Polarized Index | NDPI | |
| Ratio of backscatter coefficient | Ratio | |
| Square Difference Index | SDI | |
| Sentinel-1 Dual-polarized Water Index | SDWI | |
| Sentinel-1 Dual-polarized Raft Index | SDRI |
Index feature sets extracted from Sentinle-1 satellite.
In summary, the VV, SDWI, and SDRI features of Sentinel-1, and the HH, ADWI, and ADRI features of ALOS-1, were able to highlight each type of MFRA concurrently in Figure 3. Therefore, the HV and VH polarizations were excluded to circumvent the potential risk of HV and VH polarizations to the integrity of the extraction results.
Figure 3
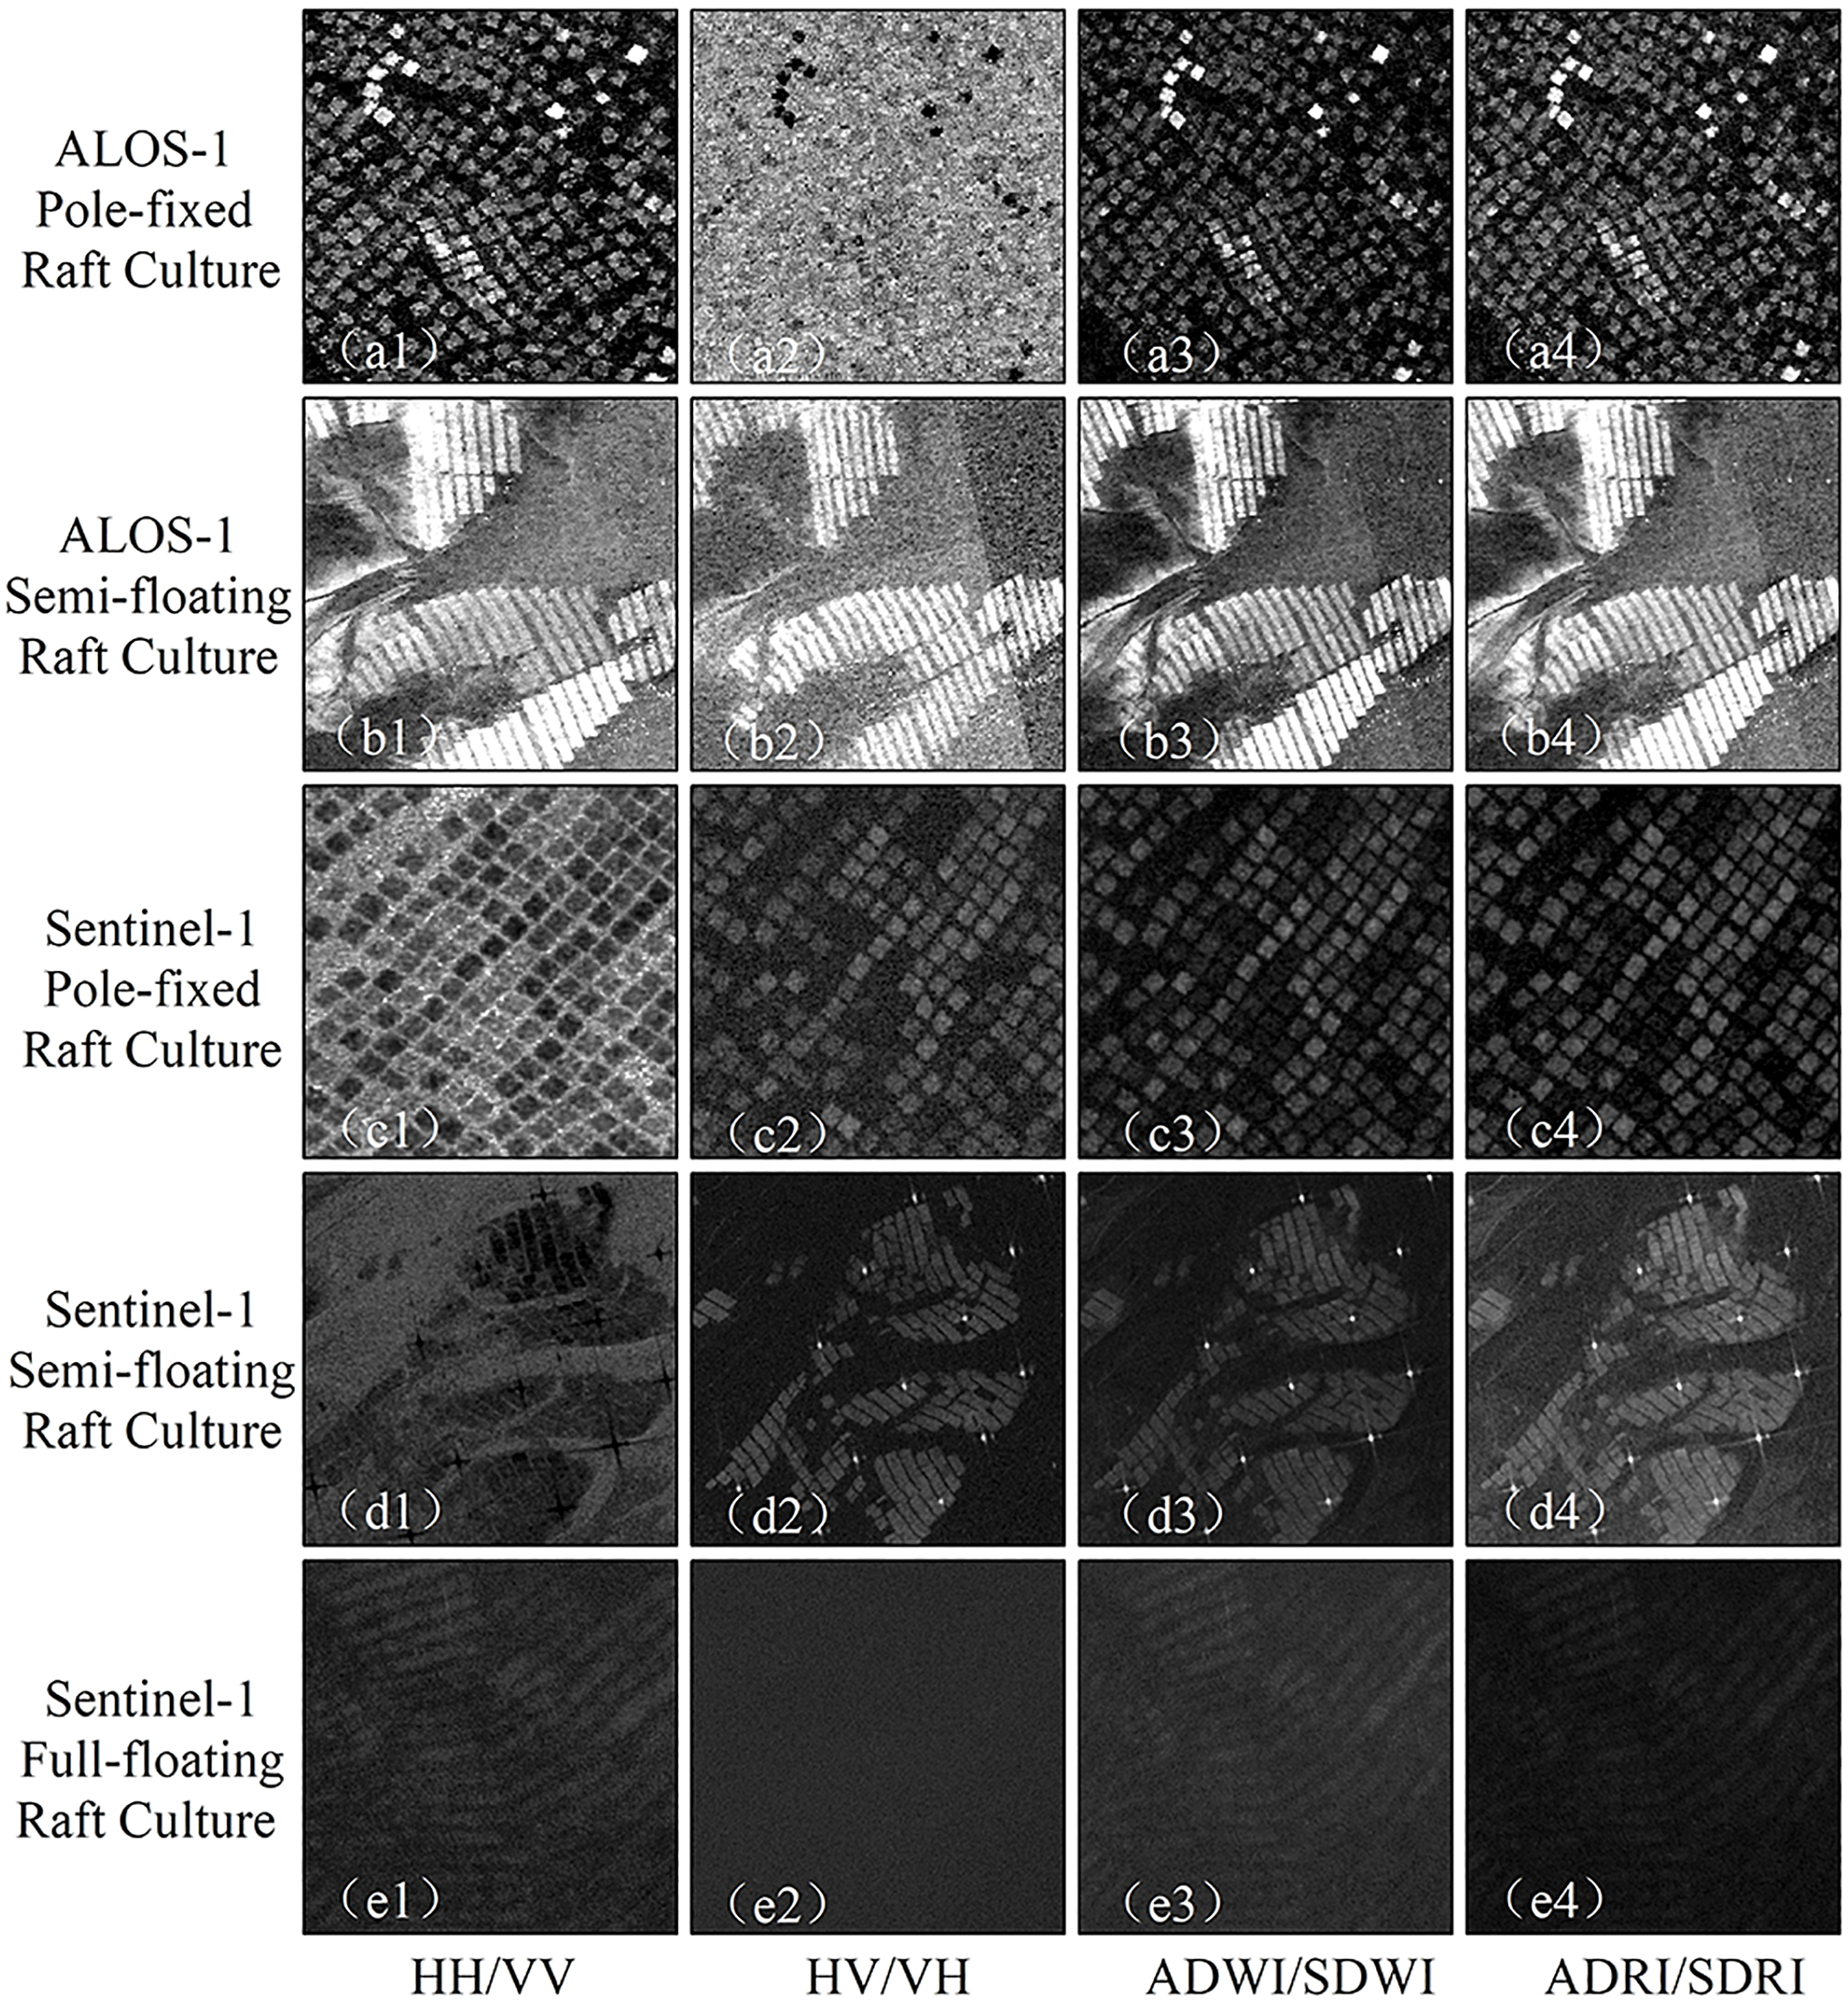
Cross-Sensor Polarization Band and Radar Index Analysis: (a, b) ALOS-1 HH/HV/ADWI/ADRI (c-e) Sentinel-1 VV/VH/SDWI/SDRI.
3.2 Deep learning framework for MFRA extraction
3.2.1 Data preparation
The primary dataset used in this study consisted of ALOS-1 and Sentinel-1 SAR images. Through the imaging characteristics analysis and index construction, the HH, ADWI, and ADRI were selected for the ALOS-1 SAR image, and the VV, SDWI, and SDRI bands were selected for the Sentinel-1 in this study. The selected band and indices were then fused into experimental image data with three channels. After acquiring the experimental image data, we manually extracted three types of MFRA in each SAR image based on visual interpretation. The Pole-pixed raft aquaculture, semi-floating raft aquaculture, and full-floating raft aquaculture targets were labeled as 1, 2, and 3 respectively. The other features were labeled as 0 to generate the final ground truth maps. All the SAR images and their corresponding ground truth were cropped into 512×512 pixels sub images for model training. Considering that background pixels vastly outnumber the MFRA pixels, we improved the quality of our training samples by selecting regions where the three MFRA types occur at high density. Additionally, we employed processing techniques such as rotation, mirroring, and noise injection to augment the dataset and enhance its diversity. Therefore, the final dataset comprises 2020 sample pairs for ALOS-1 and 6580 sample pairs for Sentinel-1, with 70% allocated for training, 15% for validation, and 15% for testing.
3.2.2 Model structure
The Swin Transformer (Liu et al., 2021) is a pioneering visual Transformer backbone network that leverages a hierarchical structure and a shift window mechanism. It achieves cross-scale visual feature modeling through efficient non-overlapping local window self-attention computation, thus achieving breakthrough performance in tasks such as image classification, target detection, and semantic segmentation with linear computational complexity. However, the Swin Transformer may face challenges when extracting MFRA from SAR images, particularly due to a series of boundary issues such as incompleteness, fragmentation, and adhesion. In addressing this challenge, the boundary-enhancing Swin Transformer model (BE-Swin) was proposed by incorporating three modules to explicitly use the boundary and semantic context information compared to the original Swin Transformer: the Boundary Extraction (BE) module, the Multi-scale Semantic Context Fusion (MSF) module, and the Attention Gated Boundary Enhanced Semantic Context (AGBES) module.
As shown in Figure 4, BE-Swin first employs the Swin Transformer as its backbone to extract multi-layer features. The image is then downsampled to 128 × 128 × 256() following initial 7 × 7 convolution, batch normalization (BN), and max-pooling operations. This is followed by a further downsampling to 64 × 64 × 512() for the extraction of middle-layer detail features, and then after residual block stacking for the extraction of high-level semantic features, which are 32 × 32 × 1024(), 16 × 16 × 2048( and ). Respectively, as the highest-level feature maps has rich semantic information and larger sensory fields. Three modules are introduced as follows:
-
1. The BE module is utilized to extract boundary information by directly leveraging the intermediate features of the backbone network. Thanks to the deep convolutional neural network, it employs a layered approach that combines the features of the low-level detail information(, ) and the high-level semantic information(). The boundary features () are generated with dimensions of 128×128×1, achieved by applying a 1×1 convolution on the channel followed by a fusion of downsampling and upsampling operations. The generation of the binary boundary labels is achieved from ground truth via the Laplacian transform. The BE module is capable of extracting and enhancing the fuzzy boundary to improve the boundary differentiation.
-
2. To fuse the multi-scale semantic information into a feature map, the MSF module adopts the channel attention mechanism to enhance the high-level semantic information by fusing different receptive fields and three high-level features with a uniform number of channels. This process results in the acquisition of 32 × 32 × 512 multi-scale fusion features(), which has been demonstrated to effectively improve the model’s perception of targets at different scales. The MSF module enhances the expression ability of different scale targets by fusing multi-scale features.
-
3. The AGBES module up-samples to 128 × 128 × 128 and performs weighted fusion with the boundary feature . This process generates the boundary-enhanced feature() by embedding the boundary information into the high-level semantic features. The AG module automatically learns to focus on target structures of different shapes and sizes, easily integrates with standard CNN architectures, and minimizes computational overhead while improving model sensitivity and predictive accuracy (Oktay et al., 2018). It is achieved by using simple addition and multiplication operations to enhance the semantic intraclass consistency. The AGBES module integrates boundary and semantic features to enhance classification consistency and segmentation accuracy.
Figure 4
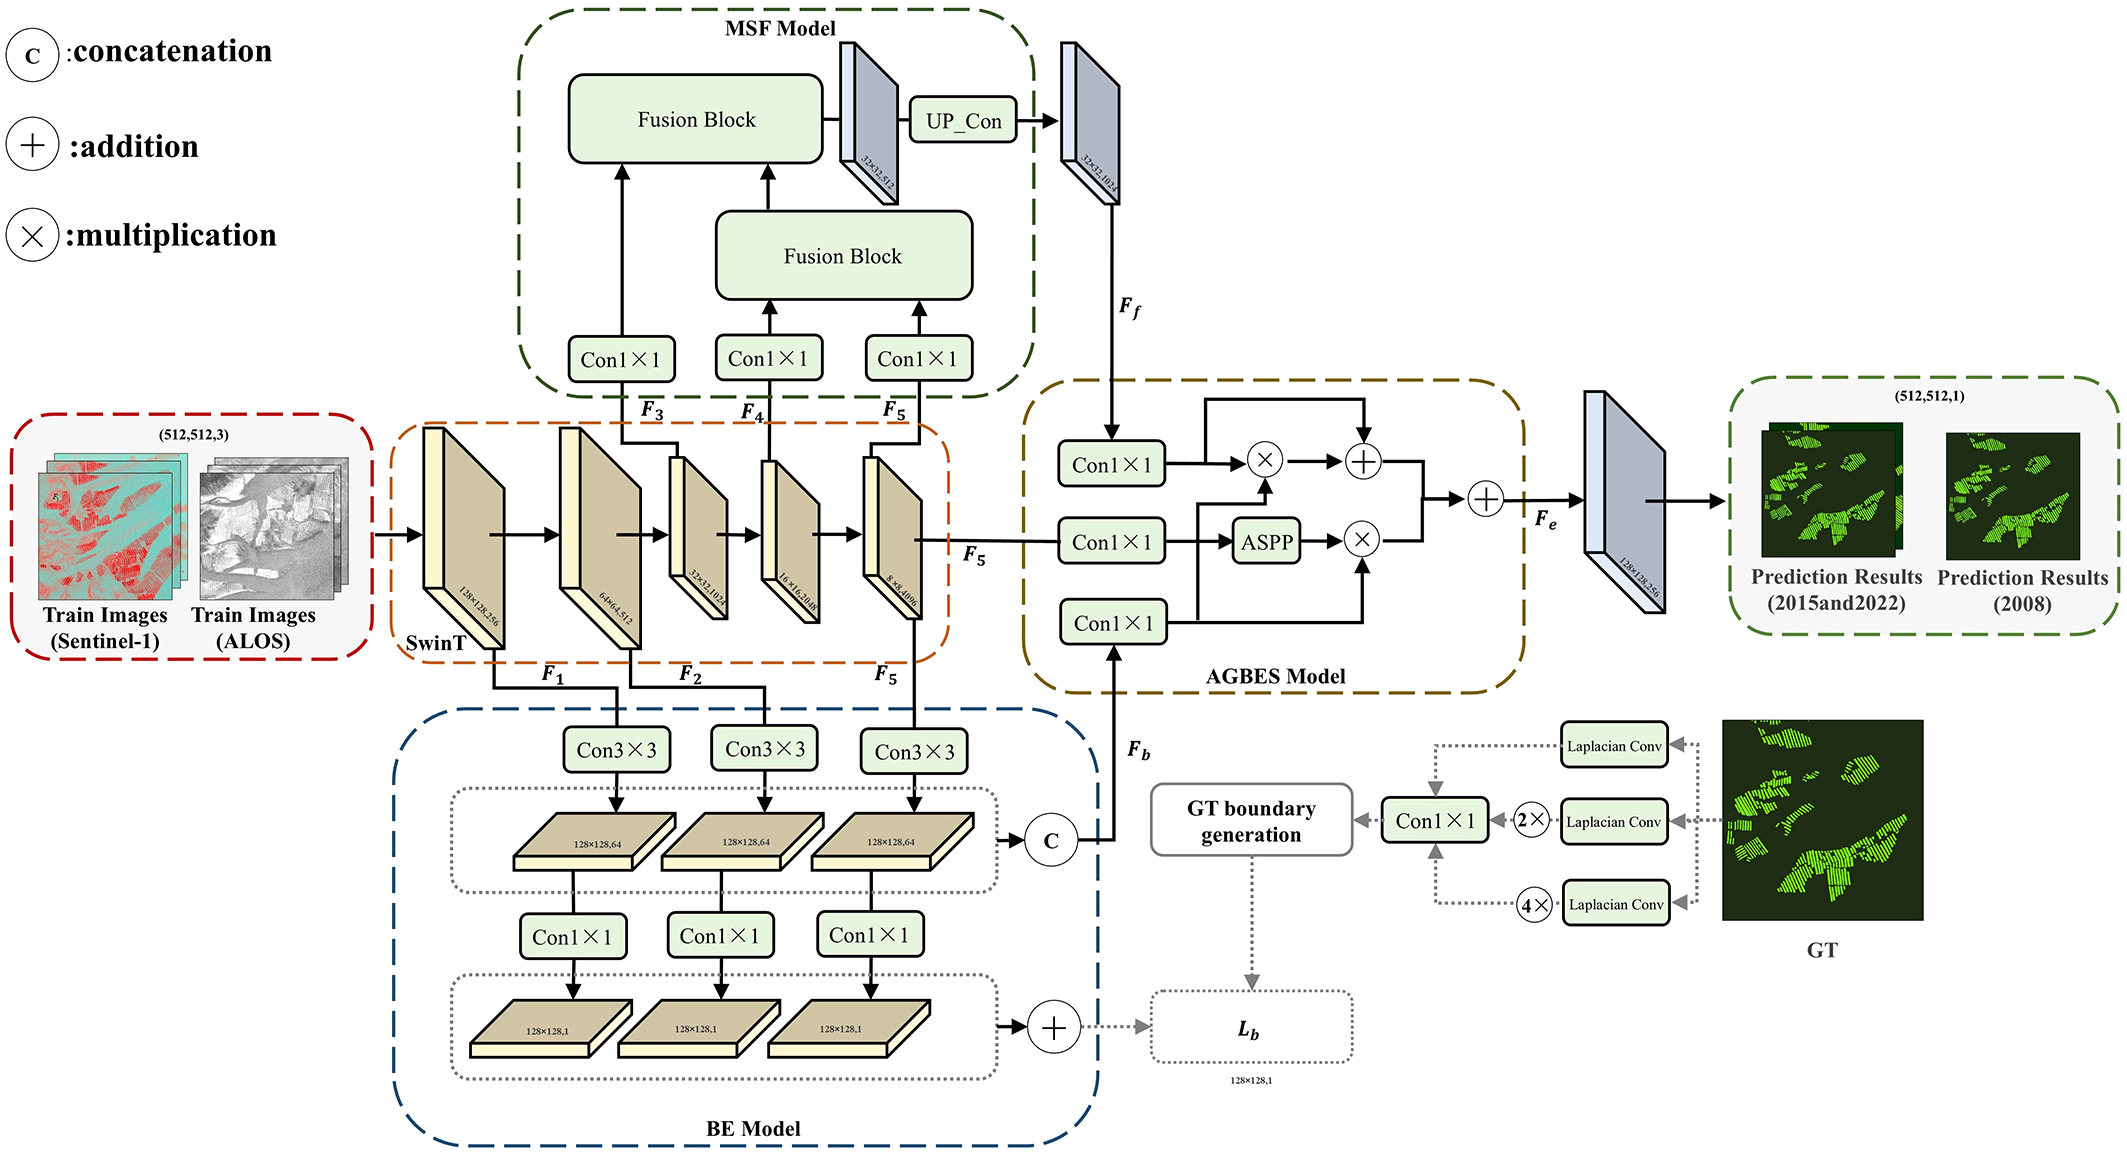
The structure of BE-Swin.
Finally, BE-Swin restores the feature map to the original size of 512 × 512 × 1 by up-sampling operation and outputs four types of pixel-level probability distributions using a Softmax classifier to complete the accurate extraction of pole-pixed raft aquaculture, semi-floating raft aquaculture, full-floating raft aquaculture and background. It is acknowledged that MFRA targets in Jiangsu Province are typical of a reduced scale, particularly in the context of pole-pixed raft aquaculture. BE-Swin extracts hierarchical semantic features and re-weights single-scale features through the MSF module. This ensures the effective utilization of cross-scale complementary information, thereby ensuring the accuracy and robustness of the model in high-resolution remote sensing images.
3.2.3 Model training
The BE-Swin model was trained and tested using the PyTorch framework on an NVIDIA RTX 3080 GPU with 10 GB under Windows 10 with CUDA 11.3. All models were trained for 100 epochs with a batch size of 8 and an initial learning rate of 0.001. To ensure fairness, all models used the same data splits, preprocessing, and training settings. The BE-Swin model showed stable convergence, with loss values plateauing before training completion. Results are averaged over three runs with different random seeds.
3.3 Model evaluation metrics
To assess the accuracy and reliability of the extraction results, and to guide future research optimizations, five commonly used metrics are employed: precision (Equation 1), recall (Equation 2), F1-score (Equation 3), accuracy (Equation 4) and mean intersection over union (mIoU) (Equation 5). The formulae for calculating the above evaluation metrics are as follows:
The variable denotes the total number of classes, inclusive of the background class. We can use a confusion matrix to present the results of the classifier, while its element at the intersection of the th and the th column for is the number of instances from the th classified to the th class. denotes the total number of pixels in the image under consideration.
4 Result and analysis
4.1 Model performance and MFRA extraction results
To better evaluate the performance of the BE-Swin model, we used the same dataset to train and test our model and other neural network models. Figure 5 shows the prediction results of the BE-Swin model and other comparison models for different types of MFRA. Some scenes have been selected to compare the extraction results of the different models. The first two rows of Figure 5 correspond to the extraction results of the ALOS-1 dataset. The next three rows of Figure 5 correspond to the extraction results of the Sentinel-1 dataset. The color-coding system employed in this study delineates between pole-pixed raft aquaculture (orange), semi-floating raft aquaculture (fuchsia), full-floating raft aquaculture (red), and the background (black). The first two columns of Figure 5 correspond to the SAR images and the ground truth, respectively. The next four columns show the extraction results of the different models. It is undeniable that each mode exhibits some degree of misclassification and omission. Specifically, the U-Net model shows more misclassification (a2&b2), omission(c2&d2), and boundary adhesion(b2&e2). The MA-Net and DeepLab V3+ models show better results than the U-Net model. However, the DeepLabV3+ model still shows some omissions (c4&d4) and more boundary incompleteness or fragmentation (a4, b4&e4). The MA-Net model (Fan et al., 2020) still shows some misclassifications (c3&d3). The proposed BE-Swin model shows the best extraction results. It shows reduced misclassification and omission errors, effectively preserving the authentic shapes and boundaries of MFRA. This improvement is attributed to the integration of boundary and semantic features, which enhances classification consistency and segmentation accuracy.
Figure 5
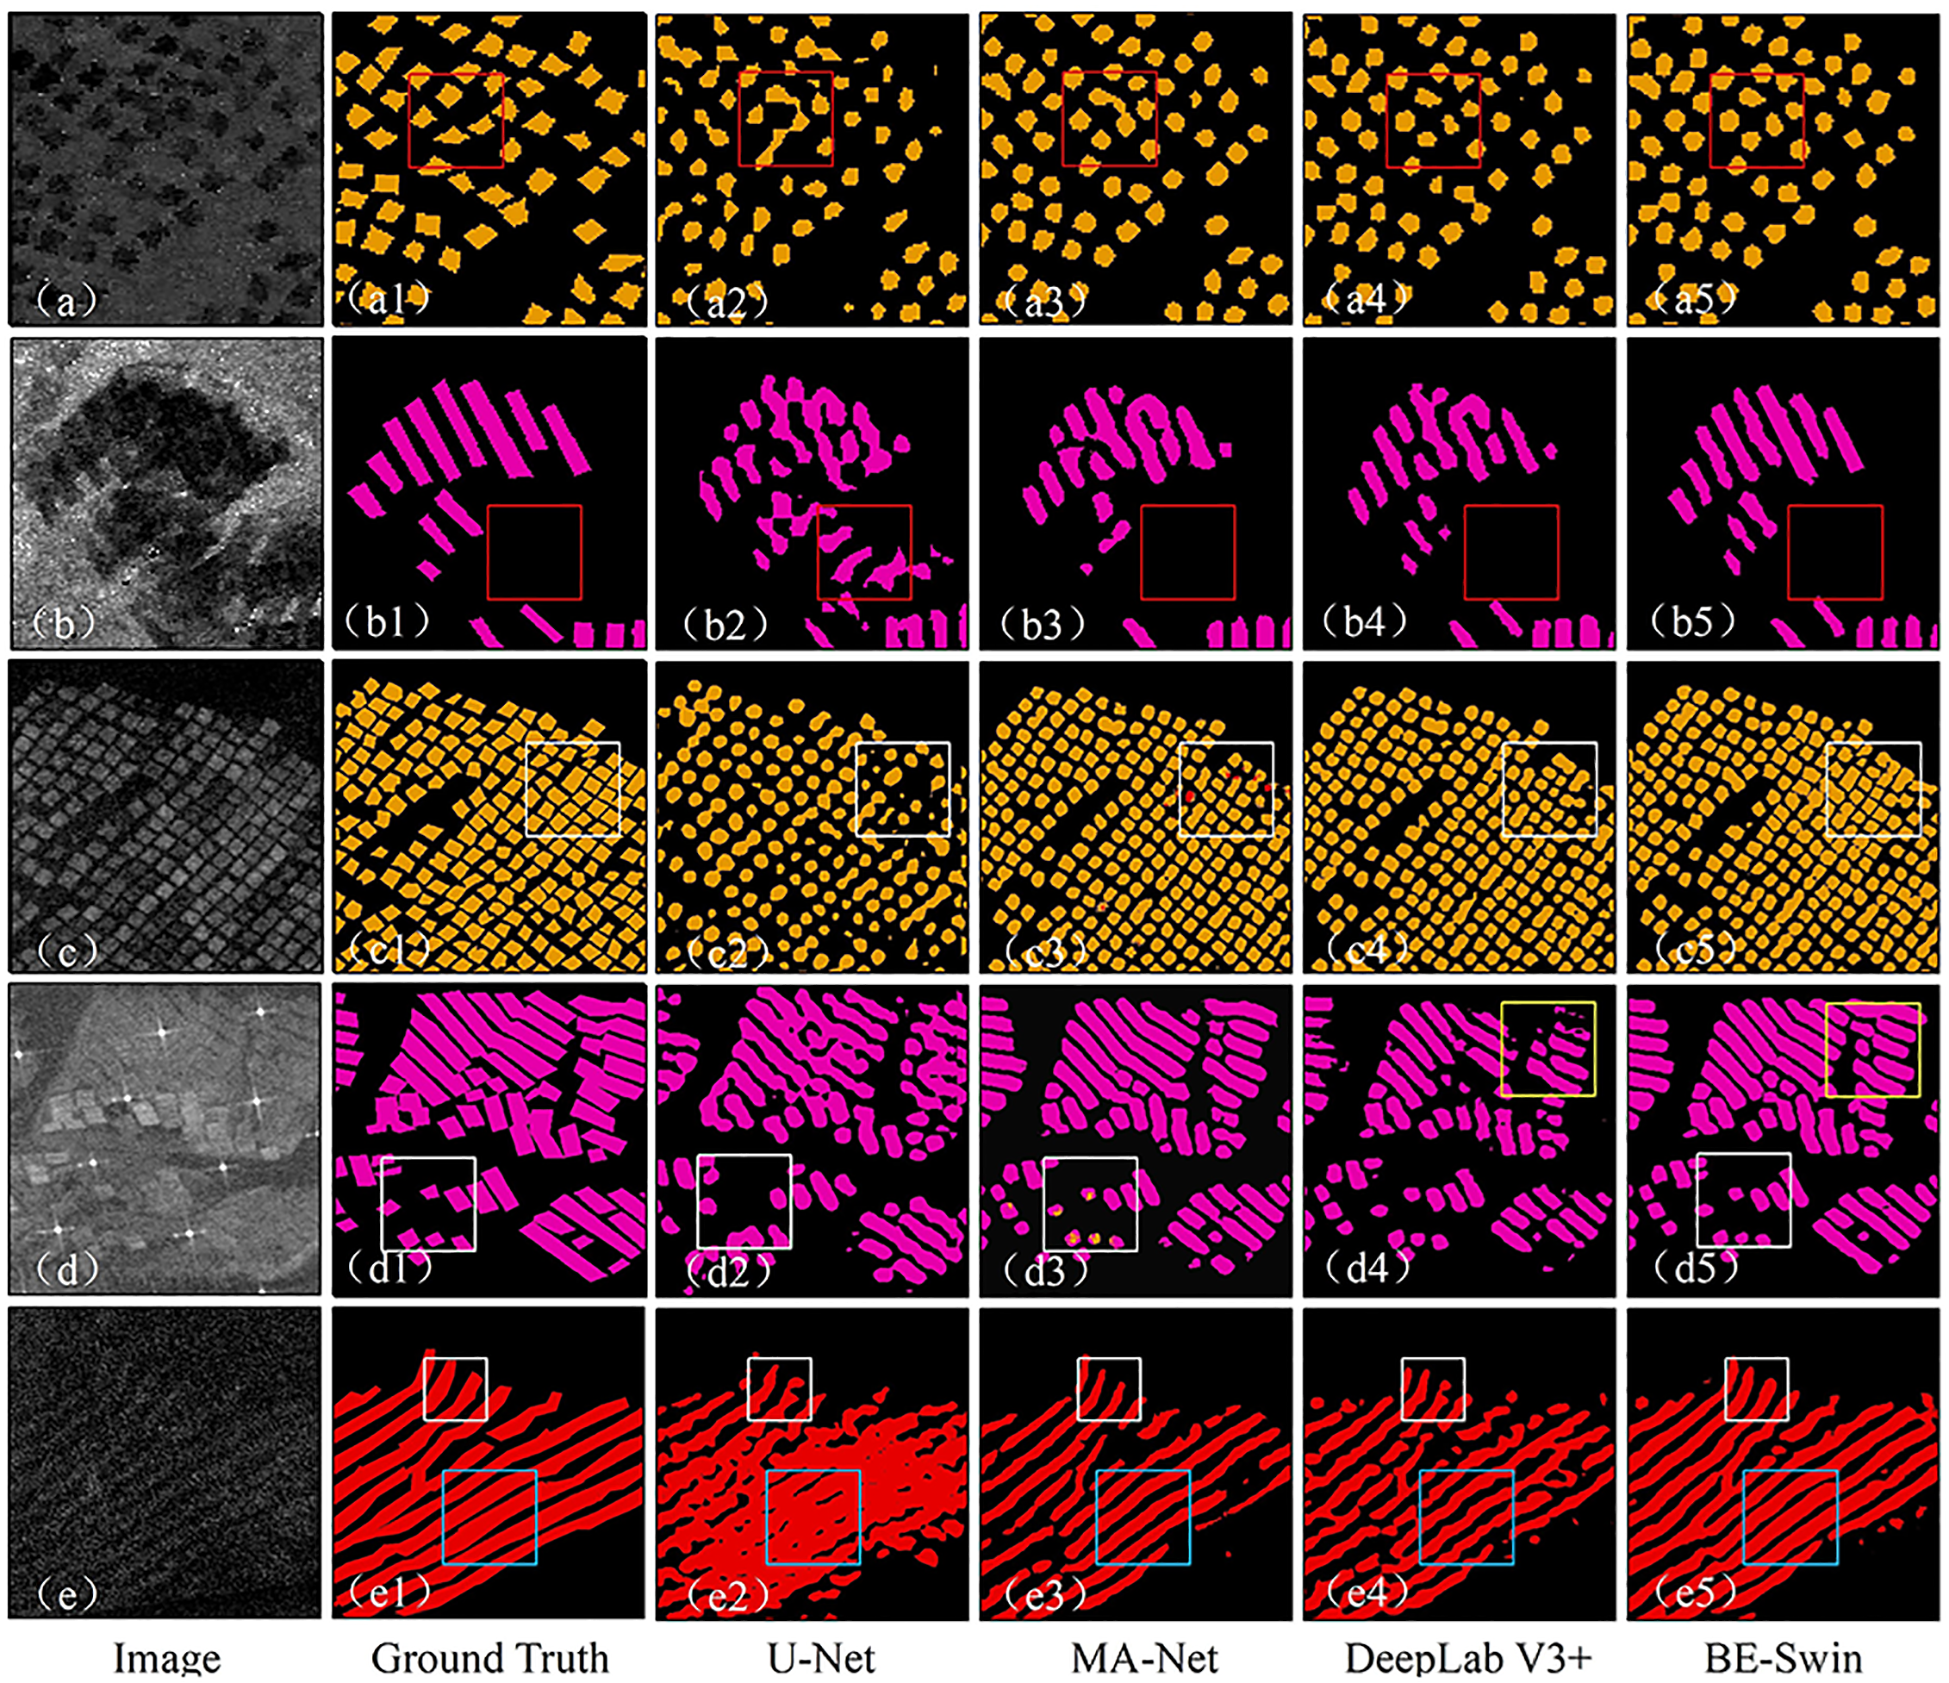
Comparison of the results obtained from multiple models (a2-e2, a3-e3, a4-e4, a5-e5) with test images and ground truth (a1-e1).
Tables 3 , 4 show the evaluation metric values for each model of Sentinel-1 and ALOS dataset respectively. In Table 3, the results show that the BE-Swin model achieves the highest overall accuracy and mIoU, indicating superior overall performance. The U-Net model achieves unsatisfactory figures in all indicators, especially for the full-floating raft aquaculture. Compared with the other two types, accurately extracting full-floating raft aquaculture areas from SAR images presents significant challenges due to the subtle and complex features of these structures. Their low prominence in SAR imagery often leads to difficulties in precise identification and extraction. In this study, for full-floating raft aquaculture, the BE-Swin model achieves the highest levels in three metrics precision, recall, and F1-score. For semi-floating raft aquaculture, the BE-Swin model achieves higher precision but lower recall compared with MA-Net and DeepLab V3+. For pole-pixed raft aquaculture, the BE-Swin model achieves the highest recall and F1-score with a precision of 95.18%. In Table 4, the results show that the BE-Swin model achieves the highest levels in all the indicators, suggesting that it is a more suitable choice to use the BE-Swin model in the ALOS-1 dataset.
Table 3
| Model | Raft type | Precision | Recall | F1-score | Accuracy | mloU |
|---|---|---|---|---|---|---|
| U-Net | full-floating | 54.27 | 89.12 | 67.46 | 87.71 | 59.76 |
| semi-floating | 79.57 | 66.34 | 72.36 | |||
| Pole-pixed | 87.38 | 57.48 | 69.34 | |||
| MA-Net | full-floating | 59.98 | 94.49 | 73.38 | 95.31 | 70.11 |
| semi-floating | 76.42 | 85.95 | 80.91 | |||
| Pole-pixed | 95.44 | 65.88 | 77.95 | |||
| DeepLab V3+ | full-floating | 59.87 | 94.40 | 73.27 | 95.16 | 67.65 |
| semi-floating | 84.41 | 83.34 | 83.87 | |||
| Pole-pixed | 96.73 | 48.63 | 64.73 | |||
| BE-Swin | full-floating | 60.80 | 94.68 | 74.05 | 95.71 | 71.94 |
| semi-floating | 84.60 | 81.56 | 83.05 | |||
| Pole-pixed | 95.18 | 79.57 | 86.68 |
Evaluation indicators for different models of Sentinel-1 dataset (the bold values represent the best results).
Table 4
| Model | Raft type | Precision | Recall | F1-score | Accuracy | mloU |
|---|---|---|---|---|---|---|
| U-Net | semi-floating | 89.62 | 76.24 | 82.39 | 83.55 | 54.93 |
| Pole-pixed | 53.29 | 68.93 | 60.11 | |||
| MA-Net | semi-floating | 93.73 | 95.75 | 94.73 | 93.40 | 58.15 |
| Pole-pixed | 84.08 | 84.56 | 84.32 | |||
| DeepLab V3+ | semi-floating | 93.79 | 95.82 | 94.79 | 93.33 | 61.43 |
| Pole-pixed | 89.2 | 88.47 | 88.83 | |||
| BE-Swin | semi-floating | 93.93 | 95.85 | 94.88 | 93.71 | 61.89 |
| Pole-pixed | 90.40 | 88.67 | 89.53 |
Evaluation indicators for different models of ALOSl-1 dataset (the bold values represent the best results).
As demonstrated in Tables 3, 4, the BE-Swin model exhibits a clear advantage in extracting diverse categories of MFRA across both datasets. Therefore, this model was employed to comprehensively extract all MFRA in Jiangsu Province to analyze the distribution and change in marine aquaculture from 2008 to 2022. We extracted MFRA from ALOS-1 (2008) and Sentinel-1 (2015 and 2022) SAR images and the extraction results are shown in Figures 6, 7. Compared with the original SAR images, the MFRA maps extracted by the BE-Swin model were consistent with the distribution range of marine aquaculture areas in the real images. As shown in Figures 6 and 7, the MFRA is mainly concentrated in the Haizhou Bay area of Lianyungang City and the Southern Yellow Sea radial sand ridge group region, in which the Yellow Sea radial sand ridge group region depth is within 25 m, formed by the interaction of the river (the ancient Yangtze River and the ancient Yellow River) and the sea (the Yellow Sea) (Zhang et al., 2011). Figure 8a shows the total areas of MFRA calculated using the method in this study. Within 16 years, the MFRA areas in the coastal zone of Jiangsu Province have generally experienced a rise followed by a decrease in the change. From 2008 to 2015, the area of MFRA in Jiangsu Province increased from 261.97 km2 to 418.18 km2 and decreased to 364.82 km2 by 2022. We also collected fishery statistical yearbook data for the Jiangsu Province from the Ministry of Agriculture and Rural Affairs of the People’s Republic of China and the relative errors were calculated based on the data. The results showed a strong consistency between our results and the fishery statistical yearbook data. The relative error was <10.5% and the relative error in 2015 was the lowest at 4.99%. These statistical data on the extent of MFRA serve as a valuable predictive tool for estimating aquaculture production.
Figure 6
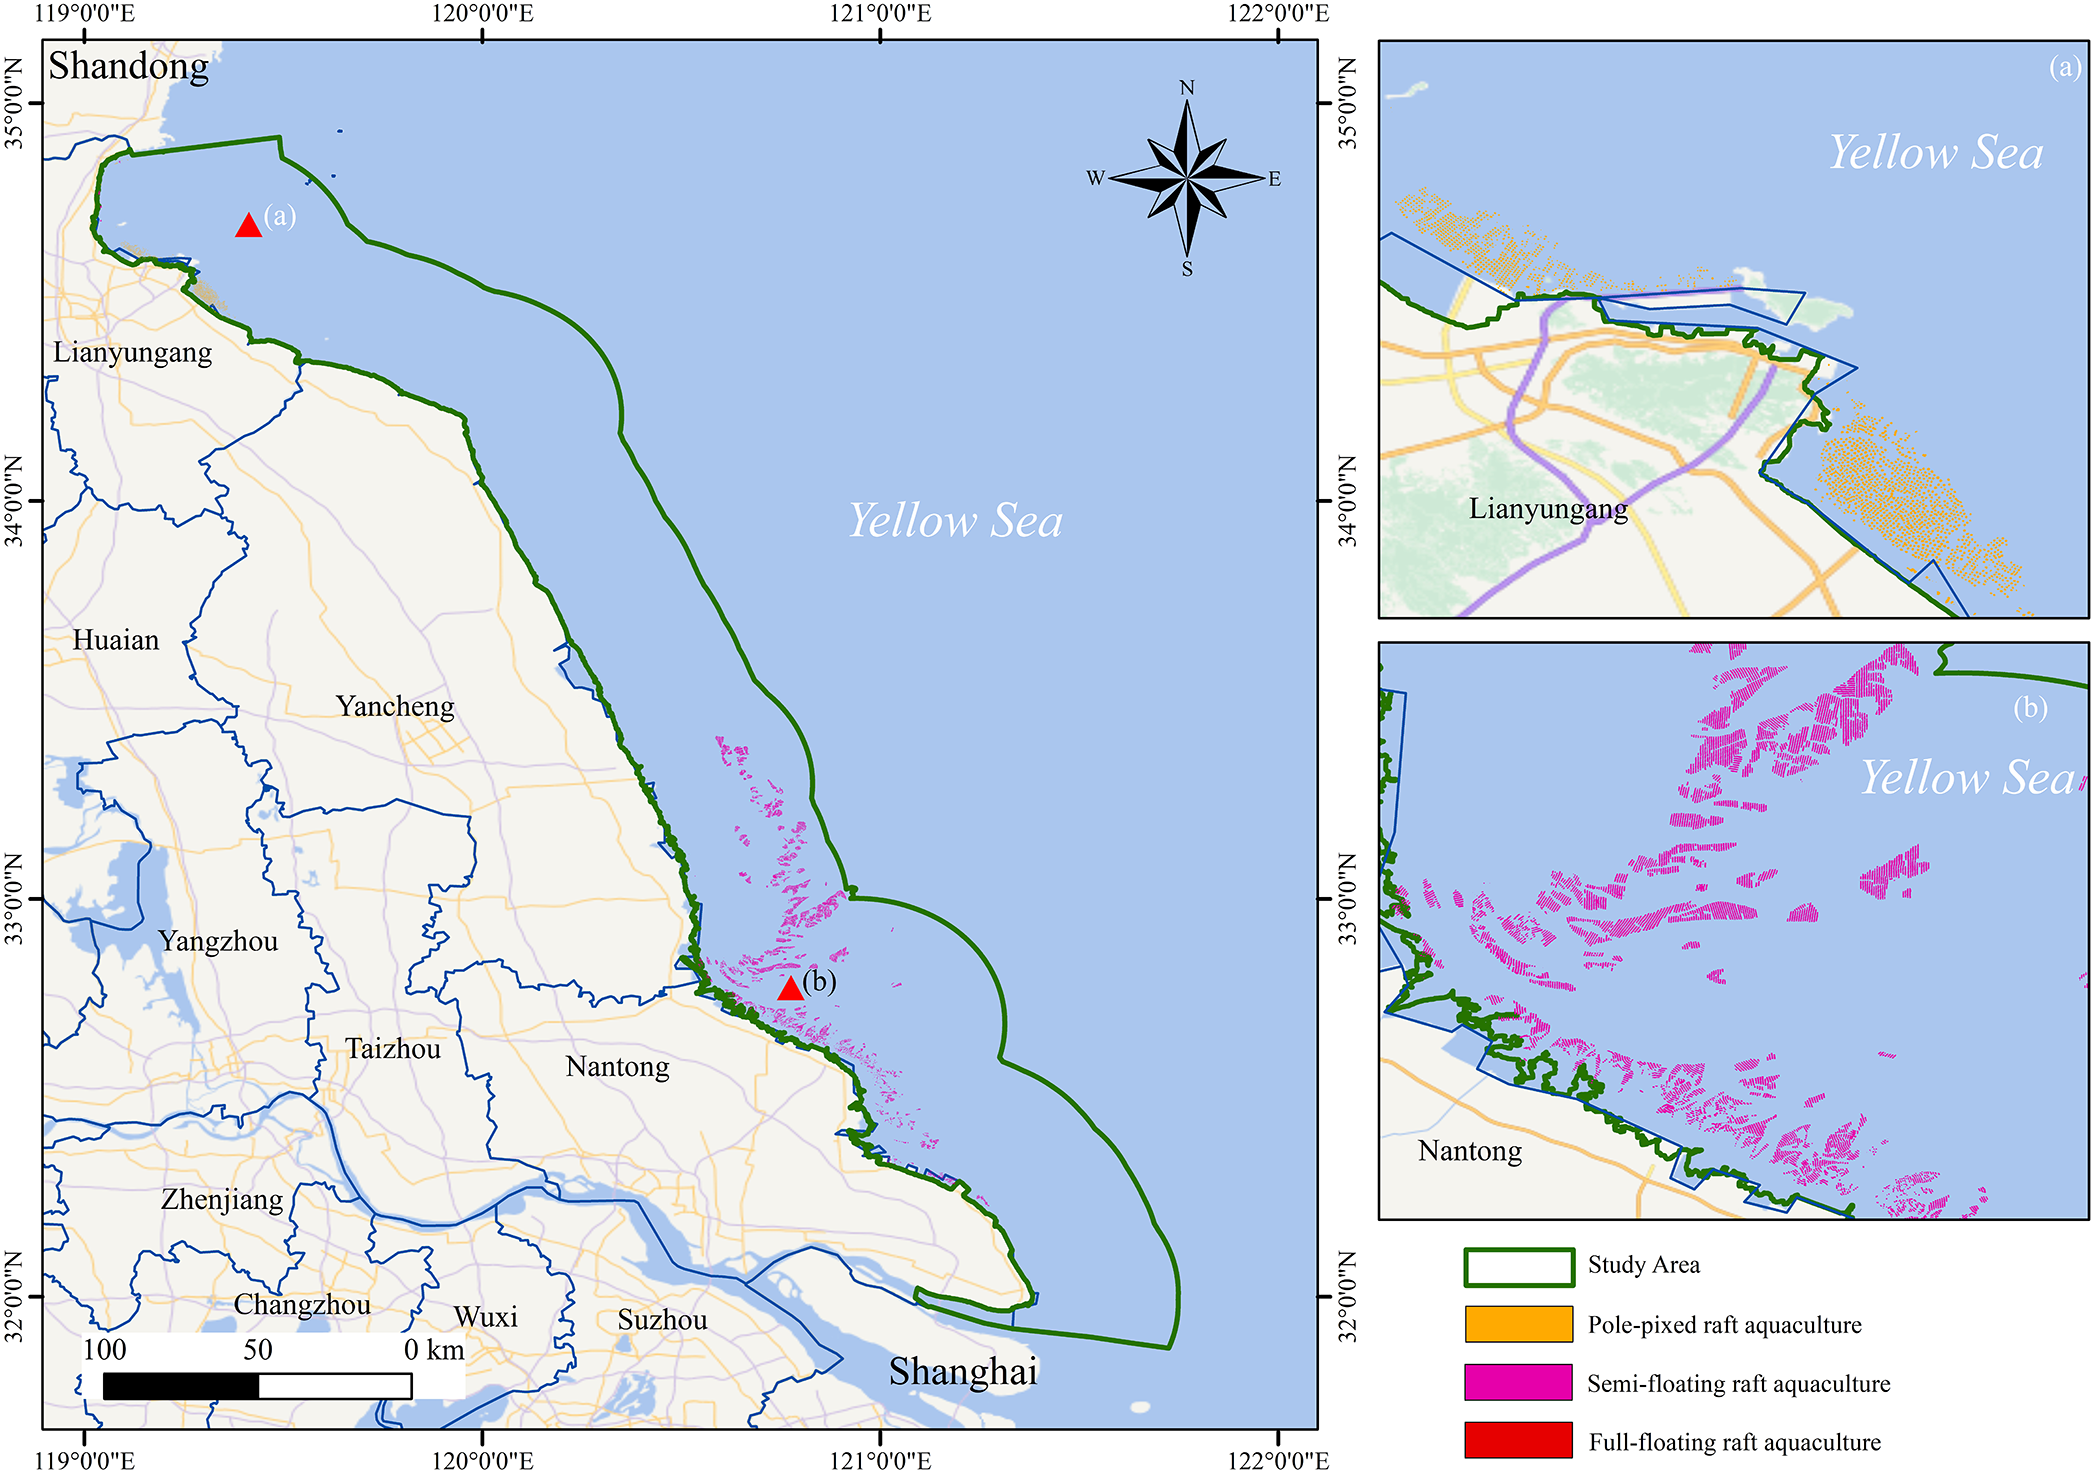
Extraction results of Sentinel-1 dataset.
Figure 7
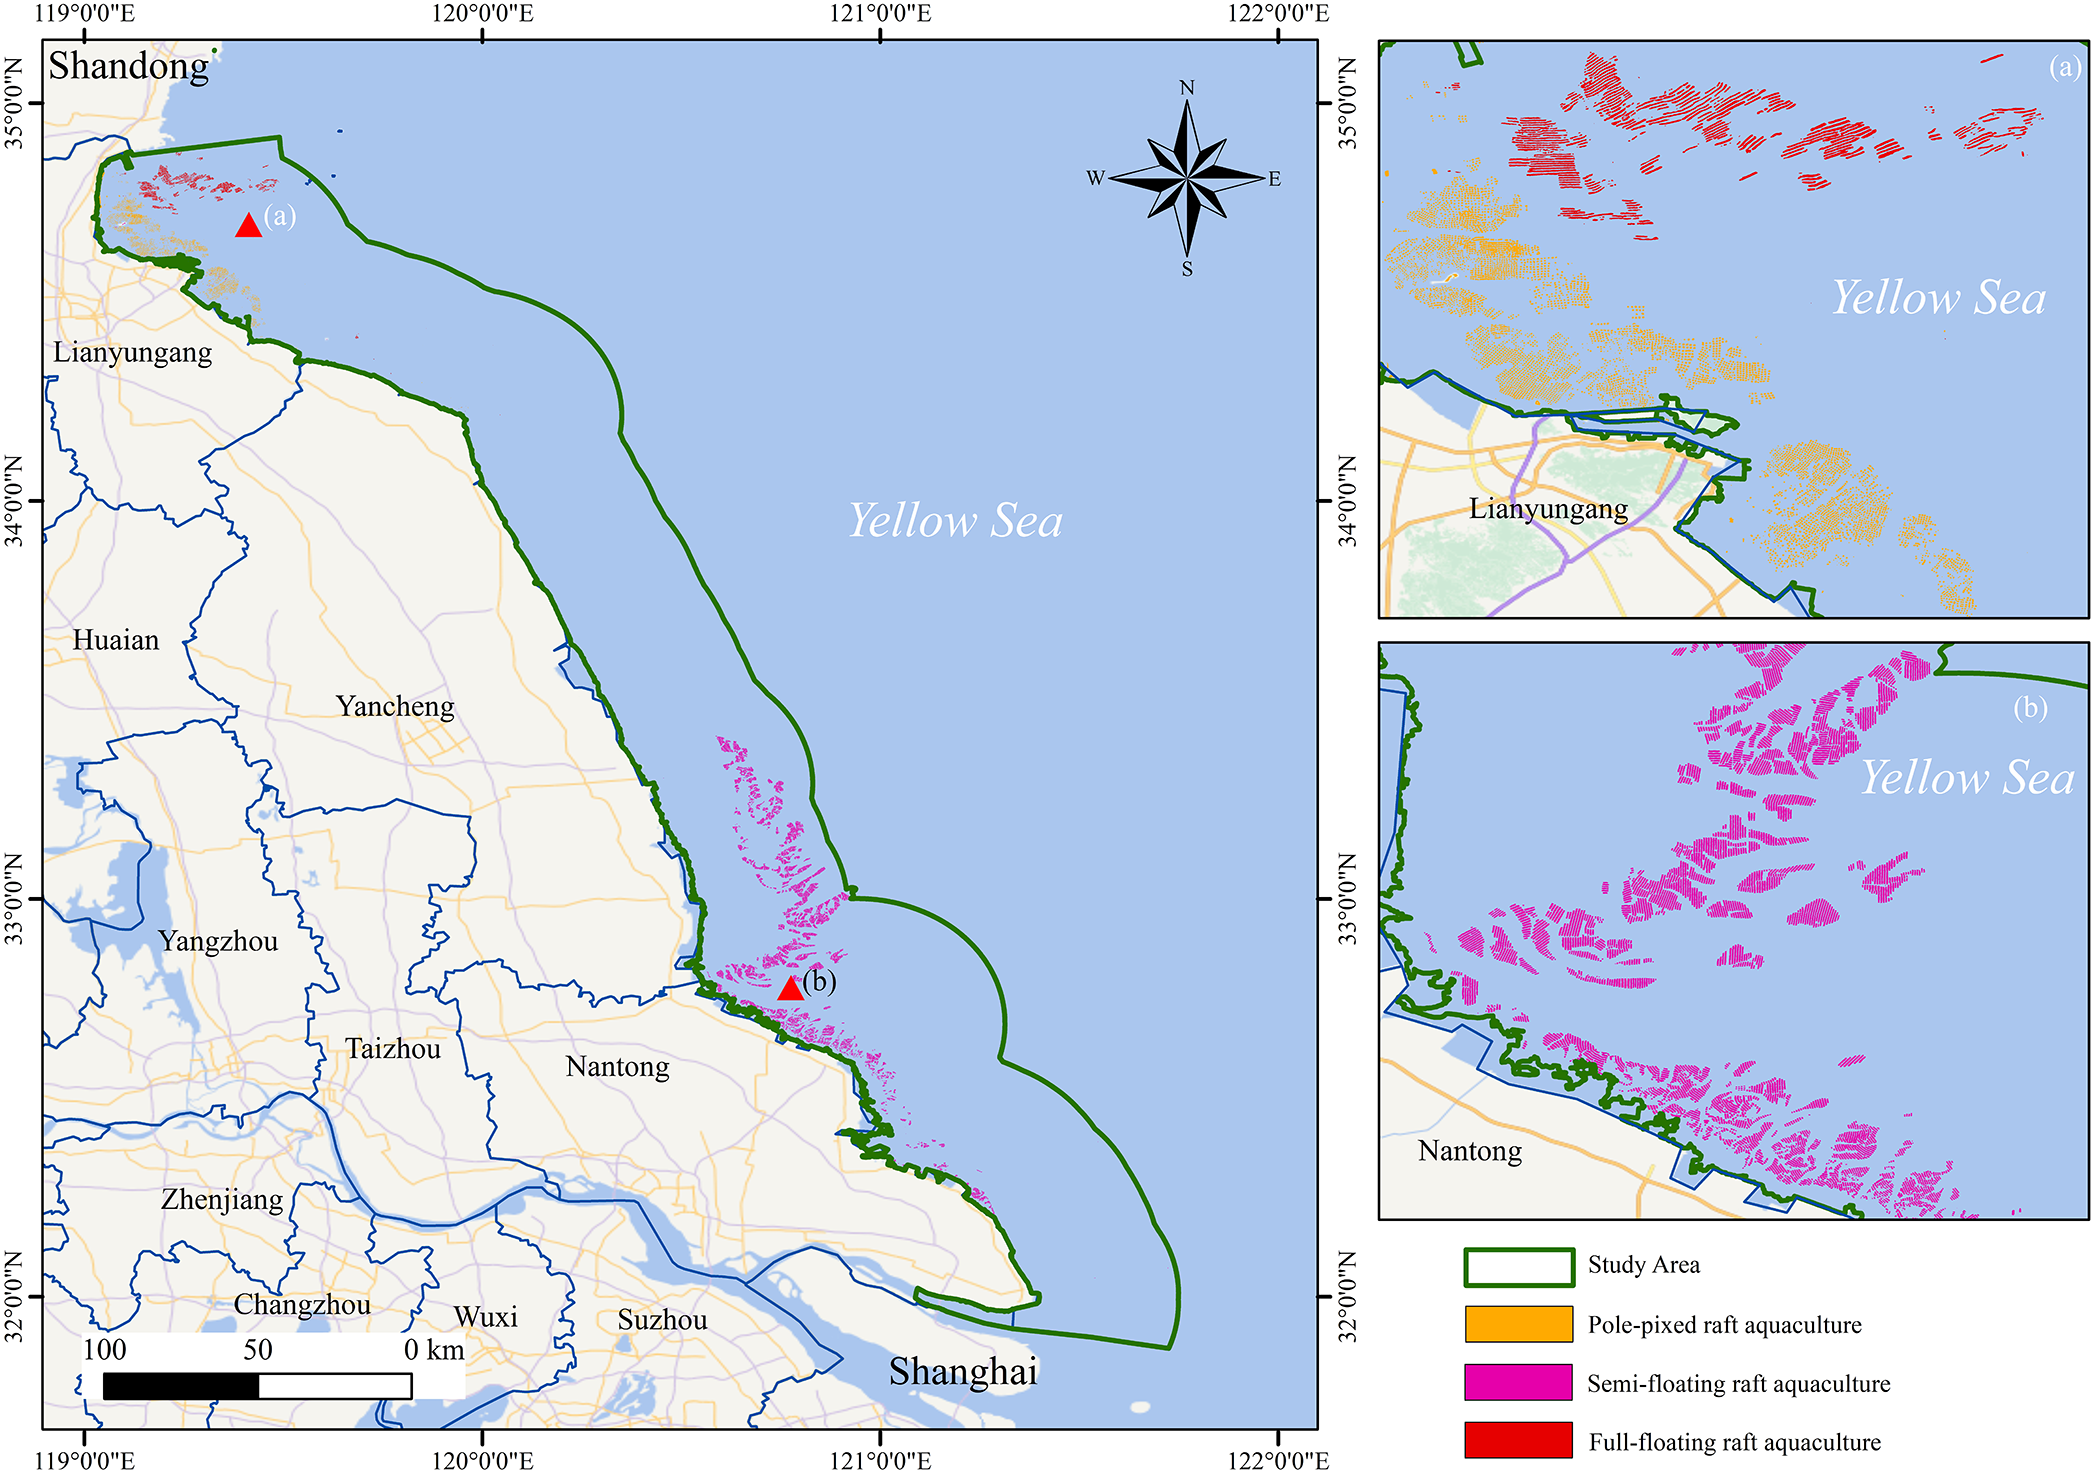
Extraction results of ALOS-1 dataset.
Figure 8
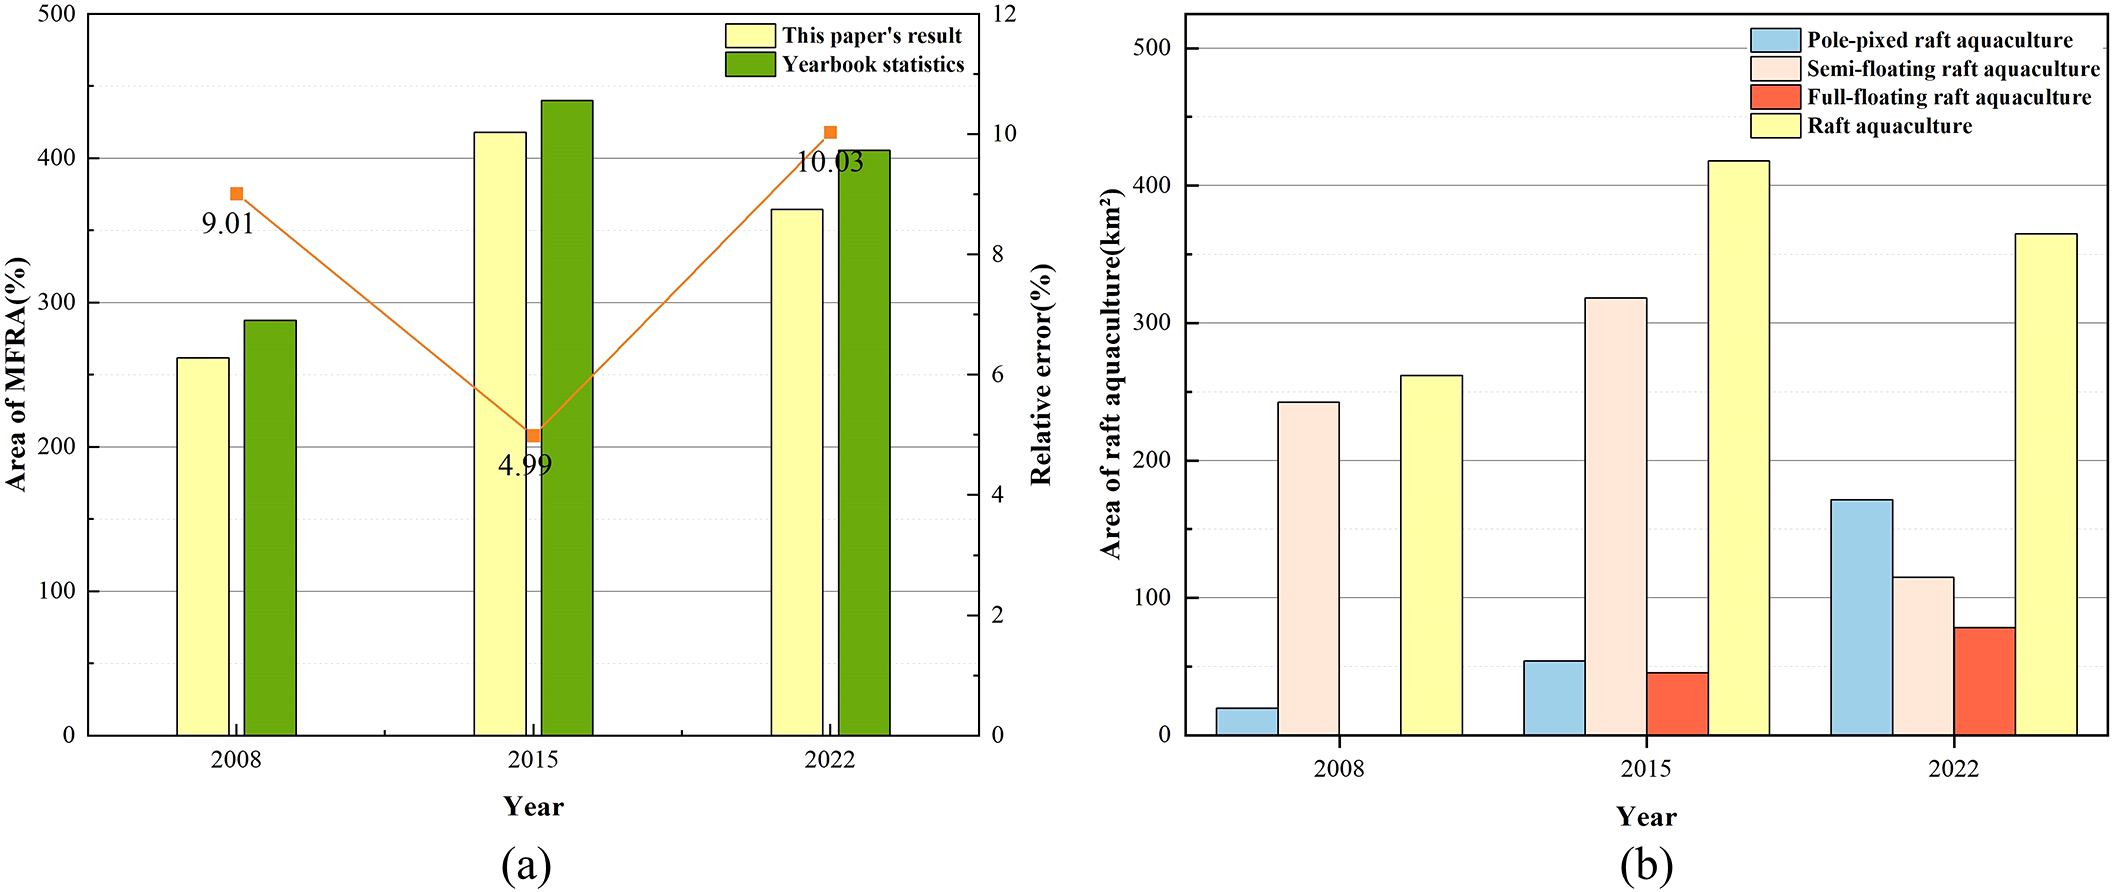
Jiangsu MFRA area trends (2008–2022) (a) Total area (this paper’s results vs. yearbook statistics) and relative error. (b) Three MFRA categories.
4.2 Spatiotemporal distribution and dynamics of MFRA
Figure 8 shows the area changes of three types of MFRA in Jiangsu Province from 2008 to 2022, and Figure 9 shows the spatial distribution changes of multiple types of MFRA. In general, raft aquaculture in the entire coastal area of Jiangsu Province experienced a rapid expansion to a slow contraction from 2008 to 2022. Different types of rafts do not have the same trends in area and distribution. Among them, the area of pole-fixed raft aquaculture has steadily increased over the years, eventually forming a significant scale, which reached the maximum area of 171.38 km2 in 2022. As shown in Figure 9a, this aquaculture type has expanded from the nearshore to deeper offshore waters in the Haizhou Bay area of Lianyungang City, Jiangsu Province. Semi-floating raft aquaculture emerged on a large scale in 2008, becoming the predominant form of marine raft aquaculture that year, a significant portion of which overlapped with the Southern Yellow Sea radial sand ridge group region in the shallow waters off the central coastline of Jiangsu Province. The overall area of semi-floating raft aquaculture in Jiangsu Province has experienced a change of increasing and then decreasing from 2008 to 2022 and reached a peak of 318.36 km2 in 2015. As shown in Figure 9b, the overall distribution of semi-floating raft aquaculture is concentrated in the Southern Yellow Sea radial sand ridge group region and the coast, and this type of MFRA is dismantled by nearly half in 2022. Full-floating raft aquaculture was not adopted in aquaculture in Jiangsu Province in the early stage, but there is a tendency to gradually form large-scale aquaculture, which reached a maximum area of 78.42 km2 in 2022. As shown in Figure 9c, from 2015 to 2022, these rafts were more and more widely distributed, coexisting with pole-pixed raft aquaculture in the Haizhou Bay area of Lianyungang City. They have mostly distributed in the area farther away from the shore of Jiangsu Province compared to pole-pixed raft aquaculture, closer to the coastline where Shandong Province meets Jiangsu Province.
Figure 9
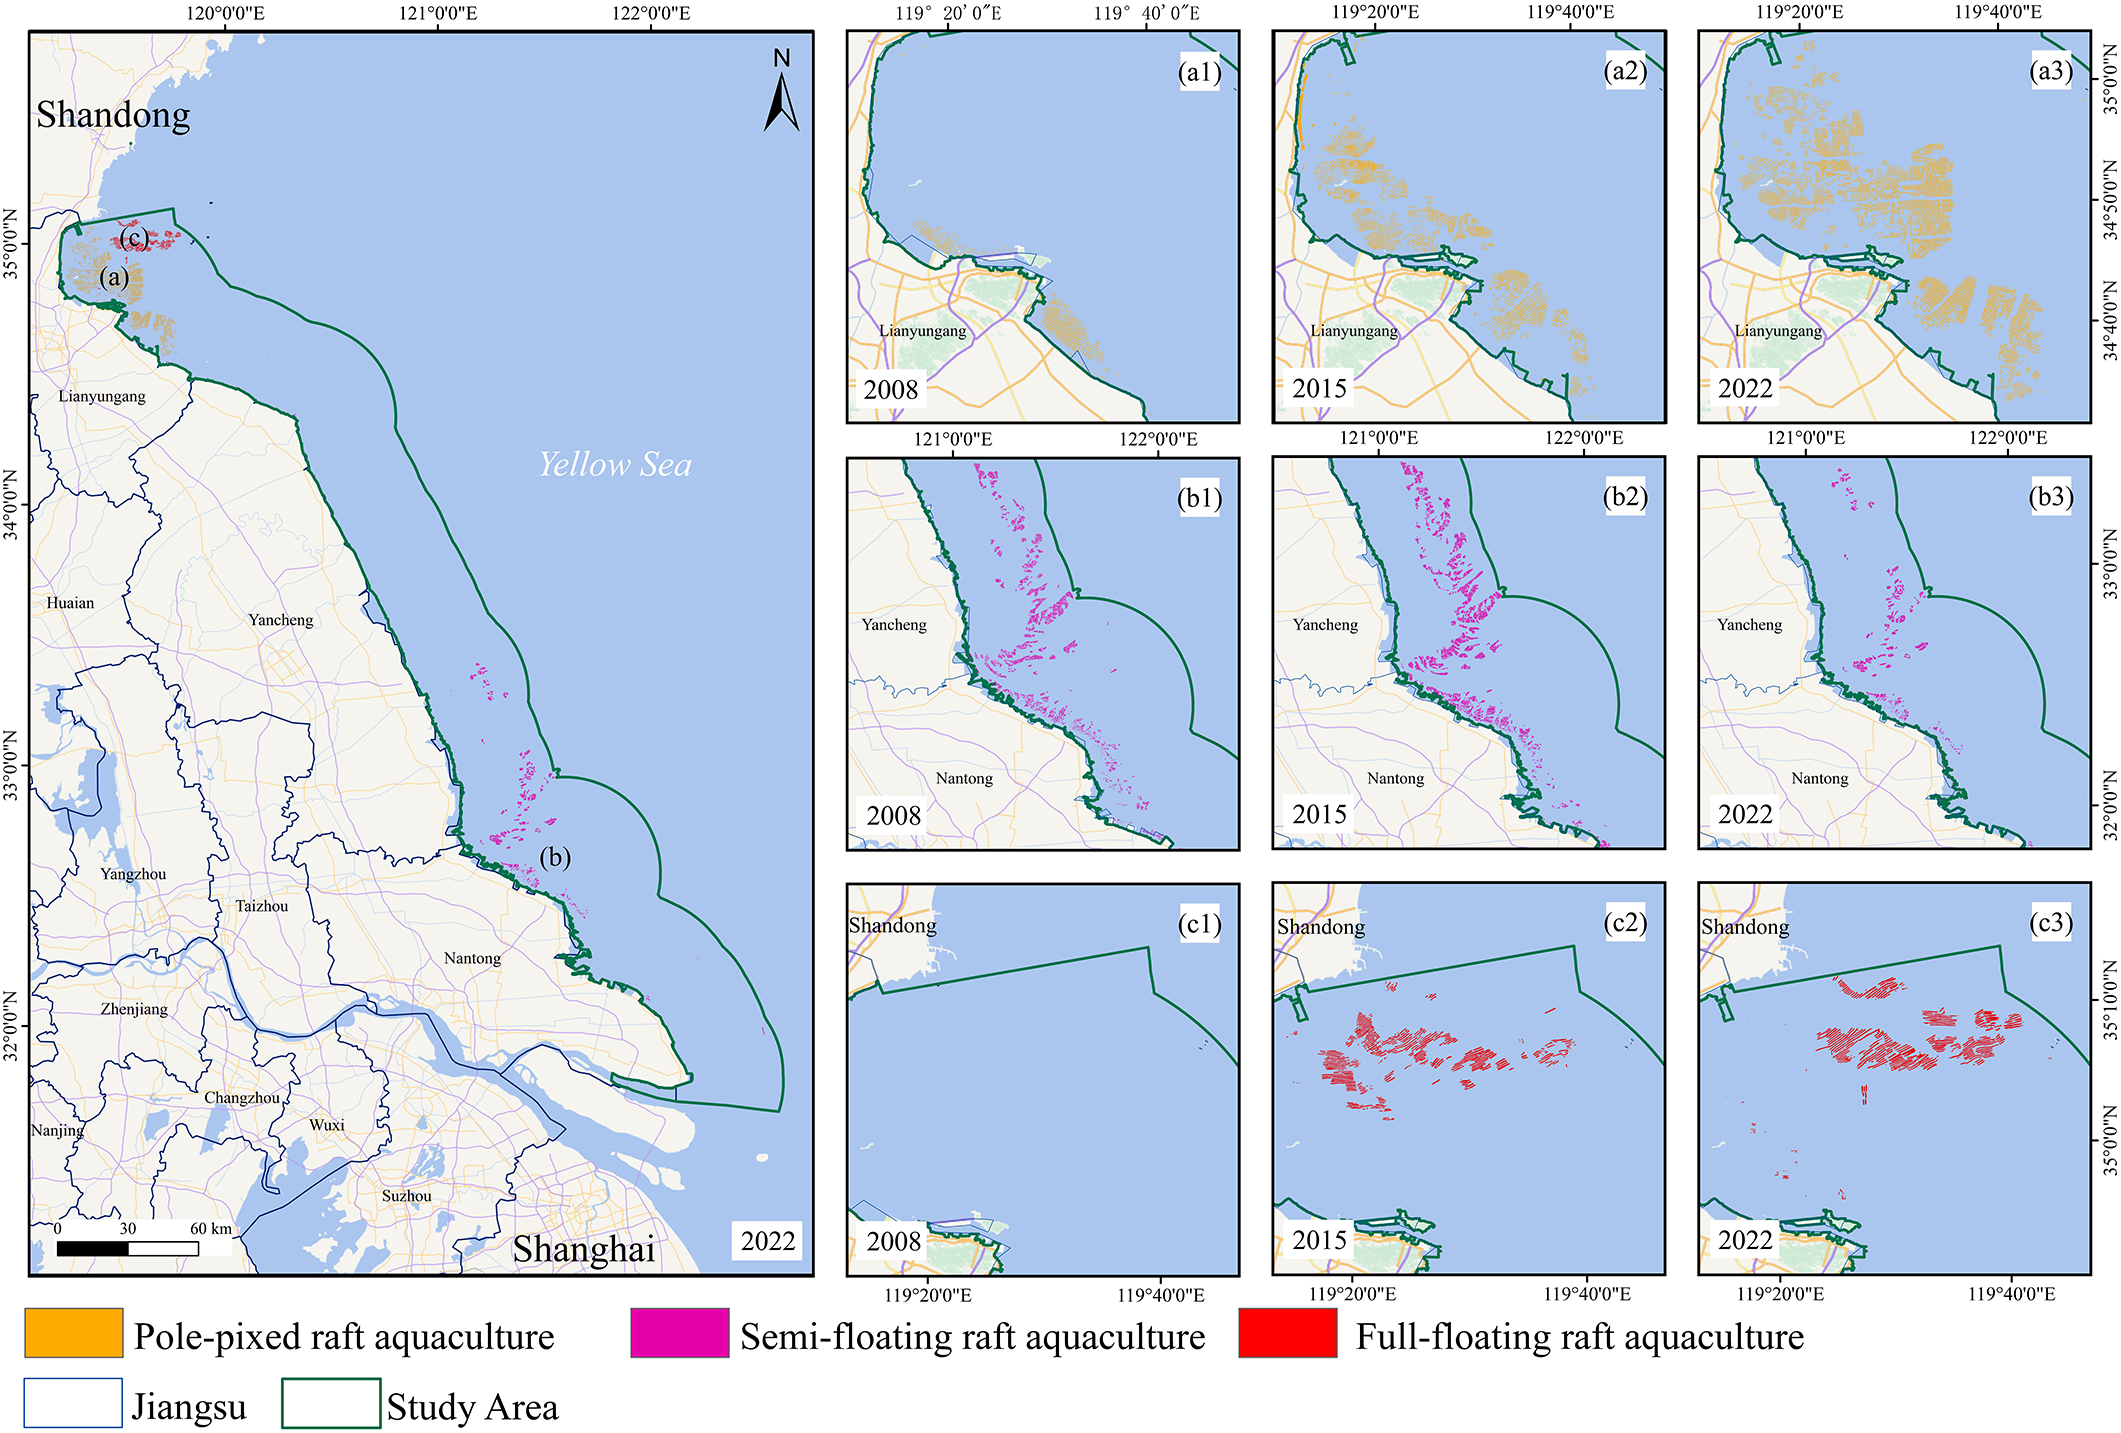
Dynamic changes of pole-pixed raft aquaculture (a1-a3), semi-floating raft aquaculture (b1-b3), and full-floating raft aquaculture (c1-c3).
Figure 10 shows changes in the nuclear density of MFRA in Jiangsu Province. Raft aquaculture in Jiangsu Province is distributed in Haizhou Bay of Lianyungang City, the radial ridge group region of Yancheng City, and the northern coast of Nantong City. The density of raft aquaculture in the Haizhou Bay area of Lianyungang City experienced a process of rapid growth followed by a slow decline. The raft aquaculture in Yancheng City and Nantong City was adjacent to each other, and the overall density experienced a trend of slow growth followed by a rapid decline.
Figure 10
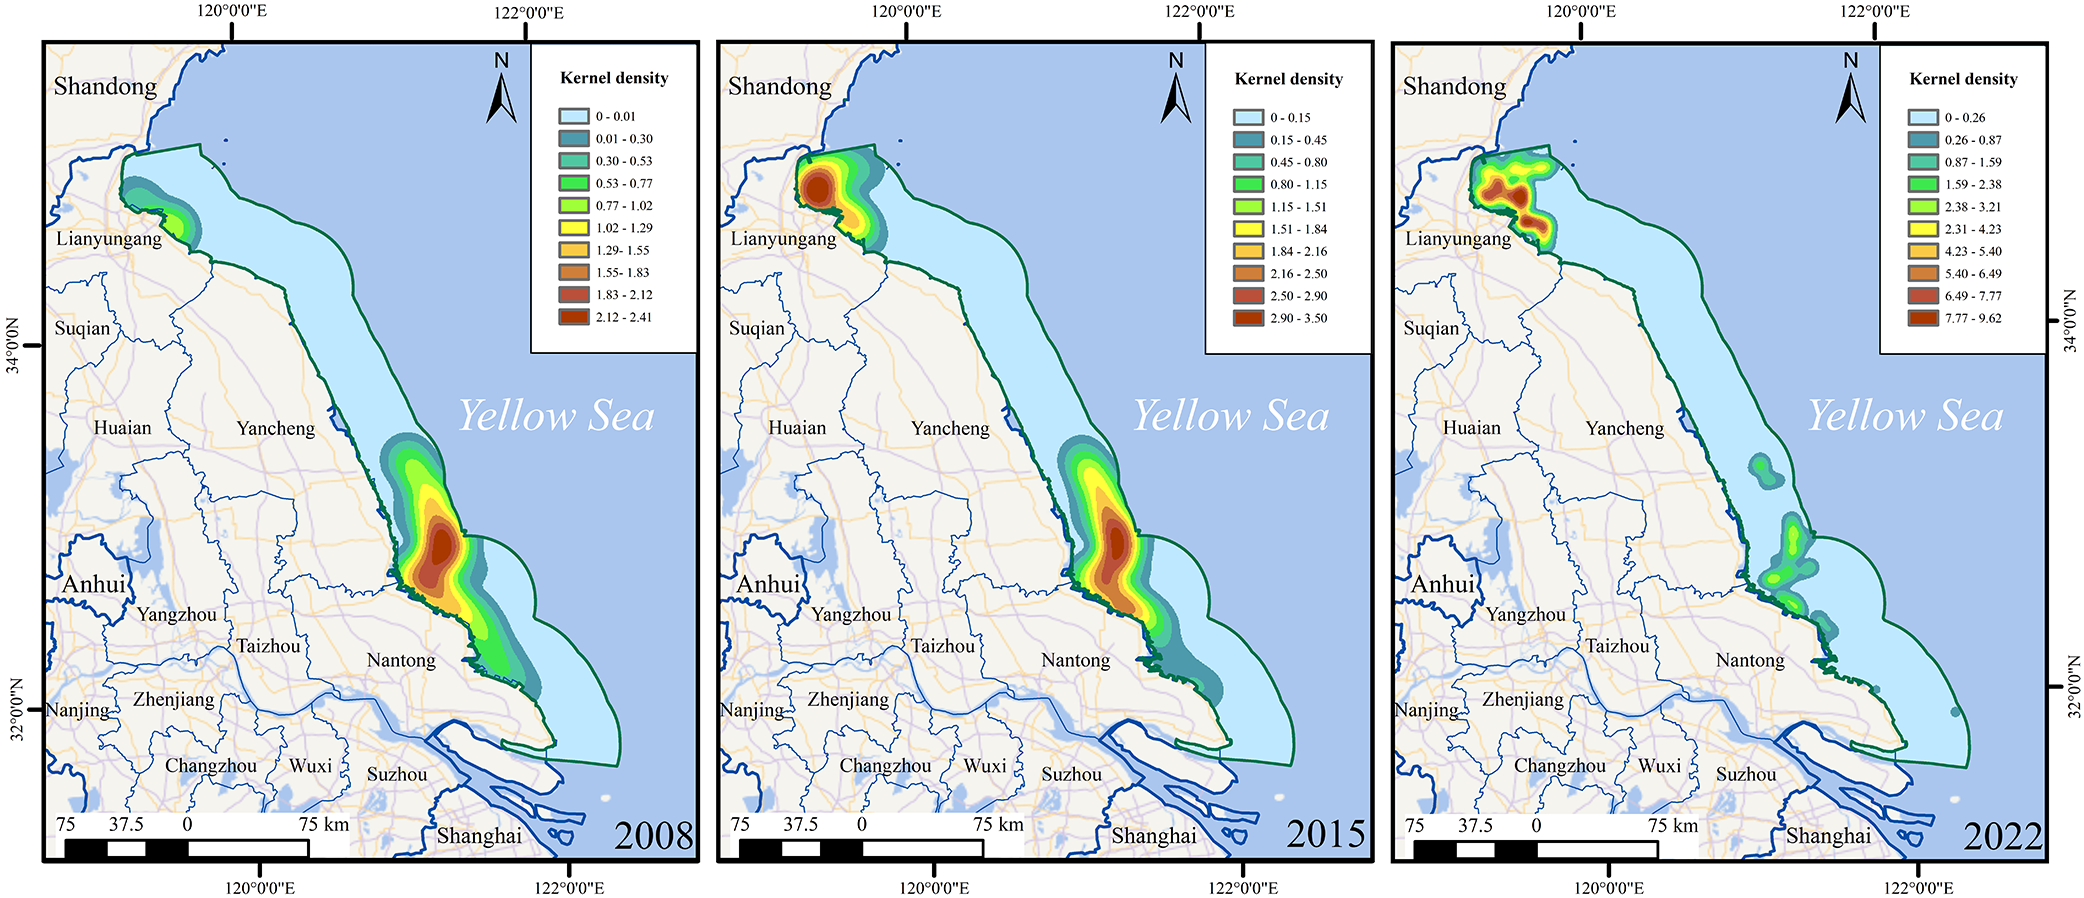
Kernel density analysis of raft aquaculture in Jiangsu province, 2008, 2015 and 2022.
5 Discussion
5.1 Policy drivers behind temporal and spatial changes
Since 1953, China has formulated The Five-Year Plan for National Economic and Social Development, which sets goals and directions for national economic development every five years, including special plans for fisheries. The Fisheries Development Plan of the 11th to 14th Five-Year Plan (2005–2025) issued by the Ministry of Agriculture and Rural Affairs of Jiangsu Province counted the achievement of the previous five-year target and also mentioned important instructions for upgrading the aquaculture industry from traditional capture fisheries. According to the Fisheries Development Plan, the utilization rate of shallow sea areas in the island groups of Lian Dao, Qin Shan Dao, and the nearshore waters of Lianyungang will be increased, and a seaweed, crab, and shellfish breeding base is planned to be established in Haizhou Bay. Yancheng City plans to take full advantage of the sandbanks and radial sand ridge group region to vigorously develop shellfish and algae aquaculture production. The temporal and spatial changes of MFRA in Jiangsu Province appear to be in response to the relevant Fisheries Development Plan. The marine raft aquaculture in Jiangsu Province experienced a rapid expansion from 2008 to 2015. In the Haizhou Bay area of Lianyungang City, the scale of both pole-fixed and full-floating raft aquaculture has steadily increased year by year.
However, the semi-floating floating raft aquaculture in the Radiation Shazhou area of Yancheng City has experienced a substantial reduction in its cultivation area from 2015 to 2022. As we know, in 2016, China’s Ministry of Agriculture issued a document on the guiding opinions on speeding up the promotion of fishery transformation and structural adjustment, which explicitly required the improvement of the aquaculture waters, beach and mudflat planning, and scientific layout of marine aquaculture. Subsequently, the Jiangsu Provincial Aquaculture Waters and Mudflats Plan (2020-2030) issued by the Ministry of Agriculture and Rural Affairs of Jiangsu Province delineates Jiangsu Province’s aquaculture waters and mudflats into three categories: prohibited aquaculture zones, restricted aquaculture zones, and designated aquaculture zones. As shown in Figure 11, part of the radial sand ridge group region in Yancheng waters was classified as the restricted aquaculture zone (Figure 11 highlighted in blue box). Consequently, semi-floating raft aquaculture in the restricted aquaculture zones experienced a significant reduction in scale between 2015 and 2022. The prohibited aquaculture zones delineated in Lianyungang City waters further regulate the development of pole-pixed raft aquaculture, which can be reflected in the red and orange highlighted areas in Figure 11.
Figure 11
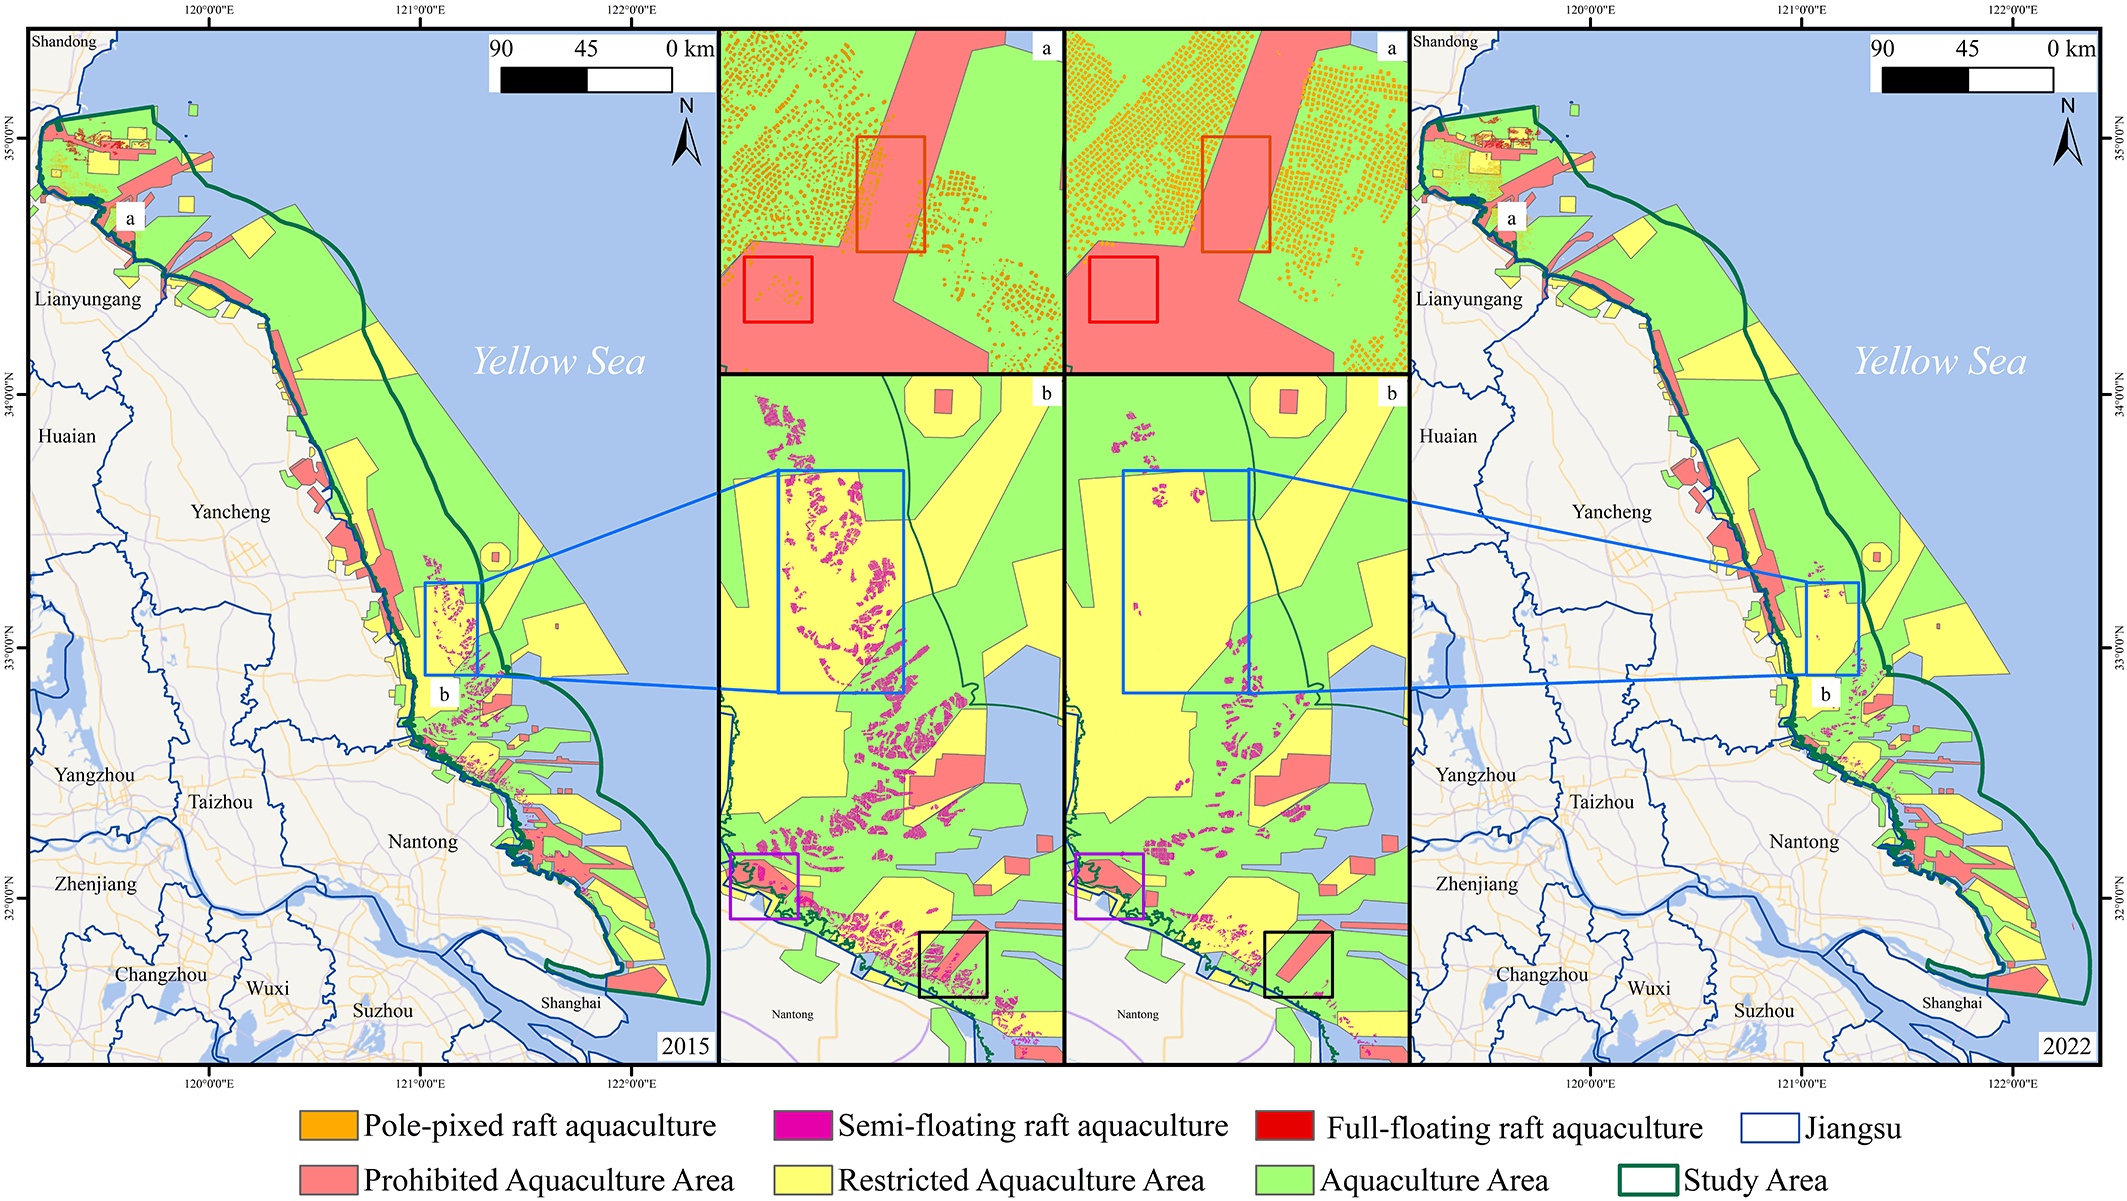
The prohibited aquaculture zones, restricted aquaculture zones, and designated aquaculture zones in Jiangsu Province.
5.2 Spatial distribution analysis in relation to coastal distance
The spatial distribution of different types of MFRA varies greatly along the coastal zone. To analyze the spatial distribution of the three types of MFRA, the entire study area of the 40-km buffer zone was divided into eight statistical areas at 5 km intervals and the proportion relationship of the areas occupied by the three types of MFRA in different distance zones from the coastline was statistically analyzed. As shown in Figure 12a, the spatial distribution of pole-fixed raft aquaculture in Jiangsu Province has exhibited a notable seaward expansion during the study period. In 2008, these aquaculture installations were predominantly located within 5 km of the coastline. By 2015, the majority had extended to within 15 km of the shore, and by 2022, they reached up to 20 km offshore. This finding is corroborated by (a1-a3) in Figure 9. As shown in Figure 12b, the spatial distribution of semi-floating raft aquaculture in Jiangsu Province varies with distance from the coastline. Approximately 48% of the total aquaculture area is located between 20 and 35 km from the shore and less than 4% is situated between 35 and 40 km from the coastline. The decline in semi-floating raft aquaculture within the 0 to 10 km range from the coastline can be observed from 2008 to 2022. As shown in Figure 12c, in 2008, the presence of full-floating raft aquaculture was non-existent, while in 2015, the majority of full-floating raft aquaculture was distributed within 5 to 35 km from the coastline, and within 10 to 40 km in 2022. This indicates an overall extension into the deep sea, a conclusion that is also verified in Figure 9 (c1-c3).
Figure 12
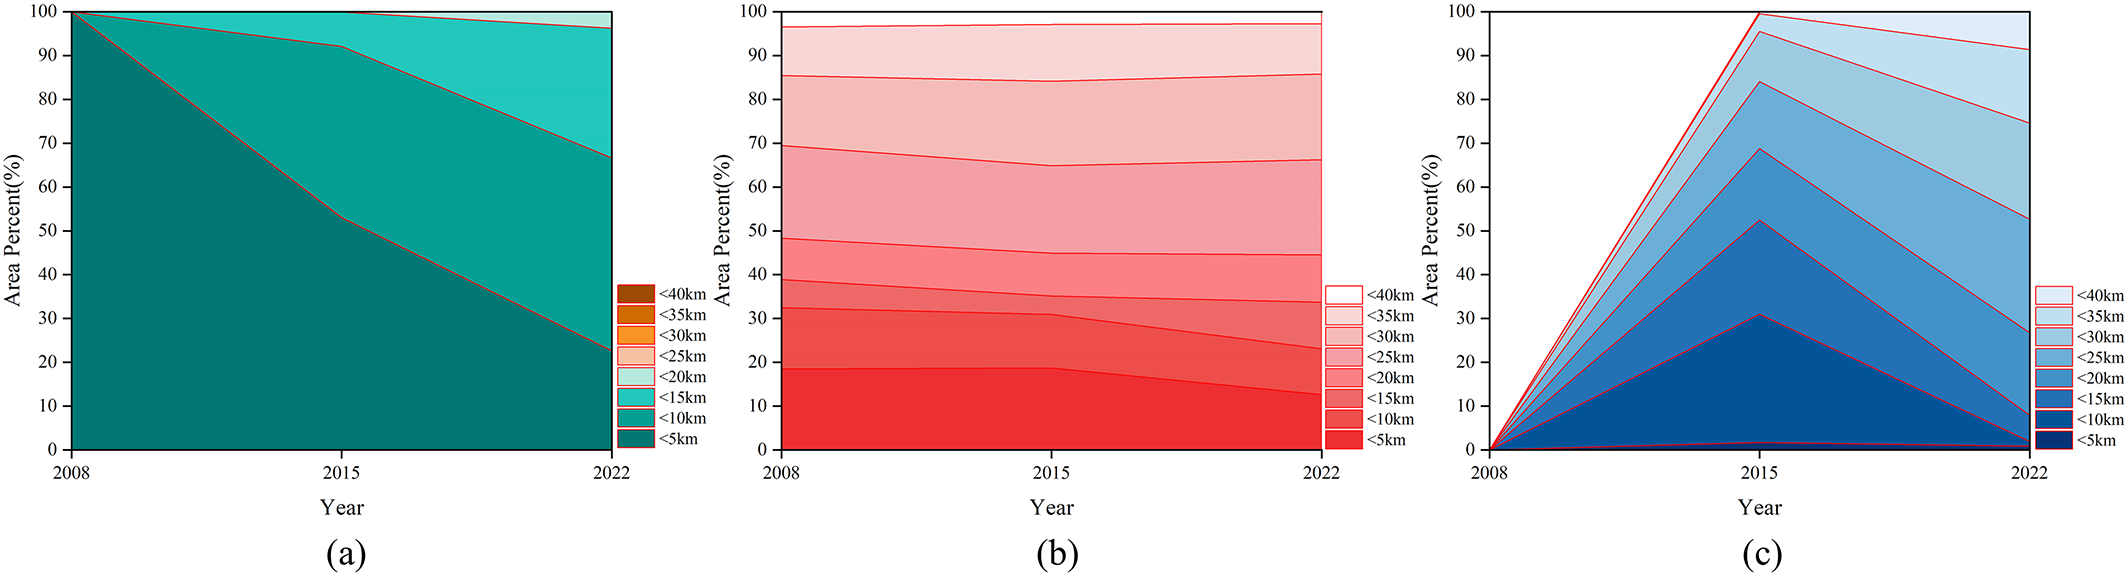
The cumulative proportion of the area distribution of different types of MFRA in the coastline space: (a) Pole-pixed raft aquaculture, (b) semi-floating raft aquaculture, (c) and full-floating raft aquaculture.
5.3 Limitations of the study
In this study, the spatiotemporal distribution and long-term changes of MFRA were obtained by using multi-source SAR imagery. However, as the ALOS-1 FBD and Sentinel-1 IW GRD images differ in resolution and polarization modes, the use of multi-source data may increase errors in the extraction results. The extraction results obtained from the ALOS-1 dataset are inferior to those derived from the Sentinel-1 dataset, thus leaving for improvement. In addition, although our results show strong consistency with the fishery statistical yearbook data, the errors in the area still exist. Since the area of the marine aquaculture in this study was calculated based on the image resolution and the number of extracted pixels, future studies could try to use high-resolution SAR images. Furthermore, although the BE-Swin model proposed in this paper effectively mitigates boundary issues to some extent, issues such as incompleteness and adhesion persist, particularly in full-floating raft aquaculture. Therefore, developing a better model by introducing hybrid attention mechanisms and optimizing the boundary enhancing modules is worthy of further exploration. As a direction for future research, we also intend to investigate multimodal fusion approaches that combine Sentinel-1 and ALOS-1 PolSAR data. This may help to exploit the complementary spatial, spectral, and temporal characteristics of the two datasets, potentially enhancing the accuracy and robustness of MFRA extraction.
6 Conclusions
Compared with optical images, SAR images can be acquired 24 hours a day, 7 days a week, without the constraints of cloud cover, snow, and ice. In this study, we developed a deep neural network tailored for extracting different types of MFRA from dual-polarized SAR imagery and obtained the distributions and dynamic changes of MFRA in Jiangsu Province from 2008 to 2022 by using ALOS-1 and Sentinel-1 images. The following conclusions were drawn:
-
1. Combining ALOS-1 and Sentinel-1 data makes it possible to map the long-term dynamics of the MFRA in Jiangsu province, China. The spatiotemporal distribution and area data of MFRA obtained from SAR images are of great significance for verifying the implementation effect of local policies and the scientific conservation of coastal marine ecosystems.
-
2. The BE-Swin model can enhance the extraction of boundary information for MFRA, eliminating errors, omissions, and adhesion issues at the boundaries. Compared with other deep neural network models, the BE-Swin model improved the extraction accuracy. The overall accuracy of the proposed model in Sentinel-1 data reached 95.71% and was also as high as 93.71% in ALOS-1 data.
-
3. MFRA in Jiangsu Province is distributed in Haizhou Bay of Lianyungang City, the radial ridge group region of Yancheng City, and the northern coast of Nantong City. In general, raft aquaculture in the entire coastal area of Jiangsu Province experienced a rapid expansion to a slow contraction from 2008 to 2022. It appears to be in response to the relevant Fisheries Development Plan.
-
4. MFRA in Jiangsu Province is divided into three categories, namely, pole-pixed raft aquaculture, semi-floating raft aquaculture, and full-floating raft aquaculture. The area of pole-fixed raft aquaculture has steadily increased over the year and reached 171.38 km2 in 2022. The area of semi-floating raft aquaculture in Jiangsu Province has experienced a change of increasing and then decreasing from 2008 to 2022. It reached a peak of 318.36 km2 in 2015 and dismantled by nearly half in 2022. Full-floating raft aquaculture was not adopted in aquaculture in Jiangsu Province in the early stage, but there is a tendency to gradually form large-scale aquaculture, which reached 78.42 km2 in 2022.
Statements
Data availability statement
The raw data supporting the conclusions of this article will be made available by the authors, without undue reservation.
Author contributions
WL: Methodology, Data curation, Writing – original draft, Investigation, Validation, Conceptualization. JX: Funding acquisition, Supervision, Conceptualization, Writing – review & editing, Methodology. YC: Supervision, Writing – review & editing. CL: Writing – review & editing, Supervision.
Funding
The author(s) declare that financial support was received for the research and/or publication of this article. This work was supported by Key Laboratory of Land Satellite Remote Sensing Application, Ministry of Natural Resources of the People’s Republic of China (No.KLSMNR-K202209), the special fund for Natural Resources Development (Innovation Project of Marine Science and Technology) of Jiangsu Province (No. JSZRHYKJ202101), the Jiangsu AgriculturaScience and Technology Innovation Fund under Grant (No.CX(22)2001).
Acknowledgments
We thank the Japan Aerospace Exploration Agency and European Space Agency for distributing the ALOS-1 and Sentinel-1 data and the Institute of Geographic Sciences and Natural Resources Research, Chinese Academy of Sciences for providing the East Asian Monsoon Eco-geographic Zone Boundary dataset.
Conflict of interest
The authors declare that the research was conducted in the absence of any commercial or financial relationships that could be construed as a potential conflict of interest.
Generative AI statement
The author(s) declare that no Generative AI was used in the creation of this manuscript.
Publisher’s note
All claims expressed in this article are solely those of the authors and do not necessarily represent those of their affiliated organizations, or those of the publisher, the editors and the reviewers. Any product that may be evaluated in this article, or claim that may be made by its manufacturer, is not guaranteed or endorsed by the publisher.
References
1
Anh P. T. Kroeze C. Bush S. R. Mol A. P. J. (2010). Water pollution by intensive brackish shrimp farming in south-east Vietnam: Causes and options for control. Agr Water Manage97, 872–882. doi: 10.1016/j.agwat.2010.01.018
2
Chen W. Li X. (2024). Deep-learning-based marine aquaculture zone extractions from dual-polarimetric SAR imagery. IEEE J-stars17, 8043–8057. doi: 10.1109/JSTARS.2024.3384511
3
Choe B.-H. Kim D. Hwang J.-H. Oh Y. Moon W. M. (2012). Detection of oyster habitat in tidal flats using multi-frequency polarimetric SAR data. Estuarine Coast. Shelf Sci.97, 28–37. doi: 10.1016/j.ecss.2011.11.007
4
Crona B. Wassénius E. Troell M. Barclay K. Mallory T. Fabinyi M. et al . (2020). China at a crossroads: an analysis of China’s changing seafood production and consumption. One Earth3, 32–44. doi: 10.1016/j.oneear.2020.06.013
5
Duan Y. Tian B. Li X. Liu D. Sengupta D. Wang Y. et al . (2021). Tracking changes in aquaculture ponds on the China coast using 30 years of Landsat images. Int. J. Appl. Earth Obs.102, 102383. doi: 10.1016/j.jag.2021.102383
6
Emenike E. C. Iwuozor K. O. Anidiobi S. U. (2022). Heavy metal pollution in aquaculture: sources, impacts and mitigation techniques. Biol. Trace Elem. Res.200, 4476–4492. doi: 10.1007/s12011-021-03037-x
7
Fan T. Wang G. Li Y. Wang H. (2020). MA-net: A multi-scale attention network for liver and tumor segmentation. IEEE Access8, 179656–179665. doi: 10.1109/ACCESS.2020.3025372
8
FAO (2022). The state of world fisheries and aquaculture 2022 (FAO). Available online at: https://openknowledge.fao.org/handle/20.500.14283/cc0461en (Accessed February 4, 2025).
9
Gao L. Wang C. Liu K. Chen S. Dong G. Su H. (2022). Extraction of floating raft aquaculture areas from sentinel-1 SAR images by a dense residual U-net model with pre-trained resnet34 as the encoder. Remote Sens.14, 3003. doi: 10.3390/rs14133003
10
Jia S. Xue D. Li C. Zheng J. Li W. (2019). Study on new method for water area information extraction based on Sentinel-1 data. Yangtze River50, 213–217. doi: 10.16232/j.cnki.1001-4179.2019.02.038
11
Lee S.-K. Hong S.-H. Kim S.-W. Yamaguchi Y. Won J.-S. (2006). Polarimetric features of oyster farm observed by AIRSAR and JERS-1. IEEE Trans. Geosci. Remote Sens.44, 2728–2735. doi: 10.1109/TGRS.2006.879107
12
Liu Z. Lin Y. Cao Y. Hu H. Wei Y. Zhang Z. et al . (2021). Swin transformer: Hierarchical vision transformer using shifted windows. 10012–10022. Available online at: https://openaccess.thecvf.com/content/ICCV2021/html/Liu_Swin_Transformer_Hierarchical_Vision_Transformer_Using_Shifted_Windows_ICCV_2021_paper (Accessed February 19, 2025).
13
Liu C. Shi R. (2015). Boundary Data of East Asia Summer Monsoon Geo_Eco_region (EASMBND). doi: 10.3974/geodb.2015.01.12.V1
14
Liu Y. Wang Z. Yang X. Zhang Y. Yang F. Liu B. et al . (2020). Satellite-based monitoring and statistics for raft and cage aquaculture in China’s offshore waters. Int. J. Appl. Earth Obs.91, 102118. doi: 10.1016/j.jag.2020.102118
15
Liu C. Xu J. Ding H. Li Z. (2023). Marine RAFT aquaculture type identification from polarimetric SAR image based on dual-branch hybrid encoding network, dbhe-net., in 2023 SAR in Big Data Era (BIGSARDATA). 1–4. doi: 10.1109/BIGSARDATA59007.2023.10294766
16
Oktay O. Schlemper J. Folgoc L. L. Lee M. Heinrich M. Misawa K. et al . (2018). Attention U-net: Learning where to look for the pancreas. doi: 10.48550/arXiv.1804.03999
17
Quaade S. Vallebueno A. Alcabes O. D. N. Rodolfa K. T. Ho D. E. (2024). Locating and measuring marine aquaculture production from space: A computer vision approach in the French Mediterranean. doi: 10.48550/arXiv.2406.13847
18
Román A. Prasyad H. Oiry S. Davies B. F. R. Brunier G. Barillé L. (2023). Mapping intertidal oyster farms using unmanned aerial vehicles (UAV) high-resolution multispectral data. Estuarine Coast. Shelf Sci.291, 108432. doi: 10.1016/j.ecss.2023.108432
19
Rosenqvist A. Shimada M. Ito N. Watanabe M. (2007). ALOS PALSAR: A pathfinder mission for global-scale monitoring of the environment. IEEE T Geosci. Remote45, 3307–3316. doi: 10.1109/TGRS.2007.901027
20
Sun Z. Luo J. Yang J. Yu Q. Zhang L. Xue K. et al . (2020). Nation-scale mapping of coastal aquaculture ponds with sentinel-1 SAR data using google earth engine. Remote Sens.12, 3086. doi: 10.3390/rs12183086
21
Travaglia C. Profeti G. Aguilar-Manjarrez J. Lopez N. A. Nations, F. and A. O. of the U (2004). Mapping coastal aquaculture and fisheries structures by satellite imaging radar: Case study of the Lingayen gulf, The Philippines (Viale delle Terme di Caracalla, 00100 Rome, Italy: Food & Agriculture Org).
22
Xu N. Wang Y. Huang C. Jiang S. Jia M. Ma Y. (2022). Monitoring coastal reclamation changes across Jiangsu Province during 1984–2019 using landsat data. Mar. Policy136, 104887. doi: 10.1016/j.marpol.2021.104887
23
Zhang C. Chen J. Lin K. Ding X. Yuan R. Kang Y. (2011). Spatial layout of reclamation of coastal tidal flats in Jiangsu Province. J. Hohai University(Natural Sciences)39, 206–212.
24
Zhang Y. Wang C. Ji Y. Chen J. Deng Y. Chen J. et al . (2020). Combining segmentation network and nonsubsampled contourlet transform for automatic marine raft aquaculture area extraction from sentinel-1 images. Remote Sens-basel12, 4182. doi: 10.3390/rs12244182
Summary
Keywords
synthetic aperture radar (SAR), marine floating raft aquaculture (MFRA), dynamic change, sentinel-1, ALOS-1, swin transformer
Citation
Li W, Xu J, Chen Y and Liu C (2025) Dynamic monitoring of marine floating raft aquaculture in Jiangsu province based on multi-source SAR imagery. Front. Mar. Sci. 12:1594048. doi: 10.3389/fmars.2025.1594048
Received
15 March 2025
Accepted
15 April 2025
Published
09 May 2025
Volume
12 - 2025
Edited by
Dongjie Fu, Chinese Academy of Sciences (CAS), China
Reviewed by
Xiaomeng Geng, Hebei Normal University, China
Yueming Liu, Chinese Academy of Sciences (CAS), China
Updates
Copyright
© 2025 Li, Xu, Chen and Liu.
This is an open-access article distributed under the terms of the Creative Commons Attribution License (CC BY). The use, distribution or reproduction in other forums is permitted, provided the original author(s) and the copyright owner(s) are credited and that the original publication in this journal is cited, in accordance with accepted academic practice. No use, distribution or reproduction is permitted which does not comply with these terms.
*Correspondence: Jia Xu, hhuxj@hhu.edu.cn
Disclaimer
All claims expressed in this article are solely those of the authors and do not necessarily represent those of their affiliated organizations, or those of the publisher, the editors and the reviewers. Any product that may be evaluated in this article or claim that may be made by its manufacturer is not guaranteed or endorsed by the publisher.