Abstract
Introduction:
The creation of safety culture in shipping industry is an important measure for reducing ship accidents and improving navigation safety. On the basis of literature review and theoretical assessments, this paper puts forward the conceptual logical framework and research hypotheses of safety culture and safety behavior. The purpose of this paper is to explore the effect of safety culture on ship officers' safety behavior.
Method:
This paper developed a scale by referring to the well-established safety culture and safety behavior scales proposed in previous literature and combined with the shipping background. Based on self-reported questionnaire and primary data collected from 229 deck officers and captains from a shipping company in Shanghai, a relationship model between safety culture and safety behavior was constructed using structural equation modeling (SEM), and empirical tests were conducted to explore the impact of safety culture on ship officers’ safety behavior.
Results:
The results show that safety culture has a positive impact on ship officers’ safety behavior, in which safety material culture has a positive impact on safety compliance behavior, safety system culture has positive impacts on safety compliance behavior and prosocial safety behavior, while safety management culture and safety value fit have positive impacts on all dimensions of ship officers’ safety behavior.
Discussion:
This paper proposes and validates a new model that can help explore the impact of safety culture on the safety behavior of ship officers. The research results indicate that we can improve ship officers’ safety behavior from two dimensions: safety management culture and safety value fit. More importantly, the research findings can help shipping companies develop measures to improve ship officers’ behavior based on their own circumstances, thereby reducing the likelihood of maritime accidents. The results of this paper will contribute to the development of safety management in shipping industry.
1 Introduction
Maritime transportation serves as a pivotal component within global trade networks, with approximately 90 percent of global goods being transported by ships. Ships are the workplace and living quarters for ship officers, often exposed to harsh environments (Altinpinar and Başar, 2022). Maritime accidents often lead to the loss of life, property, and marine environment (Xi et al., 2023; Wang et al., 2023; Aydin et al., 2021). Despite recent developments in safety, seafaring is still considered one of the most dangerous occupations (Altinpinar and Başar, 2022). According to the European Maritime Safety Agency (2023), from 2014 to 2022, the total number of reported maritime casualties and incidents was 23814, with human factors accounting for 80.7%. From this, it can be seen that the behavior of ship officers remains an important factor affecting maritime transportation safety.
In order to reduce the frequency of human errors, in 1993, the International Maritime Organization (IMO) issued the International Safety Management Code (ISM) (IMO, 1993), which compels the shipping companies to establish a safety management system (SMS) to ensure safety by improving the behavior of ship officers. Although strengthening the safety management of shipping companies through the implementation of international conventions reduces the occurrence of unsafe human acts, at the same time, serious maritime accidents still occur occasionally (Altinpinar and Başar, 2022). Human factors still play an important role in today’s maritime accidents (Erdem et al., 2024), and there is still a long way to go to improve ship officers’ safety behavior.
In order to improve safety behavior, significant efforts have been made in previous research. Previous studies have found that measuring safety culture can provide tangible indicators for the impact of existing status and planned improvements (Berg, 2013), and enable us to determine where to start improving safety behavior. For example, the root cause of the sinking accident of passenger ship “Seol” is believed to be the total collapse of the safety culture of the shipping company, and the lack of safety culture has led to the dulling of risk perception, the decay of the implementation of safety procedures, and the rupture of the safety responsibility chain between enterprises and ship officers (Wang et al., 2020; Lee et al., 2017). The impact of safety culture on safety behavior has been validated in high-risk industries such as coal mining and construction (e.g. Bhattacharjee et al., 2025; Kapusta et al., 2024; Pratama and Caponecchia, 2025). In the shipping industry, Ek et al. (2000) developed the first version of a questionnaire for measuring safety culture on board ships. On this basis, Håvold (2005) empirically demonstrated the relationship between a set of safety culture cognition and safety behavior in the shipping industry. Since then, with the continuous deepening of research, the study of safety culture has shown a diversified trend. Previous studies have considered the influence of different factors on safety culture (For example, Min Jung (2021) compared the differences in safety culture levels between domestic and international seafarers. Darbra et al. (2007) found that factors such as commercial pressure have an impact on the safety culture of pilots), and the impact of safety culture on the safety behavior of crew members with specific backgrounds (such as pilots, passenger ship crew, container ship crew, etc.) (e.g. Lu and Tsai, 2010; Lu and Yang, 2011; Zhang et al., 2021).
In summary, we believe that the study of ship officers of a particular ship type may lead to a lack of generalizability due to differences in the operating environment of the ship, and according to the European Maritime Safety Agency (2023), the high proportion of human factors in maritime casualties and accidents is common in all ship types. In view of this, this paper argues that in order to better discover the common problems in the shipping industry and improve the safety behavior of ship officers, it is necessary to explore the impact of safety culture in the shipping industry on the safety behavior of ship officers of various ship types, that is, to evaluate the safety culture level of the shipping industry from the overall level, in order to provide a theoretical basis for shipping safety management and assist the development of safety culture in the shipping industry. In addition, in order to better describe the various behaviors of ship officers to maintain their own safety and the ship’s safety, this paper intends to subdivide the ship officers’ safety behavior into safety compliance behavior, prosocial safety behavior and proactive safety behavior on the basis of previous research.
The rest of this paper is organized as follows. Chapter 2 presents the theoretical background and proposes the research hypotheses by reviewing the relevant literature. Chapter 3 describes the methodology that encompasses scale collection and data analysis. The results of the empirical analyses are presented in Chapter 4. The research results are discussed in Chapter 5 and the impact and limitations of the study are introduced in Chapter 6.
2 Theoretical background and research hypothesis
2.1 Safety culture
The term “safety culture” was first introduced by the international atomic energy agency (IAEA) in a report issued after the Chernobyl nuclear accident in 1986. The safety culture is defined as “an organizational atmosphere where safety and health are understood and accepted as top priorities” by the International Nuclear Safety Advisory Group (INSAG,1996). Since then, safety culture has been widely used in the investigation and analysis of major accidents, and active research and exploration of safety culture have been performed in different fields. With the deepening of research on safety culture in various industries, different organizations and individuals have put forward different definitions of safety culture. It is worth noting that there are also significant differences in the dimension division of safety culture in previous studies.
Safety culture is considered as an informal set of norms and values that improve safety performance by controlling interactions between individuals and groups (Darbra et al., 2007). The core of safety culture lies in the organization’s ability and willingness to take safety measures, prevent potential risks, and continuously promote safety (Berg, 2013). One of the most widely used definitions of safety culture is put forward by the Health and Safety Executive, which believes that safety culture is the product of the values, attitudes, and behavioral patterns of individuals and groups, and determines the health and safety management of an organization (HSE, 2005).
In the shipping industry, the International Chamber of Shipping (ICS) defines safety culture as sharing the concept of applying the best safety practices in the workplace, and ultimately reducing risks (ICS, 2013). IMO considered that safety must be regarded as the center of all decision making, and the success of safety culture will depend on the resources to support, nurture and develop it (IMO, 2003). In summary, although different organizations and individuals define safety culture differently, almost all definitions include attitude, behavior, management, and values.
In previous studies, there was no consensus on the dimensions of measuring safety culture, but several influential safety culture models have been formed: Guldenmund (2000) classified the safety culture into three dimensions, including visible artifacts, determinable espoused values, and intangible basic assumptions. Cooper (2000) regards safety culture as a subculture of organizations culture, while emphasizing that it is a product of the interaction between people (psychological), jobs (behavioral), and the organization (situational), this model has received support from many studies. Tian et al. (2011) pointed out that many scholars in China divide enterprise safety culture into four levels: safety concept culture, safety system culture, safety behavior culture, and safety material culture.
From the above review, it can be found that since the concept of safety culture was proposed, there has not been a unified definition or a set of measurement indicators applicable to all industries. The division of safety culture dimensions may vary depending on the research background, but in previous studies, the dimensions of safety culture mostly include values, systems, patterns of behavior and so on.
For ship officers, ships are relatively enclosed spaces and working conditions at sea can be very harsh, posing significant risks to ship officers (Altinpinar and Başar, 2022). Therefore, in our opinion, in order to ensure the safety of ship officers, the development of safety culture should include the following aspects. First of all, the occurrence of personal accidents is associated with the lack of use of protective equipment (Jensen, 2004). There should be good working conditions on board, including the provision of adequate personal protective equipment and sound emergency plans. Secondly, safety culture manifests as observable outputs in safety management practices (Ek et al., 2000). Therefore, there should be a good safety management system on board to promptly and effectively handle defects and hazards. In addition, the structure of safety culture is based on the understanding of policies, values, and beliefs related to safety held by the employees of an organization, these factors influence the safety behaviors and the occurrence of accidents (Kalteh et al., 2021). In this regard, the ship should have an appropriate safety system to guide the behavior of ship officers, and positive and effective communication should be maintained between organizations and ship officers to ensure consistent safety values.
Based on the definitions of safety culture by different organizations and individuals mentioned above (e.g. Berg, 2013; Darbra et al., 2007), as well as the different ways of dividing safety culture dimensions (Cooper, 2000; Guldenmund, 2000; Tian et al., 2011), and combined them with the characteristics of the shipping industry itself, this paper divides the safety culture into four dimensions including safety material culture, safety system culture, safety management culture, and safety value fit. Among them, safety material culture refers to the equipment and facilities provided by enterprises to ensure the physical and mental safety of employees, including personal protective equipment and emergency support, etc. Safety system culture refers to the rules and regulations that enterprises continuously modify and improve to constrain and guide employee behavior (Mei et al., 2017). Safety management culture refers to the practical practices, roles, and functions related to maintaining safety (Lu and Tsai, 2010). Safety value fit refers to the similarity in the evaluation and perception of the significance and importance of safety issues between enterprises and employees.
2.2 Safety behavior
In order to maintain effectiveness and support improvement, safety system should have a comprehensive and accurate performance measurement strategy (Oguz Erkal et al., 2023). Traditional safety performance measurement standards mainly rely on accident or injury data, but these data often have lag (Flin et al., 2000; Kao et al., 2009). Syed-Yahya et al. (2022a) discussed that although incidents and injuries stem from occurrences within the workplace, they are frequently impacted by safety-related behaviors. Therefore, most of the research works are focused on safety behavior, that is, safety behavior is regarded as a measure of safety performance.
Safety behavior can be defined as the actions or steps taken by individuals at workplace for advancing the health and safety of workers or environment (Kalteh et al., 2021). In literature related to occupational safety research, safety behavior has been conceptualized into multiple dimensions. One of the most widely adopted divisions is the study presented by Neal et al. (2000), which classified the safety behaviors into safety compliance and safety participation. Among them, safety compliance refers to the activities that individuals must perform to maintain workplace safety, including complying with standard work procedures and wearing personal protective equipment, and safety participation is defined as behavior that does not have a direct impact on personal safety, but helps in creating a safe environment, including participating in safety activities, attending safety meetings, etc (Lu and Yang, 2011; Neal et al., 2000). The safety compliance is the center of safety activities, which can maintain the minimum level of safety (Griffin and Curcuruto, 2016). Safety participation reflects the active participation and commitment of workers towards safety. By actively participating in safety activities and encouraging safe behaviors in colleagues, there is an improvement in the personal safety awareness and safety of work environment (Clarke, 2006).
In previous literature (e.g. Kvalheim and Dahl, 2016; Lu and Yang, 2011), active participation of employees in safety-related events is usually measured as a single structure, indicating that different safety participation behaviors have equal importance in predicting the organizational safety performance. However, emerging research suggests that specific safety behaviors have different impacts on safety performance. Curcuruto et al. (2015) argued that specific participation behaviors are related to different antecedents and consequences, so treating safety participation as a single dimension may be oversimplified and may overlook the important differences between specific behaviors and different safety performance outcomes. The classification of safety participation behaviors into prosocial safety behaviors and proactive safety behaviors can help improve the safety performance. Among them, prosocial safety behaviors are often expressed as helping colleagues and caring for their safety, while proactive safety behaviors aim to bring about positive changes in the safety aspects of the workplace.
According to the division of safety behavior dimensions in the research mentioned above (Curcuruto et al., 2015; Neal et al., 2000), in order to effectively describe the different levels of behaviors taken by ship officers for ensuring ship safety and reflect the proactive attitude of ship officers for maintaining the ship safety, proactive safety behavior as a measure of more initiative behavior of ship officers is proposed. Therefore, this paper divides safety behaviors into three dimensions: safety compliance behaviors, prosocial safety behaviors, and proactive safety behaviors, with definitions consistent with those in Neal et al.’s and Curcuruto et al.’s articles (Curcuruto et al., 2015; Neal et al., 2000).
2.3 Research hypothesis
The influence of positive safety culture within an organization on individual safety behavior has been accepted by the organizations and scholars (e.g. Kalteh et al., 2021; Nævestad, 2017). Safety material culture is the embodiment of enterprise safety culture in material form (Tian et al., 2011). According to Zohar and Luria (2003), about 40 percent of work-related accidents are caused by the failure to use protective equipment provided in the workplace, despite continuous efforts, this statistical data has remained unchanged for over 20 years. Jensen (2004) also found that the lack of personal protective equipment was significantly related to the increased risk of injury.
The safety system culture has a subtle effect on employees. Syed-Yahya et al. (2022b) argued that safety policies and systems introduced by managers may trigger positive safety behaviors among the employees. For ship officers, the working environment on board is harsh and safety requirements are high. Therefore, the safety system culture is needed to guide and constrain the behavior of ship officers.
Safety management culture expresses the organization’s commitment to safety, aimed at reducing their unsafe acts (Fernández-Muñiz et al., 2007). In the workplace, due to the short-term benefits that unsafe behavior can bring to employees, violations of safety management are common. Unsafe behavior is given greater psychological weight than accident risk in human decision-making, and safety behavior has therefore become a continuous management challenge (Luria, 2010).
The safety values are an overall evaluation of the role and significance of their own safety issues. Safety values are used to guide the safety behavior or norms of employees within the organization (Hogan and Coote, 2014). Xi et al. (2021) argued that safety culture is an informal set of values and norms, and these values will have an impact on safety behavior. Zhang et al. (2021) argued that the process of employees’ cognition and reflection on their values constitutes the first step towards safety culture, thereby enabling them to improve their safety behavior.
Based on previous studies and in the context of shipping industry, this paper proposes the following reasonable hypotheses:
-
Hypothesis 1: Shipping safety culture positively influences ship officers’ safety compliance behavior. Thus, safety material culture (H1-1), safety system culture (H1-2), safety management culture (H1-3), and safety value fit (H1-4) positively influence the ship officers’ safety compliance behavior.
-
Hypothesis 2: Shipping safety culture positively influences the ship officers’ prosocial safety behavior. Thus, safety material culture (H2-1), safety system culture (H2-2), safety management culture (H2-3), and safety value fit (H2-4) positively influence the ship officers’ prosocial safety behavior.
-
Hypothesis 3: Shipping safety culture positively influences the ship officers’ proactive safety behavior. Thus, safety material culture (H3-1), safety system culture (H3-2), safety management culture (H3-3), and safety value fit (H3-4) positively influence the ship officers’ proactive safety behavior.
The conceptual model for constructing the research hypotheses in this work is presented in Figure 1.
Figure 1
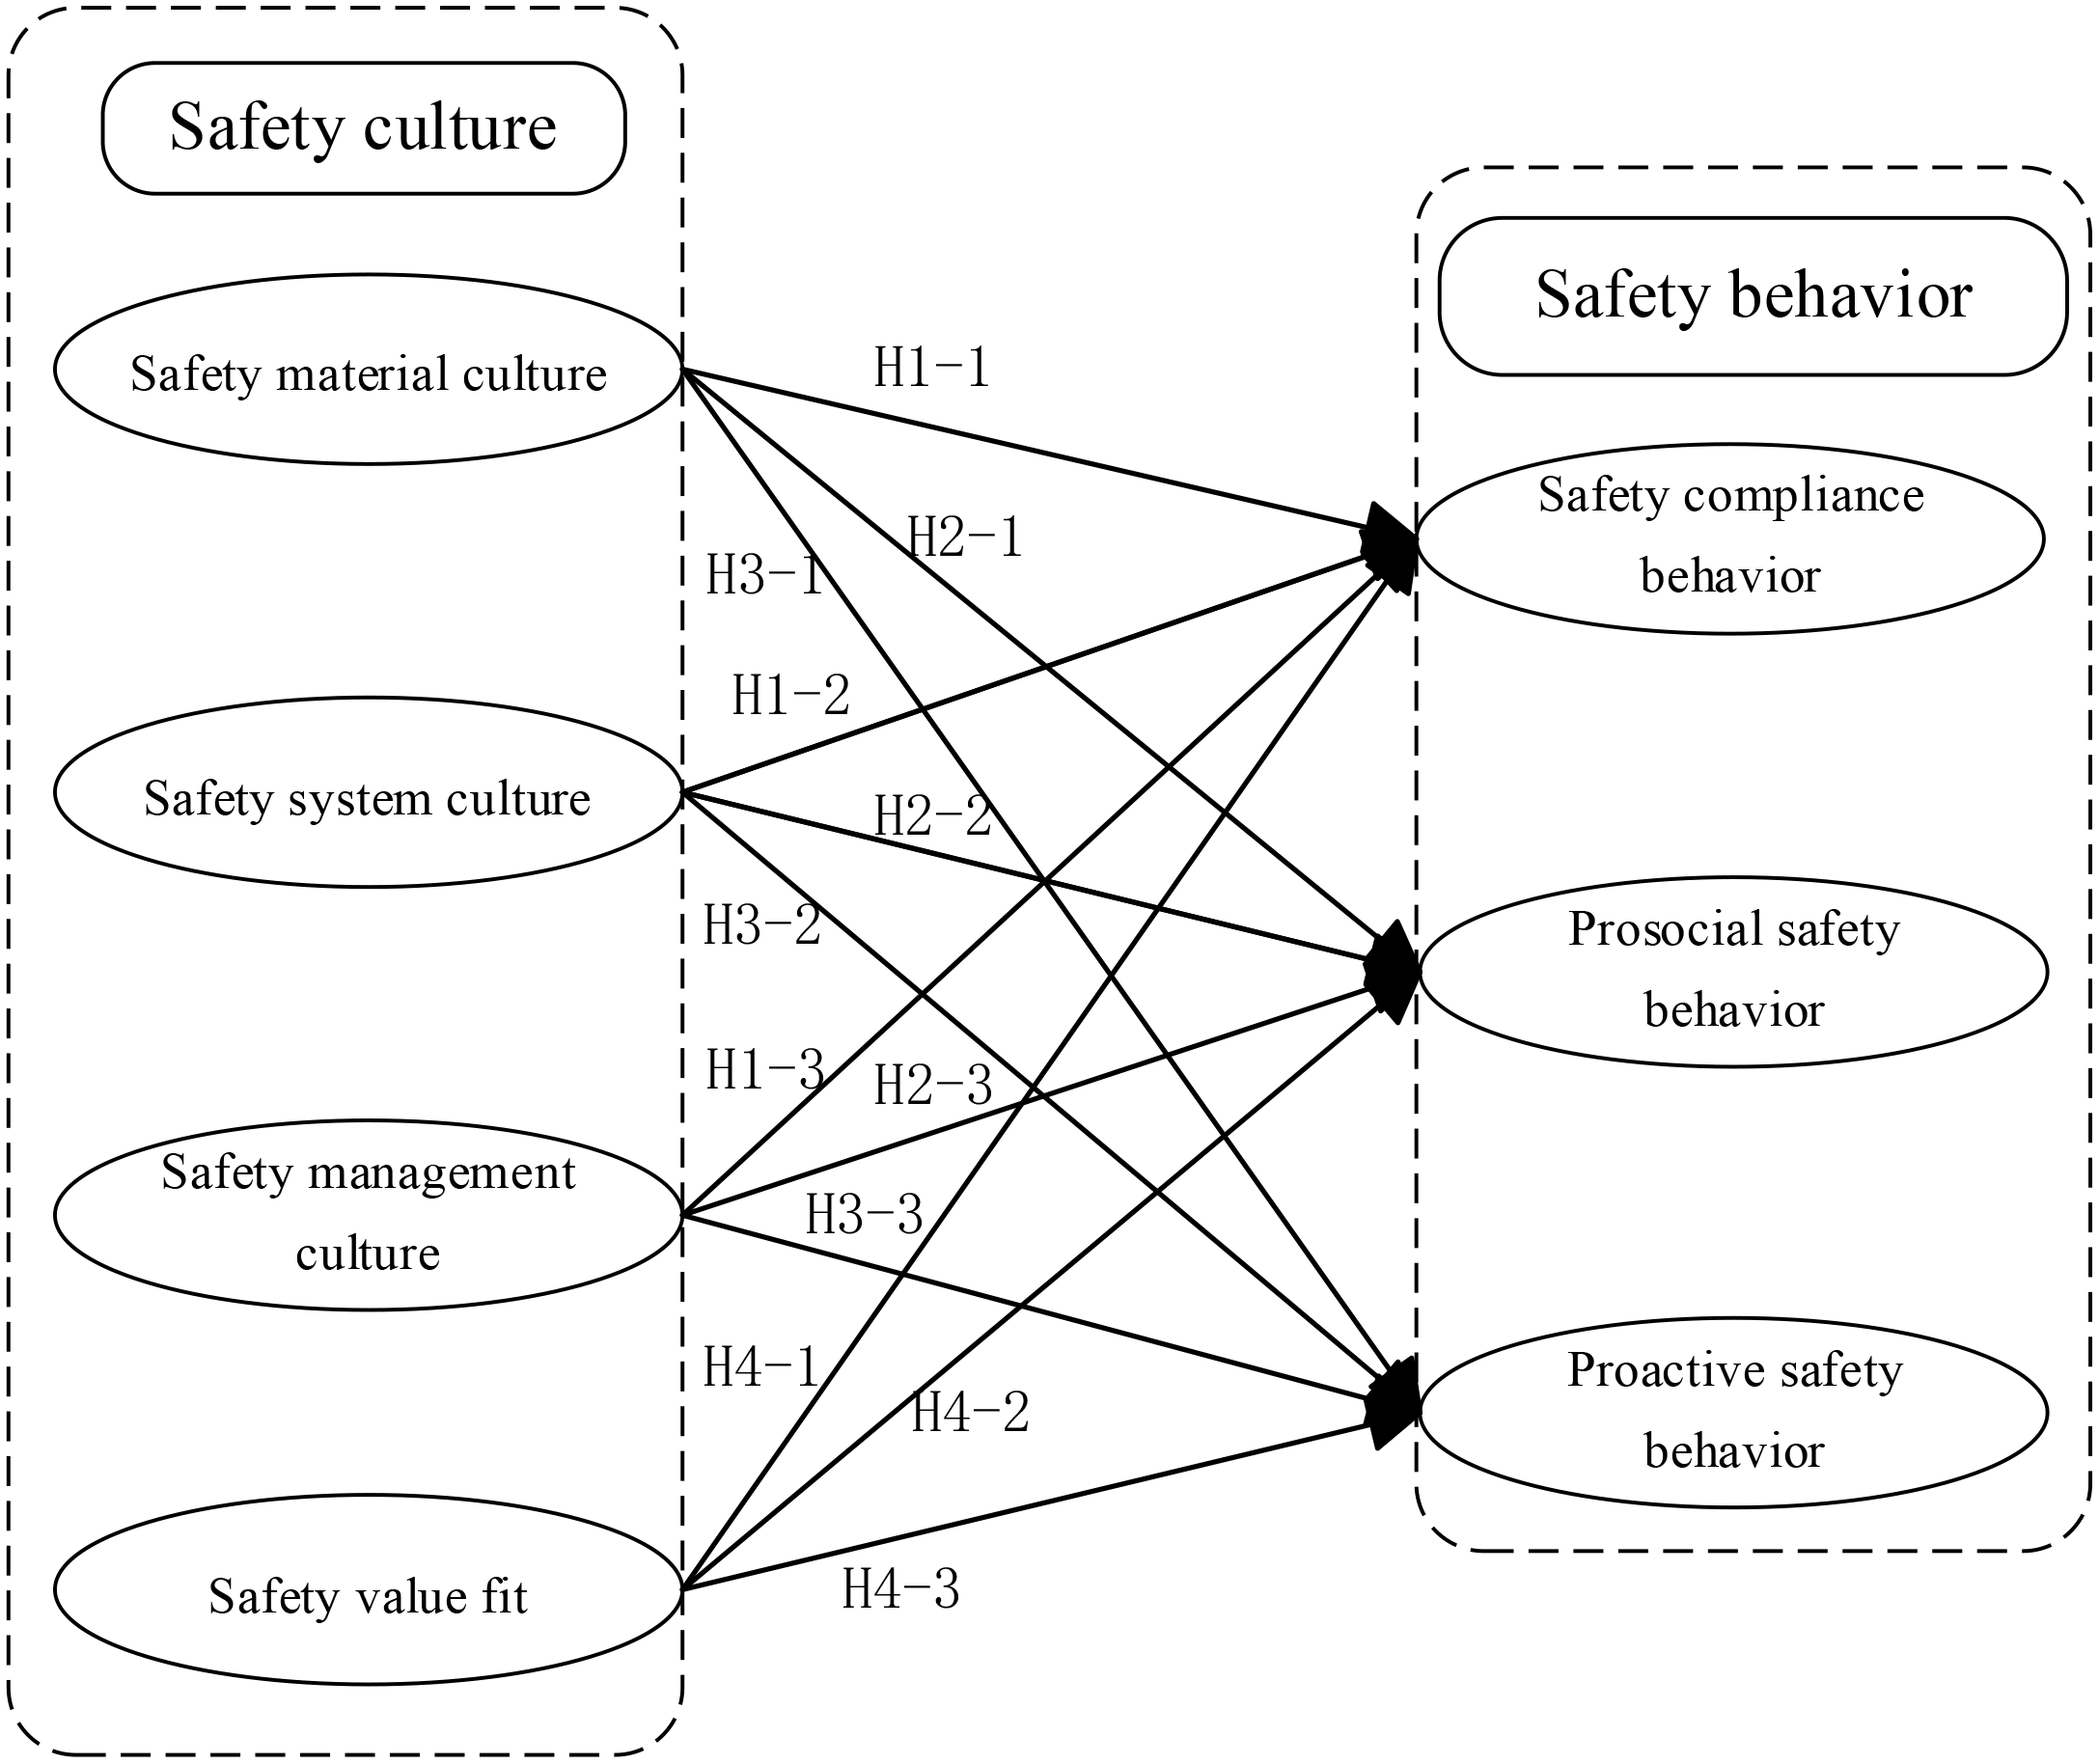
The conceptual model for the analyzed hypotheses.
3 Research methodology
3.1 Scale design and collection
The scale was developed by referencing the well-established safety culture and safety behavior scales proposed in previous literature (e.g. Dos Santos Grecco et al., 2014; Nævestad, 2017; Xi et al., 2021) and combined with the shipping background. This scale includes 37 items related to basic information of ship officers, safety culture, and safety behavior. The basic information includes age, education background, vessel type and so on. The scale is based on a 5-point Likert scale, and the numbers 1–5 indicate strong disagreement to strong agreement.
In designing the scale, in order to minimize common method bias and non-response bias, the following control measures were adopted. Firstly, when designing the scale, follow the principles of being easy to understand and concise, using single sentence to avoid misunderstandings among respondents and all statements in the questionnaire were worded as neutrally as possible. Secondly, before distributing the questionnaire, we asked the ship officers by phone or email if they are willing to participate in the survey, and distribute the questionnaire after obtaining their consent, the survey questionnaire was conducted anonymously. The respondents of this survey are all from a large shipping company in Shanghai, the questionnaire was distributed in October 2023 and was collected two weeks after its distribution. The data collection was conducted through the questionnaire survey website Questionnaire Star (www.wjx.cn), and a total of 229 survey questionnaires were collected. The comprehensive items are presented in Table 1.
Table 1
| NO. | Item | Mean | SD |
|---|---|---|---|
| Safety material culture (Dos Santos Grecco et al., 2014; Lu and Tsai, 2010; Lu and Yang, 2011; Mei et al., 2017; Xi et al., 2020) | |||
| A1 | The company emphasizes safe working conditions and provides good safety equipment | 3.45 | 1.141 |
| A2 | The ship is equipped with an appropriate alarm system and an external alarm device for crew members | 3.34 | 1.008 |
| A3 | The company regularly inspects, repairs, or updates the safety equipment | 3.43 | 1.085 |
| A4 | The company has established an emergency plan in case of emergency | 3.46 | 1.149 |
| A5 | In emergency plans, all members have clearly defined tasks | 3.35 | 1.064 |
| A6 | The company conducts regular drills to test the effectiveness of emergency plans | 3.44 | 1.155 |
| Safety system culture (Mei et al., 2017; Shang et al., 2011; Xi et al., 2020) | |||
| B1 | The company has developed relatively perfect safety rules and regulations | 3.56 | 1.113 |
| B2 | The company’s policies are clear and can guide the behavior of ship officers | 3.51 | 1.087 |
| B3 | The company is able to implement the safety system effectively | 3.44 | 1.044 |
| B4 | The company has formulated a reasonable reward and punishment system to regulate the behavior of ship officers | 3.47 | 0.998 |
| Safety management culture (Corrigan et al., 2019; Lu and Tsai, 2010; Lu and Yang, 2011; Xi et al., 2023; Jiang et al., 2025) | |||
| C1 | The company’s safety management is effective in reducing injuries | 3.45 | 1.085 |
| C2 | The company regularly conducts safety management system inspections to ensure the effective operation of the entire system | 3.47 | 1.134 |
| C3 | The company provides adequate safety training for new employees. | 3.42 | 1.096 |
| C4 | The company’s safety training program helps in the prevention of accidents | 3.45 | 1.061 |
| C5 | Safety related issues are dealt with promptly and reported defects or hazards are promptly corrected | 3.48 | 1.107 |
| C6 | Management investigates the incidents to understand the weaknesses in procedures, and not just to determine who is to blame | 3.44 | 1.109 |
| C7 | The company encourages the employees to participate in safety decisions and provide safety advice | 3.41 | 1.135 |
| Safety value fit (Guo et al., 2016; Nævestad, 2017) | |||
| D1 | Shipping companies regard safety as the most important part of all work activities | 3.40 | 1.126 |
| D2 | The safety values of my organization fit well with mine | 3.31 | 1.130 |
| D3 | My colleagues strongly object to breaches in health and safety procedures | 3.46 | 1.098 |
| D4 | Working safely is in line with my personal values and I feel guilty when I can’t work safely | 3.44 | 1.117 |
| D5 | The use of safety equipment reduces the casualties and accidents | 3.38 | 1.104 |
| D6 | At work, the exchange of safety information between colleagues is smooth and effective | 3.44 | 1.136 |
| Safety compliance behaviors (Lu and Yang, 2011) | |||
| F1 | I always work in strict accordance with the relevant safety regulations and operating procedures. | 3.50 | 1.119 |
| F2 | I observe personal protective measures and use relevant safety equipment correctly | 3.44 | 1.069 |
| F3 | I always choose the safest way to do my job | 3.40 | 1.126 |
| Prosocial safety behaviors (Xi et al., 2021) | |||
| G1 | My colleagues and I actively participate in safety training and learning activities | 3.35 | 1.121 |
| G2 | I am actively involved in setting safety goals and advising on safety improvements | 3.49 | 1.041 |
| G3 | I actively inform colleagues and supervisors of potential hazards and safety incidents at work | 3.43 | 1.120 |
| Proactive safety behaviors (Mei et al., 2017) | |||
| H1 | I will take the initiative to do all kinds of safety work and be a role model among my colleagues | 3.55 | 1.090 |
| H2 | I will voluntarily promote safety programs throughout the organization | 3.52 | 1.172 |
| H3 | I will independently deepen my own safety awareness and improve safety cultivation | 3.56 | 1.085 |
Descriptive statistics for items—mean value and standard deviation. (N = 229).
In order to understand the group characteristics and group distribution status of the surveyed ship officers, this paper summarizes and analyses the basic information part of the scale filled in by the surveyed ship officers. The statistics of data are presented in Table 2.
Table 2
| Basic information | Sort | Sample size | Proportion |
|---|---|---|---|
| Age | Under the age of 25 | 54 | 23.58% |
| 26-30 | 18 | 7.86% | |
| 31-35 | 68 | 29.69% | |
| 36-40 | 62 | 27.07% | |
| 41-45 | 18 | 7.86% | |
| Over 45 years old | 9 | 3.93% | |
| Position | Cadet | 44 | 19.21% |
| Third officer | 31 | 13.53% | |
| Second officer | 16 | 6.98% | |
| Chief officer | 113 | 49.34% | |
| Captain | 25 | 10.91% | |
| Sea experience | Less than 1 year | 23 | 10.04% |
| 1 to 3 years | 42 | 18.34% | |
| 3 to 5years | 52 | 22.70% | |
| 5 to 10 years | 86 | 37.55% | |
| More than 10 years | 26 | 11.35% | |
| Education background | High school degree | 10 | 4.36% |
| Technical secondary school | 13 | 5.67% | |
| College degree | 83 | 36.24% | |
| Bachelor’s degree | 110 | 48.03% | |
| Master’s degree | 13 | 5.67% | |
| Types of ship | Bulk cargo ship | 71 | 31.00% |
| Container ship | 51 | 22.27% | |
| Oil tanker | 37 | 16.15% | |
| Passenger ship | 31 | 13.53% | |
| Ro-ro ship | 23 | 10.04% | |
| Working ship (dredger, salvage ship) | 16 | 6.98% |
Profiles of respondents (N=229).
Based on the data presented in Table 2, it can be observed that the age of the surveyed ship officers is concentrated in the range of 31 to 35 years old, with 68 individuals, accounting for 29.69%; Among the surveyed ship officers, 49.34% are chief officer; Nearly half of the surveyed ship officers joined the workforce after obtaining a Bachelor’s degree, with 110 people, constituting 48.03%. Additionally, the number of people working on bulk carriers is the largest, accounting for 31%.
3.2 Data analysis method
In order to ensure the validity and accuracy of the study, the following steps should be followed when analyzing questionnaire data. First of all, in order to check the constructed factors and determine the stability and consistency of the scale, the items related to safety culture and safety behavior should be screened and verified. In view of this, we use exploratory factor analysis (EFA), through the principal component analysis (PCA) to reveal the underlying structure of the data and determine the number of factors that affect the observed variables. After determining the dimension of the scale, confirmatory factor analysis (CFA) is used to verify the consistency between the factor structure of the scale and the theoretical presupposition model, so as to ensure the validity and reliability of the scale. In this process, convergence validity analysis was used to verify the correlation between indicators of the same variable, and discriminant validity analysis was used to verify the difference between latent variables. Finally, the SEM was constructed to fit the model and test the hypothetical path, and the influence of each dimension of safety culture on safety behavior was tested by examining the complex relationship between variables. In this paper, SPSS 26.0 and AMOS 26.0 were used to support the above experiments.
4 Analysis of results
4.1 Common method bias testing
As all the survey respondents in this paper are ship officers, there is a possibility that the scale results may have common method bias, which affects the results of the data analyses. Therefore, it is necessary to perform the common method bias test.
Conduct a common method bias analysis on 32 items related to safety culture and safety behavior, as presented in Table 3, there are seven factors with an eigenvalue greater than 1, and the first factor has an eigenvalue of 10.38, the variance explanation rate is 32.42%. If the first factor variance explanation rate is less than 50%, it can be considered that there is no significant common method bias (Podsakoff et al., 2003). Therefore, the exploratory factor analysis can be carried out.
Table 3
| Factor | Eigen | % of Variance (Unrotated) | % of Variance (Rotated) | ||||||
|---|---|---|---|---|---|---|---|---|---|
| Eigen value | % of variance | Cumulative % of variance | Eigen value | % of variance | Cumulative % of variance | Eigen value | % of variance | Cumulative % of variance | |
| 1 | 10.375 | 32.421 | 32.421 | 10.375 | 32.421 | 32.421 | 4.833 | 15.103 | 15.103 |
| 2 | 3.249 | 10.154 | 42.575 | 3.249 | 10.154 | 42.575 | 4.272 | 13.350 | 28.452 |
| 3 | 2.975 | 9.297 | 51.872 | 2.975 | 9.297 | 51.872 | 4.089 | 12.779 | 41.231 |
| 4 | 1.900 | 5.936 | 57.808 | 1.900 | 5.936 | 57.808 | 2.943 | 9.197 | 50.428 |
| 5 | 1.740 | 5.438 | 63.246 | 1.740 | 5.438 | 63.246 | 2.171 | 6.786 | 57.213 |
| 6 | 1.188 | 3.713 | 66.959 | 1.188 | 3.713 | 66.959 | 2.101 | 6.565 | 63.778 |
| 7 | 1.045 | 3.265 | 70.224 | 1.045 | 3.265 | 70.224 | 2.063 | 6.446 | 70.224 |
| 8 | 0.660 | 2.062 | 72.286 | ||||||
| 9 | 0.640 | 2.000 | 74.287 | ||||||
Common method bias test results.
4.2 Exploratory factor analysis
Before conducting factor analysis, Kaiser-Meyer-Olkin (KMO) test and Bartlett’s sphere test should be used to evaluate whether the data is suitable for factor analysis. As a result, KMO = 0.905(>0.7), χ2 = 4319.793, and p< 0.01. According to Howard (2016), it can be considered that the data is of high quality and is suitable for factor analysis.
The latent variables of safety culture and safety behavior have been presupposed based on the theoretical foundations in the previous text, so it is necessary to test the constructed structure and assess the consistency of the scale. In this paper, exploratory factor analysis (EFA) was used to find the essential structure of multiple observed variables.
Conduct the EFA on 32 items related to safety culture and safety behavior, and the results are shown in Table 4, with a total of seven factors having eigenvalues greater than 1. The seven factors, in order, are safety management culture, safety values fit, safety material culture, safety system culture, proactive safety behavior, prosocial safety behavior and safety compliance behavior, which is consistent with the assumed conceptual model. As is shown in Table 4, the cumulative variance contribution rate of the seven factors is 70.22%. According to Hinkin (1998), when the cumulative variance contribution rate is greater than 60%, it can be considered that it has a strong ability to explain the original variables. In addition, the Cronbach’s alpha values for each dimension is greater than 0.7, indicating sufficient internal consistency (Robinson et al., 1991); The factor loadings for each dimension are greater than 0.7, therefore all items should be retained (Xi et al., 2021).
Table 4
| Items | F1 | F2 | F3 | F4 | F5 | F6 | F7 |
|---|---|---|---|---|---|---|---|
| C1 | 0.75 | ||||||
| C2 | 0.79 | ||||||
| C3 | 0.78 | ||||||
| C4 | 0.79 | ||||||
| C5 | 0.77 | ||||||
| C6 | 0.81 | ||||||
| C7 | 0.80 | ||||||
| D1 | 0.77 | ||||||
| D2 | 0.80 | ||||||
| D3 | 0.78 | ||||||
| D4 | 0.76 | ||||||
| D5 | 0.77 | ||||||
| D6 | 0.76 | ||||||
| A1 | 0.78 | ||||||
| A2 | 0.72 | ||||||
| A3 | 0.81 | ||||||
| A4 | 0.81 | ||||||
| A5 | 0.80 | ||||||
| A6 | 0.80 | ||||||
| B1 | 0.83 | ||||||
| B2 | 0.78 | ||||||
| B3 | 0.83 | ||||||
| B4 | 0.75 | ||||||
| H1 | 0.78 | ||||||
| H2 | 0.74 | ||||||
| H3 | 0.78 | ||||||
| G1 | 0.71 | ||||||
| G2 | 0.79 | ||||||
| G3 | 0.75 | ||||||
| F1 | 0.74 | ||||||
| F2 | 0.78 | ||||||
| F3 | 0.71 | ||||||
| Eigenvalues | 10.38 | 3.25 | 2.98 | 1.90 | 1.74 | 1.19 | 1.05 |
| Percentage variance variance |
32.42 | 10.15 | 9.30 | 5.94 | 5.44 | 3.71 | 3.27 |
| Cumulative variance | 32.42 | 42.58 | 51.87 | 57.81 | 63.25 | 66.96 | 70.22 |
| Cronbach alpha | 0.92 | 0.91 | 0.90 | 0.86 | 0.82 | 0.81 | 0.81 |
| Mean | 3.45 | 3.40 | 3.41 | 3.50 | 3.54 | 3.42 | 3.45 |
Results of exploratory factor analysis.
4.3 Confirmatory factor analysis
After identified the structural dimensions, it is necessary to conduct CFA to test and analyze the effectiveness of the structural dimensions and the relationship between various dimensions.
Considering that in the hypothetical chapter of this paper, some hypotheses model safety culture as a separate factor, so it is necessary to construct first-order model and second-order model respectively. In order to quantitatively describe the relationship between the measured items and the factors, as well as the interaction between the factors, it is necessary to make the following assumptions about the relationship between the factors:
First-order CFA model: it is assumed that there is a linear relationship between observation variables and latent variables, each observation variable contains a residual, these residuals are random and independent of each other. It is assumed that there is a covariant relationship among the factors, and this relationship is mutual between any two factors.
Second-order CFA model: it is assumed that there is a higher-order concept of “safety culture”, which can explain the relationship among the factors in the first-order model. It is assumed that there is a linear relationship between the first order latent variable and the second order latent variable.
AMOS26 is used to construct the first-order CFA model as presented in Figure 2 for 32 items in 7 dimensions. Before CFA, the fit of the model should be tested first. According to Schermelleh-Engel et al. (2003), the fit of a model can be judged based on indicators such as the Comparative Fit Index (CFI), Tucker-Lewis Index (TLI), Root Mean Square Error of Approximation (RMSEA), Standardized Root Mean Square Residual (SRMR), Parsimonious Normed Fit Index (PNFI), Incremental Fit Index (IFI), etc. CFI is used to measure the degree of fit between the model and the hypothesis, and it is generally considered acceptable when CFI≥0.9. TLI is used to measure the relationship between observed variables and latent factors. It is generally believed that a TLI≥0.9 indicates a good model fit. RMSEA is used to evaluate the accuracy of model fitting, and we usually consider RMSEA<0.08 to indicate good model fitting. SRMR is used to measure the degree of difference between observed values and model predictions, SRMR<0.08 usually indicates good model fitting. PNFI is used to compare models of different complexities, when PNFI>0.5, it usually indicates that the model has good simplicity and fit. IFI is used to evaluate the degree of fit between the model and the data. Generally, when IFI≥0.9, the model is considered acceptable. The model fitting results are shown in Table 5. We can see that all indicators meet the requirements, indicating that the model is in good agreement with the data and suitable for further testing.
Figure 2
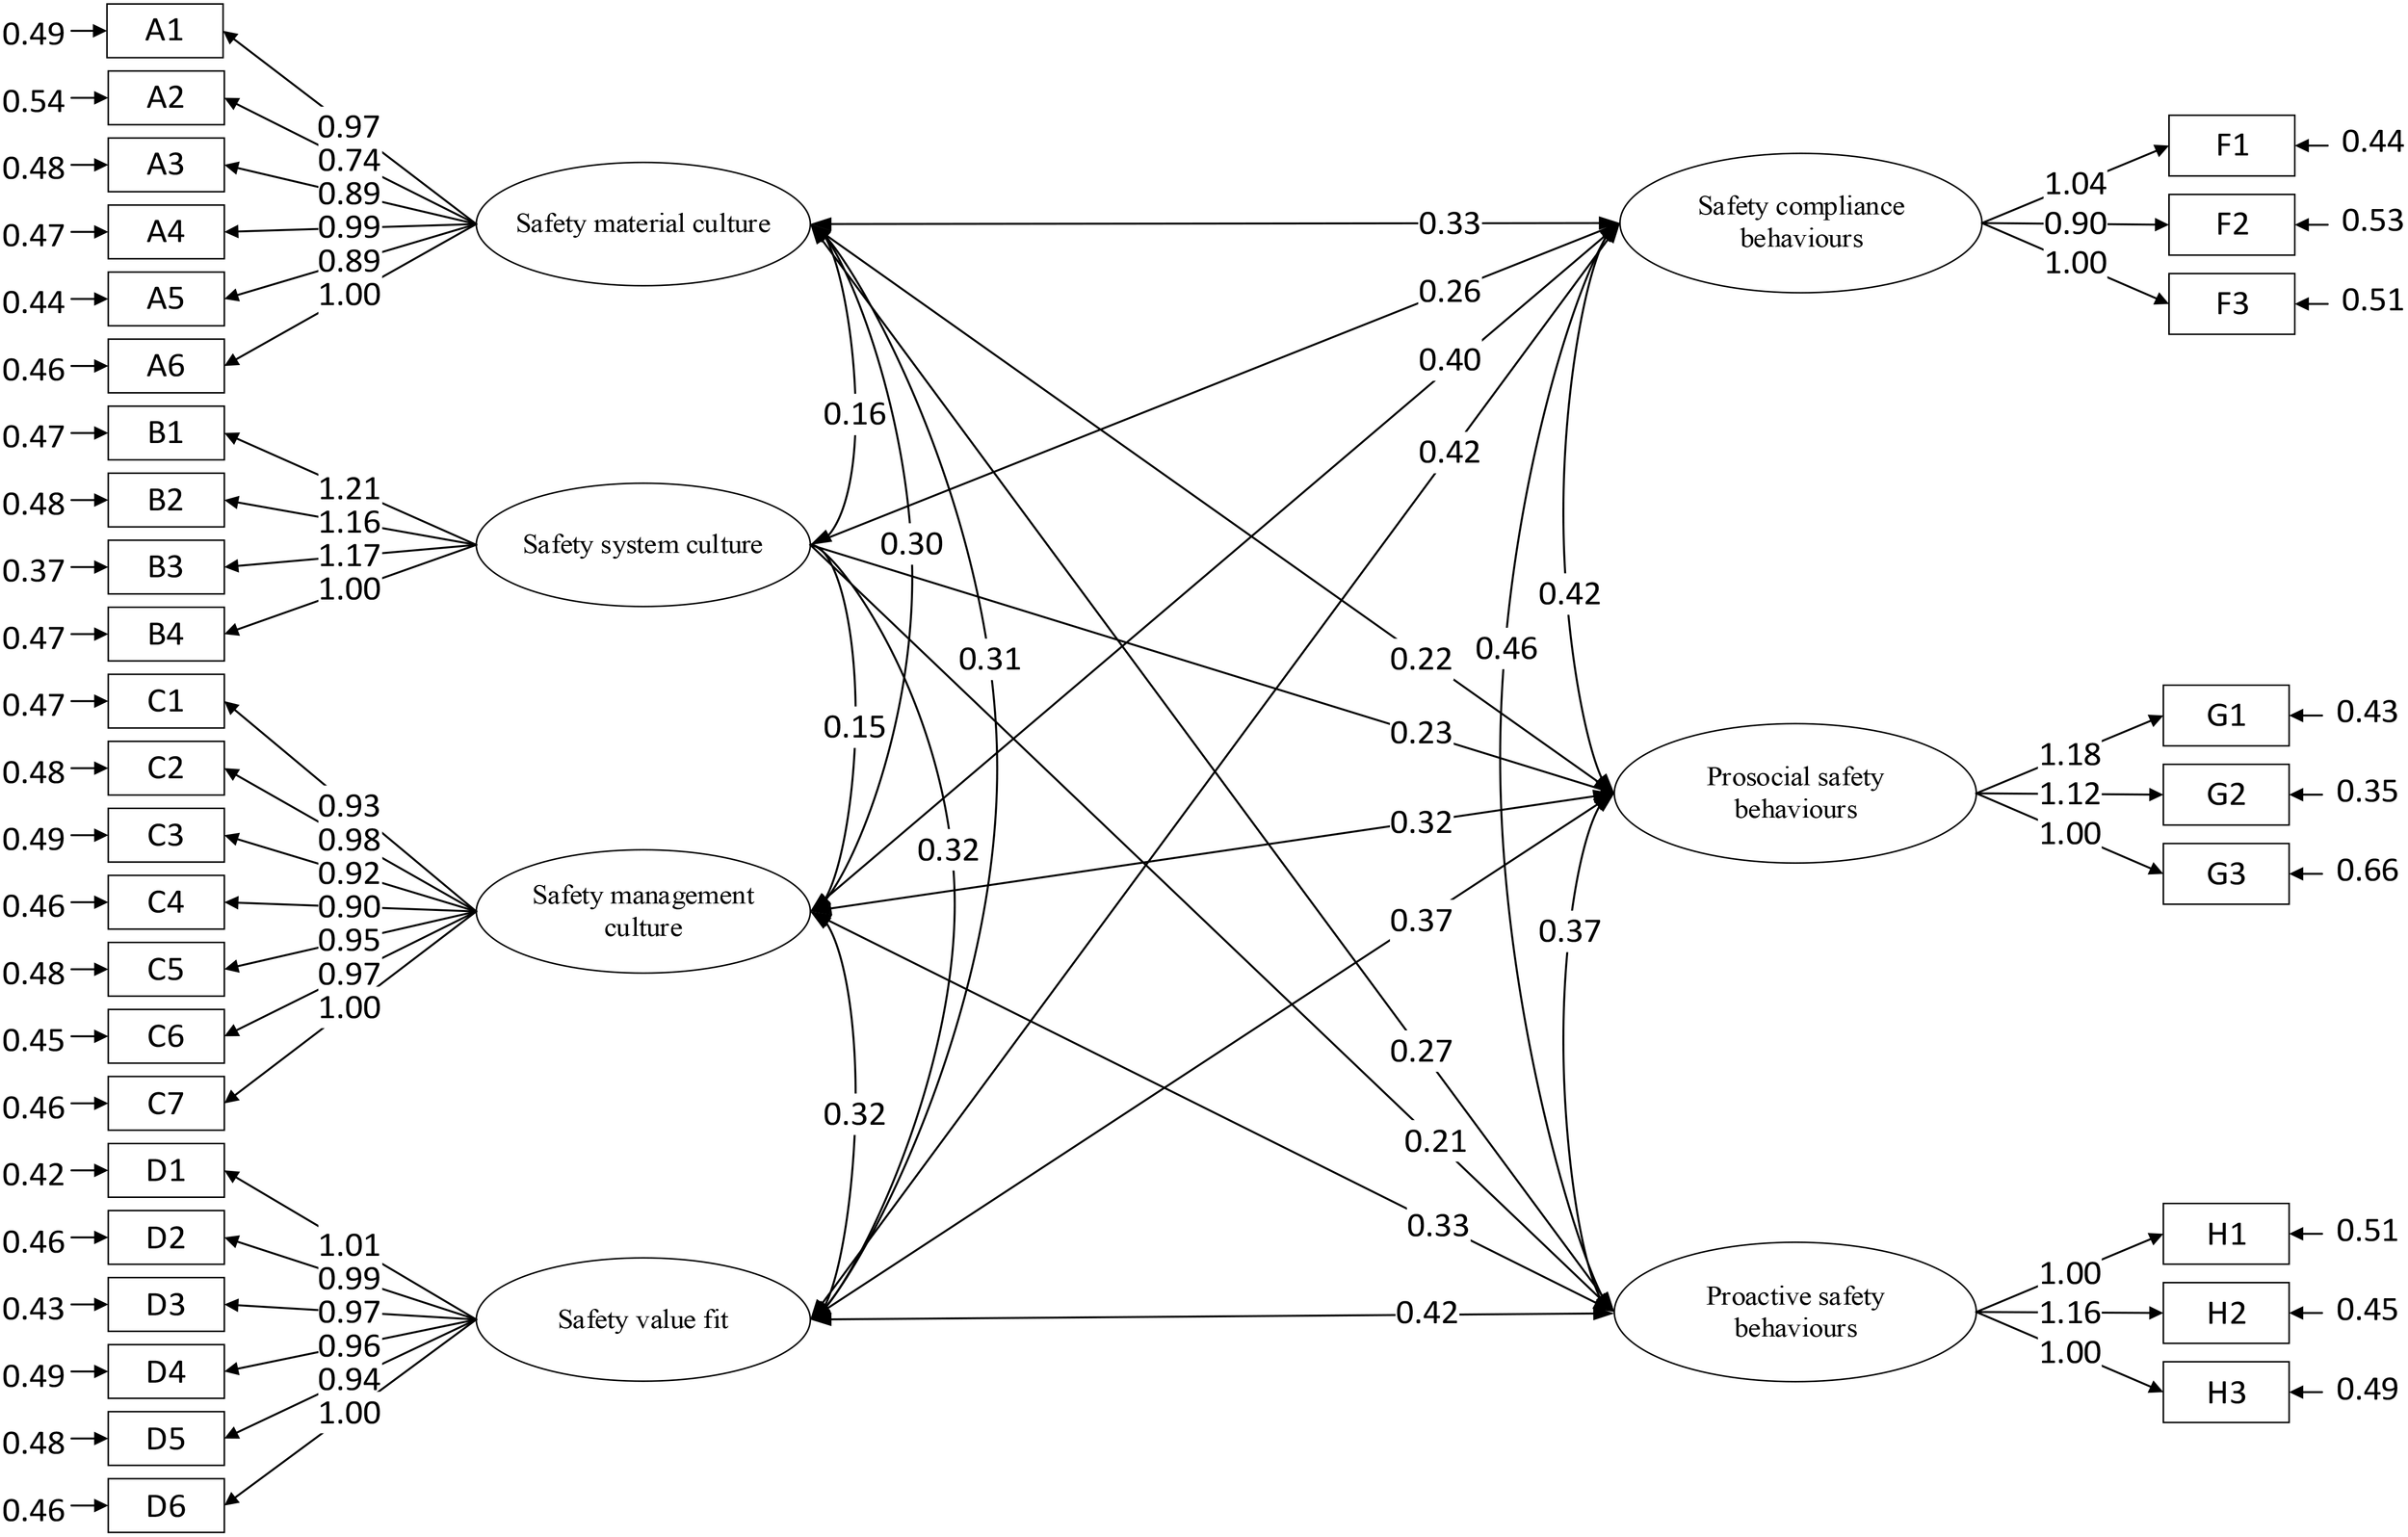
The first order CFA model.
Table 5
| Fitness indices | χ2 | df | χ2/df | CFI | TLI | RMSEA | SRMR | PNFI | IFI |
|---|---|---|---|---|---|---|---|---|---|
| Judgment indicators | — | — | 1 ~3 | >0.9 | >0.9 | <0.08 | <0.08 | >0.5 | >0.9 |
| First order CFA value | 517.362 | 443 | 1.168 | 0.982 | 0.979 | 0.027 | 0.039 | 0.792 | 0.982 |
The goodness-of-fit index.
After passing the model fit test, in order to avoid a large bias in the model, convergence validity analysis is required. Convergent validity is usually judged based on indicators including standardized factor loadings, composite reliability (CR) and average variance extracted (AVE). Among them, the composite reliability is used to indicate the degree of consistency between the measured variables under the same latent variable, and the AVE is used to indicate the degree of explanation of the measured variables for the latent variable. According to Xi et al. (2021) and Hair et al. (2010), it is generally required that the standardized factor loadings be greater than 0.5, the value of composite reliability be greater than 0.7, and the value of AVE be greater than 0.5. The results of convergent reliability analysis are shown in Table 6, and all indicators meet the above requirements, indicating that the correlation between each item in the scale and its corresponding dimension is high, and the model has good convergent validity.
Table 6
| Construct/item | Standardized factor loading | Standard error | Critical ratio | R2 | CR | AVE |
|---|---|---|---|---|---|---|
| Safety material culture | 0.90 | 0.60 | ||||
| A1 | 0.79 | 0.07 | 13.037*** | 0.62 | ||
| A2 | 0.69 | 0.07 | 10.958*** | 0.48 | ||
| A3 | 0.77 | 0.07 | 12.559*** | 0.59 | ||
| A4 | 0.80 | 0.07 | 13.227*** | 0.64 | ||
| A5 | 0.78 | 0.07 | 12.933*** | 0.61 | ||
| A6 | 0.81 | 0.65 | ||||
| Safety system culture | 0.86 | 0.60 | ||||
| B1 | 0.79 | 0.11 | 11.103*** | 0.62 | ||
| B2 | 0.77 | 0.11 | 10.490*** | 0.59 | ||
| B3 | 0.81 | 0.11 | 10.946*** | 0.66 | ||
| B4 | 0.73 | 0.53 | ||||
| Safety management culture | 0.92 | 0.61 | ||||
| C1 | 0.78 | 0.07 | 13.016*** | 0.60 | ||
| C2 | 0.79 | 0.07 | 13.230*** | 0.62 | ||
| C3 | 0.77 | 0.07 | 12.679*** | 0.59 | ||
| C4 | 0.77 | 0.07 | 12.743*** | 0.59 | ||
| C5 | 0.78 | 0.07 | 12.939*** | 0.61 | ||
| C6 | 0.80 | 0.07 | 13.332*** | 0.63 | ||
| C7 | 0.80 | 0.64 | ||||
| Safety value fit | 0.91 | 0.63 | ||||
| D1 | 0.82 | 0.07 | 13.826*** | 0.67 | ||
| D2 | 0.80 | 0.07 | 13.322*** | 0.63 | ||
| D3 | 0.80 | 0.07 | 13.366*** | 0.64 | ||
| D4 | 0.78 | 0.07 | 12.918*** | 0.61 | ||
| D5 | 0.78 | 0.07 | 12.913*** | 0.60 | ||
| D6 | 0.80 | 0.64 | ||||
| Safety compliance behaviors | 0.81 | 0.59 | ||||
| F1 | 0.81 | 0.09 | 11.128*** | 0.65 | ||
| F2 | 0.73 | 0.09 | 10.496*** | 0.53 | ||
| F3 | 0.77 | 0.60 | ||||
| Prosocial safety behaviors | 0.82 | 0.60 | ||||
| G1 | 0.81 | 0.12 | 9.927*** | 0.65 | ||
| G2 | 0.82 | 0.11 | 10.400*** | 0.68 | ||
| G3 | 0.68 | 0.46 | ||||
| Proactive safety behaviors | 0.82 | 0.61 | ||||
| H1 | 0.76 | 0.09 | 10.781*** | 0.57 | ||
| H2 | 0.82 | 0.10 | 11.189*** | 0.67 | ||
| H3 | 0.76 | 0.58 |
Summary table of loading coefficients.
Discriminant validity can be examined via comparison of the square root of AVE and correlations among constructs. The result of discriminant validity is shown in Table 7, the correlation coefficient between dimension A and any other dimension within the scale for this sample data is less than for dimension A, which indicates that the sample data has good discriminant validity (Bagozzi, 1981).
Table 7
| Dimension | Safety material culture | Safety system culture | Safety management culture | Safety value fit | Safety compliance behaviors | Prosocial safety behaviors | Proactive safety behaviors |
|---|---|---|---|---|---|---|---|
| Safety material culture | 0.772 | ||||||
| Safety system culture | 0.242 | 0.773 | |||||
| Safety management culture | 0.354 | 0.226 | 0.782 | ||||
| Safety value fit | 0.366 | 0.493 | 0.389 | 0.794 | |||
| Safety compliance behaviors | 0.407 | 0.408 | 0.502 | 0.530 | 0.769 | ||
| Prosocial safety behaviors | 0.312 | 0.420 | 0.467 | 0.540 | 0.627 | 0.774 | |
| Proactive safety behaviors | 0.353 | 0.351 | 0.435 | 0.561 | 0.638 | 0.586 | 0.777 |
The convergence validity and discriminative validity.
After the first-order model passes the test, it is necessary to examine whether safety culture can be considered as a separate factor, that is, to test whether safety material culture, safety system culture, safety management culture, and safety value fit can be considered as components of safety culture. We constructed the first order and second order CFA model for safety culture in AMOS, the model composition and associated data are presented in Figure 3, Figure 4 and Table 8.
Figure 3
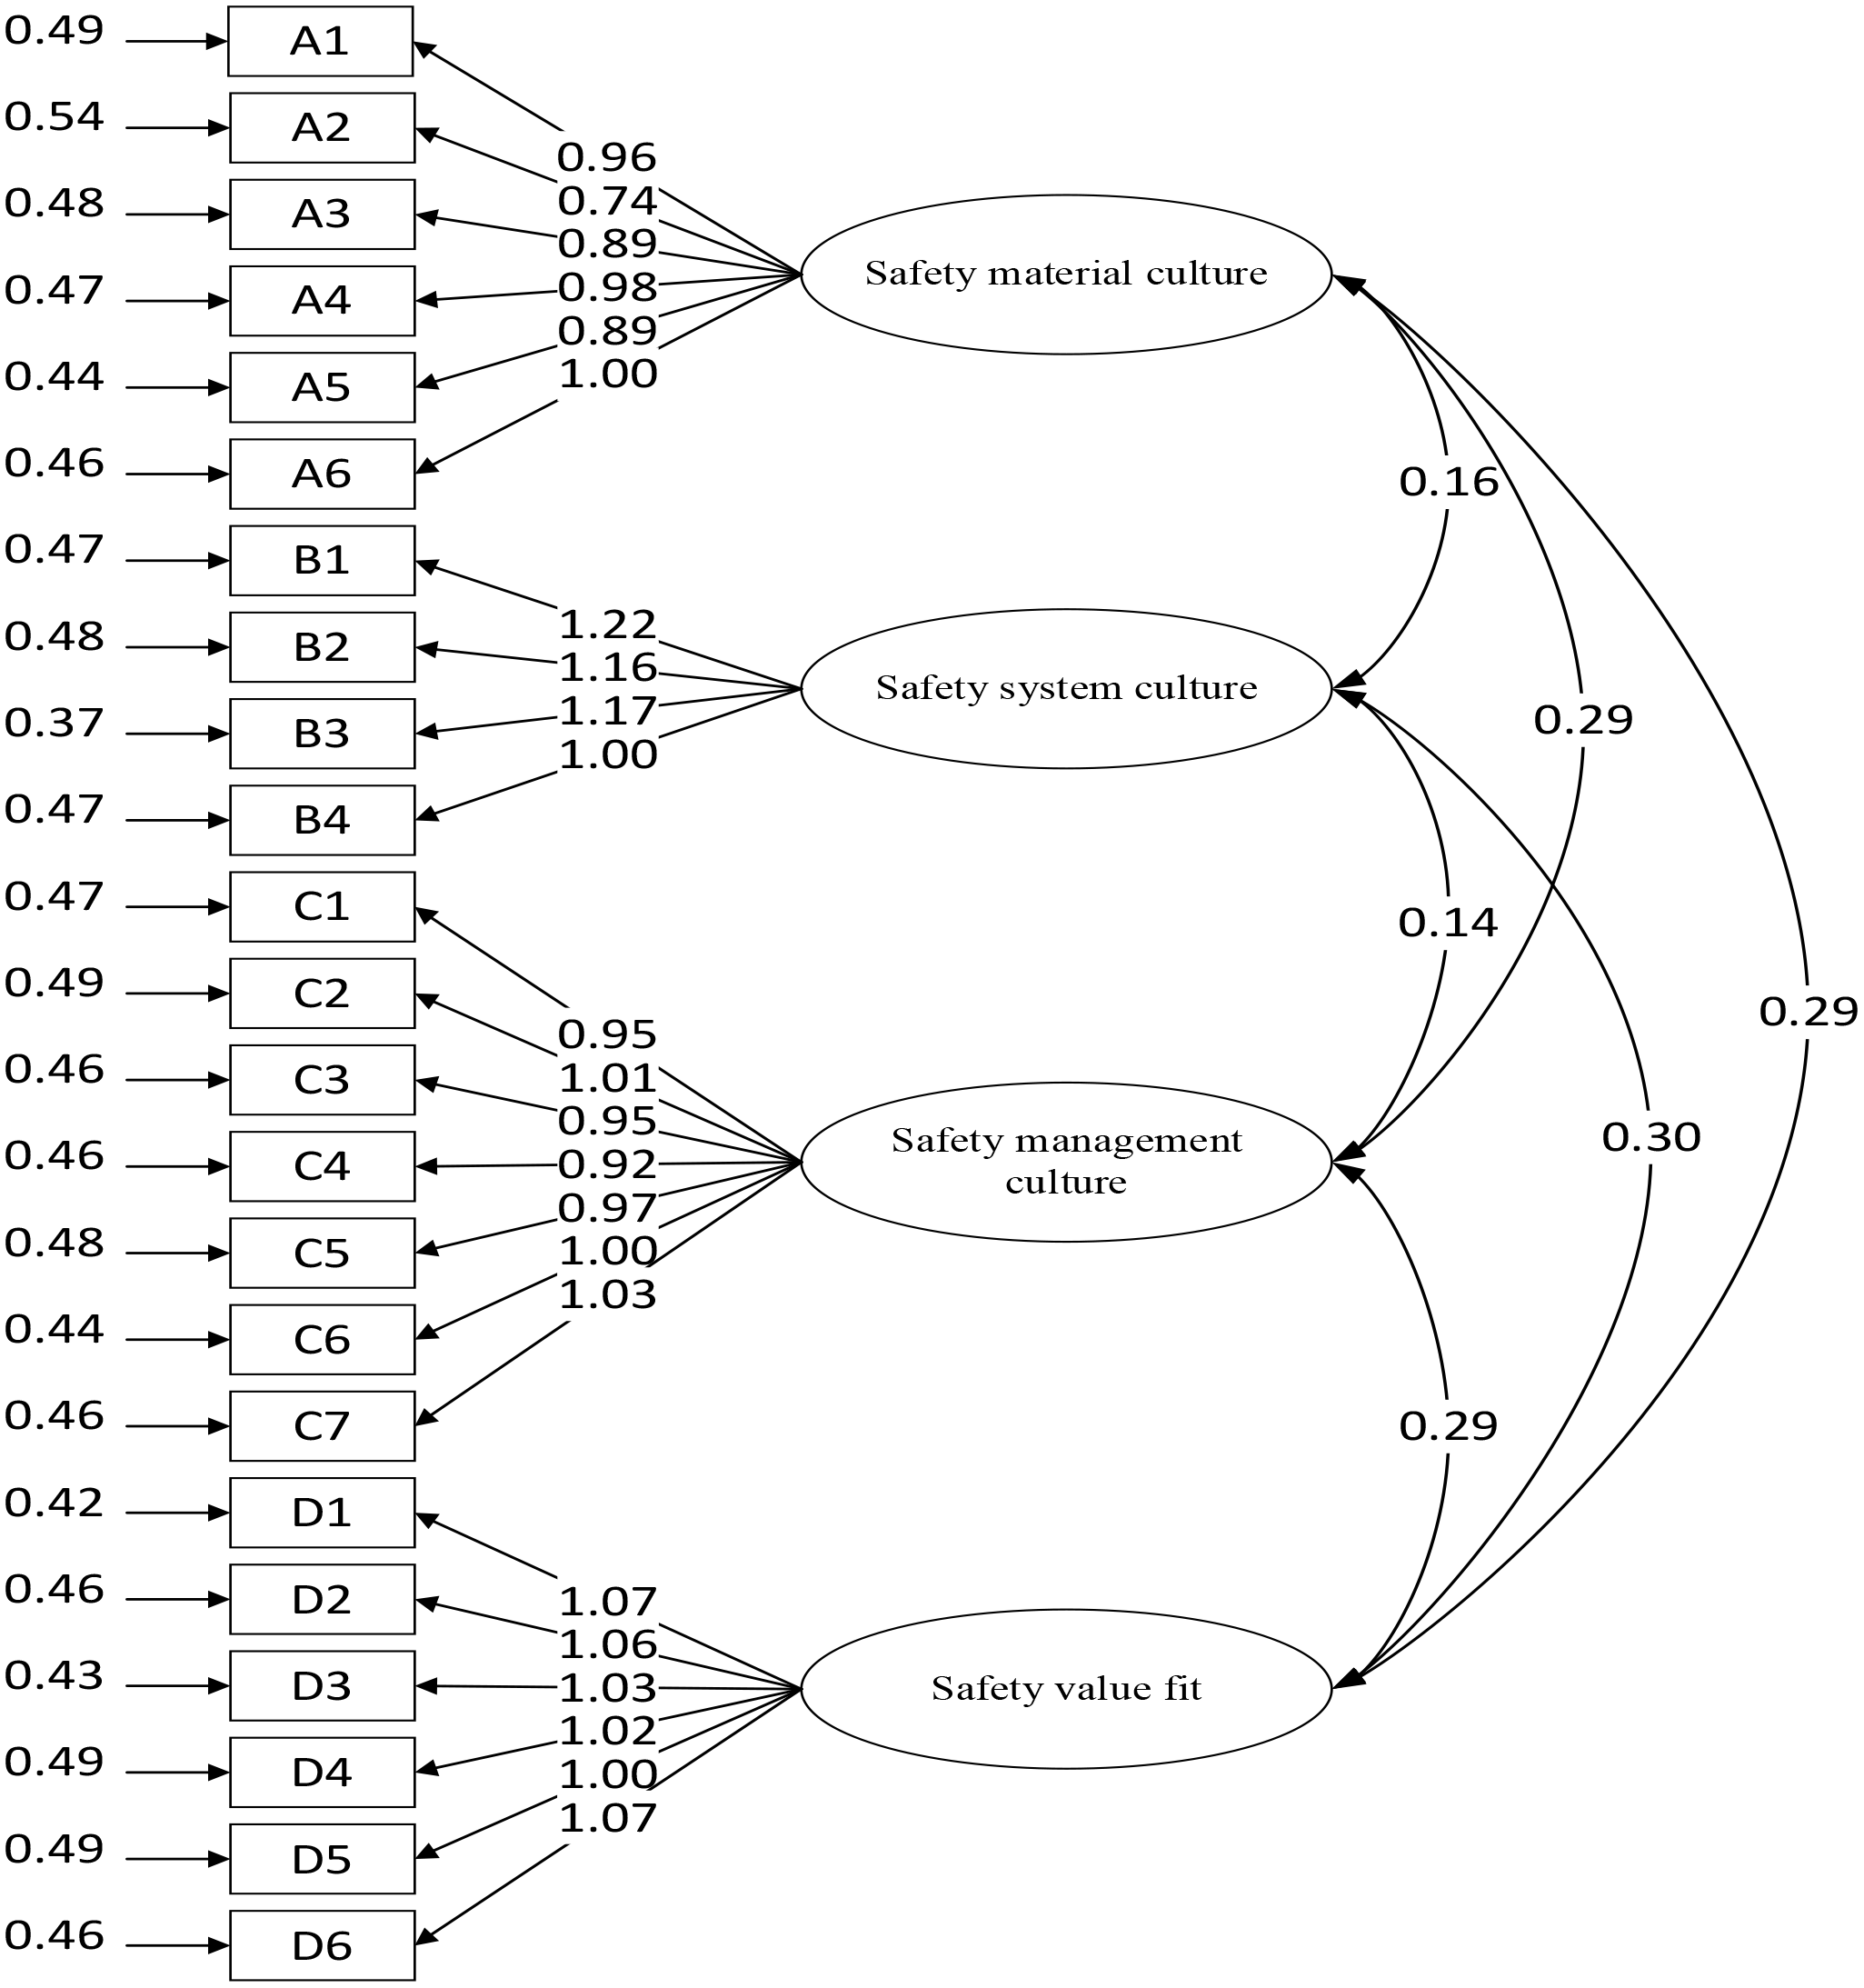
First order safety culture CFA model.
Figure 4
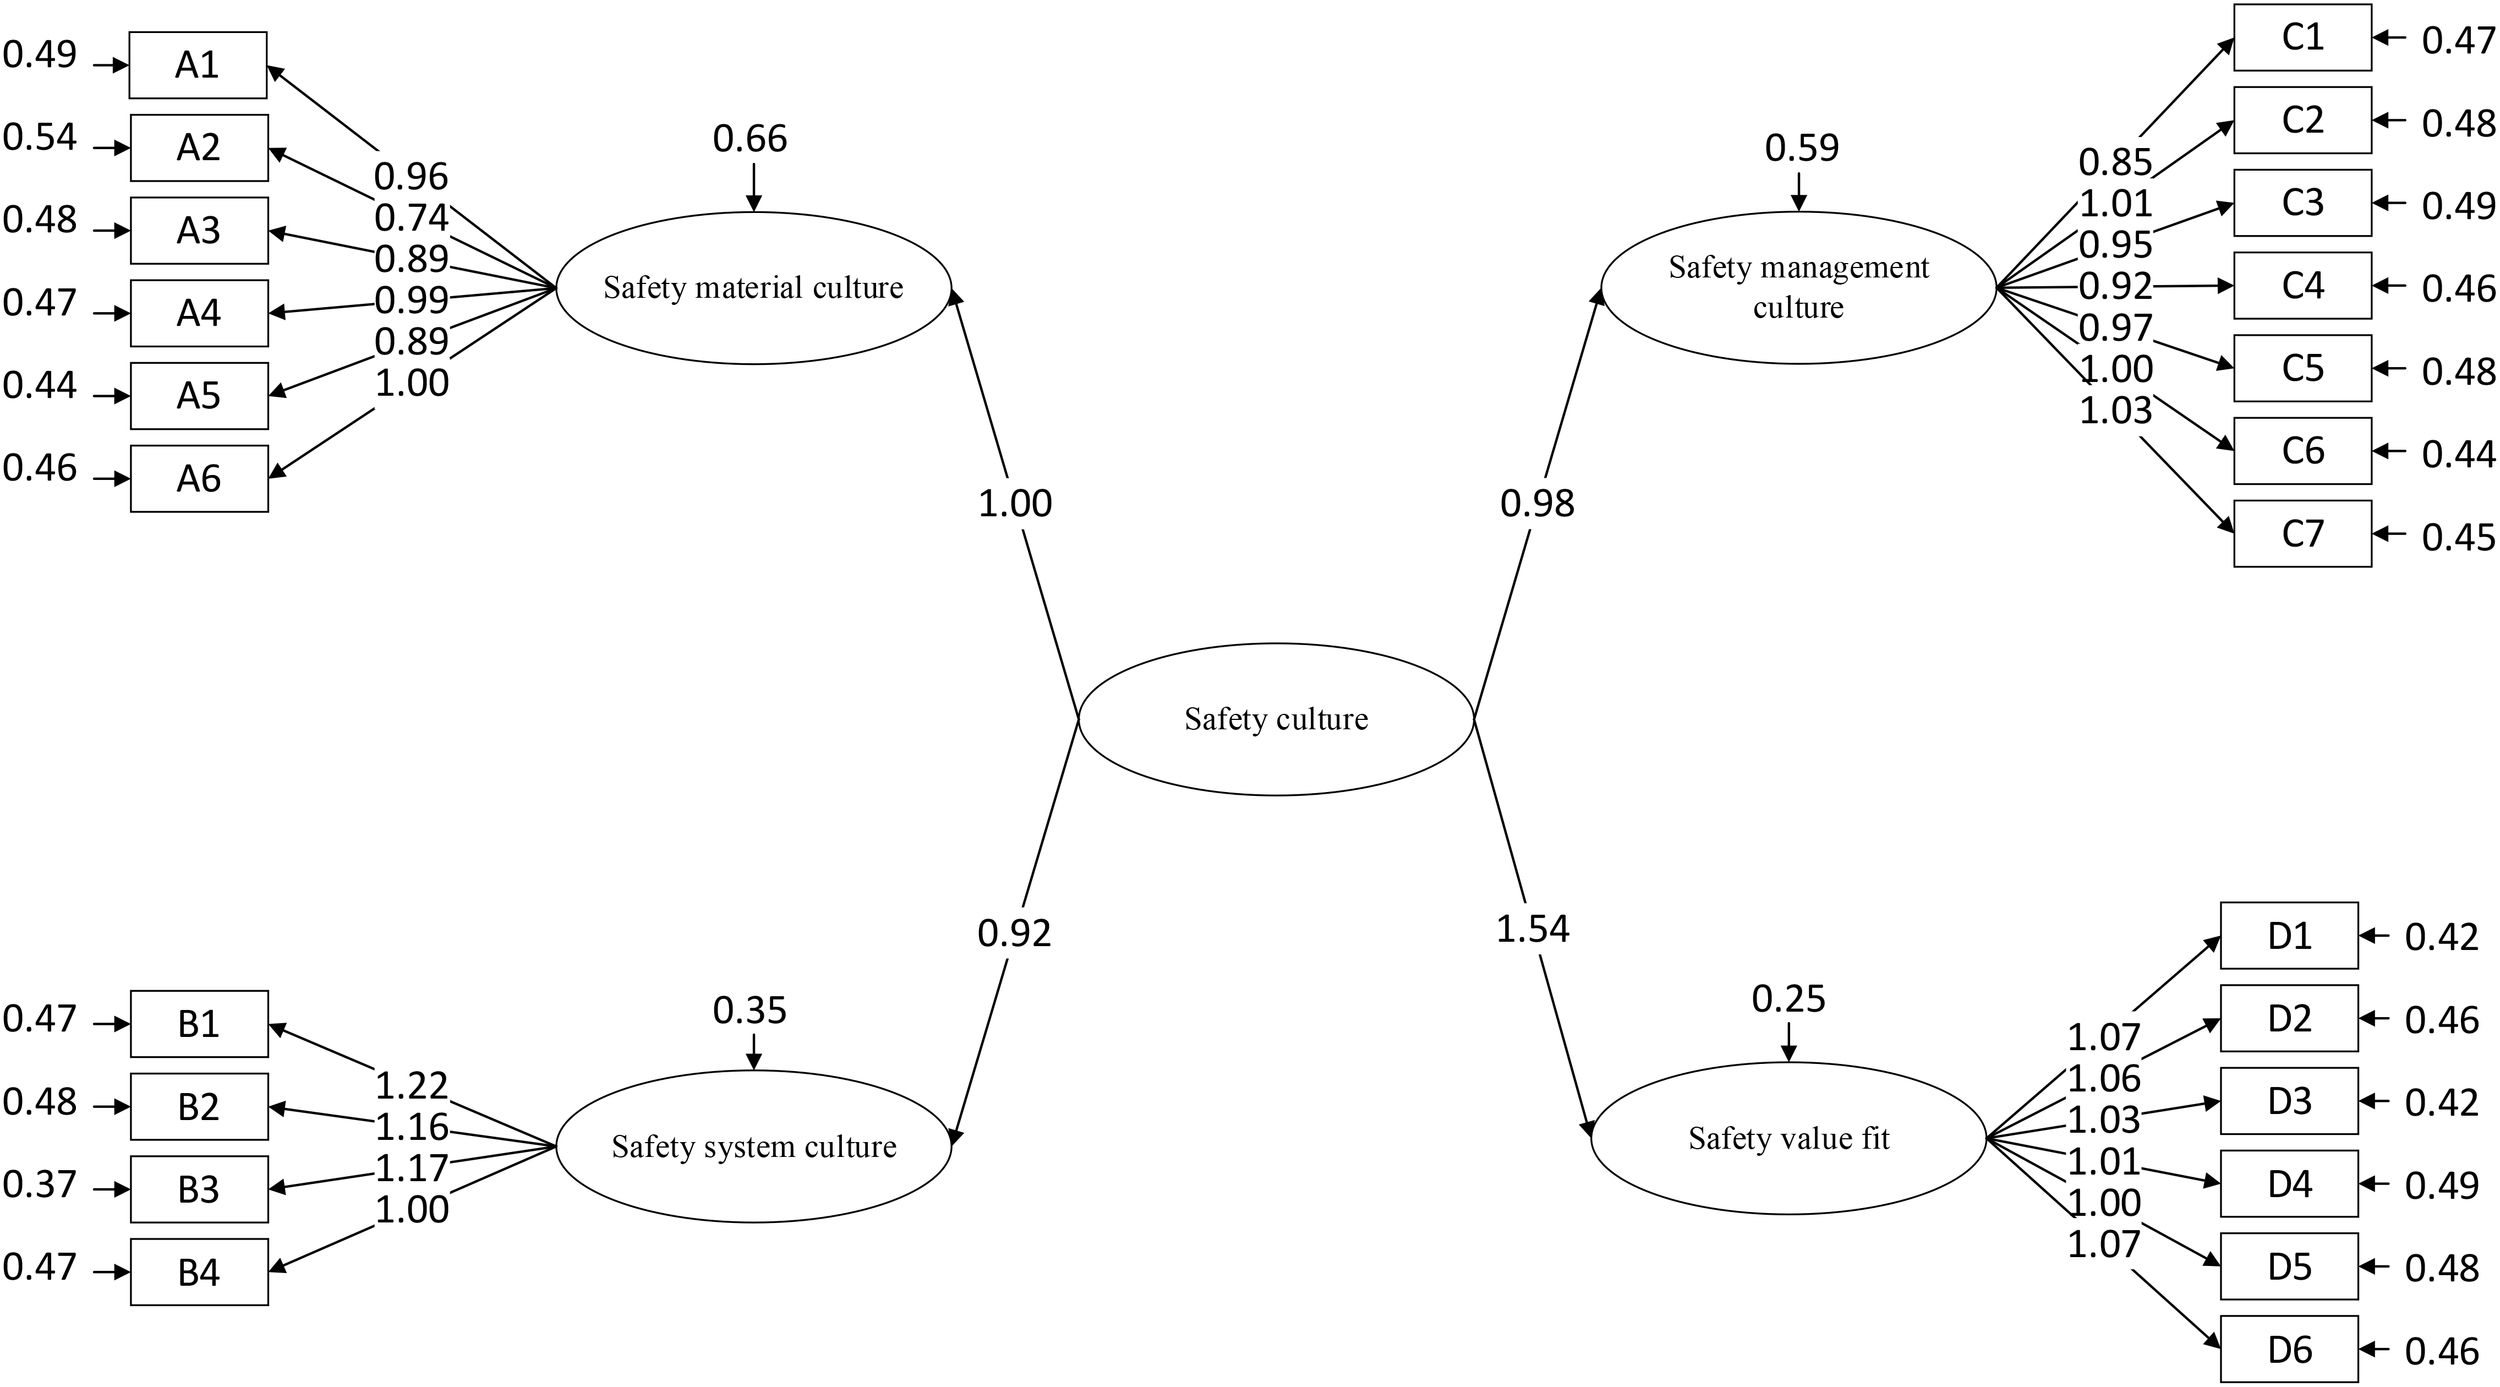
Second order safety culture CFA model.
Table 8
| Model | χ2 | CFI | TLI |
|---|---|---|---|
| First order safety culture CFA | 265.165 | 0.986 | 0.985 |
| Second order safety culture CFA | 271.448 | 0.985 | 0.983 |
Comparison between first-order and second-order CFA models of safety culture.
Target coefficient = first order χ2/Second order χ2≈0.977
According to the results of Table 8 and the research of Marsh and Hocevar (1985), it is known that the comparative fitting index (CFI) and Tucker-Lewis index (TLI) of the second-order model are both greater than 0.9, indicating that the second-order model fits well. In addition, the target coefficient of the first-order CFA model and the second-order CFA model is 0.977, the T value greater than 0.9 and approaching 1, it indicates that the second-order CFA model can replace the first-order CFA model, i.e., safety culture can be independently used as a factor for hypothesis testing in this paper.
4.4 Model fitting and hypothesis testing
The SEM is an important tool for multivariate data analysis. Model fitting and testing of hypothetical paths using SEM can be used to analyze the relationship between various factors, such as safety culture and safety behavior of ship officers.
In order to analyze the relationship between safety culture and safety behavior, the first model was constructed in AMOS as shown in Figure 5. It can be seen that the standardized path coefficients of safety culture on safety compliance behavior, prosocial safety behavior, and proactive safety behavior are 0.81, 0.76, and 0.76. Their C.R values are 7.683, 7.476, and 7.391, which are greater than 1.96 (Xi et al., 2020). Therefore, safety culture has a significant positive impact on safety compliance behavior, prosocial safety behavior and proactive safety behavior, H1, H2, and H3 all hold true.
Figure 5
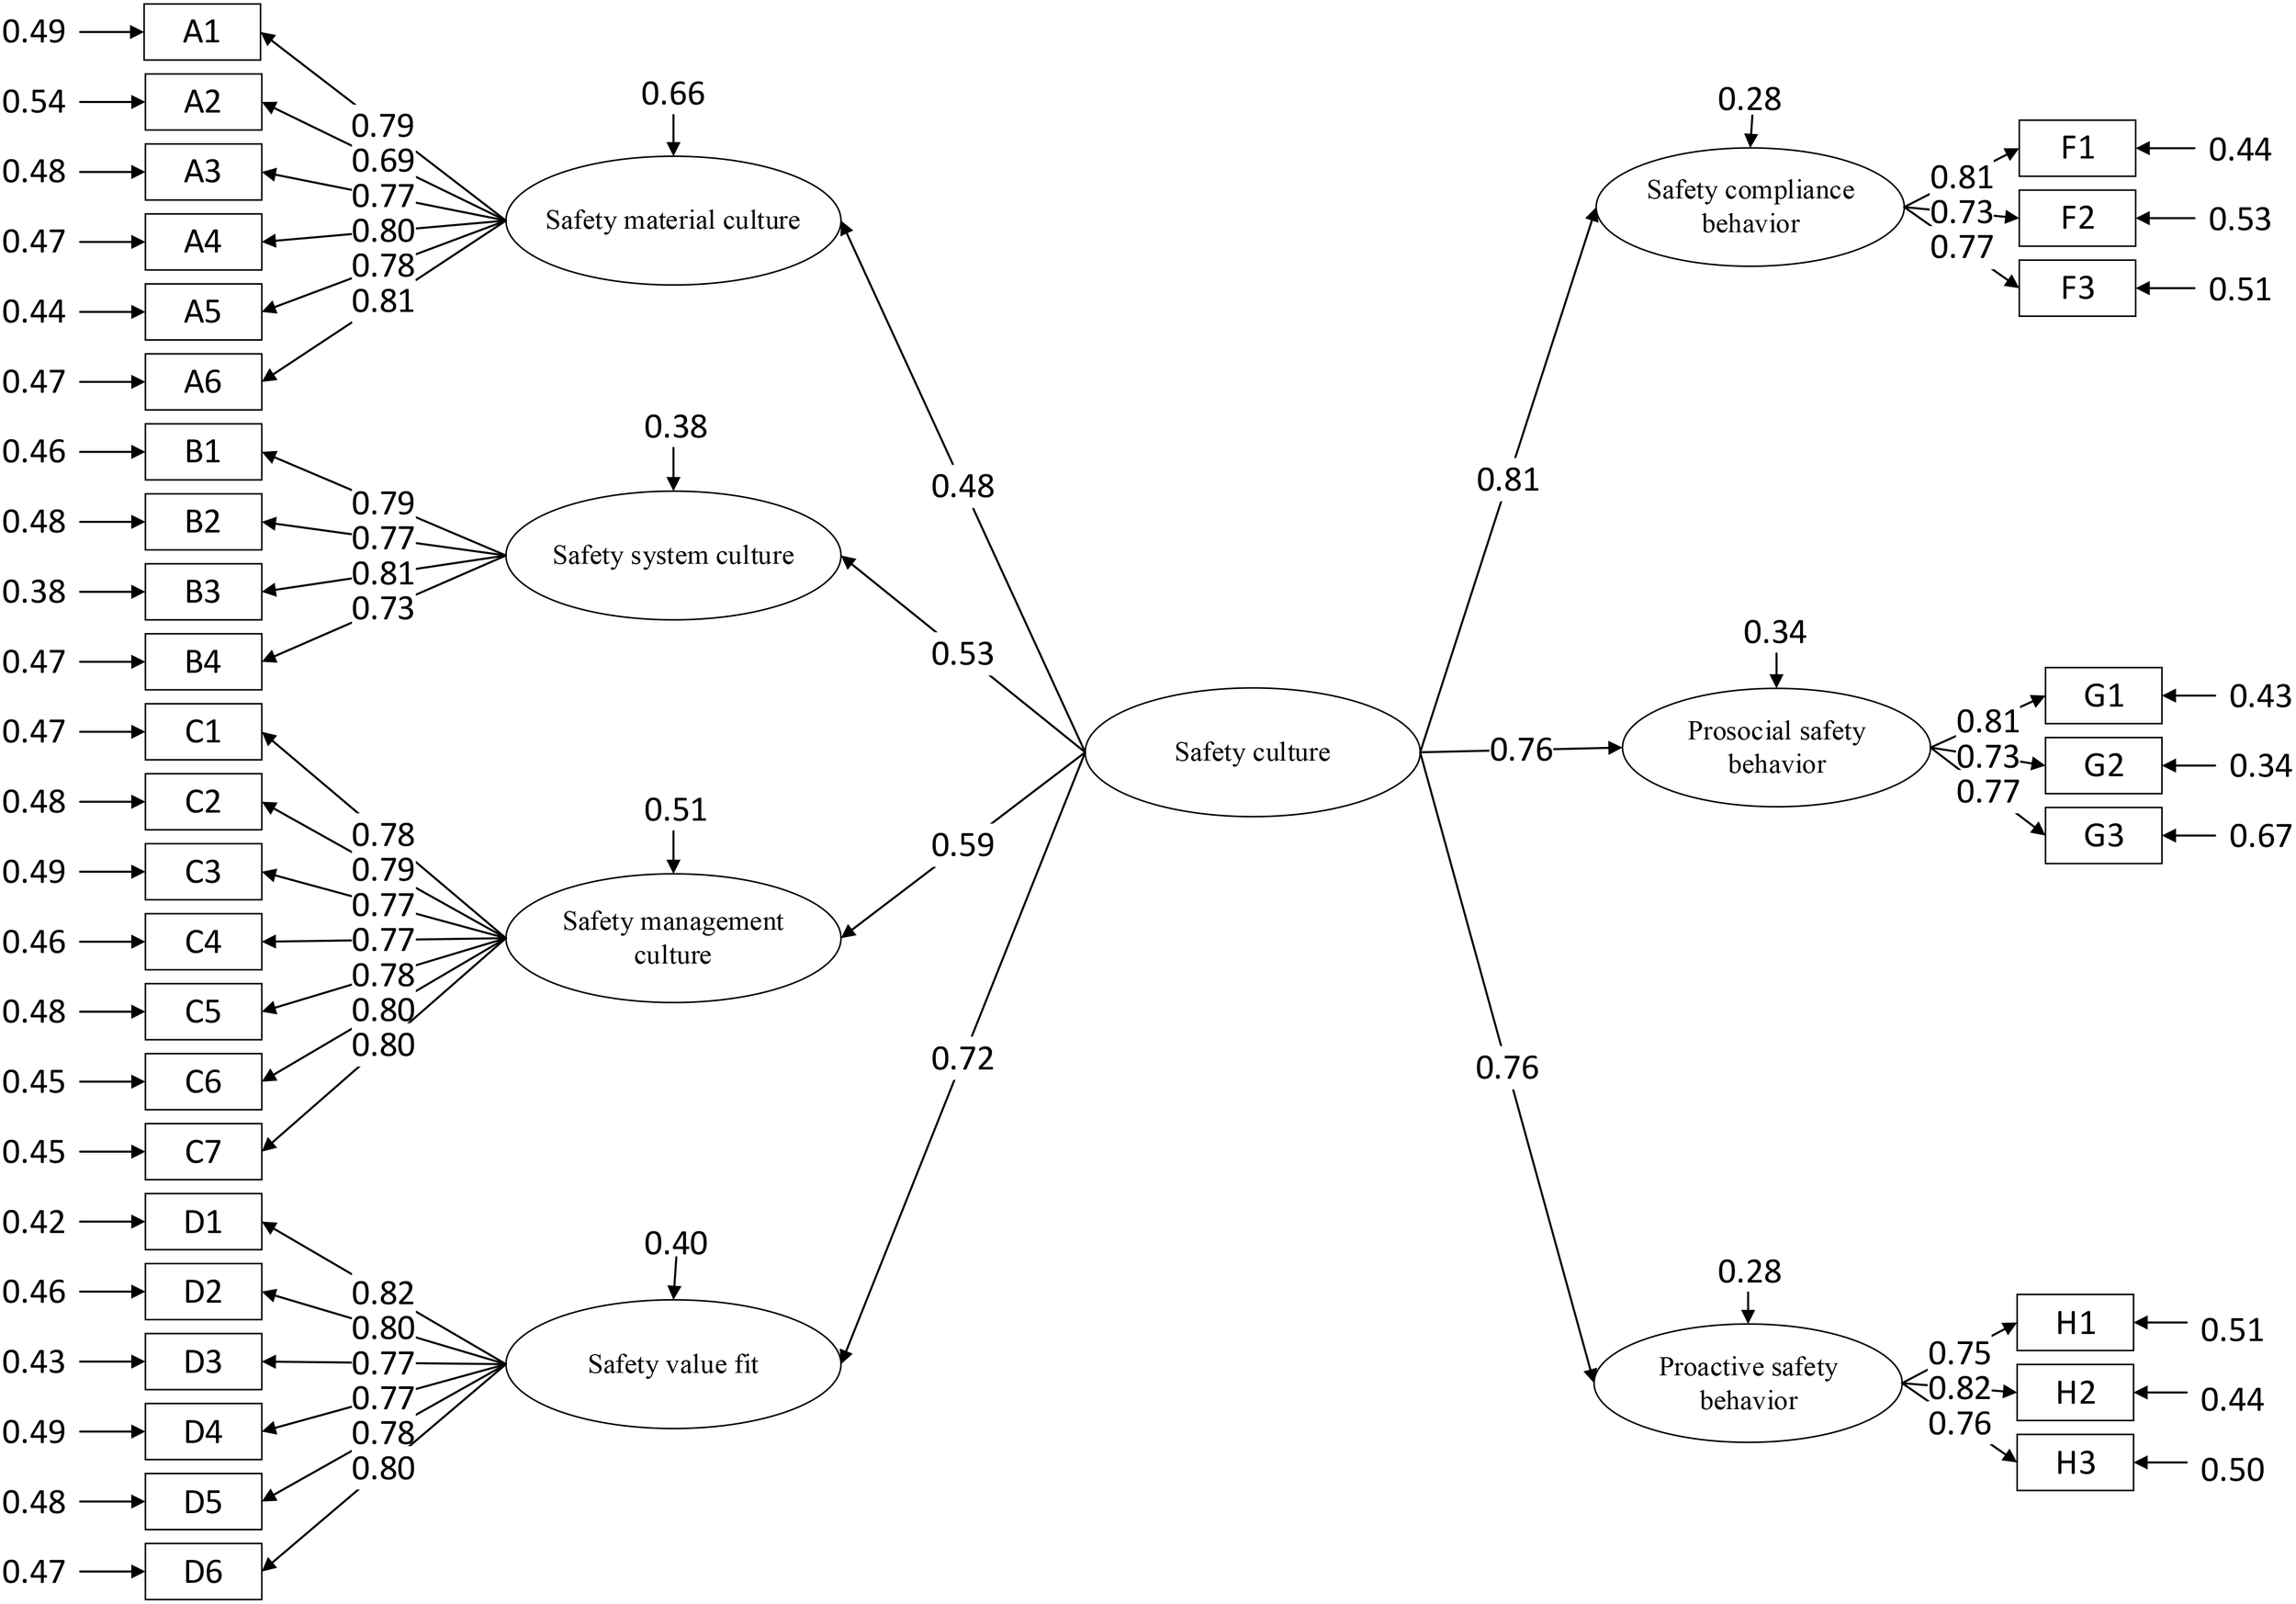
The first model.
In order to further study the influence of each dimension of safety culture on safety behavior, the second model was constructed in AMOS as shown in Figure 6. The standardized path coefficients of three paths, safety material culture → prosocial safety behavior, safety material culture → proactive safety behavior and safety system culture → proactive safety behavior are less than 0.1. The C.R values (Table 9) of these three paths are all less than 1.96, so the model should be revised.
Figure 6
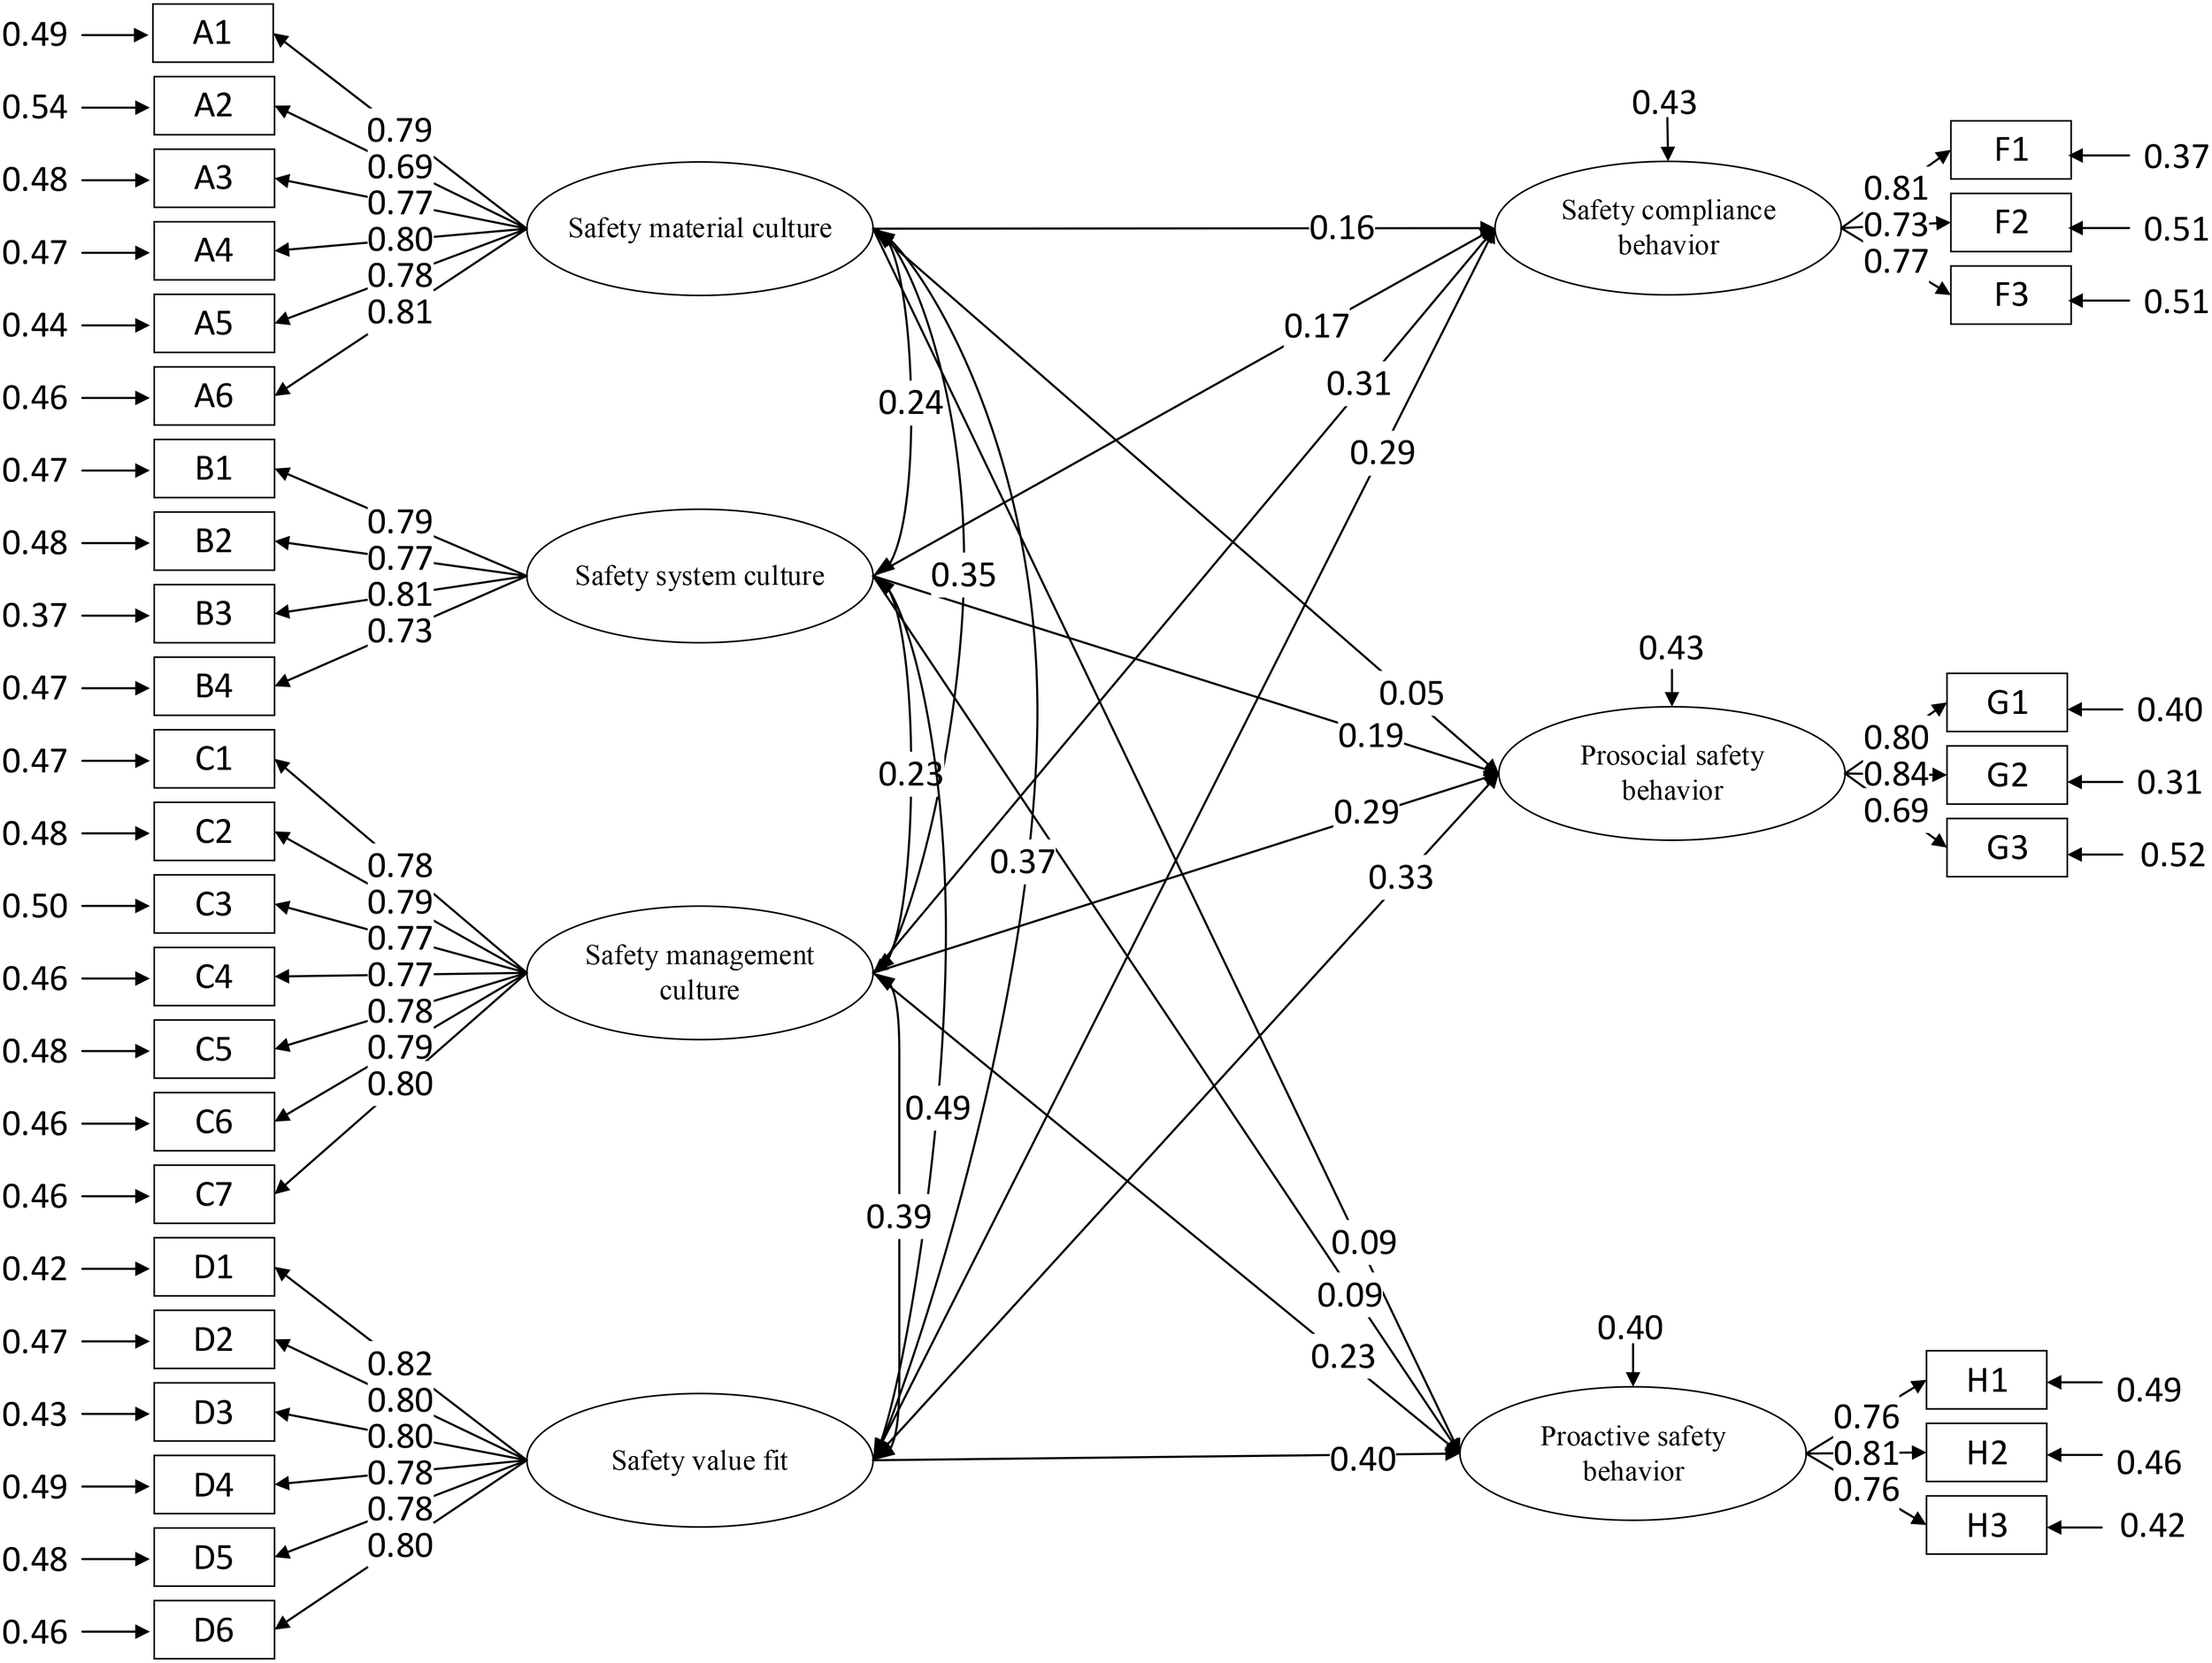
The second model.
Table 9
| Path | Standardized coefficient | Standard deviation | C.R | C.R>1.96 |
|---|---|---|---|---|
| H1-1: Safety material culture→ safety compliance behavior | 0.155 | 0.068 | 2.324 | Yes |
| H2-1: Safety material culture→ prosocial safety behavior | 0.048 | 0.066 | 0.683 | No |
| H3-1: Safety material culture→ proactive safety behavior | 0.089 | 0.064 | 1.606 | No |
| H1-2: Safety system culture→ safety compliance behavior | 0.170 | 0.096 | 2.328 | Yes |
| H2-2: Safety system culture→ prosocial safety behavior | 0.190 | 0.093 | 2.656 | Yes |
| H3-2: Safety system culture→ proactive safety behavior | 0.088 | 0.090 | 1.227 | No |
| H1-3: Safety management culture→ safety compliance behavior | 0.309 | 0.074 | 4.421 | Yes |
| H2-3: Safety management culture→ prosocial safety behavior | 0.291 | 0.073 | 4.148 | Yes |
| H3-3: Safety management culture→ proactive safety behavior | 0.234 | 0.069 | 3.396 | Yes |
| H1-4: Safety value fit→ safety compliance behavior | 0.289 | 0.081 | 3.269 | Yes |
| H2-4: Safety value fit→ prosocial safety behavior | 0.330 | 0.080 | 3.786 | Yes |
| H3-4: Safety value fit→ proactive safety behavior | 0.403 | 0.080 | 4.508 | Yes |
The hypotheses testing results of the second model.
After modifying the model, the third model was obtained as shown in Figure 7. According to Figure 7, the standardized path coefficients of each path are all greater than 0.1, indicating a correlation between variables. The results of model fitting for the third model are shown in Table 10. Comparing the fitting results of the third model in Table 10 with the requirements of Schermelleh-Engel et al. (2003) for model fitting, it can be seen that all indicators meet the above requirements, indicating that the model fitting effect is good and hypothesis testing could be conducted.
Figure 7
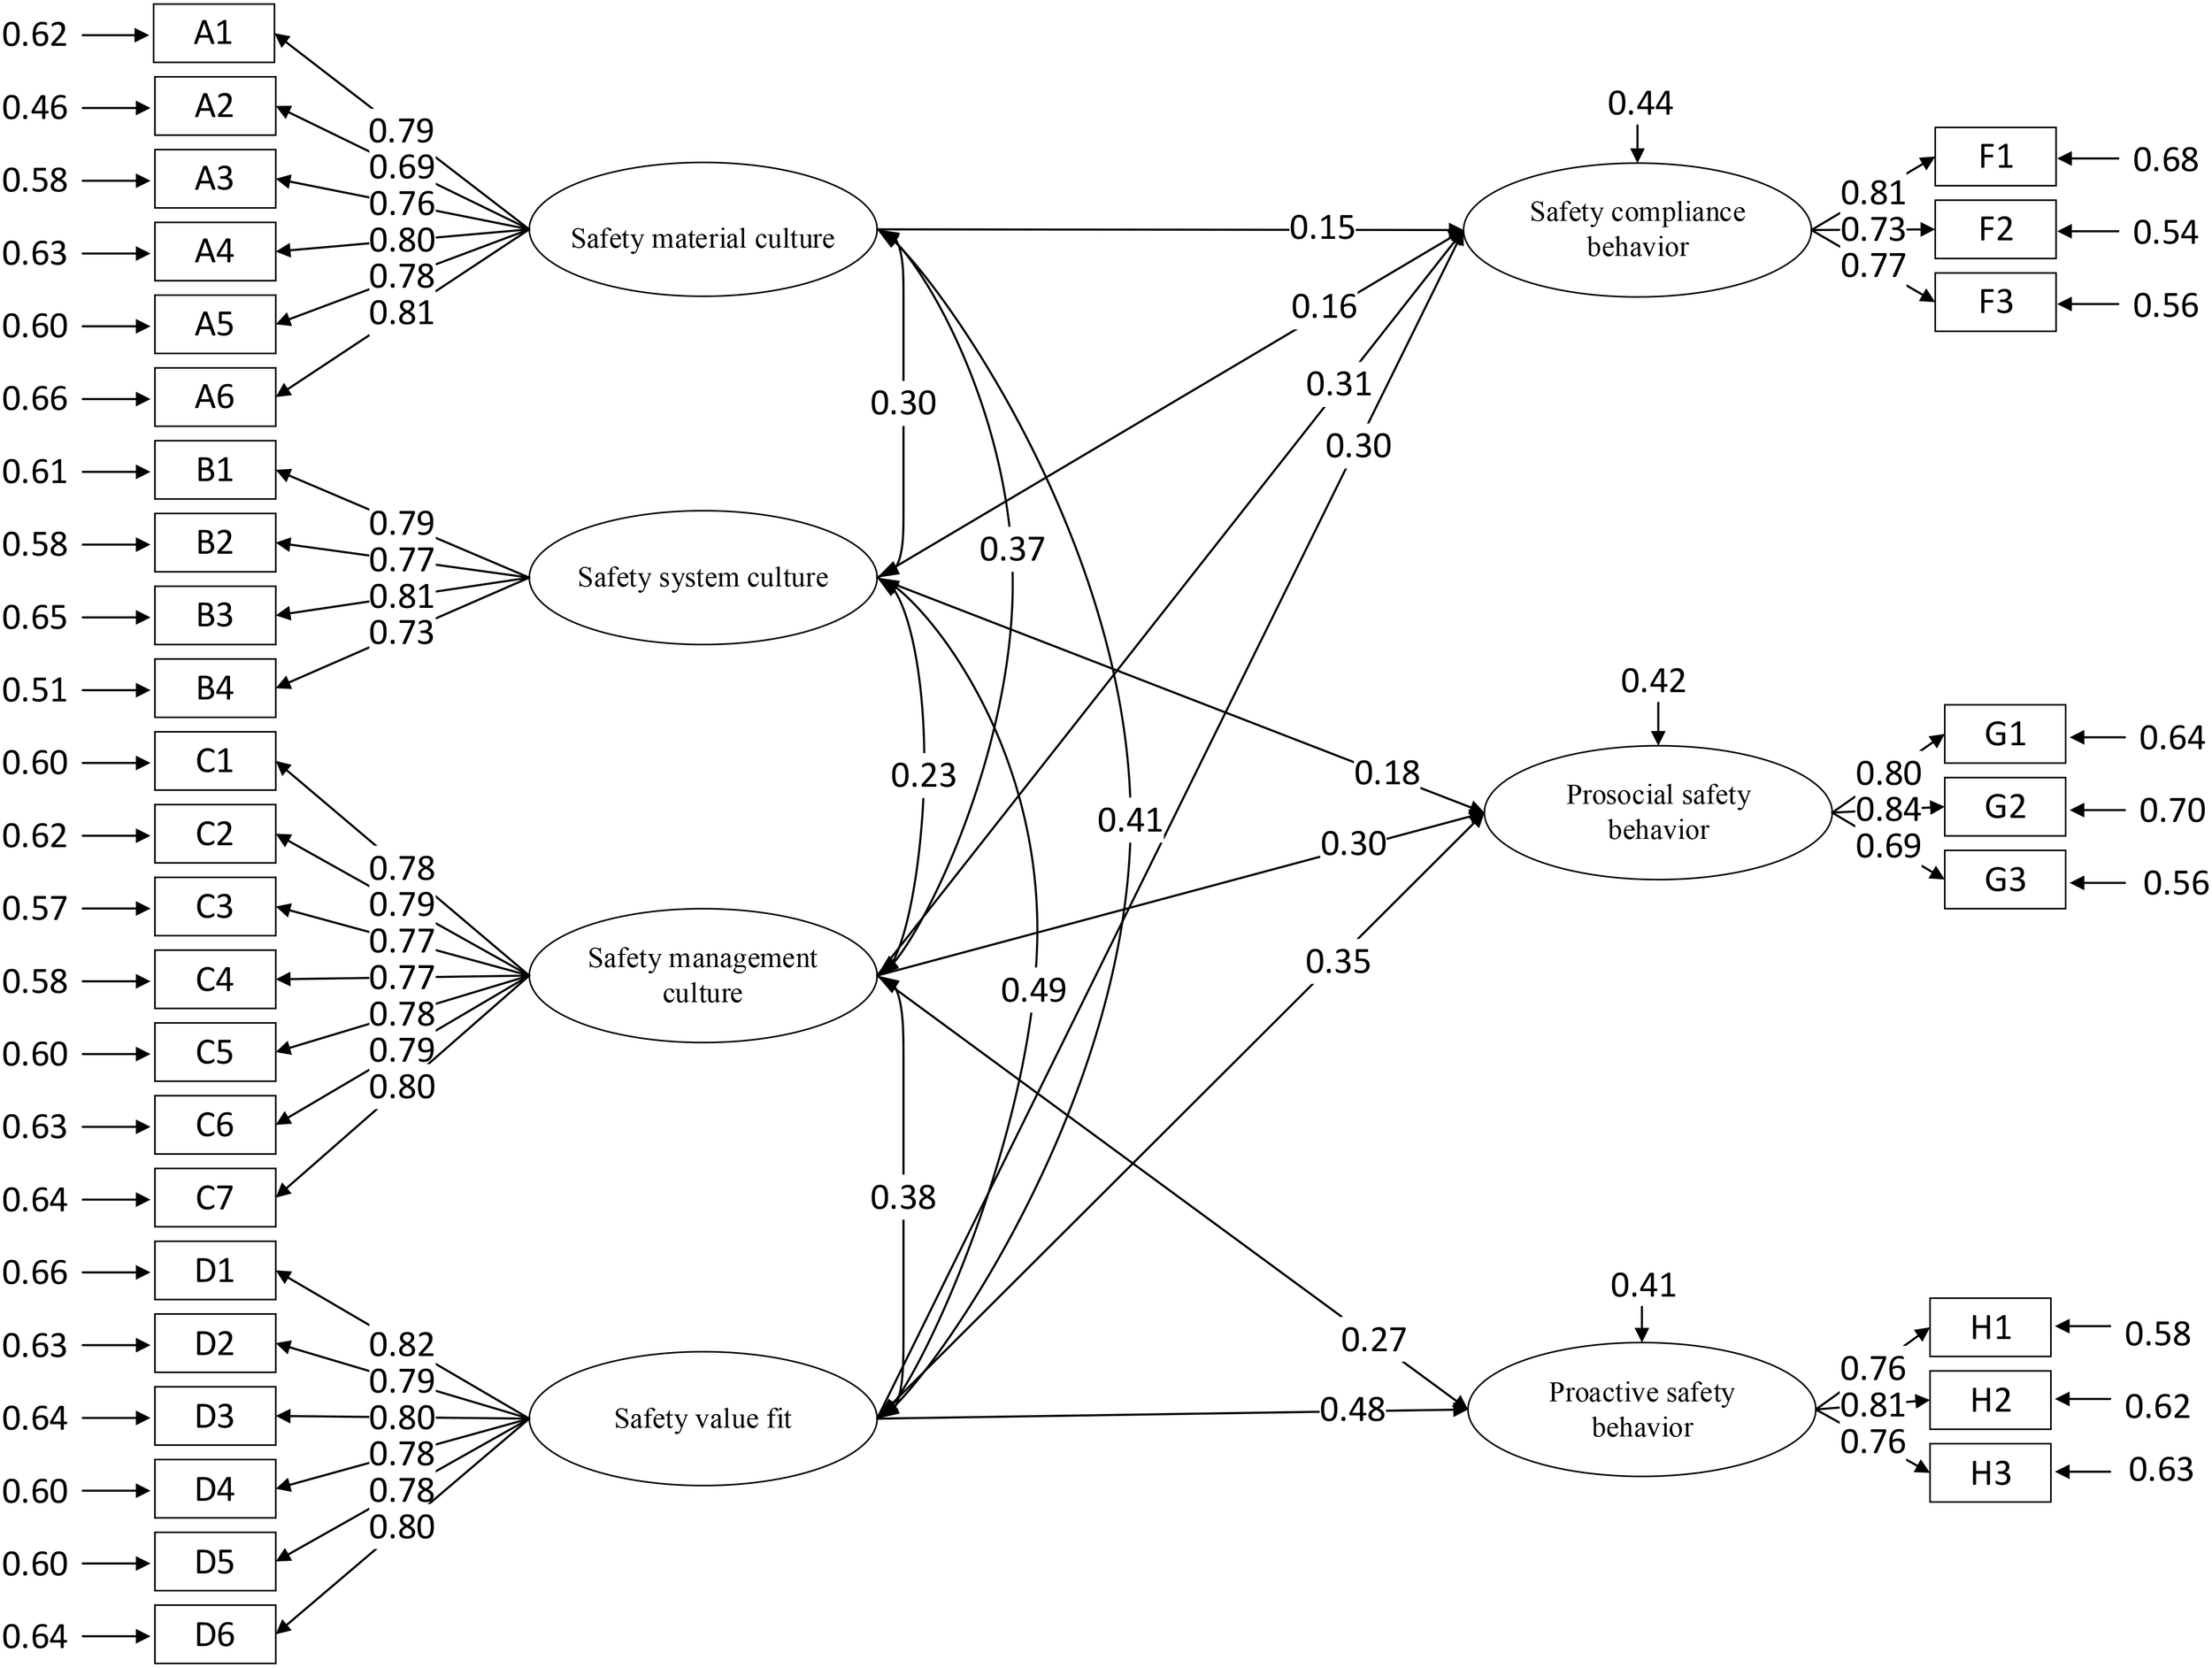
The third model.
Table 10
| Index | χ2 | df | χ2/df | CFI | TLI | RMSEA | SRMR | PNFI | IFI |
|---|---|---|---|---|---|---|---|---|---|
| Standard | - | - | 1 ~3 | >0.9 | >0.9 | <0.05 | <0.08 | >0.5 | >0.9 |
| Model 1 | 534.027 | 457 | 1.169 | 0.981 | 0.979 | 0.027 | 0.039 | 0.813 | 0.981 |
| Model 3 | 563.588 | 449 | 1.255 | 0.972 | 0.969 | 0.033 | 0.049 | 0.793 | 0.972 |
The goodness-of-fit of the first model and the third model.
The results of hypothesis testing on the third model are shown as Table 11, where the C.R value of each path is greater than 1.96, and their standardized path coefficients have reached a significant level. All paths have been validated.
Table 11
| Path | Standardized coefficient | Standard deviation | C.R | C.R>1.96 |
|---|---|---|---|---|
| H1-1: Safety material culture→ safety compliance behavior | 0.145 | 0.069 | 2.032 | Yes |
| H1-2: Safety system culture→ safety compliance behavior | 0.161 | 0.097 | 2.071 | Yes |
| H2-2: Safety system culture→ prosocial safety behavior | 0.184 | 0.096 | 2.354 | Yes |
| H1-3: Safety management culture→ safety compliance behavior | 0.312 | 0.076 | 4.230 | Yes |
| H2-3: Safety management culture→ prosocial safety behavior | 0.304 | 0.074 | 4.199 | Yes |
| H3-3: Safety management culture→ proactive safety behavior | 0.265 | 0.069 | 3.643 | Yes |
| H1-4: Safety value fit→ safety compliance behavior | 0.299 | 0.084 | 3.544 | Yes |
| H2-4: Safety value fit→ prosocial safety behavior | 0.348 | 0.083 | 4.130 | Yes |
| H3-4: Safety value fit→ proactive safety behavior | 0.481 | 0.073 | 6.013 | Yes |
The hypotheses testing results of the first model and the third model.
By sorting out the above hypothesis test results (Table 12), safety material culture, safety system culture, safety management culture and safety value fit can all positively affect safety compliance behavior. Safety system culture, safety management culture and safety value fit can positively affect prosocial safety behavior, but the influence of safety material culture on prosocial safety behavior is not significant. Safety management culture and safety value fit can positively affect proactive safety behavior, but the impact of safety material culture and safety system culture on proactive safety behavior is not significant. Therefore, the hypothesis of H2-1, H3–1 H3–2 do not hold, and the remaining hypotheses hold true.
Table 12
| Hypothesis | Results |
|---|---|
| H1: Safety culture→ safety compliance behavior | Yes |
| H1-1: Safety material culture→ safety compliance behavior | Yes |
| H1-2: Safety system culture→ safety compliance behavior | Yes |
| H1-3: Safety management culture→ safety compliance behavior | Yes |
| H1-4: Safety value fit→ safety compliance behavior | Yes |
| H2: Safety culture→ prosocial safety behavior | Yes |
| H2-1: Safety material culture→ prosocial safety behavior | No |
| H2-2: Safety system culture→ prosocial safety behavior | Yes |
| H2-3: Safety management culture→ prosocial safety behavior | Yes |
| H2-4: Safety value fit→ prosocial safety behavior | Yes |
| H3: Safety culture→ proactive safety behavior | Yes |
| H3-1: Safety material culture→ proactive safety behavior | No |
| H3-2: Safety system culture→ proactive safety behavior | No |
| H3-3: Safety management culture→ proactive safety behavior | Yes |
| H3-4: Safety value fit→ proactive safety behavior | Yes |
The results of hypotheses testing.
5 Discussion
5.1 Analysis of the influence of safety culture on safety behavior
Based on the above research results, we can find that safety culture has a positive impact on ship officers’ safety compliance behavior, prosocial safety behavior and proactive safety behavior, indicating that the safety behavior of ship officers can be improved through the development of safety culture. In order to promote the safety of navigation, shipping companies should develop their safety culture according to their own situation.
Among the dimensions of safety culture, safety material culture has a positive impact on the safety compliance behavior of ship officers, but has no significant impact on the prosocial safety behavior and proactive safety behavior of ship officers. The reason for this result is that ship officers regard the provision of protective equipment and emergency support as the duty of the shipping company, and the provision of protective equipment and emergency support can provide good working conditions for ship officers, but it cannot make ship officers feel the importance of the shipping company to safety, so the safety material culture only has a positive impact on safety compliance behavior. In medium-sized enterprises of high-risk industries, the safety material culture has a positive impact on employees’ safety compliance behavior (Mei et al., 2017). In view of this, shipping companies should be aware that on the basis of attaching importance to and strengthening the development of safety material culture, they should also pay attention to the development of non-material culture at the level of safety management and values on board.
Safety system culture has a positive impact on ship officers’ safety compliance behavior and prosocial safety behavior, but has no significant impact on ship officers’ proactive safety behavior. We believe that the reason for this result is that the strict rules and regulations on board force ship officers to work passively in accordance with the regulations and participate in safety activities on time, but due to the imperfection of the safety system, such as the lack of reward and punishment system, etc., it can’t motivate ship officers to actively maintain their own safety and that of the ship. Thus, a more humane and flexible safety system should be designed on board, and a reasonable reward and punishment system should be established to stimulate the active safety behavior of ship officers.
Safety management culture has a positive impact on ship officers’ safety compliance behavior, prosocial safety behavior and proactive safety behavior. We have found that a good safety management system on board can make ship officers feel that the shipping company and management personnel attach importance to the safety of ship officers, which can stimulate the initiative of ship officers, so that ship officers are willing to contribute to the maintenance of themselves and the safety of the ship on the basis of actively participating in the safety activities on the ship. At the same time, Shang et al. (2011) found that safety management has a positive impact on safety performance in the context of container handling operations. Therefore, shipping companies can ensure the effective implementation of a safety management culture by encouraging ship officers to participate in the safety management and decision-making process, and conducting regular safety inspections.
Safety value fit has a positive impact on the safety compliance behavior, prosocial safety behavior and proactive safety behavior of ship officers. In nautical practice, when ship officers believe that they and their colleagues on board consider safety to be the most important part of their work activities, they will work together to create a good working atmosphere and actively deepen their safety awareness and improve their safety literacy, rather than just viewing safety as a mandatory rule or external constraint. Hence, shipping companies should attach great importance to the cultivation and shaping of safety values, guide ship officers to establish a correct safety concept, let safety values be deeply rooted in the hearts of the people, become the code of conduct and action guide for each ship officer, and provide a solid guarantee for shipping safety.
5.2 Research advantages and limitations
In particular, as far as we know, on the basis of previous studies (Curcuruto et al., 2015), this paper divides ship officers’ safety participation behavior into prosocial safety behavior and proactive safety behavior for the first time, in which prosocial safety behavior emphasizes helping colleagues and caring for their safety, proactive safety behavior emphasizes bringing positive changes to workplace safety. The results of this paper show that the impact of safety culture on prosocial safety behavior and proactive safety behavior is not exactly the same, so the division of ship officers’ safety participation behavior can help to more accurately understand and describe the specific behavior of ship officers in maintaining themselves and ship safety, so as to get more targeted suggestions for improvement. It is helpful to build a more comprehensive theoretical framework of safety behavior and to identify the focus and direction of the development of safety culture.
At the same time, there are some limitations of this paper. First, a self-reported scale is used to investigate safety culture and safety behavior. Therefore, ship officers may be reluctant to report actual safety behaviors in order to avoid unfavorable consequences to themselves. Second, this paper divides safety culture into four dimensions, which makes it difficult to easily and clearly describe and measure such a large and complex structure of safety culture. Therefore, the inclusion of other dimensions and other factors affecting safe behavior should be considered in future studies. Finally, due to the lack of knowledge about the management system of shipping companies, the items of the scale need further improvement in future studies.
6 Conclusion
Based on the definition and dimension division of safety culture and safety behavior by different organizations and individuals, this paper proposes and verifies a new model, analyzes and discusses the influence of safety culture on ship officers’ safety behavior in the shipping industry, and provides new ideas and methods for safety management in the shipping industry, in order to reduce marine accidents and unsafe behaviors of ship officers. By using structural equation model, this study empirically analyzed the impact of safety material culture, safety system culture, safety management culture, and safety value fit on safety behavior. It is found that safety material culture has a positive impact on safety compliance behavior, safety system culture has a positive impact on safety compliance behavior and prosocial safety behavior, while safety management culture and safety value fit have a positive impact on safety compliance behavior, prosocial safety behavior and proactive safety behavior. Therefore, in shipping practice, we can focus on the two dimensions of safety management culture and safety value fit to promote the safety culture in the shipping industry and improve the safety behavior of ship officers.
In theory, the research results of this article reveal the important role of safety culture in improving ship officers’ safety behavior at the theoretical level, expanding the analytical dimensions of ship officers’ safety behavior research. In practice, this article provides an actionable path for the development of safety culture in the shipping industry, which can help shipping companies develop measures to improve ship officers’ behavior based on their own situation, thereby reducing the possibility of maritime accidents. By continuously developing safety culture, the shipping industry is expected to achieve a paradigm shift from “accident response” to “risk prevention”, providing solid guarantees for global maritime safety.
In the future research, the dimension division of the safety culture of the shipping industry can be further enriched and improved on the basis of this study through in-depth investigation of the actual operation of shipping companies, so as to better reflect the characteristics of the shipping industry. And for the study of ship officers’ safety behavior, the behavior of ship officers can be objectively recorded with the help of intelligent equipment, so as to avoid subjectivity. In terms of the dimension division of safety behavior, it can be further subdivided on the basis of the research in this paper, so as to better study the correlation mechanism between safety culture and safety behavior.
Statements
Data availability statement
The raw data supporting the conclusions of this article will be made available by the authors, without undue reservation.
Author contributions
YX: Writing – original draft, Methodology, Conceptualization, Validation. ZW: Methodology, Software, Conceptualization, Writing – original draft. SH: Validation, Formal Analysis, Writing – review & editing, Software. BH: Conceptualization, Writing – review & editing, Formal Analysis. JY: Formal Analysis, Writing – original draft, Validation, Conceptualization.
Funding
The author(s) declare that financial support was received for the research and/or publication of this article. This work is supported by funding from the State Key Laboratory of Maritime Technology and Safety (Grant No. W24CG000042). The views expressed remain solely those of the authors.
Conflict of interest
Authors BH was/were employed by Shanghai Institute of Shipping and Transportation Science Co., Ltd.
The remaining authors declare that the research was conducted in the absence of any commercial or financial relationships that could be construed as a potential conflict of interest.
Generative AI statement
The author(s) declare that no Generative AI was used in the creation of this manuscript.
Publisher’s note
All claims expressed in this article are solely those of the authors and do not necessarily represent those of their affiliated organizations, or those of the publisher, the editors and the reviewers. Any product that may be evaluated in this article, or claim that may be made by its manufacturer, is not guaranteed or endorsed by the publisher.
References
1
Altinpinar İ. Başar E. (2022). Investigation of the effect of vessel type on seafarers’ safety culture. Int. J. Occup. Saf. Ergonom.28, 1618–1623. doi: 10.1080/10803548.2021.1916209
2
Aydin M. Camliyurt G. Akyuz E. Arslan O. (2021). Analyzing human error contributions to maritime environmental risk in oil/chemical tanker ship. Hum. Ecol. Risk Assess.: Int. J.27, 1838–1859. doi: 10.1080/10807039.2021.1910011
3
Bagozzi R. P. (1981). Evaluating structural equation models with unobservable variables and measurement error: A comment. J. OF MARKET. Res.18, 375–381. doi: 10.1177/002224378101800312
4
Berg H. P. (2013). Human factors and safety culture in maritime safety (revised). TransNav Int. J. Marine Navig. Saf. Sea Transport.7, 343–352. doi: 10.12716/1001.07.03.04
5
Bhattacharjee K. Bugalia N. Mahalingam A. (2025). Differences in pathways to resilient safety culture for construction projects of different sizes. J. Construct. Eng. Manage.151, 04025026. doi: 10.1061/JCEMD4.COENG-15046
6
Clarke S. (2006). The relationship between safety climate and safety performance: A meta-analytic review. J. Occup. Health Psychol.11, 315–327. doi: 10.1037/1076-8998.11.4.315
7
Cooper M. D. (2000). Towards a model of safety culture. Saf. Sci.36, 111–136. doi: 10.1016/S0925-7535(00)00035-7
8
Corrigan S. Kay A. Ryan M. Ward M. E. Brazil B. (2019). Human factors and safety culture: Challenges and opportunities for the port environment. Saf. Sci.119, 252–265. doi: 10.1016/j.ssci.2018.03.008
9
Curcuruto M. Conchie S. M. Mariani M. G. Violante F. S. (2015). The role of prosocial and proactive safety behaviors in predicting safety performance. Saf. Sci.80, 317–323. doi: 10.1016/j.ssci.2015.07.032
10
Darbra R. M. Crawford J. F. E. Haley C. W. Morrison R. J. (2007). Safety culture and hazard risk perception of Australian and New Zealand maritime pilots. Marine Policy.31, 736–745. doi: 10.1016/j.marpol.2007.02.004
11
Dos Santos Grecco C. H. Vidal M. C. R. Cosenza C. A. N. Dos Santos I. J. A. L. De Carvalho P. V. R. (2014). Safety culture assessment: A fuzzy model for improving safety performance in a radioactive installation. Prog. Nuclear Energy.70, 71–83. doi: 10.1016/j.pnucene.2013.08.001
12
Ek Å. Olsson U. M. M. Akselsson K. R. (2000). Safety culture onboard ships. Proc. Hum. Fact. Ergonom. Soc. Annu. Meet.44, 320–322. doi: 10.1177/154193120004402710
13
Erdem P. Akyuz E. Aydin M. Celik E. Arslan O. (2024). Assessment of human error contribution to container loss risk under fault tree analysis and interval type-2 fuzzy logic-based SLIM approach. Proc. Instit. Mechan. Eng. Part M: J. Eng. Maritime Environ.238, 553–566. doi: 10.1177/14750902231203074
14
European Maritime Safety Agency (2023). Annual Overview of Marine Casualties and Incidents 2023 (Lisbon: EMSA). Available at: https://www.emsa.europa.eu/emcip/items.html?cid=141&id=5052.
15
Fernández-Muñiz B. Montes-Peón J. M. Vázquez-Ordás C. J. (2007). Safety management system: Development and validation of a multidimensional scale. J. Loss Prev. Process Industr.20, 52–68. doi: 10.1016/j.jlp.2006.10.002
16
Flin R. Mearns K. O’Connor P. Bryden R. (2000). Measuring safety climate: Identifying the common features. Saf. Sci.34, 177–192. doi: 10.1016/S0925-7535(00)00012-6
17
Griffin M. A. Curcuruto M. (2016). Safety climate in organizations. Annu. Rev. Organ. Psychol. Organ. Behavior.3, 191–212. doi: 10.1146/annurev-orgpsych-041015-062414
18
Guldenmund F. W. (2000). The nature of safety culture: A review of theory and research. Saf. Sci.34, 215–257. doi: 10.1016/S0925-7535(00)00014-X
19
Guo B. H. W. Yiu T. W. González V. A. (2016). Predicting safety behavior in the construction industry: Development and test of an integrative model. Saf. Sci.84, 1–11. doi: 10.1016/j.ssci.2015.11.020
20
Hair J. F. Black W. C. Babin B. J. Anderson R. E. (2010). Multivariate Data Analysis. 7th ed (USA: Prentice Hall).
21
Håvold J. I. (2005). Safety-culture in a Norwegian shipping company. J. Saf. Res.36, 441–458. doi: 10.1016/j.jsr.2005.08.005
22
Health and Safety Executive (2005). A review of safety culture and safety climate literature for the development of the safety culture inspection toolkit (Bristol: HSE). Research report 367.
23
Hinkin T. R. (1998). A brief tutorial on the development of measures for use in survey questionnaires. Organ. Res. Methods1, 104–121. doi: 10.1177/109442819800100106
24
Hogan S. J. Coote L. V. (2014). Organizational culture, innovation, and performance: A test of Schein’s model. J. Business Res.67, 1609–1621. doi: 10.1016/j.jbusres.2013.09.007
25
Howard M. C. (2016). A review of exploratory factor analysis decisions and overview of current practices: what we are doing and how can we improve? Int. J. Human-Computer Interact.32, 51–62. doi: 10.1080/10447318.2015.1087664
26
International Chamber of Shipping (2013). Implementing an Effective Safety Culture (London: ICS). Available at: http://www.ics-shipping.org/docs/default-source/resources/safety-security-and-operations/implementing-an-effective-safety-culture.pdf?sfvrsn=8 (Accessed December 2, 2020).
27
International Maritime Organization (1993). International Management Code for the Safe Operation of Ships and for Pollution Prevention (International Safety Management (ISM) Code) (No. A.741(18)) (London: IMO). Available at: https://www.imo.org/en/OurWork/HumanElement/Pages/ISMCode.aspx (Accessed November 4, 1993).
28
International Maritime Organization (2003). Role of the Human Element. (No. MSC 77/17) (London: IMO). Available at: www.sjofartsverket.se/upload/4001/77-17.pdf (Accessed September 28, 2013).
29
International Nuclear Safety Advisory Group (1996). Report on Defence in Depth in Nuclear Safety (Vienna: International Atomic Energy Agency. INSAG).
30
Jensen O. C. (2004). Incidence of self-reported occupational injuries in seafaring—An international study. Occup. Med.54, 548–555. doi: 10.1093/occmed/kqh090
31
Jiang Z. Xiao Z. Feng Y. Cao Y. Zhou D. Wang X. (2025). Analysis of risk influential factors of marine pilots during the embarkation and disembarkation. J. Marine Eng. Technol.24, 40–53. doi: 10.1080/20464177.2024.2397847
32
Jung M. (2021). Examining perceptual differences in maritime safety climate: A case study of korean seafarers. J. Marine Sci. Eng.9, 381. doi: 10.3390/jmse9040381
33
Kalteh H. O. Mortazavi S. B. Mohammadi E. Salesi M. (2021). The relationship between safety culture and safety climate and safety performance: A systematic review. Int. J. Occup. Saf. Ergonom.27, 206–216. doi: 10.1080/10803548.2018.1556976
34
Kao L. H. Stewart M. Lee K. H. (2009). Using structural equation modeling to predict cabin safety outcomes among Taiwanese airlines. Transport. Res. Part E: Logist. Transport. Review.45, 357–365. doi: 10.1016/j.tre.2008.09.007
35
Kapusta M. Bąk P. Sukiennik M. (2024). Model of the formation of work safety culture in polish mining enterprises. Arch. Min. Sci.69, 253–270. doi: 10.24425/ams.2024.150344
36
Kvalheim S. A. Dahl Ø. (2016). Safety compliance and safety climate: A repeated cross-sectional study in the oil and gas industry. J. Saf. Res.59, 33–41. doi: 10.1016/j.jsr.2016.10.006
37
Lee S. Moh Y. B. Tabibzadeh M. Meshkati N. (2017). Applying the AcciMap methodology to investigate the tragic Sewol Ferry accident in South Korea. Appl. Ergonom.59, 517–525. doi: 10.1016/j.apergo.2016.07.013
38
Lu C. S. Tsai C. L. (2010). The effect of safety climate on seafarers’ safety behaviors in container shipping. Accident Anal. Prevent.42, 1999–2006. doi: 10.1016/j.aap.2010.06.008
39
Lu C. S. Yang C. S. (2011). Safety climate and safety behavior in the passenger ferry context. Accident Anal. Prevent.43, 329–341. doi: 10.1016/j.aap.2010.09.001
40
Luria G. (2010). The social aspects of safety management: Trust and safety climate. Accident Anal. Prevent.42, 1288–1295. doi: 10.1016/j.aap.2010.02.006
41
Marsh H. W. Hocevar D. (1985). Application of confirmatory factor analysis to the study of self-concept: first- and higher order factor models and their invariance across groups. psychol. Bullet.97, 562–582. doi: 10.1037/0033-2909.97.3.562
42
Mei Q. Zhang C. Li W. (2017). Relationship among Safety Culture, Safety Climate and Staffs’ Safety Behavior-An Empirical Analysis of SMEs in High-risk Industry. J. Systems & Manage.26, 277–286.
43
Nævestad T. O. (2017). Safety culture, working conditions and personal injuries in Norwegian maritime transport. Marine Policy.84, 251–262. doi: 10.1016/j.marpol.2017.07.019
44
Neal A. Griffin M. A. Hart P. M. (2000). The impact of organizational climate on safety climate and individual behavior. Saf. Sci.34, 99–109. doi: 10.1016/S0925-7535(00)00008-4
45
Oguz Erkal E. D. Hallowell M. R. Bhandari S. (2023). Formal evaluation of construction safety performance metrics and a case for a balanced approach. J. Saf. Res.85, 380–390. doi: 10.1016/j.jsr.2023.04.005
46
Podsakoff P. M. MacKenzie S. B. Lee J.-Y. Podsakoff N. P. (2003). Common method biases in behavioral research: A critical review of the literature and recommended remedies. J. Appl. Psychol.88, 879–903. doi: 10.1037/0021-9010.88.5.879
47
Pratama G. B. Caponecchia C. (2025). Examining the influence of national culture on aviation safety: A systematic review. J. Saf. Res.92, 317–330. doi: 10.1016/j.jsr.2024.11.020
48
Robinson J. P. Shaver P. R. Wrightsman L. S. (1991). Measures of Personality and Social Psychological Attitudes (San Diego: Academic Press).
49
Schermelleh-Engel K. Moosbrugger H. Müller H. (2003). Evaluating the fit of structural equation models: tests of significance and descriptive goodness-of-fit measures. Methods psychol. Res. online.8, 23–74.
50
Shang K. C. Yang C. S. Lu C. S. (2011). The effect of safety management on perceived safety performance in container stevedoring operations. Int. J. Ship. Transp. Logist.3, 323. doi: 10.1504/IJSTL.2011.040801
51
Syed-Yahya S. N. N. Idris M. A. Noblet A. J. (2022a). The relationship between safety climate and safety performance: A review. J. Saf. Res.83, 105–118. doi: 10.1016/j.jsr.2022.08.008
52
Syed-Yahya S. N. N. Noblet A. J. Idris M. A. Lee M. C. C. (2022b). Examining the role of supervisory and co-worker safety support in mediating the relationship between safety climate and safety performance. Saf. Sci.155, 105880. doi: 10.1016/j.ssci.2022.105880
53
Tian S. C. Li L. Wang L. Jing X. P. (2011). Fuzzy comprehensive evaluation of enterprises safety culture based on ANP. China Saf. Sci. J.21, 15–20. doi: 10.16265/j.cnki.issn1003-3033.2011.07.018
54
Wang X. Zhang B. Zhao X. Wang L. Tong R. (2020). Exploring the underlying causes of chinese eastern star, korean sewol, and thai phoenix ferry accidents by employing the HFACS-MA. Int. J. Environ. Res. Public Health17, 4114. doi: 10.3390/ijerph17114114
55
Wang J. Zhou Y. Zhuang L. Shi L. Zhang S. (2023). A model of maritime accidents prediction based on multi-factor time series analysis. J. Marine Eng. Technol.22, 153–165. doi: 10.1080/20464177.2023.2167269
56
Xi Y. Hu S. Yang Z. Fu S. Weng J. (2023). Analysis of safety climate effect on individual safety consciousness creation and safety behaviour improvement in shipping operations. Maritime Policy Manage.50, 941–956. doi: 10.1080/03088839.2022.2059718
57
Xi Y. Liu R. Zhang Q. (2020). Impact of safety climate on safety behavior of maritime pilots: mediation of safety consciousness. China Saf. Sci. J.30, 15–21. doi: 10.16265/j.cnki.issn1003-3033.2020.09.003
58
Xi Y. Zhang Q. Hu S. Yang Z. Fu S. (2021). The effect of social cognition and risk tolerance on marine pilots’ safety behaviour. Maritime Policy Manage.48, 1–18. doi: 10.1080/03088839.2020.1847338
59
Zhang Q. Xi Y. Xuan S. Hu S. (2021). The influence path of safety culture on pilot’s safety behavior. 2021 6th Int. Conf. Transport. Inf. Saf. (ICTIS), 811–815. doi: 10.1109/ICTIS54573.2021.9798662
60
Zohar D. Luria G. (2003). The use of supervisory practices as leverage to improve safety behavior: A cross-level intervention model. J. Saf. Res.34, 567–577. doi: 10.1016/j.jsr.2003.05.006
Summary
Keywords
safety culture, ship officer, safety behavior, structural equation modelling, shipping industry
Citation
Xi Y, Wang Z, Hu S, Han B and Yin J (2025) The effect of safety culture on the safety behavior of ship deck officers- empirical evidence from shipping industry. Front. Mar. Sci. 12:1599455. doi: 10.3389/fmars.2025.1599455
Received
25 March 2025
Accepted
21 April 2025
Published
12 May 2025
Volume
12 - 2025
Edited by
Xinjian Wang, Dalian Maritime University, China
Reviewed by
Da Wu, Wuhan University of Technology, China
Qing Yu, Jimei University, China
Muhammet Aydin, Recep Tayyip Erdoğan University, Türkiye
Zhang Wenfen, Wuhan Textile University, China
Esma Uflaz, Istanbul Technical University, Türkiye
Updates
Copyright
© 2025 Xi, Wang, Hu, Han and Yin.
This is an open-access article distributed under the terms of the Creative Commons Attribution License (CC BY). The use, distribution or reproduction in other forums is permitted, provided the original author(s) and the copyright owner(s) are credited and that the original publication in this journal is cited, in accordance with accepted academic practice. No use, distribution or reproduction is permitted which does not comply with these terms.
*Correspondence: Jingbo Yin, jingboyin@sjtu.edu.cn
Disclaimer
All claims expressed in this article are solely those of the authors and do not necessarily represent those of their affiliated organizations, or those of the publisher, the editors and the reviewers. Any product that may be evaluated in this article or claim that may be made by its manufacturer is not guaranteed or endorsed by the publisher.