 Shuhang Chen1
 Zhihuan Wang2,3*
 Tianye Lu4Jiayang Zhu2
 Chunchang Zhang3,5Xiangming Zeng3,5Jiayi Wang1Zandi Shang6,7*
- 1Innovation Center, China Ocean Shipping Company (COSCO) Shipping Technology Co., Ltd, Shanghai, China
- 2Institute of Logistics Science and Engineering, Shanghai Maritime University, Shanghai, China
- 3National Engineering Research Center for Special Equipment and Power Systems of Ships and Marine Engineering, Shanghai, China
- 4Logistics Engineering College, Shanghai Maritime University, Shanghai, China
- 5Merchant Marine College, Shanghai Maritime University, Shanghai, China
- 6China Academy of Transportation Sciences, Beijing, China
- 7Key Laboratory of Transport Industry of Big Data Application Technologies for Comprehensive Transport, Beijing, China
Maritime cargo capacity serves as a critical indicator of port efficiency and regional economic impact, yet reliable data remain constrained by operational and commercial complexities. This study addresses this gap by leveraging maritime big data to compare traditional empirical methods with machine learning approaches, integrating multi-source datasets (ship inbound/outbound records, vessel archives, and AIS data). Results demonstrate that the K-nearest neighbors (KNN) algorithm achieves 88% predictive accuracy on validation data—a 19-percentage-point improvement over conventional methods (69%). While training accuracy reached 95%, anomalous vessel operations in validation samples reduced performance to 88%, revealing the model’s sensitivity to real-world variability and underscoring the need for enhanced data preprocessing. These findings highlight machine learning’s potential to refine cargo capacity estimation while emphasizing the importance of robust data quality frameworks for operational deployment.
1 Introduction
Driven by the resurgence of global trade and carbon neutrality objectives, ship cargo capacity forecasting has emerged as a pivotal component of the shipping industry’s digital transformation. According to the United Nations Conference on Trade and Development (UNCTAD) 2024 Report (UNCTAD, 2024), the Carbon Intensity Index (CII) grading system mandates that shipowners reduce carbon intensity per cargo turnover by 15% by 2026. In this context, enhancing cargo capacity prediction accuracy can minimize empty voyages and inefficient emissions by optimizing cargo allocation strategies. This advancement holds substantial potential for cutting operational costs and reducing the maritime sector’s carbon footprint.
This study demonstrates a systematic methodology for integrating multi-source maritime datasets—including 2023 ship inbound/outbound records, archival vessel specifications, and dynamic AIS trajectory data—to construct a robust framework for ship cargo capacity prediction through comprehensive data fusion and cleaning protocols. We conduct a comparative evaluation of two distinct estimation approaches: conventional empirical formulas based on International Maritime Organization (IMO) technical guidelines and data-driven machine learning models. For the machine learning approach, we specifically investigate how critical preprocessing techniques such as normalization and logarithmic transformation influence model performance and prediction stability. The trained models are subsequently validated against a temporally independent 2024 dataset to assess their generalizability and operational relevance in real-world maritime logistics scenarios.
The main contributions of this paper are as follows: Firstly, this paper pioneered the exploration of predicting ship cargo capacity with multi-source heterogeneous data and established separate cargo capacity prediction models for ships transporting different types of cargo. Secondly, to enhance the quality of the ship cargo capacity training dataset, we propose a data-cleaning method that corrects the negative correlation between draught and cargo capacity and removes draught data that do not comply with the regulations as per the IMO report. For missing data, this paper developed a machine-learning approach to fill in the gaps by leveraging the correlation between ship size information and the missing data. Thirdly, in the realm of ship cargo capacity estimation, this paper established machine-learning models to predict cargo capacity, using traditional empirical formula-based methods as a comparison. We employ suitable indicators to evaluate the models based on different samples, thereby demonstrating the accuracy of the trained models on the validation set. All the abbreviations used in this paper have been listed in Table A1 in Appendix A.
2 Literature review
The primary role of a merchant vessel is to transport cargo from one location to another, with its carrying capacity defined as the maximum mass it can safely carry. For bulk carriers transporting high-density cargos, deadweight tonnage (DWT) is commonly used to indicate the maximum carrying capacity. However, for other types of vessels, the measurement may vary. For instance, gas carriers use cubic meters, container ships use twenty-foot equivalent units (TEU), and Roll-on/Roll-off (RoRo) vessels use lane meters (Adland and Jia, 2018). The proportion of a vessel’s total carrying capacity occupied by paying cargo, known as payload, is referred to as vessel capacity utilization or load factor (Alizadeh and Talley, 2011b). For shipping companies, payload or capacity utilization is one of the main factors influencing their profitability and unit transport cost. The payload, as implied by a vessel’s draught, is also a crucial input for calculating vessel fuel consumption (Ghose, 2004). Despite the significance of payload in the shipping industry from both economic (micro and macro) and environmental perspectives, limited academic research has focused on this issue. As (Hjelle, 2011) notes, load factors are ‘critical input factors with scarce empirical evidence, … possibly because such information is considered highly sensitive.’
However, there are relatively few studies related to ship cargo capacity at present (Chen et al., 2023; Huang et al., 2023), and most of the research methods for obtaining ship cargo capacity include equipment measurement methods, empirical estimation methods (Alizadeh and Talley, 2011a; Sandvik, 2005). have presumed that the load factor or payload remains a constant proportion of a vessel’s carrying capacity, regardless of the measurement method used for that capacity (Styhre, 2010). examines the key factors influencing vessel capacity utilisation in a case study of ferry services in Scandinavia, where payload data is directly obtained from companies. According to (Styhre, 2010), service frequency, trade imbalance, demand fluctuations, types of customers and cargo, and the competitive landscape are the four primary factors affecting vessel capacity utilization (Kristensen, 2012). used a regression method to study the relationship between length, width, draught and maximum load capacity of different types of ships (Sun and Wang, 2011). mainly studied the relationship between the length and width of container ships, as well as the number of containers and their carrying capacity.
Although the above-mentioned research focuses on estimating the cargo volume through traditional methods (Chen et al., 2023, 2020; Liu et al., 2024), mentioned that the trend of intelligent shipping in recent years requires the prediction model to have dynamic adaptability (Cepowski, 2019). established a regression formula with cargo capacity by combining AIS data and considering ship mass based on length, width and draught (Gurgen et al., 2018). used artificial neural networks to predict parameters such as the length, width and draught of the ship, considering the maximum deadweight tonnage and designed speed of the ship, providing support for cargo capacity prediction (Jia et al., 2019). used traditional empirical formulas and combined them with draught data in AIS to estimate the cargo capacity of ships, verifying the reliability and applicability of the draught data in this data source (Yanagimoto et al., 2022). investigated the impact of acceleration on the cargo load of dry bulk carriers using Discrete Element Method (DEM)-Finite Element Method (FEM) coupling analyses combined with propagation models to assess the cargo load of dry bulk ships. To determine whether peak shipping capacity could be reached (Garrido et al., 2020), assessed the limits of ship size based on economies of scale, port infrastructure, demand, environmental trends, and naval design criteria.
In conclusion, methods for estimating ship cargo capacity based on shipping big data have not been extensively explored (Zou et al., 2025), and machine learning-related methods have not been adequately applied or validated. To address this gap, this paper takes global ships transporting crude oil, coal, ore, grain, Liquefied Natural Gas (LNG), and Liquefied Petroleum Gas (LPG) as examples. By leveraging multi-source heterogeneous data and integrating domain knowledge with statistical methods, we establish a high-quality dataset for predicting ship cargo capacity. We compare the accuracy of various machine learning models with traditional empirical formula methods under different data preprocessing conditions to predict cargo capacity. This approach holds significant value for global cargo monitoring, assessment of port influence, and estimation of port throughput (Li et al., 2024; Obeidat et al., 2024; Adland et al., 2017; Zhang, 2016). believes that it is also of great significance for establishing a shipping network.
3 Data and methodology
This study takes ships transporting crude oil, coal, ore, grain, LNG, LPG as examples. Before establishing the ship’s cargo capacity prediction model, the relevant data needs to be preprocessed to ensure the generalization performance of the cargo capacity prediction model by improving the data quality. The specific prediction framework is as follows, where the schematics is as shown in (Figure 1).
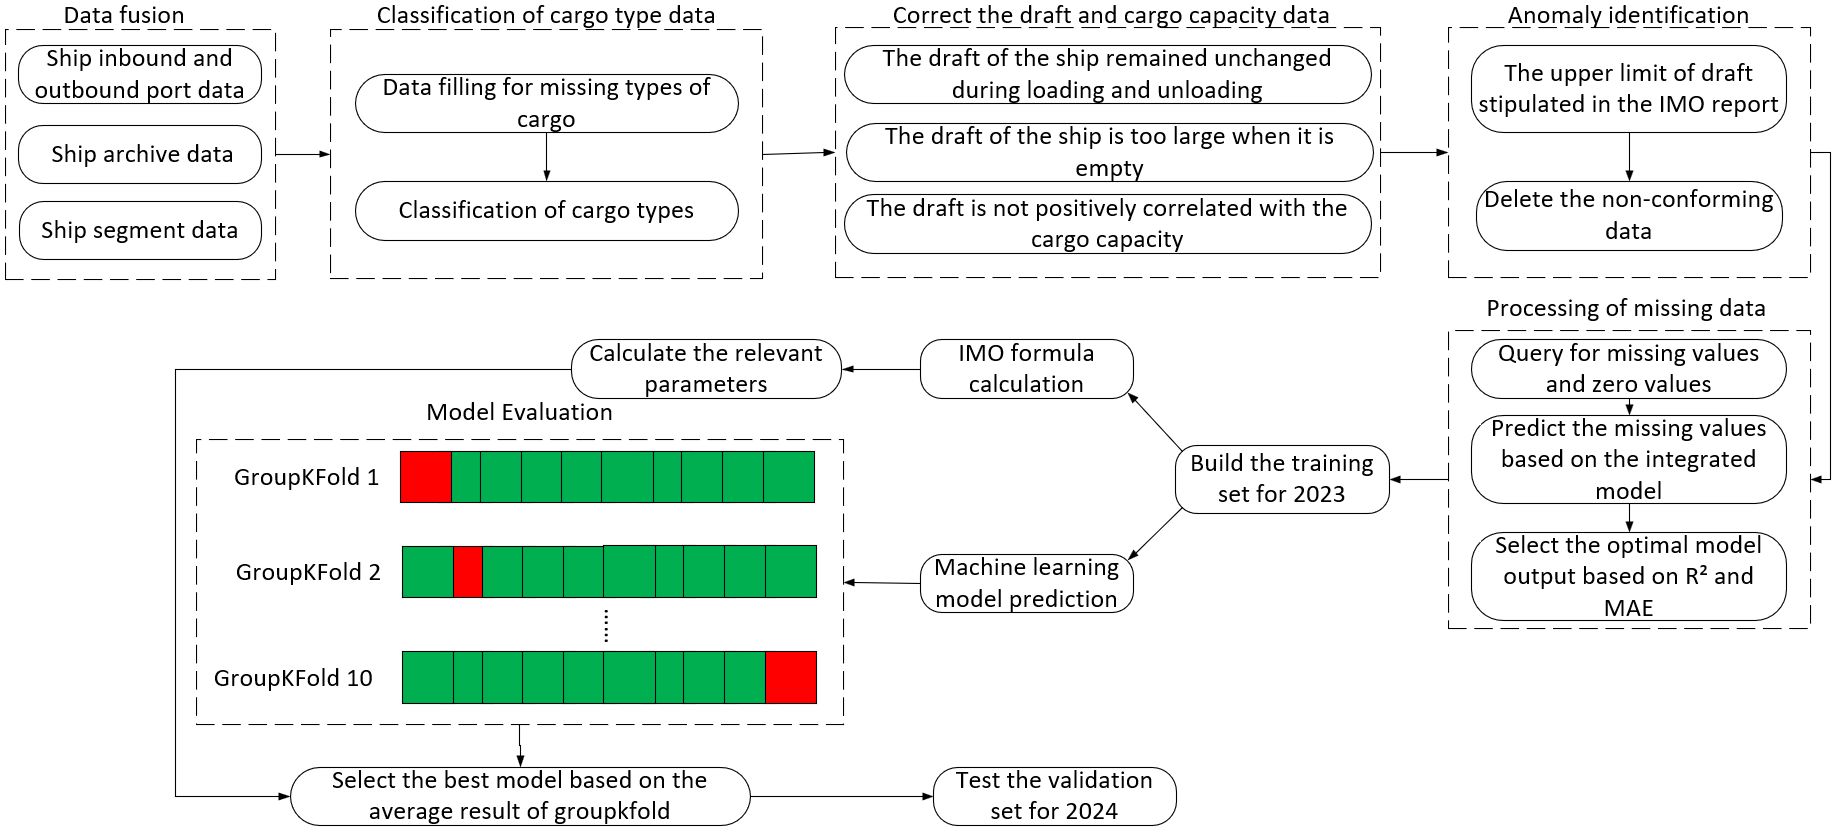
Figure 1. Prediction framework for ship cargo capacity.
3.1 Data
The dataset used in this study mainly includes ship inbound and outbound port data, AIS data, ship segment data, ship archive data, and port and berth archive data within 2023 (Table 1).
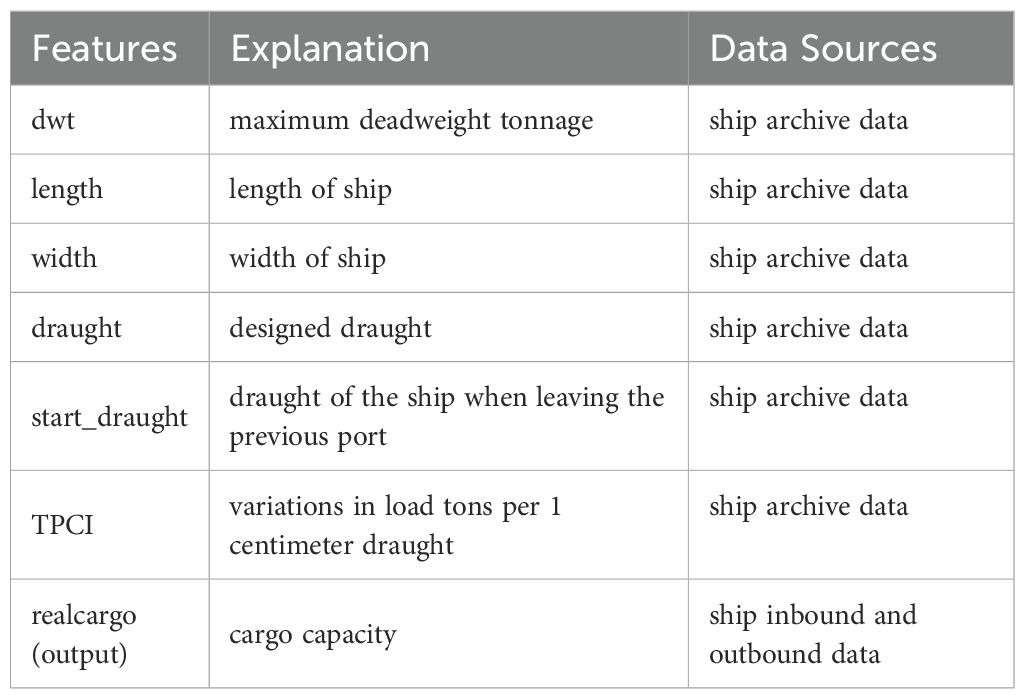
Table 1. Description of characteristics and output data.
3.1.1 Data fusion
Based on the data collected above, associations need to be established according to the common fields of the relevant data (Maritime Mobile Service Identity (mmsi), berth_uuid, report_start_time, report_end_time, etc.) to achieve data fusion of different ships in both temporal and spatial dimensions. The specific fusion process is as follows, where the schematics of the fusion process is displayed in Figure 2.
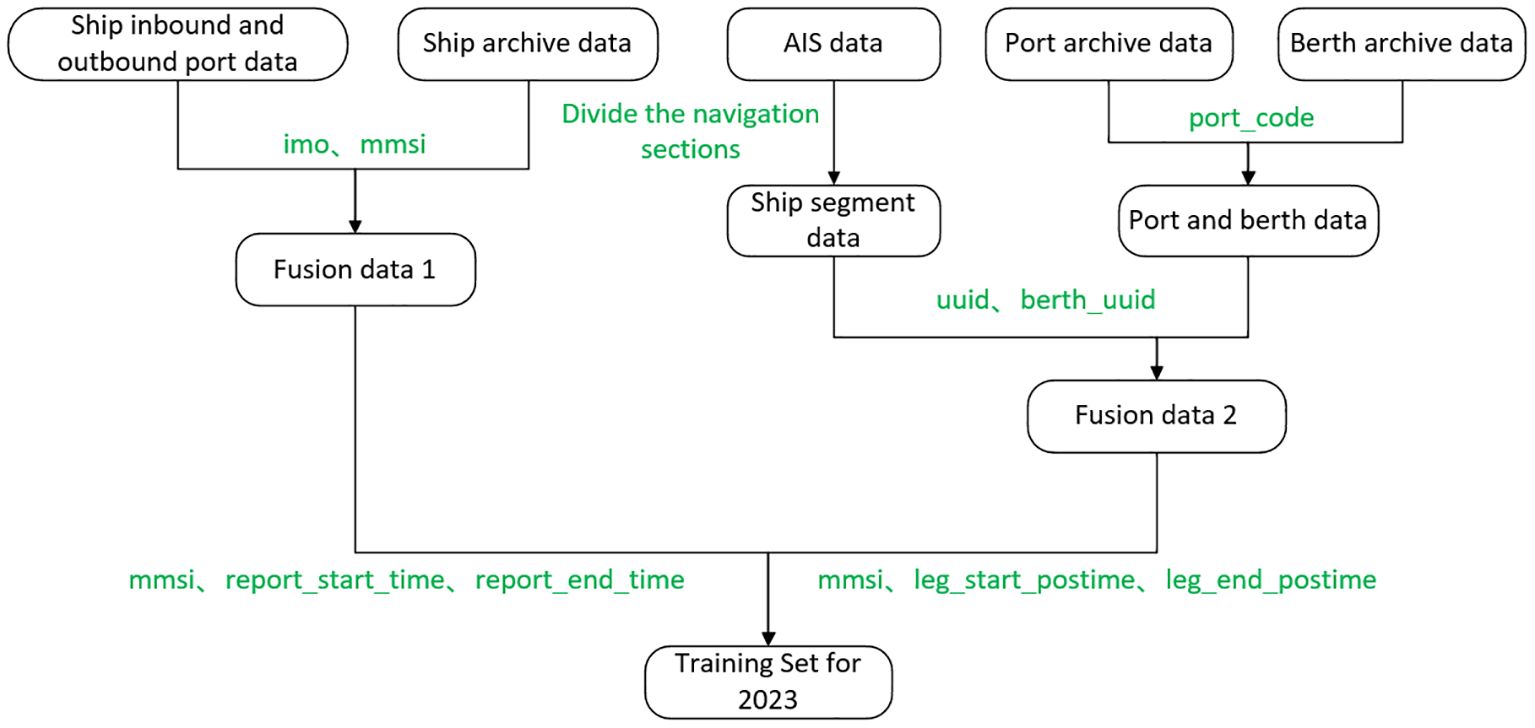
Figure 2. Processing of data fusion.
Among them, due to the differences in the definition of the time dimension among the multi-source data, when fusing based on the time in the inbound and outbound port data (start time, end time) and the time in the segment data (leg_start_postime, leg_end_postime), the cargo capacity of the previous port in the adjacent samples repeats in the next port, leading to anomalous problems. The reasons are illustrated in the following Figure 3.
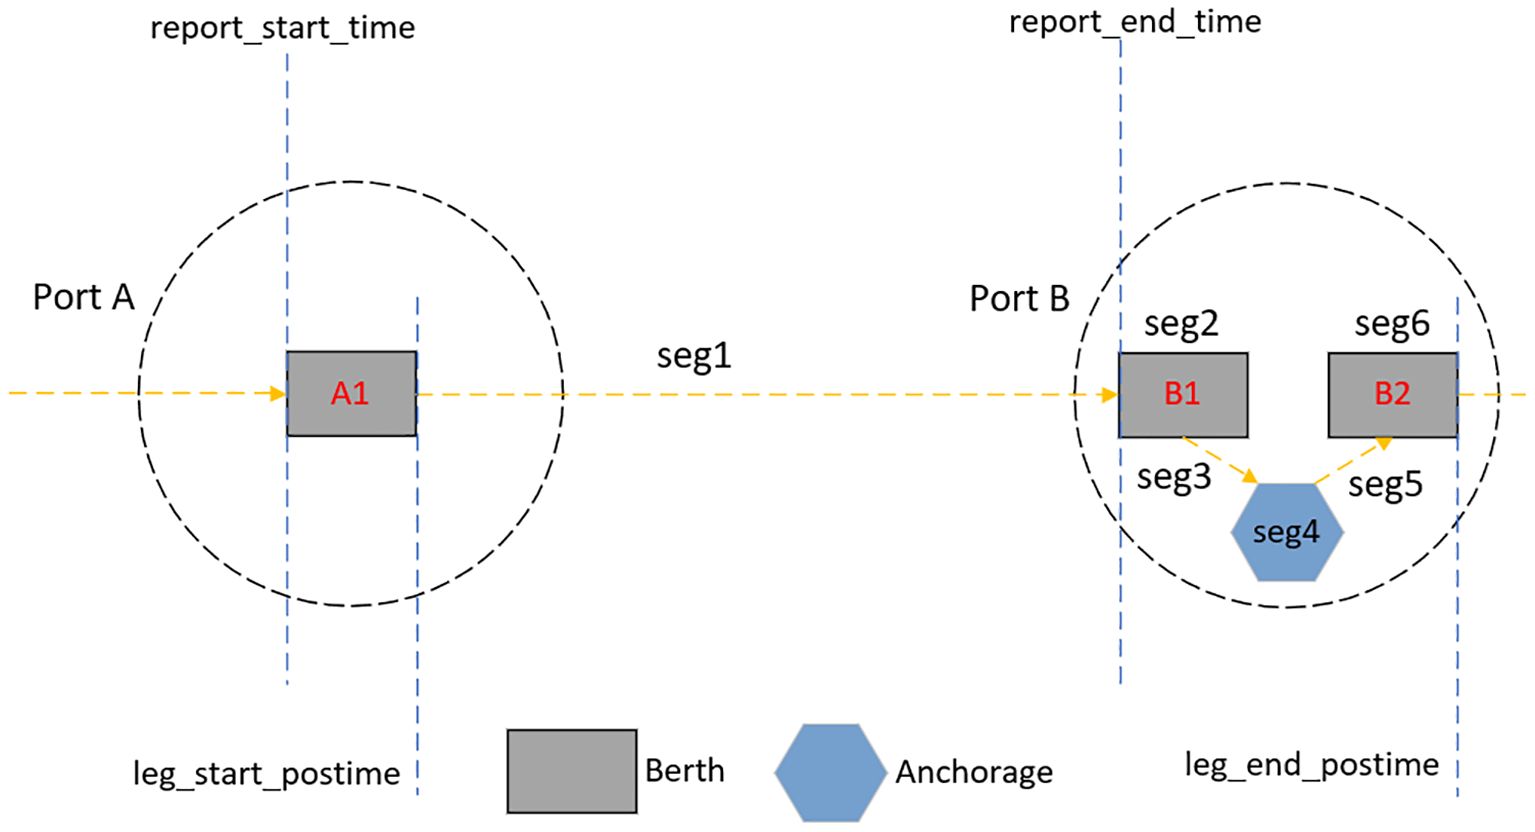
Figure 3. Defining relationships for the time dimension in different data sources.
As illustrated in the figure above, the inbound and outbound port data record the ship’s voyage time in the port arrival-port arrival format, whereas the segment data record the voyage time in the port departure-port departure format. Consequently, during the data fusion process, the time crossover issue may cause a mismatch between the actual draught and the cargo capacity. The objective of this study is to predict the cargo capacity of the ship in segment 1.
3.1.2 Data cleaning
Given the varying definitions of the time dimension across multi-source data, crossover issues may arise when fusing these data based on the time dimension. Specifically, the data information from the previous segment may be erroneously attributed to the next segment, leading to identical cargo capacity information for both segments while the actual draught remains associated with the original segment. This disrupts the reasonable positive correlation between draught characteristics which are crucial information and cargo capacity, thereby undermining the predictive power of the model. Moreover, the cargo capacity data in the inbound and outbound records are manually entered, introducing a degree of inaccuracy. Consequently, the fused datasets require preprocessing to enhance data quality.
(1) Classification of cargo type data
To establish predictive models for ships carrying different types of cargo, we first address the issue that the ship segment data lack information on cargo types, with specific descriptions of loaded cargo types only available in the inbound and outbound port data.
Additionally, considering that the liquid (capacity of liquid tanks) field in the data of ships transporting crude oil is not empty, we take measures to avoid omissions. Specifically, we identify all non-empty data in the liquid field. Furthermore, data that are not classified as crude oil through the initial mapping relationship (based on mmsi query) are also categorized as crude oil.
(2) Correct draught and cargo capacity data
Theoretically, there is a positive correlation between the draught depth of a ship and the weight of the cargo it carries. Therefore, we first plot the distribution of draught versus cargo capacity for each type of ship to determine whether anomaly handling is necessary (Figure 4).
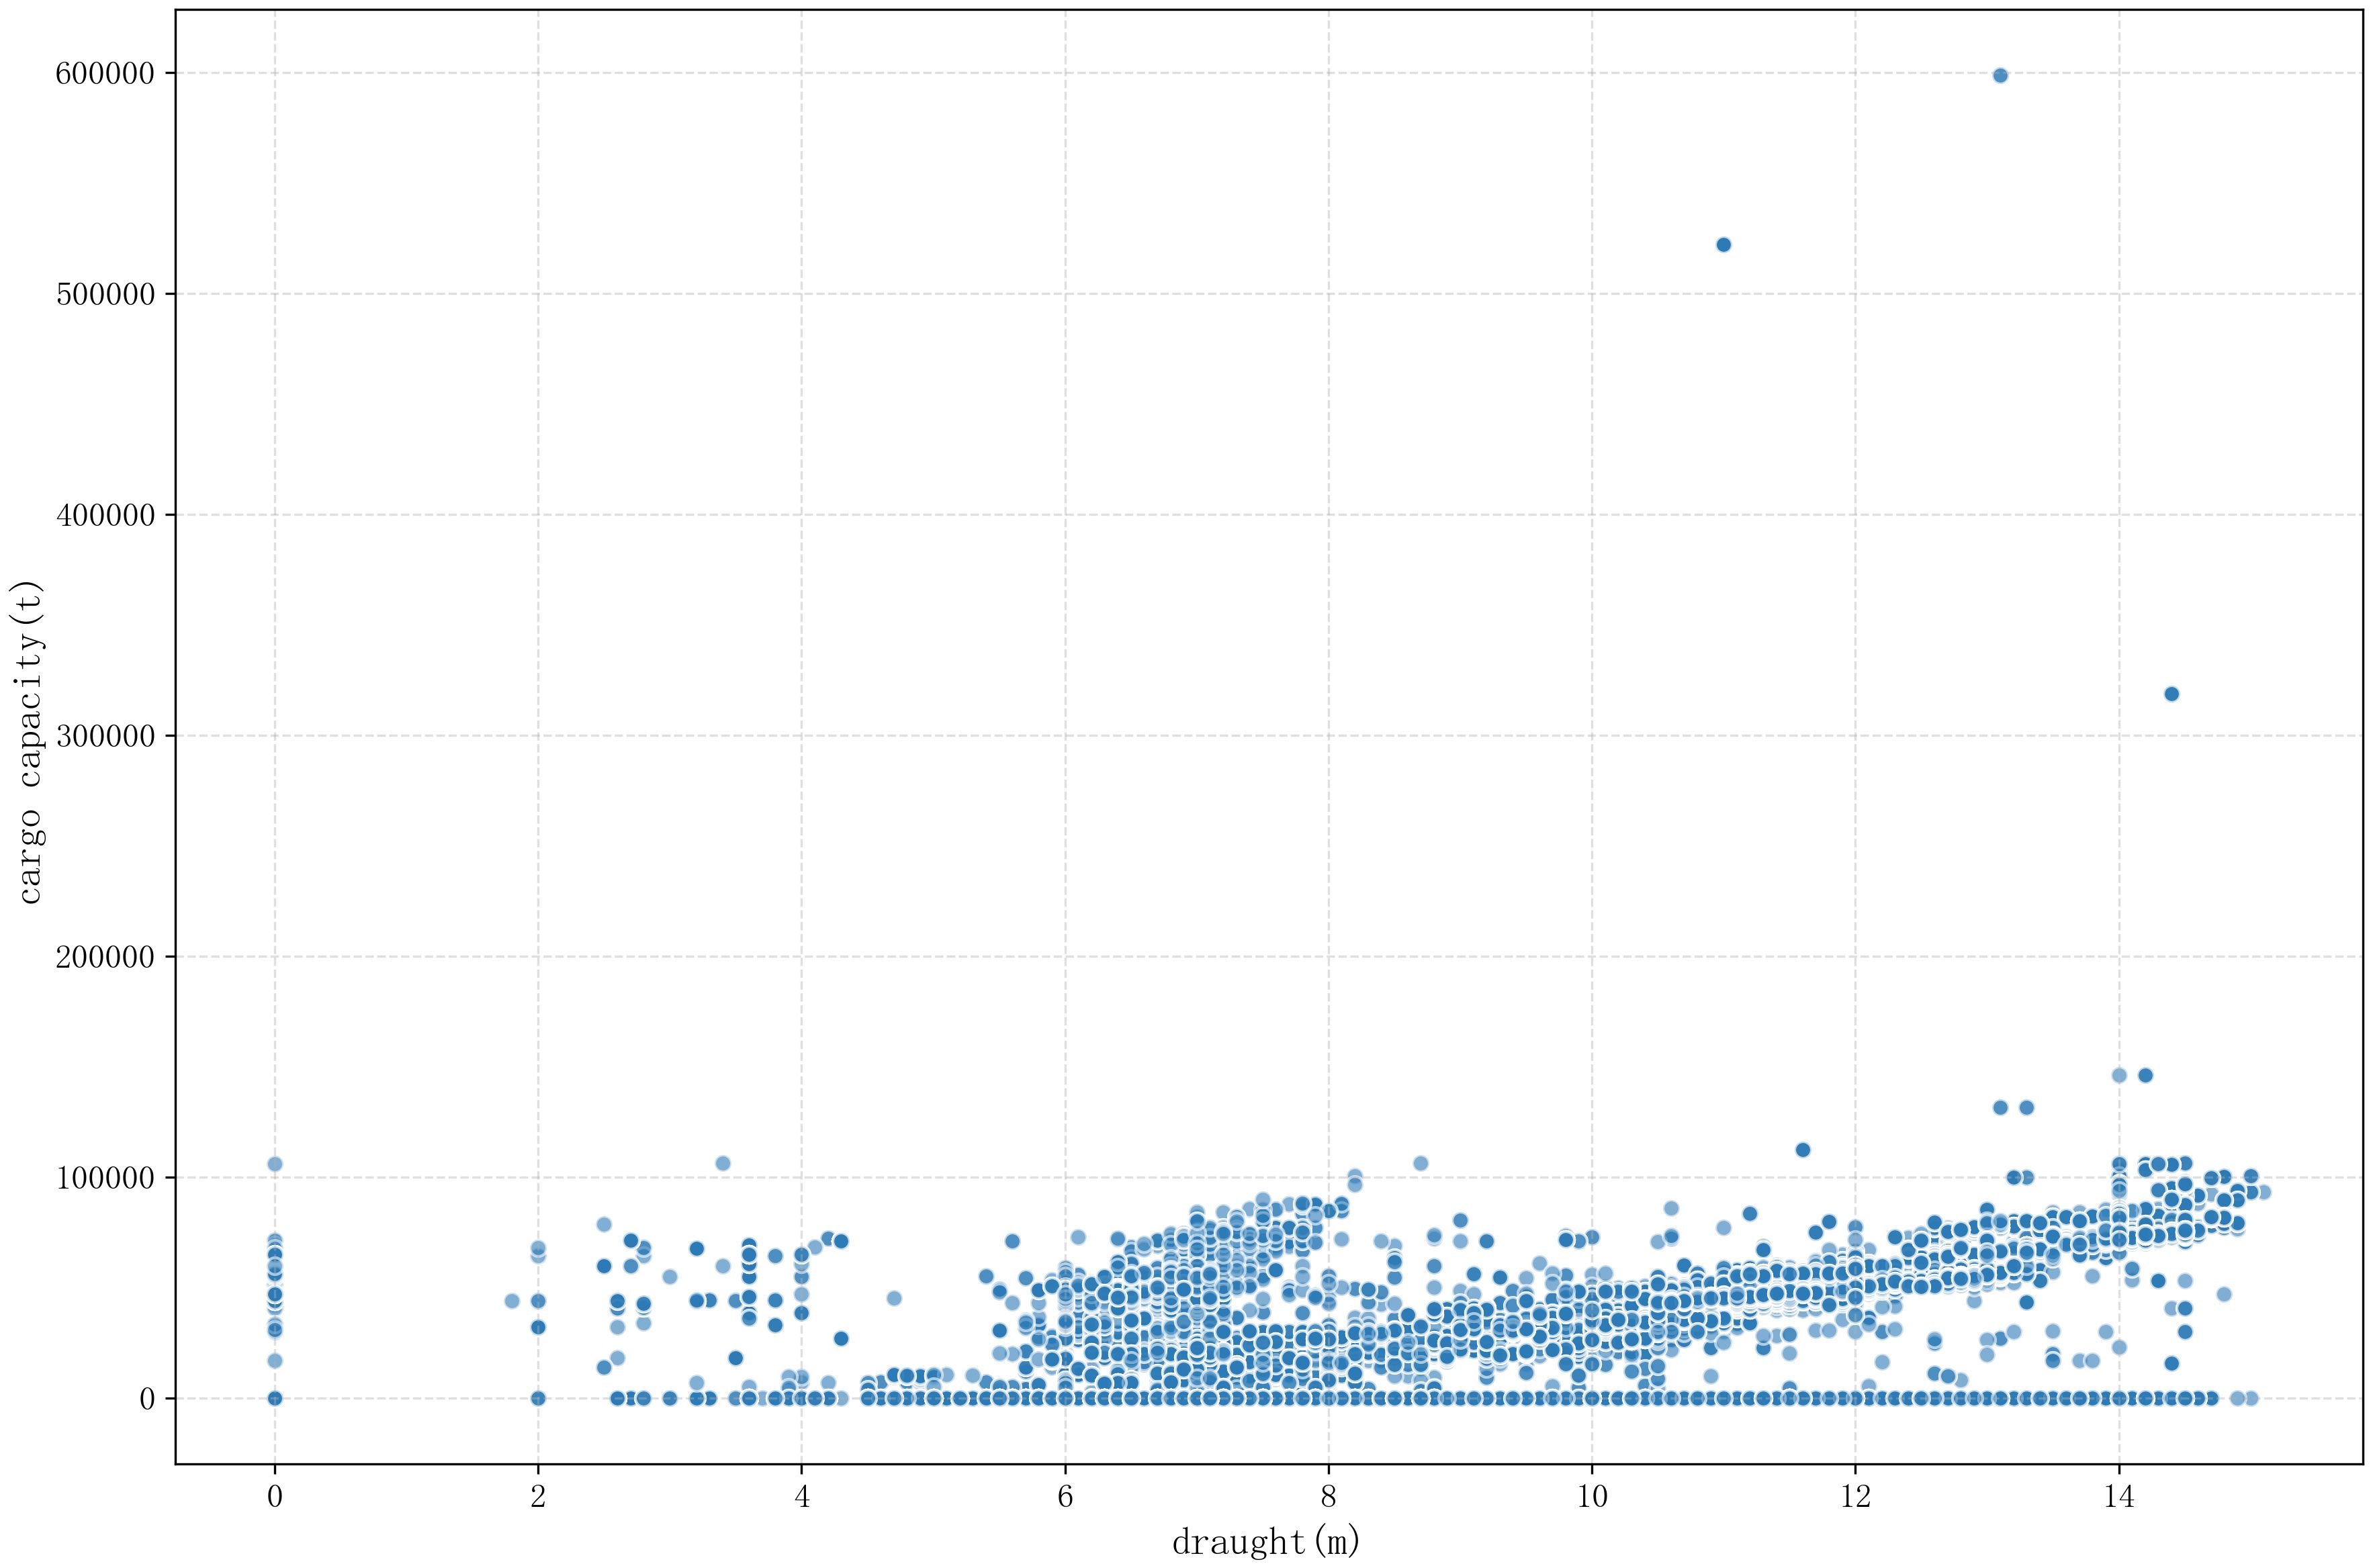
Figure 4. Distribution of draught and cargo capacity data before correction.
As illustrated in the figure above, ships carrying different types of cargo exhibit varying degrees of abnormal scattered points that affect the positive correlation between draught and cargo capacity, potentially impacting the model. By examining the original dataset, we identified the overall issue and its corresponding solution as follows:
(a) For segment information with a dynamic_type of 5, it indicates that loading and unloading occurred, but the start_draught and end_draught remained unchanged.
To address the existing draught issue, we extract data with a dynamic_type of 5 from the complete fusion dataset, treating each data point as the beginning of a voyage. Based on this, if a loading or unloading state occurs without a change in draught, we traverse the next adjacent segment row by row to locate the data where the draught value (start_draught) begins to change and replace it accordingly.
(b) For cases where the cargo capacity is empty, but the draught data is abnormally indicating that the draught deviates significantly from the expected value for an empty ship. According to the IMO report, which specifies the minimum no-load draught for ships. This minimum no-load draught is used as the reference draught when the cargo capacity is zero.
The specific calculation method is as follows, shown in Equation 1.
Where represents the minimum no-load draught and represents the length of the ship.
To solve this problem, the specific solution is as follows:
Step 1: Query all the data in the dataset with a cargo capacity of 0.
Step 2: Calculate the absolute deviation a between the actual draught and the minimum no-load draught, and based on empirical observations take 5% of the ship’s designed draught as the allowable draught deviation b.
Step 3: Compare the magnitudes of a and b. If a is greater than b, it indicates that the actual draught in the no-load data exceeds the maximum allowable no-load draught of the corresponding ship. Generate a random number from the interval [minimum no-load draught, minimum no-load draught + b] to replace the actual draught (set the random seed to 42), with the aim of allowing the model to maintain good generalization performance when learning rule of the no-load data.
Step 4: Compare the sizes of a and b. If a is less than or equal to b, it indicates that the actual draught in the empty data is within the range of the maximum allowable empty draught of the corresponding ship, the original actual draught value will be returned.
(c) Abnormal cargo capacity problem:
Problem 1: According to the actual draught, theoretically the ship is empty, but the actual data is not. It should be corrected to 0.
Problem 2: According to the actual draught, the ship is theoretically not empty, but in the actual data, group by mmsi, there is no positive correlation between the actual data and the draught.
In the context of the above two problems, the specific solutions are as follows:
Step 1: Calculate the absolute deviation c between the actual draught and the minimum no-load draught.
Step 2: Compare the magnitudes of c and b. If c is less than or equal to b, it indicates that the actual draught is relatively close to the minimum no-load draught. In this case, the download cargo capacity is likely to be 0, so the cargo capacity is corrected to 0.
Step 3: If c is greater than b, it indicates that the actual draught is not close to the minimum no-load draught. In this case, the ship is likely to be not empty, so further processing will be carried out. First, calculate the expected cargo capacity based on the following formula, manifested in Equation 2
Step 4: Calculate the percentage deviation between the expected cargo capacity and the actual cargo capacity by the following formula, displayed in shown in Equation 3.
Step 5: If realcargo_error is greater than 5%, replace the expected cargo capacity with the actual cargo capacity; otherwise, return the actual cargo capacity.
After correcting some of the draught and cargo capacity data, there is a good positive correlation between the draught and load of each cargo type, which is beneficial for improving the training performance of the subsequent model, as shown in (Figure 5).
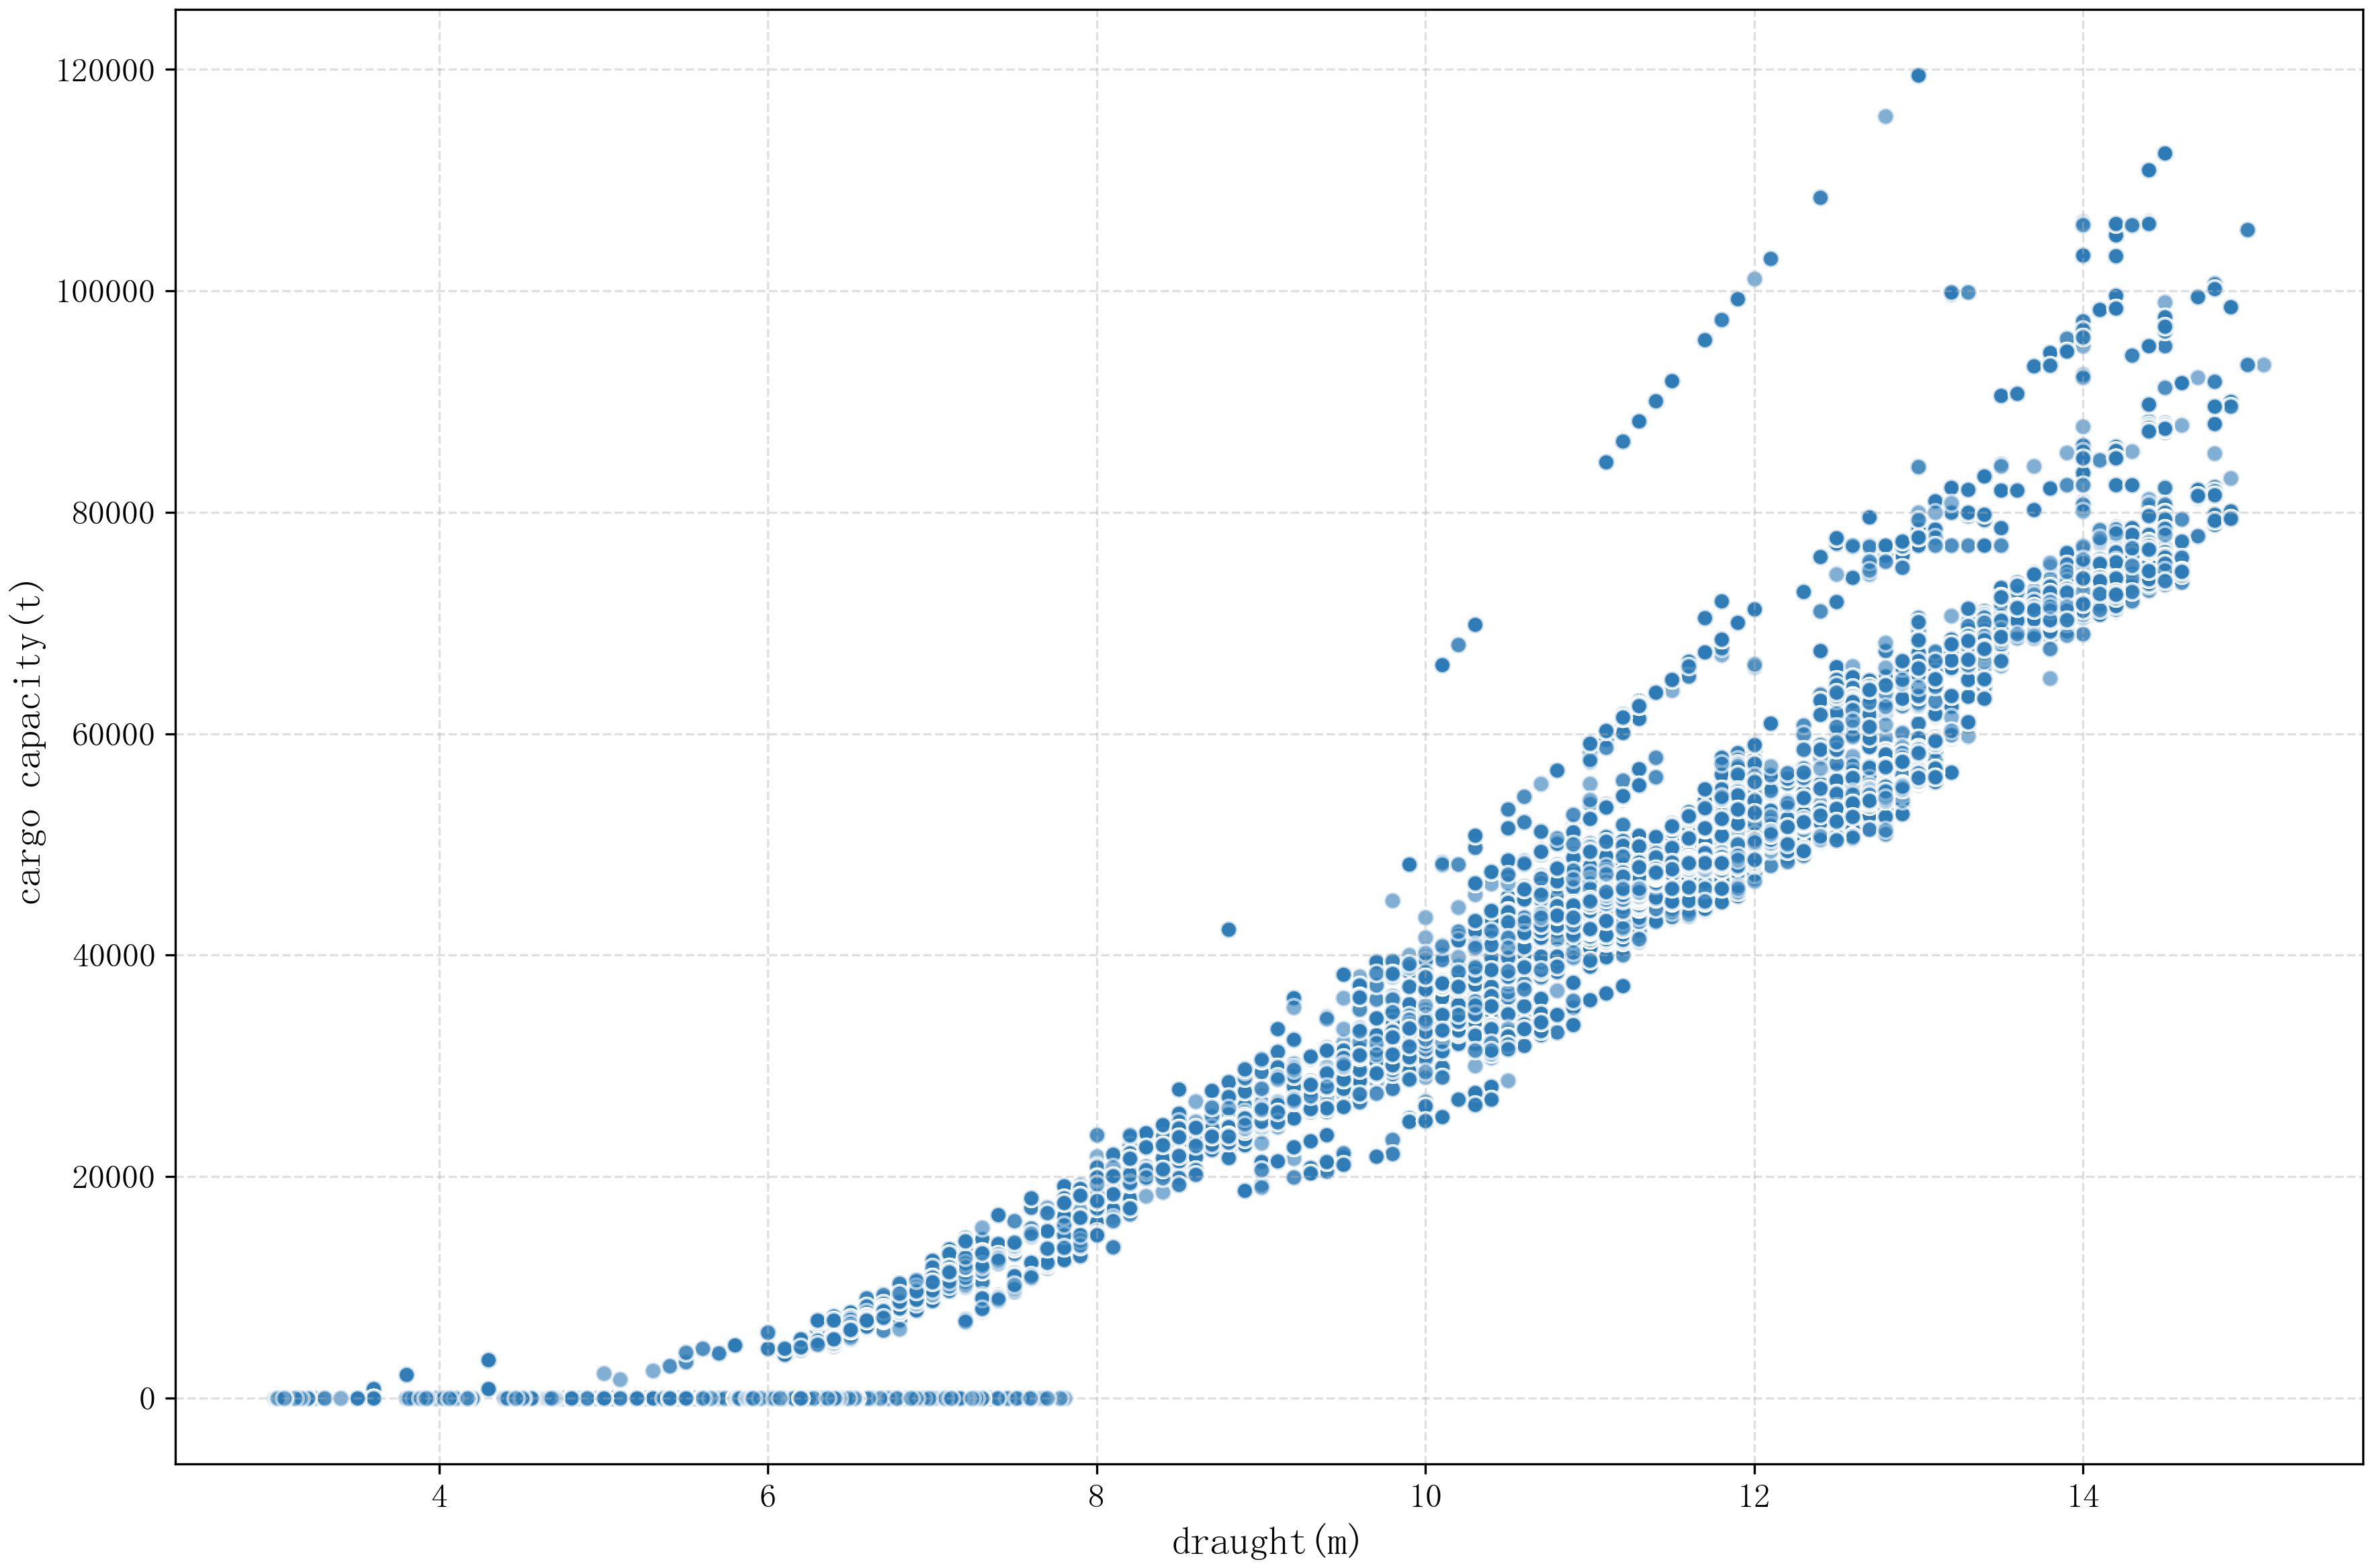
Figure 5. Distribution of draft and cargo capacity data after correction.
(3) Anomalous data processing
After the previous related processing, to ensure that the draught and cargo capacity data remain logically accurate and positively correlated, the draught and cargo capacity anomalies are identified based on scatter plots and ship structure theory as follows:
The above diagram (Figure 6) shows the relationship between a ship’s cargo capacity and draught, with the X-axis representing draught and the Y-axis representing cargo capacity. Point A represents the ship’s designed draught and maximum deadweight (DWT), point B and point C have draughts of 90% and 110% of the designed draught, point D represents the minimum no-load draught according to the ship’s safety design requirements, and point E represents the upper limit of no-load draught. It can be expressed as .
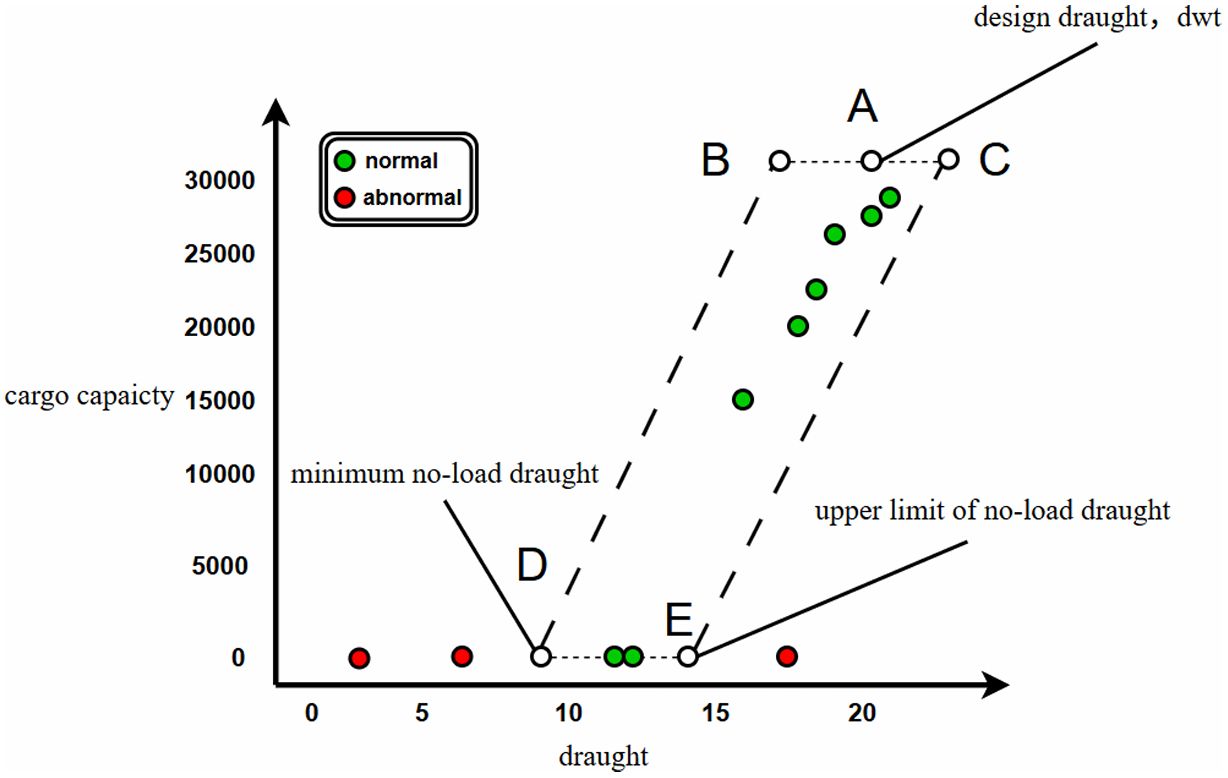
Figure 6. A example of the theoretical relationship between the cargo capacity and draught.
According to IMO requirements, the basic requirements for draught of no-load ship: For ships with a length of no more than 150 m, when sailing with no-load, the draught at the front of the smallest boat should be greater than or equal to , and the draught in the middle of the smallest boat should be greater than or equal to ; For ships longer than 150 meters, when sailing empty, the draught at the front of the smallest boat is greater than or equal to , and the draught in the middle of the smallest boat is greater than or equal to . Any point within the B, C, D, E quadrilateral above is a normal point, while any point outside of it is an abnormal point. The following figure shows the results of anomaly detection for the complete data (Figure 7):
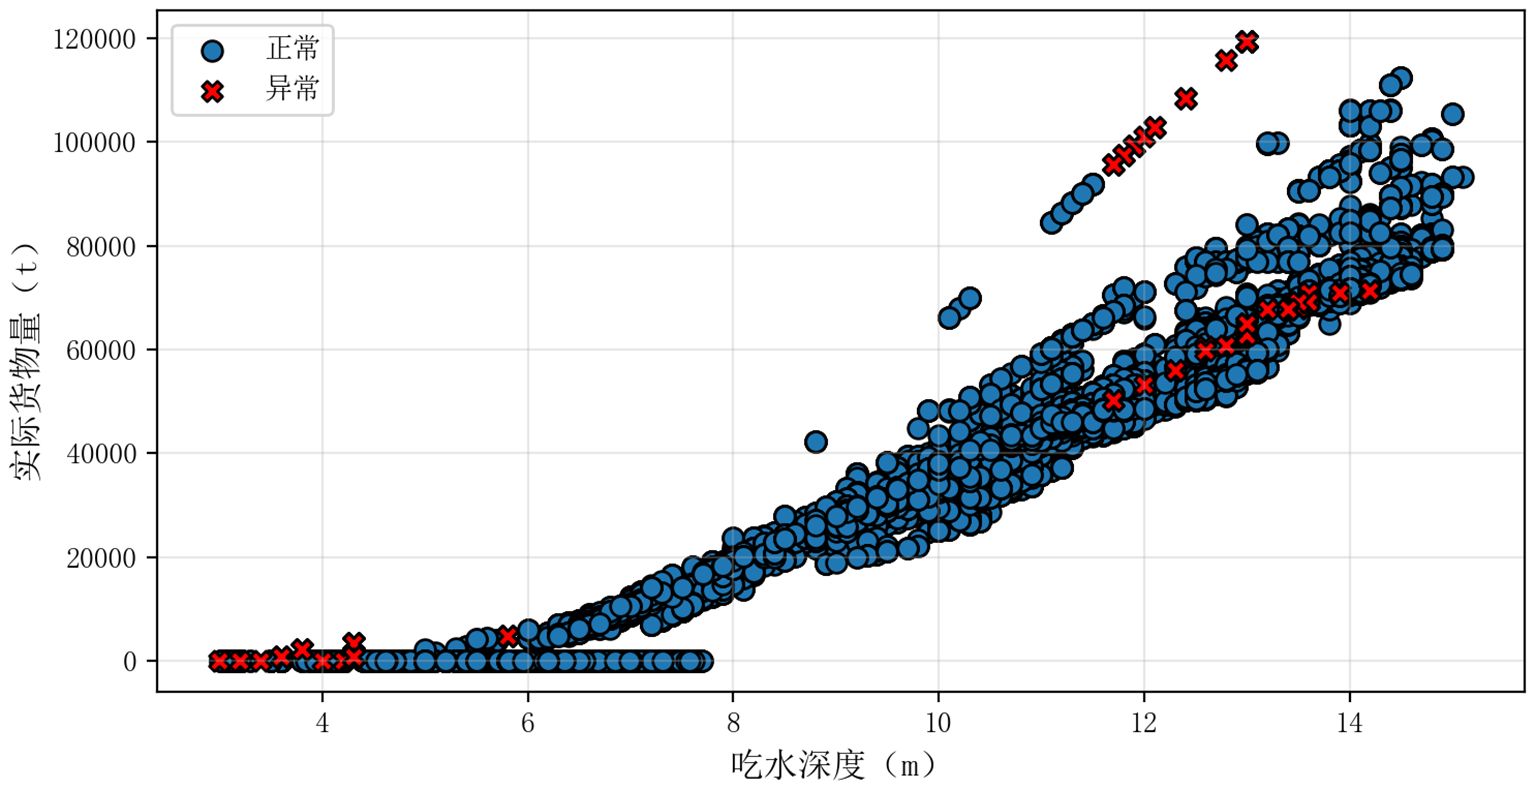
Figure 7. Process of anomalous data.
(4) Missing value processing
Before training the model, it is essential to assess the presence of missing key information. Upon statistical analysis, we found that the column for TPCI (Tons Per Centimeter Immersion) contained missing data. Since TPCI represents the change in deadweight tonnage (t) for a one centimeter (cm) change in the ship’s draught, it is a static characteristic of the ship that can reflect its size and, to some extent, determine the possible cargo capacity. Therefore, we decided to impute this feature. In this study, we employed Random Forest, Gradient Boosting Decision Tree, and XGBoost for this purpose.
The selected feature input as follows:
With maximizing and minimizing as the main evaluation criteria, select the model with the highest fit, and finally select the Random Forest model. The formulas for and are as follows, shown in Equations 4, 5.
where represents the predicted value of the model, represents the actual value of the cargo capacity, represents the average value of the cargo capacity, nrepresents the size of sample.
The distribution of the padded TPCI data is as follows (The red part is the padded data, and the blue part is the original data), as manifested in (Figure 8):
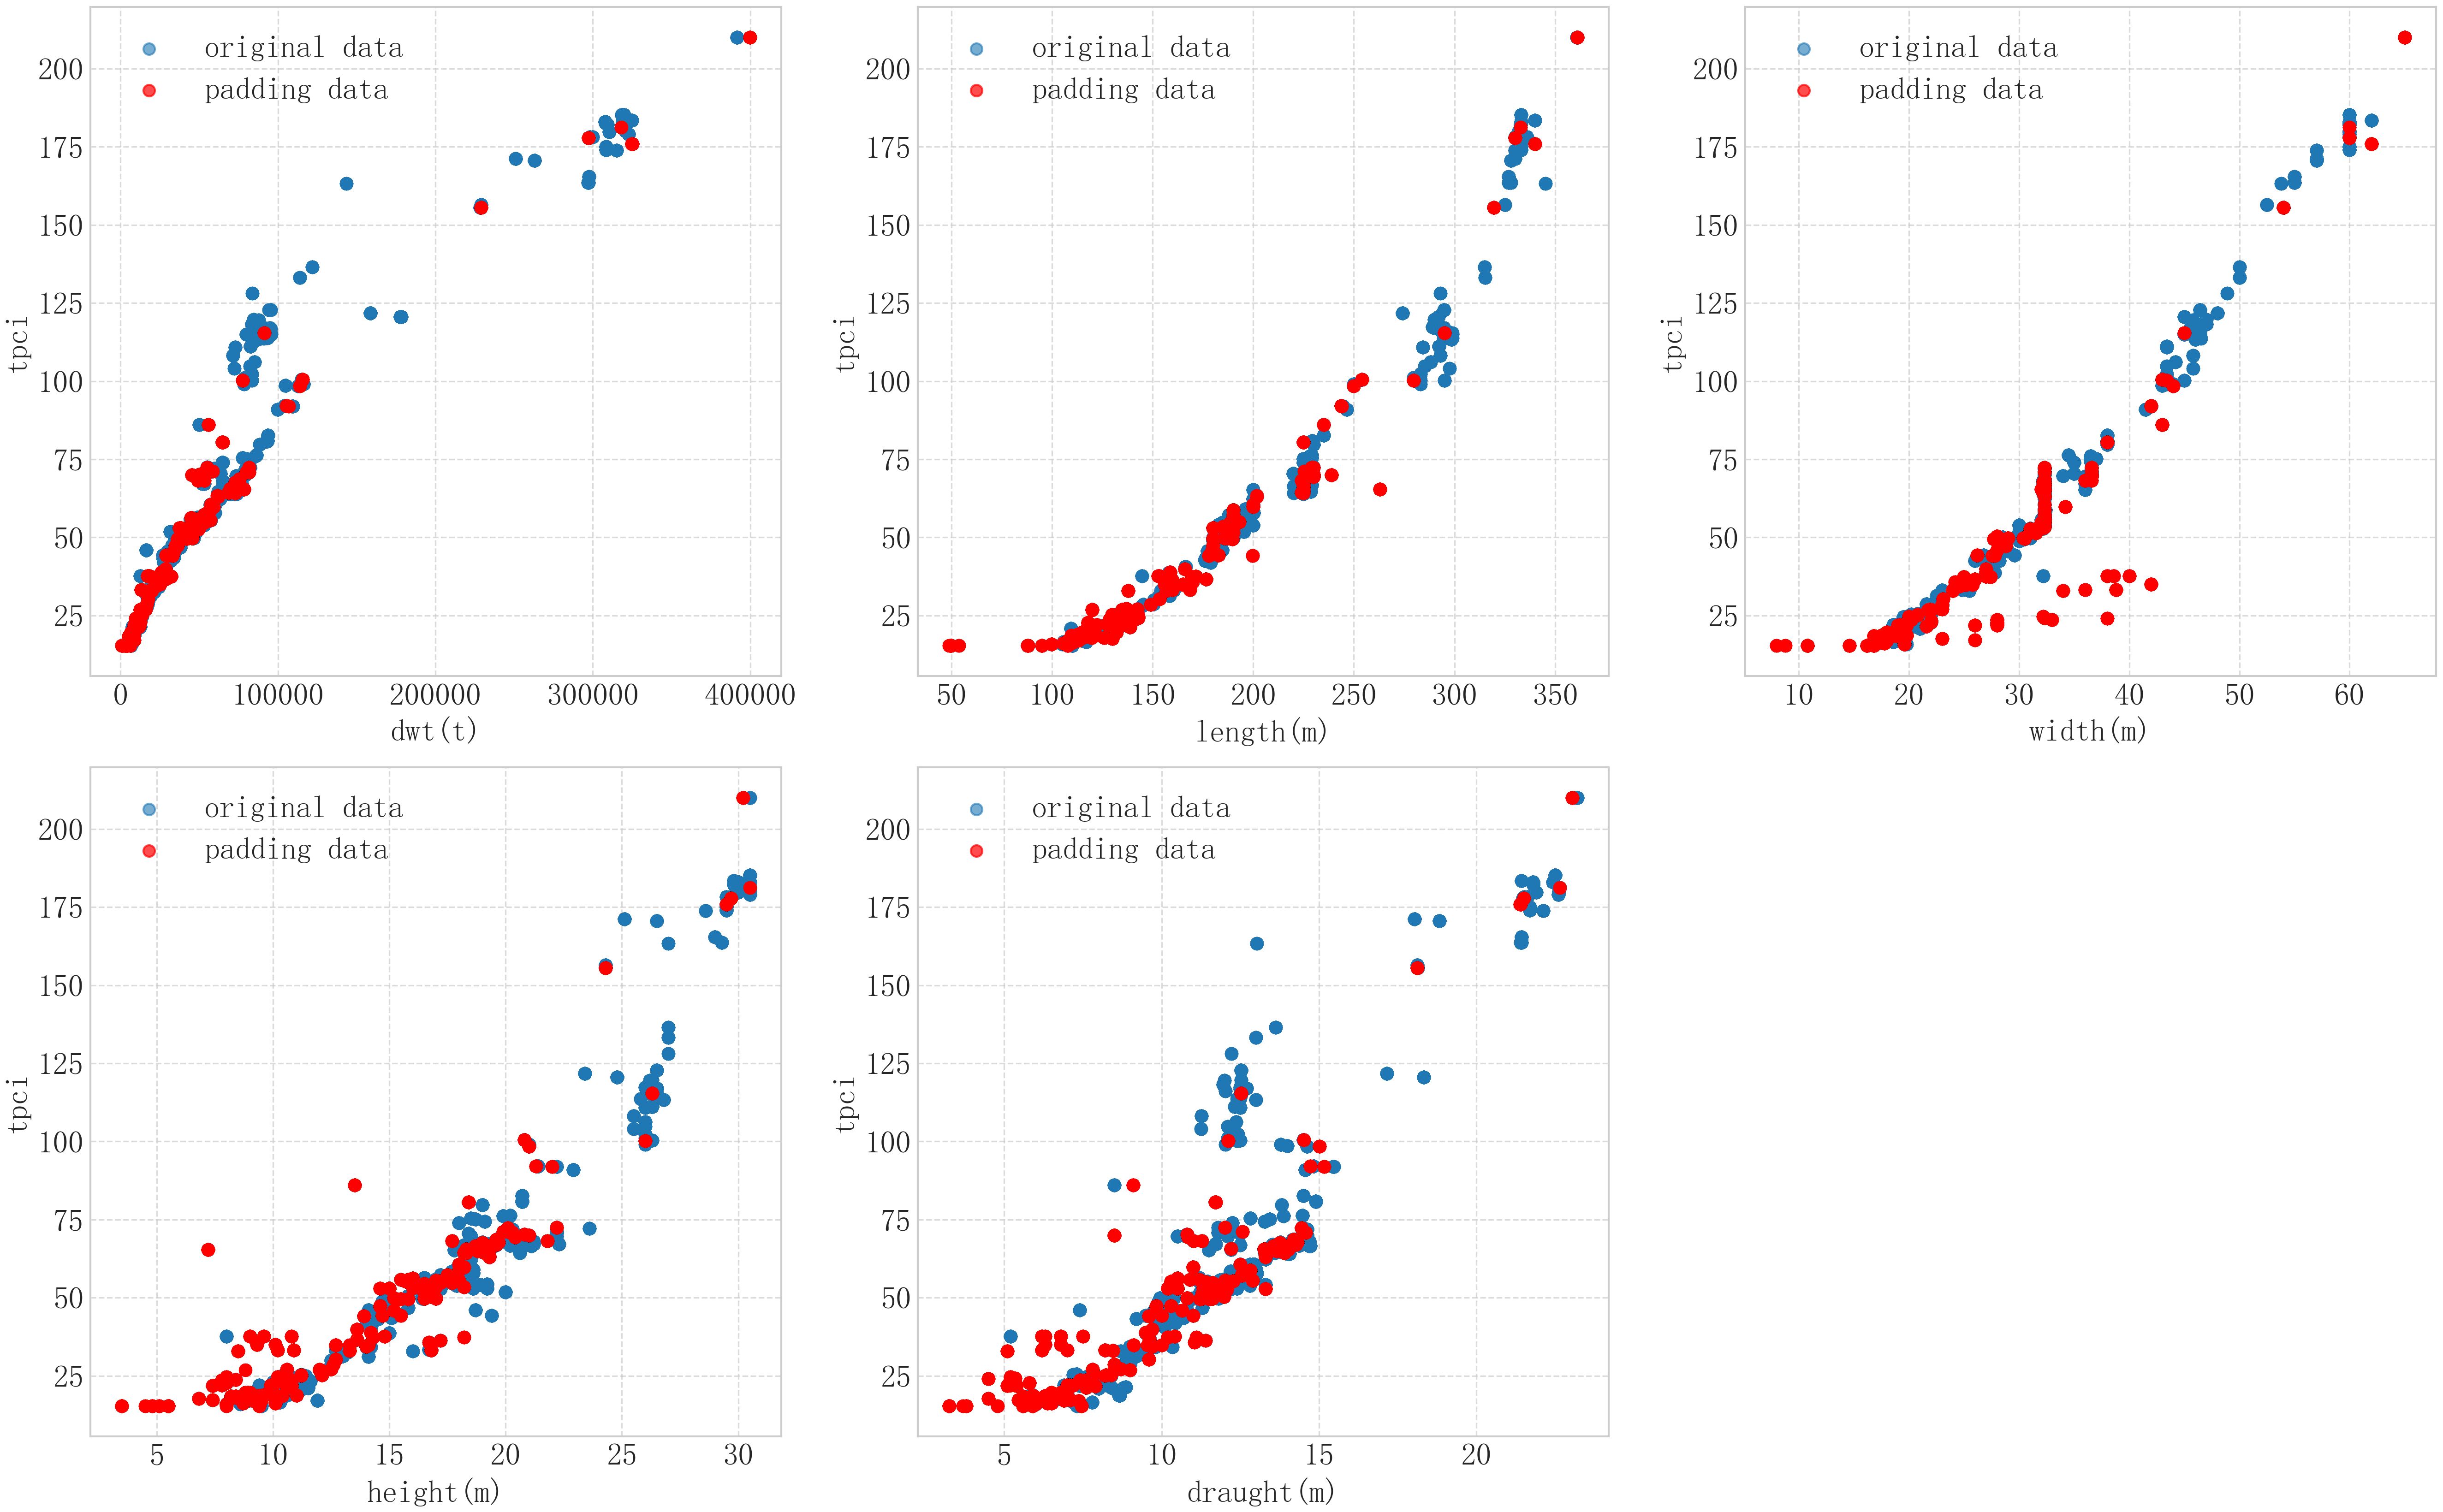
Figure 8. Distribution of TPCI data after filling with different features based on the RF model.
3.2 Methodology
Based on the previously preprocessed dataset, this paper estimates the cargo capacity of the target ships using both the calculation method based on the IMO report and the data-driven method based on machine learning. Considering the size of the ship and the scale of the data, to facilitate a unified evaluation of model performance, the following metrics were adopted in this study, shown in Equations 6–8.
where for samples with non-zero cargo capacity, is used to evaluate model; for samples with zero cargo capacity is used to evaluate model, for all samples, is used to evaluate model.
3.2.1 Estimating ship cargo capacity with traditional empirical formulas
According to the IMO report in 2020 (MEPC, 2020), based on the stability performance of the ship under various operating conditions and its cargo capacity, the cargo capacity of the ship is estimated. The calculation method of the cargo capacity () is as follows, shown in Equation 9.
where represents the variable mass under different operating and navigation conditions, represents the mass of ballast, represents the mass of fuel carried by ship. The steps to calculate relevant parameters are as follows:
Step 1 Calculate the balance of the ship's mass and buoyancy, displayed in Equation 10.
where represents the total mass of the ship; represents the density of seawater, taken as 1.025 tons per cubic meter; represents the capacitytric displacement of the ship. The total mass of the ship can also be expressed as the sum of the ship’s light weight tonnage() and its variable mass, displayed in Equation 11 ():
Step 2 Calculate the capacitytric displacement of the ship, displayed in Equation 12.
where represents the instantaneous square coefficient (the ratio of the capacity of water drained by the ship at a particular draught to the waterline area of the hull, used to assess the stability of the ship under different loading conditions); L represents the length of the ship; B represents the width of the ship, represents the instantaneous draught. The formula for calculating is as follows, displayed in Equation 13.
where represents the design square coefficient (the ratio of the drainage capacity of the ship at the design draught depth to the waterline area of the hull), represents the design draught. The formula for calculating is as follows, manifested in Equation 14.
where represents the arctangent function, the formula for calculating Fn, displayed in Equation 15. :
where represents the designed speed of the ship, in knots.
Step 3 Calculate , for the general type of ship, assume to estimate in the design state (=DWT), the calculation formula is as follows, displayed in Equation 16.
where represents the maximum deadweight tonnage.
Step 4 Calculate , displayed in Equation 17.
For , it is necessary to look up the specific coefficients within different DWT intervals based on the ballast coefficient table in the report.
Step 5 Calculate , displayed in Equations 18, 19.
Based on the calculation results in the report, take the coefficient as the median of 0.053.
Step 6 Calculate , displayed in Equation 20:
3.2.2 Estimating ship cargo capacity with machine learning models
Generally, a vessel’s cargo-carrying capacity (tonnage) is directly proportional to its size. Therefore, key parameters such as deadweight tonnage (DWT), length, beam, designed draft, and tonnage-per-centimeter immersion (TPCI) can serve as primary indicators for determining vessel scale. These metrics typically exhibit positive correlations with cargo capacity - larger vessels generally possess greater cargo-carrying capabilities across different ship types.
For dynamic assessment of cargo load on a specific vessel, real-time variables must be considered. The draft measurement serves as a reliable dynamic indicator, where increased draft depth directly corresponds to greater actual cargo loading. This relationship holds particularly for individual vessels during operation, with deeper drafts consistently indicating higher cargo quantities aboard. Therefore, the features and outputs for this study are determined as follows:
This paper employed several machine learning models to train and test the cargo capacity of ships, including K-Nearest Neighbors (KNN), Decision Tree, Random Forest, XGBoost, Gradient Boosting Decision Tree (GBDT), and Extra Trees.
To ensure an accurate evaluation of the model’s generalization performance, we employed GroupKFold (group cross-validation) based on mmsi grouping before training the model. Unlike conventional cross-validation, this method assigns all data from the same ship to either the training set or the validation set. This approach effectively prevents data leakage, as the static feature data of the same ship remains unchanged. The number of folds for cross-validation is set as follows: min(num_group, 10), which is the smaller value between the number of ship groups and 10, with a maximum of no more than 10 folds. The specific model training and test evaluation results will be statistically calculated based on the average of the group cross-validation iterations (CV). Considering the potential impact of different data standardization methods on the model, the input features and output cargo capacity will be processed using three methods: unprocessed, normalized, and logarithmic. Appropriate inverse processing will be conducted before calculating the evaluation indicators to ensure that the data are statistically calculated at the original scale. On this basis, recognizing that the entire voyage segment contains more repetitive information (since each ship has multiple voyage data and static feature information is repetitive), we conducted an additional test on the berthing operation segment (seg5) to determine whether the model’s accuracy could be further improved.
4 Results and discussion
Based on the two evaluation methods mentioned above, this study utilized 2023 data for model training and evaluation, and combined 2024 ship data for validation. The hyperparameters of the machine learning models employed in this study are specified as follows, as shown in (Table 2).
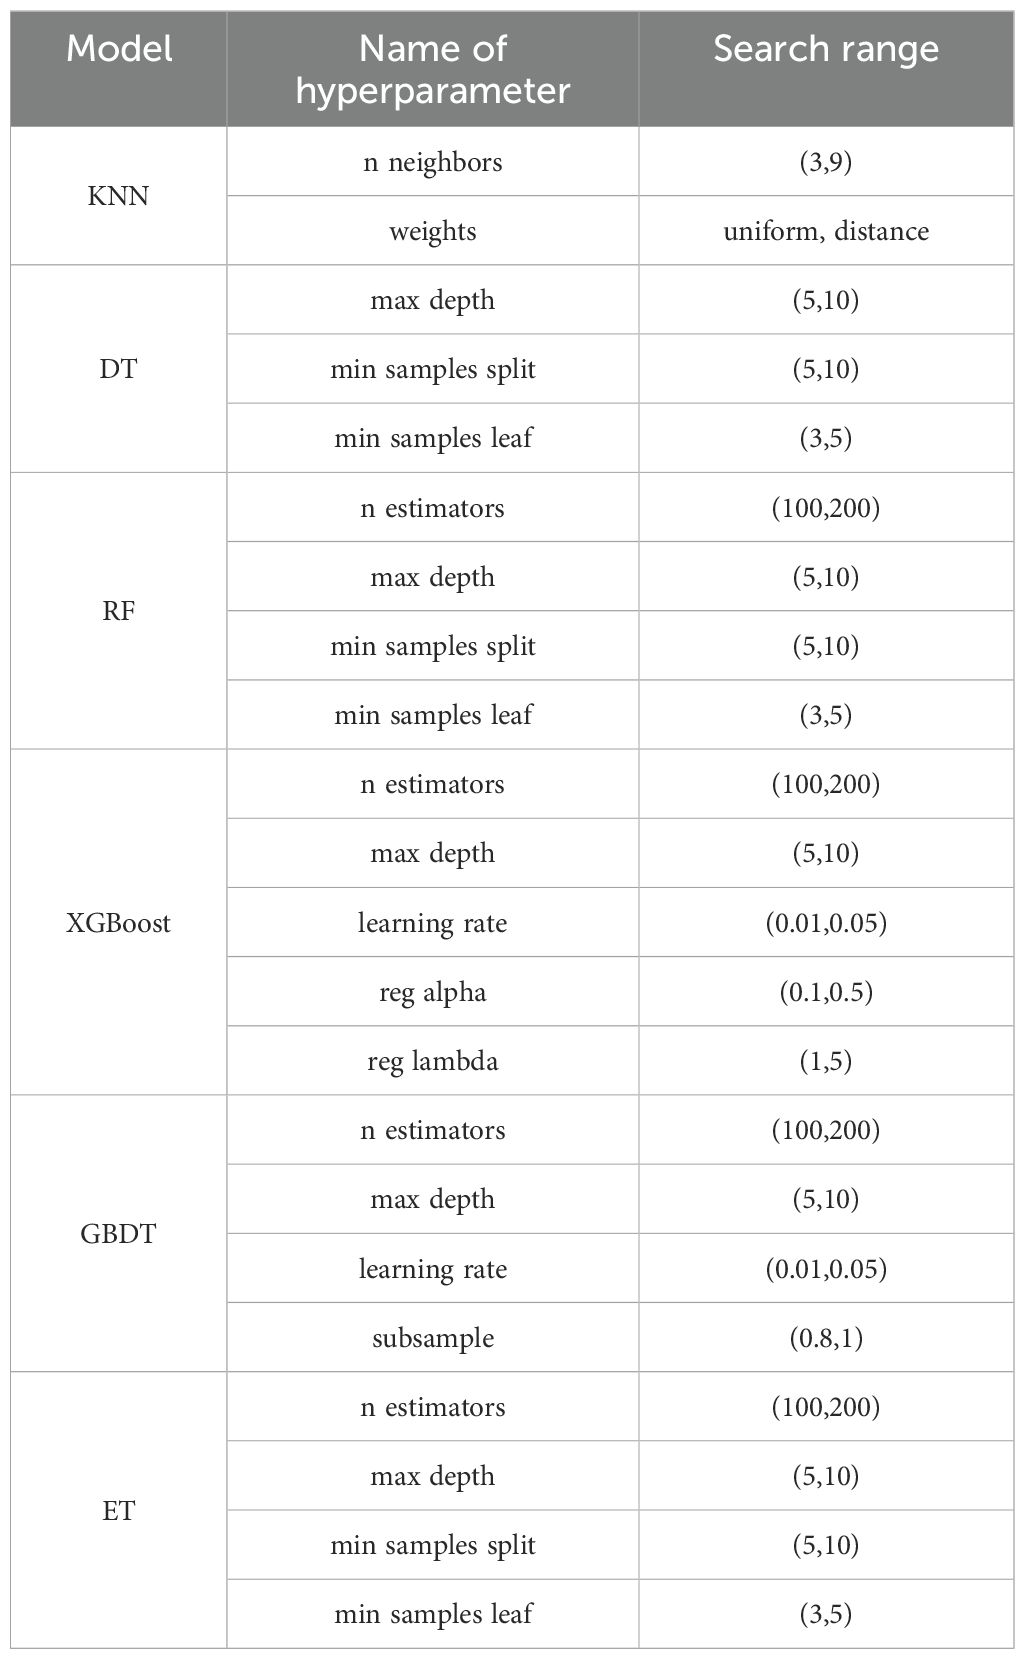
Table 2. The hyperparameter optimization search range of different machine learning models.
The accuracy of cargo load estimation using different methods on the training dataset is shown as follows:
As can be seen from the table above (Table 3), based on the data of all segments, KNN model performed best. Furthermore, compared with other data preprocessing methods, logarithmic enables models to exhibit lower errors on no-load samples.
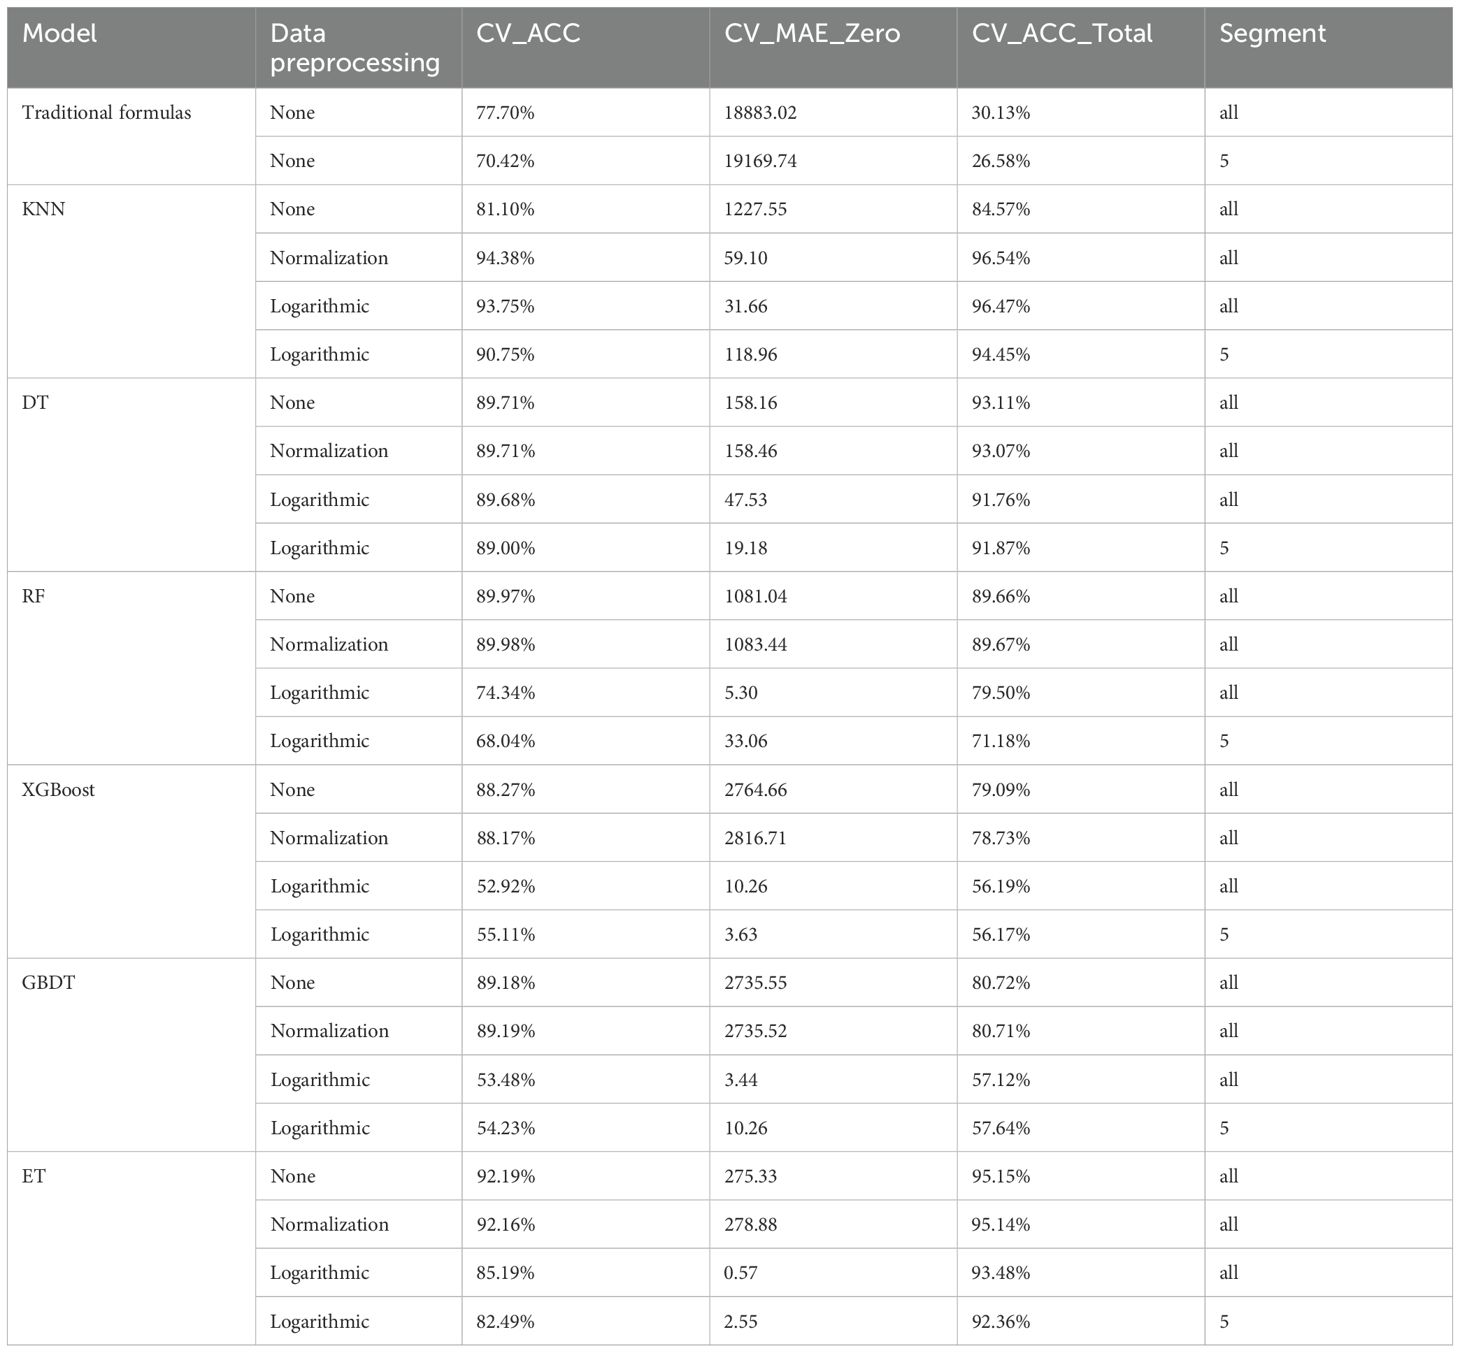
Table 3. Cross-validation evaluation results of each model group after different data preprocessing.
For the 2024 ship data, in terms of data preprocessing, considering the absence of cargo data when making actual cargo predictions, only the TPCI filling method used during the training set processing (selecting the model with TPCI filled in the training set) was applied.
As shown in the table above (Table 4), on the training set, the overall accuracy of cargo capacity prediction based on the KNN model is superior to that of the traditional empirical formula estimation method.
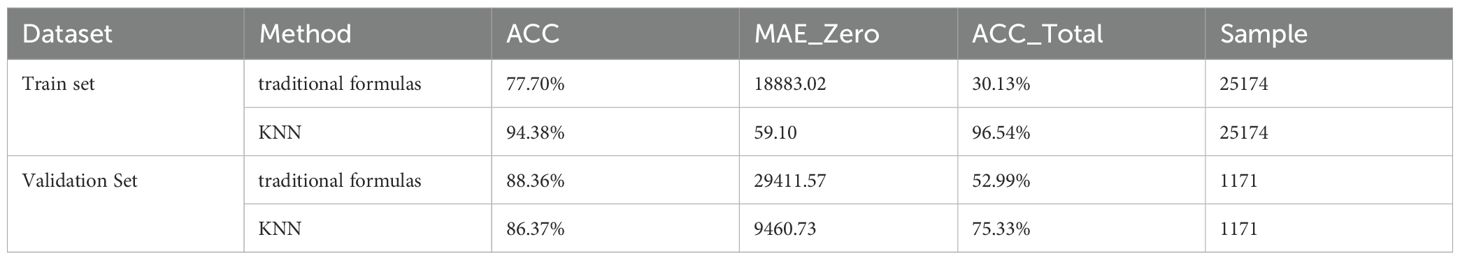
Table 4. Comparison of traditional formulas with KNN predictions in training and test sets.
On the validation set, the KNN model exhibits lower accuracy than the traditional formula when applied to non-zero cargo capacity samples. This discrepancy arises due to anomalies in the draft and cargo volume data within the validation set. For example, some records contain draft values from the previous port, which—if loading/unloading operations occurred there—fail to correlate positively with the current cargo volume. Consequently, when the actual draft is large (indicating an empty ship), the model produces significant errors.
The KNN model still achieves higher accuracy than the conventional empirical formula estimation method on samples with an actual value of 0 and overall. Additionally, the KNN model exhibits no significant difference in accuracy for non-zero samples between the training and validation sets, indicating that the model is not overfitted. The abnormal data in the validation set, however, leads to a notable difference in bias for zero cargo samples and overall accuracy.
5 Conclusion
This paper takes global ships transporting ore as an example. By integrating inbound and outbound port data, ship segment data, ship archive data, port and berth archive data, and combining business logic in the shipping field with relevant experience in statistical data analysis, we applied preprocessing methods such as cargo type matching, abnormal data correction and identification, and filling in missing values of static ship characteristics to the fused data. This process further improved the data quality and mitigated the impact of manual reporting errors and abnormal data on the model. The main conclusions from the model evaluation are as follows:
1. Model evaluation based on different data preprocessing methods shows that when logarithmic processing is applied, the mean absolute error of different models in predicting no-load data information is significantly reduced.
2. KNN, DT, RF, XGBoost, GBDT, and ET models were employed for model training, evaluation, and comparative analysis. Results demonstrated that the KNN model exhibited superior predictive accuracy for ore cargo capacity across diverse operational scenarios, achieving a peak accuracy of 96.54%.
3. Comparative analysis revealed that the KNN model achieved significantly higher prediction accuracy than conventional empirical formulas across both training and validation datasets. While model performance on the validation set showed a 22.34 percentage point reduction compared to training results (attributable to anomalous data instances), the KNN approach maintained superior accuracy, outperforming traditional empirical estimation methods by 22.34 percentage points overall.
The main limitation of this paper is that the validation set also exhibits anomalies, such as a negative correlation between draught and cargo capacity. This issue, to some extent, prevents the model’s prediction accuracy on the validation set from fully reflecting its generalization performance. Moreover, due to differing definitions of the time dimension in vessel port entry and exit data as well as vessel leg data, data fusion based on the time dimension may result in mismatches between draught and cargo capacity, leading to further anomalies.
This study’s methodology and results provide a scalable template for data-driven decision-making in bulk shipping. Future research could focus on collecting higher-quality AIS data for model training and validation and exploring more effective data-cleaning methods. Additionally, experimenting with more advanced deep learning models or improved machine learning models could further enhance the accuracy of ship cargo capacity prediction.
Data availability statement
The datasets presented in this article are not readily available because The data are the private property of COSCO SHIPPING Technology CO.,Ltd. Requests to access the datasets should be directed to Y2hlbi5zaHVoYW5nQGNvc2Nvc2hpcHBpbmcuY29t.
Author contributions
SC: Data curation, Methodology, Validation, Conceptualization, Supervision, Writing – review & editing, Project administration, Funding acquisition, Software. ZW: Methodology, Writing – review & editing, Supervision, Project administration, Conceptualization, Investigation, Resources. TL: Conceptualization, Methodology, Validation, Writing – original draft, Formal Analysis, Software, Visualization. JZ: Software, Visualization, Conceptualization, Validation, Writing – review & editing, Methodology, Formal Analysis. CZ: Writing – review & editing, Supervision, Project administration, Resources, Methodology, Investigation. XZ: Methodology, Project administration, Resources, Investigation, Supervision, Writing – review & editing. JW: Writing – review & editing, Methodology, Project administration, Supervision. ZS: Conceptualization, Funding acquisition, Methodology, Resources, Supervision, Project administration, Writing – review & editing.
Funding
The author(s) declare that financial support was received for the research and/or publication of this article. This research was founded by the Open research topics of the Key Laboratory of Transport Industry of Big Data Application Technologies for Comprehensive Transport open project, number: 2023B1201.
Conflict of interest
Authors SC and JW were employed by COSCO SHIPPING Technology CO., Ltd.
The remaining authors declare that the research was conducted in the absence of any commercial or financial relationships that could be construed as a potential conflict of interest.
Generative AI statement
The author(s) declare that no Generative AI was used in the creation of this manuscript.
Publisher’s note
All claims expressed in this article are solely those of the authors and do not necessarily represent those of their affiliated organizations, or those of the publisher, the editors and the reviewers. Any product that may be evaluated in this article, or claim that may be made by its manufacturer, is not guaranteed or endorsed by the publisher.
References
Adland R. and Jia H. (2018). Dynamic speed choice in bulk shipping. Maritime Economics Logistics 20, 253–266. doi: 10.1057/s41278-016-0002-3
Adland R., Jia H., and Strandenes S. P. (2017). Are AIS-based trade capacity estimates reliable? The case of crude oil exports. Maritime Policy Manage. 44, 657–665. doi: 10.1080/03088839.2017.1309470
Alizadeh A. H. and Talley W. K. (2011a). Microeconomic determinants of dry bulk shipping freight rates and contract times. Transportation 38, 561–579. doi: 10.1007/s11116-010-9308-7
Alizadeh A. H. and Talley W. K. (2011b). Vessel and voyage determinants of tanker freight rates and contract times. Transport Policy 18, 665–675. doi: 10.1016/j.tranpol.2011.01.001
Cepowski T. (2019). Determination of regression formulas for main tanker dimensions at the preliminary design stage. Ships Offshore Structures 14, 320–330. doi: 10.1080/17445302.2018.1498570
Chen S., Piao L., Zang X., Luo Q., Li J., Yang J., et al. (2023). Analyzing differences of highway lane-changing behavior using vehicle trajectory data. Physica A: Stat. Mechanics its Appl. 624, 128980.
Chen X., Wei C., Xin Z., Zhao J., and Xian J. (2023). Ship detection under low-visibility weather interference via an ensemble generative adversarial network. J. Mar. Sci. Eng. 11, 2065. doi: 10.3390/jmse11112065
Chen X., Wu S., Shi C., Huang Y., Yang Y., Ke R., et al. (2020). Sensing data supported traffic flow prediction via denoising schemes and ANN: A comparison. IEEE Sensors J. 20, 14317–14328. doi: 10.1109/JSEN.7361
Garrido J., Sauri S., Marrero A., Gül Ü., and Rúa C. (2020). Predicting the future capacity and dimensions of container ships. Transportation Res. Rec. 2674, 177–190. doi: 10.1177/0361198120927395
Gurgen S., Altin I., and Ozkok M. (2018). Prediction of main particulars of a chemical tanker at preliminary ship design using artificial neural network. Ships Offshore Structures 13, 459–465. doi: 10.1080/17445302.2018.1425337
Hjelle H. M. (2011). The double load factor problem of Ro-Ro shipping. Maritime Policy Manage. 38, 235–249. doi: 10.1080/03088839.2011.572697
Huang J., Wei W., Peng X., Hu L., and Chen H. (2023). Driver mental load identification model adapting to urban road traffic scenarios. Transportation Saf. Environ. 5, tdac076. doi: 10.1093/tse/tdac076
Jia H., Prakash V., and Smith T. (2019). Estimating vessel payloads in bulk shipping using AIS data. Int. J. Shipping Transport Logistics 11, 25–40. doi: 10.1504/IJSTL.2019.096864
Kristensen H. O. (2012). Determination of regression formulas for main dimensions of tankers and bulk carriers based on IHS fairplay data. Clean Shipping Currents 1.
Li Y., Wu Z., Sun L., and Yue J. (2024). Study on the hierarchical structure of container port systems along the South China Sea in the context of low carbon emissions. Front. Mar. Sci. 11, 1339515. doi: 10.3389/fmars.2024.1339515
Liu X., Qiu L., Fang Y., Wang K., Li Y., and Rodríguez J. (2024). Event-driven based reinforcement learning predictive controller design for three-phase NPC converters using online approximators. IEEE Trans. Power Electronics.
MEPC REDUCTION OF GHG EMISSIONS FROM SHIPS Fourth IMO GHG Study 2020 – Final report Note by the Secretariat. Available online at: https://imoarcticsummit.org/wp-content/uploads/2020/09/MEPC-75-7-15-Fourth-IMO-GHG-Study-2020-Final-report-Secretariat.pdf (Accessed July 2020).
Obeidat M. S., Obeidat R. M., and Dweiri F. (2024). Unravelling the veil of traffic safety: a comprehensive analysis of factors influencing crash frequency across US states. Transportation Saf. Environ. 6, tdae016.
Sandvik E. T. (2005). Environmental impacts of intermodal freight transport. MFM Rep. Molde Møreforsking Molde.
Sun L. and Wang D. (2011). A new rational-based optimal design strategy of ship structure based on multi-level analysis and super-element modeling method. J. Mar. Sci. Appl. 10, 272–280. doi: 10.1007/s11804-011-1069-y
UNCTAD (2024). Review of Maritime Transport. Available online at: https://unctad.org/system/files/official-document/rmt2024_en.pdf.
Yanagimoto F., Sugimoto K., and Ishibashi K. (2022). Numerical investigation of dry bulk cargo load during ship vertical motion. Ocean Eng. 266, 112970. doi: 10.1016/j.oceaneng.2022.112970
Zou Y., Xiao G., Li Q., and Biancardo S. A. (2025). Intelligent maritime shipping: A bibliometric analysis of internet technologies and automated port infrastructure applications. J. Mar. Sci. Eng. 13, 979.
Appendix A
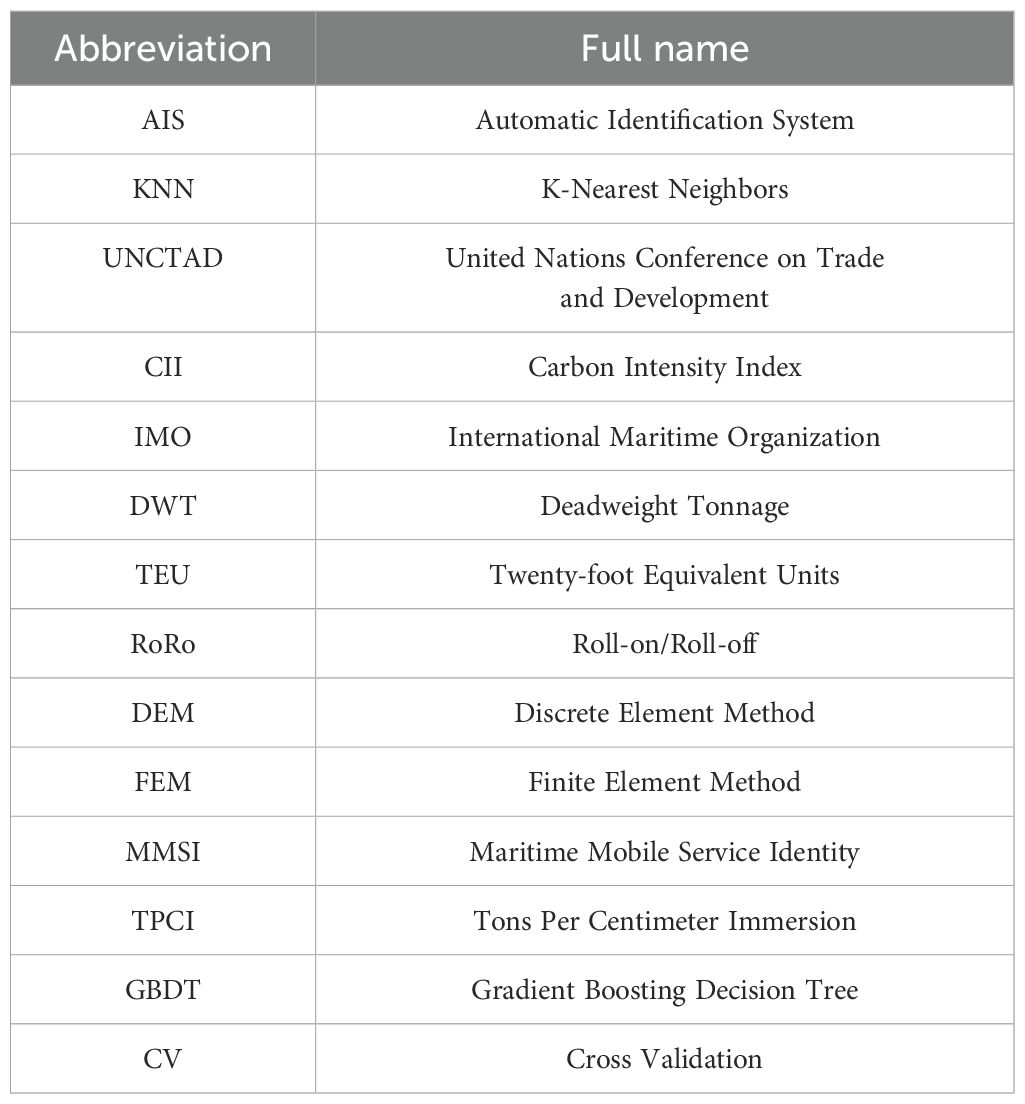
. Table A1 Abbreviation list in this research.
Keywords: ship cargo capacity prediction, machine learning, shipping big data, draught depth, high accuracy
Citation: Chen S, Wang Z, Lu T, Zhu J, Zhang C, Zeng X, Wang J and Shang Z (2025) Research on global ship cargo capacity prediction based on multi-source heterogeneous data. Front. Mar. Sci. 12:1632661. doi: 10.3389/fmars.2025.1632661
Received: 21 May 2025; Accepted: 30 June 2025;
Published: 21 July 2025.
Edited by:
Maohan Liang, National University of Singapore, SingaporeReviewed by:
Chengbo Wang, University of Science and Technology of China, ChinaQiang Luo, Guangzhou University, China
Copyright © 2025 Chen, Wang, Lu, Zhu, Zhang, Zeng, Wang and Shang. This is an open-access article distributed under the terms of the Creative Commons Attribution License (CC BY). The use, distribution or reproduction in other forums is permitted, provided the original author(s) and the copyright owner(s) are credited and that the original publication in this journal is cited, in accordance with accepted academic practice. No use, distribution or reproduction is permitted which does not comply with these terms.
*Correspondence: Zhihuan Wang, emh3YW5nQHNobXR1LmVkdS5jbg==; Zandi Shang, c2hhbmd6YW5kaUBtb3RjYXRzLmFjLmNu