Abstract
The international shipping market, as a vital pillar of global trade, is closely intertwined with the crude oil market. Geopolitical conflicts—through mechanisms such as supply disruptions, rising transportation costs, and heightened market uncertainty—intensify volatility in both markets and amplify their mutual spillover effects. Using data from November 1999 to August 2025 across three markets, this study applies the Diebold–Yilmaz (DY) spillover index and the DCC-GARCH model to analyze the dynamic linkages between the shipping and crude oil markets, with a particular focus on volatility spillovers among the three. The results show significant bidirectional volatility spillovers between international shipping and crude oil markets, with the strongest spillovers occurring within the shipping market itself, reflecting its high degree of internal interconnectedness. Geopolitical conflict risk acts mainly as a net receiver of volatility and, by triggering supply–demand imbalances, prompting behavioral adjustments, and generating lagged policy effects, further amplifies spillovers between shipping and oil markets. This study not only provides a new perspective for understanding the interdependence of global energy and shipping markets under geopolitical uncertainty, but also offers valuable decision-making implications for policymakers and market participants in managing risks.
1 Introduction
Approximately 85%–90% of global trade is transported by sea, and key maritime routes are often focal points of geopolitical conflicts. Shipping also serves as a core instrument for implementing economic sanctions—during conflicts, the blockade of an adversary’s ports can paralyze its economy (Rasshyvalov et al., 2024; Theodorou, 2024; Aropelto, 2025). As one of the world’s most crucial energy sources, oil transportation is highly dependent on maritime shipping (Dalsøren et al., 2007; Gilbert and Pearl, 2012). For example, about 20% of global oil supply passes through the narrow Strait of Hormuz each day. If this chokepoint were closed due to conflict, it could trigger soaring global energy prices and widespread economic turbulence (Shichor, 2008; Ramadhani and Marzaman, 2024; Brito and Jaffe, 2005).
In this study, geopolitical conflict risk (Geopolitical Risk, GPR) specifically refers to the uncertainty in the global economy and financial markets caused by international or regional political events—such as wars, sanctions, terrorist attacks, and political unrest (Salisu et al., 2022). In recent years, geopolitical conflicts have become increasingly frequent, including unrest in the Middle East, the Russia–Ukraine war, and the U.S.–China trade war. These events have exerted profound impacts on the global economy, energy markets, and shipping markets. The outbreak of geopolitical conflicts often leads to oil supply disruptions, shipping route blockages, and rising transportation costs. These problems are intertwined, creating cascading effects on both the shipping and energy markets. Such conflicts not only directly threaten energy supply security but also, through market linkages, affect global trade, supply chain stability, and financial market volatility (Kolb, 2011; Scholten and Bosman, 2016; Su et al., 2021; Rasshyvalov et al., 2024).
Exploring the impact of geopolitical conflict risk on the volatility transmission mechanisms between the international shipping and crude oil markets is of critical importance for understanding global economic and financial stability (Jiao et al., 2023). From a theoretical perspective, studying volatility spillovers under geopolitical risks helps deepen financial contagion theory, particularly by enhancing our understanding of cross-market risk transmission mechanisms (Elsayed and Helmi, 2021; Ahmed and Sohag, 2025). At present, most studies focus on direct relationships between one or two markets. Introducing geopolitical conflict risk as a variable allows for a more comprehensive explanation of the complex role of external shocks in volatility transmission (Elsayed and Helmi, 2021; Korsah and Mensah, 2024). From a practical perspective, given the increasing complexity of global geopolitics and the frequent occurrence of conflicts, their impacts on international shipping and crude oil markets have become increasingly significant. Quantitatively analyzing how geopolitical conflict risk affects volatility and co-movements between the two markets can provide decision-making support for policymakers, investors, and enterprises, helping them effectively manage market risks (Guo et al., 2025). In addition, this research has important policy implications: the findings can serve as a reference for governments and international organizations in formulating more effective energy security policies and shipping risk management strategies, thereby mitigating the adverse impacts of geopolitical conflicts.
The structure of this paper is arranged as follows: Section 2 reviews the related literature and analyzes the shortcomings of existing studies, thereby clarifying the academic contributions of this research. Section 3 introduces the dataset, theoretical models, and econometric methods employed. Section 4 presents the results of the empirical analysis and provides an in-depth discussion of the findings. Section 5 offers further discussion of the research implications. Finally, Section 6 concludes the paper.
This study advances the literature by jointly modeling shipping, crude oil, and geopolitical conflict risk within a unified volatility spillover framework, uncovering the bidirectional and time-varying nature of their interdependence and highlighting policy-relevant implications for global maritime and energy security.
2 Literature review
This study aims to conduct an in-depth analysis of the impact of geopolitical conflict risk (Geopolitical Risk, GPR) on the volatility spillover effects between the international shipping market and the crude oil market. The research focuses on three aspects: the mechanisms of geopolitical conflict risk, the interactive relationship between the two markets, and the transmission pathways of volatility spillovers. Based on existing literature, this section reviews the current state of research in related fields and highlights the innovative contributions of this study.
2.1 Studies on the impact of geopolitical conflicts
As a critical external shock factor, geopolitical risk (GPR) has exerted widespread and profound influences on the volatility of financial and commodity markets. Caldara and Iacoviello (2022), through text analysis and index construction based on newspaper data, provided an important tool for quantifying GPR and laid a data foundation for subsequent research. Many studies have focused on the impact of GPR on different markets, particularly on volatility in the oil market. Hamilton (2009) pointed out that the volatility of the oil market is often significantly shaped by geopolitical factors; especially during conflicts, fluctuations in geopolitical risk premiums exacerbate instability in oil prices. Baumeister and Kilian (2016) further revealed that geopolitical tensions—such as conflicts in major oil-producing countries—have a substantial impact on oil price volatility. Historical episodes such as the 1973 oil crisis, the 1979 Iranian Revolution, the 2003 Iraq War, the 2011 Libyan Civil War, the 2014 Ukraine crisis, and the 2022 Russia–Ukraine conflict all demonstrate the far-reaching influence of geopolitical events on oil prices. Monge et al. (2023), using fractional integration methods, studied the behavior of West Texas Intermediate (WTI) prices and the Baltic Dry Index (BDI) under geopolitical risk assumptions. Their results suggest that while the BDI series tends to revert to its original trend following external shocks, the WTI series displays markedly different persistence, highlighting contrasting behaviors. Chen et al. (2025) investigated the dynamic relationship between the crude oil market and the tanker shipping market under shocks of geopolitical risk, with a particular focus on the differential impacts of threat-based and action-based geopolitical risks as well as supply–demand disruptions. They employed the VAR-BEKK-GARCH model to capture changes in spillover dynamics before and after geopolitical shocks, and applied the TVP-SV-VAR model to visualize the time-varying intensity, direction, and duration of geopolitical risks. Their findings show that threat-based risks enhanced bidirectional spillovers between crude oil and the Baltic Clean Tanker Index (BCTI), whereas action-based risks suppressed these spillover effects. Zeng et al. (2024), using a quantile vector autoregression (QVAR) approach in the frequency domain, studied the risk linkages between the global Geopolitical Risk Index (GPR), the CBOE Oil Volatility Index (OVX), and major agricultural and livestock indices. Their results indicate that food markets are the main transmitters of spillover effects, while the OVX is predominantly a net receiver of risk spillovers in most cases. Smales (2021) highlighted the role of media coverage of geopolitical events, showing that extensive reporting significantly affects investors’ required risk premiums. This provides evidence that geopolitical risks play a critical role in determining oil price volatility and, to a lesser extent, stock market volatility. Wang and Dong (2024), using a rolling-window VAR-DY spillover model combined with network theory, measured the dynamic net spillovers in financial markets. Their study found that international crude oil price volatility not only strongly influences Chinese crude oil prices but also, to some extent, affects geopolitical risk itself.
In examining the impacts on other markets, Mishra et al. (2024), using an event study approach, revealed that geopolitical conflicts such as the Russia–Ukraine war significantly increased global stock market volatility, particularly in regions geographically close to or economically more connected with the conflict countries. Afonso et al. (2024) also showed that GPR significantly exacerbates sovereign debt risks in European countries, affecting debt conditions by raising financing costs and expectations of market uncertainty. From a global perspective, Zhang et al. (2023) investigated the relationship between geopolitical risk and stock market volatility, finding that GPR exerts a significant positive effect on stock market volatility, with stronger impacts observed in emerging economies, oil-exporting countries, and peaceful states. Elsayed and Helmi (2021) applied the ADCC-GARCH model and spillover analysis to examine the effects of geopolitical risk on return and volatility dynamics in Middle East and North African (MENA) markets. Their results emphasize that while GPR did not significantly affect return spillovers across MENA financial markets, dynamic analysis shows that the total spillover index responded strongly to major political events.
However, research on the impact of geopolitical conflict risk on energy markets—particularly the shipping market—remains relatively limited. Although Stopford (2009) pointed out that the volatility of the shipping market is closely linked to oil prices, he did not systematically investigate the mechanisms of volatility transmission between the two. Drobetz et al. (2021), using a Bayesian VAR model, studied the effects of geopolitical risk (GPR) and economic policy uncertainty (EPU) on shipping freight rates. Their results confirmed that GPR exerts a positive impact on dry bulk freight rates through global, rather than country-specific, geopolitical shocks, though the effect has been gradually weakening over time. Qian et al. (2022), employing an autoregressive Markov-regime switching model, explored the predictability of oil market volatility under GPR, showing that GPR contains useful predictive information for oil price volatility, particularly effective in the long-term forecasting horizon.
Building on previous research, the impact of geopolitical risk on the shipping market remains an area that warrants further in-depth investigation. At the same time, most existing studies focus on the analysis of volatility within a single market, with relatively little exploration of how geopolitical conflicts influence volatility transmission across multiple markets. Therefore, this study introduces a volatility spillover framework to systematically analyze the dynamic relationship between the international shipping market and the crude oil market, with the aim of filling this research gap.
2.2 Studies on the relationship between shipping and oil markets
As central players in the transportation and energy sectors, the relationship between the shipping market and the crude oil market has long been a focus of academic research—particularly regarding the impacts of tanker transportation, fuel price fluctuations, and external economic events on their interaction mechanisms. Kavussanos and Alizadeh-M (2002), in their analysis of shipping cost structures, risk premium formation, and market expectations, repeatedly suggested that the oil market significantly influences the shipping market through channels such as fuel costs, financing conditions, and global trade activity. Broadstock and Filis (2014), using Structural Vector Autoregression (SVAR) and the Scalar-BEKK model, examined the time-varying correlations between different types of oil price shocks and the returns of U.S. and Chinese stock markets and their industry sectors. In the process, they pointed out a logical chain in which shipping market activity affects global economic activity, which in turn shapes oil demand. Alexandridis et al. (2018) argued that fluctuations in fuel prices alter the cost structures of shipping companies, thereby amplifying freight rate volatility and ultimately affecting corporate profitability and stock market performance. Baumeister and Hamilton (2019), using Structural Vector Autoregression (SVAR) methods, re-examined the importance of shocks to oil supply and demand. In their discussion of SVAR models for the oil market, they noted that shipping costs had historically been used as a proxy for global economic activity to reflect oil demand. However, due to their structural instability and strong susceptibility to non-economic factors, they ultimately opted for more direct industrial production indicators. This suggests that there exists an indirect but important macroeconomic linkage between the shipping and oil markets. Riaz et al. (2023) further emphasized that volatility in the tanker market plays a crucial role in the dynamic transmission of fluctuations from the oil market, while shipping market volatility in turn exerts a significant influence on the crude oil market.
In addition, the impact of external economic events on the shipping and oil markets has attracted increasing attention. Lin (2023) found that external shocks such as the U.S.–China trade war and the COVID-19 pandemic intensified the volatility transmission from the shipping market to the oil market. Lin et al. (2019) also showed that during financial crises and economic slowdowns, the Baltic Dry Index (BDI) generated significant short-term volatility spillovers into other markets, with this effect becoming more pronounced during the global financial crisis. Khan et al. (2021) demonstrated that oil prices and the BDI are linked to geopolitical risk (GPR) in both the time and frequency domains. Their study indicated that under the presence of GPR, the connection between oil prices and the BDI becomes more evident: GPR first affects oil prices in the short term, and this effect later translates into the BDI in the medium term. While their approach is highly insightful for this study, it is limited to the dry bulk sector and does not extend to the entire shipping market; moreover, there is room for improvement in terms of research methods and the time span of data used.
In summary, although existing studies have revealed important interactions between the shipping and crude oil markets, most research has primarily focused on volatility analysis within a single market, with little systematic exploration of volatility spillover effects between the two under the backdrop of geopolitical risk.
2.3 Studies on volatility spillover effects
When two markets are connected through financial or trade linkages, price fluctuations in one market—driven by policies, information shocks, or other factors—can be transmitted to the other, thereby changing the correlation of volatility between them. This phenomenon is referred to as volatility spillover effects (Wang and He, 2016). Volatility spillovers are a core manifestation of cross-market interactions, explaining how volatility changes in one market influence another.
Engle (1982) proposed the multivariate Generalized Autoregressive Conditional Heteroskedasticity (GARCH) model, which provided a powerful analytical tool for studying volatility spillover effects. Later, Engle (2002) introduced the Dynamic Conditional Correlation GARCH (DCC-GARCH) model, a multivariate volatility framework that captures time-varying correlations flexibly through a two-step procedure—first estimating univariate GARCH models and then dynamically modeling the correlations of standardized residuals. Because of its parsimonious parameterization and ability to ensure the positive definiteness of the covariance matrix, the DCC-GARCH model is particularly well-suited for high-dimensional financial systems. In their review of multivariate GARCH models, Silvennoinen and Teräsvirta (2009) noted that DCC-GARCH achieves a good balance between estimation efficiency and practical applicability by capturing time-varying correlations dynamically within a simple two-parameter framework while maintaining covariance matrix positive definiteness. As a result, the DCC-GARCH model has become one of the most favored tools among scholars for studying volatility spillover effects. Tissaoui et al. (2024) focused on the dynamic relationship between the crude oil market and multiple sources of uncertainty. By combining the DCC-GARCH model with frequency-domain Granger causality tests, they revealed that the persistent high volatility originating from commodity and energy markets exerts significant spillover effects on crude oil returns, and they emphasized the importance of time–frequency decomposition in distinguishing long- and short-term effects. Yıldırım et al. (2022), in the context of the COVID-19 pandemic, applied the DCC-GARCH model to explore the mechanisms of return and risk transmission between oil and precious metals. Their study revealed the differing behaviors of safe-haven assets and cyclical assets during crisis periods. Similarly, Tan et al. (2022), also set against the pandemic background, introduced the DCC-GARCH-Connectedness framework, which they used to examine volatility spillover levels and the multilayer spillover structures between commodity markets (energy and precious metals) before and during COVID-19.
Diebold and Yilmaz (2012) proposed the DY spillover index model, which is constructed based on forecast error variance decomposition within a generalized VAR framework. The model can quantify the total, directional, and net volatility spillover effects across different markets, and its results are not affected by the ordering of variables. It is particularly suitable for accurately tracking the transmission paths and intensities of cross-market volatility risks—such as in equities, bonds, foreign exchange, and commodity markets—during financial crises. The DY model has been applied in multiple research contexts. Tsouknidis (2016) combined the DY spillover index with the DCC-GARCH model to study dynamic volatility spillovers within and between dry bulk and tanker freight markets, finding substantial time-varying spillover effects that were especially strong during and after the global financial crisis. Jiang et al. (2019) also integrated the two models to examine volatility spillovers from China’s shipping market to the steel market, concluding that the two markets exhibit weak spillovers but with evidence of a breakdown in the price transmission mechanism. Kang et al. (2017) employed a multivariate DECO-GARCH model together with the DY spillover index to investigate return and volatility spillovers among six commodity futures (gold, silver, WTI crude oil, corn, wheat, and rice), revealing the strength and direction of transmission during the recent global financial crisis and the European sovereign debt crisis.
The DCC-GARCH model, by estimating the volatilities of individual variables and their dynamic conditional correlations in stages, effectively captures time-varying correlations between variables. However, it cannot directly quantify risk transmission at the mean level. In contrast, the DY model performs exceptionally well in analyzing volatility spillover effects across markets: it can quantify the intensity and direction of transmission, reveal dynamic relationships, and capture time-varying characteristics. Nevertheless, the DY framework mainly focuses on mean spillover effects (first moments), while its ability to capture volatility (second moments) and tail risks (higher moments) is relatively limited.
In terms of alternative models, Kirkpinar and Evrim (2023) employed a Copula model in combination with a VAR-MGARCH model to conduct an in-depth investigation of volatility spillover effects between the BRICS bond markets and commodity markets (gold and oil). By leveraging the Copula model’s ability to capture nonlinear dependencies together with the VAR-MGARCH framework’s capacity to analyze both mean and volatility spillovers, their study produced results that more closely reflect actual market behavior—particularly in the analysis of tail risks.
This study provides a systematic review of the theoretical and empirical research on volatility spillover effects. The DY model reveals the directional characteristics of global risk transmission, compensating for the inability of the DCC-GARCH model to directly quantify risk transmission at the mean level, while the DCC-GARCH model offers a more detailed description of the dynamic correlations of risks. The two models are therefore functionally complementary, and their joint application can effectively overcome the limitations of a single model, thereby presenting analytical advantages from multiple dimensions. In addition, the combined use of these models is technically feasible: both rely on time-series data, which facilitates data collection and processing, and joint analysis of the same dataset allows for mutual validation, enhancing the objectivity and accuracy of the results. However, existing literature has mainly concentrated on volatility analysis within single markets, while in-depth exploration of interactions and transmission mechanisms between markets remains relatively scarce.
2.4 Contributions of this study
The main contributions of this study lie in two aspects.
First, this paper is the first to systematically construct a triangular analytical framework of “international shipping market – crude oil market – geopolitical risk”, breaking through the limitations of traditional single- or dual-variable studies. By employing a volatility spillover framework, it systematically analyzes the impact of geopolitical conflicts on the shipping and oil markets, providing empirical support for the existence of bidirectional volatility spillovers and confirming the information transmission characteristics of the international shipping market.
This study combines the DY spillover index model with the DCC-GARCH model in a complementary way: while the former quantifies the intensity and direction of spillovers, the latter captures dynamic correlations. Together, they enable a comprehensive exploration of the volatility spillover effects among geopolitical risk, the international shipping market, and the crude oil market, offering a new perspective for understanding how geopolitical risks influence volatility transmission across markets in different periods.
Second, compared with the existing literature that mostly relies on relatively short time series, a key innovation of this study is the use of 25 years of daily data from 1999 to 2025. This ultra-long sample fully covers multiple major geopolitical and economic crises, providing a solid data foundation for precisely estimating the long-term evolution of dynamic correlations and rigorously testing model robustness under extreme market stress conditions. As a result, the conclusions of this study are more generalizable and practically relevant.
3 Data and model framework
3.1 DY spillover index model
The DY spillover index model, also known as the generalized forecast error variance decomposition (FEVD) spillover index model, was proposed and later refined by Diebold and Yilmaz. This model enables the quantitative analysis of directional volatility spillover effects. In 2009, the two scholars first introduced the model, primarily applying it to stock markets; in 2012, they further extended it to multiple asset markets and addressed the issue of model results being sensitive to variable ordering. Since then, scholars worldwide have widely applied the DY spillover index to measure volatility spillovers in financial markets such as equities and commodity derivatives. The method is based on the forecast error variance decomposition (FEVD) of a VAR model. By quantifying the spillover effects of return volatility, it effectively captures the trends, cycles, and burst characteristics of spillover dynamics. The analysis of the DY model mainly includes two dimensions: (1) Static Volatility Connectedness – measuring the strength of bidirectional connectedness across different asset classes. (2) Dynamic Volatility Connectedness – capturing the time-varying features of volatility linkages (Diebold and Yilmaz, 2012).
For each group of variables that passes the stationarity tests, the system can be written as an N-variable, k-lag VAR model (Equation 1):
is an endogenous variable vector, which includes multivariate time series of , , , , and ; is an N × N-dimensional parameter matrix; is the error term. Its moving average form is (Equation 2):
The N×N -dimensional covariance matrix is defined as: , where denotes the N×N -dimensional identity matrix. The transformation of variance decomposition associated with moving average coefficients is reconfigured into a temporally adaptive framework via this methodology. Crucially, the variance decomposition under this method remains invariant to variable ordering.
Following this, the generalized variance decomposition framework is applied to assess the proportional influence of individual markets on cross-market volatility. Here, Zij(H) measures the forecast error variance attributed to variable j for variable i within a prediction span H (Equation 3).
When implementing the generalized VAR framework, it is observed that the row-wise totals in the variance decomposition matrix may deviate from unity. This indicates that the combined variance contributions from a variable itself and its interactions with others do not sum to 1. To effectively harness the variance decomposition matrix for spillover index computation, each entry in the matrix must undergo row-wise normalization (Equation 4).
The total spillover index SI, formulated via KPPS variance decomposition, characterizes the aggregate magnitude of cross-market spillover effects and quantifies the influence of individual volatility shocks on the spillover of total prediction error variance (Equation 5).
While analyzing the total volatility spillover index effectively enhances understanding of volatility impact magnitudes among core variables, the generalized VAR framework further allows the investigation of directional spillover patterns across heterogeneous market segments. Directional spillovers are calculated through standardized components derived from the generalized variance decomposition matrix, expressed via directional and net spillover indices.
Directional Spillover Index: Discriminates between markets serving as net contributors or net recipients of volatility spillovers.
From i to other variables (Equation 6):
From other variables to i (Equation 7):
Net Spillover Index: Assesses the comparative significance of individual markets within the systemic framework (Equation 8).
3.2 DCC-GARCH model
The Dynamic Conditional Correlation Generalized Autoregressive Conditional Heteroskedasticity (DCC-GARCH) model was first proposed by Engle (2002) with the purpose of capturing and analyzing the time-varying conditional correlations among multivariate time series. This model overcomes the limitation of the traditional Constant Conditional Correlation GARCH (CCC-GARCH) model, which assumes correlation coefficients to be constant. By incorporating a time-varying structure, the DCC-GARCH model is able to measure how correlations between variables evolve over time, making it more consistent with real-world dynamics. The development of this model is rooted in deeper insights into the characteristics of financial time series volatility, particularly the phenomena of volatility clustering and conditional heteroskedasticity. For example, Engle and Sheppard (2001) were the first to apply the DCC-MGARCH model to analyze linkages among international stock markets, revealing that correlations between markets strengthen significantly during crisis periods. Subsequently, studies by Tse and Tsui (2002) and Silvennoinen and Teräsvirta (2009) further extended the application of this model to cross-market and cross-asset research, confirming its effectiveness in risk management and portfolio optimization.
The DCC-GARCH model adopts a two-stage estimation procedure. In the first stage, a univariate GARCH(1,1) model (Bollerslev, 1986) is fitted to each return series to estimate its conditional variance, thereby capturing the time-varying characteristics of individual volatilities. In the second stage, the Dynamic Conditional Correlation (DCC) model is employed, which constructs the dynamic conditional correlation matrix using standardized residuals, i.e., by dividing the raw residuals by their conditional standard deviations. The DCC model describes the evolution of correlations over time through a dynamic updating equation, allowing correlation coefficients to adjust dynamically in order to more accurately capture the volatility and co-movements observed in financial time series data. The model is specified as follows (Equation 9):
Within this framework, encapsulates the temporal dynamics of five variables linked to the shipping market, crude oil market, and geopolitical tensions. is defined as the steady-state equilibrium return. The N×1-dimensional vectors , , characterize the investigated time series, their conditional expectations, error terms, and standardized disturbances. comprises the entirety of information available prior to time t (Equations 10-13).
In this framework, and are defined as N×N -dimensional matrices, corresponding to dynamic conditional correlations, evolving conditional covariance matrices, and temporally adaptive conditional variances (Equations 14, 15).
In this framework, represents the unconditional covariance matrix associated with standardized residuals. Following Hansen and Lunde (2005) methodology, the model assumes that an impulse parameter and a persistence coefficient govern short-term shocks and long-lasting memory effects, respectively, subject to to ensure volatility stationarity. Under these conditions, and exhibit temporal variation. Under such conditions, the model asymptotically approaches the CCC-GARCH framework, resulting in a time-invariant . Here signifies the long-term equilibrium level, reflecting the steady-state market volatility absent external disturbances. Proximity of to unity correlates with heightened persistence of fluctuation impacts from shocks.
3.3 Dataset specification
To represent the international shipping market, we select the Baltic Dry Index (BDI), the Baltic Dirty Tanker Index (BDTI), and the Baltic Clean Tanker Index (BCTI).
-
The Baltic Dry Index (BDI) is the core indicator reflecting fluctuations in international dry bulk shipping prices. It is composed of freight rates for Capesize, Panamax, and Handymax vessels.
-
The Baltic Dirty Tanker Index (BDTI) measures global transportation costs for crude oil and fuel oil. It reflects both the supply–demand conditions and the transportation costs in the market for unrefined “dirty” tankers.
-
The Baltic Clean Tanker Index (BCTI) tracks the transportation costs of refined oil products (such as gasoline and diesel). It reflects changes in freight rates for tankers used to transport “clean” refined petroleum products.
For the international crude oil market, we use the futures closing price of West Texas Intermediate (WTI) traded on the New York Mercantile Exchange (NYMEX), which serves as one of the world’s most important pricing benchmarks. Compared with Brent crude, which is seaborne and therefore more sensitive to shipping rates, international sanctions, and geopolitical disruptions, WTI is a landlocked crude oil whose price is more directly driven by fundamental market factors such as inventories, production, pipeline transport capacity, and refining demand. Thus, WTI provides a “cleaner” laboratory environment for this study. In the empirical analysis, we further conduct a robustness check by substituting WTI with Brent crude; the results are reported in 4.3.
For geopolitical risk (GPR), we adopt the Geopolitical Risk Index compiled by Dario Caldara and Matteo Iacoviello. This index is constructed by searching the archives of ten newspapers and calculating, for each month, the proportion of articles related to adverse geopolitical events relative to the total number of news articles.
All indicators use daily data from November 1, 1999 to August 29, 2025. The indices for the shipping market are obtained from Clarksons Shipping Intelligence Network, WTI data from the global financial information platform Investing.com, and GPR data from the official website of its compilers (https://www.matteoiacoviello.com/gpr.htm). Returns are calculated from these series for analysis.
3.4 Model applicability test
To ensure the reliability of the empirical results, this study conducts a series of rigorous data preprocessing and model specification tests before estimating the dynamic spillover index and dynamic conditional correlations. The purpose of this section is to verify whether the data used satisfy the basic assumptions of the models and to assess whether the selected models can adequately capture the dynamic characteristics of the data (Lütkepohl, 2013).
First, the ADF and PP tests were applied to examine the stationarity of the data. As shown in Table 1, the ADF and PP statistics of all five variables are smaller than the corresponding critical values, rejecting the null hypothesis of a unit root and confirming that the data are stationary (Dickey and Fuller, 1979; Phillips and Perron, 1988).
Table 1
| Statistic | BDI | BDTI | BCTI | WTI | GPR |
|---|---|---|---|---|---|
| Mean | 0.0065 | 0.0051 | 0.0005 | 0.0162 | 0.0033 |
| Std | 2.4956 | 2.2198 | 2.2022 | 2.7038 | 37.9871 |
| Max | 20.3367 | 23.8076 | 29.2244 | 58.1235 | 234.4884 |
| Min | -19.2272 | -38.1224 | -57.1987 | -56.8589 | -299.5883 |
| Median | 0.0000 | -0.0947 | -0.1442 | 0.0620 | -0.5168 |
| Skewness | 0.3699 | -0.0943 | -1.4415 | -0.1581 | 0.0703 |
| Kurtosis | 5.6734 | 34.7749 | 98.8042 | 71.2408 | 1.9819 |
| ADF | -16.9013 | -26.9856 | -15.9041 | -13.8017 | -20.6617 |
| PP | -33.2428 | -44.9216 | -46.4020 | -86.7946 | -306.1327 |
| Critical Value (1%) | -3.4314 | -3.4314 | -3.4314 | -3.4314 | -3.4314 |
| Observations | 6451 | 6451 | 6451 | 6451 | 6451 |
Descriptive statistics.
Second, diagnostic tests were conducted on the residuals of the models, including the Ljung–Box test for autocorrelation, the normality test, and the ARCH-LM test. The results are presented in Table 2, Figure 1, Table 3, and Table 4. The Ljung–Box test results show that the residuals of all five variables satisfy the white-noise assumption, indicating that the VAR model provides a good fit to the data.
Table 2
| Variable | BDI | BDTI | BCTI | WTI | GPR | |||||
|---|---|---|---|---|---|---|---|---|---|---|
| Lag | LB-Stat | P value | LB-Stat | P value | LB-Stat | P value | LB-Stat | P value | LB-Stat | P value |
| 1 | 0.0008 | 0.9779 | 0.0007 | 0.9789 | 0.0013 | 0.9708 | 0.0013 | 0.9709 | 0.0038 | 0.9510 |
| 2 | 0.0043 | 0.9979 | 0.0335 | 0.9834 | 0.0047 | 0.9977 | 0.0148 | 0.9926 | 0.0814 | 0.9601 |
| 3 | 0.0064 | 0.9999 | 0.0397 | 0.9979 | 0.0070 | 0.9998 | 0.0161 | 0.9995 | 0.2978 | 0.9604 |
| 4 | 0.0072 | 1.0000 | 0.0431 | 0.9998 | 0.0162 | 1.0000 | 0.0340 | 0.9999 | 0.5544 | 0.9680 |
| 5 | 0.0078 | 1.0000 | 0.0455 | 1.0000 | 0.0471 | 1.0000 | 0.0645 | 0.9999 | 0.8166 | 0.9760 |
| 6 | 0.0091 | 1.0000 | 0.0632 | 1.0000 | 0.0541 | 1.0000 | 0.0788 | 1.0000 | 1.0177 | 0.9849 |
| 7 | 0.0113 | 1.0000 | 0.0633 | 1.0000 | 0.0741 | 1.0000 | 0.1570 | 1.0000 | 1.3346 | 0.9875 |
| 8 | 0.0162 | 1.0000 | 0.0651 | 1.0000 | 0.0865 | 1.0000 | 0.1602 | 1.0000 | 1.8384 | 0.9856 |
| 9 | 0.0238 | 1.0000 | 0.0757 | 1.0000 | 0.0891 | 1.0000 | 0.1627 | 1.0000 | 2.3681 | 0.9842 |
| 10 | 0.0239 | 1.0000 | 0.0942 | 1.0000 | 0.2268 | 1.0000 | 0.2011 | 1.0000 | 3.4054 | 0.9702 |
| 11 | 0.0309 | 1.0000 | 0.1303 | 1.0000 | 0.2492 | 1.0000 | 0.2321 | 1.0000 | 4.2798 | 0.9610 |
| 12 | 0.0312 | 1.0000 | 0.1588 | 1.0000 | 0.2492 | 1.0000 | 0.2322 | 1.0000 | 5.5740 | 0.9360 |
| 13 | 0.1269 | 1.0000 | 0.1789 | 1.0000 | 0.3378 | 1.0000 | 0.3225 | 1.0000 | 8.7874 | 0.7888 |
| 14 | 0.1949 | 1.0000 | 0.1816 | 1.0000 | 0.4019 | 1.0000 | 0.3769 | 1.0000 | 13.5675 | 0.4824 |
| 15 | 1.8909 | 1.0000 | 0.4058 | 1.0000 | 0.4085 | 1.0000 | 0.3889 | 1.0000 | 20.6559 | 0.1482 |
Residual autocorrelation tests.
Figure 1
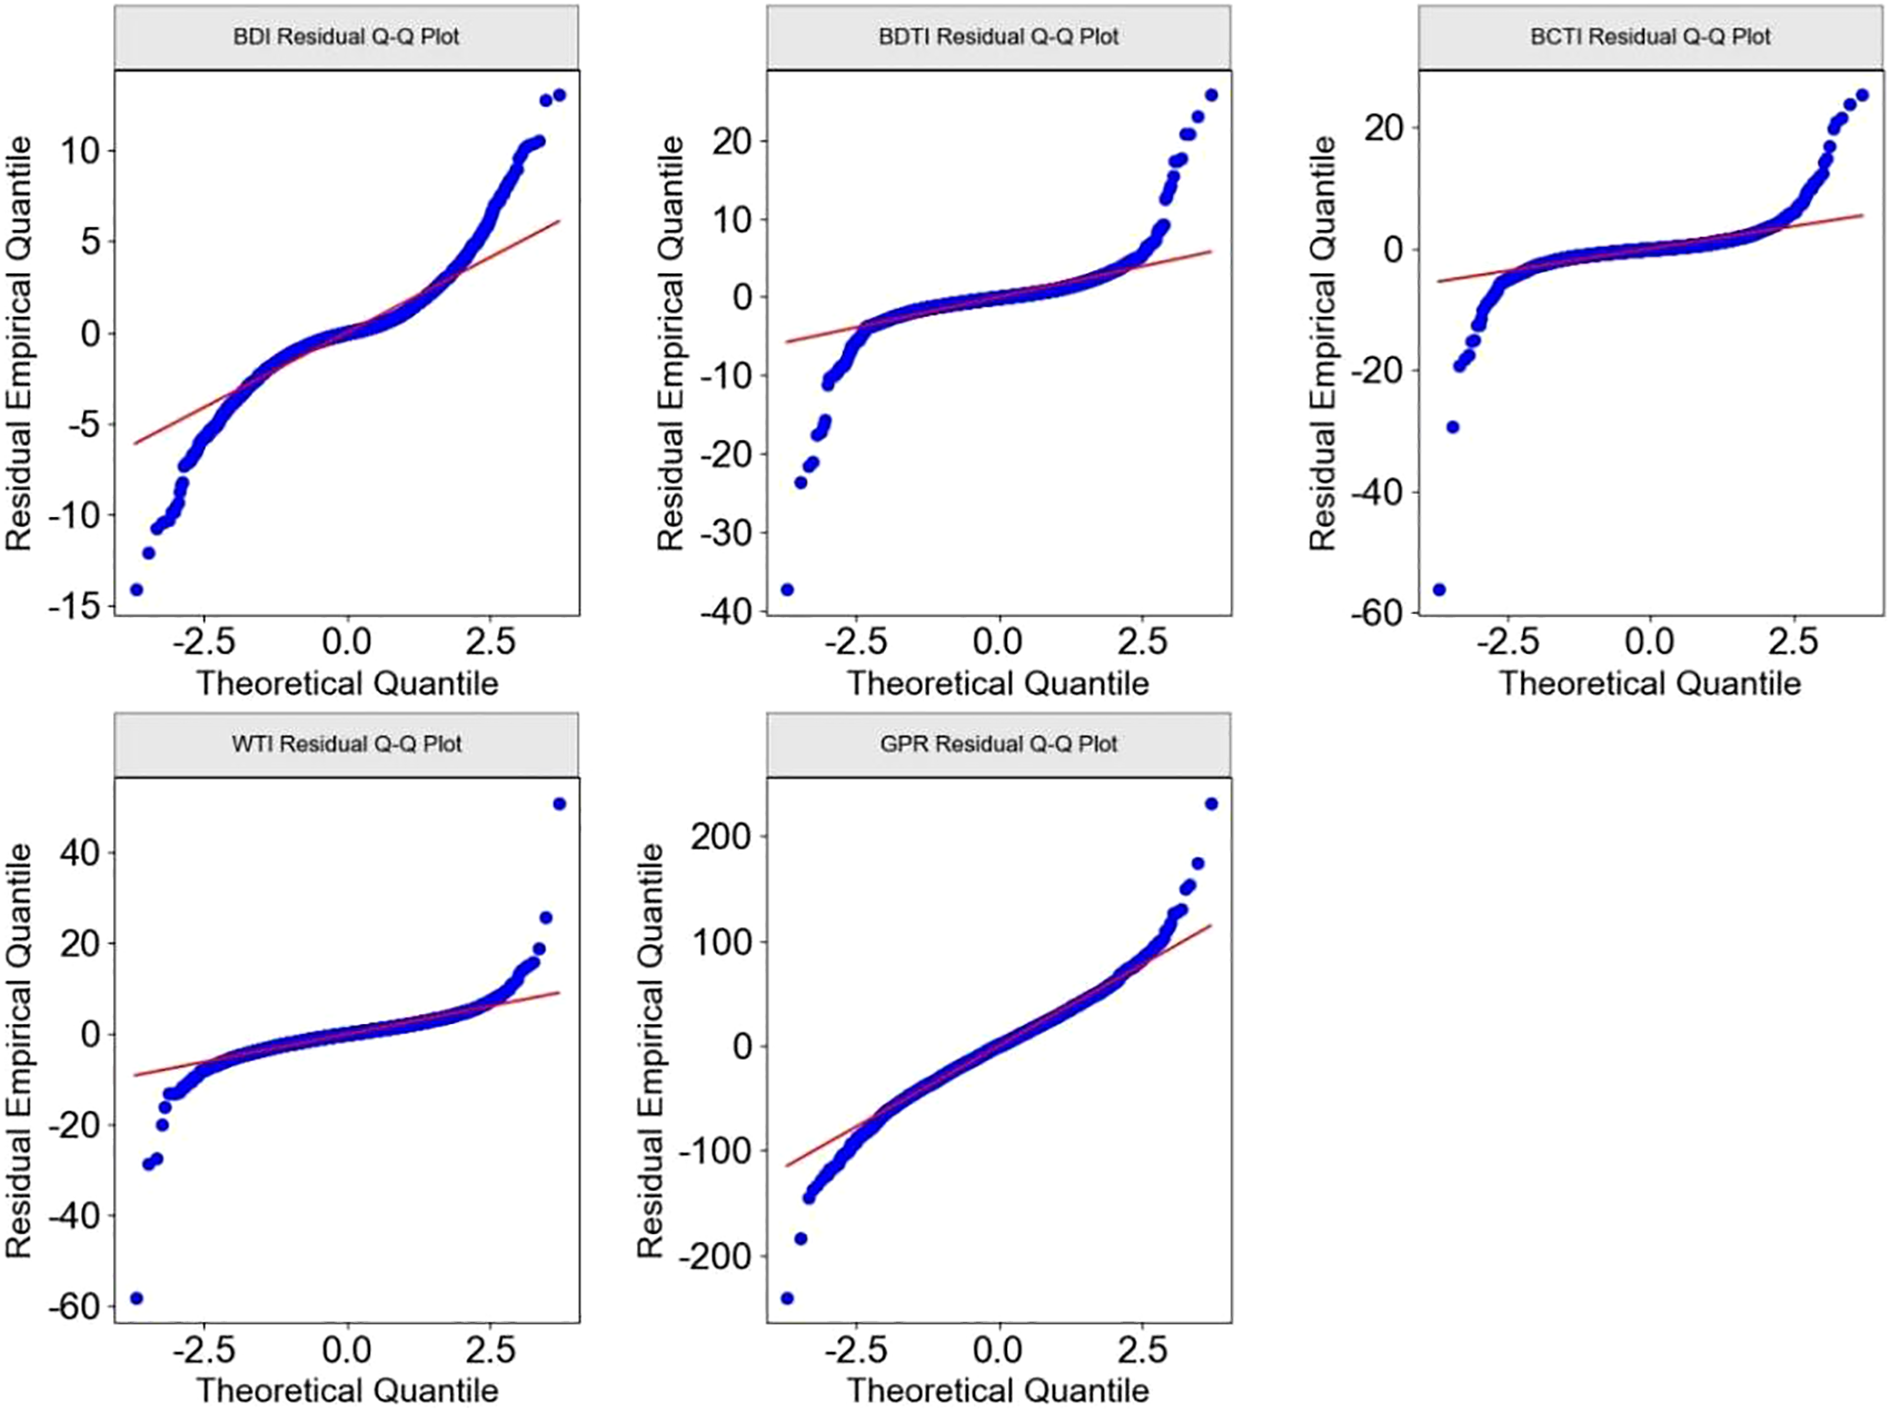
VAR model residual Q-Q plot (quantile-quantile plot).
Table 3
| Variable | Shapiro_statistic | Shapiro_pvalue | Skewness | Kurtosis | Sample_size |
|---|---|---|---|---|---|
| BDI | 0.9317 | 0.0 | 0.3699 | 5.6734 | 6451 |
| BDTI | 0.7976 | 0.0 | -0.0943 | 34.7749 | 6451 |
| BCTI | 0.7032 | 0.0 | -1.4415 | 98.8042 | 6451 |
| WTI | 0.8312 | 0.0 | -0.1581 | 71.2408 | 6451 |
| GPR | 0.9869 | 0.0 | 0.0703 | 1.9819 | 6451 |
Results of normality tests.
Table 4
| Coefficient | BDI | BDTI | BCTI | WTI | GPR |
|---|---|---|---|---|---|
| ω | 0.0064 | 0.1754 | 0.07672 | 0.0144 | 0.6479 |
| α | 0.3660 | 0.8958 | 0.7169 | 0.0936 | 0.2235 |
| β | 0.62400 | 0.09422 | 0.2731 | 0.8904 | 0.1284 |
| α+β | 0.9900 | 0.9900 | 0.9900 | 0.9840 | 0.3519 |
| Persistence | High Persistence | High Persistence | High Persistence | High Persistence | Low Persistence |
| ν | 9.1734 | 4.4417 | 4.1970 | 7.8186 | 7.6580 |
| LM_Lag | 5 | 5 | 5 | 5 | 5 |
| LM_Statistic | 0.5979 | 0.0240 | 0.0252 | 0.2884 | 0.7049 |
| LM_Pvalue | 0.9881 | 0.9999 | 0.9999 | 0.9979 | 0.9827 |
| ARCH_Effect_Removed | True | True | True | True | True |
Parameter estimates of univariate GARCH(1,1) models and ARCH-LM test results.
The normality test results are presented in Figure 1 (Q–Q plots of the VAR model residuals) and Table 5 (statistics of residual normality tests). The results strongly reject the null hypothesis, indicating that the standardized residuals exhibit leptokurtosis and fat tails, which is a typical feature of financial time series. Given the robustness of the DY spillover index and DCC-GARCH models in estimation, such non-normality does not fundamentally affect the core conclusions. Therefore, this paper adopts the t-distribution—which is better suited for capturing fat-tail characteristics—as the distributional assumption of the GARCH model innovations, in order to improve model fit and the accuracy of risk measurement (Rani Das, 2016).
Table 5
| Variable | BDI | BDTI | BCTI | WTI | GPR | From others |
|---|---|---|---|---|---|---|
| BDI | 0.6826 | 0.0877 | 0.0801 | 0.0775 | 0.0722 | 0.3175 |
| BDTI | 0.0883 | 0.6626 | 0.0958 | 0.0837 | 0.0696 | 0.3374 |
| BCTI | 0.0901 | 0.1883 | 0.5623 | 0.0967 | 0.0626 | 0.4377 |
| WTI | 0.0842 | 0.0892 | 0.0866 | 0.6704 | 0.0697 | 0.3297 |
| GPR | 0.0824 | 0.0888 | 0.0777 | 0.0801 | 0.6711 | 0.329 |
| Contribution to others | 0.345 | 0.454 | 0.3402 | 0.338 | 0.2741 | SI |
| NSI | 1.0276 | 1.1166 | -0.0975 | 0.0083 | -0.0549 | 0.3502 |
Volatility spillover table.
Note: SI denotes the total spillover index, calculated using Equation 5 in Section 3.1; NSI denotes the net spillover index, calculated using Equation 8 in Section 3.1; From others and Contribution to others refer to directional spillover indices, calculated using Equation 6 and Equation 7 in Section 3.1.
To verify whether the DCC-GARCH model sufficiently captures the effect of volatility clustering, we conducted the ARCH-LM test on the standardized residuals. The null hypothesis states that no remaining ARCH effects exist in the residuals. The test results, together with the parameter estimates of the univariate GARCH(1,1) models for all variables, are reported in Table 3. The results demonstrate that the GARCH(1,1) models successfully absorb the conditional heteroskedasticity in the original series, and that the standardized residuals are homoscedastic. Hence, the use of GARCH-family models is both necessary and sufficient, and the stationarity condition (α+β<1) is also validated (Engle, 2000).
4 Empirical findings
4.1 Parameter estimation of the DY spillover index model
To ensure the rigor of model specification and the robustness of estimation results, this study carefully determined the key parameters. First, according to the Bayesian Information Criterion (BIC), the optimal lag order of the model was set at p = 15, which allows the dynamic relationships among the variables to be fully captured while avoiding overfitting. Second, the forecast horizon for the Forecast Error Variance Decomposition (FEVD) was set at H = 20 days, so that the spillover index measures become stable. Finally, a 200-day rolling window was adopted for dynamic analysis, aiming to guarantee the reliability of estimation results while being sufficiently sensitive to capture the time-varying characteristics of spillover effects.
Figure 2 presents the directional spillover indices of each variable, while Figure 3 illustrates the dynamic evolution of the total volatility spillover index. Table 4 reports the decomposition results of cross-market volatility spillovers based on the DY spillover index model.
Figure 2
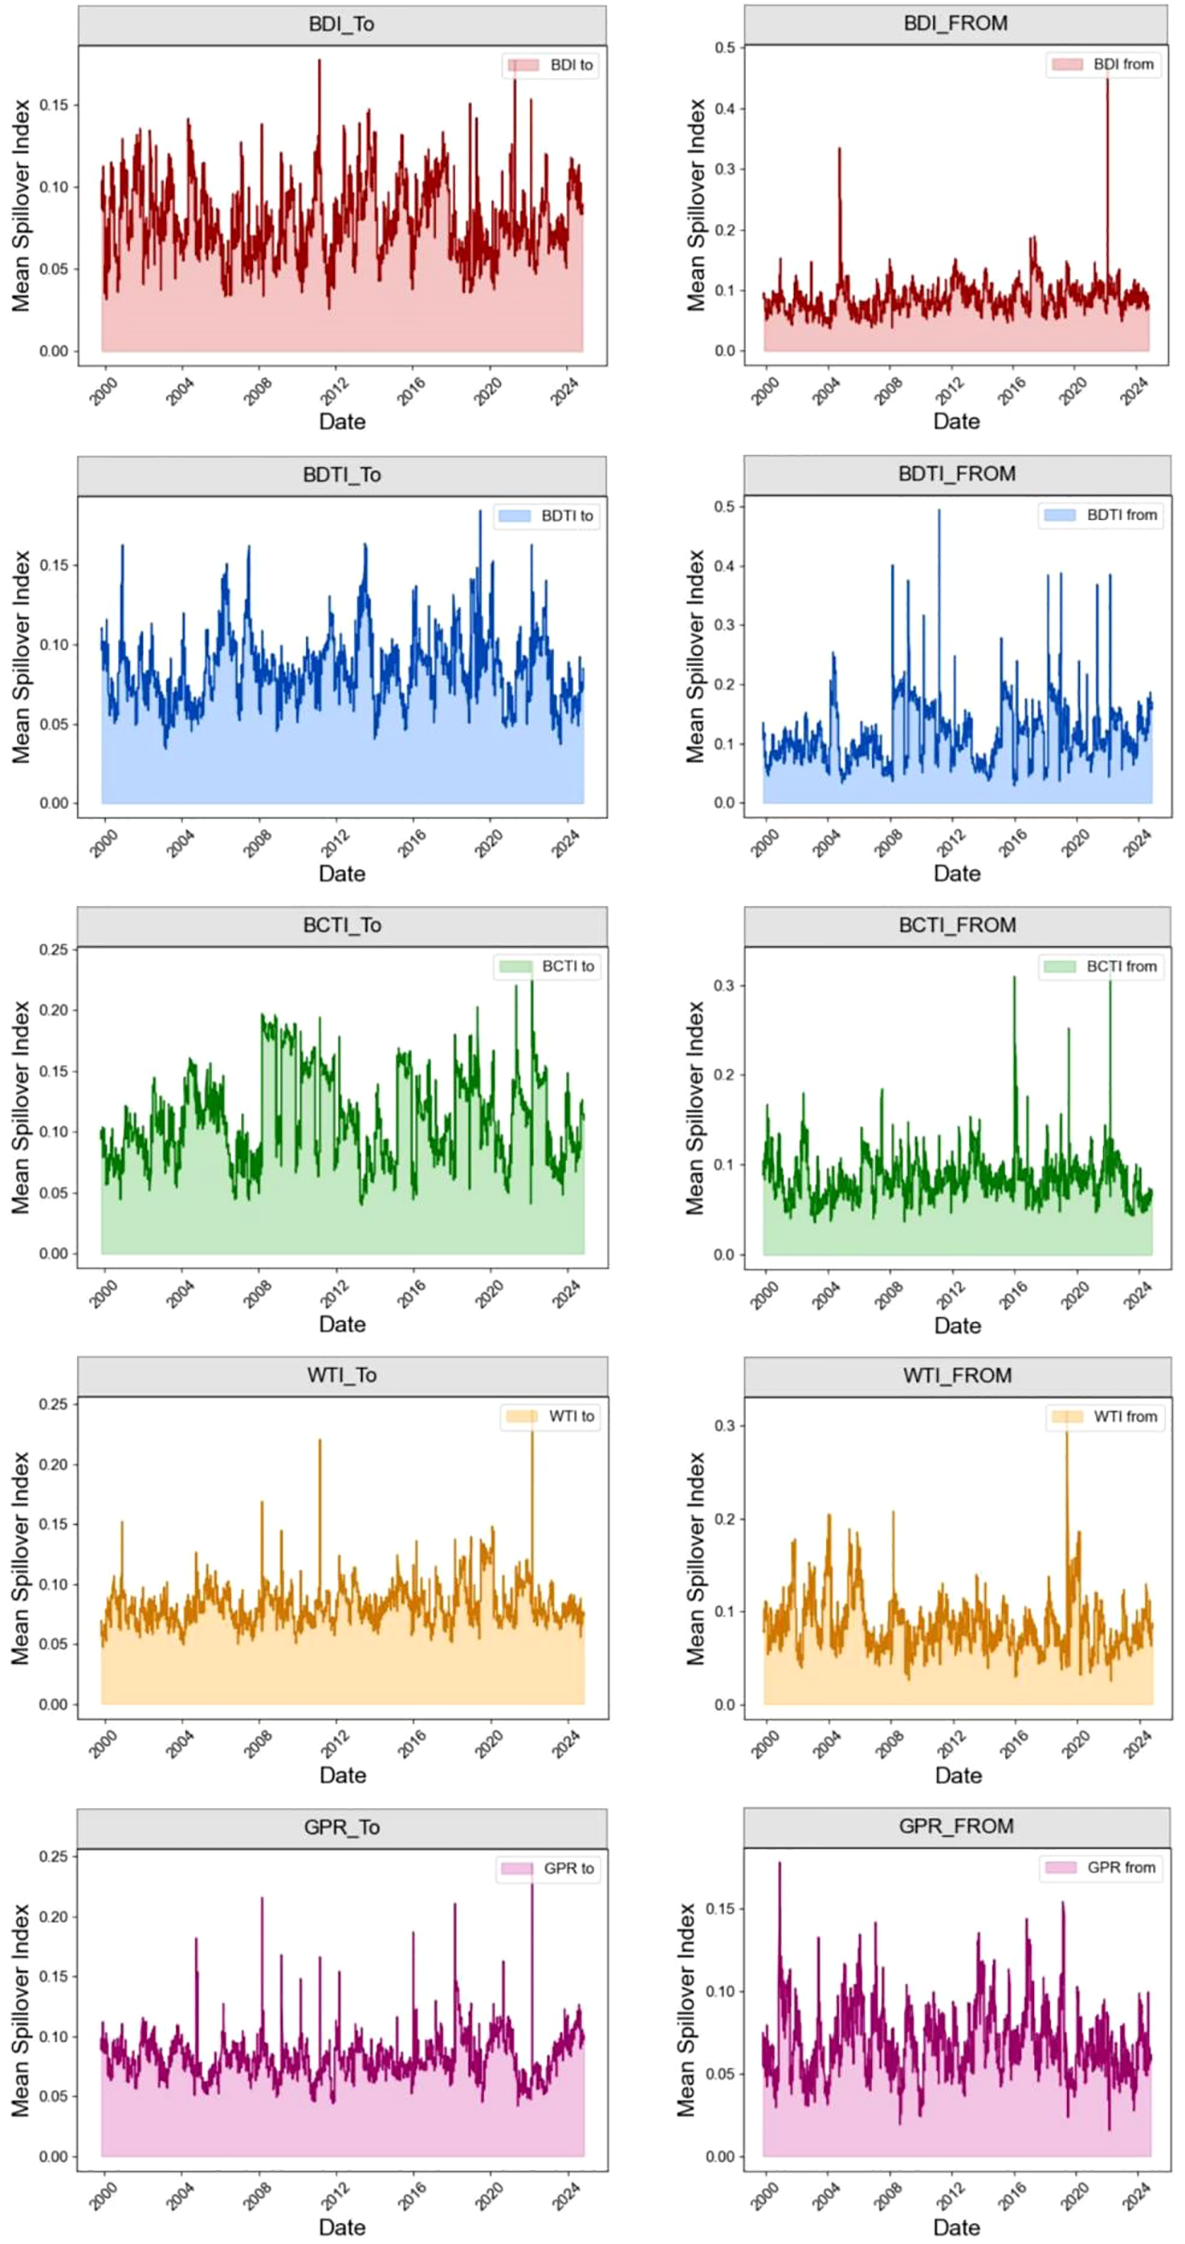
Directional spillover indices. The figure shows the results of lag order p = 15, rolling window length w = 200 days, and prediction step H = 20 days.
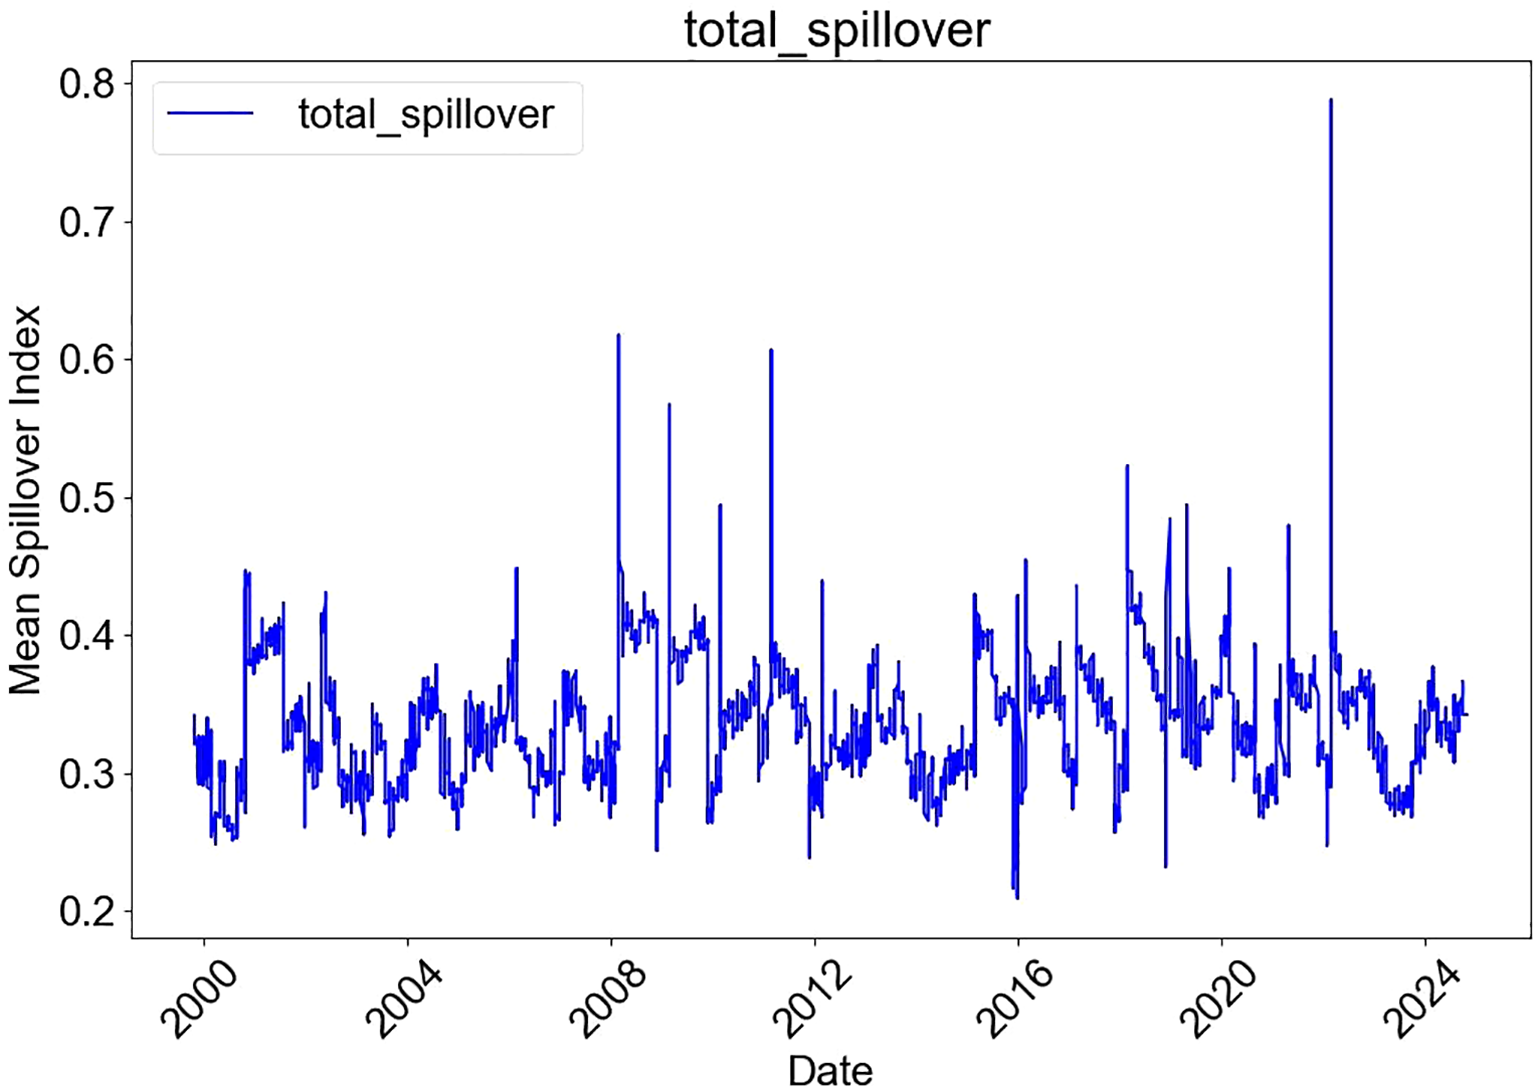
Figure 3
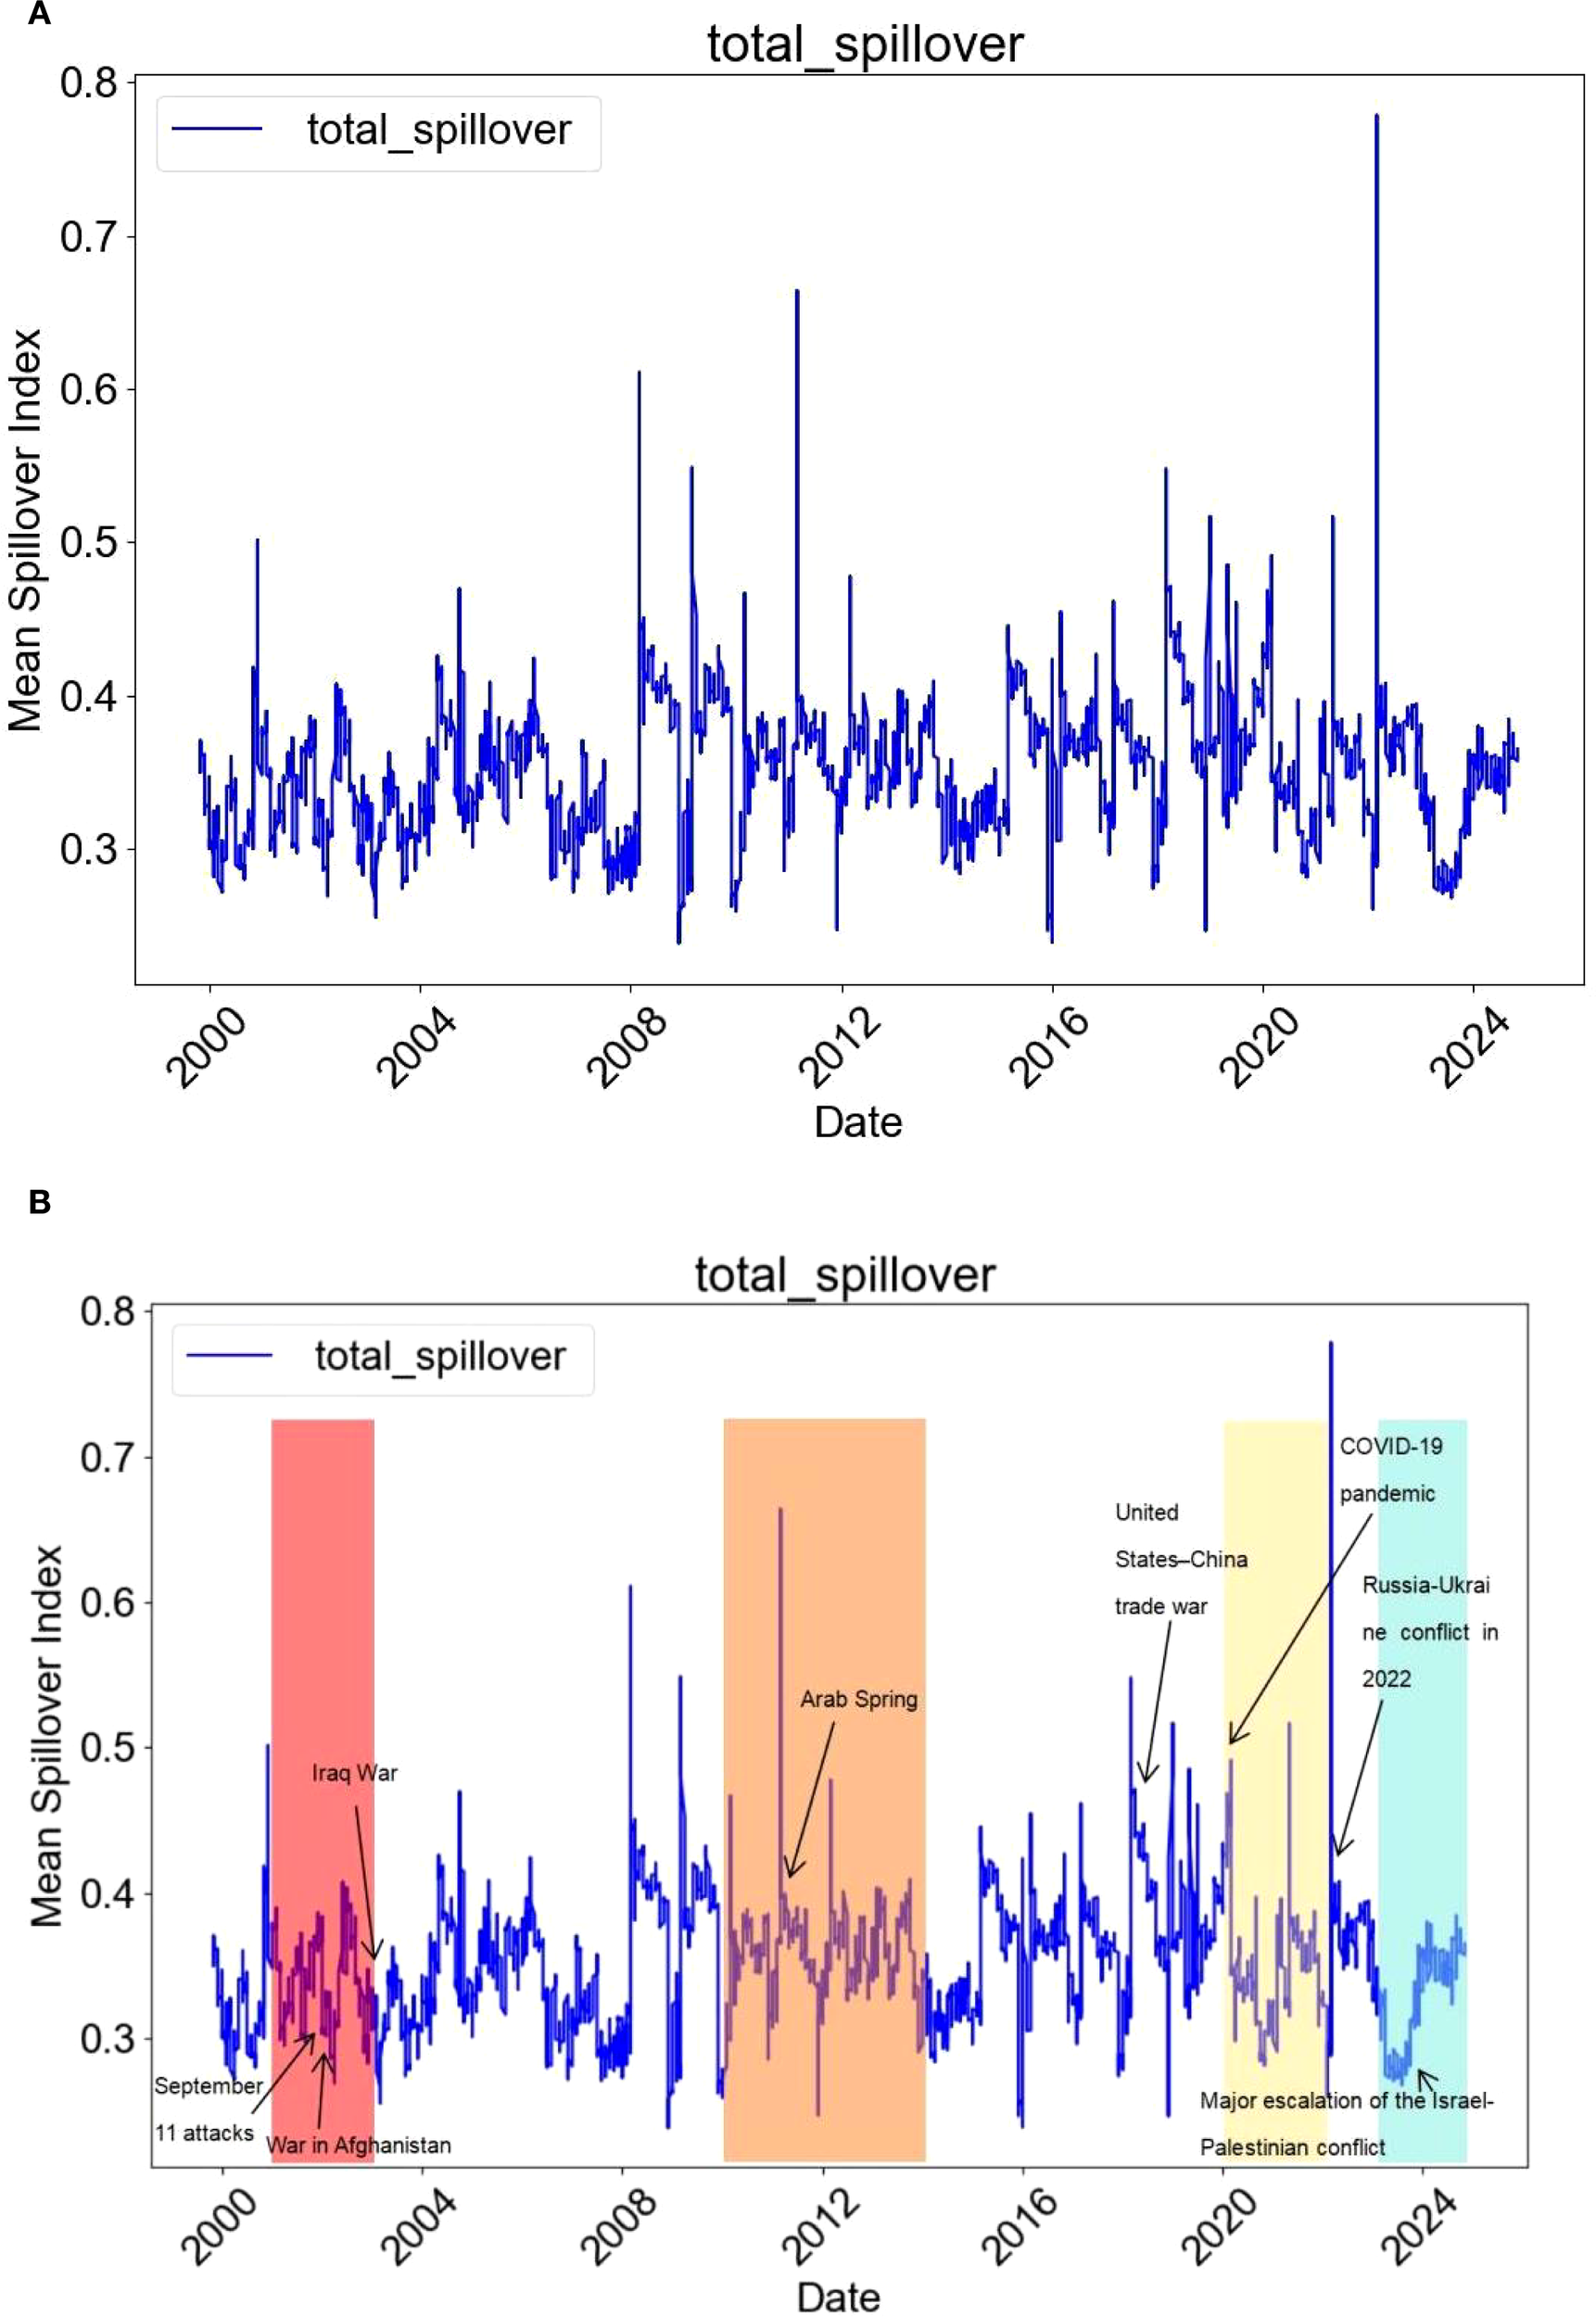
Total volatility spillovers. (A) Total volatility spillover index. (B) Total volatility spillover index with major events marked. The figure shows the results of lag order p = 15, rolling window length w = 200 days, and prediction step H = 20 days.
The table quantifies the transmission intensity of volatility among the indices using the forecast error variance decomposition (FEVD). Specifically, the element in column j represents the contribution of indicator j to the volatility of indicator i. The column sums of the off-diagonal elements (i.e., “contributions to other indicators”) and the row sums of the off-diagonal elements (i.e., “contributions received from other indicators”) correspond to directional spillovers to others and directional spillovers from others, respectively. The difference between the two yields the net volatility spillover.
In addition, the total volatility spillover index is located at the bottom right corner of the spillover table. It represents the percentage share of the sum of off-diagonal elements (either row sums or column sums) relative to the total (including diagonal elements). This index reveals the overall degree of volatility connectedness within the system. The spillover table thus provides an approximate “input–output” decomposition of the total spillover index.
We first analyze the directional spillovers. From the Contribution to others row, it can be observed that among the five indicators, the BDI contributes the largest total directional volatility spillovers to other markets, followed by the BDTI, BCTI, and WTI, while the GPR contributes the least. From the From others column, we see that GPR receives the largest spillovers from other indicators, followed by WTI, BCTI, and BDTI, with the BDI receiving the least spillovers. In terms of net directional spillovers, the BDI exhibits the highest net spillover, confirming its role as the primary net transmitter of volatility. In contrast, GPR shows the lowest net spillover, identifying it as the main net receiver of volatility. Within the shipping market specifically, the BDTI exerts the strongest directional spillover on the BCTI, suggesting a close relationship between crude oil tanker freight rates and clean product tanker freight rates.
Overall, spillover effects within the shipping market are stronger than those between the shipping market and external factors (WTI and GPR). Meanwhile, the spillover effects of crude oil prices and geopolitical conflict risk on the shipping market are more pronounced. Looking beyond the shipping market, the spillover from WTI to GPR is stronger than that from GPR to WTI. Furthermore, the spillovers between crude oil prices and geopolitical risk are greater than those between either of them and the shipping market. Geopolitical risk also exhibits similar characteristics.
From a dynamic perspective, directional spillovers among variables are significantly amplified during crisis periods. Between November 1999 and December 2024, the Iraq War of 2003 provides the first clear evidence of shifts in directional spillover indices across markets. At the onset of the war, concerns over crude oil supply shortages drove a sharp surge in Brent oil prices. However, following the release of U.S. strategic petroleum reserves, prices fell back. This phenomenon corresponds with the WTI “To” and “From” directional spillover indices, which rose initially and then declined during this period. By contrast, the impact of the war on dry bulk shipping was more indirect compared with that on the crude oil and product tanker markets. Consequently, the BDI’s directional spillover index exhibited patterns different from those of the other markets. However, due to the decline in global trade confidence, the BDI’s directional spillover index remained at a relatively low level, indicating that its influence on other markets—and the extent to which it was influenced by others—was both limited during this time. In 2008, the Russia–Georgia conflict disrupted Black Sea shipping routes, and combined with the global financial crisis, led to a contraction in world trade. The BDI index plunged sharply with heightened volatility, and both its To and From directional spillover indices rose to temporary peaks, establishing a higher baseline for subsequent periods. During the 2012 EU oil embargo on Iran, the BDI once again dropped to a low point, while the BDI_To directional spillover index remained elevated, reflecting the significant influence of the dry bulk market on other markets during this period. In February 2022, with the escalation of the Russia–Ukraine conflict, freight rates along the Black Sea–Mediterranean routes surged, pushing the BDTI index to its highest level since May 2020. At the same time, market concerns over restrictions on Russian crude oil exports drove Brent crude prices above USD 119 per barrel. Correspondingly, the BDTI_From, WTI_To, WTI_From, and GPR_To directional spillover indices all reached their highest levels of the 2020–2024 period. By 2024, amid the Red Sea crisis and the shutdown of the Suez Canal, the GPR_To directional spillover index remained at consistently high levels, exceeding its average during the 2016–2020 period.
In summary, the GPR_To directional spillover index tends to spike during major geopolitical conflict events. When wars disrupt the oil market, the WTI_To and WTI_From indices display pronounced upward fluctuations, while the BDTI and BCTI spillover indices follow similar patterns to those of WTI. The BDI spillover index, however, typically exhibits substantial fluctuations when geopolitical conflict risks severely impact global trade.
Note: Panel (A) shows the original total volatility spillover index. Panel (B) is based on Panel (A) but marks several major international events along the timeline. Shaded areas indicate periods during which multiple significant events occurred, while text labels mark the start dates of selected events to facilitate interpretation in conjunction with the index dynamics.
The total volatility spillover index reaches 35.02% (see the lower-right corner of Table 4), indicating that approximately 35.02% of the forecast error variance in the five markets can be attributed to cross-market spillover effects. This relatively high level reflects strong cross-market volatility interconnectedness.
From the dynamic evolution of the total volatility spillover index in Figure 3, we observe considerable variation over the sample period (November 1999 to August 2025), some of which can be described as more or less continuous developments. Overall, the total spillover index remains within a range of 25%–60%, exhibiting certain cyclical fluctuations.
Given the evolving and turbulent background of the shipping markets, it appears unlikely that any single fixed-parameter model would be well-suited to the entire sample period. Therefore, while traditional full-sample spillover tables and spillover indices summarize average spillover behavior, they may fail to capture crucial long-term and cyclical variations in spillovers.
To address this issue, we employ a 200-day rolling sample combined with major geopolitical conflict events to analyze volatility spillovers.
During 2003–2011, wars in the Middle East had a profound impact on both the shipping and oil markets. The Iraq War disrupted oil supplies, causing crude oil prices to surge. The shipping market, meanwhile, faced heightened risks from military operations in the Persian Gulf and piracy threats (e.g., in the Gulf of Aden). Coupled with the Libyan War in 2011, the volatility index remained at elevated levels.
Between 2014 and 2017, conflicts in the Middle East raised shipping risks in the Strait of Hormuz. However, the simultaneous boom in U.S. shale oil production triggered a collapse in oil prices. With global trade slowing, the shipping market weakened, and the volatility index fell below 0.4.
From 2022 to 2024, the escalation of the Russia–Ukraine war and the Israel–Palestine conflict, together with sanctions on Russian crude oil, led to severe fluctuations in international oil prices. Multiple global shipping routes were affected to varying degrees: Black Sea shipping was disrupted (e.g., Ukrainian grain exports were blocked), the Arctic route faced militarization risks, Red Sea shipping was targeted by Houthi attacks, and transit costs through the Suez Canal surged. Container freight indices also rose in 2024. These combined factors corresponded closely with the sharp increase in the volatility index.
4.2 Parameter estimation of DCC-GARCH model
Using the DCC-GARCH model under the t-distribution assumption, we first analyze the static correlations among the markets. Table 6 reports the static correlation coefficient matrix across variables.
Table 6
| Variable | BDI | BDTI | BCTI | WTI | GPR |
|---|---|---|---|---|---|
| BDI | 1.0000 | 0.3557 | 0.4104 | 0.1427 | 0.0580 |
| BDTI | 0.3557 | 1.0000 | 0.7748 | -0.0527 | 0.1172 |
| BCTI | 0.4104 | 0.7748 | 1.0000 | -0.0943 | 0.0919 |
| WTI | 0.1427 | -0.0527 | -0.0943 | 1.0000 | -0.0106 |
| GPR | 0.0580 | 0.1172 | 0.0919 | -0.0106 | 1.0000 |
Static correlation matrix.
The results show that: (1) Within the shipping market, the indices are positively correlated with each other. (2) The oil market and the shipping market exhibit negative correlations. (3) Geopolitical conflict risk is negatively correlated with crude oil freight rates and product tanker freight rates, but positively correlated with dry bulk freight rates and crude oil prices.
The shipping market displays strong internal linkages. For example, the correlation coefficient between the crude oil tanker index and the product tanker index is 0.7748, indicating a significant positive co-movement within the tanker segment. This finding is consistent with Kavussanos et al. (2014), who highlighted volatility spillovers across different segments of the shipping market. Such linkages may originate from shared market demand (e.g., global energy trade) and capacity allocation mechanisms. By contrast, cross-market correlations are relatively weak: the correlation coefficient between the dry bulk shipping index and crude oil prices is 0.1427, while that between geopolitical risk and crude oil prices is only –0.0106. These results align with Jiang et al. (2019) on the shipping and steel markets, further confirming the significance of the market segmentation effect. Shipping, crude oil, and geopolitical risk factors are each driven by different underlying fundamentals. Specifically, the BDI (Baltic Dry Index) primarily depends on fluctuations in global commodity trade, while WTI (West Texas Intermediate crude oil) is influenced by supply–demand conditions and inventory levels. In addition, geopolitical risk (GPR) exhibits a certain degree of independence, as its static correlations with other economic variables are generally low and close to zero. This indicates that the direct economic impact of geopolitical shocks is relatively limited. However, such shocks may transmit volatility through complex indirect channels, highlighting the necessity of dynamic analysis to further explore their potential impacts.
Next, we analyze the time-varying characteristics of dynamic correlations across markets. Figure 4 presents the dynamic conditional correlations, while Table 7 reports their descriptive statistics, from which several features can be identified. Within the shipping market, the correlations are significantly higher than those across other markets, indicating a closer internal linkage. For example, the dynamic correlation between BDTI and BCTI (Corr23) has a mean of 0.7748, a fluctuation range of [–0.7927, 0.9783], a standard deviation of 0.4469, and a kurtosis as high as 7.5981. This suggests substantial volatility in the correlation, far exceeding the kurtosis standard of a normal distribution. It indicates significant time variation, and the correlation may strengthen rapidly under extreme market conditions (e.g., geopolitical conflicts or capacity shortages). This finding is consistent with Tsouknidis (2016), who documented asymmetric volatility spillovers in the dry bulk market. Across markets, the shipping market and geopolitical risk show mostly positive relationships, while the oil market and geopolitical risk exhibit negative relationships. Similarly, correlations between the shipping and oil markets are generally negative. In terms of magnitude, the linkages between the shipping and oil markets are stronger than those between either of them and geopolitical risk.
Figure 4
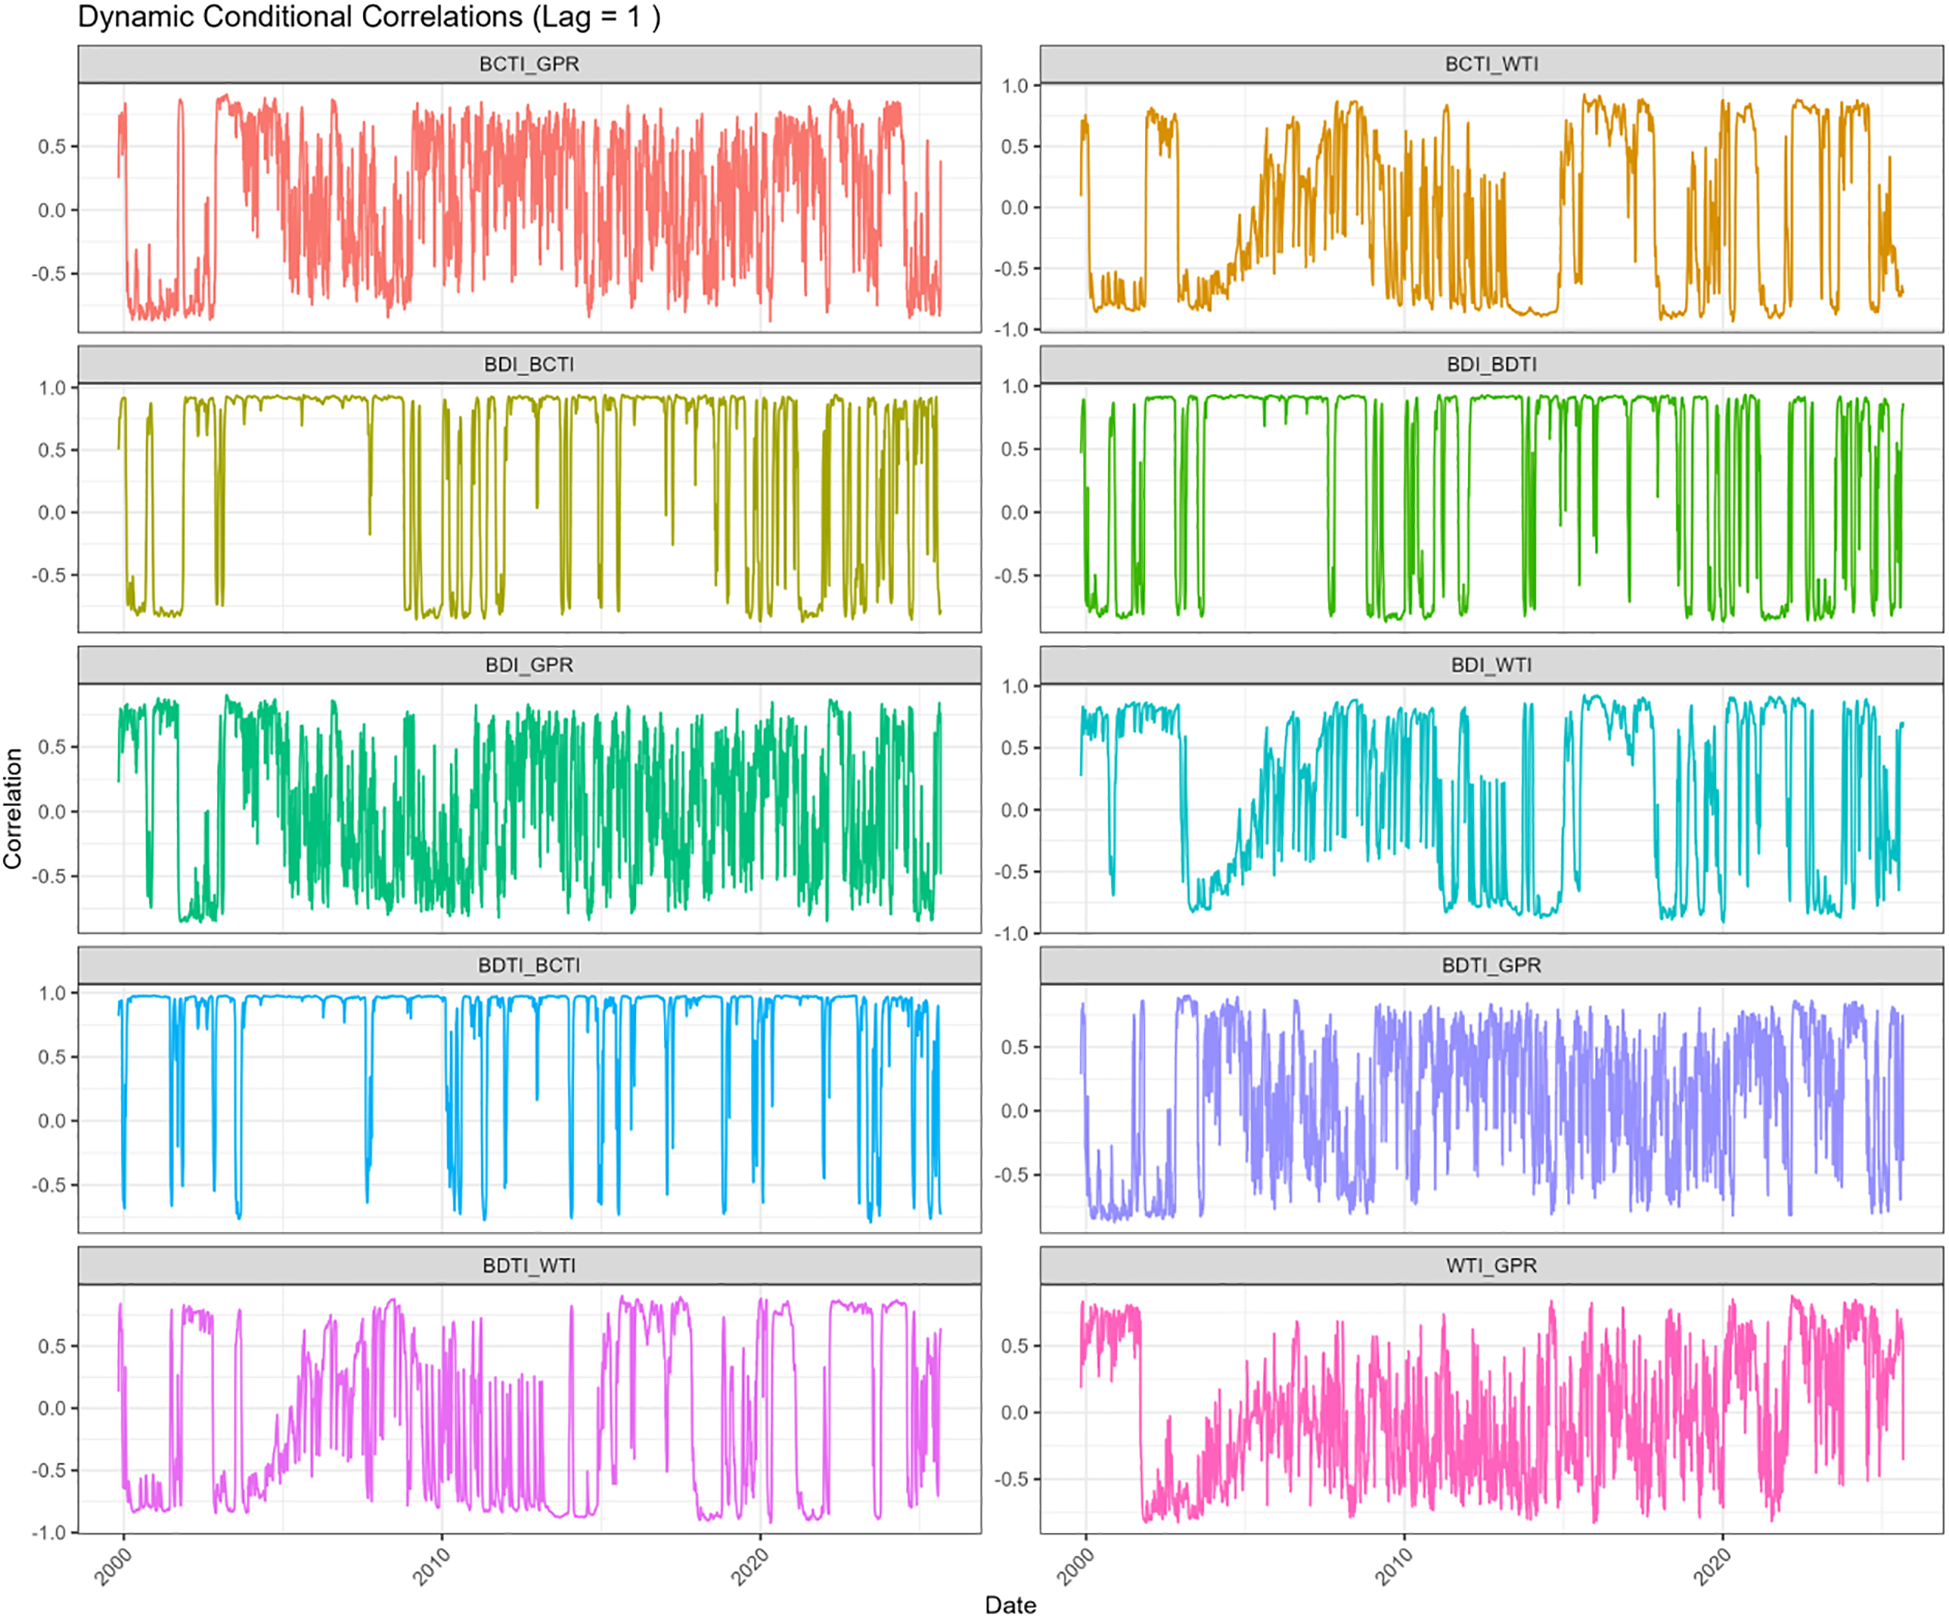
Dynamic conditional correlations.
Table 7
| Coefficient | Mean | SD | Min | Max | Skewness | Kurtosis |
|---|---|---|---|---|---|---|
| 0.3557 | 0.7331 | -0.8689 | 0.9310 | -0.7668 | 1.7207 | |
| 0.4104 | 0.7070 | -0.8767 | 0.9425 | -0.9277 | 2.0133 | |
| 0.1427 | 0.6511 | -0.9098 | 0.9267 | -0.3115 | 1.4534 | |
| 0.0580 | 0.5359 | -0.8569 | 0.8999 | -0.0981 | 1.5788 | |
| 0.7748 | 0.4469 | -0.7927 | 0.9783 | -2.4540 | 7.5981 | |
| -0.0527 | 0.6655 | -0.9220 | 0.9043 | 0.1190 | 1.3522 | |
| 0.1172 | 0.5392 | -0.8713 | 0.9009 | -0.3406 | 1.7104 | |
| -0.0943 | 0.6585 | -0.9356 | 0.9268 | 0.2011 | 1.3901 | |
| 0.0919 | 0.5404 | -0.8756 | 0.9083 | -0.2835 | 1.6656 | |
| -0.0106 | 0.4755 | -0.8274 | 0.8763 | 0.1447 | 1.7952 |
Descriptive statistics of dynamic correlations.
Labels 1–5 correspond to BDI, BDTI, BCTI, WTI, and GPR. defines the adaptive correlation coefficient for variables i and j, where specifically measures the correlation dynamics between BDI and BDTI.
Furthermore, most dynamic correlations display right-skewed distributions, suggesting that the probability of positive co-movements is slightly higher than that of negative ones. This phenomenon may be related to risk-averse behavior among market participants. During crises, institutional investors tend to adjust cross-market positions simultaneously, which may lead to stronger stock price synchronicity (Baur and McDermott, 2010). The relationship between geopolitical conflict risk and the shipping and oil markets exhibits a complex structure. For instance, the dynamic correlation between GPR and WTI (Corr45) has a mean of –0.0106, with a maximum of 0.8763 and a minimum of –0.8274. This indicates that the impact of geopolitical shocks on the oil market is event-driven. When transmission channels differ, the effects also vary: local conflicts may temporarily drive up oil prices, resulting in positive correlations, whereas long-term sanctions or demand contractions may lead to negative correlations.
Finally, to further determine whether there exists lagged effects across markets, we tested data with lags of 1, 2, 3, 4, 5 (one week), 10 (two weeks), and 20 (one month). Table 8 reports the dynamic correlation coefficients and DCC model parameters under different lag structures. By analyzing the stability of the coefficients within the shipping market (, , ), it can be observed that the information transmission efficiency within the market is relatively high. This finding is consistent with Li et al. (2014) and recent studies on the linkage between spot and forward freight markets. The estimated values of the news shock parameter and the persistence parameter in the DCC-GARCH model suggest that dynamic correlations across markets are highly persistent, while the effect of new information shocks is relatively weak. This result is consistent with Celik (2012) on dynamic correlations in emerging markets, implying that the main driver of cross-market volatility spillovers lies in historical correlations rather than contemporaneous shocks.
Table 8
| Coefficient | T-1 | T-2 | T-3 | T-4 | T-5 | T-10 | T-20 |
|---|---|---|---|---|---|---|---|
| 0.356*** | 0.355*** | 0.357*** | 0.356*** | 0.349*** | 0.348*** | 0.352*** | |
| 0.410*** | 0.412*** | 0.413*** | 0.412*** | 0.405*** | 0.405*** | 0.408*** | |
| 0.143*** | 0.146*** | 0.148*** | 0.147*** | 0.145*** | 0.143*** | 0.146*** | |
| 0.058*** | 0.059*** | 0.061*** | 0.062*** | 0.058*** | 0.066*** | 0.070*** | |
| 0.775*** | 0.774*** | 0.774*** | 0.773*** | 0.773*** | 0.775*** | 0.773*** | |
| -0.053*** | -0.055*** | -0.058*** | -0.057*** | -0.058*** | -0.057*** | -0.059*** | |
| 0.117*** | 0.116*** | 0.117*** | 0.113*** | 0.113*** | 0.107*** | 0.092*** | |
| -0.094*** | -0.095*** | -0.096*** | -0.095*** | -0.096*** | -0.097*** | -0.097*** | |
| 0.092*** | 0.091*** | 0.091*** | 0.087*** | 0.086*** | 0.080*** | 0.083*** | |
| -0.011* | -0.014** | -0.018*** | -0.008 | -0.010 | -0.014** | -0.011* | |
| 0.187*** | 0.228*** | 0.270*** | 0.256*** | 0.282*** | 0.241*** | 0.256*** | |
| 0.784*** | 0.740*** | 0.690*** | 0.707*** | 0.679*** | 0.726*** | 0.707*** |
Results of lagged correlation tests.
*p< 0.1, **p< 0.05, ***p< 0.01. In the table, 1–5 correspond to BDI, BDTI, BCTI, WTI, and GPR, respectively. denotes the dynamic correlation coefficient between variables i and j; for example, represents the dynamic correlation between BDI and BDTI.
4.3 Model robustness test
To verify the reliability of the empirical results, this study conducts robustness checks from three perspectives, all of which confirm the stability of the core findings.
First, we perform a variable substitution test by replacing WTI crude oil prices with Brent crude oil prices and re-estimating the models. The results of the DY spillover index model and the DCC-GARCH model are presented in Figure 5 and Table 9, respectively. The findings show that the time-varying trends of spillover indices, the directions of net spillovers across markets, and the overall patterns of dynamic correlations are highly consistent with the baseline results. This demonstrates that the conclusions are not sensitive to the choice of benchmark crude oil price.
Figure 5
Total volatility spillover index (DY) with Brent crude oil replacing WTI. The figure presents the results with a lag order of P = 15, a rolling window length of W = 200 days, and a forecast horizon of H = 20 days.
Table 9
| Variable | BDI | BDTI | BCTI | BRENT | GPR |
|---|---|---|---|---|---|
| BDI | 1.0000 | 0.3547 | 0.4110 | 0.1234 | 0.0577 |
| BDTI | 0.3547 | 1.0000 | 0.7681 | -0.1191 | 0.1177 |
| BCTI | 0.4110 | 0.7681 | 1.0000 | -0.1562 | 0.0934 |
| BRENT | 0.1234 | -0.1191 | -0.1562 | 1.0000 | -0.0410 |
| GPR | 0.0577 | 0.1177 | 0.0934 | -0.0410 | 1.0000 |
Dynamic correlations (DCC) with brent crude oil replacing WTI.
Second, we tested the robustness of the results by altering key parameters of the DY model, including a shorter lag order (p = 9), a shorter rolling window (w = 100 days), and a shorter forecast horizon (H = 10). The combined results, shown in Figure 6, indicate that the empirical findings are not sensitive to parameter choices.
Figure 6
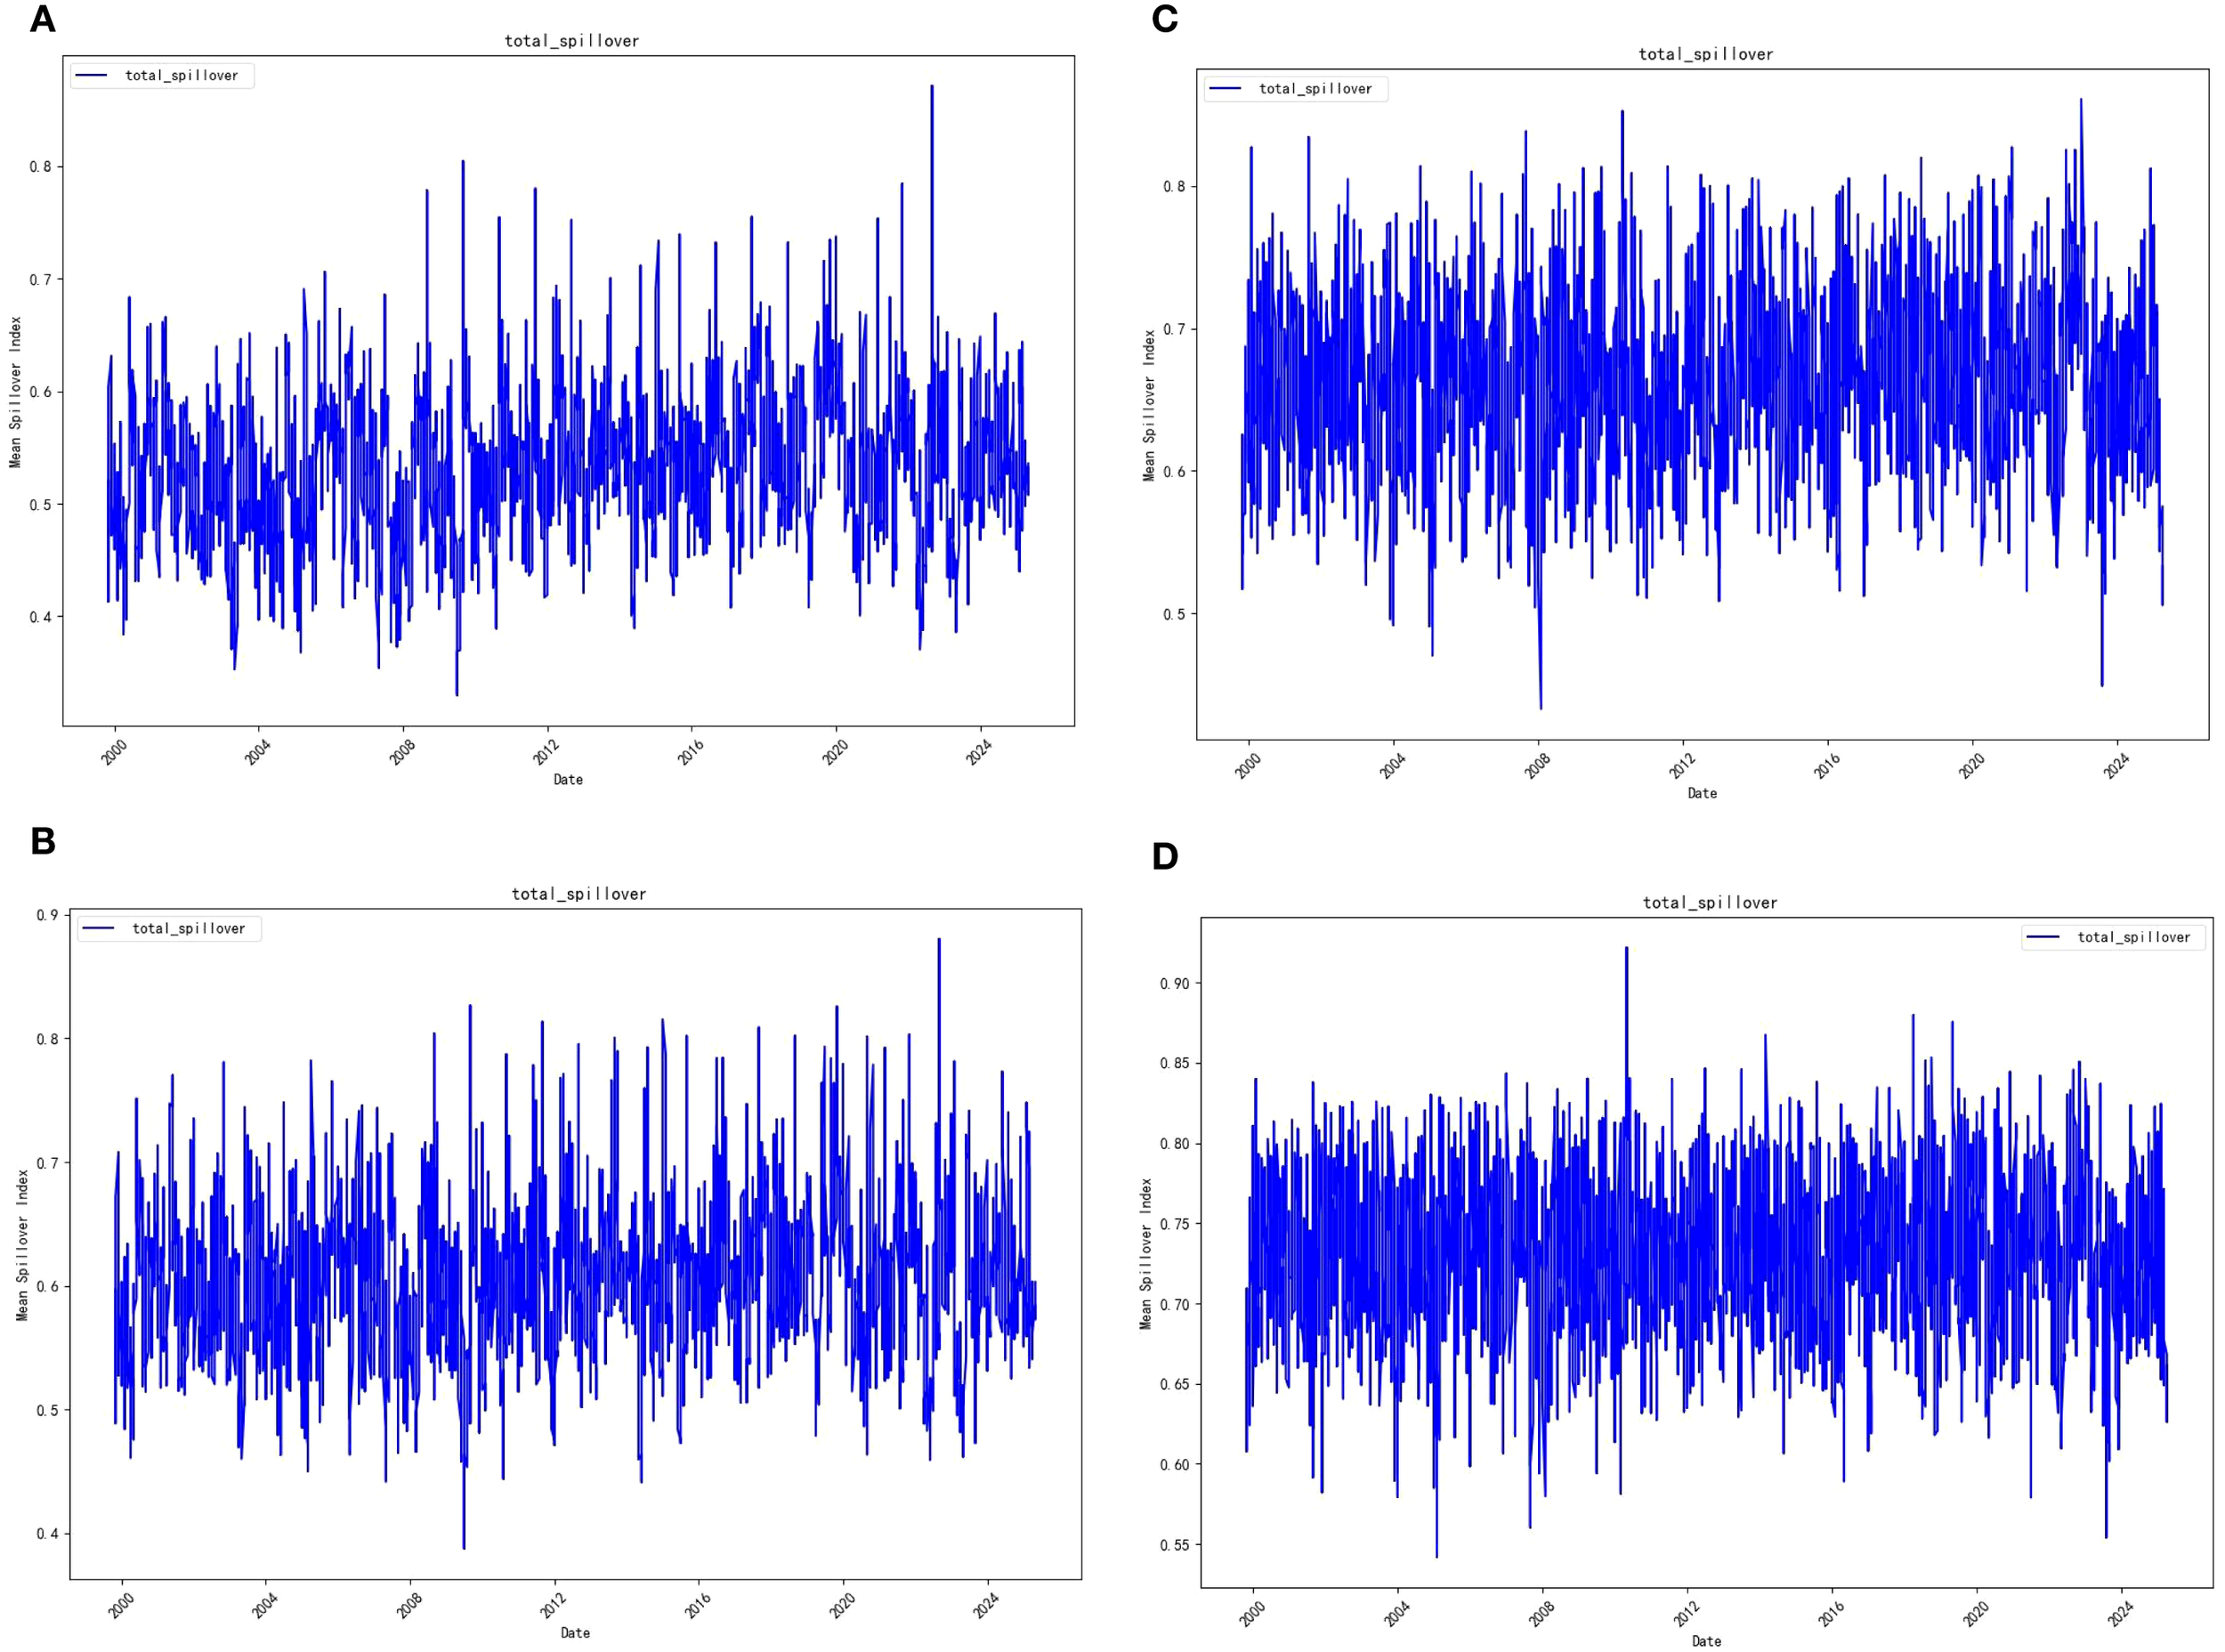
Total volatility spillover index under different parameter settings. (A). W = 75, H = 10, P = 9 (B) W = 75, H = 20, P = 9 (C) W = 100, H = 10, P = 15 (D) d. W = 100, H = 20, P = 15 Note: W denotes the rolling window length, P the lag order, and H the forecast horizon.
In addition, the full sample was divided into four key sub-periods:
-
1999–2008 (pre-global financial crisis),
-
2009–2019.11 (post-crisis period),
-
2019.12–2023.5 (COVID-19 pandemic period), and
-
2023.6–2025.8 (post-pandemic period).
The results, presented in Figure 7, show that although the absolute levels of spillovers differ across sub-periods, the underlying patterns remain unchanged: spillover effects intensify during crises and weaken during stable periods, while the relative spillover relationships among major markets remain consistent.
Figure 7
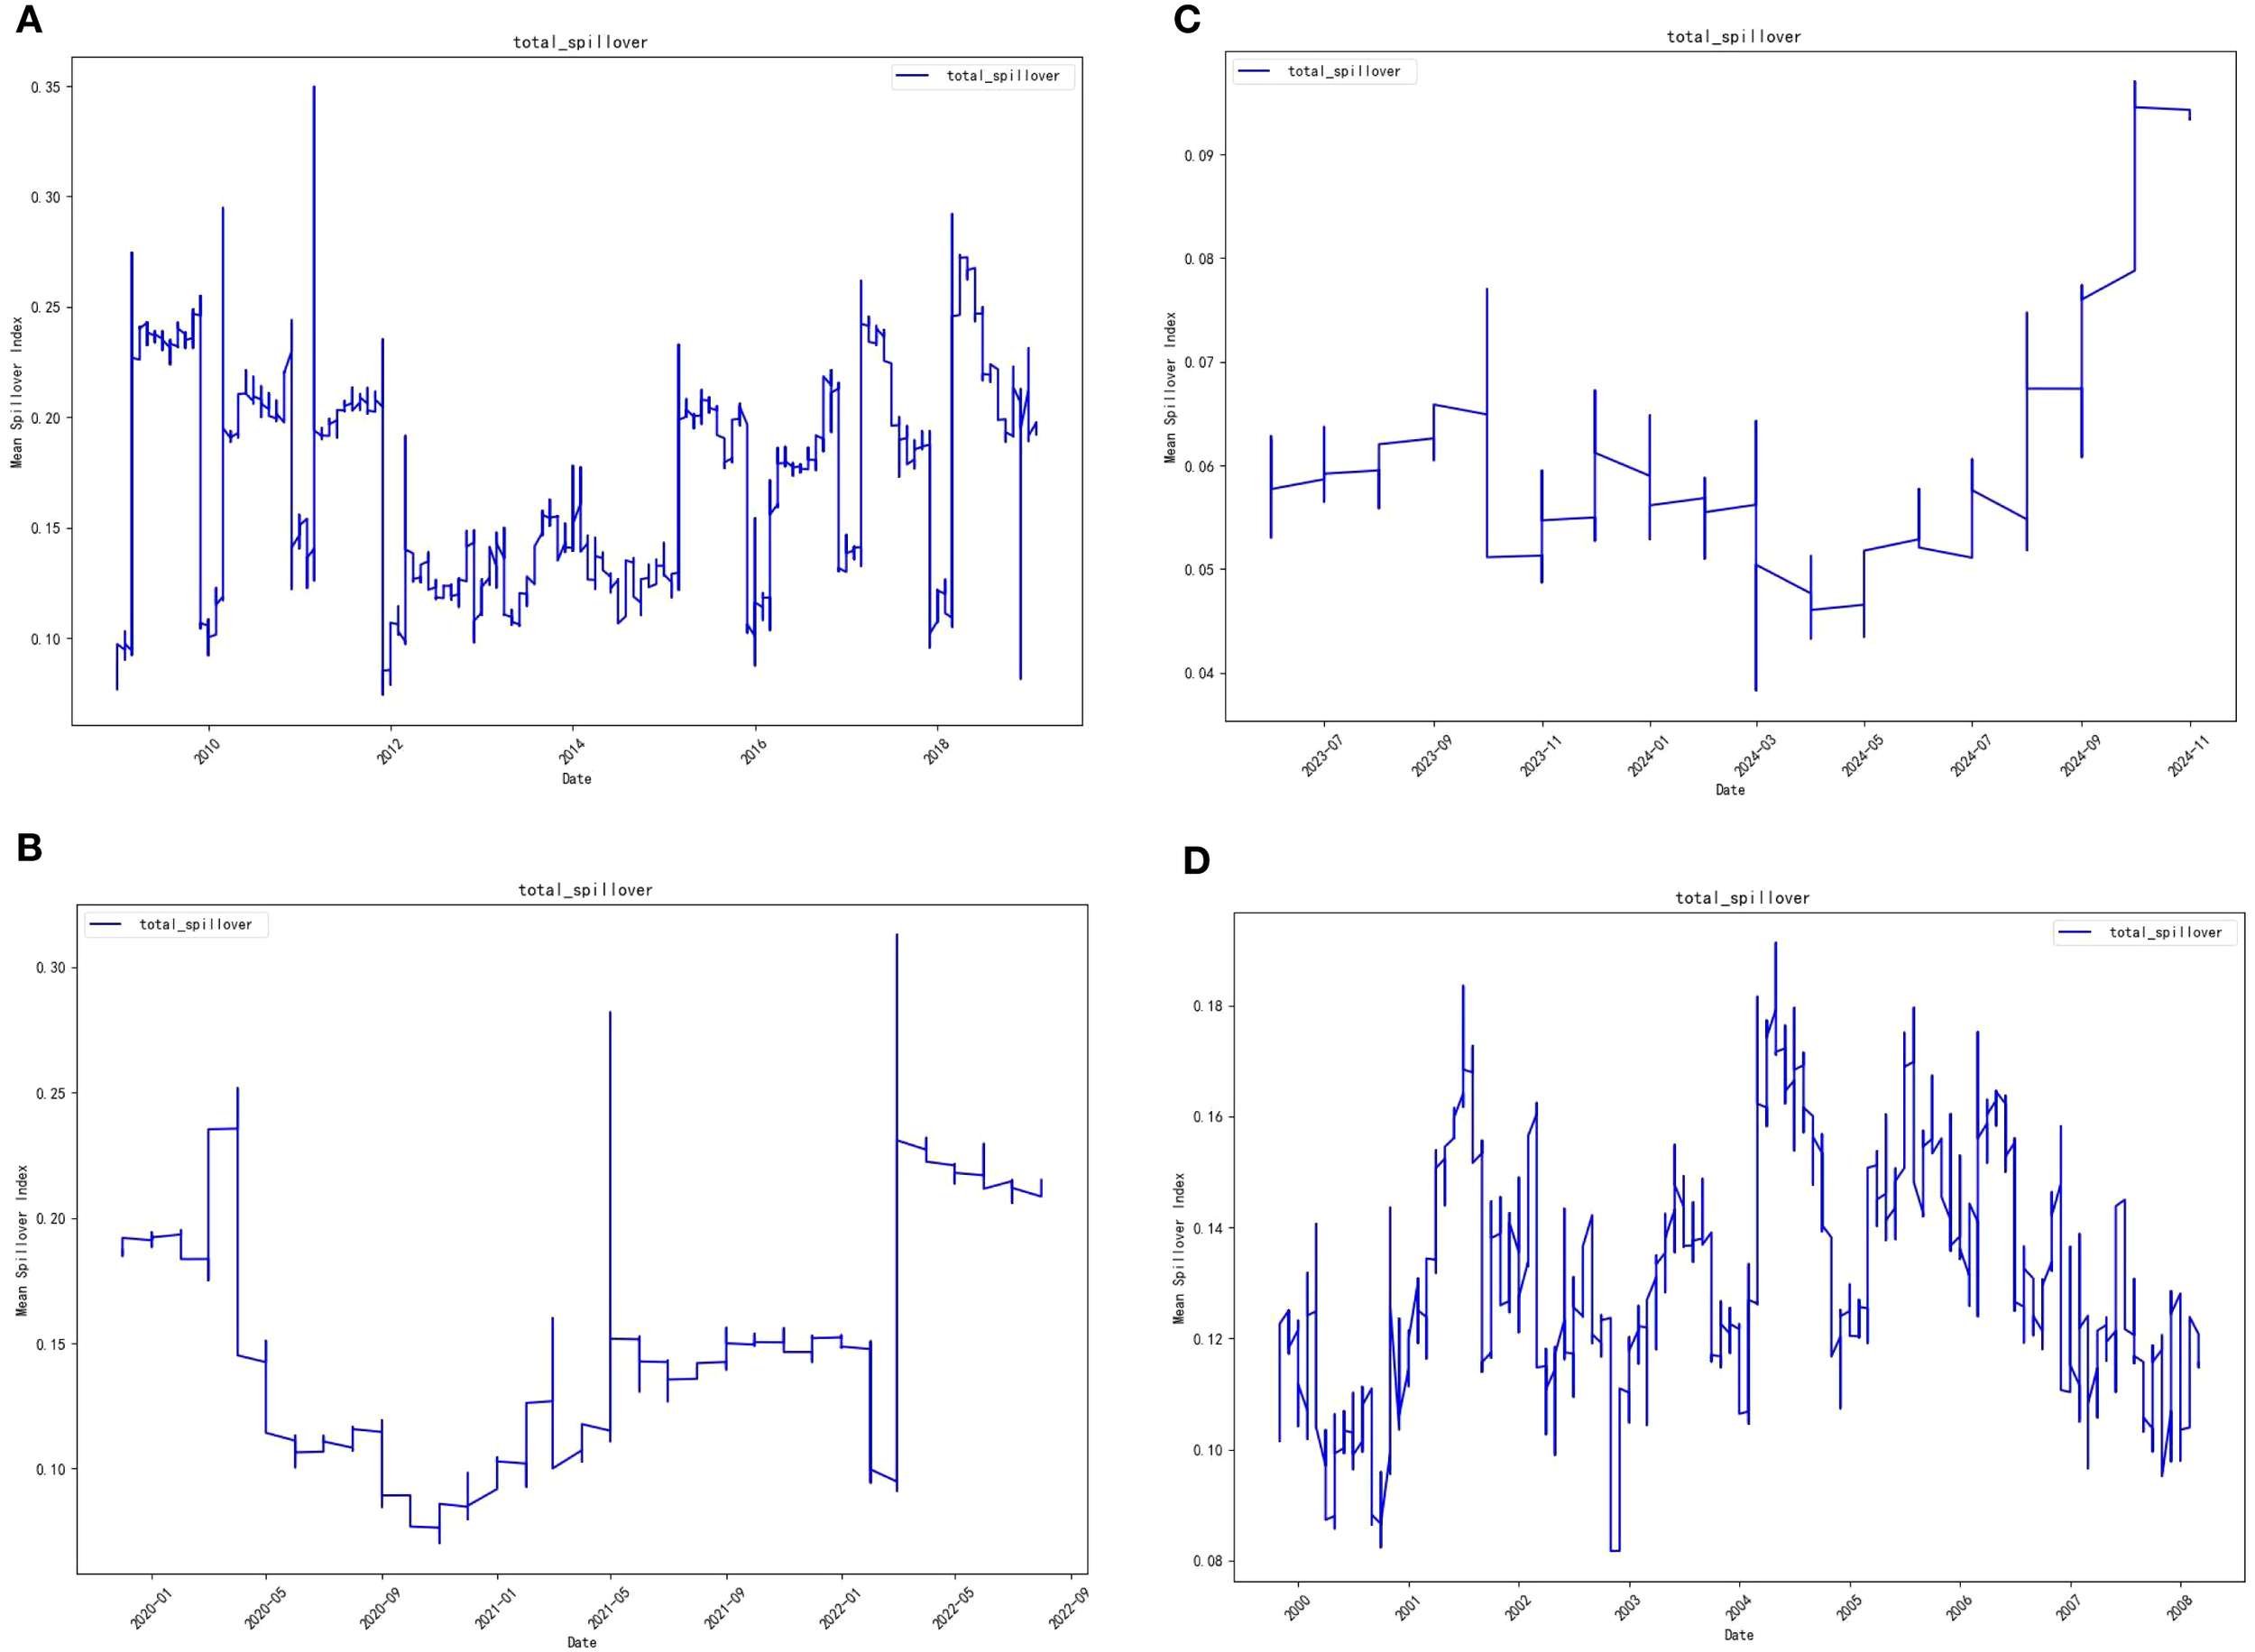
Total volatility spillover index across sub-periods. (A) 1999-2008 (B) 2009-2019.11 (C) 2019.12-2023.5 (D) 2023.6-2025.8.
In summary, the series of robustness checks fully support the reliability of the core conclusions of this study.
5 Discussion
5.1 Mechanisms through which geopolitical conflict events affect volatility spillovers
Geopolitical conflicts influence the volatility spillover effects between the international shipping and crude oil markets through multiple transmission channels. The mechanisms can be analyzed from the following three perspectives:
First, direct shocks and indirect transmissions arising from supply–demand imbalances. The DY spillover index model shows that geopolitical risk (GPR), as the main net receiver of volatility, is significantly more sensitive to external shocks than other indicators. This feature is consistent with the results of the DCC-GARCH dynamic correlation analysis, which indicates that GPR has relatively low static correlations with WTI crude oil prices under normal conditions, suggesting weak linkage in routine circumstances. However, under extreme events—such as local conflicts or prolonged sanctions—the dynamic impact of GPR on oil prices becomes significant, either driving prices sharply upward or suppressing demand. This reflects the event-driven nature of geopolitical conflict impacts: in the short term, oil supply disruptions may push prices higher, while long-term sanctions or trade restrictions may transmit negative effects via demand contraction. For example, in the early stage of the Russia–Ukraine conflict in 2022, Brent crude oil prices surged by more than 10% in a single day. Subsequently, the EU’s embargo on Russian oil caused a mismatch in shipping capacity, leading to a sharp increase in the dynamic correlations between BDTI and BCTI. This demonstrates how geopolitical shocks can reinforce market interconnectedness through supply chain restructuring, highlighting the multi-phase nature of geopolitical conflict risk: short-term panic-driven supply–demand shocks, medium-term supply chain restructuring, and long-term policy feedback.
Second, asymmetric adjustments in market participants’ behavior. The results from the DCC-GARCH model show that most dynamic correlations exhibit a right-skewed distribution, which suggests that the probability of positive co-movements is relatively higher. This finding is consistent with the theory of “flight-to-safety convergence during crises” proposed by Baur and McDermott (2010). Specifically, when geopolitical risks intensify, investors tend to simultaneously reduce their exposure to high-risk assets, thereby amplifying cross-market volatility spillovers. Further analysis reveals that this asymmetric adjustment behavior varies under different market conditions. According to the DY model, during crises, the proportion of volatility spillovers received by GPR surged sharply from below 5% in tranquil periods to about 15%. This effect is particularly evident when tensions in the Strait of Hormuz raised crude oil transportation costs and increased insurance premiums. These findings demonstrate that geopolitical risk can magnify contagion effects across markets by triggering panic sentiment among market participants. For example, during the 2019 Strait of Hormuz crisis, crude oil transportation insurance costs surged by 300%, leading to a 40% increase in the spillover intensity between BDTI and WTI in the short term (Tsouknidis, 2016). This case clearly demonstrates how geopolitical events can rapidly and sharply alter market participants’ behavior patterns as well as overall market interconnectedness. Further observation shows that the asymmetric adjustment mechanism of markets is not only shaped by sudden events but is also closely related to the intrinsic structure of the markets and investors’ risk preferences. Under relatively stable market environments, investors tend to exhibit higher risk tolerance and prefer high-yield assets, resulting in weaker market interconnectedness. However, once confronted with external shocks such as geopolitical risks, investors’ risk preferences shift abruptly toward safe-haven assets, causing capital flows to change direction and triggering heightened volatility and cross-market risk transmission. This behavioral shift not only reflects the sensitivity of market participants to risk, but also reveals the fragility and complexity of financial markets when exposed to external shocks. Future research could further explore the interactions among these factors and examine how they influence market stability and efficiency.
Third, the lagged effects of policy responses and supply chain adjustments. The lagged correlation test results show that the correlation coefficient between BDI and GPR declines significantly at a lag of 20 periods (approximately one month) (see Table 8), revealing the lagged nature of the negative impacts of geopolitical risks. This phenomenon may stem from delays in policy interventions (e.g., approvals for route changes) or in supply chain restructuring (e.g., energy-importing countries shifting to alternative suppliers). For example, following the Suez Canal blockage in 2021, although the BDI’s daily volatility surged in the short term, the negative spillover effect of GPR on BDI became significant only about three weeks after the event. This further confirms the role of supply chain resilience in buffering volatility transmission (Celik, 2012). Further analysis shows that the lagged effects of policy responses and supply chain adjustments exert multifaceted impacts on markets. On one hand, policy formulation and implementation typically require time to assess and address complex situations. For instance, approvals for rerouting permits involve coordination across multiple agencies and must balance safety, economic, and other considerations, leading to delayed policy responses. On the other hand, supply chain restructuring requires firms to reassess suppliers, adjust transport routes, and revise production plans—a process that is both complex and time-consuming. In critical sectors such as energy, importing countries face challenges such as infrastructure compatibility and cost considerations when shifting to alternative suppliers (Xiao et al., 2025).
5.2 Discussion of the impact of other major events
During the sample period, aside from geopolitical conflicts, systemic events such as financial crises and pandemics also influenced volatility spillovers through differentiated transmission channels (Hynes et al., 2020; Laborda and Olmo, 2021; Balli et al., 2022). This study does not explicitly control for these events, but their impacts are discussed based on their timing. During the 2008 global financial crisis, the DY model shows that the total volatility spillover index surged from a low of 0.25 to 0.6, far exceeding the sample mean of 35.02%. The DCC-GARCH dynamic analysis further reveals that the dynamic correlations between BDTI and BCTI spiked during this period, while the spillover intensity received by GPR increased by about 200%. This phenomenon can likely be attributed to cross-market fire sales triggered by liquidity squeezes: financial institutions, in order to meet margin calls, simultaneously reduced positions in both shipping derivatives and crude oil futures, thereby driving up co-movements in volatility. Unlike geopolitical conflicts, the volatility transmission of a financial crisis is global and instantaneous. The DY model shows that during the crisis, the “To others” spillover values of all markets increased by more than 50%, whereas the impact of geopolitical conflicts tends to be more regional in nature (e.g., stronger co-movements primarily between GPR and WTI).
During the initial stage of the COVID-19 pandemic (late 2019 to 2020), the DY model shows that the net spillover value of the BDI dropped below its average of 0.35. The DCC-GARCH model, however, indicates that the dynamic correlation between BDI and WTI surged above 0.5, significantly higher than its mean, and was statistically significant at the 1% level. This phenomenon may reflect the resonance effect between shrinking demand (particularly for crude oil) and excess shipping capacity. Unlike the financial crisis, the pandemic shock directly suppressed commodity trade volumes by halting real economic activity, thereby weakening the shipping market’s ability to export volatility (Barua, 2020; Notteboom et al., 2021). However, as central banks across countries implemented quantitative easing, economic indicators began to recover in the second half of 2020. This demonstrates that policy interventions via liquidity injections helped, to some extent, restore the market co-movement mechanisms (Li et al., 2014; Wang et al., 2025).
6 Conclusion
Using the DY spillover index model and the DCC-GARCH model, this paper systematically analyzes the volatility spillover effects among geopolitical conflict risk, the shipping market, and the crude oil market, yielding the following main conclusions: First, there exist significant bidirectional spillover effects among the three. Within the shipping market, volatility spillovers among dry bulk freight rates, crude oil tanker freight rates, and product tanker freight rates are the strongest, reflecting the close internal relationships of the sector. In addition, the volatility spillover effects between the crude oil market and geopolitical conflict risk are also notable. However, compared with geopolitical risk, the spillover effects between the shipping and crude oil markets are more pronounced. Second, the relationships between geopolitical conflict risk and the shipping and crude oil markets are complex, showing different positive or negative linkages under different transmission mechanisms. These relationships are characterized by asymmetry and time variation. The transmission mechanisms operate through multiple channels, including direct shocks from supply–demand imbalances, adjustments in investor sentiment and expectations, and the lagged effects of policy responses and supply chain restructuring.
The research findings provide valuable references for policymakers in formulating energy security policies and shipping risk management strategies, while also helping market participants better cope with risks arising from geopolitical uncertainty. For policymakers, it is imperative to enhance real-time monitoring of the dynamic interactions between the shipping and crude oil markets, and to integrate geopolitical risks into early warning mechanisms for energy security, shipping security and supply chain resilience. To address risks associated with geopolitical conflicts, policymakers should establish cross-national information-sharing and early warning systems, promote the development of regional risk monitoring platforms, and consolidate military, intelligence, and commercial shipping data to periodically publish maritime route risk assessments. In the event of major risk incidents, the calibrated release of strategic petroleum reserves may be considered to alleviate market panic induced by supply disruptions. Furthermore, international marine insurance organizations should be encouraged to collaborate in implementing differentiated war risk insurance premium rates and subsidy mechanisms, thereby guiding enterprises through market-based approaches to prioritize safer shipping routes and mitigate systemic risks. For shipping and energy companies, it is advisable to establish dynamic hedging strategies against geopolitical risks. Examples include implementing cross-market hedging through Forward Freight Agreements (FFAs) and crude oil futures, and optimizing hedging timing by incorporating sentiment indicators such as the GPR index. In addition, companies should strengthen the management of Contracts of Affreightment (COAs) and introduce flexible clauses to address potential co-movement volatility in freight rates and oil prices. For investors, asset allocation should take into account the amplifying effect of geopolitical risk on volatility spillovers across markets. It is important to avoid excessive exposure to highly correlated asset portfolios during crises, while actively exploring volatility derivatives and other risk management instruments.
This study is not without limitations. Methodologically, although the DY and DCC-GARCH models effectively capture mean spillovers and time-varying correlations, they are less capable of characterizing tail dependencies under extreme risk events, and they do not fully account for potential estimation biases arising from structural breaks. Future research could adopt approaches such as Quantile Spillover models or mixed-frequency Copula models to further investigate asymmetric spillover mechanisms. In terms of mechanism identification, while this paper analyzes spillover channels from multiple perspectives, it does not quantify the relative contributions of each transmission pathway. Subsequent studies may consider combining structural VAR models or mediation effect models to decompose and test the influence of different channels. From a data perspective, future work could incorporate finer-grained regional geopolitical risk indices, capacity data by vessel type, and crude oil trade flow data, thereby enabling better identification of regional heterogeneity and micro-level transmission mechanisms.
Statements
Data availability statement
The original contributions presented in the study are included in the article/supplementary material. Further inquiries can be directed to the corresponding author.
Author contributions
XC: Project administration, Writing – original draft, Writing – review & editing. RZ: Data curation, Methodology, Writing – review & editing. YC: Data curation, Software, Visualization, Writing – review & editing. GX: Funding acquisition, Resources, Supervision, Writing – review & editing.
Funding
The author(s) declare financial support was received for the research and/or publication of this article. This research was funded by National Natural Science Foundation of China, grant number 52472323.
Conflict of interest
The authors declare that the research was conducted in the absence of any commercial or financial relationships that could be construed as a potential conflict of interest.
GX declared that they were an editorial board member of Frontiers, at the time of submission. This had no impact on the peer review process and the final decision.
Generative AI statement
The author(s) declare that no Generative AI was used in the creation of this manuscript.
Any alternative text (alt text) provided alongside figures in this article has been generated by Frontiers with the support of artificial intelligence and reasonable efforts have been made to ensure accuracy, including review by the authors wherever possible. If you identify any issues, please contact us.
Publisher’s note
All claims expressed in this article are solely those of the authors and do not necessarily represent those of their affiliated organizations, or those of the publisher, the editors and the reviewers. Any product that may be evaluated in this article, or claim that may be made by its manufacturer, is not guaranteed or endorsed by the publisher.
References
1
Afonso A. Alves J. Monteiro S. (2024). Beyond borders: Assessing the influence of Geopolitical tensions on sovereign risk dynamics. Eur. J. Political Economy83, 102550. doi: 10.1016/j.ejpoleco.2024.102550
2
Ahmed F. Sohag K. (2025). Spillover effects of separated oil price shocks on regional financial stress amidst Russia–Ukraine and global geopolitical tensions: a novel GVAR approach. Eurasian Econ Rev. 1-47. doi: 10.1007/s40822-025-00329-8
3
Alexandridis G. Kavussanos M. G. Kim C. Y. Tsouknidis D. A. Visvikis I. D. (2018). A survey of shipping finance research: Setting the future research agenda. Transportation Res. Part E: Logistics Transportation Rev.115, 164–212. doi: 10.1016/j.tre.2018.04.001
4
Aropelto N. (2025). The Impact of Geopolitical Crises on the Global Economy: the significance of specific trade routes during times of geopolitical crises.urn.fi/URN: NBN:fi:amk-202505028742
5
Balli F. Balli H. O. Hasan M. Gregory-Allen R. (2022). Geopolitical risk spillovers and its determinants. Ann. Reg. Sci.68, 463–500. doi: 10.1007/s00168-021-01081-y
6
Barua S. (2020). Understanding coronanomics: the economic implications of the coronavirus (COVID-19) pandemic. SSRN J. doi: 10.2139/ssrn.3566477
7
Baumeister C. Hamilton J. D. (2019). Structural interpretation of vector autoregressions with incomplete identification: Revisiting the role of oil supply and demand shocks. Am. Economic Rev.109, 1873–1910. doi: 10.1257/aer.20151569
8
Baumeister C. Kilian L. (2016). Understanding the decline in the price of oil since june 2014. J. Assoc. Environ. resource economists. 3 (1), 131–158. doi: 10.1086/684160
9
Baur D. G. McDermott T. K. (2010). Is gold a safe haven? International evidence. J. Banking Finance34, 1886–1898. doi: 10.1016/j.jbankfin.2009.12.008
10
Bollerslev T. (1986). Generalized autoregressive conditional heteroskedasticity. J. econometrics31, 307–327. doi: 10.1016/0304-4076(86)90063-1
11
Brito D. Jaffe A. M. (2005). Reducing vulnerability of the strait of hormuz. In: SokolskiH. D.ClawsonP. (eds) Getting Ready for a Nuclear-Ready Iran. Carlisle, PA: Strategic Studies Institute, U.S. Army War College. pp. 209–224. Available online at: https://press.armywarcollege.edu/monographs/727/
12
Broadstock D. C. Filis G. (2014). Oil price shocks and stock market returns: New evidence from the United States and China. J. Int. Financial Markets Institutions Money33, 417–433. doi: 10.1016/j.intfin.2014.09.007
13
Caldara D. Iacoviello M. (2022). Measuring geopolitical risk. Am. Economic Rev.112, 1194–1225. doi: 10.1257/aer.20191823
14
Celik S. (2012). The more contagion effect on emerging markets: The evidence of DCC-GARCH model. Economic Model.29, 1946–1959. doi: 10.1016/j.econmod.2012.06.011
15
Chen S. Hao S. Meng B. Zhang Y. Kuang H. (2025). Revisiting oil and tanker shipping markets: The role of geopolitical risk in shaping spillover dynamics. Energy321, 135494. doi: 10.1016/j.energy.2025.135494
16
Dalsøren S. B. Endresen Ø. Isaksen I. S. A. Gravir G. Sørgård E. (2007). Environmental impacts of the expected increase in sea transportation, with a particular focus on oil and gas scenarios for Norway and northwest Russia. J. Geophys. Res.112, 2005JD006927. doi: 10.1029/2005JD006927
17
Dickey D. A. Fuller W. A. (1979). Distribution of the estimators for autoregressive time series with a unit root. J. Am. Stat. Assoc.74, 427–431. doi: 10.1080/01621459.1979.10482531
18
Diebold F. X. Yilmaz K. (2012). Better to give than to receive: Predictive directional measurement of volatility spillovers. Int. J. Forecasting28, 57–66. doi: 10.1016/j.ijforecast.2011.02.006
19
Drobetz W. Gavriilidis K. Krokida S.-I. Tsouknidis D. (2021). The effects of geopolitical risk and economic policy uncertainty on dry bulk shipping freight rates. Appl. Econ53, 2218–2229. doi: 10.1080/00036846.2020.1857329
20
Elsayed A. H. Helmi M. H. (2021). Volatility transmission and spillover dynamics across financial markets: the role of geopolitical risk. Ann. Oper Res.305, 1–22. doi: 10.1007/s10479-021-04081-5
21
Engle R. F. (2000). Dynamic conditional correlation: a simple class of multivariate GARCH models. SSRN Journal. doi: 10.2139/ssrn.236998
22
Engle R. F. (2000). Dynamic conditional correlation - A simple class of multivariate GARCH models. SSRN J. doi: 10.2139/ssrn.236998
23
Engle R. (2002). Dynamic conditional correlation: A simple class of multivariate generalized autoregressive conditional heteroskedasticity models. J. Business Economic Stat20, 339–350. doi: 10.1198/073500102288618487
24
Engle R. F. III Sheppard K. (2001). Theoretical and empirical properties of dynamic conditional correlation multivariate ( GARCH). doi: 10.3386/w8554
25
Gilbert R. Pearl A. (2012). Transport revolutions: moving people and freight without oil (London: Routledge). doi: 10.4324/9781849773454
26
Guo R. Xiao G. Zhang C. Li Q. (2025). A study on influencing factors of port cargo throughput based on multi-scale geographically weighted regression. Front. Mar. Sci12. doi: 10.3389/fmars.2025.1637660
27
Hamilton J. D. (2009). Causes and consequences of the oil shock of 2007-08 (No. w15002) ( National Bureau of Economic Research). doi: 10.3386/w15002
28
Hansen P. R. Lunde A. (2005). A forecast comparison of volatility models: does anything beat a GARCH (1, 1)? J. Appl. Econometrics20, 873–889. doi: 10.1002/jae.800
29
Hynes W. Trump B. Love P. Linkov I. (2020). Bouncing forward: a resilience approach to dealing with COVID-19 and future systemic shocks. Environ. Syst. Decis40, 174–184. doi: 10.1007/s10669-020-09776-x
30
Jiang B. Zhang Q. Li J. (2019). The volatility spillover effect of the international shipping market on China’s steel market. Int. Business Res.40, 20–31.CNKI: SUN : GJSJ.0.2019-06-002
31
Jiao J.-W. Yin J.-P. Xu P.-F. Zhang J. Liu Y. (2023). Transmission mechanisms of geopolitical risks to the crude oil market——A pioneering two-stage geopolitical risk analysis approach. Energy283, 128449. doi: 10.1016/j.energy.2023.128449
32
Kang S. H. McIver R. Yoon S.-M. (2017). Dynamic spillover effects among crude oil, precious metal, and agricultural commodity futures markets. Energy Econ62, 19–32. doi: 10.1016/j.eneco.2016.12.011
33
Kavussanos M. G. Alizadeh-M A. H. (2002). The expectations hypothesis of the term structure and risk premiums in dry bulk shipping freight markets. J. Transport Econ Policy (JTEP)36, 267–304.
34
Kavussanos M. G. Visvikis I. D. Dimitrakopoulos D. N. (2014). Economic spillovers between related derivatives markets: The case of commodity and freight markets. Transportation Res. Part E: Logistics Transportation Rev.68, 79–102. doi: 10.1016/j.tre.2014.05.003
35
Khan K. Su C.-W. Tao R. Umar M. (2021). How do geopolitical risks affect oil prices and freight rates? Ocean Coast. Manage.215, 105955. doi: 10.1016/j.ocecoaman.2021.105955
36
Kirkpinar A. Evrim M. (2023). A volatility spillover analysis between bond and commodity markets as an indicator for global liquidity risk. Panoeconomicus70, 71–100. doi: 10.2298/PAN180811011K
37
Kolb R. W. (2011). Geopolitical threats to world energy markets. J. Soc. Polit. Econ. Stud.36(2), 154-196.
38
Korsah D. Mensah L. (2024). Geopolitical risk, economic policy uncertainty, financial stress and stock returns nexus: evidence from African stock markets. JCMS8, 25–42. doi: 10.1108/JCMS-08-2023-0031
39
Laborda R. Olmo J. (2021). Volatility spillover between economic sectors in financial crisis prediction: Evidence spanning the great financial crisis and Covid-19 pandemic. Res. Int. Business Finance57, 101402. doi: 10.1016/j.ribaf.2021.101402
40
Li K. X. Qi G. Shi W. Yang Z. Bang H. S. Woo S. H. et al . (2014). Spillover effects and dynamic correlations between spot and forward tanker freight markets. Maritime Policy Manage.41, 683–696. doi: 10.1080/03088839.2014.958585
41
Lin A. J. (2023). Volatility contagion from bulk shipping and petrochemical industries to oil futures market during the economic uncertainty. Mathematics11, 3737. doi: 10.3390/math11173737
42
Lin A. J. Chang H. Y. Hsiao J. L. (2019). Does the Baltic Dry Index drive volatility spillovers in the commodities, currency, or stock markets? Transportation Res. Part E: Logistics Transportation Rev.127, 265–283. doi: 10.1016/j.tre.2019.05.013
43
Lütkepohl H. (2013). “ Vector autoregressive models,” in Handbook of research methods and applications in empirical macroeconomics (Cheltenham: Edward Elgar Publishing), 139–164. Available online at: https://www.elgaronline.com/edcollchap/edcoll/9780857931016/9780857931016.00012.xml.
44
Mishra A. K. Ansari Y. Bansal R. Maurya P. K. (2024). Regional and periodic asymmetries in the effect of Russia-Ukraine war on global stock markets. Heliyon10, e28362. doi: 10.1016/j.heliyon.2024.e28362
45
Monge M. Romero Rojo M. F. Gil-Alana L. A. (2023). The impact of geopolitical risk on the behavior of oil prices and freight rates. Energy269, 126779. doi: 10.1016/j.energy.2023.126779
46
Notteboom T. Pallis T. Rodrigue J.-P. (2021). Disruptions and resilience in global container shipping and ports: the COVID-19 pandemic versus the 2008–2009 financial crisis. Marit Econ Logist23, 179–210. doi: 10.1057/s41278-020-00180-5
47
Phillips P. C. Perron P. (1988). Testing for a unit root in time series regression. biometrika75, 335–346. doi: 10.1093/biomet/75.2.335
48
Qian L. Zeng Q. Li T. (2022). Geopolitical risk and oil price volatility: Evidence from Markov-switching model. Int. Rev. Econ Finance81, 29–38. doi: 10.1016/j.iref.2022.05.002
49
Ramadhani R. Marzaman A. (2024). Maritime stability in the strait of hormuz: challenges, global impacts, and multilateral diplomacy. hypothesis3, 81–96. doi: 10.62668/hypothesis.v3i02.1293
50
Rani Das K. (2016). A brief review of tests for normality. AJTAS5, 5. doi: 10.11648/j.ajtas.20160501.12
51
Rasshyvalov D. Portnov Y. Sigaieva T. Alboshchii O. Rozumnyi O. (2024). Navigating geopolitical risks: Implications for global supply chain management. Multidiscip. Rev.7, 2024spe017. doi: 10.31893/multirev.2024spe017
52
Riaz A. Xingong L. Jiao Z. Shahbaz M. (2023). Dynamic volatility spillover between oil and marine shipping industry. Energy Rep.9, 3493–3507. doi: 10.1016/j.egyr.2023.02.025
53
Salisu A. A. Lasisi L. Tchankam J. P. (2022). Historical geopolitical risk and the behaviour of stock returns in advanced economies. Eur. J. Finance28, 889–906. doi: 10.1080/1351847X.2021.1968467
54
Scholten D. Bosman R. (2016). The geopolitics of renewables; exploring the political implications of renewable energy systems. Technol. Forecasting Soc. Change103, 273–283. doi: 10.1016/j.techfore.2015.10.014
55
Shichor Y. (2008). Blocking the hormuz strait: China’s energy dilemma. China Brief. 8 (18), 8-12.
56
Silvennoinen A. Teräsvirta T. (2009). Modeling multivariate autoregressive conditional heteroskedasticity with the double smooth transition conditional correlation GARCH model. J. Financial Econometrics7, 373–411. doi: 10.1093/jjfinec/nbp013
57
Smales L. A. (2021). Geopolitical risk and volatility spillovers in oil and stock markets. Q. Rev. Econ Finance80, 358–366. doi: 10.1016/j.qref.2021.03.008
58
Stopford M. (2009). Maritime economics. 3rd ed (London ; New York: Routledge).
59
Su C.-W. Khan K. Umar M. Zhang W. (2021). Does renewable energy redefine geopolitical risks? Energy Policy158, 112566. doi: 10.1016/j.enpol.2021.112566
60
Tan X. Wang X. Ma S. Wang Z. Zhao Y. Xiang L. (2022). COVID-19 shock and the time-varying volatility spillovers among the energy and precious metals markets: evidence from A DCC-GARCH-CONNECTEDNESS approach. Front. Public Health10. doi: 10.3389/fpubh.2022.906969
61
Theodorou T. (2024). Economic and Geopolitical factors affecting the freight rates. Available online at: http://dspace.lib.uom.gr/handle/2159/30948 (Accessed September 5, 2025).
62
Tissaoui K. Abidi I. Azibi N. Nsaibi M. (2024). Spillover effects between crude oil returns and uncertainty: new evidence from time-frequency domain approaches. Energies17, 340. doi: 10.3390/en17020340
63
Tse Y. K. Tsui A. K. C. (2002). A multivariate generalized autoregressive conditional heteroscedasticity model with time-varying correlations. J. Business Economic Stat20, 351–362. doi: 10.1198/073500102288618496
64
Tsouknidis D. A. (2016). Dynamic volatility spillovers across shipping freight markets. Transportation Res. Part E: Logistics Transportation Rev.91, 90–111. doi: 10.1016/j.tre.2016.04.001
65
Wang Z. Dong Z. (2024). Volatility spillover effects among geopolitical risks and international and Chinese crude oil markets——A study utilizing time-varying networks. Resour. Policy96, 105225. doi: 10.1016/j.resourpol.2024.105225
66
Wang X. He J. (2016). A literature review on risk contagion across financial markets. Shanghai Finance7), 50–58. doi: 10.13910/j.cnki.shjr.2016.07.007
67
Wang T. Xiao G. Li Q. Biancardo S. A. (2025). The impact of the 21st-Century Maritime Silk Road on sulfur dioxide emissions in Chinese ports: based on the difference-in-difference model. Front. Mar. Sci12. doi: 10.3389/fmars.2025.1608803
68
Xiao G. Amamoo-Otoo C. Wang T. Li Q. Biancardo S. A. (2025). Evaluating the impact of ECA policy on sulfur emissions from the five busiest ports in America based on difference in difference model. Front. Mar. Sci12. doi: 10.3389/fmars.2025.1609261
69
Yıldırım D.Ç. Esen Ö. Ertuğrul H. M. (2022). Impact of the COVID-19 pandemic on return and risk transmission between oil and precious metals: Evidence from DCC-GARCH model. Resour. Policy79, 102939. doi: 10.1016/j.resourpol.2022.102939
70
Zeng H. Xu W. Lu R. (2024). Quantile frequency connectedness between crude oil volatility, geopolitical risk and major agriculture and livestock markets. Appl. Econ. 57 (25), 1–16. doi: 10.1080/00036846.2024.2337778
71
Zhang Y. He J. He M. Li S. (2023). Geopolitical risk and stock market volatility: A global perspective. Finance Res. Lett.53, 103620. doi: 10.1016/j.frl.2022.103620
Summary
Keywords
geopolitical conflict risks, shipping market, crude oil prices, volatility spillover effects, DY spillover index model, DCC-GARCH model
Citation
Chi X, Zheng R, Chen Y and Xiao G (2025) Research on the volatility spillover effects of geopolitical conflict risks on international shipping and crude oil markets. Front. Mar. Sci. 12:1647599. doi: 10.3389/fmars.2025.1647599
Received
16 June 2025
Accepted
25 September 2025
Published
21 October 2025
Volume
12 - 2025
Edited by
Tsz Leung Yip, Hong Kong Polytechnic University, Hong Kong SAR, China
Reviewed by
Mega Amelia Putri, Politeknik Pertanian Negeri Payakumbuh, Indonesia; Şerife Akıncı Tok, Zonguldak Bulent Ecevit University, Türkiye
Updates
Copyright
© 2025 Chi, Zheng, Chen and Xiao.
This is an open-access article distributed under the terms of the Creative Commons Attribution License (CC BY). The use, distribution or reproduction in other forums is permitted, provided the original author(s) and the copyright owner(s) are credited and that the original publication in this journal is cited, in accordance with accepted academic practice. No use, distribution or reproduction is permitted which does not comply with these terms.
*Correspondence: Guangnian Xiao, gnxiao@shmtu.edu.cn
Disclaimer
All claims expressed in this article are solely those of the authors and do not necessarily represent those of their affiliated organizations, or those of the publisher, the editors and the reviewers. Any product that may be evaluated in this article or claim that may be made by its manufacturer is not guaranteed or endorsed by the publisher.