Abstract
Accurate carbon emission data serve as the foundation for the effective functioning of carbon markets. However, strategic collusion driven by perceived utility values among market participants can systematically erode governance efficacy. In response to the vulnerability of shipping carbon governance systems caused by rent-seeking behavior, this study develops a tripartite evolutionary game model involving shipping companies, carbon verification agencies, and governments based on prospect theory. Using system dynamics modeling and numerical simulation, we validate the equilibrium constraints and analyze the impact of basic parameters and perceived value coefficient. The results indicate that shipping carbon governance evolves dynamically in stages across its lifecycle, driven by the formation of self-sustaining in shipping companies. Moreover, stakeholder decisions predominantly determined by cost-benefit structures, wherein ESGs’ green premiums effectively drive low-carbon transition, while the anticipated rent-seeking gains incentivize such collusion. Additionally, perceived coefficients exert differentiated moderating effects. Shipping companies’ transition decisions show negative correlations with the risk attitude and loss aversion coefficients, whereas carbon verification agencies and governments demonstrate overall positive correlations with these coefficients. Consequently, we propose a systematic governance framework to provide decision support for solving the rent-seeking dilemma and promoting a carbon governance in shipping industry.
1 Introduction
As global climate change intensifies, reducing greenhouse gas (GHG) emissions has become an urgent international priority. Maritime transport, the primary mode of global trade (Wang et al., 2021), contributes approximately 3% of global GHG emissions (Hoang et al., 2022), exerting significant impacts on climate systems. To address this, the International Maritime Organization (IMO) set an ambitious net-zero target for shipping by 2050 (IMO, 2023). Consequently, governments and regions worldwide are implementing coordinated policy measures, including carbon taxes (Miao et al., 2025), carbon tariffs (Jia et al., 2024b), renewable energy subsidies (Yige et al., 2025), and emissions trading systems (Liu et al., 2023). Parallelly, ESG disclosure mandates for shipping companies are being globally promoted, providing new governance mechanisms for maritime decarbonization (Zhou and Yuen, 2024).
Systemic institutional barriers and structural deficiencies are increasingly evident in shipping carbon governance. A case in point is the EU Emissions Trading System (EU ETS). EU ETS is a cap-and-trade program that sets a declining ceiling on total emissions and requires enterprises to surrender tradable allowances for each tone of GHG released. Under this institutional framework, shipping companies face operational challenges of carbon allowance allocation mechanisms. Regulations permit carbon quotas purchased via exchanges and over-the-counter markets (European Commission, 2024). Carbon pricing in EU ETS is implemented in three stages, shipping companies must submit a quota for 40% of verified emissions in 2024, rising to 70% in 2025 and 100% in 2026. Within this system, accurate emission data forms the operational foundation of carbon markets (Siddique et al., 2021; Shi, 2023), necessitating full lifecycle verification by accredited third-party verification agencies (Bai et al., 2016).
However, empirical evidence reveals strategic rent-seeking by some firms to evade environmental accountability (Haque and Islam, 2015; Luo, 2019). Concurrently, driven by economic incentives such as securing additional revenue, maintaining client relationships, and competitive pressures, carbon verification agencies (CVAs) may form strategic collusion with shipping companies (Pan et al., 2019). Compounded by potential loopholes or insufficient incentives within the regulatory environment, these factors collectively heighten the risk of systematic data inaccuracies and incentivize verifiers to deviate from their mandate of independent and objective verification. These principal-agent issues distort carbon pricing signals and trigger regulatory failures through adverse selection, ultimately eroding governance effectiveness and disrupting the regulatory framework (Wang et al., 2023). This demands an anti-rent-seeking collaborative governance framework to enable the industry’s effective low-carbon transition.
Prospect theory provides a robust framework for analyzing irrational decision-making (Githinji et al., 2023), demonstrating how actors asymmetrically perceive gains versus losses through dynamic reference point adjustments (Barberis, 2013). Complementarily, evolutionary game theory models multi-agent dynamic interactions by simulating long-term equilibrium selection among stakeholders (Brunetti et al., 2018). In shipping carbon governance, shipping companies and verification agencies, operating under risk-based cost-benefit structures, exhibit reference-dependent preferences that amplify strategic complexity (Ye et al., 2024). Integrating these theories enables precise modeling of stakeholder decision patterns and strategy evolution, thereby providing scientifically grounded insights for effective governance policies.
To address systemic vulnerabilities of shipping carbon governance caused by rent-seeking, it is of great theoretical value to analyze how governments can reconstructs stakeholder value perceptions and activate the endogenous emission reduction through incentive and constraint mechanisms. Integrating evolutionary game and prospect theory, we construct a tripartite evolutionary game model involving shipping companies, CVAs, and governments. This model reveals the dynamic influence mechanism of key parameters and perceived value coefficients on the governance system stability, and proposes optimization pathways. This study explored three core issues through model construction and numerical simulation:
-
How can a tripartite rent-seeking game model identify the evolutionary stable equilibrium in shipping carbon governance system?
-
How do key parameters including rent-seeking costs, ESG’s green premium, speculative costs, and reward and punishment intensity change system evolution pathways through threshold effects?
-
What are the mechanisms by which perceived coefficients influence the decision-making and evolutionary pathways of governance subjects?
This study holds significant value at both theoretical and practical levels. Theoretically, it elucidates the psychological decision-making mechanisms behind rent-seeking behavior in shipping carbon governance by integrating prospect theory with tripartite evolutionary game theory. Furthermore, it constructs a phase evolution model, clarifying the critical conditions required for the governance system to transition from a government-dominated regulatory regime to a market self-sustaining mechanism. Practically, the research offers a basis for governments to formulate differentiated incentive-disincentive mechanisms, thereby addressing the dilemma of unilateral governmental regulation. Additionally, it highlights the value of ESG (Environmental, Social, and Governance) principles in carbon governance, providing crucial guidance for promoting voluntary emission reductions within the shipping industry.
The remainder of this paper is organized as follows. Section 2 reviews the current research in related fields. Section 3 constructs a tripartite evolutionary game model based on prospect theory. Section 4 analyzes the evolutionary stable strategies. Section 5 employs system dynamics modeling to validate the evolutionarily stable strategies and investigate the impacts of critical parameters and perceptual value coefficients. Section 6 summarizes and presents the management implications.
2 Literature review
2.1 Research on shipping carbon emissions governance
Shipping carbon governance has become a critical research focus globally. Technological innovations primarily follow two pathways: improving vessel efficiency via system optimization and hull design innovations (Ma et al., 2025), and adopting alternative fuel such as methanol and ammonia, leveraging the energy density advantages for next-generation propulsion systems (Chiong et al., 2021). Hybrid technologies achieve synergistic carbon reduction and cost efficiency through energy recovery systems and power configuration optimization, progressively lowering the marginal abatement costs (Inal et al., 2022). However, despite their decarbonization potential, implementation persist barriers due to economic constraints, significantly diminishing shipowners’ abatement incentives (Yang et al., 2012).
Therefore, addressing these challenges requires coordinated governance. Shipping carbon emissions are governed through a collaborative model featuring government leadership, corporate implementation, and societal participation (Venus Lun et al., 2015). As critical global supply chain nodes, shipping companies drive decarbonization via green operational transitions (Zhou et al., 2026), while carriers’ and freight forwarders’ environmental performances critically determine systemic sustainability outcomes (Lai et al., 2013). Moreover, evolving national governance systems, ESG performance evaluation systems, and international regulatory frameworks provide essential institutional foundations for achieving carbon neutrality (Jia et al., 2024a; Shi et al., 2024). The collaborative governance mechanism achieves policy efficacy transmission through market-based instruments, with carbon tax and ETS serving as primary regulatory tools (Lagouvardou and Psaraftis, 2022; Xu et al., 2022). Empirical evidence confirms that carbon tax significantly incentivizes shipping companies’ technological upgrading through price signaling mechanisms (Liu et al., 2021), and expanding global carbon markets necessitate the institutional inevitability of integrating maritime transport into the ETS (Mao et al., 2024). By simultaneously reducing energy intensity and carbon intensity, these dual carbon pricing mechanisms effectively control aggregate emissions (Zhang et al., 2022).
2.2 Research on rent-seeking behavior in carbon governance
The combined implementation of carbon tax and ETS demonstrates synergistic emission reduction and macroeconomic benefits (Zhang et al., 2020; Chai et al., 2025). However, their institutional effectiveness critically depends on the data reliability of Monitoring-Reporting-Verification (MRV) mechanisms (Tang et al., 2018). Empirical evidence reveals that carbon credit fraud and enforcement gaps in MRV implementation substantially undermined ETS efficacy (Gao et al., 2020). This systemic failure stems from economically motivated CVAs, which act as regulatory agents, engaging in strategic collusion with emission companies to circumvent environmental accountability via systematic data manipulation (Wang et al., 2023). Such collusion creates significant information distortion risks for regulators (Liu et al., 2025), ultimately triggering the progressive erosion of regulatory effectiveness (Long et al., 2023).
Such strategic collusion constitutes rent-seeking behavior in economic theory, where market actors manipulate government and regulatory processes to secure disproportionate advantages (Foreman and Kleit, 2023). Within principal-agent framework, rent-seeking emerges from institutional alienation due to information asymmetry, which is manifested in market distortion, inefficient resource allocation and policy implementation deviation (Costa Junior and Garcia-Cintado, 2021). Economic incentives fundamentally drive the rent-seeking activities of carbon emission companies (Hillman, 2009), facilitated by institutional design flaws (Xu et al., 2023), regulatory gaps (Liu and Li, 2022), and the absence of binding constraints on stakeholders (Song et al., 2018). Consequently, scholars have proposed countermeasures through institutional optimization, enhanced regulatory enforcement, and improved informational transparency to mitigate rent-seeking dynamics (Zhang et al., 2024).
2.3 Evolutionary game analysis in environmental governance
Evolutionary game theory effectively simulates equilibrium strategy formation among governance stakeholders through long-term behavioral evolution, serving as a powerful analytical tool for complex system decision-making (Beck and Mahony, 2017). The fundamental strategic interactions in environmental governance emerge between regulatory enforcers and polluting enterprises (Davidson et al., 2021; Zhao et al., 2022). Through game theory modeling, Zhou et al. (2025) demonstrate that optimal equilibrium states occur when governments successfully incentivize corporate engagement in environmental governance. Conversely, active corporate participation enhances policy efficacy via positive feedback loops. Zhang et al. (2025b) developed a dynamic government and airline interaction model, demonstrating the synergistic effects of carbon trading mechanisms and subsidy policies in advancing sustainable aviation fuel development and emphasizing the scientific and regulatory effectiveness of policy design. Environmental governance inherently involves complex multi-stakeholder interactions. Through a tripartite game model encompassing governments, corporations, and the public, Chen et al. (2019) revealed that government and public collaboration significantly enhances governance outcomes, with public participation partially substituting for government oversight. Furthermore, leveraging resource endowment disparities among China, the United States and Europe, Wang and Dou (2023) employed multi-scenario simulations to analyze competitive and cooperative dynamics in carbon neutrality strategies, systematically validating the imperative for international collaboration.
Evolutionary game theory has distinct advantages in analyzing rent-seeking prevention in environmental governance systems. Pan et al. (2019) simulated the collusion between emission enterprise and third-party verification agency, which proved the necessity of the government to implement the data review mechanism. Through a game framework involving the government, ELSP and ESG rating agency, Zhang et al. (2024) revealed that regulatory incentives combined with ESG disclosure requirements significantly curb rent-seeking activities. Liu et al. (2025) conducted a comparative analysis of China’s carbon emission trading systems, demonstrating that market-oriented governance models exhibit superior rent-seeking mitigation effectiveness compared to government dominated approaches.
The current literature has extensively examined green transition pathways and carbon governance mechanisms in shipping industry. These studies reveal the implementation challenges caused by rent-seeking behaviors in emission control systems while employing evolutionary game theory to analyze the strategic interactions among governance stakeholders. However, three limitations persist in the current research: (i) The focus is on the technical feasibility of governance, with insufficient systematic analysis of the full lifecycle costs and benefits for stakeholders; (ii) Most collaborative governance frameworks concentrate on the macro-level institutional design of carbon markets, overlooking the optimization of MRV mechanisms in ETS and carbon tax. (iii) Although traditional evolutionary game models can simulate strategy choices, it fails to deeply analyze the differences in the psychologically perceived value among stakeholders in the principal-agent relationships of the shipping industry, causing deviations between model predictions and actual decisions. To address the above limitations, this study integrates prospect theory into an enhanced evolutionary game framework involving shipping companies, CVAs, and the government, revealing the dynamic influence mechanism of key profit and loss parameters and perceived value coefficients on the carbon governance system, and then proposes a mechanism optimization path for shipping carbon emission governance.
3 Tripartite evolutionary game model
3.1 Problem statement
Within shipping carbon governance, the strategic decisions of shipping companies, CVAs, and governments form an interconnected system: (1) Acting as the regulator for the carbon market, the government drives green transition in shipping through subsidies and regulatory punishments, delegating emissions monitoring to CVAs. Information asymmetry creates collusion risks between CVAs and shipping companies, potentially compromising data accuracy. (2) Serving as information intermediaries, the operational rigor of CVAs determines data reliability and policy effectiveness. However, economic incentives may prompt them to collude strategically with shipping companies. (3) Shipping companies’ transition strategy balances short-term costs with the long-term benefits of green adoption within regulations and verification requirements. However, when this balance is disrupted, they may attempt to distort audit outcomes through rent-seeking behavior. The core contradiction of this governance system lies in the conflict between the government’s goal of maximizing environmental benefits, shipping companies’ optimization of cost-benefit structures, and CVAs’ dynamic balance between verification profits and rent-seeking risks. Therefore, we develop a collaborative governance model for the shipping carbon governance system involving “shipping companies–CVAs–governments” with structural relationships shown in Figure 1.
Figure 1
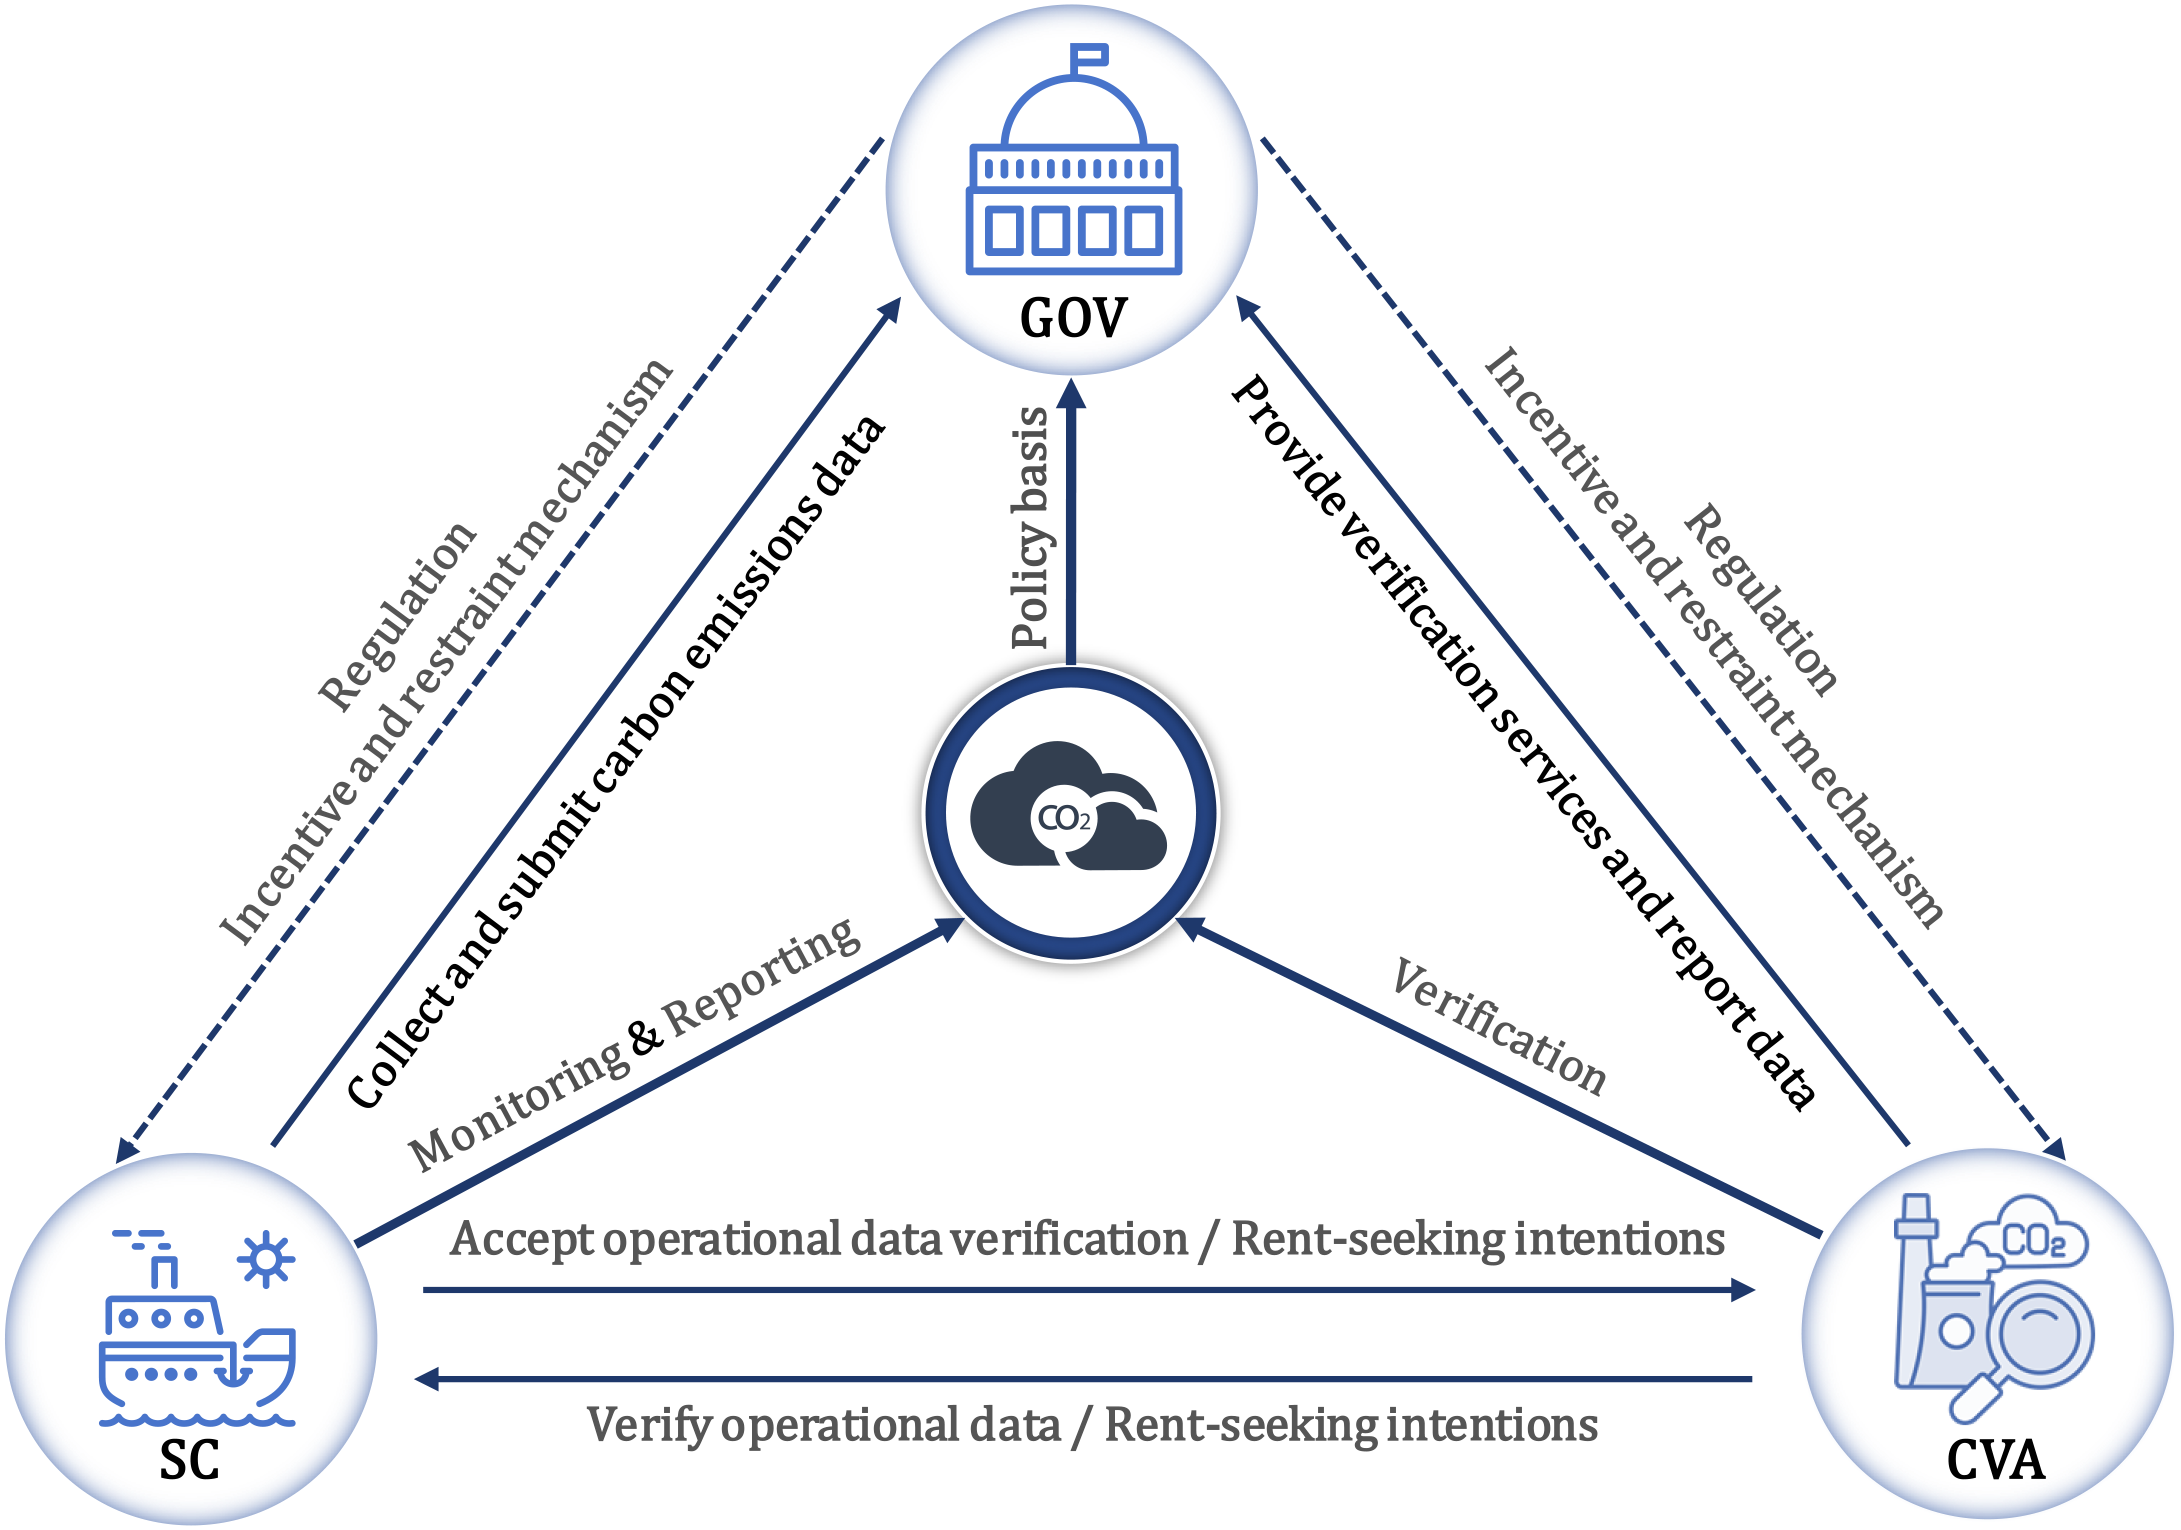
Logical framework for carbon governance in shipping industry.
3.2 Model assumptions
Assumption 1: Strategic options and probability. The shipping companies’ decision space is {low-carbon transition, high-emissions operation}, adopting ‘low-carbon transition’ with probability of x, and ‘high-emissions operation’ with , where . The CVAs’ decision space is {no rent-seeking, rent-seeking}, opting for ‘no rent-seeking’ with probability of y, and “rent-seeking” with , where . The governments’ decision space is {strict regulation, loose regulation}, implementing ‘strict regulation’ with probability of y, and ‘loose regulation’ with , where . Here, x, y, and z represent time-dependent variables that evolve throughout the strategic interaction process.
Assumption 2: Basic parameters. ① The cost for shipping companies to maintain high-emission operation is , and the basic shipping income generated is . Implementing low-carbon transition requires investments in clean energy adoption, equipment upgrades, and route optimization, these costs are quantified as . This environmentally friendly strategy conforms to the social preference for environmental protection and emission reduction, shipping companies obtain additional income, which mainly include the green premium of ESG Ratings, denoted as . Moreover, this behavior will receive green subsidies under strict regulation of the governments, which is recorded as . If the companies maintain high-emission operation and collude with CVAs to falsely claim low-carbon transition data, it illegally obtains , but incur rent-seeking costs and speculative costs, which are denoted as and , respectively. ② The cost for CVAs to operate routine verification is , and the corresponding operational income is . When facing rent-seeking behaviors from shipping companies, agencies that choose to reject rent-seeking and accurately disclose emissions data gain government rewards, which is recorded as . If intending to seek rent and assistance by falsifying fuel consumption data and voyage records, the agencies gain rent-seeking income from shipping companies and bear speculative costs quantified as , where ensures a net benefit from such misconduct. ③ The cost for governments to adopt strict regulation is , and this behavior yields social credibility benefits is . Governments can derive environmental benefits from shipping companies’ low-carbon transition, which is quantified as . If the regulation discovers that shipping companies maintain high emissions or CVAs have rent-seeking intentions, the governments will impose penalties, which are denoted as and , respectively. Under loose regulation, governments eliminate regulation costs, which are denoted as , and cannot access the decision-making information of relevant entities. This strategy yields two scenarios: (i) Accountable enforcement, where penalties are applied if the companies maintain high emissions, but CVAs reject rent-seeking. (ii) Systemic failure: Strategic rent-seeking between actors leads to the government being unable to effectively control shipping high emissions. Notably, regardless of whether penalties are imposed, governments must bear environmental governance costs when shipping companies maintain high emissions, which is recorded as .
Assumption 3: Prospect theory. The strategic choices of stakeholders are based on their psychological value perception for gains and losses, which conforms to prospect theory. That is:
Where represents the objective probability of event i. represents the perceived value, which is composed of the value function and decision weight function . Taking the decision-maker’s expected payoff as the reference point, indicates the deviation between actual income and this benchmark: represents the psychological perception of the decision-maker as a ‘gain’, while corresponds to perceived ‘loss’. is the risk preference coefficient, which reflects the diminishing sensitivity of a decision-maker’s perceived value toward gains and losses, with values constrained to ; is the loss avoidance coefficient, which is usually set to , indicating that the decision-maker is more sensitive to losses than benefits. The cognitive law revealed by prospect theory is that individuals systematically overestimate low probability events while underestimating high probability outcomes. This behavioral pattern aligns with the bounded rationality of decision-makers operating under uncertainty.
Assumption 4: Parameter classification. Prospect theory posits that decision-makers exhibit no value perception bias in the face of certain gains or losses; cognitive biases arise only when the outcomes are uncertain. In the baseline model, deterministic gains or losses include the costs of high-emission operation and fundamental shipping revenue for shipping companies, routine verification costs and operational income for CVAs, strict regulation costs for governments, and incentives or penalties tied to stakeholder behavior. Based on related literatures (Yong et al., 2024; Zhang et al., 2025a), uncertain gains or losses encompass low-carbon transition costs and ESGs’ green premiums , rent-seeking costs , speculative costs for shipping companies , speculative costs for CVAs , environmental benefits , social credibility benefits and environmental governance costs . These are perceived values, denoted as , , , , , , and in turn.
The parameters and descriptions of the game model are presented in Table 1.
Table 1
| Parameter | Descriptions | Parameter | Descriptions | ||
|---|---|---|---|---|---|
| Basic model | the cost for shipping companies to maintain high-emission operation | Basic model | government penalties for shipping company to adopt high-emission operation | ||
| the basic shipping income for shipping companies | government penalties for CVA to implement rent-seeking strategy |
||||
| the transition cost for shipping companies to adopt low-carbon transition | environmental governance costs for governments | ||||
| the income for shipping companies to adopt low-carbon transition, which includes ESG’s green premium | Perceived value | risk preference coefficient, | |||
| government green subsidies for shipping companies to adopt low-carbon transition | loss avoidance coefficient, | ||||
| the rent-seeking costs for shipping companies the rent-seeking incomes for CVAs |
the perceived loss for shipping company to adopt low- carbon transition |
||||
| the speculative costs for shipping companies | the perceived gain for shipping company to adopt low- carbon transition |
||||
| the costs for CVAs to operate routine verification | the perceived loss of rent-seeking for shipping company the perception gains of rent-seeking for CVA | ||||
| the income for CVAs to operate routine verification | |||||
| government rewards for CVAs to reject rent-seeking | the perceived loss of speculation for shipping company | ||||
| the speculative costs for CVAs to implement ren-seeking | the perceived loss of speculation for CVA | ||||
| the cost for governments to adopt strict regulation | the perceived gain of social credibility for government | ||||
| the social credibility benefits for governments to adopt strict regulation | the perceived gain of environmental benefits for governments | ||||
| the environmental benefits from shipping companies’ low-carbon transition | the perceived loss of environmental governance for governments | ||||
Model parameters and descriptions.
3.3 Model construction
Based on the above assumptions and combined with real game scenarios, we construct the mixed strategy game matrix, as shown in Table 2.
Table 2
| Shipping companies | CVAs | Governments | |
|---|---|---|---|
| Strict regulation | Loose regulation | ||
| Low-carbon transition |
No rent-seeking | , , | , , |
| Rent-seeking | , , | , , | |
| High-emission operation |
No rent-seeking | , , | , , |
| Rent-seeking | , , | , , | |
Payoff matrix.
4 Strategy stability analysis
4.1 Strategy stability analysis of shipping companies
Based on the payoff matrix in Table 2, the expected payoff for shipping companies adopting the ‘Low-carbon transition’ is denoted as , the expected payoff for adopting the ‘High-emission operation’ is denoted as , and the average expected payoff is denoted as :
According to the Equations 1–3, the corresponding replicator dynamics equation for shipping companies is derived as follows:
According to the operation rule of the value function, the uncertain gains and losses including , , , are iteratively calculated and substituted into Equation 4. We can obtain the replication dynamic equation under prospect theory and its first-order derivative with respect to x, which are presented in Equations 5, 6, respectively:
To analyze the strategy stability of shipping companies, we assume that . According to the stability theorem of differential equations, to achieve the optimal state of the dynamic game for shipping companies, x must satisfy the necessary conditions that , and . For , we can get is an increasing function of y. When , the system satisfies conditions that and , and all x are stable states, which demonstrate that there is no significant correlation between the probability of ‘low-carbon transition’ and expected payoff for shipping companies. When , the strategy of ‘low-carbon transition’ is stable in the two situations: (i) When , then and , it can be concluded that ‘high-emission operation’ () is the evolutionary stable strategy (ESS). (ii) When , then and , it can be concluded that ‘low-carbon transition’ () is the ESS. Consequently, the evolutionary process of shipping companies’ strategies is shown in Figure 2.
Figure 2
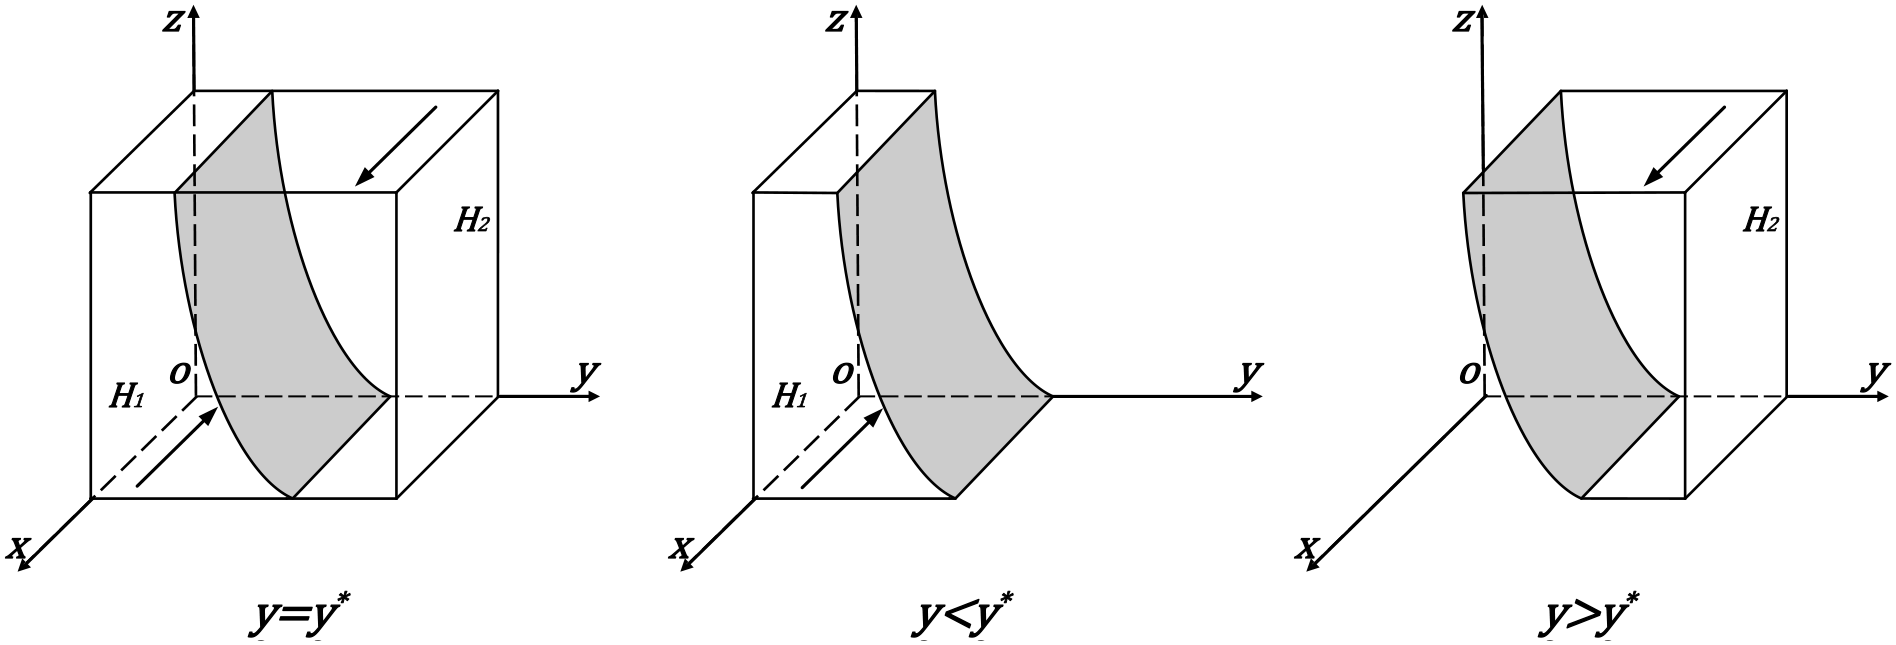
The evolutionary process of shipping companies’ strategies.
4.2 Strategy stability analysis of CVAs
The expected payoffs for CVAs adopting the ‘no rent-seeking’ strategy and the ‘rent-seeking’ strategy are denoted as and , and the average expected payoff is denoted as :
According to the Equations 7–9, the corresponding replicator dynamics equation for CVAs is derived as follows:
According to the operation rule, , are iteratively calculated and substituted into Equation 10 to obtain the replication dynamic equation under prospect theory and its first-order derivative with respect to y, which are presented in Equations 11, 12, respectively:
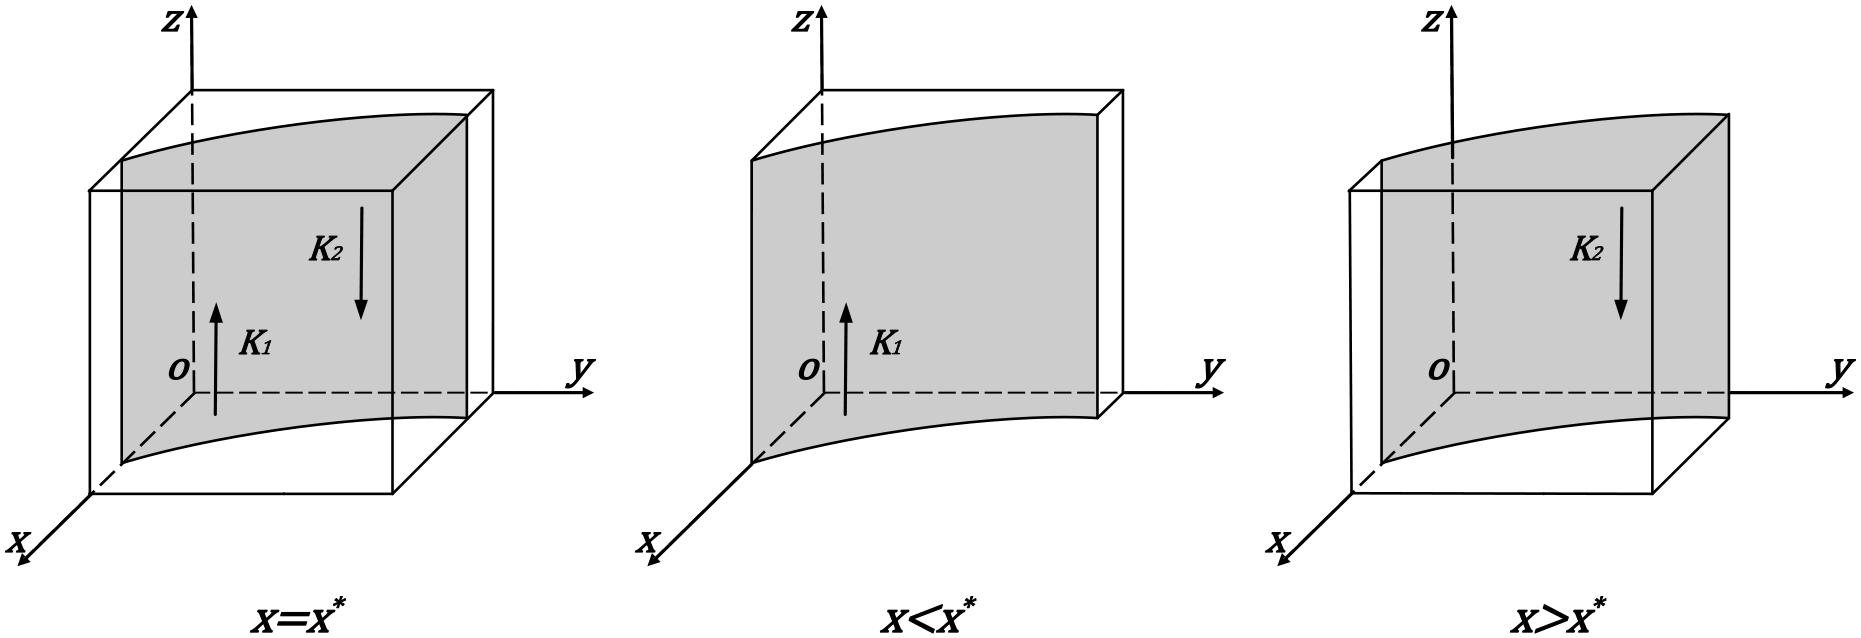
To analyze the strategy stability of shipping companies, we assume that . According to the stability theorem of differential equations, to achieve the optimal state of the dynamic game for CVAs, y must satisfy the necessary conditions that , and . For , we can get is an increasing function of y. When , the system satisfies the conditions that and , then all y are stable states, which demonstrates that there is no significant correlation between the probability of ‘no rent-seeking’ and the expected payoff for CVAs. When , the strategy of ‘no rent-seeking’ is stable in the two situations: (i) When , then and , it can be concluded that ‘rent-seeking’ () is the ESS. (ii) When , then and , it can be concluded that ‘no rent-seeking’ () is the ESS. Consequently, the evolutionary process of the CVAs strategies is shown in Figure 3.
Figure 3
The evolutionary process of CVAs strategies.
4.3 Strategy stability analysis of governments
The expected payoff for the governments adopting the ‘strict regulation’ strategy and the ‘loose regulation’ strategy are denoted as and , and the average expected payoff is denoted as :
According to the Equations 13–15, the corresponding replicator dynamics equation for governments is derived as follows:
is iteratively calculated and substituted into Equation 16 to obtain the replication dynamic equation under prospect theory and its first-order derivative with respect to z, which are presented in Equations 17, 18, respectively:
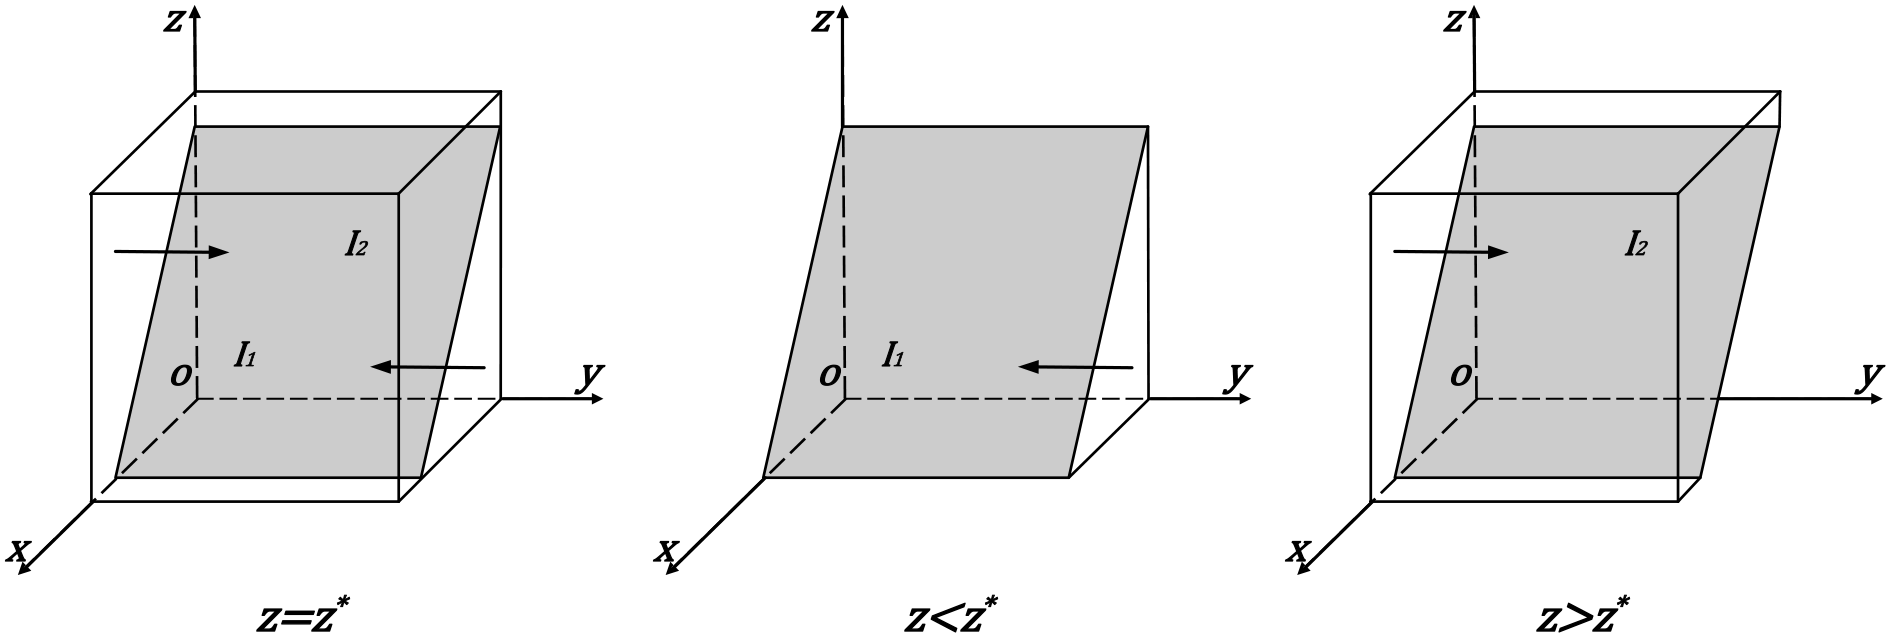
To analyze the strategy stability of governments, we assume that . According to the stability theorem of differential equations, to achieve the optimal state of the dynamic game for governments, z must satisfy the necessary conditions that , and . For , we can get is a decreasing function of z. When , the system satisfies conditions that and , then all z are stable states, which demonstrate that there is no significant correlation between the probability of ‘strict regulation’ and expected payoff for governments. When , the strategy of ‘strict regulation’ is stable in the two situations: (i) When , then and , it can be concluded that ‘strict regulation’ () is the ESS. (ii) When , then and , it can be concluded that ‘loose regulation’ () is the ESS. Consequently, the evolutionary process of governments strategies is shown in Figure 4.
Figure 4
The evolutionary process of governments strategies.
4.4 Analysis of evolutionary stable strategy
Based on the replicated dynamic Equations 5, 11, and 17, the three-dimensional dynamic system is described as:
Let , , , and solve to obtain eight pure strategy equilibrium points are as follow: , , , , , , and . In addition, there are several mixed strategy equilibrium points in the system. Because the mixed strategy equilibrium points do not satisfy the constraint conditions required by the strict Nash equilibrium definition based on the Lyapunov stability criterions (Parks, 1992), these points are not considered.
According to the research conclusion of Friedman (1991), we can determine the stability of the equilibrium strategies by judging the eigenvalues of the Jacobian matrix, and then obtain the ESS of the game system. The Jacobian matrix of the tripartite evolutionary game system is as follows:
The Lyapunov stability criterions demonstrate that: (i) If all eigenvalues of the Jacobian matrix have negative real parts, the equilibrium point is asymptotically stable. (ii) If at least one eigenvalue has a positive real part, the equilibrium point is unstable. (iii) When eigenvalues all have negative real parts except those with zero real parts, the equilibrium is in a critical case where stability cannot be determined solely by the eigenvalues’ signs. We conducted a detailed analysis of the stability of each equilibrium point, as shown in Tables 3, 4.
Table 3
| Equilibrium points | The eigenvalues of the Jacobian matrix | ||
|---|---|---|---|
The eigenvalues of the Jacobian matrix.
Table 4
| Equilibrium points | Symbol | Constraint conditions | Stability | ||
|---|---|---|---|---|---|
| U | + | The constraint condition ③ cannot be satisfied | Unstable | ||
| U | + | U | The constraint condition ② cannot be satisfied | Unstable | |
| U | + | U | The constraint condition ② cannot be satisfied | Unstable | |
| U | U | U | , , | ESS | |
| U | U | , , | ESS | ||
| U | + | U | The constraint condition ② cannot be satisfied | Unstable | |
| + | U | U | The constraint condition ① cannot be satisfied | Unstable | |
| U | U | , , | ESS | ||
Local stability analysis of equilibrium points.
U represents the eigenvalue symbol uncertainty.
ESS represents the equilibrium point is in an evolutionarily stable state.
Constraint conditions:① , ② , ③ .
Based on model assumptions and real practices, collusions between CVAs and shipping companies requires specific rent-seeking benefits relative to speculative costs. Such collusion becomes feasible only if the condition that is satisfied, at which point the CVAs gain motivation for rent-seeking. Among the eight equilibrium points, , and violate this constraint, which cannot constitute an ESS. Additionally, driven by the synergy of global abatement targets, government interventions steer the green transition of the shipping industry while reinforcing low-carbon social preferences, the following conditions emerge: and . Thus, equilibrium points and are incompatible with the current shipping decarbonization pathways and prevailing social preferences. A comprehensive analysis identifies , and as stable equilibria with practical significances in this system.
The refinement of carbon governance frameworks evolves progressively through dynamic interest coordination and collaboration among stakeholders. As Ostrom (2009) established in her principles of self-governance: Sole reliance on government intervention cannot ensure systemic sustainability; the self-investment of resource users is pivotal. Consequently, maritime carbon market governance advances through three lifecycle phases. First, initial phase represents government-led institutional scaffolding that incentivizes corporate decarbonization and verification integrity through reward-penalty mechanisms; Second, growth phase represents emergence of collaborative networks that reduce regulatory costs; Third, maturity phase represents establishment of self-sustaining governance ecosystems driven by endogenous motivations. This evolutionary trajectory () aligns with lifecycle theory—the strategic configurations of governance agents signify qualitative leaps from institutional dependence to operational autonomy.
Proposition 1 When , , and are satisfied, the system exhibits a stable point , which corresponds to the initial stage.
Proposition 1 reveals an intractable regulatory paradox. When shipping companies persist in high-emission operation while CVAs pursue rent-seeking, governments become trapped in a unilateral enforcement dilemma. It means that proactive regulatory measures fail to disrupt collusion between these parties. Consequently, the system inevitably converges to the equilibrium state, which is (high-emission operation, rent-seeking, strict regulation). The mechanism of the initial stage operates as follows: when shipping companies consider their perceived losses for low-carbon transition to exceed the perceived gains under green transition and regulatory pressure, government incentives fail to overcome their cost constraints. Simultaneously, CVAs opt for rent-seeking driven by economic gain. Although governments implement incentive and punishment mechanisms to compensate market actors, these institutional designs remain below the critical threshold required to resolve the dual-agency problem.
Proposition 2 When , , and are satisfied, the system exhibits a stale point , which corresponds to the growth stage.
Proposition 2 reveals a sustainable governance paradigm. When shipping companies implement low-carbon transition, and CVAs opt for rejecting rent-seeking under strict governments regulation, then the system achieves collaborative governance. Thanks to enhanced regulatory intensity and reinforced incentive and punishment mechanisms, governments effectively incentivize transparent carbon reporting by both parties. Consequently, the system converges to the equilibrium state, which is (low-carbon transition, no rent-seeking, strict regulation). The growth stage mechanism operates through the following interactions: First, shipping companies overcome cost barriers under government subsidies, technological advances, and ESGs’ green premiums, collectively enabling economically viable transitions to low-carbon operations. Second, CVAs avoid collusion and ensure accurate emission data, driven by incentive measures and shipping companies’ green transition. Overall, these effective government incentive measures encourage strategic shifts among market parties, promoting both improved governance effectiveness and increased public trust in a reinforcing cycle.
Proposition 3 When , , and , the system exhibits a stable state , which corresponds to the maturity stage.
Proposition 3 reveals a self-sustaining governance paradigm. When shipping companies implement low-carbon transition, and CVAs adopt no rent-seeking under loose governments regulation, the shipping abatement system achieves an endogenously driven stage. Through scaled-back regulatory interventions and sustained collaboration by both parties, transparent and sustainable shipping operations are institutionalized. The maturity stage mechanism operates as follows. First, shipping companies achieve a self-sustaining decarbonization mechanism where perceived marginal benefits consistently outweigh marginal costs under the green premium created through enhanced ESG performance. Meanwhile, influenced by companies consciously implementing decarbonization strategy, CVAs ensure accurate emissions reporting to governments, which effectively mitigating systemic risk from data distortion. Consequently, governments should focus on enhancing carbon-related policies in this stage, such as emissions trading systems, and advancing green technologies. Simultaneously achieving shipping carbon reduction targets and driving industry-wide optimal resource allocation with upgraded governance structures is essential.
Based on the stability analysis of the model, the stable points , , and correspond to the initial, growth, and maturity stages of carbon governance in shipping industry, respectively. Acting as both carbon reduction advocates and carbon market regulators, the governments incentivize shipping companies’ abatement and CVAs compliance through incentive and punishment mechanisms. However, constrained by green investment costs and limited responsibility awareness, shipping companies and CVAs exhibit strategic collusive tendencies in the initial stage, triggering a unilateral regulatory dilemma for the government. Second, the system evolves to the growth stage, policy frameworks mature and incentive and punishment intensity escalates, the governments effectively drive shipping companies to adopt green technological innovations. These measures compel CVAs to reject rent-seeking behavior and uphold data authenticity standards. Therefore, this stage achieves a transformation from unilateral regulation to multi-agent collaborative governance in shipping carbon governance. Finally, when the system enters the maturity stage, it exhibits the following characteristics: governments transition into an institutional enabler; shipping companies establish low-carbon operational mechanisms driven by optimized marginal abatement costs and internalized environmental responsibility; and CVAs ensure end-to-end data fidelity in emissions monitoring through industrial self-regulation. Consequently, the three subjects collectively establish an endogenous governance pattern characterized by “self-driven – verified data – institutional empowerment”. This evolutionary tendency demonstrates that a sustainable dynamic equilibrium emerges between institutional compliance costs and green transition benefits. The governance system will undergo a fundamental shift from externally imposed regulations to endogenous self-regulation.
5 System dynamic modeling and numerical analysis
5.1 System dynamic modeling
To systematically analyze stakeholder evolution in shipping carbon governance, this study constructs a tripartite evolutionary game based on prospect theory. Using the VensimPLE software, a system dynamics (SD) model was developed to simulate this system, as illustrated in Figure 5. The SD model comprises three subsystems: shipping companies, CVAs, and governments. Rectangles represent level variables, indicating accumulated values over time; valves denote rate variables controlling material flows entering or circulating within this system; and the remaining variables are classified as exogenous or auxiliary variables. Excluding the rate variables, other parameters including the risk attitude and loss avoidance coefficient, originate from the formally defined parameters in Section 3.
Figure 5
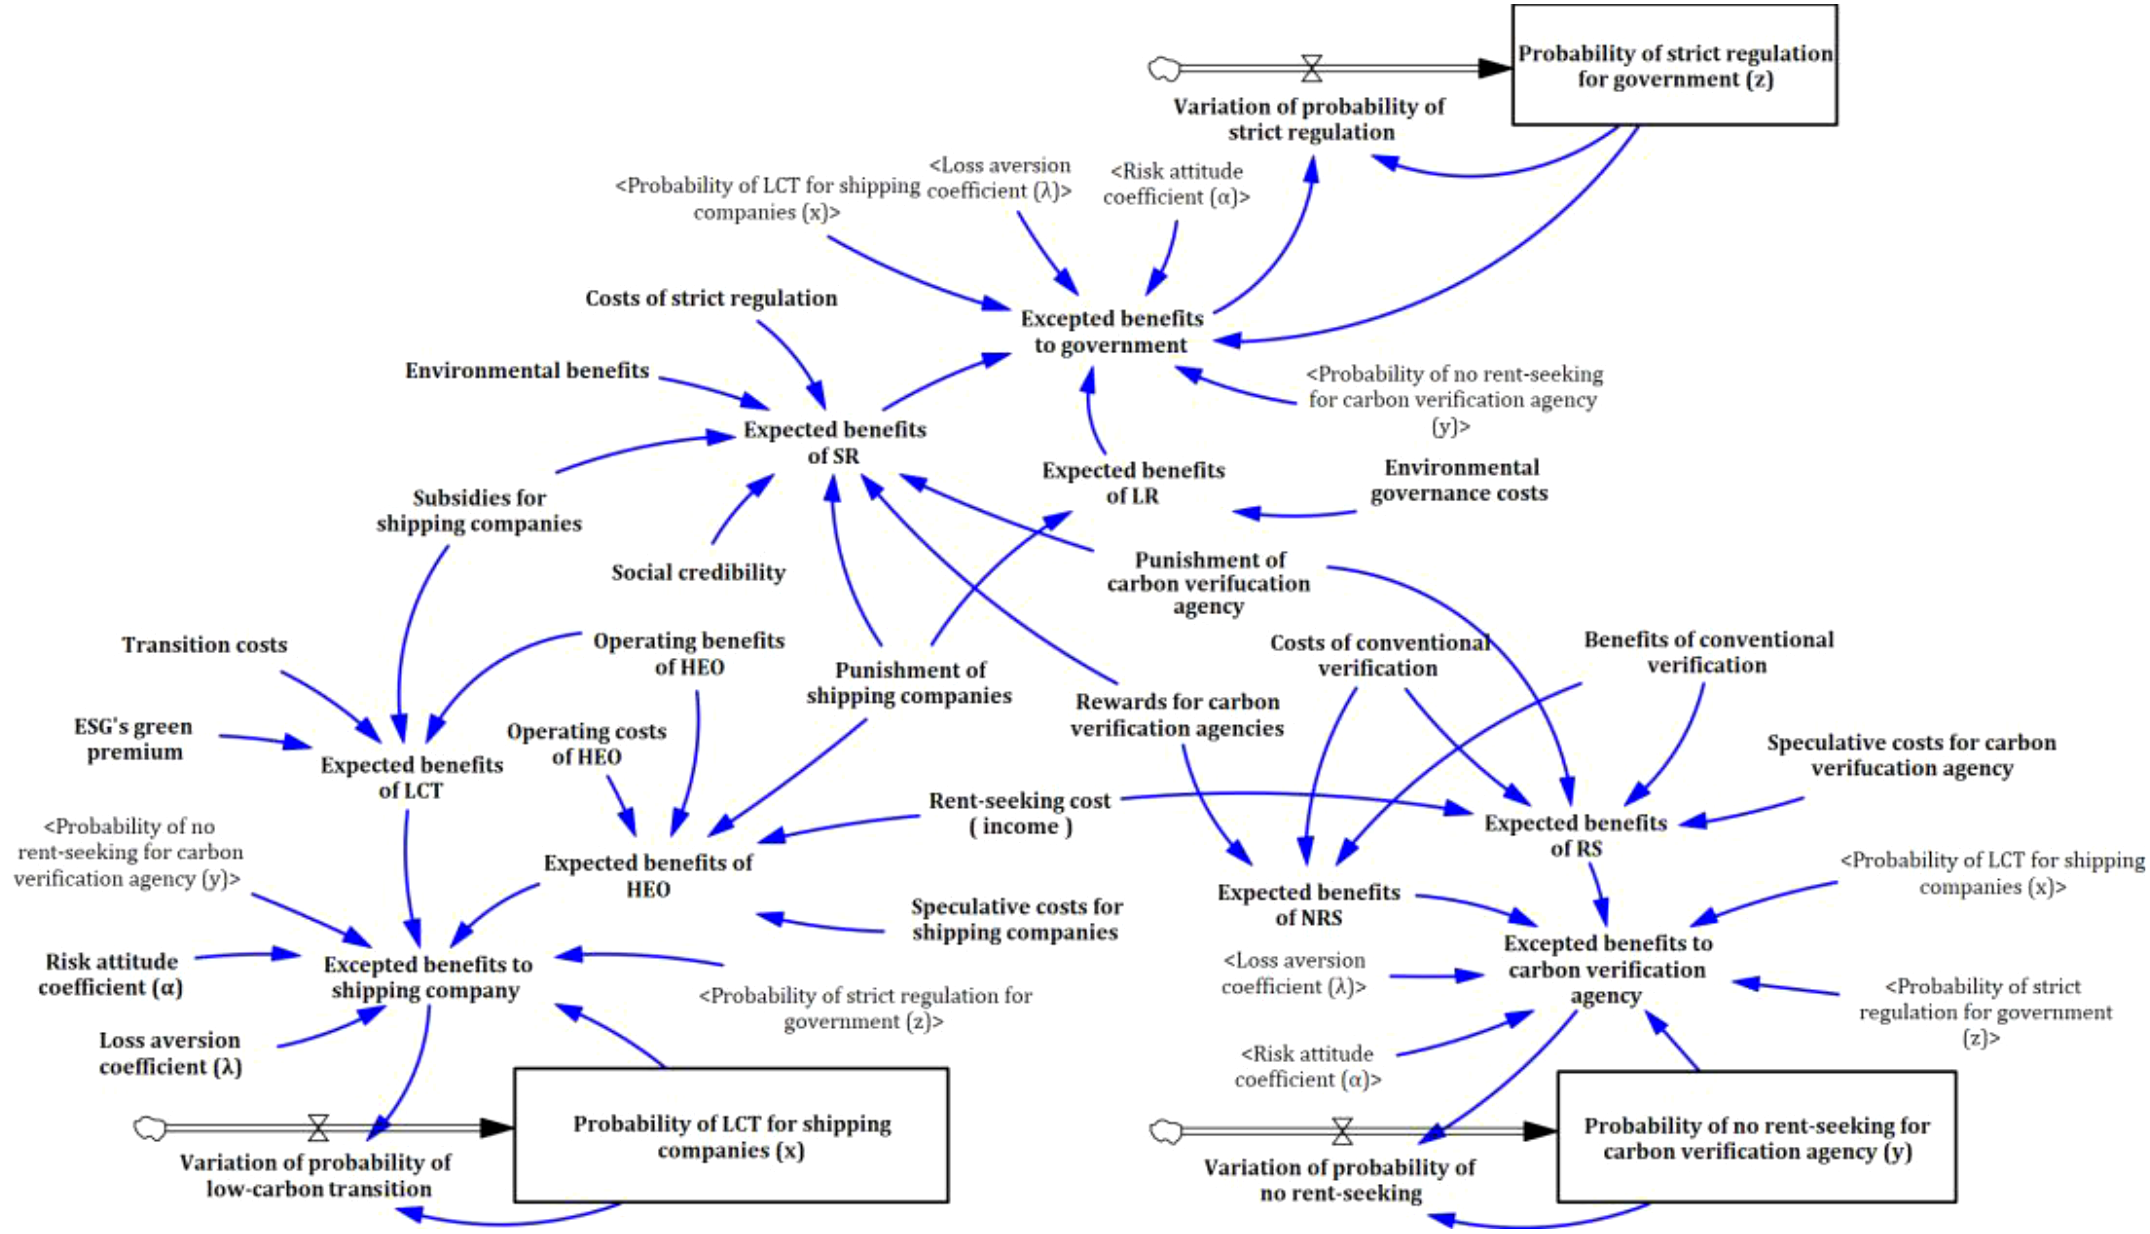
System dynamics model of tripartite evolutionary game.
5.2 Numerical analysis
To comprehensively investigate dynamic stakeholders’ strategies and interactions in shipping carbon governance, and validate the rationality and effectiveness of the model analysis, we conduct numerical simulations. Using a system dynamic based simulation framework, crucial parameters are quantified and incorporated into the model to simulate how stakeholder decisions under different scenarios impact governance outcomes. This visually demonstrates the evolution patterns and system stability throughout the governance process.
Based on the stability analysis and existing literature (Zhang, 2024; Bei et al., 2025), the basic parameters value of three stages are set. Meanwhile, accounting for heterogeneous gain-loss perceptions among stakeholders across governance stages (Koszegi and Rabin, 2006; Eccles et al., 2014). Specifically, α and λ exhibit a biphasic characteristic, with the initial phase characterized by elevated loss aversion (high λ) driven by technological uncertainties and the maturity phase by risk-seeking dominance (high α) enabled by institutionalized market mechanism (Baucells and Heukamp, 2012). We assign the parameter values to different stages, which are presented in Table 5.
Table 5
| Parameter | ||||||||||||||
|---|---|---|---|---|---|---|---|---|---|---|---|---|---|---|
| Initial stage | 10 | 75 | 15 | 20 | 6 | 5 | 10 | 5 | 3 | 4 | 20 | 30 | 0.88 | 1.5 |
| Growth stage | 10 | 60 | 30 | 25 | 8 | 15 | 20 | 8 | 10 | 15 | 30 | 90 | 0.90 | 1.35 |
| Maturity stage | 10 | 50 | 60 | 25 | 12 | 15 | 20 | 12 | 10 | 15 | 30 | 60 | 0.92 | 1.25 |
The parameter values of different stages.
5.2.1 Evolutionary stability strategy
In the scenario where the conditions: , , and are satisfied, we assign numerical group of the initial stage in Table 5. Using MATLAB 2022a software to generate 125 sets of initial strategy combinations . The evolutionary results are shown in Figure 6, which confirms that equilibrium point is an ESS, corresponding to (high-emission operation, rent-seeking, strict regulation). This state reveals a unilateral regulatory dilemma characterized by two mechanisms: (i) Shipping companies experience decarbonization lock-in due to conflicts between immediate high costs and discounted long-term returns, promoting strategic collusion with CVAs through benefit transfers; (ii) Current governmental incentives fail to exceed critical thresholds for overcoming operational cost constraints and rent-seeking motivation. Resolving this dilemma requires two key governmental actions, which are persistent strengthening of regulatory capacity and enhanced incentive intensity to shift policy frameworks from cost compensation to threshold-exceeding mechanisms.
Figure 6
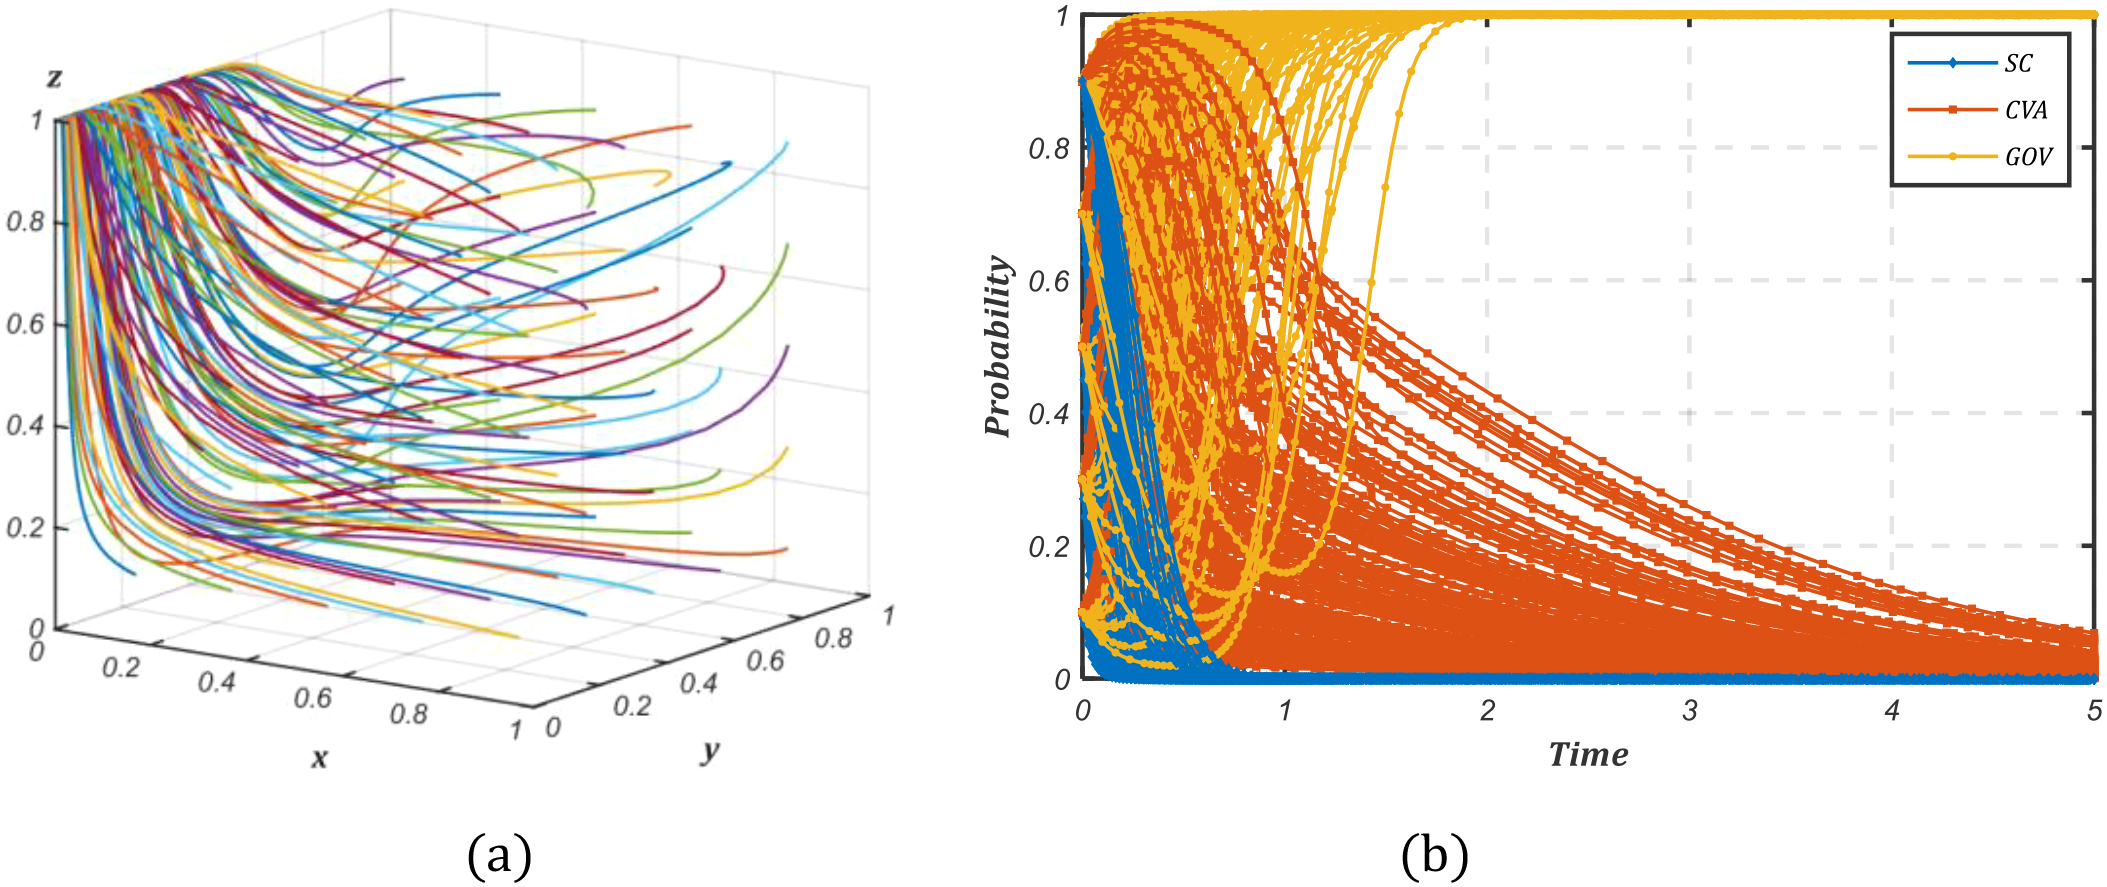
The numerical simulation result of the initial stage. (a) The evolution paths of the system. (b) The probability of tripartite evolution over time.
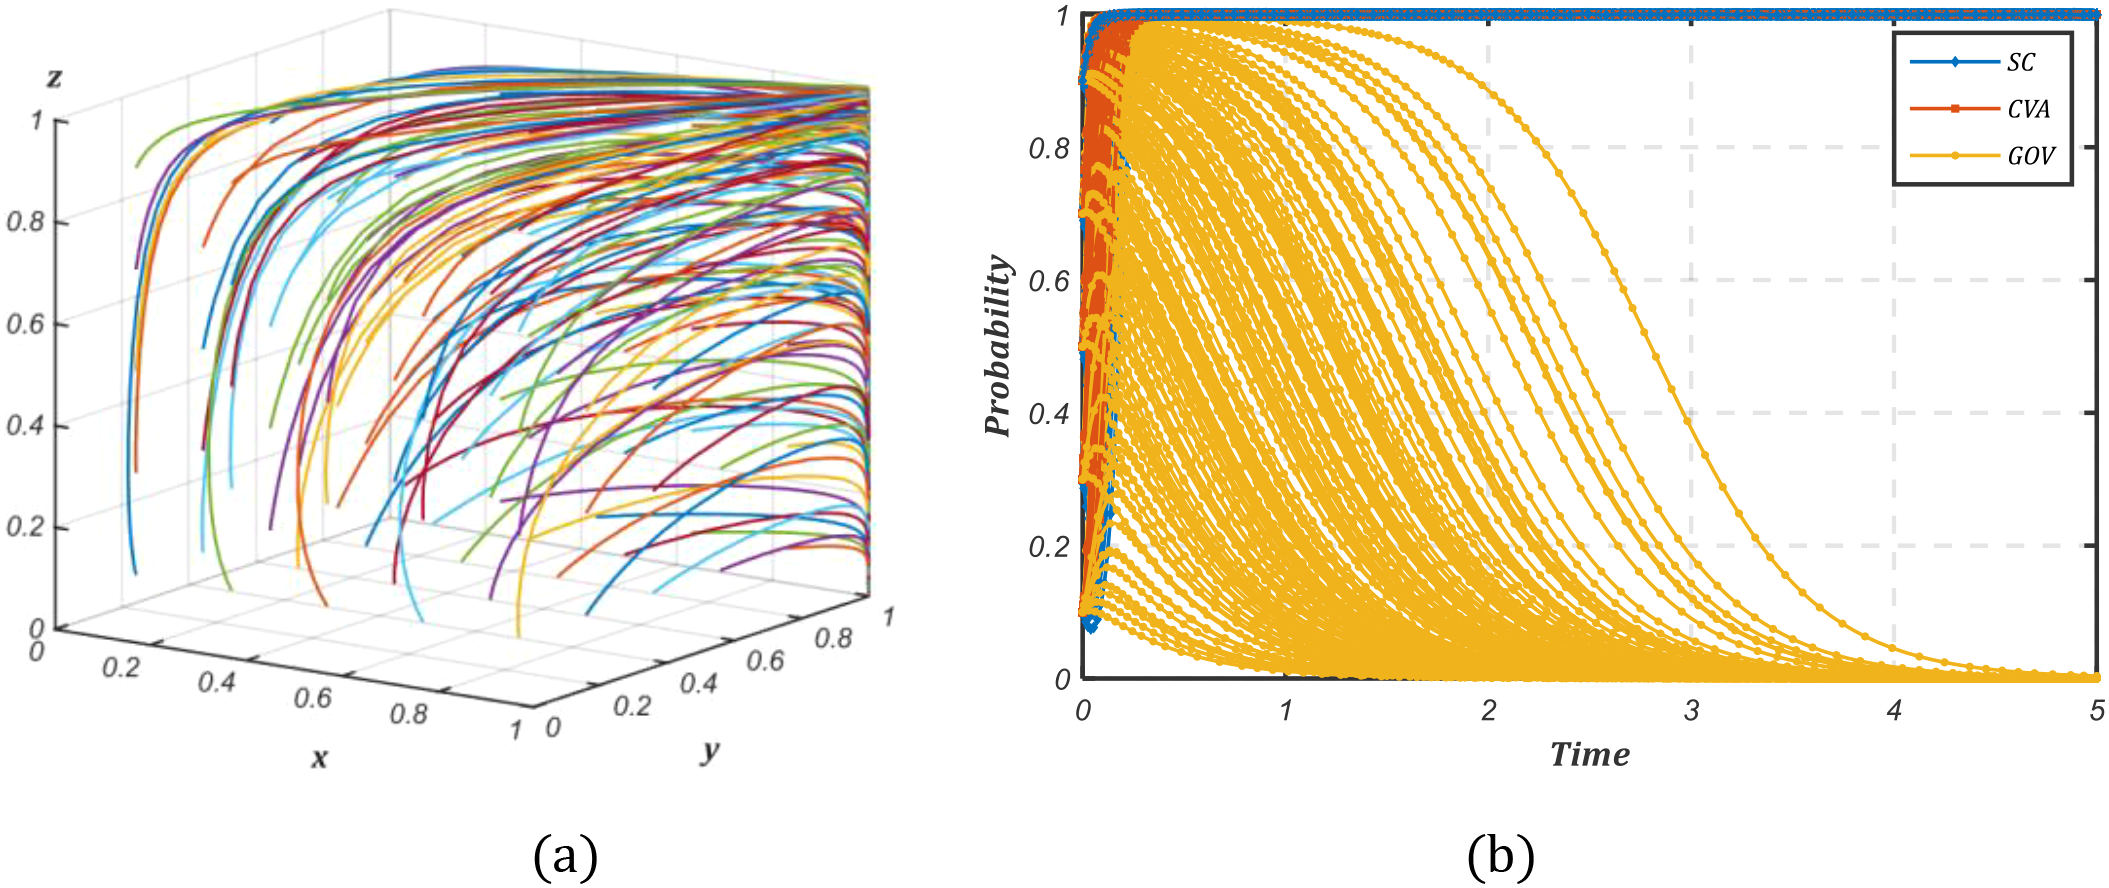
In the scenario where the conditions: , , and are satisfied, we assign the parameter values in the growth stage. As shown in Figure 7, the initial strategy combinations randomly generated confirm that the equilibrium point is an ESS, which corresponds to (low-carbon transition, no rent-seeking, strict regulation). The growth stage effectively resolves the unilateral regulatory dilemma through two synergistic mechanisms: (i) Strengthened social low-carbon preferences coupled with coordinated incentives and punishment frameworks overcome shipping companies’ decarbonization lock-in; (ii) Enhanced verification incentives significantly raise the opportunity cost of rent-seeking for CVAs, which effectively curbs the systemic risks of falsified emissions reporting through companies-agencies collusion. The resulting governance efficacy stems from synergistic market institutional interactions, establishing a self-reinforcing cycle of “policy impetus – market responses – low-carbon transition”. This transition signifies a paradigm shift from unilateral regulation to multi-agent collaborative governance in shipping carbon reduction.
Figure 7
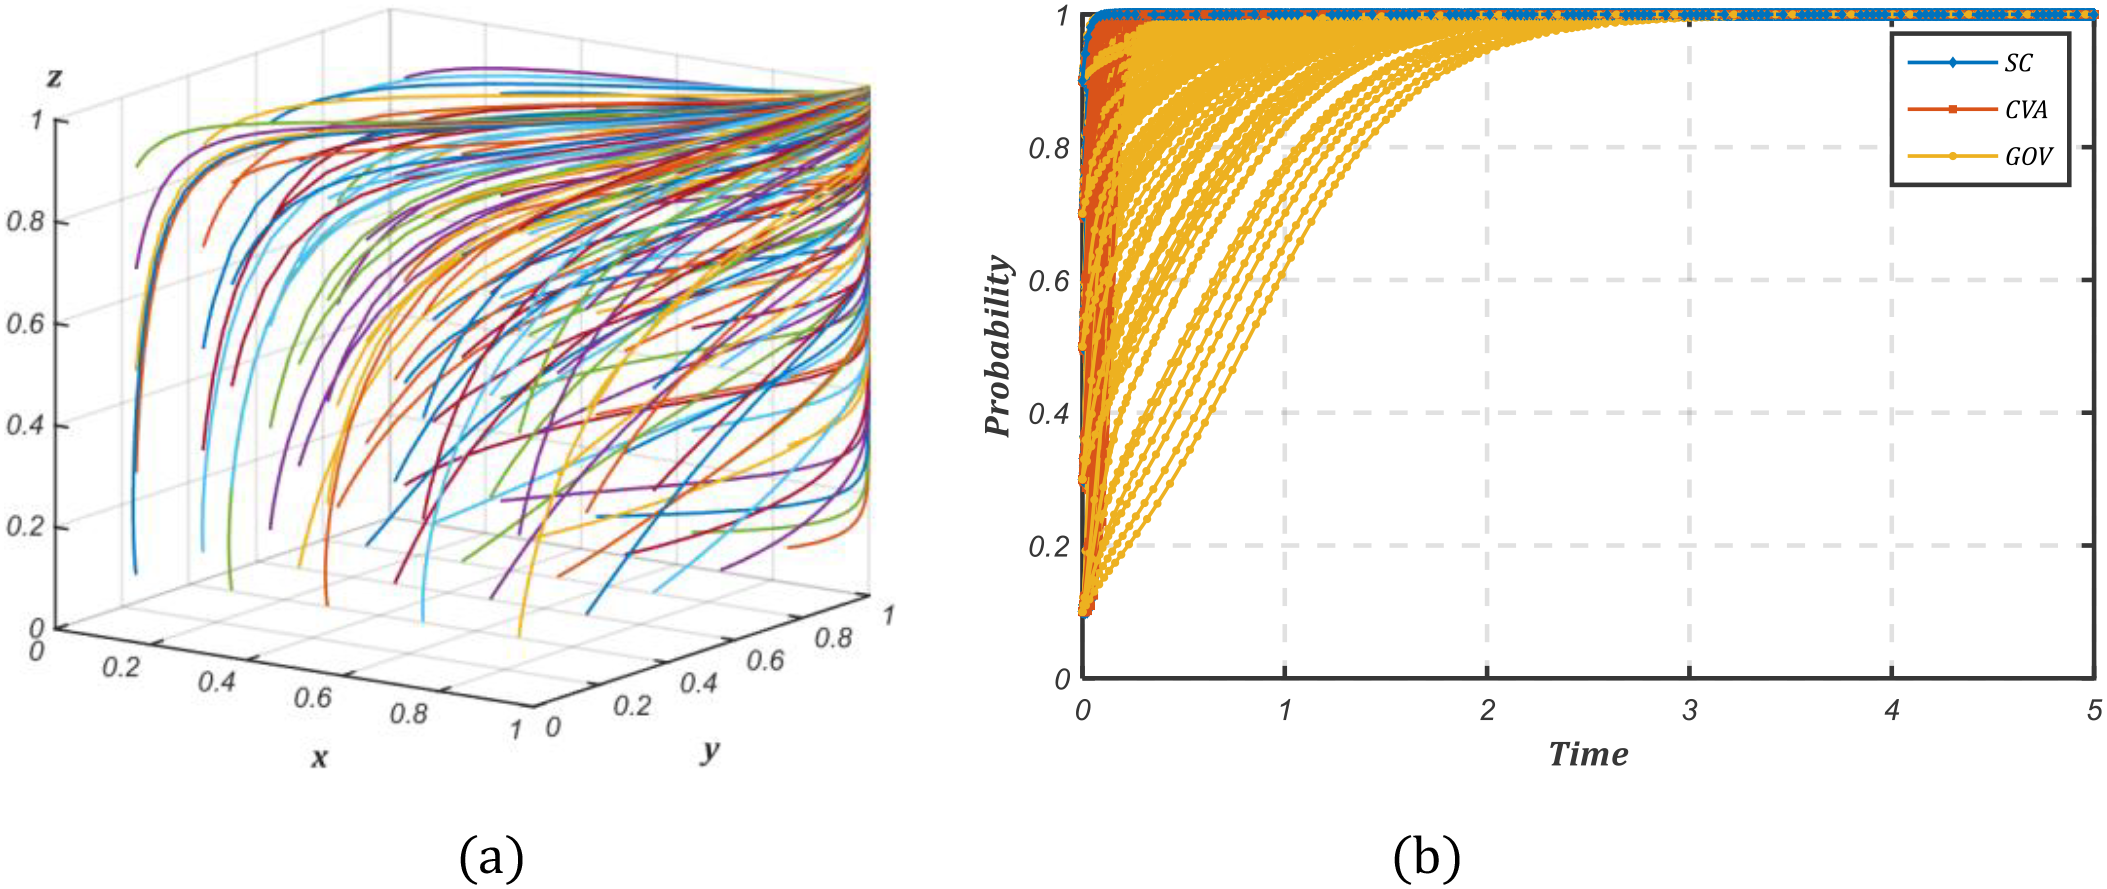
The numerical simulation result of the growth stage. (a) The evolution paths of the system. (b) The probability of tripartite evolution over time.
In the scenario where the conditions: , , and are satisfied, we assign the parameter values in the maturity stage. The evolutionary results of the maturity stage are shown in Figure 8, which confirms that equilibrium point is an ESS, and corresponds to (low-carbon transition, no rent-seeking, loose regulation). This strategy signifies a structural evolution in shipping carbon governance. First, persistent government green subsidies and substantially improved low-carbon economic returns enable shipping companies to overcome cost constraints and establish endogenous drivers for autonomous emission reductions. Second, compressed rent-seeking opportunities compel CVAs to rigorously enforce carbon accounting standards, which ensure reliable data for the formulation of carbon-related policies. This configuration yields a self-driven governance system characterized by dynamic coupling between market incentives and companies’ abatement initiatives. Consequently, the mechanism of “self-driven abatement – verified data integrity – institutional empowerment” is generated to accelerate the transition toward a sustainable governance paradigm for shipping carbon emissions.
Figure 8
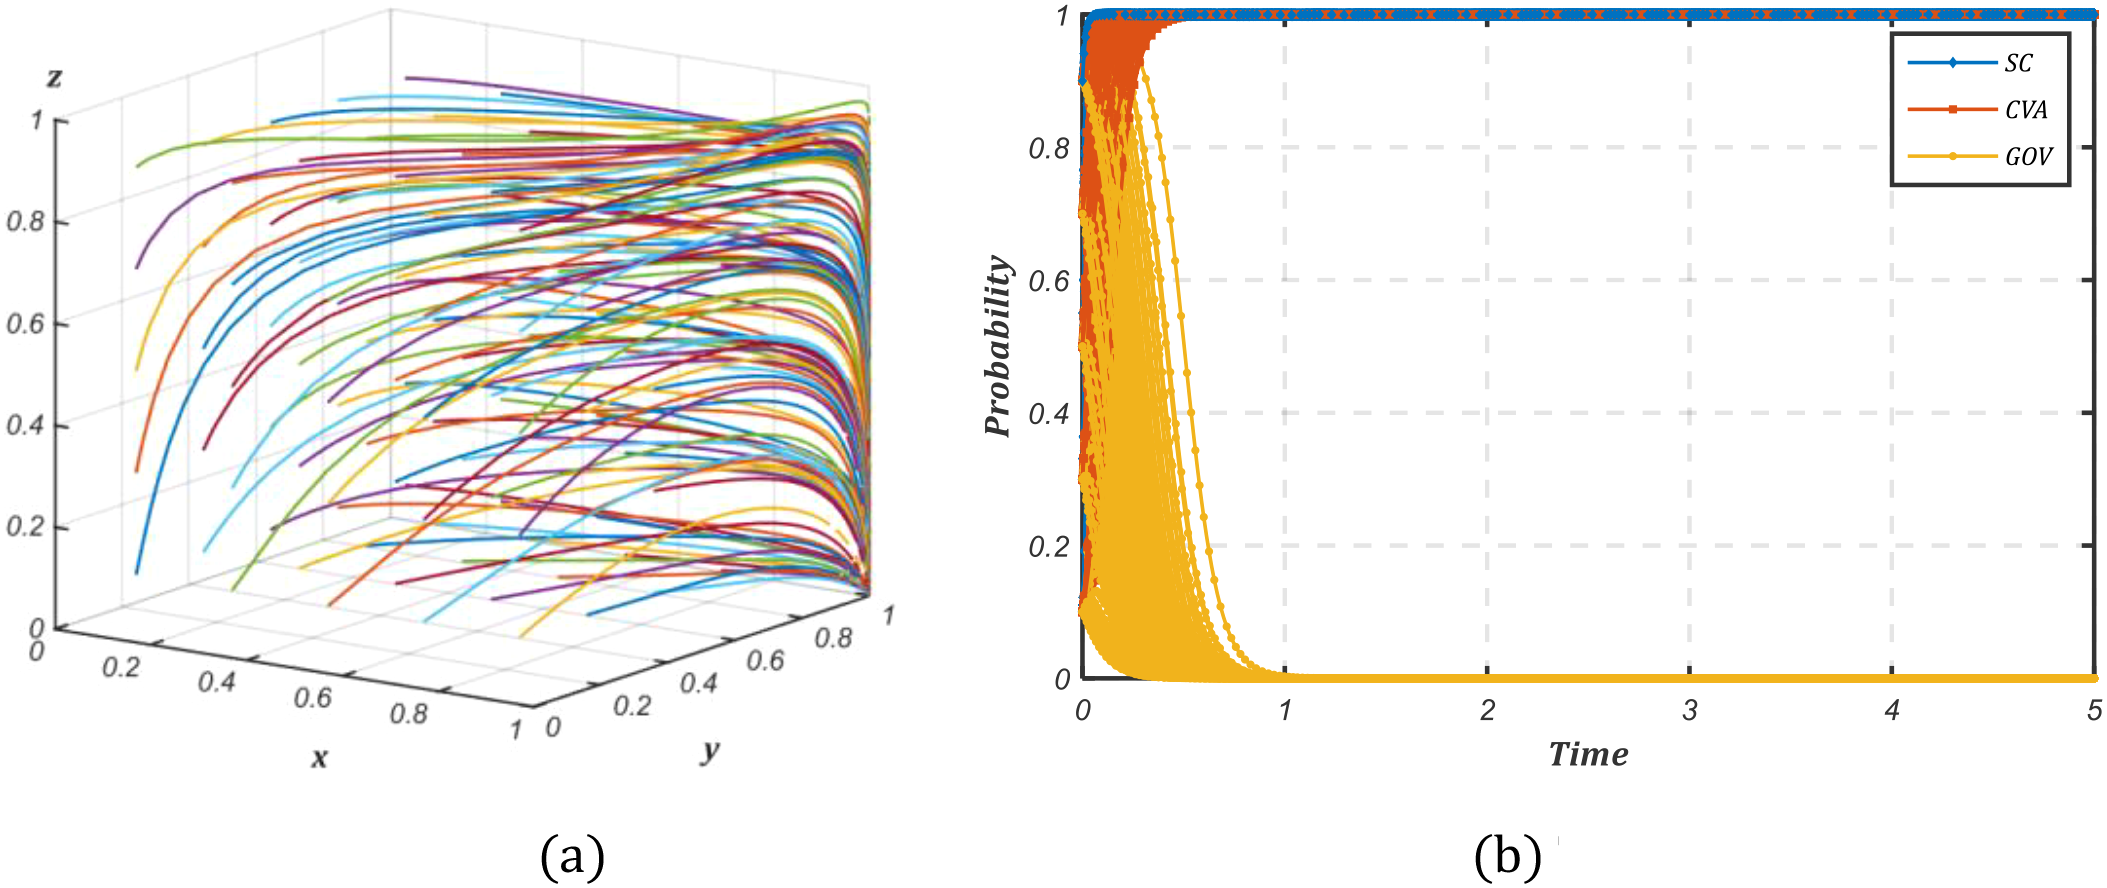
The numerical simulation result of the maturity stage. (a) The evolution paths of the system. (b) The probability of tripartite evolution over time.
5.2.2 Sensitivity analysis
To effectively regulate polluting subjects, our model incorporates five key parameters of shipping companies, which are low-carbon transition costs, green premium, rent-seeking costs, government green subsidies and punishments. Analysis is conducted based on the initial stage.
Low-carbon transition costs, functioning as a key moderating variable in shipping companies’ strategic decision-making, significantly influence the efficacy of transition behaviors through variations in their magnitudes. We assign as = 45, 60 and 75 to analyze the impact of stakeholders’ decisions, and the simulation results are as shown in Figure 9. Where Figure 9a indicates that elevated low-carbon transition costs (and 70) accelerate convergence toward high-emission operation among shipping companies. Conversely, when declines below a critical threshold, which is , companies undergo strategic substitution, rapidly converging toward low-carbon transition. Moreover, Figures 9b, c further demonstrate that transition costs define the strategic boundaries for shipping companies while exerting systemic spillover effects on CVAs and governmental decision evolution. These results demonstrate that: (i) Below the cost threshold, shipping companies exhibit endogenous disincentives toward rent-seeking, generating positive environmental externalities. (2) Above the cost threshold, carbon reduction incentives weaken significantly, prompting CVAs to seek rent to circumvent abatement costs. Here, intensified governments regulation is essential for mitigating carbon emission externalities. Consequently, these evolutionary paths reveal that reducing transition costs through technological innovation effectively strengthens autonomous emission reduction incentives and establishes a synergistic governance framework for carbon emission reduction in the shipping industry.
Figure 9
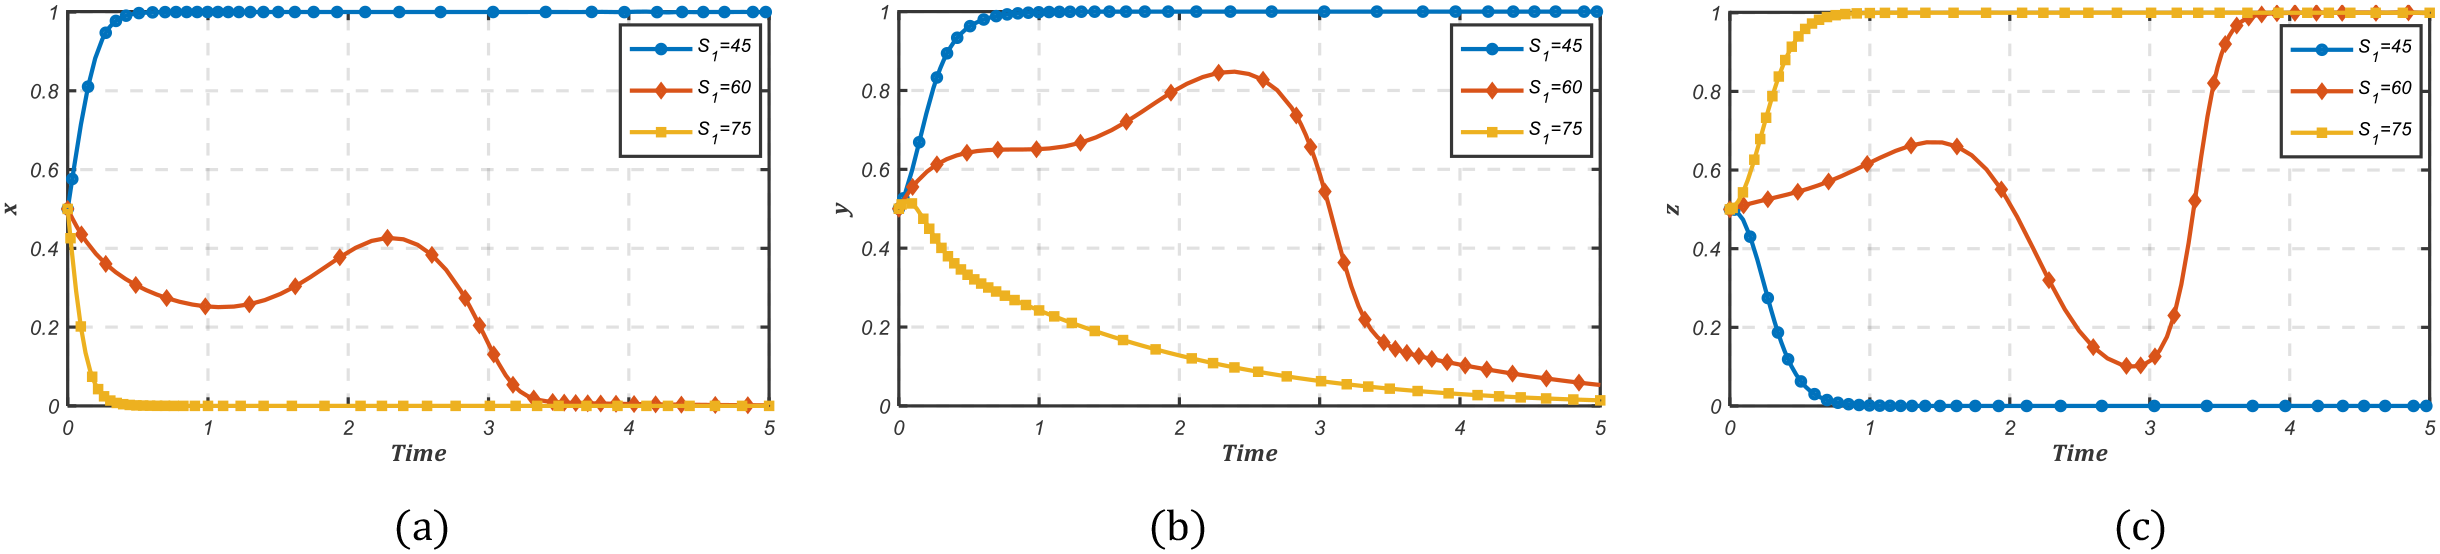
The impact of low-carbon transition costs for stakeholders’ strategies. (a) Shipping company. (b) Carbon verification agency. (c) Government.
The green premium derived from ESG ratings critically influences operational decisions of shipping companies. We therefore simulated stakeholders’ strategies at three premium levels, which are and 50, with results shown in Figure 10. When the green premium is low (), shipping companies maintains high-emission operation, though the transition toward such practices slowed as increased. Concurrently, CVAs’ rent-seeking initiatives decelerated, and governments regulatory intensity declined. A fundamental strategic shift occurred when exceeded its threshold (), the system evolved from the state (0,0,1) of government-dominated regulation to the stage (1,1,0) of self-driven abatement. This transition demonstrates that ESG ratings substantially shape operational strategies in shipping companies. Significant market share and profit gains from elevated ESG ratings incentivize adoption of green technologies, creating internal drivers for sustainable operations and advancing autonomous abatement in shipping carbon governance.
Figure 10
The impact of ESGs green premium for stakeholders’ strategies. (a) Shipping company. (b) Carbon verification agency. (c) Government.
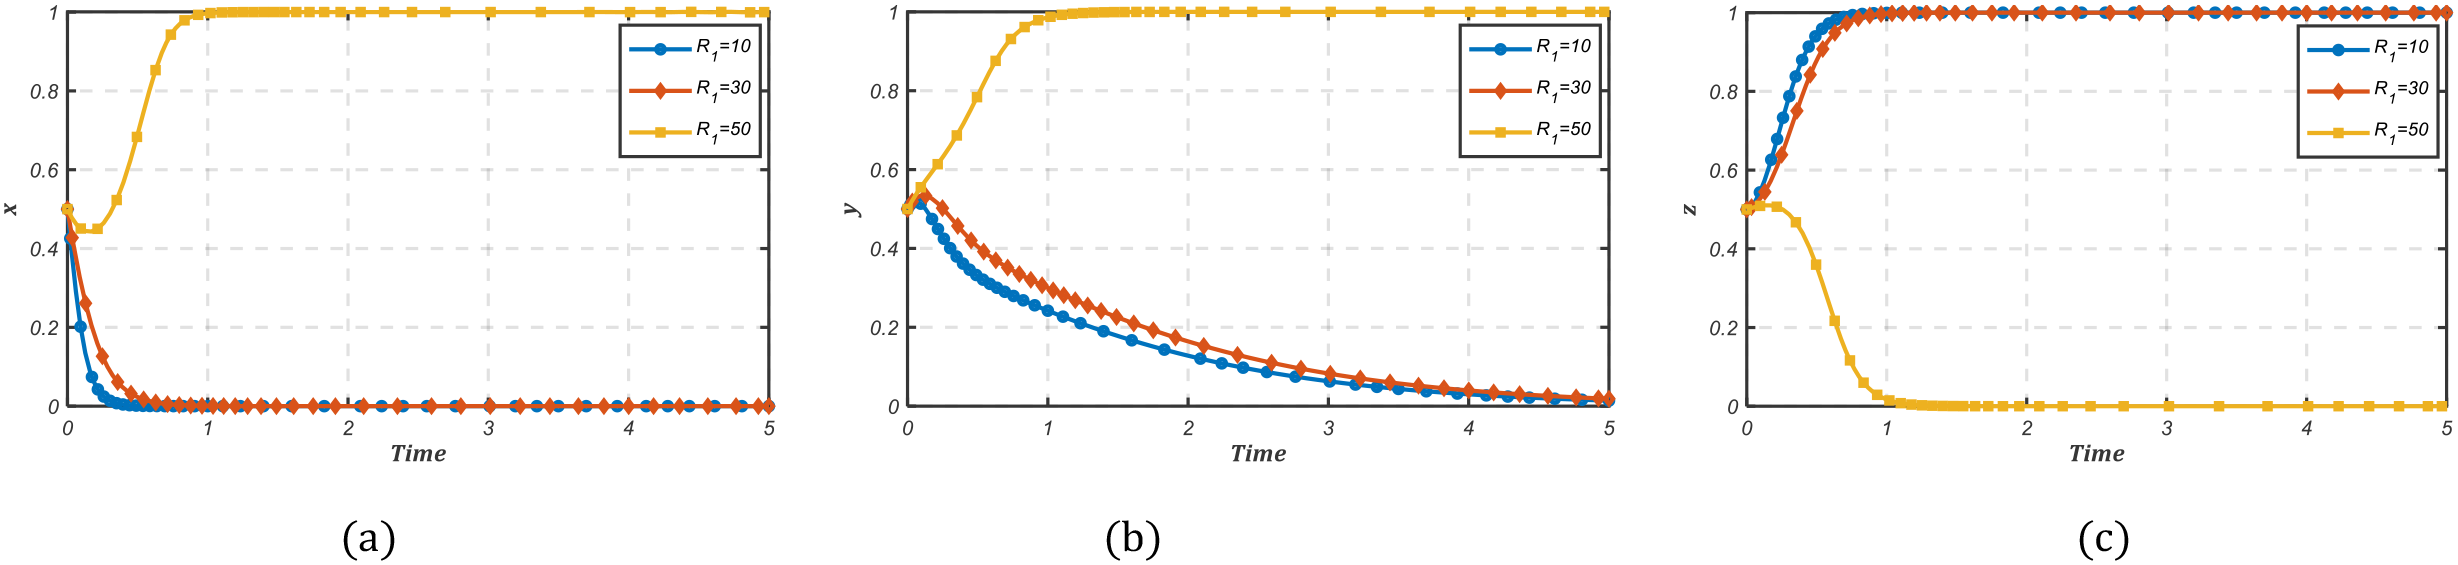
Rent-seeking constitutes a critical behavioral phenomenon in shipping carbon governance, and its associated costs directly shape the system equilibrium between shipping companies’ abatement avoidance and CVAs’ non-compliance gains. We assign , 30 and 40 to analyze the impact of stakeholders’ decisions. Where Figure 11a demonstrates that low rent-seeking costs exhibit an inverse correlation with convergence toward high-emission operation; while crossing the critical threshold () triggers strategic reversal, accelerating low-carbon transition for shipping companies. Notably, Figure 11b reveals that the CVAs’ behaviors are path-dependent. An initial increase promotes rent-seeking intentions, and crossing the threshold triggers a shift toward rent-seeking rejection. Figure 11c further confirms that governments optimize resource allocation through dynamic regulatory calibration based on the strategic evolution of companies and CVAs. Collectively, the evolutionary paths indicate that elevating rent-seeking barriers via market mechanisms effectively inhibits data manipulation, thus establishing a self-reinforcing constraint framework for carbon reduction in the shipping industry.
Figure 11
The impact of rent-seeking costs for stakeholders’ strategies. (a) Shipping company. (b) Carbon verification agency. (c) Government.
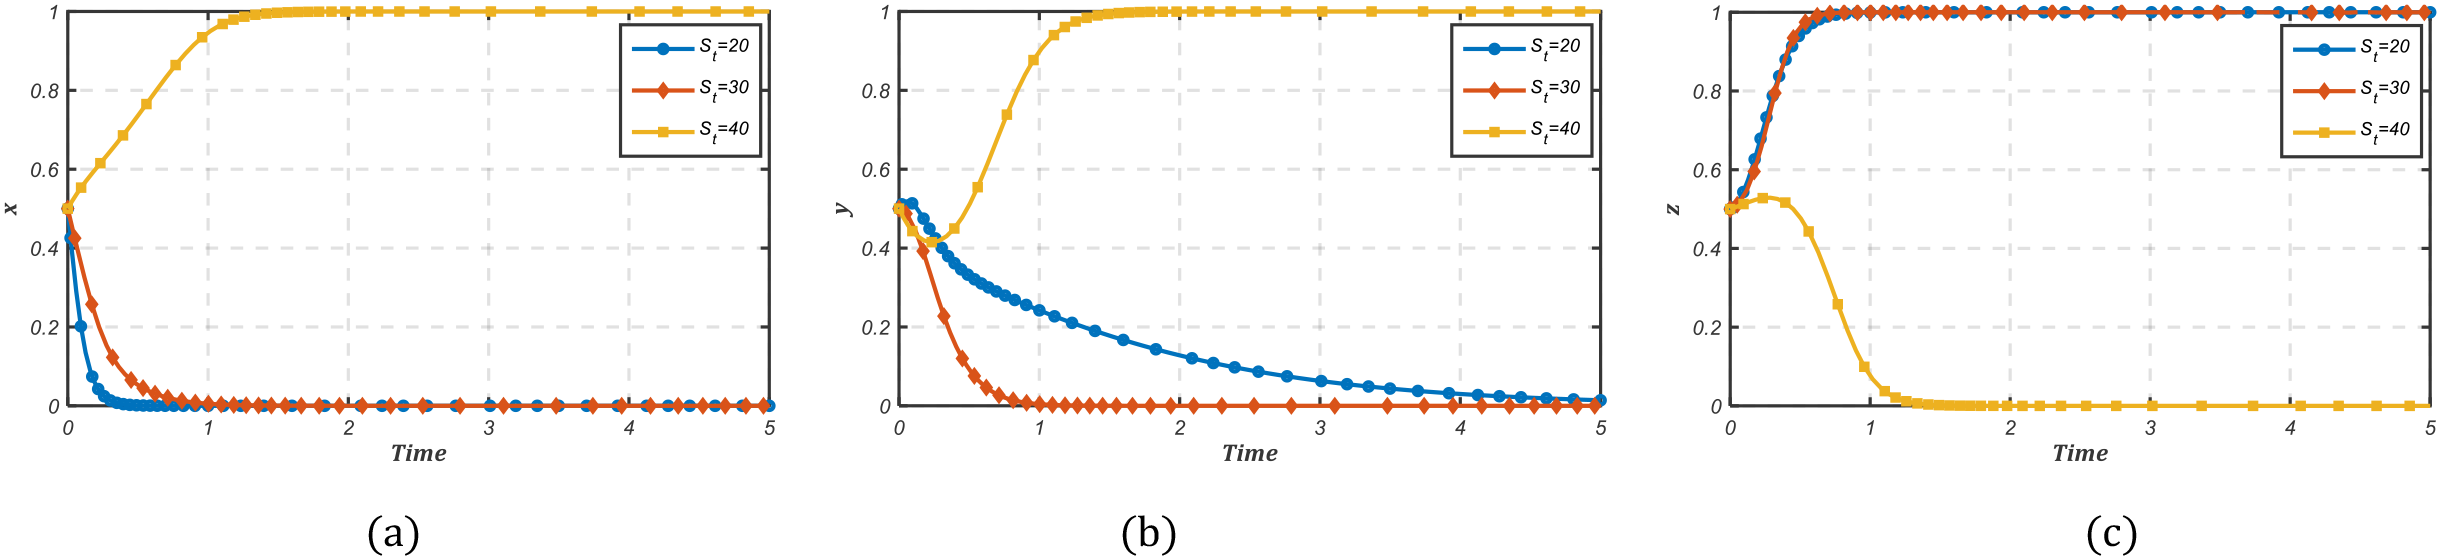
Government subsidies significantly modulate shipping companies’ decision-making by restructuring their cost-benefit structures. We assign as , 10 and 20 to analyze its influence mechanism, and the simulation results are shown in Figure 12. The results reveal that green subsidies enhance shipping companies’ willingness, thereby compelling CVAs to increase the probability of no rent-seeking. Notably, while increased subsidies induce transient fluctuations in system evolution, the equilibrium state converges persistently to . Key evolutionary patterns emerge as follows: (i) When increases from 5 to 10, shipping companies maintain high-emission operation without substantial change. However, the convergence toward this strategy is slow, with parallel deceleration in rent-seeking behavior and regulatory oversight. (ii) At , convergence toward high-emission operation slows further, and firms temporarily shift toward low-carbon strategies before reverting during mid-evolution. This suggests that the low-carbon transition of shipping companies through substantial subsidies is unsustainable. The core issue lies in the fact that subsidies induce policy dependence for shipping companies in the short term. While creating short-term compliance, they fail to foster intrinsic motivation for emission reduction. Concurrently, stricter carbon verification requirements paradoxically reduce regulatory intensity, ultimately undermining the sustainability of the transition. These evolutionary paths reveal a core dilemma that incentive intensity conflicts with sustainability, and a single subsidy policy fails to drive lasting decarbonization in the shipping industry. Effective solutions require integrated mechanisms that combine the carbon market, technological innovation support, and a collaborative governance framework for shipping carbon reduction.
Figure 12

The impact of subsidies and punishments for stakeholders’ strategies. (a) Shipping company. (b) Carbon verification agency. (c) Government.
5.2.3 Perceived coefficients analysis
Tversky and Kahneman (1992) established that risk attitude coefficient and loss aversion coefficient represent typical decision-maker preferences. Substituting baseline values into growth stage, which are and , the system state changes from (1,1,1) to (1,1,0), and this result is shown in Figure 13. We analyze how perceived value coefficients influence carbon governance system in shipping industry.
Figure 13
The numerical simulation for α=0.88 and λ=2.25 under growth stage conditions. (a) The evolution paths of the system. (b) The probability of tripartite evolution over time.
First, we assign α as α = 0.4, 0.7, 0.88, 1, and the simulation results are shown in Figure 14. It reveals the system state shift, which is (low-carbon transition, no rent-seeking, loose regulation) at α = 0.4, 0.7, 0.88; while α = 1, the system converges to (low-carbon transition, no rent-seeking, strict regulation). Notably, government strategies exhibit the highest sensitivity to the risk attitude coefficient in this stage, and regulation strategies shift abruptly from loose to strict, thereby triggering corresponding systemic changes when α = 1. Aggregate analysis reveals distinct correlation patterns: (i) Shipping companies’ strategies exhibit a negative correlation with α; (ii) Both CVAs and government strategies demonstrate positive correlations with α. Through prospect theory analysis, increasing α (with λ fixed at 2.25) elevates perceived value. When α = 1 and , the system satisfies three critical constraints, which are , , and , thereby the system converges to (1,1,0). The evolutionary paths indicate that stakeholders become more sensitivity to gains and losses as the risk attitude coefficient increases, with effects magnified at large absolute values.
Figure 14
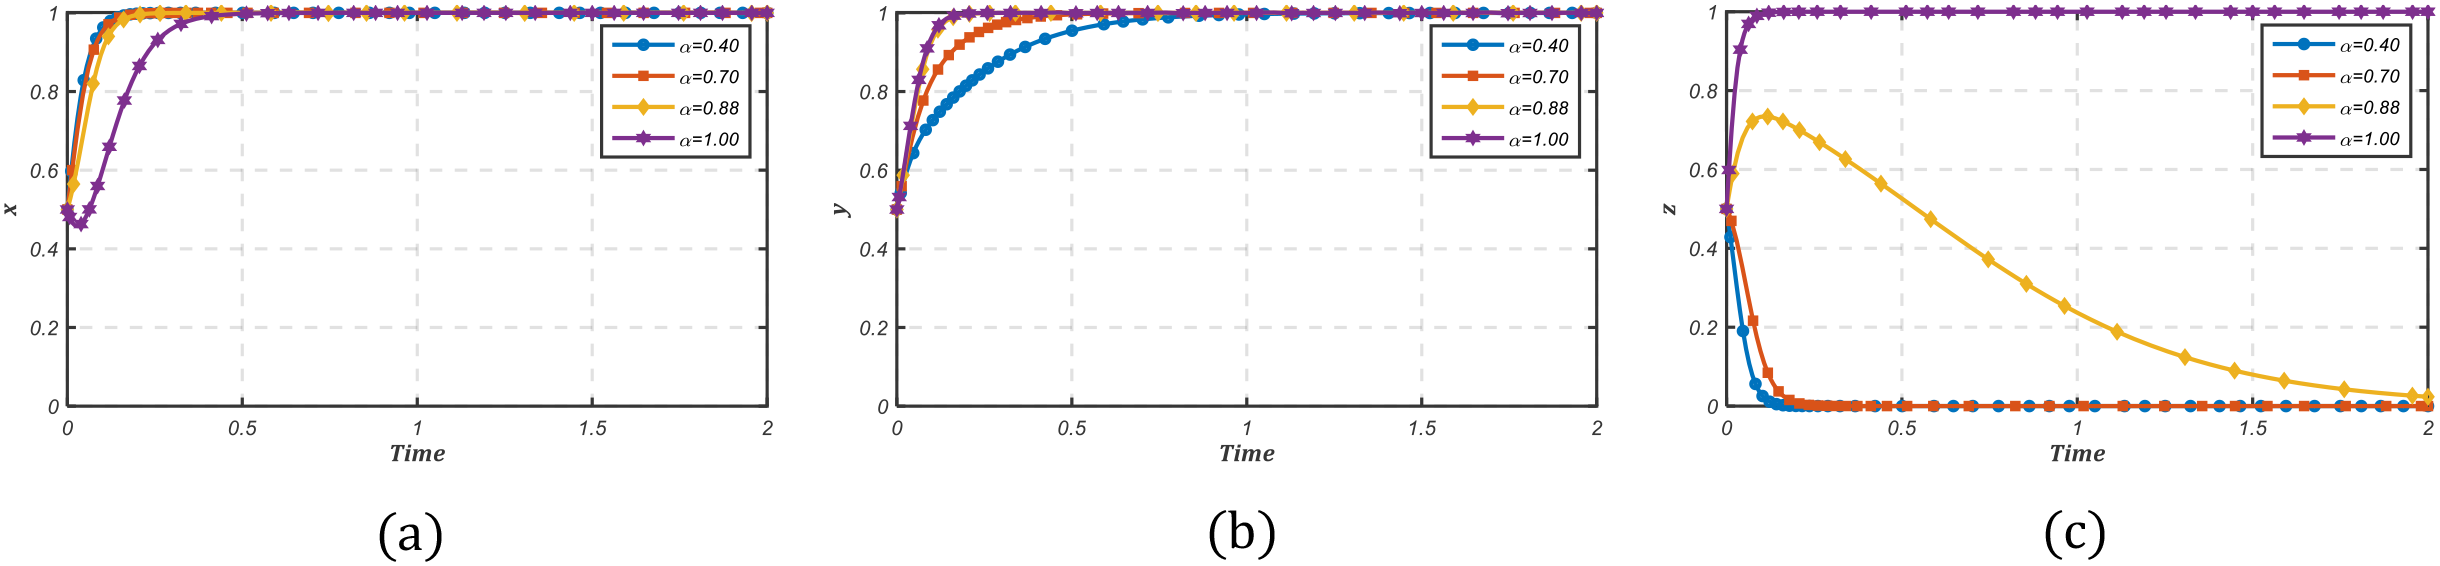
The impact of risk attitude coefficient for stakeholders’ strategies. (a) Shipping company. (b) Carbon verification agency. (c) Government.
Second, we assign λ as , 2.25, 3.25 and 4.25, and the simulation results are shown in Figure 15. This reveals a significant change that when λ exceeds 4.25, the system transitions from the stable state (low-carbon transition, no rent-seeking, loose regulation) to an unstable state. Specifically, shipping companies and governments exhibit high sensitivity to the loss aversion coefficient: (i) As λ increases from 1.25 to 3.25, companies’ convergence toward low-carbon transition slows, while governments’ regulatory strictness accelerates. (ii) At , accelerated strategic evolution paradoxically induces system instability. Additionally, the CVAs’ convergence speed for no rent-seeking increases with λ. Through prospect theory analysis, increasing λ (with α fixed at 0.88) elevates perceived value. When α = 0.88 and , the system only satisfies , while the constraint conditions and cannot be satisfied, which induces systemic instability. The evolutionary paths indicate that a higher loss aversion coefficient makes agents more sensitive to losses. When losses exceed a threshold, the behavioral changes in one agent cascade through the system, altering the strategies of other agents and ultimately destabilizing the entire system.
Figure 15
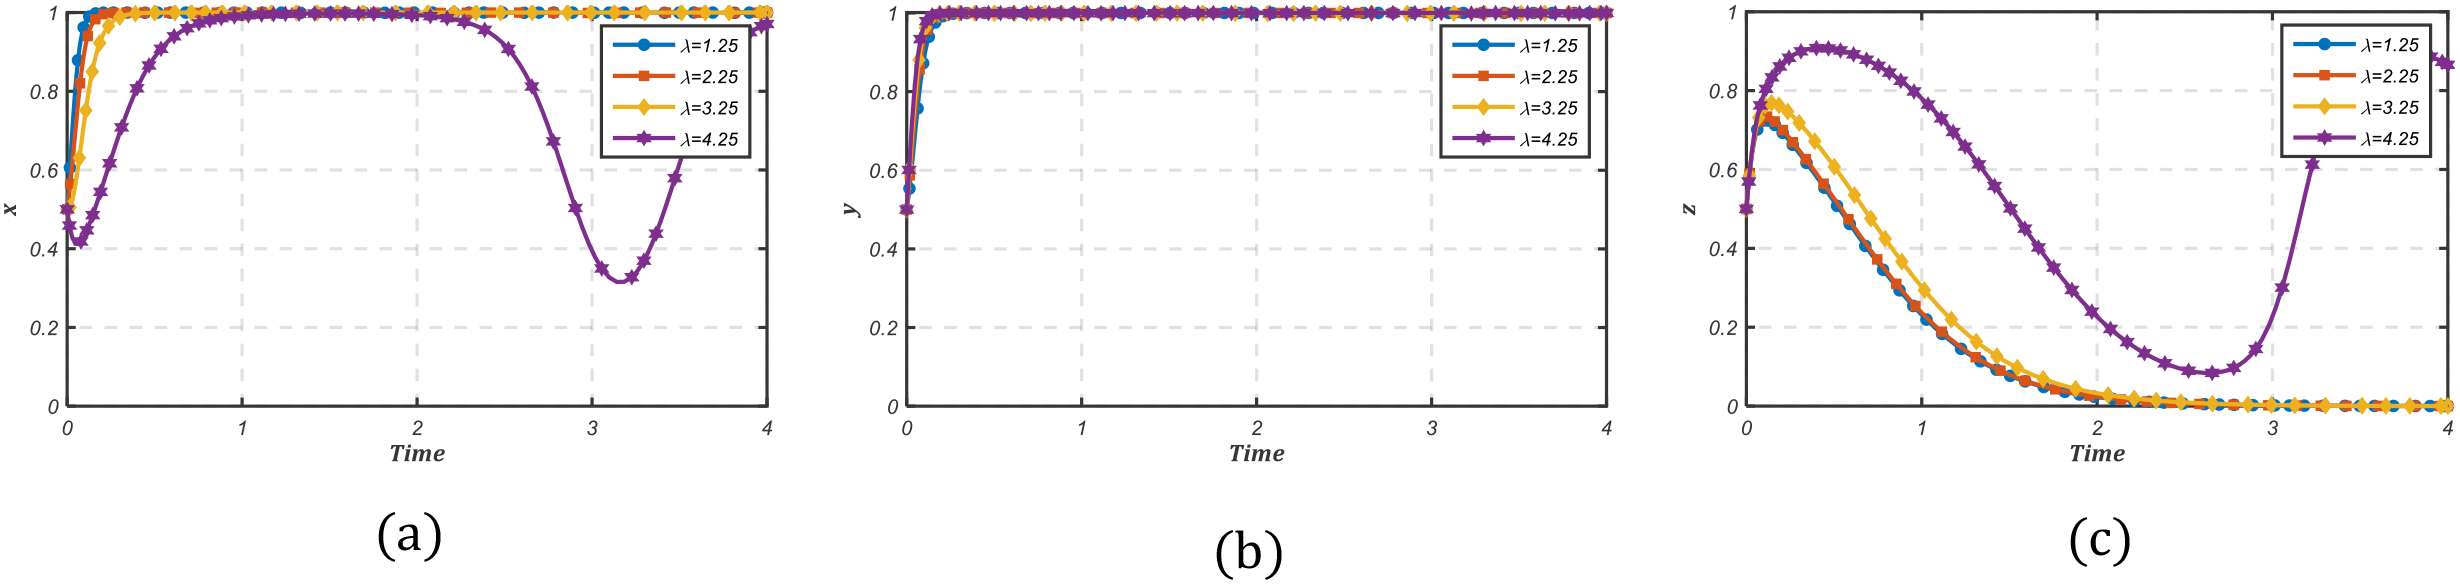
The impact of loss aversion coefficient for stakeholders’ strategies. (a) Shipping company. (b) Carbon verification agency. (c) Government.
6 Conclusions and implications
This study dedicates to inquire an effective approach to solve the systemic data distortion risks in shipping carbon governance caused by rent-seeking behavior. Based on prospect theory, we develop a tripartite evolutionary game model involving shipping companies, CVAs, and governments, enabling a thorough analysis of stakeholders’ strategies and system stability. Moreover, we analyze the evolutionary paths of ESS across various stages in shipping carbon governance. Further, systemic dynamics modeling and numerical simulations validate the conditions for achieving equilibrium points, the impacts of key parameters, and perceived coefficients on this system.
The principal results are as follows. First, carbon governance in shipping industry evolves dynamically throughout its lifecycle, driven primarily by endogenous mechanisms within shipping companies. Through voluntary abatement initiatives, shipping companies compel CVAs to reject rent-seeking, thereby enhancing carbon data credibility. This progression ultimately enables industry self-regulation without governments. Second, cost-benefit structures fundamentally drive stakeholders’ decisions. Shipping companies base their choices on the cost-benefit rates of low-carbon transition, while anticipated rent-seeking gains incentivize collusion. Government incentives and punishments can achieve abatement targets as supplementary tools, yet unlike green premiums created by ESG performance, they fail to establish enduring self-sustaining mechanisms for voluntary carbon reduction. Third, the perceived coefficients exert differentiated effects on stakeholders. Shipping companies’ low-carbon transition shows a significant negative correlation with risk attitude and loss aversion coefficients, and increased values slow the convergence of low-carbon transition. Conversely, the positive strategies of CVAs and governments positively correlate with these coefficients, and higher values accelerate evolution rates.
We present actionable governance implications for advancing shipping carbon governance.
First, synergistic mechanisms between dynamic regulation and endogenous drivers should be established. Governments should integrate regulatory functions with guidance mechanisms to create incentives and compatible patterns to strengthen both shipping companies’ self-sustaining green transition drivers and CVAs’ verification efficacy. During the initial governance stage, prioritize cultivating strategic foresight in shipping companies and responsibility awareness in CVAs through targeted institutional support. Once stable carbon reduction mechanisms emerge in shipping companies, governments should shift toward institutional enablers by perfecting carbon-related policies and developing carbon market instruments.
Second, stakeholders’ cost-benefit structures should be optimized. Dynamic incentive and punishment mechanisms must be established according to cost investments and expected payoffs of shipping companies and CVAs, thereby reducing rent-seeking gains that incentivize collusion. Meanwhile, Blockchain-based ESG evaluation systems should be developed and implemented to enhance data authenticity and strengthen ESG’s market influence. This improves real-time verification and raises rent-seeking costs, preventing shipping companies from illicitly obtaining carbon quotas.
Third, the perceived guidance of uncertain gains and losses for stakeholders should be enhanced. Given the negative correlation of shipping companies with the risk attitude and loss aversion coefficients, governments should implement customized management training programs to guide companies in rationally assessing the risks and returns of green technology adoption, moderating their overly sensitive perception. For CVAs and government regulators, responsibility awareness should be strengthened through mission-oriented education and ethical development programs to reinforce positive value perceptions.
Effective marine greenhouse gas mitigation requires not only direct emission reduction from shipping transportation through source control, but also strengthened carbon absorption and sequestration capacities via blue carbon ecosystems. Fundamentally, shipping carbon governance focusing on emission reduction from maritime activities, and blue carbon governance centered on protecting and enhancing marine carbon sinks constitute complementary and interconnected climate mitigation strategies. Both collectively lower atmospheric greenhouse gas concentrations.
This study has the following limitations, suggesting directions for future research. Constrained by limited empirical data on carbon emissions and opportunistic behavior costs under rent-seeking conditions, simulation values were theoretically derived based on practical feasibility and system stability requirements. Future work will systematically analyze stakeholders within blue carbon markets, and using practical data to examine incentive mechanisms, carbon credit verification protocols, and policy integration frameworks to unlock synergistic climate benefits.
Statements
Data availability statement
The original contributions presented in the study are included in the article/supplementary material. Further inquiries can be directed to the corresponding author.
Author contributions
QC: Software, Writing – original draft. FC: Formal Analysis, Writing – original draft. BG: Methodology, Funding acquisition, Writing – review & editing. PT: Validation, Writing – review & editing. YF: Conceptualization, Writing – review & editing.
Funding
The author(s) declare financial support was received for the research and/or publication of this article. This research was supported by the National Social Science Fund of China (Grant No. 24BGL222), the Fundamental Research Funds for the Provincial Universities of Zhejiang (Grant No. 2023Y008), Natural Science Foundation of Xinjiang Uygur Autonomous Region (Grant No. 2021D01B41), Special Project for the Reform of Basic Scientific Research Funds in Colleges and Universities, Zhejiang Provincial Philosophy and Social Science Planning (Grant No. 25NDJC099YBMS).
Conflict of interest
The authors declare that the research was conducted in the absence of any commercial or financial relationships that could be construed as a potential conflict of interest.
Generative AI statement
The author(s) declare that no Generative AI was used in the creation of this manuscript.
Any alternative text (alt text) provided alongside figures in this article has been generated by Frontiers with the support of artificial intelligence and reasonable efforts have been made to ensure accuracy, including review by the authors wherever possible. If you identify any issues, please contact us.
Publisher’s note
All claims expressed in this article are solely those of the authors and do not necessarily represent those of their affiliated organizations, or those of the publisher, the editors and the reviewers. Any product that may be evaluated in this article, or claim that may be made by its manufacturer, is not guaranteed or endorsed by the publisher.
References
1
Bai W. Wang J. Yao Q. Li Y. Li J. Cheng W. (2016). Investigation of international carbon verification policy-systems. J. Eng. Stud.08, 322–331. doi: 10.3724/SP.J.1224.2016.00322
2
Barberis N. C. (2013). Thirty years of prospect theory in economics: A review and assessment. J. Economic Perspect.27, 173–196. doi: 10.1257/jep.27.1.173
3
Baucells M. Heukamp F. H. (2012). Probability and time trade-off. Manage Sci.58, 831–842. doi: 10.1287/mnsc.1110.1450
4
Beck S. Mahony M. (2017). The IPCC and the politics of anticipation. Nat. Clim Chang7, 311–313. doi: 10.1038/nclimate3264
5
Bei H. Zhang J. Yang T. (2025). Development strategies for green methanol in the shipping industry with government subsidies: An analysis based on evolutionary game and system dynamics. J. Clean Prod507, 145520. doi: 10.1016/j.jclepro.2025.145520
6
Brunetti I. Hayel Y. Altman E. (2018). State-policy dynamics in evolutionary games. Dyn Games Appl.8, 93–116. doi: 10.1007/s13235-016-0208-0
7
Chai S. Huo W. Li Q. Ji Q. Shi X. (2025). Effects of carbon tax on energy transition, emissions and economy amid technological progress. Appl. Energy377, 124578. doi: 10.1016/j.apenergy.2024.124578
8
Chen Y. Zhang J. Tadikamalla P. R. Gao X. (2019). The relationship among government, enterprise, and public in environmental governance from the perspective of multi-player evolutionary game. Int. J. Environ. Res. Public Health16, 3351. doi: 10.3390/ijerph16183351
9
Chiong M.-C. Kang H.-S. Shaharuddin N. M. R. Mat S. Quen L. K. Ten K.-H. et al . (2021). Challenges and opportunities of marine propulsion with alternative fuels. Renewable Sustain. Energy Rev.149, 111397. doi: 10.1016/j.rser.2021.111397
10
Costa Junior C. J. Garcia-Cintado A. C. (2021). Rent-seeking in an emerging market: A DSGE approach. Economic Syst.45, 100775. doi: 10.1016/j.ecosys.2020.100775
11
Davidson M. Karplus V. J. Zhang D. Zhang X. (2021). Policies and institutions to support carbon neutrality in China by 2060. Economics Energy Environ. Policy10, 7–24. doi: 10.5547/2160-5890.10.2.mdav
12
Eccles R. G. Ioannou I. Serafeim G. (2014). The impact of corporate sustainability on organizational processes and performance. Manage Sci.60, 2835–2857. doi: 10.1287/mnsc.2014.1984
13
European Commission (2024).Reducing emissions from the shipping sector. Available online at: https://climate.ec.europa.eu/eu-action/eu-emissions-trading-system-eu-ets_en (Accessed May 04, 2025).
14
Foreman R. D. Kleit A. N. (2023). Is prorationing efficiency-enhancing or rent-seeking?: Evidence from a natural experiment. Resour. Policy80, 103117. doi: 10.1016/j.resourpol.2022.103117
15
Friedman D. (1991). Evolutionary games in economics. Econometrica59, 637. doi: 10.2307/2938222
16
Gao Y. Li M. Xue J. Liu Y. (2020). Evaluation of effectiveness of China’s carbon emissions trading scheme in carbon mitigation. Energy Econ90, 104872. doi: 10.1016/j.eneco.2020.104872
17
Githinji M. van Noordwijk M. Muthuri C. Speelman E. N. Jan Hofstede G. (2023). Farmer land-use decision-making from an instrumental and relational perspective. Curr. Opin. Environ. Sustain63, 101303. doi: 10.1016/j.cosust.2023.101303
18
Haque S. Islam M. A. (2015). “Carbon emission accounting fraud,” in Corporate Carbon and Climate Accounting (Springer International Publishing, Cham), 243–257. doi: 10.1007/978-3-319-27718-9_11
19
Hillman A. L. (2009). Public Finance and Public Policy (Cambridge University Press). doi: 10.1017/CBO9780511813788
20
Hoang A. T. Foley A. M. Nižetić S. Huang Z. Ong H. C. Ölçer A. I. et al . (2022). Energy-related approach for reduction of CO2 emissions: A critical strategy on the port-to-ship pathway. J. Clean Prod355, 131772. doi: 10.1016/j.jclepro.2022.131772
21
IMO (2023).2023 IMO strategy on reduction of GHG emissions from ships. Available online at: https://www.imo.org/en/OurWork/Environment/Pages/2023-IMO-Strategy-on-Reduction-of-GHG-Emissions-from-Ships.aspx (Accessed May 04, 2025).
22
Inal O. B. Charpentier J.-F. Deniz C. (2022). Hybrid power and propulsion systems for ships: Current status and future challenges. Renewable Sustain. Energy Rev.156, 111965. doi: 10.1016/j.rser.2021.111965
23
Jia H. Jiang L. Azevedo P. (2024a). Green premium and the role of financial investors in sustainable investment in container shipping. Transp Res. E Logist Transp Rev.189, 103658. doi: 10.1016/j.tre.2024.103658
24
Jia Z. Wu R. Liu Y. Wen S. Lin B. (2024b). Can carbon tariffs based on domestic embedded carbon emissions reduce more carbon leakages? Ecol. Economics220, 108163. doi: 10.1016/j.ecolecon.2024.108163
25
Koszegi B. Rabin M. (2006). A model of reference-dependent preferences. Q J. Econ121, 1133–1165. doi: 10.1093/qje/121.4.1133
26
Lagouvardou S. Psaraftis H. N. (2022). Implications of the EU Emissions Trading System (ETS) on European container routes: A carbon leakage case study. Maritime Transport Res.3, 100059. doi: 10.1016/j.martra.2022.100059
27
Lai K. H. Lun Y. H. V. Wong C. W. Y. Cheng T. C. E. (2013). Measures for evaluating green shipping practices implementation. Int. J. Shipping Transport Logistics5, 217. doi: 10.1504/IJSTL.2013.053251
28
Liu C. Sun J. Zheng L. Zhu R. (2025). Combating the rent-seeking among enterprises in China’s emissions trading system. Emerging Markets Rev.65, 101233. doi: 10.1016/j.ememar.2024.101233
29
Liu H. Mao Z. Li X. (2023). Analysis of international shipping emissions reduction policy and China’s participation. Front. Mar. Sci.10. doi: 10.3389/fmars.2023.1093533
30
Liu M. Li Y. (2022). Environmental regulation and green innovation: Evidence from China’s carbon emissions trading policy. Financ Res. Lett.48, 103051. doi: 10.1016/j.frl.2022.103051
31
Liu Y. Xin X. Yang Z. Chen K. Li C. (2021). Liner shipping network - transaction mechanism joint design model considering carbon tax and liner alliance. Ocean Coast. Manag212, 105817. doi: 10.1016/j.ocecoaman.2021.105817
32
Long W. Qu X. Yin S. (2023). How does carbon emissions trading policy affect accrued earnings management in corporations? Evidence from China. Financ Res. Lett.55, 103840. doi: 10.1016/j.frl.2023.103840
33
Luo L. (2019). The influence of institutional contexts on the relationship between voluntary carbon disclosure and carbon emission performance. Accounting Finance59, 1235–1264. doi: 10.1111/acfi.12267
34
Ma R. Zhao Q. Wang K. Cao J. Yang C. Hu Z. et al . (2025). Energy efficiency improvement technologies for ship in operation: A comprehensive review. Ocean Eng.331, 121258. doi: 10.1016/j.oceaneng.2025.121258
35
Mao Z. Ma A. Zhang Z. (2024). Towards carbon neutrality in shipping: Impact of European Union’s emissions trading system for shipping and China’s response. Ocean Coast. Manag249, 107006. doi: 10.1016/j.ocecoaman.2023.107006
36
Miao H. Feng X. Li X. (2025). Economic viability of arctic shipping under IMO environmental regulations: a well-to-wake assessment of different carbon tax scenarios. Front. Mar. Sci.12. doi: 10.3389/fmars.2025.1575551
37
Ostrom E. (2009). A general framework for analyzing sustainability of social-ecological systems. Sci. (1979)325, 419–422. doi: 10.1126/science.1172133
38
Pan Y. Yang W. Ma N. Chen Z. Zhou M. Xiong Y. (2019). Game analysis of carbon emission verification: A case study from Shenzhen’s cap-and-trade system in China. Energy Policy130, 418–428. doi: 10.1016/j.enpol.2019.04.024
39
Parks P. C. (1992). A. M. Lyapunov’s stability theory—100 years on. IMA J. Math Control Inf9, 275–303. doi: 10.1093/imamci/9.4.275
40
Shi Y. (2023). China’s shipping market supervision system under theRCEP: Influence, challenges and countermeasures. Front. Mar. Sci.10. doi: 10.3389/fmars.2023.1155452
41
Shi J. Xu J. Chen J. Ye J. Zhu M. Qin Q. et al . (2024). Clean energy ship application to promote carbon neutrality in global maritime industry: State governance or international supervision? Ocean Coast. Manag257, 107356. doi: 10.1016/j.ocecoaman.2024.107356
42
Siddique M. A. Akhtaruzzaman M. Rashid A. Hammami H. (2021). Carbon disclosure, carbon performance and financial performance: International evidence. Int. Rev. Financial Anal.75, 101734. doi: 10.1016/j.irfa.2021.101734
43
Song X. Lu Y. Shen L. Shi X. (2018). Will China’s building sector participate in emission trading system? Insights from modelling an owner’s optimal carbon reduction strategies. Energy Policy118, 232–244. doi: 10.1016/j.enpol.2018.03.075
44
Tang R. Guo W. Oudenes M. Li P. Wang J. Tang J. et al . (2018). Key challenges for the establishment of the monitoring, reporting and verification (MRV) system in China’s national carbon emissions trading market. Climate Policy18, 106–121. doi: 10.1080/14693062.2018.1454882
45
Tversky A. Kahneman D. (1992). Advances in prospect theory: Cumulative representation of uncertainty. J. Risk Uncertain5, 297–323. doi: 10.1007/BF00122574
46
Venus Lun Y. H. Lai K. Wong C. W. Y. Cheng T. C. E. (2015). Environmental governance mechanisms in shipping firms and their environmental performance. Transp Res. E Logist Transp Rev.78, 82–92. doi: 10.1016/j.tre.2015.01.011
47
Wang D. Dou W. (2023). Research on the synergy mechanism of multiple subjects in global climate governance: Based on the perspective of the evolutionary game of carbon neutral strategy between China, the US, and the EU. J. Clean Prod419, 138306. doi: 10.1016/j.jclepro.2023.138306
48
Wang X.-T. Liu H. Lv Z.-F. Deng F.-Y. Xu H.-L. Qi L.-J. et al . (2021). Trade-linked shipping CO2 emissions. Nat. Clim Chang11, 945–951. doi: 10.1038/s41558-021-01176-6
49
Wang Y. Sun Y. Miao Y. (2023). Management of enterprise carbon emissions data falsification considering government regulation and media monitoring. Front. Environ. Sci.11. doi: 10.3389/fenvs.2023.1302089
50
Xu S. Fang L. Govindan K. (2022). Energy performance contracting in a supply chain with financially asymmetric manufacturers under carbon tax regulation for climate change mitigation. Omega (Westport)106, 102535. doi: 10.1016/j.omega.2021.102535
51
Xu H. Pan X. Li J. Feng S. Guo S. (2023). Comparing the impacts of carbon tax and carbon emission trading, which regulation is more effective? J. Environ. Manage330, 117156. doi: 10.1016/j.jenvman.2022.117156
52
Yang Z. L. Zhang D. Caglayan O. Jenkinson I. D. Bonsall S. Wang J. et al . (2012). Selection of techniques for reducing shipping NOx and SOx emissions. Transp Res. D Transp Environ.17, 478–486. doi: 10.1016/j.trd.2012.05.010
53
Ye J. Chen J. Shi J. Jiang X. Zhou S. (2024). Novel synergy mechanism for carbon emissions abatement in shipping decarbonization. Transp Res. D Transp Environ.127, 104059. doi: 10.1016/j.trd.2024.104059
54
Yige Z. Haibo K. Min W. Meng Z. Jianzhao L. (2025). Research on government subsidy strategy of green shipping supply chain considering corporate social responsibility. Res. Transportation Business Manage.60, 101368. doi: 10.1016/j.rtbm.2025.101368
55
Yong X. Tao Y. Wu Y. Chen W. (2024). Rent-seeking analysis of carbon emission verification based on game theory and prospect theory from the perspective of multi-participation. J. Clean Prod438, 140784. doi: 10.1016/j.jclepro.2024.140784
56
Zhang C. (2024). How can rural China achieve sustainable development through inclusive innovation? A tripartite evolutionary game analysis. J. Clean Prod469, 143126. doi: 10.1016/j.jclepro.2024.143126
57
Zhang W. Chen X. Wang Y. Zhu K. He L. (2025a). The evolution of CCS-EOR technology diffusion involving multi-agent participation under dual carbon targets: A system dynamics and prospect theory approach. Sustain. Futures9, 100642. doi: 10.1016/j.sftr.2025.100642
58
Zhang W. Li C. Jia T. Wang S. Hao Q. Yang J. (2025b). Evolutionary game analysis of sustainable aviation fuel promotion. Energy322, 135723. doi: 10.1016/j.energy.2025.135723
59
Zhang W. Li J. Li G. Guo S. (2020). Emission reduction effect and carbon market efficiency of carbon emissions trading policy in China. Energy196, 117117. doi: 10.1016/j.energy.2020.117117
60
Zhang Y. Qi L. Lin X. Pan H. Sharp B. (2022). Synergistic effect of carbon ETS and carbon tax under China’s peak emission target: A dynamic CGE analysis. Sci. Total Environ.825, 154076. doi: 10.1016/j.scitotenv.2022.154076
61
Zhang M. Shen Q. Zhao Z. Wang S. Huang G. Q. (2024). Commitment or rent-seeking? Government incentive policies for ESG reporting in sustainable e-commerce logistics. Int. J. Prod Econ268, 109134. doi: 10.1016/j.ijpe.2023.109134
62
Zhao X. Ma X. Chen B. Shang Y. Song M. (2022). Challenges toward carbon neutrality in China: Strategies and countermeasures. Resour Conserv. Recycl176, 105959. doi: 10.1016/j.resconrec.2021.105959
63
Zhou C. Richardson-Barlow C. Fan L. Cai H. Zhang W. Zhang Z. (2025). Towards organic collaborative governance for a more sustainable environment: Evolutionary game analysis within the policy implementation of China’s net-zero emissions goals. J. Environ. Manage373, 123765. doi: 10.1016/j.jenvman.2024.123765
64
Zhou Z. Wu Z. Liu C. Shao L. Zhang Y. Liu W. et al . (2026). The path to carbon neutral shipping: a comparative analysis of low carbon technologies. J. Environ. Sci. doi: 10.1016/j.jes.2025.04.034
65
Zhou Y. Yuen K. F. (2024). Prepare for the sustainability era: A quantitative risk analysis model for container shipping sustainability-related risks. J. Clean Prod475, 143661. doi: 10.1016/j.jclepro.2024.143661
Summary
Keywords
carbon governance, rent-seeking behavior, emissions trading system, sustainable development goal, evolutionary game, prospect theory
Citation
Chen Q, Chen F, Gu B, Tian P and Fu Y (2025) Research on shipping carbon governance considering rent-seeking behavior: an evolutionary game analysis based on prospect theory. Front. Mar. Sci. 12:1655085. doi: 10.3389/fmars.2025.1655085
Received
27 June 2025
Accepted
05 August 2025
Published
04 September 2025
Volume
12 - 2025
Edited by
Yidan Xu, Maastricht University, Netherlands
Reviewed by
Chunyao Ou, Guangdong Ocean University, China
Mengdi Zhang, The Hong Kong Polytechnic University, Hong Kong SAR, China
Updates
Copyright
© 2025 Chen, Chen, Gu, Tian and Fu.
This is an open-access article distributed under the terms of the Creative Commons Attribution License (CC BY). The use, distribution or reproduction in other forums is permitted, provided the original author(s) and the copyright owner(s) are credited and that the original publication in this journal is cited, in accordance with accepted academic practice. No use, distribution or reproduction is permitted which does not comply with these terms.
*Correspondence: Yufang Fu, fuyufang@zjou.edu.cn
Disclaimer
All claims expressed in this article are solely those of the authors and do not necessarily represent those of their affiliated organizations, or those of the publisher, the editors and the reviewers. Any product that may be evaluated in this article or claim that may be made by its manufacturer is not guaranteed or endorsed by the publisher.