Abstract
Although Geographic Information Systems (GIS) have proved to be reliable tools for animal health management, their implementations in the aquatic animal health (AAH) domain are scarce, likely because they require expertise in GIS technologies, the specific characteristics of aquatic environments, and epidemiology. Considering the lack of GIS approaches tailored to AAH, this study presents a framework conceived to guide GIS users through the development of GIS operative designs for disease surveillance and response. Its practical application and actual accessibility within two case studies in an Italian marine environment and in a Brazilian freshwater aquaculture site were investigated. The main take-home message emerging from both the framework and its applications is the key importance of project planning in GIS development. Without a structured planning phase, GIS projects are likely to produce inconsistent, incomplete, or unsustainable outcomes. The framework accompanies GIS users, including those with little GIS knowledge, through all the stages of GIS project development, encouraging them to include the fundamental planning elements based on the principles of applicability, sustainability, appropriateness and opportunity of implementation. However, the framework must be used consciously, not as rigid instructions but, rather, as a tool that provides orientation to navigate GIS planning in the complex aquatic contexts.
1 Introduction
Since aquaculture has been arguably taking a leading role in suppling animal food worldwide, aquatic animal health (AAH) has become an essential piece in the puzzle of global food security, international trade, and environmental sustainability (Troell et al., 2014). Although disease is known to be one of the biggest threats to both stability and growth of the sector (Jennings et al., 2016; Li et al., 2022), dealing with health issues and risks in the aquatic domain remains a complex challenge to be faced. Managing aquaculture for resilience and sustainability requires AAH stakeholders (producers, policymakers, scientists) to field innovative technological approaches and adapted management strategies to closely and consistently monitor, promptly react, and, possibly, anticipate changes and evolutions in rapidly evolving disease events and dynamics, as well as environmental stressors that can, in turn, affect AAH (i.e., from global climate change to enhanced disease transmission between different populations, or introduction and spread of invasive species) (Hambrey, 2017; Bang Jensen et al., 2021; Pacheco et al., 2025). In fact, nowadays, monitoring animal diseases and handling health emergencies, such as disease outbreaks or biosecurity breaches, require highly accurate and updated geospatial data for efficient spatiotemporal data analysis and visualization; especially when the aim is to promptly inform decision makers and animal health operators (Henriksson et al., 2018; Khashoggi and Murad, 2020; Alam et al., 2022). However, if, on the one hand, Geographic Information System (GIS) solutions have proved to be reliable tools for disease surveillance and disease response (Mengistu and Haile, 2017; EFSA (European Food Safety Authority) et al., 2022), their implementation within AAH initiatives requires for operators to have not only substantial skills and expertise in GIS technologies for data management and spatial analysis but also a great understanding of the unique characteristics of aquatic environments (i.e., marine, transitional, and freshwater). Indeed, such environments are often complex and dynamic, making geospatial data definition, representation, and analysis particularly challenging (Meaden and Aguilar-Manjarrez, 2013; Adams et al., 2016). Including in regions of the world with well-established AAH systems and services, GIS expertise among professionals is often inadequate, and so is their familiarity with the full potential of GIS technologies; not to mention that resources are usually constrained and data availability limited (including environmental, farm registry, and animal health data) (Falconer et al., 2020; Riuzzi et al., 2024). This most likely results in poorly planned GIS projects and, as a consequence, in GIS implementations that fail to deliver reliable outputs and to maximize environmental readiness and exploitation, or that require costly redevelopment to meet evolving needs (Jayanthi et al., 2022). Unlike in GIS projects for terrestrial animals, data capture for aquatic ecosystems requires tailored data models, workflows, and tools, together with specialized approaches. Yet, despite the need for such standardized GIS approaches specific to AAH has been largely recognized (McCallum et al., 2004; Norman, 2008), they still appear to be lacking as most of the existing GIS methodologies are designed for terrestrial applications and cannot be directly adapted to aquatic systems (Guerry et al., 2012; Oidtmann et al., 2013). To the best of these authors’ knowledge, only a few attempts have been made to design and implement new and innovative technological solutions that can be put at the fish sector’s disposal (Guerry et al., 2012), none of which specifically supporting AAH management. This gap leaves stakeholders working within the aquatic domain without clear guidance on planning, implementing, and maintaining GIS projects to address the unique needs of aquatic health monitoring and management (Falconer et al., 2020; Dorotea et al., 2023).
With the goal of filling in this gap, the present study describes the structure and goals of a framework designed to provide a tailored methodological approach to GIS project development for aquatic animal health (AAH) management and based on the key principles of: (i) applicability, (ii) sustainability, (iii) appropriateness, and (iv) opportunity of implementation in aquatic contexts. Furthermore, its application within two case studies in two different aquatic environments, marine and freshwater, will be documented with the further specific goal of testing and reflecting on its practical implementation and actual accessibility, while also identifying experienced and potential benefits coming from its design, as well as challenges and limitations. Lastly, some final recommendations will be shared to ensure the effective adoption and exploitation of the framework to enhance capacity to plan and implement GIS projects in the AAH domain.
2 The framework: context of establishment and validation
In line with the priorities set by the World Organisation for Animal Health (WOAH) in its Aquatic Animal Health Strategy (World Organisation for Animal Health (OIE), 2021), the framework was developed within the international cooperation project Aquae Strength (“Strengthening capacity on aquatic animal health and epidemiological surveillance”)1, which aimed at providing technical assistance and sharing professional know-how to enhance AAH management, especially through the implementation of advanced GIS techniques to support disease surveillance and disease response. The project activities threw, once more, a spotlight on the challenges posed by the application of GIS for AAH purposes, confirming a different level of GIS “maturity” (i.e., organization’s capacity to fully leverage geospatial technology, data, and expertise to implement GIS projects) and application in aquaculture across the world, as well as the following main issue areas:
-
Data: lack of centralized data repositories for fish farms, limited data access;
-
Limited resources: human resources, insufficient tools, funding constraints.
Mostly, such issues are thought to be caused by a lack of standardized GIS methodologies for AAH, leading to inefficiencies in the use of human, time and financial resources (EFSA (European Food Safety Authority) et al., 2022). Therefore, considering also the peculiar challenges that aquatic environments pose, an approach that is both standardized and tailored seems to be needed.
Figure 1 showcases the flow of activities that led to the establishment and validation of the final framework, entitled “A framework for planning GIS projects in the aquatic animal health domain”2, by a panel of ten international GIS professionals with extensive experience and technical knowledge in both AAH management (i.e., veterinary epidemiology, disease surveillance and response) and GIS technologies (i.e., geospatial technologies, data management, and spatial analysis). The experts were selected among the project partners and those that had been involved in the previous project activities3. The first version of the framework was drawn and then shared with the experts, who were asked to provide their revisions and suggestions for modifications and further improvements, especially on structure, methodologies, and key elements. Two rounds of revisions were performed and managed by email and then final modifications and suggestions were discussed and agreed on during a workshop that was held in Padua (February 5th, 2025) and that led to the production of the final version of the framework. Designed as a step-by-step procedure to guide GIS end users through the development phases of a GIS project for disease surveillance and disease response to support AAH management, the framework is meant to target: (i) individuals with minimal experience or mainly unfamiliar with GIS technologies and applications, especially for AAH purposes; (ii) GIS users with various levels of expertise in search of guidance on data and features specific to aquatic environments, or that need resources to compare their own applications, integrate suggested methodologies and standards, and evaluate the accuracy and completeness of their own projects. As shown in Figure 2, the framework describes five main project development phases, further developed through six propositions and nine corollaries, offering main practical guidance and insights for GIS end users and addressing critical aspects of GIS planning in the aquatic domain. For more detailed instructions and guidelines related to the specific propositions and corollaries, the reader is also addressed to the relevant annexes.
Figure 1
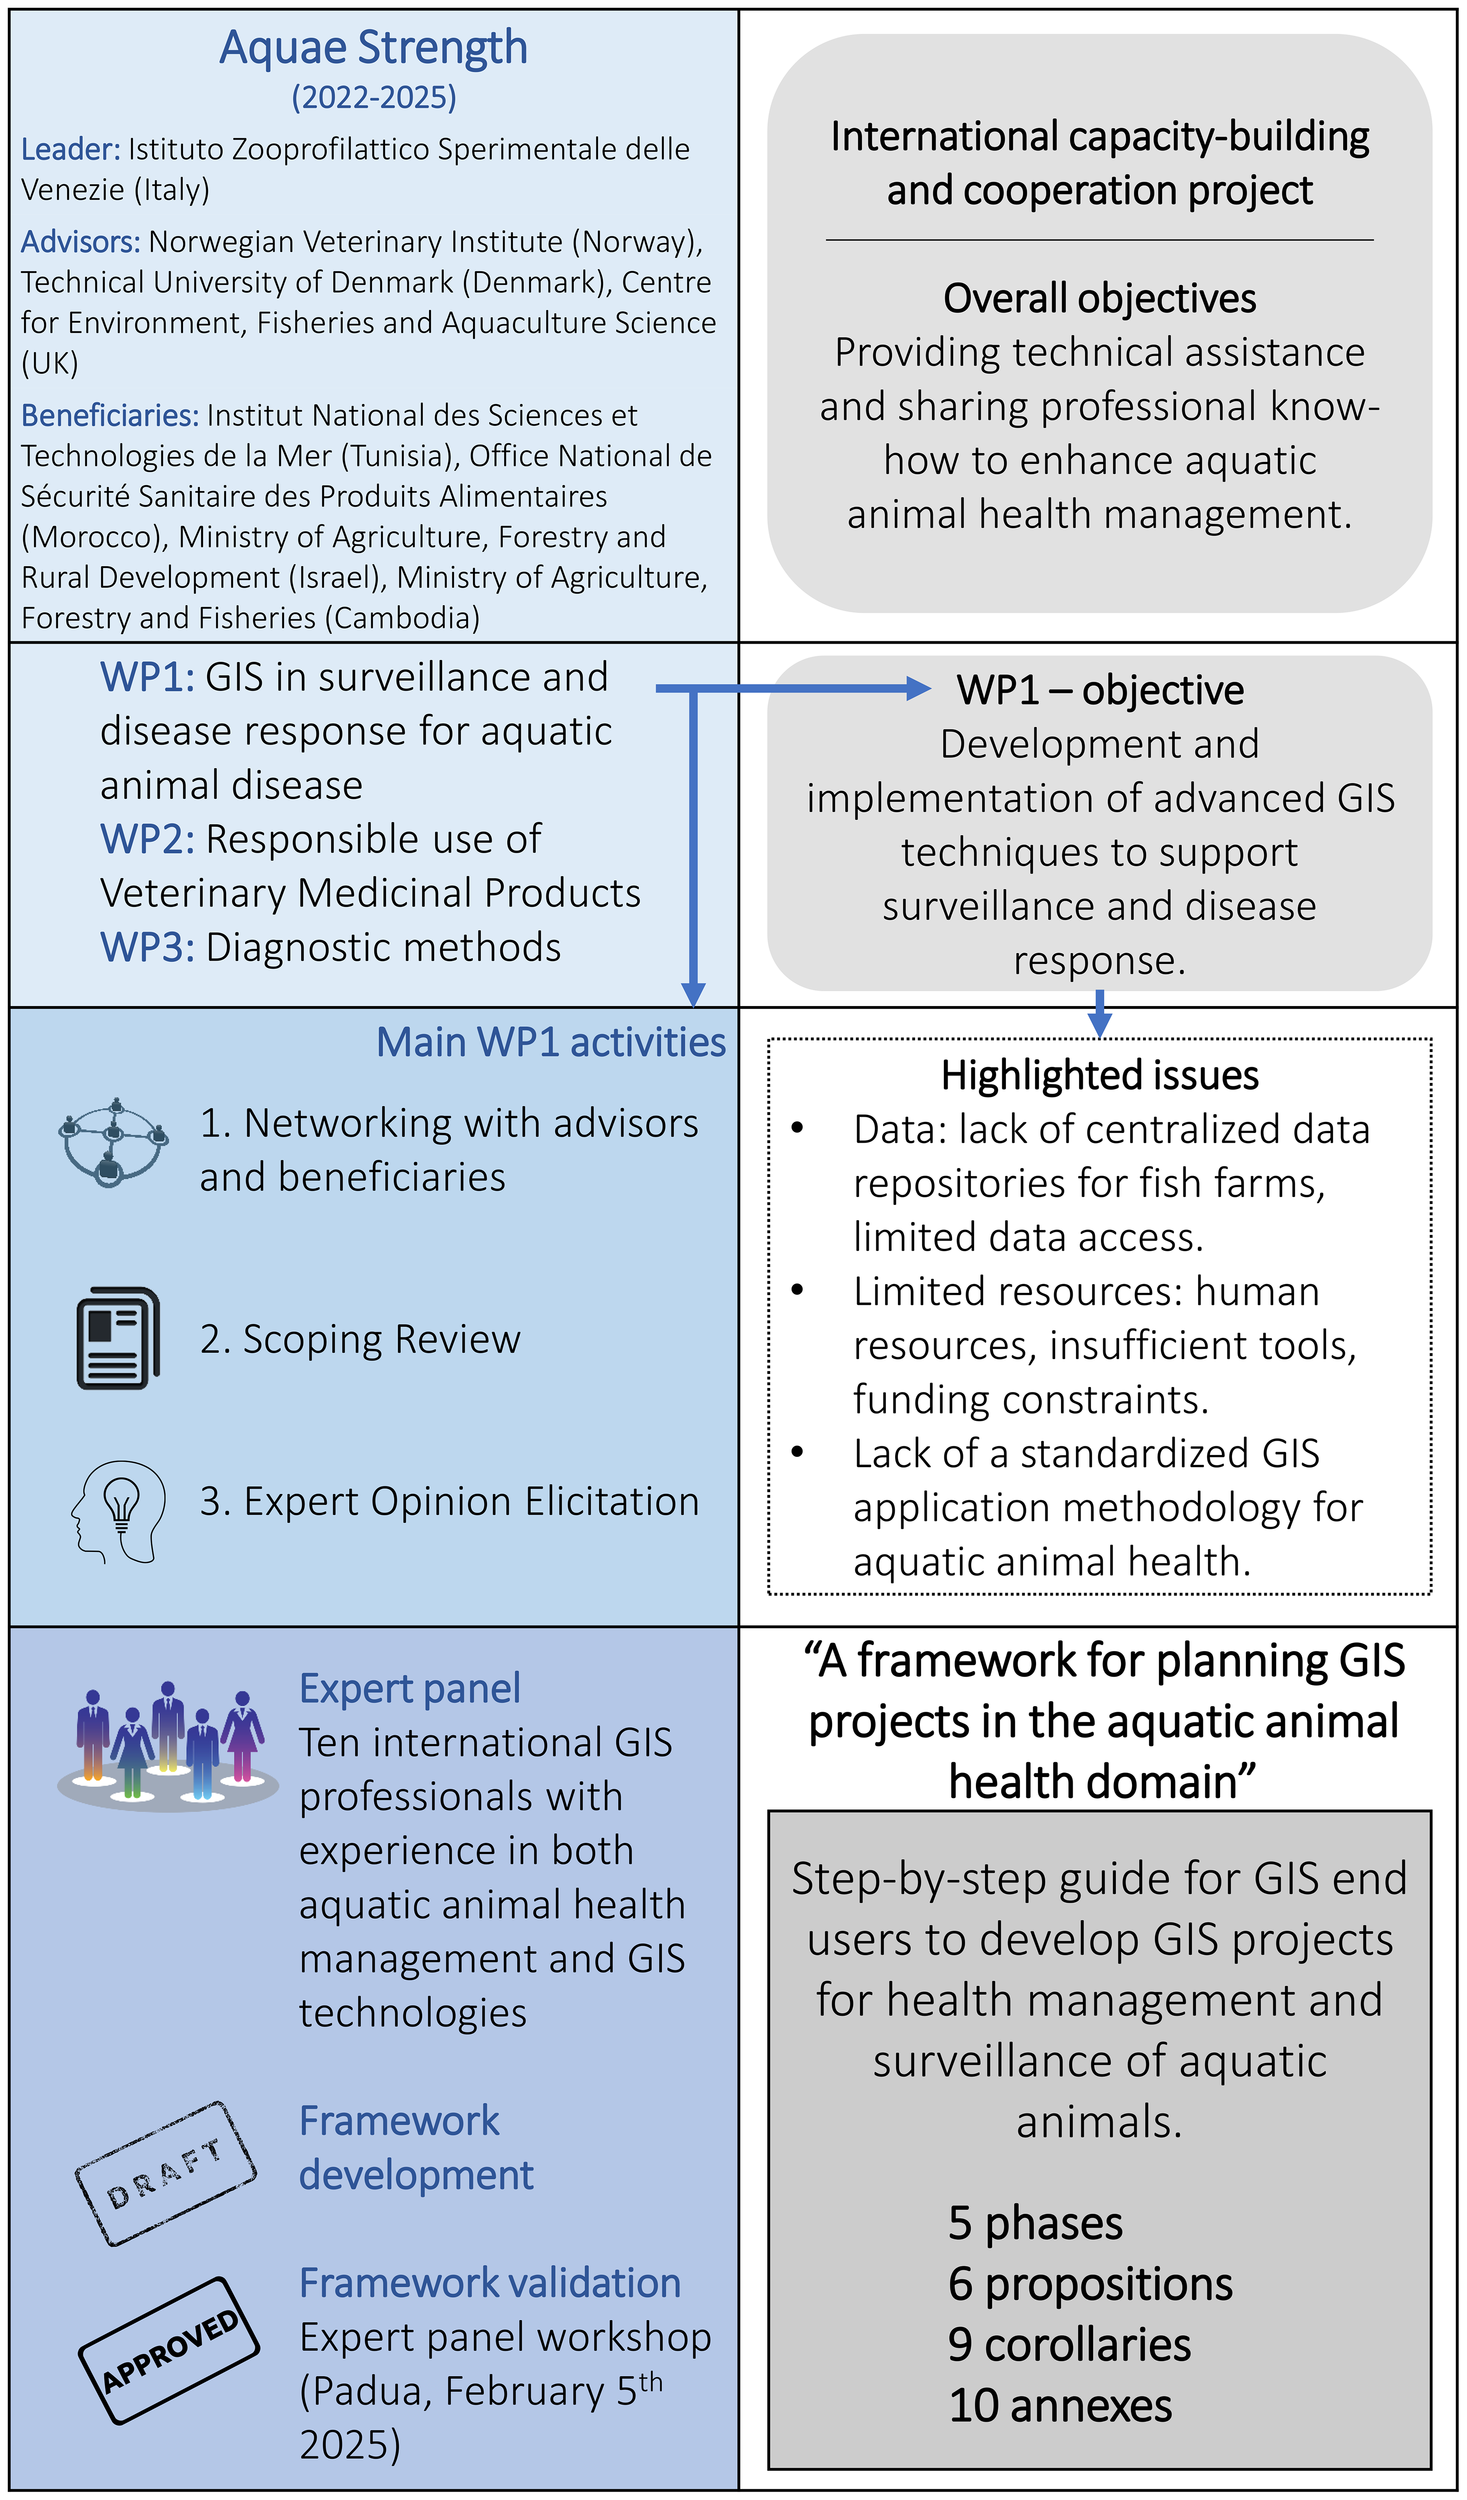
Chart representing the context and flow of activities for the establishment and validation of the framework within the Aquae Strength international cooperation project.
Figure 2
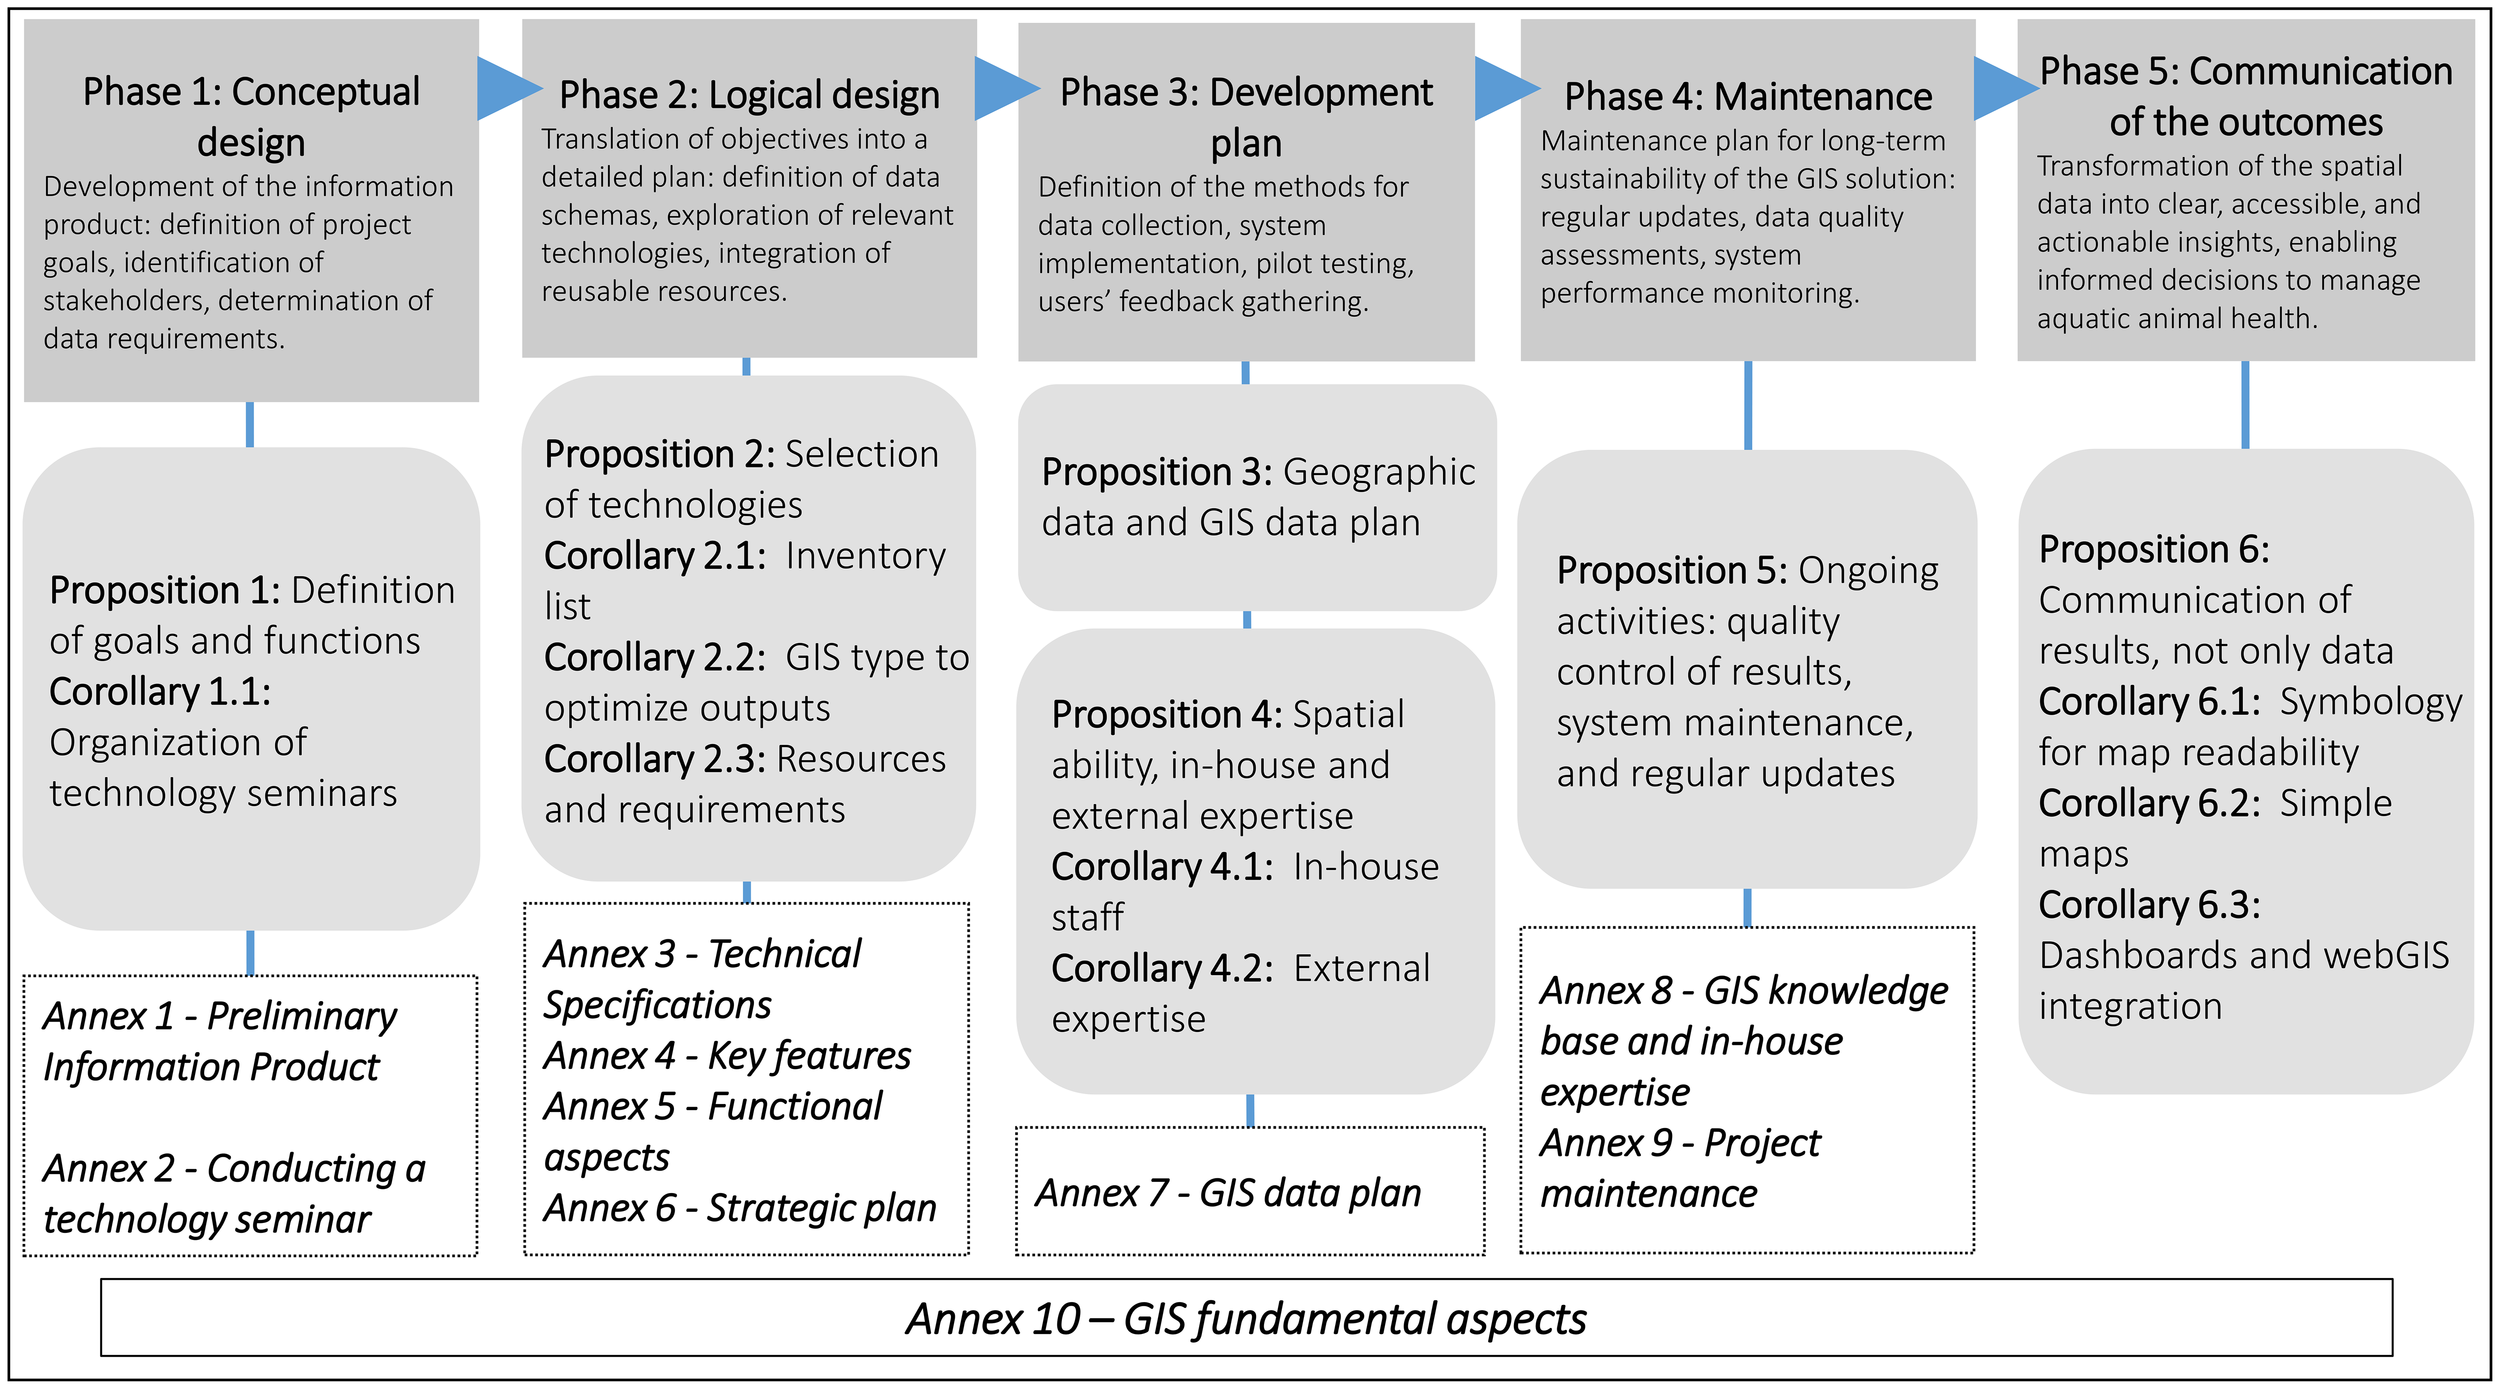
Structural representation of the framework outlining the five suggested steps to plan GIS projects for aquatic animal health purposes through their propositions, corollaries, and annexes.
The main features of these five phases are as follows:
-
Conceptual design: development of the information product, which serves as the backbone of the project; GIS end users define the project goals, identify stakeholders, and determine data requirements.
-
Logical design: the high-level objectives identified in the previous phase are translated into a detailed plan. This involves defining data schemas, exploring relevant technologies, and integrating reusable resources, such as background maps to streamline the development procedure.
-
Development plan: definition of the methods for data collection, system implementation, pilot testing, and users’ feedback gathering to refine the system before full deployment.
-
Maintenance: design of a maintenance plan to ensure the long-term sustainability of the GIS solution. This plan should consider regular updates, data quality assessments, and system performance monitoring.
-
Communication of the outcomes: transformation of the spatial data into clear, accessible, and actionable insights, enabling informed decisions to manage AAH.
3 Application of the framework: two case studies
To evaluate and reflect on its applicability, effectiveness, and accessibility, the proposed framework was implemented in two aquatic environments, marine and freshwater. These two case studies demonstrated its versatility as it is applied in different environmental contexts, and they documented how the framework’s step-by-step process is put into practice in a real-world scenario. Despite the peculiar characteristics and specific requirements of the aquatic environments and, especially from an epidemiological perspective, the differences among them (e.g., marine vs. freshwater vs. transitional) and with the terrestrial contexts that can strongly influence disease spread, the primary purpose of the two framework applications was to produce static maps representing the current disease status from an AAH perspective, the first step to approach the creation and use of a GIS system for epidemiological purposes. Performing further statistical or epidemiological analyses, which would require the integration of dynamic environmental parameters and modelling approaches, was not part of the specific objectives of this study; even though it remains a crucial area for future development to fully exploit GIS potential in aquatic epidemiology.
3.1 Marine environment
3.1.1 Setting and population
The study area coincided with the Tuscan coastline running from Piombino (north; province of Livorno) to Orbetello (south; province of Grosseto): about a hundred kilometers facing the Tyrrhenian Sea. The area has always had a strong vocation for aquaculture, and it has been primarily dedicated to sea bass (Dicentrarchus labrax) and gilthead seabream (Sparus aurata) farming, with a smaller percentage of meagre (Argyrosomus regius)4 farming. The aquaculture method involves the use of floating cages placed about 4 miles away from the coast. In the summer of 2024, the area experienced a severe Lactococcus garvieae outbreak, the first one reported in the marine environment in Italy (Salogni et al., 2024); before that, the pathogen had only been found on rainbow trout (Oncorhynchus mykiss) farms. In April 2025, to investigate the spread of the pathogen, the Toscana Region issued a regional surveillance plan, which provides for constant sampling on farms in the area and for sampling from any wild animals found dead. In May 2025, the Italian Ministry of Health issued a national surveillance plan to assess the possible presence of the disease in other regions of the country and to begin laying the groundwork for a study on the factors that triggered this new health emergency. The two plans are still underway, and only at the end of the data collection process will it be possible to make initial epidemiological assessments. Although the outbreak was, in fact, occurring at the time of the application of the framework, the GIS project developed within this case study was conceived primarily as a “proof-of-concept” to demonstrate the value of GIS as a tool to support outbreak management. Simulated data were used since data collection from farms and laboratory results was still ongoing and because the local authorities had not given their consent to use the preliminary actual data. The project was not designed to develop an operational system for immediate decision-making but, rather, to showcase potential functionalities and the added value of GIS using simulated and representative data. By providing a functional demonstration, the GIS project aimed to help decision-makers appreciate the potential benefits of integrating GIS into their routine disease response workflows, ultimately encouraging its formal adoption and incorporation into the decision-making process.
3.1.2 Phase 1: conceptual design
The framework was applied to develop a GIS pilot project to demonstrate how such a system could integrate and present data and outputs to support disease response against Lactococcosis. The stakeholders’ (regional and local veterinary authorities) requirements were gathered through a series of meetings and interviews aimed at understanding the type of GIS tool that would best meet their operational needs, thereby laying the groundwork for defining the initial “information product” to be delivered. Their main request was to provide a tool capable of identifying fish farm locations, disease cases, and farms within a 5 km buffer zone surrounding the outbreaks (Oidtmann et al., 2013). Specifically, the required output was a set of static maps on two scales (1:300,000 for an overview of the farms; 1:55,000 for details on the farms involved). The QGIS software was used to develop the GIS project (QGIS Development Team, 2024). No complex functionalities were required.
3.1.3 Phase two and three: logical design and development plan
Following the guidance provided by the framework in Annex 3 - GIS Technical Specifications (Figure 2), the set of technologies and data sources necessary for the GIS project were identified and organized as follows:
-
Basemaps: sourced from Open Street Map (OSM Standard; open-source)5 and Google Satellite Imagery (Google Satellite; fee-based)6 useful to represent the spatial context.
-
Administrative boundaries: sourced from the geodata portal of the Toscana Region7 representing Municipalities, Provinces and the Region.
-
Fish farms: data sourced from the Italian National Database and then directly from farmers to complete the dataset.
-
Outbreaks (i.e., laboratory test results from fish samples): in case of positive laboratory test results from fish samples, for specific diseases, fish farms were identified as “outbreaks” with a specific status (‘suspect’, ‘confirmed’, ‘not confirmed’) and specific dates. Simulated laboratory data were generated using the data structure and formats of the Laboratory Information Management System (LIMS) of the Istituto Zooprofilattico Sperimentale delle Venezie as a reference model.
-
Environmental parameters: EMODnet Bathymetry8 was used to acquire bathymetry information, if needed.
In line with what is suggested in the framework’s Corollary 2.2: There is no one-size-fits-all solution in GIS and Corollary 2.3: GIS technologies should be selected based on the available resources and project requirements (Figure 2), the technologies to be used were chosen to optimize outputs according to the project’s specific scope and constraints. Only essential GIS functions were applied (i.e., ‘identify’ and ‘filtering’, along with ‘proximity’ for buffer creation, and ‘select by location’ to identify farms within the buffer zone). However, the use of Corollary 2.1: Organising a technology inventory list for GIS projects, also included in the framework, was not included as it was not part of the project’s mandate, despite its recognized value for long-term system planning and maintenance.
A SWOT analysis was conducted for the proposed solution, producing the following considerations:
-
Strengths: (i) QGIS is a free system with a strong and active community; (ii) the shapefile-based system is easy to manage and requires minimal technological maintenance.
-
Weaknesses: (i) knowledge and responsibility were concentrated on one GIS user; (ii) limited data management capabilities (i.e., no exploitation of database advantages); (iii) limited automation due to the need of manual intervention.
-
Opportunities: limited dataset size allows for easy migration to a dedicated infrastructure.
-
Threats: (i) risk of data loss or corruption due to the lack of database support and manual data handling; (ii) scalability issues as the volume of data grows due to the shapefile-based storage that may become inefficient and difficult to manage; (iii) dependency on a single key GIS user could slows down or disrupts operations when they are not available; (iv) limited ability to integrate with modern external platforms may lead to technological obsolescence.
Neither risk management nor operational plan were required, and no specific metrics were used for the performance evaluation.
3.1.4 Phase four and five: maintenance and communication of the outcomes
A procedure to update outbreaks and zones in case of any new positive case was organized, together with a procedure to update data on marine fish farms. Base maps do not require maintenance.
As already highlighted in section 3.1.1 Setting and population, the outbreak map produced for this paper represents simulated data. Figure 3 shows farm localization (Panel A) and a simulation of the final outbreak map (Panel B) where the buffer zone around the outbreak includes the farms identified as at risk to introduce the pathogen due to the proximity to infected farms.
Figure 3
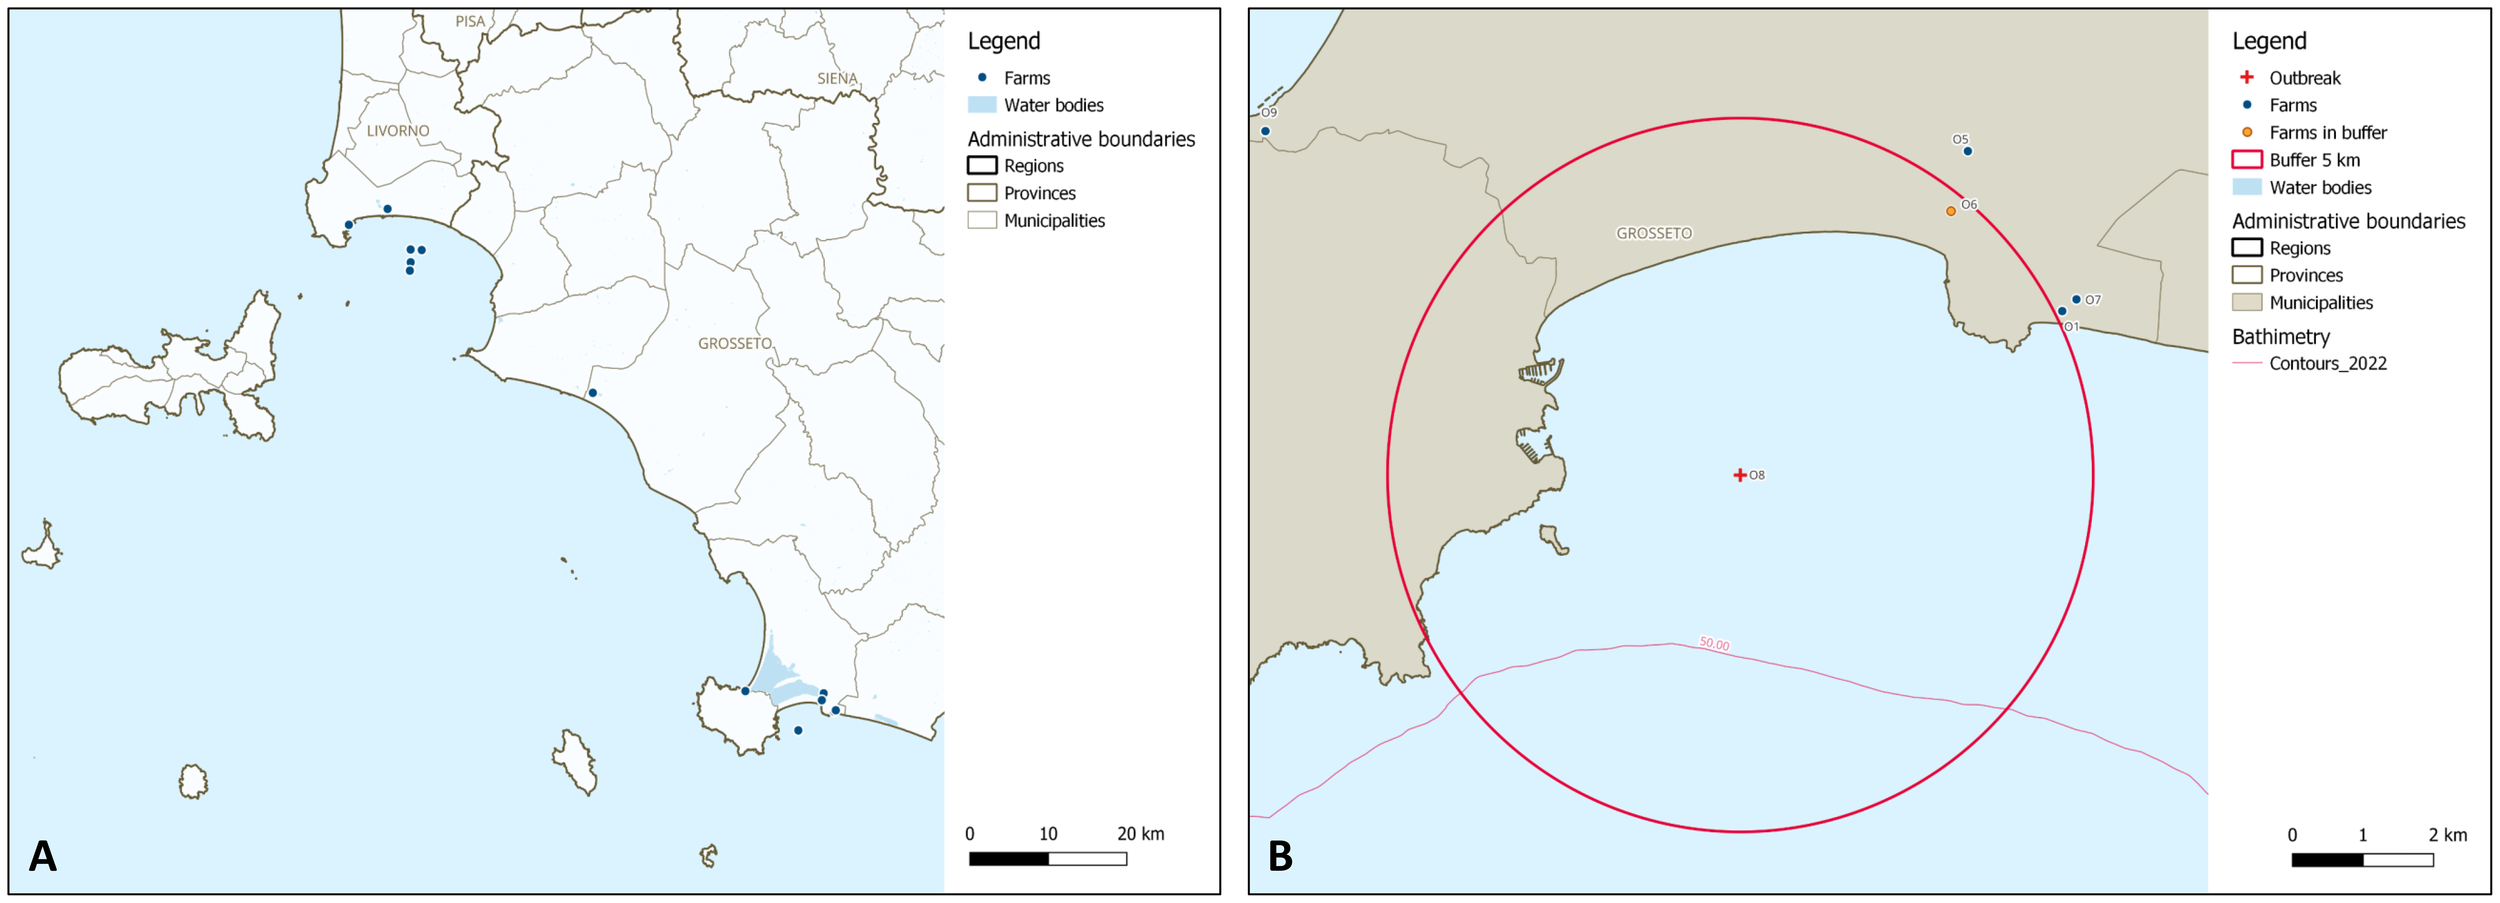
(A) shows farm localization; points (blue dots) represent the centroids of the farms. (B) is a simulation of the final outbreak map where centroids (blue and yellow dots) were used to identify the farms. The buffer zone (red circle) around the outbreak (red cross) includes the farms identified as at-risk (yellow dots).
3.2 Freshwater environment
3.2.1 Setting and population
The study area coincided with the state of Rondônia, in the North Region of Brazil. Specifically, the hydrological area of interest was the Machado River Basin. Aquaculture plays a significant role in the region’s economy, especially thanks to the farming of tambaqui (Colossoma macropomum), one of the most widely farmed fish species in Brazil9. This species is native to the Amazon and Orinoco River systems, including their tributaries, and belongs to the Serrasalmidae family (Gomes et al., 2020). In Rondônia, this species is farmed using primarily semi-intensive systems in excavated ponds, typically created by damming the headwaters of rivers (Pacheco et al., 2025). Despite the economic significance of tambaqui farming in this area, such production is challenged by parasitic outbreaks, among which those caused by acanthocephalans like Neoechinorhynchus buttnerae are of growing concern (Hilsdorf et al., 2021). In fact, high prevalence rates of N. buttnerae, obligate endoparasite of tambaqui, have been associated with the presence of ostracod zooplankton, intermediate hosts in the parasite’s life cycle, as displayed in Panel A of Figure 4. This is exacerbated by inadequate biosecurity practices on many farms, including the absence of liming, species rotation, and sanitary voids between production cycles (Perez Pedroti et al., 2025). Given the full, mainly downstream, connection between ponds and watercourses and the life cycle of N. buttnerae (de Araújo Castro et al., 2020), the movement of infected fish or the flow of water contaminated with eggs or intermediate hosts are the predominant ways for the parasite to spread. This is especially true considering the long pre-patent period (28 to 56 days), which can make a parasitized fish be received with a false-negative diagnosis, and the fact that the larva is highly resistant and can remain viable inside the egg for several months (Kennedy, 2006).
Figure 4
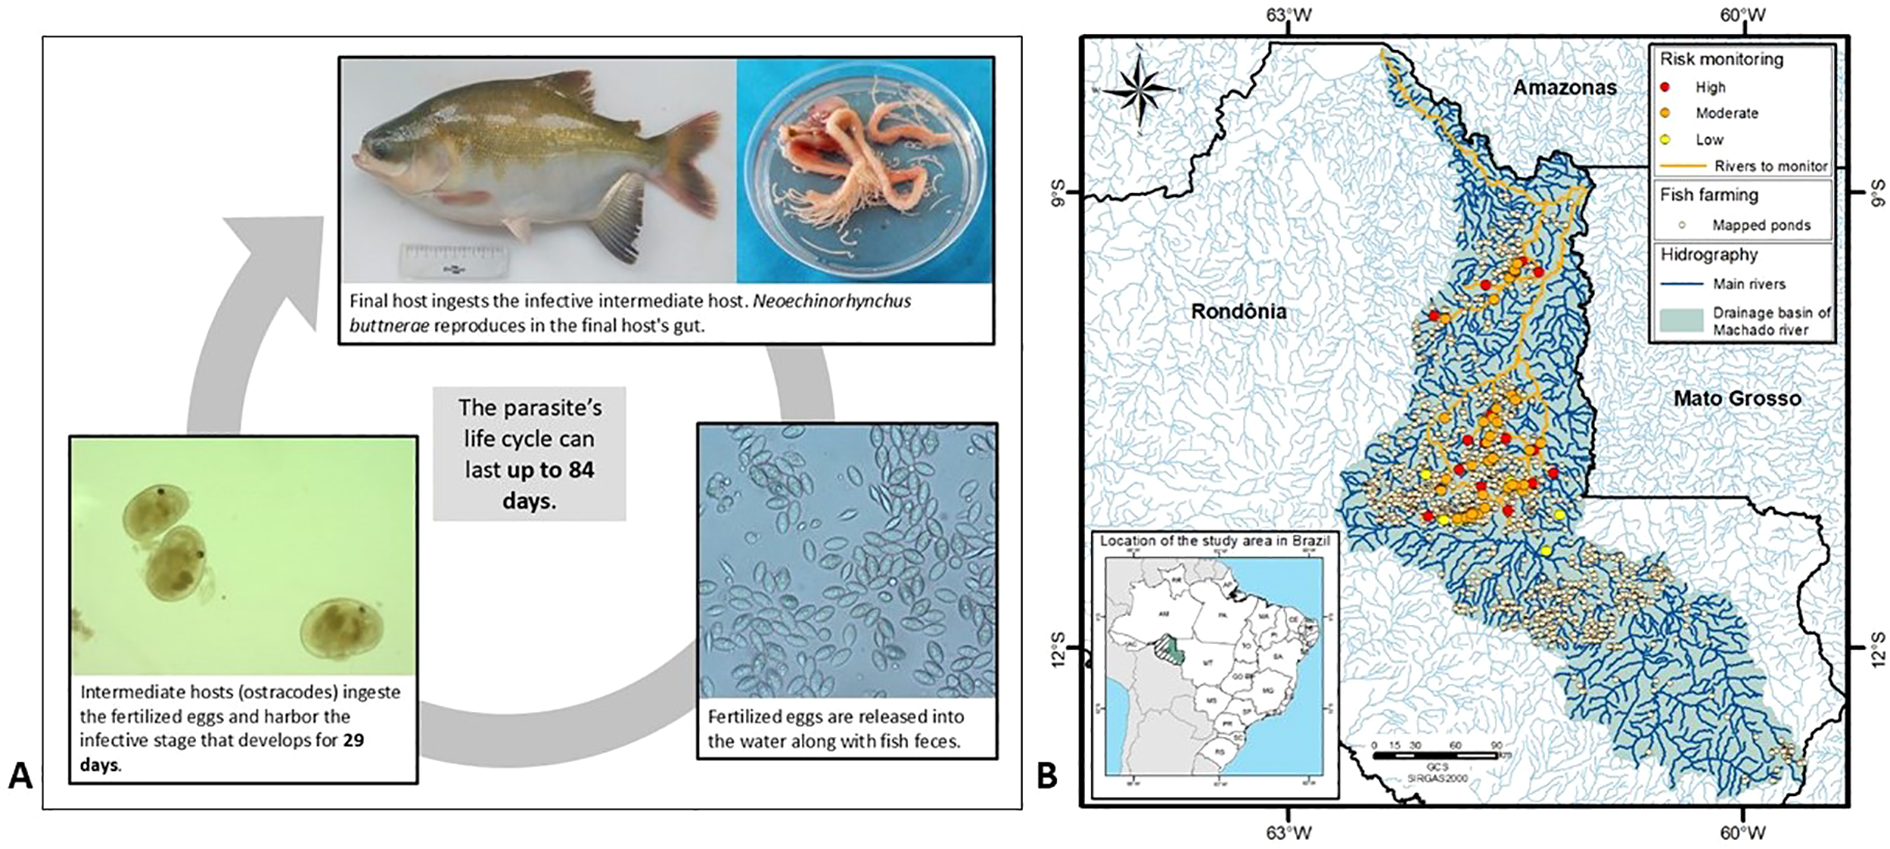
(A) summarizes the life cycle of Neoechinorhynchus buttnerae; contaminated definitive or intermediate hosts and eggs are all potential dispersers of the parasitosis. (B) shows the spatial distribution of fish farms and their associated hazard levels; the map also identifies high-priority monitoring areas based on their hydrological connectivity and confirmed parasite presence.
3.2.2 Phase one: conceptual design
The framework was implemented to develop a one-time effort GIS project dedicated to mapping the potential hazard of spread of the parasite N. buttnerae among the fish farms located in the study area. Given the risk of downstream dispersal of parasite eggs and infected zooplankton following an outbreak, it is recommended that all hydrologically connected sites be monitored for at least two months after initial detection. This two-month timeframe is based on expert judgement and operational considerations, rather than on a formal quantitative risk assessment. In freshwater systems, the dynamic nature of water flow and network geometry strongly influences disease spread. GIS applications for aquatic diseases must account for moving water by performing network analyses, such as flow-direction mapping and downstream dispersal modelling. Although these analyses were not performed in this study, aquatic GIS, unlike terrestrial disease mapping, must handle flow networks and temporal water-quality changes to identify transmission hotspots and guide targeted interventions (Meaden and Aguilar-Manjarrez, 2013). Consequently, the main request by the stakeholders (veterinarian authorities) was the possibility to study the downstream dispersion of the parasite eggs and infected zooplankton following an outbreak, and, in particular: (i) map the aquaculture pond systems and categorize their water sources (e.g., dammed surface water, groundwater, and rain-fed), (ii) map the spatial occurrence of N. buttnerae infections, (iii) identify areas with greater hazard of infection based on their hydrological connectivity and upstream-downstream relationships, and (iv) classify areas at risk of infection to support targeted monitoring and control strategies. In this context, “hazard of infection” is defined as the operational likelihood, for management purposes only, that a pond records at least one infected fish within two months, based on upstream infection occurrence status and hydrological connection between earthen ponds. The QGIS software was used to develop the GIS project (QGIS Development Team, 2024).
3.2.3 Phase two and three: logical design and development plan
Based on the stakeholders’ requirements, an operational workflow was defined to identify and prioritize areas with greater hazard of N. buttnerae spread (steps 1 to 4):
-
Selection of the study area; the Machado River Basin was chosen as the analysis unit since it is a naturally bounded hydrographic system with high internal hydrological connectivity and the largest number of aquaculture facilities mapped via satellite imagery. This basin also benefits from recent georeferenced occurrence data for N. buttnerae (Perez Pedroti et al., 2025).
-
Construction of the spatial database; according to Annex 3 - GIS Technical Specifications (Figure), where the framework specifies that technologies should be selected according to the available resources and project needs, the following relevant datasets were compiled: high-resolution satellite imagery (PlanetScope10, Google Earth11) for pond mapping; official administrative boundaries (IBGE12); aquaculture ponds classified by water source (damming, rain-fed, groundwater) via image analysis; parasite occurrence points; and a digital elevation model (INPE Topodata13) for flow and connectivity analysis. Datasets underwent preprocessing for topological consistency and coordinate reference standardization.
-
Analysis of spatial relationships; using the ‘clip’ and ‘intersect’ geoprocessing operations, spatial rules were established to identify hydrologically connected ponds that were downstream of infected sites. The evaluation carried out by the study team indicated that ponds supplied by dammed surface waters presented a higher hazard of parasite dispersal via infected zooplankton, whereas rain-fed or groundwater-fed ponds had a lower hydrological hazard but could still be exposed through fish movements (broodstock, fingerlings, juveniles).
-
Definition of priority monitoring zones; critical monitoring areas were delineated downstream from confirmed occurrences, focusing on earthen ponds connected to dammed water bodies. Additional watercourse segments without mapped ponds were also identified as potentially relevant for temporary monitoring due to hydrological linkage with infected sites.
A SWOT analysis was conducted for the proposed solution, producing the following considerations:
-
Strengths: the efficient use of free national datasets (IBGE, INPE) enabled low-cost and scalable GIS development.
-
Weaknesses: disease data were obtained through indirect georeferencing, limiting positional accuracy. This may affect the precision of hazard classification and spatial decision-making.
-
Opportunities: data were gathered and organized in a structured way while also integrated with environmental data.
-
Threats: the environmental variability may impact future uses due to altered hydrological conditions, and lack of funding for field validation may constrain the accuracy of future applications.
3.2.4 Phase four and five: maintenance and communication of the outcomes
In this freshwater case study, no maintenance process was defined. The overall outcome of this framework application was a GIS project designed to support an exploratory analysis of N. buttnerae cases in relation to the river network and distribution of fish farms. By visualizing these spatial relationships, the map that was produced enables end users to identify potential risk areas for disease spread and supports a more informed decision-making process to develop surveillance and prevention strategies. Panel B of Figure 4 shows the output map displaying the spatial distribution of fish farms and associated hazard levels. It also identifies high-priority monitoring areas based on their hydrological connectivity and confirmed parasite presence. Panel A, instead, summarizes the life cycle of N. buttnerae.
4 Discussion
4.1 Evaluation of the framework and of its application
The framework presented in this paper offers a structured and tailored approach to GIS planning for aquatic animal health (AAH) management, which is critical for implementing projects effectively, especially for GIS end users working in complex aquatic environments. In fact, when compared to terrestrial contexts, aquatic environments present specific challenges for infectious disease surveillance and control. Pathogen transmission can occur rapidly and over large distances due to hydrodynamic connectivity, such as water currents, tides, or river flows, which may spread pathogens far beyond the initial outbreak site (Alaliyat and Yndestad, 2015). Environmental variables, including temperature, salinity, dissolved oxygen, and nutrient levels, can fluctuate over short timeframes and significantly influence host susceptibility, pathogen persistence and spread, and outbreak seasonality (Urke et al., 2021; Ding et al., 2024). For instance, in the Italian case study, bathymetry was considered since the area did not have a deep seabed, which is a factor to consider due to the poor water recirculation and the consequent persistence of the pathogen. Furthermore, in aquaculture, the boundaries of production units are often more permeable than in terrestrial farming, making containment strategies less straightforward. These factors make it necessary to adapt GIS tools to integrate spatial layers and dynamic environmental data (e.g., hydrological models), which are generally less relevant or absent in terrestrial epidemiology. Through a step-by-step process based on a series of chronological phases (Figure 2), the presented framework is meant to ensure that the developed GIS projects are sustainable, efficient, and aligned with the developers’ intended goals, as well as applicable and reliable for projects of all sizes, including small or one-time efforts. Unlike other existing but more generic models and protocols, the proposed framework combines technical-practical aspects (e.g., inclusion of a master data plan) with organizational and communicative components typical of the AAH research and production sector, that is to say it is meant to put standard theory into practice in the specific context. Moreover, and in line with the “holistic approach” wished by the European Food Safety Authority (EFSA (European Food Safety Authority) et al., 2022), the interdisciplinary and collaborative effort through which the framework was produced allowed combining the experts’ different perspectives and practical insights (Figure 1), ensuring that the final framework was not only robust from a technical point of view but that it also addressed real-world challenges typical of AAH surveillance and management. It also enabled the collection and provision of practical solutions for organizing, maintaining, and analyzing spatial datasets, especially ensuring they are suitable for aquatic environments (Open GIS Consortium, Inc 1999). The two case studies describing the practical applications of the framework, both in the marine aquaculture in Italy and in the freshwater aquaculture in Brazil, demonstrated its versatility and its capacity to be adapted to different environments and to guide the development of GIS projects that are aligned with stakeholders’ expectations, even when using simulated data, as may be the case when testing a new model or information system (Ishiwaka et al., 2021; Karras et al., 2023; Steele et al., 2024) or when real data are not yet available because data collection has not yet been completed (e.g., case study in the Toscana Region, Italy).
4.2 Experienced and potential benefits deriving from the applications
One of the main strengths of the proposed framework is its ability to guide end users, especially those with still limited GIS expertise, through all the stages of GIS project planning and implementation in complex domains such as the AAH one (Tomlinson, 2007; Longley et al., 2015). In particular, it encourages the inclusion of fundamental GIS planning elements that are often overlooked. In fact, by following the framework’s phases, GIS end users of the two Italian and Brazilian studies were able to define goals, select appropriate data sources, structure their systems, and develop outputs that addressed their stakeholders’ needs. As shown by both case studies, the use of the framework facilitated interdisciplinary collaboration by introducing a shared workflow that improved communication between GIS technicians, epidemiologists, and decision-makers. This collaborative alignment contributed to the development of outputs, such as thematic maps, data inventories, and risk assessments, that were in accordance with the established needs, technically robust, and directly applicable to the decision-making processes. Overall, even if not all components of the framework were fully implemented in the two case studies, its structured methodology proved to be an asset for orienting and enhancing the design and execution of GIS projects in the two diverse aquatic environments. The adoption of its approach promoted project consistency and coherence, reducing the risk of fragmented development or redundant efforts, while also fostering a GIS project planning culture (Dennis et al., 2015).
Further potential areas foreseen for the adoption and circulation of the framework, and deriving benefits, include:
-
Capacity building initiatives in contexts where resources are limited and where GIS expertise, background spatial data, and farm registry information may be lacking (Jennings et al., 2016). Its structured approach would help avoid common pitfalls, like fragmented data integration or mismatched technologies, eventually improving disease surveillance and enhancing data sharing.
-
Academic training by scholars and educators, who can use the framework as a valuable resource to bridge the gap between theoretical GIS concepts and real-world applications for AAH. The framework could be included in academic curricula for veterinary and animal science students, providing them with hands-on experience in GIS planning and implementation of GIS projects, also using case studies and examples as it is presented in this paper.
-
Academic research, which may take the opportunity to explore if and how its principles can be adapted to address emerging environmental and health challenges in any given area, such as climate change, emerging diseases, or biosecurity (Jennings et al., 2016; Henriksson et al., 2018; Pacheco et al., 2025).
Table 1 summarizes the abovementioned benefits experienced from the application of the framework within the two case studies, as well as those foreseen for its future and further implementations.
Table 1
| Experienced benefits | Potential benefits | Experienced limitations |
|---|---|---|
| • Guidance for GIS end users of all levels throughout all stages of GIS project planning and implementation • Versatility and adaptability of the tool to different environments and working conditions • Production of a shared workflow that enhanced interdisciplinary communication and collaboration • Development of outputs both in line with the established needs, technically robust, and directly applicable to the decision-making process • Enhancement of project consistency and coherence and limitation of fragmented development and redundant effort |
• Capacity building initiatives in contexts with limited data, resources, and GIS expertise • Academic training as a resource to bridge the gap between theoretical GIS concepts and real-world applications • Academic research to explore if and how its principles can be adapted to address emerging challenges in other research areas |
• Overlooking of some major key planning components (i.e., strategic plan and data plan) which may hinder the long-term continuity and scalability of the project by leading to fragmented and unsustainable project planning • Main reliance on in-house experts rather than on external expertise, especially for complex tasks • Limited exploration of the broad range of GIS functionalities outlined in Annex 5 - GIS functional aspects • Lack of definition of “most effective” layout for output maps in Phase five: Communication of the outcomes • Poorly interactive framework format that may limit end users’ involvement |
Benefits and limitations experienced from the application of the framework within the Italian and Brazilian case studies. Potential benefits foreseen for future applications of the framework.
4.3 Challenges and limitations: lessons learned from the applications
While the two case studies confirmed the framework’s overall applicability and usefulness, they also highlighted areas where GIS project planning in the AAH domain can be further strengthened. In fact, the limitations observed underscored project-level execution deficiencies reflecting a poor GIS planning culture that is widely spread. In both applications, two framework components were not fully leveraged: the GIS strategic plan and the GIS data plan. The omission of a GIS strategic plan, which should provide users with a long-term direction for resource use and allocation, may compromise the continuity and scalability of GIS projects, particularly when one single operator is fully responsible for the technical duties or when institutional long-term vision is lacking (Dennis et al., 2015). Similarly, the inclusion of a GIS data plan document in the GIS planning ensures a structured way to strategically manage, document, and plan the use of key geospatial data within the organization, with emphasis on background maps, shared layers, and reusable datasets (EFSA (European Food Safety Authority) et al., 2022). Especially within the application in the Brazilian freshwater environment, for example, reliance on geospatial information extracted from published literature significantly limited spatial accuracy and the ability to assess the effective value of a structured GIS data plan. This presents an opportunity to further demonstrate the role of such planning documents in ensuring reliable, reusable, and well-documented data infrastructures (Tomlinson, 2007; Longley et al., 2015).
Moreover, both the investigated case studies confirmed that, while in-house GIS personnel are essential for the launch and development of the project, complex tasks like advanced spatial analysis, model development, or system integration often require specialized expertise (McDaid Kapetsky and Aguilar-Manjarrez, 2007). The framework encourages project managers to recognize when external consultants are needed, ensuring that projects are not hindered by in-house personnel’s skill gaps or limited technical capacity. Indeed, the effectiveness of the GIS project’s output is expected to be maximized thanks to the collaborative effort between external experts and in-house human resources (Sinton, 2015; Fang et al., 2018). Furthermore, it must be noted that both the applications primarily focused on the production of static maps, without fully exploring the broader range of GIS functionalities outlined in Annex 5 - GIS functional aspects, including spatial querying, inventory management, or spatial modelling. And even if all maps, including when static, represent spatial phenomena that are naturally dynamic, especially in aquatic environments, and their cartographic representation does not always need to be dynamic to fulfill an analytical or communicative purpose, this limited exploitation of the GIS possibilities suggests, once more, that GIS is largely perceived merely as a cartographic tool, while its full potential as a dynamic decision-support system is widely overlooked. In both case studies, the production of static maps was enough to support the main goals of the pilot application of the framework; that is, to test its coherence, usability, and alignment with stakeholders’ needs. However, it is important to emphasize that the primary objective of the framework is not the production of maps per se but, rather, the establishment of a structured and replicable approach for developing GIS projects that support AAH by providing a coherent, well-structured, and context-sensitive guideline. That said, we do recognize the importance of more advanced and dynamic mapping approaches (e.g., exploratory spatial and temporal data analysis or epidemiological modelling, web-based GIS applications, interactive dashboards, risk assessment, habitat suitability mapping, hydrodynamic and connectivity modelling, as well as integration with early warning and decision-support systems) to be attempted in future tentative applications; for which these first explorative case studies lay the foundation. Moreover, it must be admitted that the current version of the framework does not provide any definition of “most effective” layout for output maps. This should be considered and included to further develop Phase five: Communication of the outcomes in future editions of the framework.
Finally, although the framework is technically comprehensive, its current length and textual format may be discouraging for end users to fully engage. A modular or interactive version, supported by visual examples, could improve its accessibility and promote a broader adoption.
A summarized list of the experienced limitations is also presented in Table 1.
4.4 Recommendations for application
Planning is largely acknowledged as a foundational step for the success of any GIS project, particularly in complex domains such as the AAH one. Therefore, this framework was developed to promote structured planning as the cornerstone of GIS project development and it should be considered as a flexible and adaptable tool that guides users, especially those with limited GIS experience, through the multifaceted decision-making processes required for such a challenging task. Indeed, as demonstrated by the two practical applications described, not all the potential dimensions and challenges associated with GIS projects emerge in every individual implementation. Therefore, the process of applying the framework becomes an opportunity for learning in itself; users become more and more familiar with its structure, utility, and adaptability as they use it in real-world situations. Furthermore, it is important to underscore that the framework takes shape from the interdisciplinary experiences of the involved experts, and that it is claimed to be a working guide to be adapted according to the specific project needs and local conditions, since every possible technical, environmental, and institutional contexts that GIS practitioners might encounter cannot be addressed, especially in the AAH domain. In fact, the proposed framework helps users identify and reflect on the critical components that should be considered for a coherent and complete GIS project development, while still leaving room for local adaptation and innovation. Furthermore, and once more, the authors would like to emphasize the importance of the inclusion of both a GIS strategic plan and a GIS data plan in the project development. Without these two key components, projects may become fragmented, unsustainable, or dependent on a single operator, thereby undermining its own long-term continuity and scalability. On the contrary, embodying them in a GIS development approach helps ensure robust data management, clearer prioritization of resources, and better integration across working teams and systems. Additionally, the use of external GIS consultants should be carefully considered. While internal staff can tackle day-to-day operations, complex spatial analyses, data modeling, or web applications often require specialized expertise. External consultants help overcome inherent limitations of in-house GIS technicians; even though they may not deliver cutting-edge solutions, they are likely to offer practical and resource-appropriate strategies that work well with the institution’s budget, personnel, and time constraints. Finally, the adoption of a GIS data plan is strategic to maximize the reuse of data across multiple projects. Which is in line with what was wished for by other authors and by the experts involved in previous Aquae Strength activities: that is a planning approach based on a forward-thinking vision encompassing the reuse of resources, integration of GIS solutions into other applications or processes, and accessibility and longevity of GIS tools and data (Goodspeed et al., 2016; Pfenninger et al., 2017; EFSA (European Food Safety Authority) et al., 2022). By identifying datasets that are applicable to various GIS applications (e.g., farm registry, aquatic area management), organizations can establish dedicated GIS projects that are exclusively focused on capture, maintenance, and quality control of these shared datasets. This approach ensures that data integrity is consistently guaranteed by the GIS project dedicated to data management, while the other GIS projects do not need to deal with data collection and validation, thus focusing solely on their own specific objectives, exploiting the reliable and up-to-date datasets already created and consistently managed. This enhances operational efficiency, optimizes the use of resources by preventing a waste of effort and ensuring that high-quality data is available across all GIS applications. In particular, the adoption of a GIS data plan is especially important for projects that involve data with cross-cutting applications, as it allows organizations to maximize the efficiency and long-term value of their investments in data collection and management.
5 Conclusions
The framework presented in this study provides GIS end users involved in the aquatic animal health (AAH) domain with both principles and tools to be used to develop GIS projects in a standardized, structured, and tailored way. It bridges the gap between technical methodologies and real-world applications, empowering stakeholders to overcome technological and organizational barriers, improving data quality, facilitating an effective collaboration, and, ultimately, enhancing their ability to implement GIS projects to support AAH activities. By fostering the idea of planning as the prime condition of any successful GIS projects, as well as data reuse and resource optimization as paramount elements to design GIS within an organization, it guarantees functionality, scalability, and sustainability; whether for small-scale projects or projects with multiple users and based on complex technologies. As demonstrated through its application within two case studies in two different aquatic environments, marine and freshwater, this framework promotes the planning as an incremental, step-by-step process that helps GIS users anticipate challenges, define coherent workflows, and manage data effectively. However, it may need to be used flexibly as a tool that provides orientation to navigate the complex challenge posed by designing a GIS project for AAH purposes. Therefore, the authors encourage any potential end user to apply the framework consciously and, rather, to contribute to its evolution. The integration of the framework into further contexts and situations, together with the feedback coming from such integrations, will ensure it remains a living resource that evolves with technological advances and according to field needs.
Statements
Data availability statement
Basemaps, administrative boundaries, topographic, and environmental data can be downloaded from open source repositories (links provided in the article). The Brazilian fish farm and outbreak data were defined specifically for this paper according to a previously published article cited in the article. Italian fish farm data were acquired from the Italian National Database and accessed through the “Istituto Zooprofilattico Sperimentale del Lazio e della Toscana”, while Italian outbreak data were simulated. Requests to access these datasets should be directed to the corresponding author (Giorgia Riuzzi, giorgia.riuzzi@studenti.unipd.it).
Author contributions
FS: Writing – original draft, Writing – review & editing, Investigation, Data curation, Methodology, Conceptualization. GR: Methodology, Writing – review & editing, Writing – original draft, Data curation, Investigation, Conceptualization. RM: Writing – review & editing, Investigation, Data curation, Methodology, Formal Analysis, Visualization. MM: Formal Analysis, Data curation, Methodology, Writing – review & editing, Visualization, Investigation. EF: Writing – review & editing, Investigation, Formal Analysis. ME: Formal Analysis, Writing – review & editing, Data curation, Methodology, Investigation. PO: Investigation, Data curation, Formal Analysis, Writing – review & editing. SS: Supervision, Conceptualization, Writing – review & editing, Resources, Funding acquisition. NF: Funding acquisition, Project administration, Resources, Writing – original draft, Conceptualization, Investigation, Writing – review & editing, Supervision, Methodology.
Funding
The author(s) declared that financial support was received for this work and/or its publication. This study was made possible thanks to the funding support provided by the Italian Ministry of Health and the World Organisation for Animal Health (WOAH) for the international cooperation project entitled “Strengthening capacity on aquatic animal health and epidemiological surveillance” led by the Istituto Zooprofilattico Sperimentale delle Venezie. Open Access funding provided by Università degli Studi di Padova | University of Padua, Open Science Committee.
Acknowledgments
The authors acknowledge the Istituto Zooprofilattico Sperimentale del Lazio e della Toscana “M. Aleandri” and the Osservatorio Epidemiologico in Sanità Pubblica veterinaria “M. Mari” for supporting the application of the framework in the Italian marine environment together with the production of the final maps, and the Toscana Region, Direzione Sanità, Welfare e Coesione sociale, Settore Prevenzione, Salute e Sicurezza, Veterinaria, for providing the necessary data. Finally, the authors thank all the experts involved in the Aquae Strength activities, who contributed to the development and validation of the framework.
Conflict of interest
The authors declare that the research was conducted in the absence of any commercial or financial relationships that could be construed as a potential conflict of interest.
Generative AI statement
The author(s) declared that Generative AI was not used in the creation of this manuscript.
Any alternative text (alt text) provided alongside figures in this article has been generated by Frontiers with the support of artificial intelligence and reasonable efforts have been made to ensure accuracy, including review by the authors wherever possible. If you identify any issues, please contact us.
Publisher’s note
All claims expressed in this article are solely those of the authors and do not necessarily represent those of their affiliated organizations, or those of the publisher, the editors and the reviewers. Any product that may be evaluated in this article, or claim that may be made by its manufacturer, is not guaranteed or endorsed by the publisher.
Footnotes
1.^AquaeStrength. (2023). An international cooperation project as a tool to promote capacity building in the aquaculture. https://www.izsvenezie.it/progetto-aquae-strength/ [Accessed September 8, 2025].
2.^“A framework for planning GIS projects in the aquatic animal health domain”. (2024). http://gis.izsvenezie.it/cooperation/woah/aquae-strength/attachments/activities/pdf/A%20framework%20for%20GIS%20projects%20in%20aquatic%20animal%20health%20domain_ver3.1.pdf [Accessed September 8, 2025].
3.^Geographic Information System in surveillance and diseases response for aquatic animal disease – Publications. http://gis.izsvenezie.it/cooperation/woah/aquae-strength/publications.php [Accessed September 8, 2025].
4.^Associazione Piscicoltori Italiani. https://www.acquacoltura.org/ [Accessed September 8, 2025].
5.^Open Street Map. https://www.openstreetmap.org [Accessed September 8, 2025].
6.^Google for Developers. https://developers.google.com/ [Accessed September 8, 2025].
7.^Regione Toscana - SIPT: Cartoteca. https://www502.regione.toscana.it/geoscopio/cartoteca.html [Accessed September 8, 2025]. Metadata are available at: https://www502.regione.toscana.it/geonetwork/srv/ita/catalog.search#/metadata/r_toscan:05678d81-f6fc-4184-84f4-f8da484d9b4d [Accessed September 8, 2025].
8.^European Marine Observation and Data Network (EMODnet). https://emodnet.ec.europa.eu [Accessed September 8, 2025].
9.^Instituto Brasileiro de Geografia e Estatística. (2023). Produção da pecuária municipal. https://biblioteca.ibge.gov.br/visualizacao/periodicos/84/ppm_2023_v51_br_informativo.pdf [Accessed September 8, 2025].
10.^Earth online – PlanetScope. https://earth.esa.int/eogateway/missions/planetscope [Accessed September 8, 2025].
11.^Google Earth Platform: https://mapsplatform.google.com/maps-products/earth/capabilities/?utm_source=google_earth&utm_medium=site&utm_campaign=next-25&utm_content=legacy [Accessed September 8, 2025].
12.^Instituto Brasileiro de Geografia e Estatística – Downloads. https://www.ibge.gov.br/geociencias/downloads-geociencias.html [Accessed September 8, 2025].
13.^TOPODATA Banco des Dados Geomorfométricos do Brasil – INPE. http://www.dsr.inpe.br/topodata/ [Accessed September 8, 2025].
References
1
Adams T. P. Aleynik D. Black K. D. (2016). Temporal variability in sea lice population connectivity and implications for regional management protocols. Aquac. Environ. Interact.8, 585–596. doi: 10.3354/AEI00203
2
Alaliyat S. Yndestad H. (2015). “ An aqua agent-based model to simulate fish disease dynamics with reference to Norwegian aquaculture,” in 11th International Conference on Innovations in Information Technology (IIT). 356–361 ( IEEE). doi: 10.1109/INNOVATIONS.2015.7381567
3
Alam M. M. Torgo L. Bifet A. (2022). A survey on spatio-temporal data analytics systems. ACM Comput. Surv.54, 1–38. doi: 10.1145/3507904
4
Bang Jensen B. Dean K. R. Huseby R. B. Aldrin M. Qviller L. (2021). Realtime case study simulations of transmission of Pancreas Disease (PD) in Norwegian salmonid farming for disease control purposes. Epidemics37, 100502. doi: 10.1016/j.epidem.2021.100502
5
de Araújo Castro L. Jerônimo G. T. da Silva R. M. Santos M. J. Ramos C. A. de Andrade Porto S. M. (2020). Occurrence, pathogenicity, and control of acanthocephalosis caused by neoechinorhynchus buttnerae: A review. Rev. Bras. Parasitol. Vet.29, 1–7. doi: 10.1590/s1984-29612020070
6
Dennis A. Wixom B. H. Roth R. M. (2015). Systems analysis and design. Eighth edition (USA: John Wiley & Sons, Inc).
7
Ding F. Gagné N. Ditlecadet D. Quinn B. K. Trudel M. (2024). Modelling the dispersion of infectious salmon anemia virus from Atlantic salmon farms in the Quoddy Region of New Brunswick Vol. 9 (Canada and Maine, USA: FACETS), 1–19. doi: 10.1139/facets-2023-0156
8
Dorotea T. Riuzzi G. Franzago E. Posen P. Tavornpanich S. Di Lorenzo A. et al . (2023). A scoping review on GIS technologies applied to farmed fish health management. Animals13, 3525. doi: 10.3390/ani13223525
9
EFSA (European Food Safety Authority) Jijón A. F. Costa R. Nicova K. Furnari G. (2022). Review of the use of GIS in public health and food safety ( EFSA Supporting Publications), 80. doi: 10.2903/sp.efsa.2022.EN-7639
10
Falconer L. Middelboe A. L. Kaas H. Ross L. G. Telfer T. C. (2020). Use of geographic information systems for aquaculture and recommendations for development of spatial tools. Rev. Aquac.12, 664–677. doi: 10.1111/raq.12345
11
Fang Y. Shandas V. Cordero E. A. (2018). Spatial thinking in planning practice: An introduction to GIS (Portland: Portland State University Library).
12
Gomes L. C. Simões L. N. Araújo-Lima C. A. R. M. (2020). “ Tambaqui (Colossoma macropomum),” in Espécies nativas para piscicultura no Brasil. Eds. BaldisserotoB.GomesL. C. ( Editora UFSM, Santa Maria), 175–193.
13
Goodspeed R. Riseng C. Wehrly K. Yin W. Mason L. Schoenfeldt B. (2016). Applying design thinking methods to ecosystem management tools: Creating the Great Lakes Aquatic Habitat Explorer. Mar. Policy.69, 134–145. doi: 10.1016/j.marpol.2016.04.017
14
Guerry A. D. Ruckelshaus M. H. Arkema K. K. Bernhardt J. R. Guannel G. Kim C. K. et al . (2012). Modeling benefits from nature: Using ecosystem services to inform coastal and marine spatial planning. Int. J. Biodivers. Sci. Ecosyst. Serv. Manage.8, 107–121. doi: 10.1080/21513732.2011.647835
15
Hambrey J. (2017). The 2030 agenda and the sustainable development goals: the challenge for aquaculture development and management (Rome, Italy: FAO fisheries and aquaculture circular). C1141.
16
Henriksson P. J. G. Rico A. Troell M. Klinger D. H. Buschmann A. H. Saksida S. et al . (2018). Unpacking factors influencing antimicrobial use in global aquaculture and their implication for management: a review from a systems perspective. Sustain. Sci.13, 1105–1120. doi: 10.1007/s11625-017-0511-8
17
Hilsdorf A. W. S. Hallerman E. Valladão G. M. R. Zaminhan-Hassemer M. Teruo H. T. Koji D. J. et al . (2021). The farming and husbandry of colossoma macropomum: From Amazonian waters to sustainable production. Rev. Aquacult.14, 993–1027. doi: 10.1111/raq.12638
18
Ishiwaka Y. Zeng X. S. Eastman M. L. Kakazu S. Gross S. Mizutani R. et al . (2021). Foids: bio-inspired fish simulation for generating synthetic datasets. ACM Trans. Graphics (TOG).40, 1–15. doi: 10.1145/3478513.3480520
19
Jayanthi M. Kumaran M. Vijayakumar S. Duraisamy M. Anand P. R. Samynathan M. et al . (2022). Integration of land and water resources, environmental characteristics, and aquaculture policy regulations into site selection using GIS based spatial decision support system. Mar. Policy.136, 104946. doi: 10.1016/j.marpol.2021.104946
20
Jennings S. Stentiford G. D. Leocadio A. M. Jeffery K. R. Metcalfe J. D. Katsiadaki I. et al . (2016). Aquatic food security: insights into challenges and solutions from an analysis of interactions between fisheries, aquaculture, food safety, human health, fish and human welfare, economy and environment. Fish. Fish.17, 893–938. doi: 10.1111/faf.12152
21
Karras A. Karras C. Sioutas S. Makris C. Katselis G. Hatzilygeroudis I. et al . (2023). An integrated GIS-based reinforcement learning approach for efficient prediction of disease transmission in aquaculture. Information14, 583. doi: 10.3390/info14110583
22
Kennedy C. R. (2006). Ecology of the acanthocephala (Cambridge, United Kingdom: Cambridge University Press), 260.
23
Khashoggi B. F. Murad A. (2020). Issues of healthcare planning and GIS: A review. ISPRS Int. J. Geoinf.9, 352. doi: 10.3390/ijgi9060352
24
Li D. Li X. Wang Q. Hao Y. (2022). Advanced techniques for the intelligent diagnosis of fish diseases: A review. Animals12. doi: 10.3390/ani12212938
25
Longley P. A. Goodchild M. F. Maguire D. J. Rhind D. W. (2015). Geographic information science and systems ( John Wiley & Sons).
26
McCallum H. I. Kuris A. Harvell C. D. Lafferty K. D. Smith G. W. Porter J. (2004). Does terrestrial epidemiology apply to marine systems? Trends. Ecol. Evol.19, 585–591. doi: 10.1016/j.tree.2004.08.009
27
McDaid Kapetsky J. M. Aguilar-Manjarrez J. (2007). Geographic information systems, remote sensing and mapping for the development and management of marine aquaculture ( Rome, Italy: Food & Agriculture Org). doi: 10.13140/RG.2.1.4046.9842
28
Meaden G. J. Aguilar-Manjarrez J. (2013). Advances in geographic information systems and remote sensing for fisheries and aquaculture Vol. 552 (Rome, Italy: FAO fisheries and aquaculture technical paper). doi: 10.13140/RG.2.1.4037.7682
29
Mengistu T. S. Haile A. W. (2017). Review on the application of geographical information systems (GIS) in veterinary medicine. Int. J. Vet. Health Sci. Res.5, 176–182. doi: 10.19070/2332-2748-1700036
30
Norman S. A. (2008). Spatial epidemiology and GIS in marine mammal conservation medicine and disease research. Ecohealth5, 257–267. doi: 10.1007/s10393-008-0185-x
31
Oidtmann B. Peeler E. Thrush M. Pearce F. Stärk K. Lyngstad T. M. et al . (2013). Project ‘Risk categorisation for aquatic animal health surveillance’ (CFP/EFSA/AHAW/2011/03) Vol. 10 ( EFSA Supporting Publications). doi: 10.2903/sp.efsa.2013.EN-442
32
Open GIS Consortium, Inc (1999). “ Topic 5: features,” in The openGISTM abstract specification. Open GIS Consortium, INC.
33
Pacheco F. S. Heilpern S. A. DiLeo C. Almeida R. M. Sethi S. A. Miranda M. et al . (2025). Towards sustainable aquaculture in the Amazon. Nat. Sustain.8, 234–244. doi: 10.1038/s41893-024-01500-w
34
Perez Pedroti V. Vieira Dantas Filho J. Bezerra de Mira Á. de Lima Pinheiro M. M. Temponi Santos B. L. Garcez Costa Sousa R. et al . (2025). Mapping the Incidence of Infestation by Neoechinorhynchus buttnerae (Acanthocephala) Parasitizing Colossoma macropomum Raised in Fish Farms and the Relationship with Zooplankton Ostracods and Copepods. Vet. Sci.12, 6. doi: 10.3390/vetsci12010006
35
Pfenninger S. DeCarolis J. Hirth L. Quoilin S. Staffell I. (2017). The importance of open data and software: Is energy research lagging behind? Energ. Policy101, 211–215. doi: 10.1016/j.enpol.2016.11.046
36
QGIS Development Team (2024). QGIS geographic information system (Version 3.34).
37
Riuzzi G. Sbettega F. Tavornpanich S. Posen P. Contiero B. Mazzucato M. et al . (2024). Eliciting expert opinion on GIS use for surveillance and disease response in the aquatic animal health domain. Front. Mar. Sci.11. doi: 10.3389/fmars.2024.1429634
38
Salogni C. Bertasio C. Accini A. Gibelli L. R. Pigoli C. Susini F. et al . (2024). The Characterisation of Lactococcus garvieae Isolated in an Outbreak of Septicaemic Disease in Farmed Sea Bass (Dicentrarchus labrax, Linnaues 1758) in Italy. Pathogens13, 49. doi: 10.3390/pathogens13010049
39
Sinton D. S. (2015). “ Spatial thinking and GIS,” in TSTIP@ COSIT, 29–35.
40
Steele S. R. Ranjan R. Sharrer K. Tsukuda S. Good C. (2024). Computer-simulated virtual image datasets to train machine learning models for non-invasive fish detection in recirculating aquaculture. Sensors24, 5816. doi: 10.3390/s24175816
41
Tomlinson R. F. (2007). Thinking about GIS: geographic information system planning for managers (Redlands, California, USA: ESRI, Inc).
42
Troell M. Naylor R. L. Metian M. Beveridge M. Tyedmers P. H. Folke C. et al . (2014). Does aquaculture add resilience to the global food system? Proc. Natl. Acad. Sci. U.S.A.111, 13257–13263. doi: 10.1073/pnas.1404067111
43
Urke H. A. Daae K. Viljugrein H. Kandal I. Staalstrøm A. Jansen P. A. (2021). Improvement of aquaculture management practice by integration of hydrodynamic modelling. Ocean Coast. Manage.213, 105849. doi: 10.1016/j.ocecoaman.2021.105849
44
World Organisation for Animal Health (OIE) (2021). OIE aquatic animal health strategy 2021–2025 (Paris: OIE), 32.
Summary
Keywords
aquatic animal health, animal health management, GIS project development, framework, freshwater environment, marine environment, case studies
Citation
Sbettega F, Riuzzi G, Macario R, Mazzucato M, Franzago E, Eichemberger Ummus M, Oliveira Maciel-Honda P, Segato S and Ferrè N (2026) GIS for aquatic animal health management: a framework for tailored project development. Front. Mar. Sci. 12:1667401. doi: 10.3389/fmars.2025.1667401
Received
16 July 2025
Revised
09 October 2025
Accepted
03 December 2025
Published
05 January 2026
Volume
12 - 2025
Edited by
Vikash Kumar, Central Inland Fisheries Research Institute (ICAR), India
Reviewed by
Ercüment Genç, Ankara University, Türkiye
Leticia E. Bartolomé Del Pino, Universidad Internacional de Valencia, Spain
Updates
Copyright
© 2026 Sbettega, Riuzzi, Macario, Mazzucato, Franzago, Eichemberger Ummus, Oliveira Maciel-Honda, Segato and Ferrè.
This is an open-access article distributed under the terms of the Creative Commons Attribution License (CC BY). The use, distribution or reproduction in other forums is permitted, provided the original author(s) and the copyright owner(s) are credited and that the original publication in this journal is cited, in accordance with accepted academic practice. No use, distribution or reproduction is permitted which does not comply with these terms.
*Correspondence: Giorgia Riuzzi, giorgia.riuzzi@studenti.unipd.it
†These authors have contributed equally to this work and share first authorship
Disclaimer
All claims expressed in this article are solely those of the authors and do not necessarily represent those of their affiliated organizations, or those of the publisher, the editors and the reviewers. Any product that may be evaluated in this article or claim that may be made by its manufacturer is not guaranteed or endorsed by the publisher.