Abstract
To effectively conserve coral reef ecosystems, it is essential to monitor changes in fish fauna using minimally invasive methods. In this study, we conducted a fish survey in the Dongsha Atoll using eDNA metabarcoding. Analyzing 37 sequencing units from 26 water samples collected across 12 sites from May 2017 to September 2018, we identified 421 species from 79 families. Among these, 192 species had not been recorded in previous conventional surveys. Some of these newly recorded species are fast-swimmers, while others may be larvae or eggs, which are challenging to observe visually. However, 68% of species documented in previous records were not detected in our study. This limitation is likely due to insufficient samplings, primer specificity, fish characteristics, and rapid DNA degradation in the dynamic physical and chemical conditions (e.g., temperature, pH) of the coastal environment. Despite that eDNA metabarcoding cannot capture the full range of species within the atoll, it effectively complements visual census surveys by enriching our understanding of the diverse fish community in marine habitats.
1 Introduction
The conservation of coral reefs is of paramount importance due to their significant ecological, economic, and social value (Pearson, 1981). They support a vast array of marine species, with estimates suggesting that they are home to a quarter of all marine species worldwide. These ecosystems are therefore crucial for maintaining marine biodiversity (Souter and Linden, 2000). However, coral reefs are increasingly threatened by climate change, pollution, overfishing, and habitat destruction, which have led to the deterioration and loss (Souter and Linden, 2000; Knowlton, 2001). Urgent conservation efforts are needed to ensure their protection and restoration.
The Dongsha Atoll serves as an important stepping stone that promotes regional genetic connectivity in the South China Sea (Liu et al., 2021). The strongest internal wave worldwide transports cold and nutrient-rich water shoreward, making Dongsha a refuge for coral reefs from the rising temperatures and potentially enhancing their resilience to severe bleaching events (Alford et al., 2015; Reid et al., 2019). The ring-shaped reef flat provides diverse habitats, including coral reefs and seagrass beds, and acts as a breeding and nursery ground for various marine species, playing a crucial role in maintaining ecological balance in the South China Sea (Tkachenko and Soong, 2017). To conserve these valuable resources, it is essential to monitor the composition of organisms. Prior fish fauna investigations in Dongsha Atoll have primarily relied on underwater visual surveys and fishing. Yang et al. (1975) were the first to investigate and recorded 25 species in Dongsha Atoll. Chen et al. (1991) expanded the survey locations to include one small lagoon and six subtidal areas, recording 264 species, 255 of which were new records. With continued surveys, a total of 718 species belonging to 74 families have been recorded over the past 44 years (Liao et al., 2018). Although biodiversity is high in Dongsha Atoll, conventional surveys are time- and labor-intensive and often focus on selected taxa or habitat rather than assessing the entire ecosystem. Therefore, further investigation of the fish fauna in Dongsha Atoll remains warranted.
Conventional methods for surveying fish populations and distributions, including angling, trapping, netting, and direct observation via visual census, have limitations, especially when targeting highly mobile or low-density species (Caldwell et al., 2016). These methods often vary in effectiveness due to differences in taxonomic expertise among researchers and the lack of standardized procedures (Fediajevaite et al., 2021). In addition, the potentially invasive nature of the techniques can disrupt aquatic habitats and raise ecological concerns (Gold et al., 2021; Hammerl et al., 2024). To address these shortcomings, recent advancements in molecular technologies have introduced the use of environmental DNA (eDNA) (Ficetola et al., 2008).
eDNA consists of DNA fragments that organisms release into the environment through various means, such as feces, epidermal mucus, sloughed cells, and urine (Ficetola et al., 2008; Thomsen and Willerslev, 2015). This DNA can be collected from environmental samples, allowing researchers to identify species present in a given area without the need for physical capture or direct observation (Jeunen et al., 2022). In addition to detecting specific species, universal primers have been designed to amplify sequences from specific taxonomic groups (Zhang et al., 2020). These primers generally achieve high detection rates up to 90% in previous studies conducted in aquarium tanks (Miya et al., 2015).
Furthermore, researchers have compared the detection capabilities of eDNA metabarcoding with those of conventional survey methods in field surveys. Most prior research indicates that eDNA reveals a higher diversity of species compared to conventional methods (Fraija-Fernández et al., 2020; Gold et al., 2021; Valdivia-Carrillo et al., 2021). The effectiveness of eDNA metabarcoding in detecting species observed by conventional methods has also been demonstrated. For instance, Gold et al. (2022) reported a 94% detection rate using eDNA, while Stoeckle et al. (2021) found a range of 70-75%, He et al. (2023) observed a 64% detection rate, and McClenaghan et al. (2020) reported 60%. Furthermore, Murakami et al. (2019) conducted a dispersion and degradation experiment on eDNA and indicated a short detectable distance of 30 meters in Maizuru Bay, Japan. Ogata et al. (2021) conducted a tank study and found eDNA undetectable one day after fish removal. This suggests that eDNA metabarcoding can provide a relatively fine-scale spatial resolution of vertebrate communities.
In coral reef ecosystems, eDNA metabarcoding proves invaluable as a complementary tool for studying highly diverse fish communities (Mathon et al., 2022; Muenzel et al., 2024). For example, Bessey et al. (2023) found that 149 of 205 eDNA-detected species were not reported by visual surveys in a coral reef lagoon within the Ningaloo Marine Park, Western Australia, Oka et al. (2021) observed 193 of 291 eDNA-detected species were not recorded by netting and fishing in a coral reef lagoon in Okinawa, Japan. Tsai et al. (2023) reported 311 of 383 eDNA-detected species were not observed in visual surveys of coastal coral reefs in Taipei, Northern Taiwan. Owing to its high sensitivity in revealing hardly-detected species, such as cryptobenthic and migratory organisms, and its minimal invasiveness toward the environment, eDNA metabarcoding has been suggested as a powerful tool to make visual surveys more comprehensive and efficient (Nguyen et al., 2020).
In this study, we collected eDNA samples once per season from five stations in the Dongsha Atoll in 2017 and 2018, aiming to characterize fish composition using molecular techniques and predict the species richness. By comparing the Dongsha species list recorded in prior conventional surveys, we assessed the feasibility of applying eDNA in detecting highly diverse marine areas.
2 Materials and methods
2.1 Samplings
Five stations in the Dongsha Atoll were selected, including Dongsha Island (station 1), the center of inner atoll (station 2), the northern inner atoll (station 3), the northern outer atoll (station 4) and the northern outer atoll one kilometer away (station 5). From May 2017 to September 2018, we sampled all sites once each season, except for winter, when harsh weather conditions limited sampling to station 1. Besides, we sampled three more stations—located at the south, north, and northeast outer atoll (station 3-1, 11-1, and 21-1)—during March and April 2018. In September 2018, we also sampled four additional stations (station A1, A2, A3, and A4) in the inner atoll (Figure 1, Table 1).
Figure 1
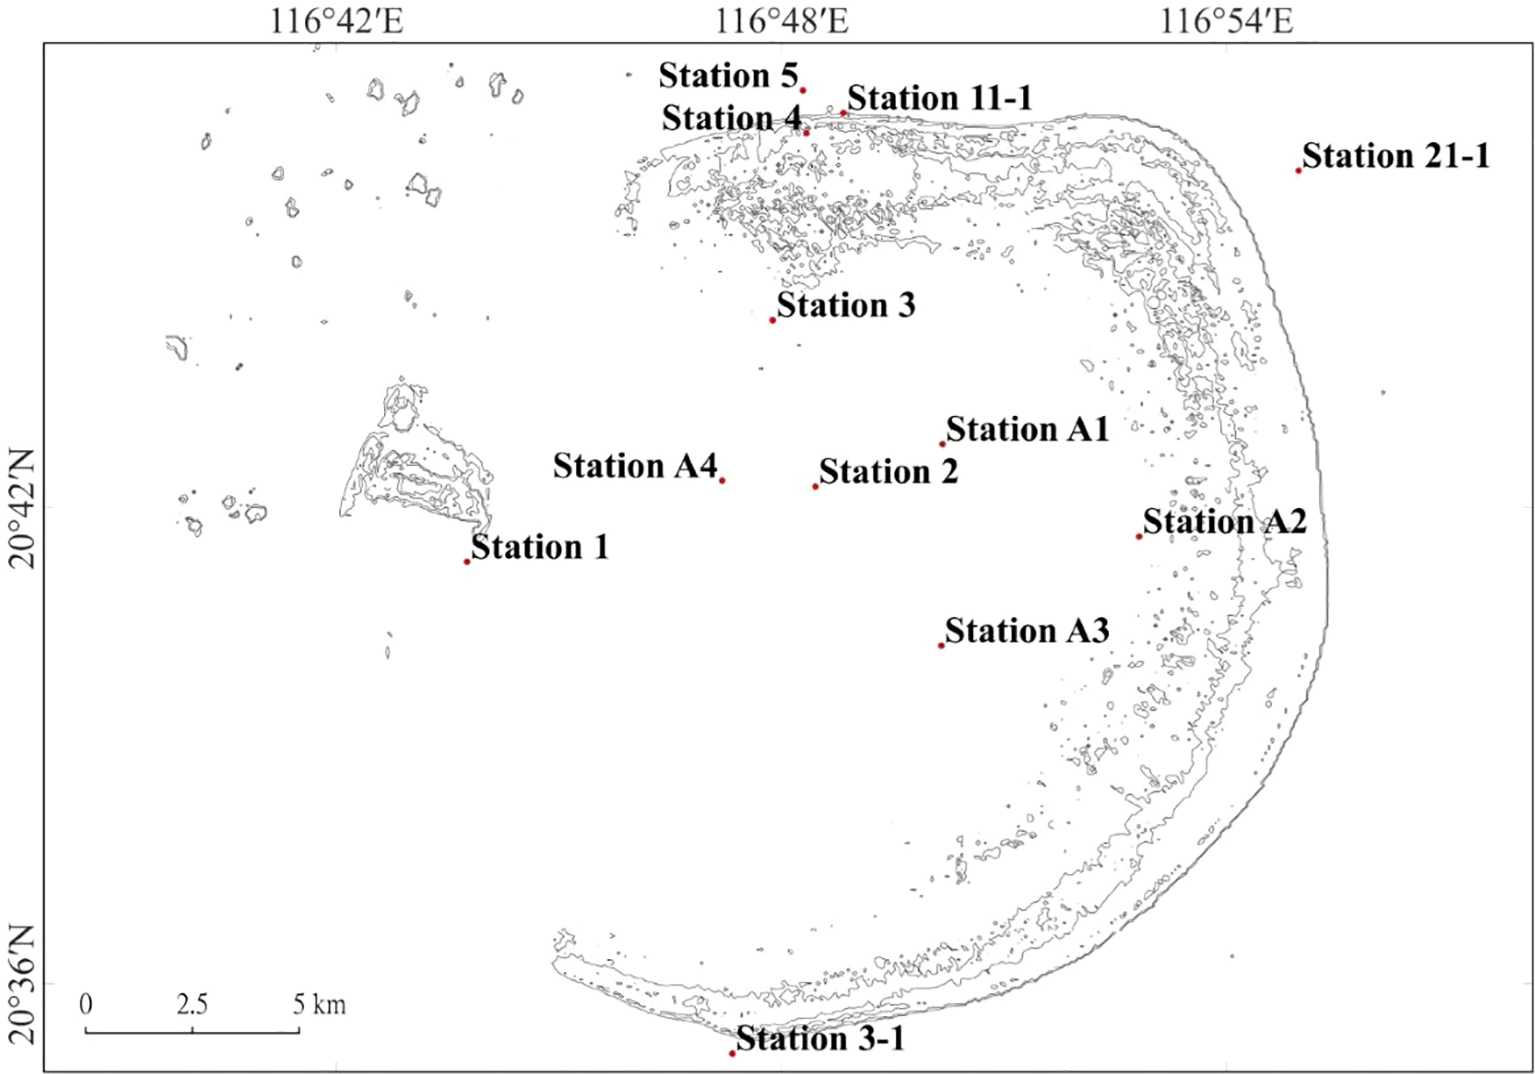
The twelve sampling stations in the Dongsha Atoll.
Table 1
| Date | Station Name | Samples | Lat. (N) | Long. (E) | Sampling Depth (m) |
|---|---|---|---|---|---|
| 03/2018 | Station 1 | SP1 | 20°41'19.08" | 116°43'45.59" | 0 |
| 03/2018 | Station 2 | SP2 | 20°42'15.93" | 116°48'27.41" | 0 |
| 03/2018 | Station 3 | SP3 | 20°44'21.75" | 116°47'52.85" | 0 |
| 03/2018 | Station 4 | SP4 | 20°46'43.14" | 116°48'20.12" | 0 |
| 03/2018 | Station 5 | SP5 | 20°47'15.48" | 116°48'17.30" | 0 |
| 05/2017 | Station 1 | SU1 | 20°41'19.08" | 116°43'45.59" | 0 |
| 06/2018 | Station 2 | SU2 | 20°42'15.93" | 116°48'27.41" | 0 |
| 06/2018 | Station 3 | SU3 | 20°44'21.75" | 116°47'52.85" | 0 |
| 05/2017 | Station 4 | SU4 | 20°46'43.14" | 116°48'20.12" | 0 |
| 06/2018 | Station 5 | SU5 | 20°47'15.48" | 116°48'17.30" | 0 |
| 09/2018 | Station 1 | F1 | 20°41'19.08" | 116°43'45.59" | 0 |
| 09/2018 | Station 2 | F2 | 20°42'15.93" | 116°48'27.41" | 0 |
| 09/2018 | Station 3 | F3 | 20°44'21.75" | 116°47'52.85" | 0 |
| 09/2018 | Station 4 | F4 | 20°46'43.14" | 116°48'20.12" | 0 |
| 09/2018 | Station 5 | F5 | 20°47'15.48" | 116°48'17.30" | 0 |
| 02/2018 | Station 1 | W1 | 20°41'19.08" | 116°43'45.59" | 0 |
| 09/2018 | Station A1 | A1 | 20°42'48.06" | 116°50'10.32" | 0 |
| 09/2018 | Station A2 | A2 | 20°43'38.16" | 116°52'49.44" | 0 |
| 09/2018 | Station A3 | A3 | 20°40'15.60" | 116°50'9.36" | 0 |
| 09/2018 | Station A4 | A4 | 20°42'20.40" | 116°47'12.00" | 0 |
| 04/2018 | Station 3-1 | 3-1S | 20°35'6.84" | 116°47'20.28" | 0 |
| 04/2018 | Station 3-1 | 3-1D | 20°35'6.84" | 116°47'20.28" | 30 |
| 03/2018 | Station 11-1 | 11-1S | 20°46'58.50" | 116°48'50.10" | 0 |
| 03/2018 | Station 11-1 | 11-1D | 20°46'58.50" | 116°48'50.10" | 30 |
| 03/2018 | Station 21-1 | 21-1 S | 20°46'14.88" | 116°54'58.38" | 0 |
| 03/2018 | Station 21-1 | 21-1 SD | 20°46'14.88" | 116°54'58.38" | 30 |
Sampling date, location and depth of each sample.
SP means spring; SU means summer; F means fall; W means Winter.
Before water sampling, all bottles were cleaned with 10% bleach several days prior to use and then rinsed three times with seawater from each sampling station. Surface layer water was collected at all stations, while at Stations 3-1, 11-1, and 21-1, additional seawater samples were taken at a depth of 30 meters. Five liters of seawater were collected from each sampling site and immediately filtered through 47-mm diameter GF/F filters with a pore size of 0.7 μm (GE Healthcare-Whatman). The filters were then divided into four equal parts, placed into autoclaved microcentrifuge tubes, and stored at -20 °C until DNA extraction. In total, 26 eDNA samples were included in this study (Figure 1, Table 1).
2.2 DNA extraction, PCR, electrophoresis and purification
One of the four filter quarters was processed for DNA extraction by using the GeneMark Easy Tissue & Cell Genomic DNA Purification kit, following the manufacturer’s standard protocol. The final DNA pellet was dissolved in 50 μl milli-Q water.
Targeted fish 12S rRNA sequences were amplified using MiFish-U primers for all samples. Additionally, MiFish-E primers were employed for samples from stations 3-1, 11-1, and 21-1 (Miya et al., 2015). Besides, two PCR replicates were performed for samples from stations 3-1, 11-1, and 21-1. Prior to PCR amplification, the extracted eDNA was diluted 30 times with Milli-Q water to minimize the effects of potential inhibitors. The PCR reaction mixture had a total volume of 12 μl, which included 2 μl of Milli-Q water, 6 μl of 2X KAPA HiFi HotStart ReadyMix (KAPA Biosystems, Wilmington, MA, USA), 1 μl of each MiFish primer (5 μM), and 2 μl of DNA template. The thermal cycle condition was an initial preheating at 95°C for 3 minutes; 35 cycles of 98°C for 20 seconds for DNA denaturation, 60°C for 20 seconds for primers annealing, and 72°C for 15 seconds for target sequence extension; and a final extension at 72°C for 3 minutes. Negative controls were included in every PCR run, in which 2 μl of DNA template was replaced with 2 μl of Milli-Q water to ensure that no contamination originated from the reagents or water.
After the first-round PCR amplification, we verified the length of the DNA products by electrophoresis using 1% agarose gels. Target region bands between 150 and 250bp were excised from the agarose gel and the DNA was extracted using the GeneMark DNA Clean Kit in order to remove non-target PCR products (Gibson et al., 2010; Utthiya et al., 2022). The purified products were then diluted 30 times with Milli-Q water and used as templates for the second-round PCR. In the second-round PCR, 8-bp MiSeq barcode sequences were added to both ends of the amplicons. This was achieved using a forward primer and a reverse primer, each designed with an 8-bp MiSeq barcode at the 5’ end (Supplementary Table 1). The reaction mixture had a total volume of 25 μl, consisting of 1 μl of each primer, 3 μl of Pro Taq 10X Buffer (Protech), 2 μl of each dNTP (Protech), 0.15 μl of Pro Taq Plus (Protech), 1 μl of DNA template, and 16.85 μl of Milli-Q water. The thermal cycle was an initial preheating at 94°C for 5 minutes; followed by 35 cycles of 94°C for 1 minute for DNA denaturation, 60°C for 15 seconds for primers annealing, and 72°C for 15 seconds for target sequence extension; and a final extension at 72°C for 3 minutes. Subsequently, we confirmed the sizes of all PCR products through electrophoresis using 1% agarose gels. One of the replicates of surface water eDNA product from station 3–1 amplified by MiFish-U and MiFish-E were pooled together, and so did the surface and bottom water eDNA product from station 21-1. Finally, all the products were sent to biotechnology company (Genomics, Taipei) for next-generation sequencing on the Illumina MiSeq platform using the v3 reagent kit, generating 300 bp paired-end reads.
2.3 Bioinformatics
All MiSeq read quality assessments were conducted using FastQC (Andrews, 2010). Following the identification of technical errors in the MiSeq sequencing, the low-quality tails of each read were trimmed using DynamicTrim.pl from the SolexaQA software package (Cox et al., 2010), ensuring that the Phred score of the last base was no less than 20 (Yamamoto et al., 2017). Subsequently, we removed PCR amplicons that fell outside the expected size range (220 ± 25 bp). The remaining sequences were subjected to multiple sequence alignment using MAFFT v7.0 (Katoh and Toh, 2008) and converted from FASTQ to FASTA format. Primer sequences were removed using MEGA v10.0 (Kumar et al., 2016). To confirm sequence identification, all sequences were queried against the GenBank database at NCBI (National Center for Biotechnology Information) with a minimum identity threshold of 97% to reference sequences. Results were further validated using the Fish Database of Taiwan and FishBase to ensure the identified species were distributed in the nearby regions. When a sequence showed the same identity to several species, we assigned it to the species reported to inhabit the Dongsha Atoll or nearby areas.
2.4 Conventional survey
The checklist of fish fauna from the Dongsha Atoll, compiled using conventional methods such as underwater observation and fishing, was based on the reports “Investigation of Fish Resources in the Dongsha Atoll” (Liao et al., 2018). Because the taxonomic status of some species has changed, we updated the scientific names of certain species accordingly. Taxonomic classifications in this study were referenced from Eschmeyer’s Catalog of Fishes, updated as of July 9, 2024. A total of 718 species from 74 families have been recorded in the Dongsha Atoll.
2.5 Species estimation analysis
The species estimation analysis accomplished in R with library SpadeR (Species-richness Prediction and Diversity Estimation in R) (version: Sep. 9, 2016) (Chao et al., 2016). To avoid underestimating species richness due to repeated sequences from replicates, we only included sequences from stations 1 to 5 collected during spring, summer, and autumn, with a total of 15 sequencing units. Based on the frequency of species being detected and the distance between each data, we predicted the number of additional species that could be detected with further sampling. Ultimately, we estimated the species richness detectable by eDNA metabarcoding for the Dongsha fish assemblage and assessed detection saturation via iChao estimator (Chao and Jost, 2015).
3 Result
3.1 Sequence quality control and assignment
Out of the 26 samples amplified using MiFish-U primers, two replicates failed to amplify: one replicate each from the bottom water samples at stations 3-1 and 11-1. Additionally, of the 12 samples amplified with MiFish-E primers, two samples failed to amplify, both from the bottom water sample at station 3-1. For sequencing, one replicate of the surface water sample from station 3-1, one replicate of the surface water sample from station 21-1, and one replicate of the bottom water sample from station 21–1 were successfully amplified by both MiFish-U and MiFish-E primers and pooled together. This resulted in a total of 37 sequencing units (Table 2).
Table 2
| Samples | Primers | Sequencing data | Samples | Primers | Sequencing data |
|---|---|---|---|---|---|
| SP1 | MiFish-U | SP1 | 3-1 D (1) | MiFish-U | N/A |
| SP2 | MiFish-U | SP2 | MiFish-E | ||
| SP3 | MiFish-U | SP3 | 11-1 S (1) | MiFish-U | 11-1SU (1) |
| SP4 | MiFish-U | SP4 | MiFish-E | 11-1SE (1) | |
| SP5 | MiFish-U | SP5 | 11-1 D (1) | MiFish-U | N/A |
| SU1 | MiFish-U | SU1 | MiFish-E | 11-1DE | |
| SU2 | MiFish-U | SU2 | 21-1 S (1) | MiFish-U | 21-1SU_21-1SE (1) |
| SU3 | MiFish-U | SU3 | MiFish-E | ||
| SU4 | MiFish-U | SU4 | 21-1 D (1) | MiFish-U | 21-1DU_21-1DE (1) |
| SU5 | MiFish-U | SU5 | MiFish-E | ||
| F1 | MiFish-U | F1 | 3-1 S (2) | MiFish-U | 3-1SU (2) |
| F2 | MiFish-U | F2 | MiFish-E | 3-1SE (2) | |
| F3 | MiFish-U | F3 | 3-1 D (2) | MiFish-U | 3-1DU (2) |
| F4 | MiFish-U | F4 | MiFish-E | N/A | |
| F5 | MiFish-U | F5 | 11-1 S (2) | MiFish-U | 11-1SU (2) |
| W1 | MiFish-U | W1 | MiFish-E | 11-1SE (2) | |
| A1 | MiFish-U | A1 | 11-1 D (2) | MiFish-U | 11-1DU (2) |
| A2 | MiFish-U | A2 | MiFish-E | 11-1DE (2) | |
| A3 | MiFish-U | A3 | 21-1 S (2) | MiFish-U | 21-1SU (2) |
| A4 | MiFish-U | A4 | MiFish-E | 21-1SE (2) | |
| 3-1 S (1) | MiFish-U | 3-1SU_SE (1) | 21-1 D (2) | MiFish-U | 21-1DU (2) |
| MiFish-E | MiFish-E | 21-1DE (2) |
The eDNA samples amplified by MiFish primers and sequencing data.
(1) means the first PCR of the two replicates; (2) means the second PCR of the two replicates; S means surface water; D means bottom water; N/A means PCR failure data, samples connected by an underscore (_) indicate mixed samples.
From the MiSeq runs, we obtained 9,346,462 reads. After quality control, 4,045,381 reads were retained. Of these, 41.81% (1,691,374 reads) had a similarity of 97% or higher on NCBI, 16.22% (656,161 reads) were of low identity, and 41.97% (1,697,000 reads) had no hits in the GenBank database (Table 3). After excluding sequences from non-target species (i.e. human, aurochs, or wild boar) and potential freshwater fish contaminants, the high-identity reads were assigned to 421 species across 79 families (Supplementary Table 2).
Table 3
| Number of Miseq reads | Value |
|---|---|
| Pass quality control | 4,045,381 |
| Blastn ≥97% | 41.81% |
| Blastn <97% | 16.22% |
| No hits | 41.97% |
| Discard reads | 5,301,081 |
| Total | 9,346,462 |
Summary of MiSeq reads.
3.2 Fish fauna detected by eDNA samples
Compared to the 718 species documented in previous conventional records, 229 species identified in this study had been previously recorded. The remaining 192 species, belonging to 64 families, were new records. Of the 74 families listed by conventional records, 21 were not detected by eDNA, including 3 cartilaginous and 18 bony fish families. On the other hand, among the 26 families detected only by eDNA, either eggs, larvae or juveniles of the Gempylidae, Gonostomatidae, Myctophidae, Nomeidae, Phosichthyidae, and Sillaginidae have been observed in previous studies (Figure 2).
Figure 2
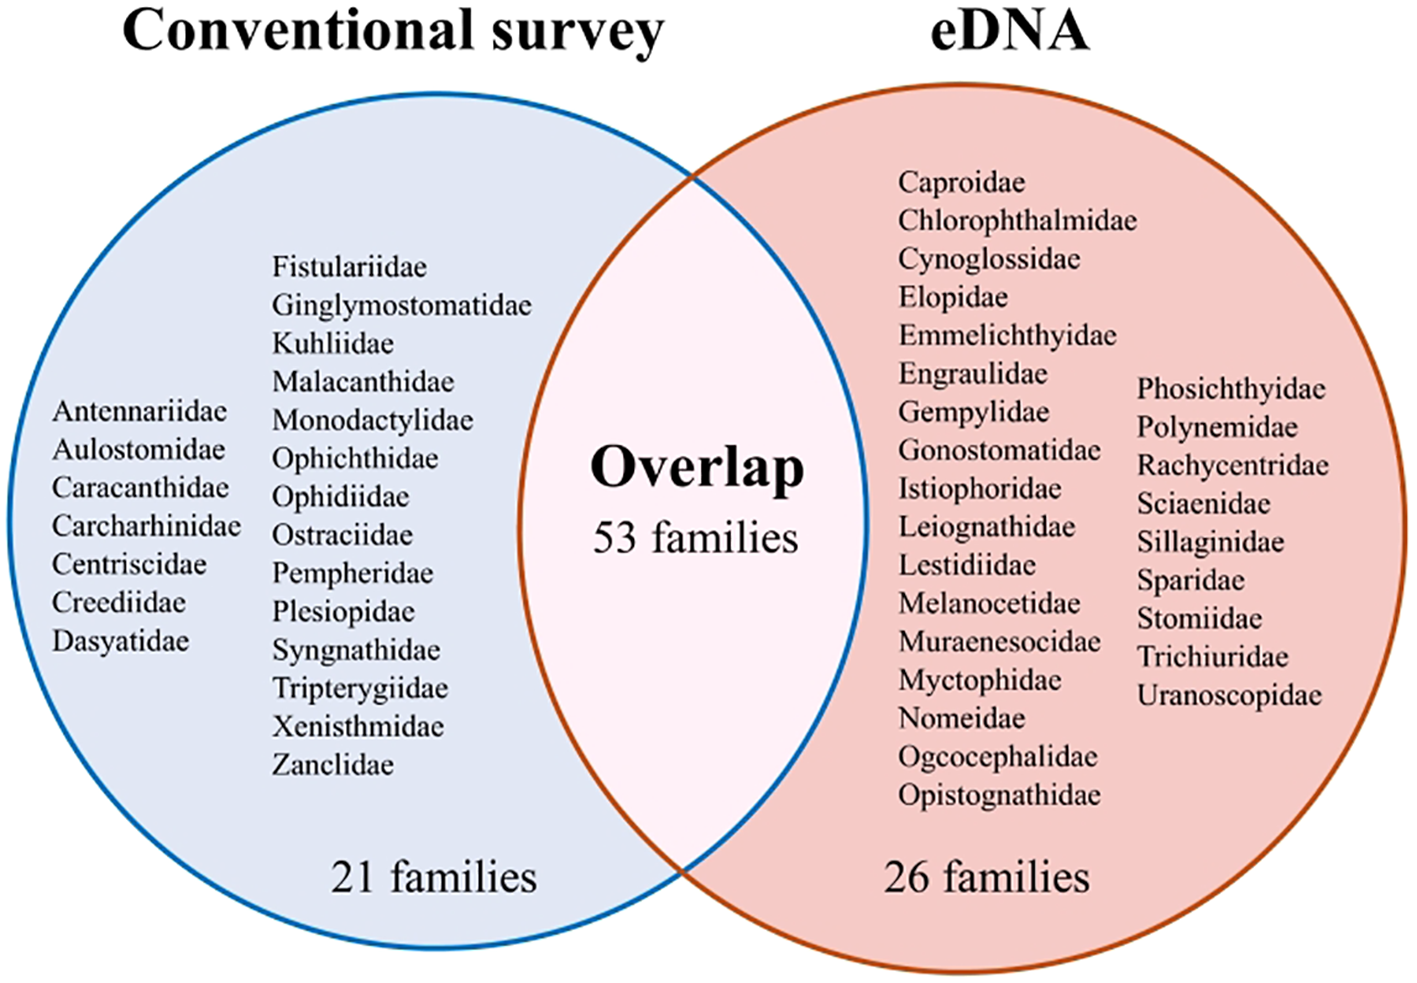
The comparison of the family recorded by conventional survey and eDNA metabarcoding in the Dongsha Atoll.
Of the species detected, the Labridae are the dominant family (54 taxa), comprising 12.83% of total species, followed by the Pomacentridae (32 taxa, 7.60%), Carangidae (26 taxa, 6.18%), and Chaetodontidae (23 taxa, 5.46%). The remaining families are less than 5% (Figure 3). In contrast, previous conventional records identified the top five dominant families as the Labridae (113 taxa, 15.74%), Gobiidae (70 taxa, 9.75%), Pomacentridae (61 taxa, 8.5%), Apogonidae (43 taxa, 5.99%), and Chaetodontidae (31 taxa, 4.32%). Among the species mentioned above, species richness was higher when using conventional methods compared to eDNA metabarcoding, with the exception of Carangidae. This difference was particularly pronounced for the Gobiidae (70 vs. 7) and Apogonidae (43 vs. 12), where more than twice as many species were detected by conventional approaches. In contrast, for the Carangidae, eDNA metabarcoding detected 26 taxa, whereas only 20 species had been recorded through conventional methods. These results highlight differing tendencies between the two methods in detecting various taxa.
Figure 3
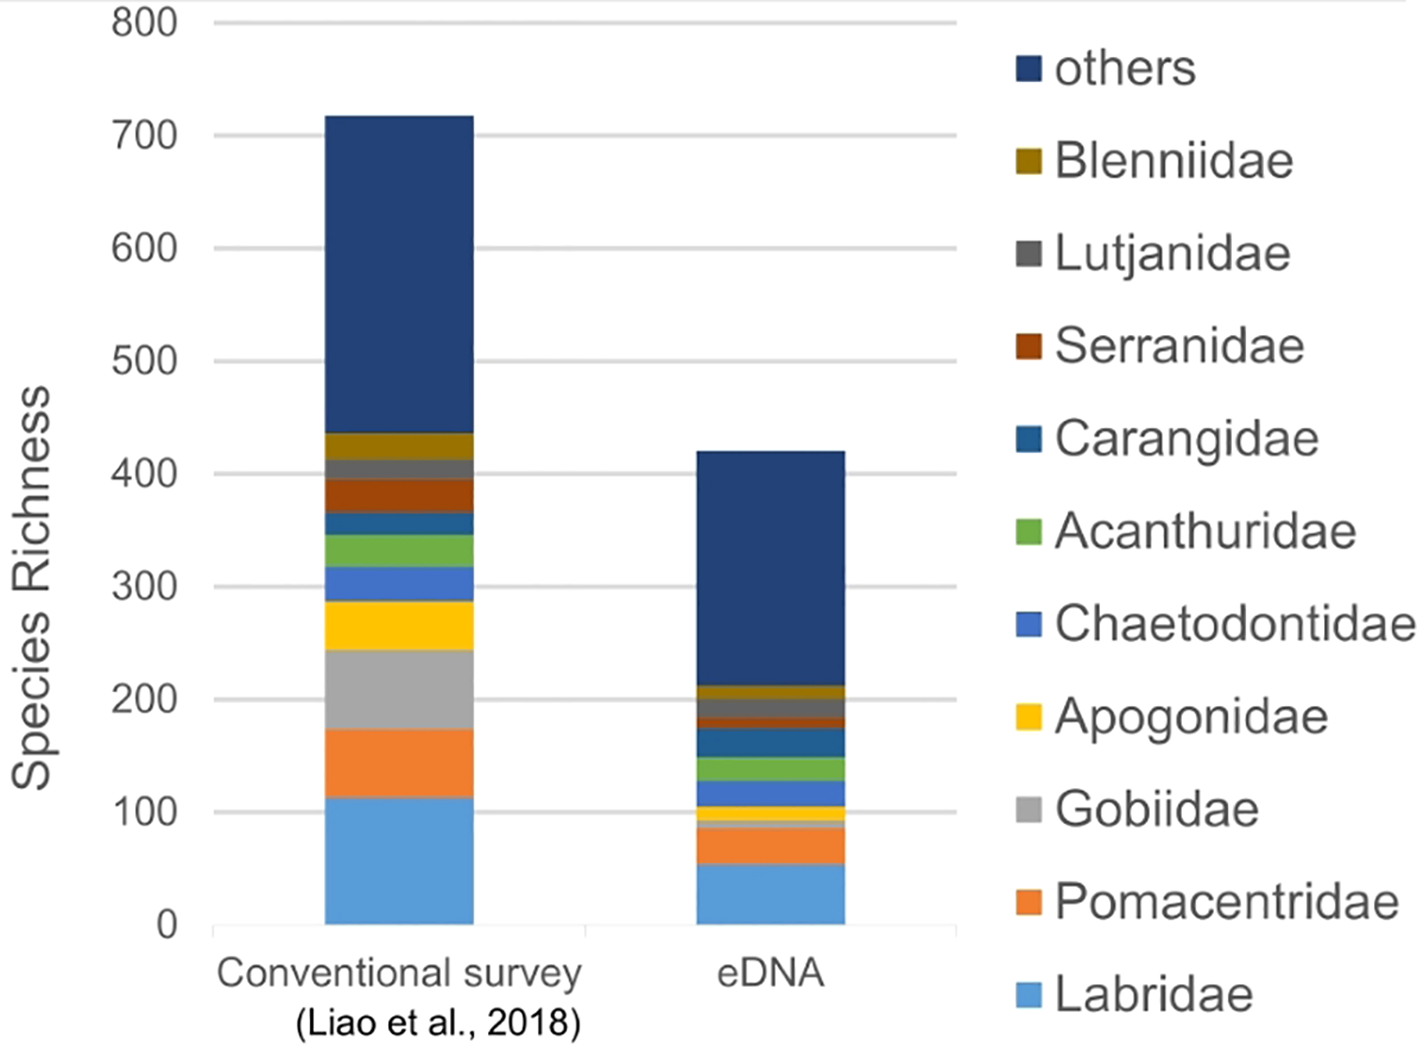
The species richness of each family detected by conventional survey (Liao et al., 2018) and eDNA metabarcoding in the Dongsha Atoll.
3.3 Estimation of the species richness by eDNA
In sequencing units gained from stations 1 to 5 during spring, summer, and autumn, 333 species are recorded, of which 177 were singletons, with a total of 849 incidences. Species estimation analysis suggested that eDNA metabarcoding could detect approximately 693 species in the Dongsha Atoll (with a 95% confidence interval ranging from 601 to 816, and a standard error of 54). Additionally, the lack of overlap between the diversity estimation curve and the observed species curve indicates that the application of eDNA metabarcoding to study the Dongsha fish fauna has not yet reached saturation (Figure 4).
Figure 4
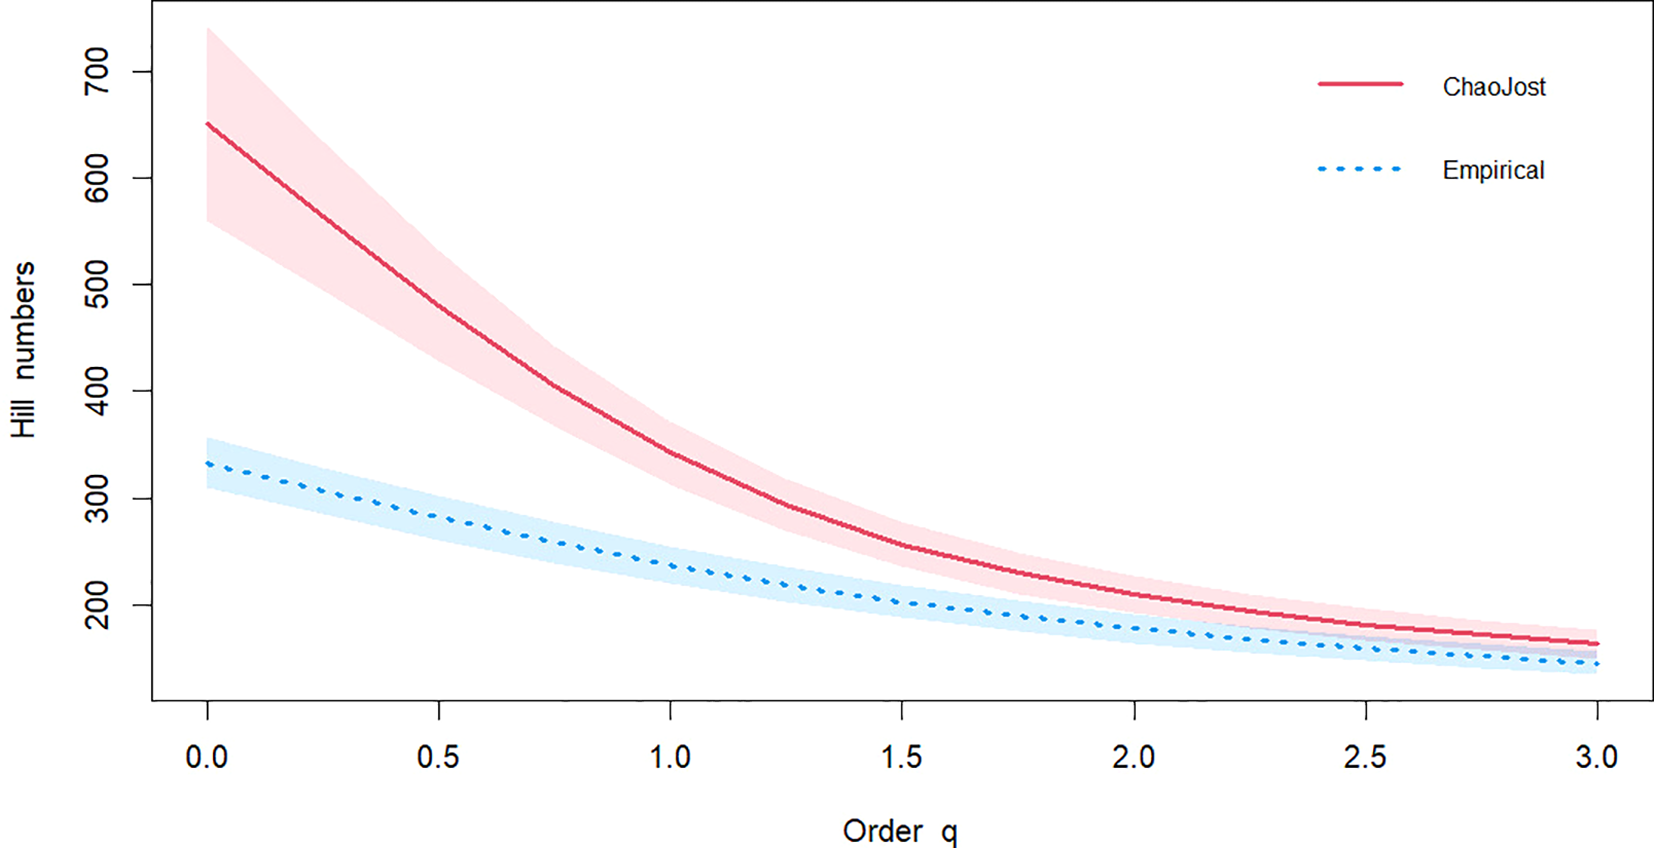
The estimation of species number curve. Order q presents the coefficient of species estimation statistical analysis. Hill numbers present the species number. It includes three widely used measures as special cases: species richness (q=0), Shannon diversity (the exponential of Shannon entropy, q=1) and Simpson diversity (the inverse of Simpson concentration, q=2), and q=3 generally changes little between observation and estimation value.
4 Discussion
Coral reef fish surveys using conventional methods, such as underwater visual surveys, are challenging due to the structural complexity of the ecosystem. In this study, eDNA metabarcoding detected 421 species from four sampling events across 12 sites using 26 water samples. In contrast, the most recent conventional survey identified 273 species across 30 transects at 27 sites (Liao et al., 2018), of which 192 species were new records. This demonstrates the advantage of eDNA metabarcoding in reducing fieldwork effort and less reliance on weather conditions. The 421 recorded taxa represent families inhabiting various habitats, highlighting the potential of eDNA metabarcoding to overcome microhabitat boundaries within a complex coral reef ecosystem (Juhel et al., 2022).
In this study, a total of 26 fish families were newly recorded in this area. Several of them such as Chlorophthalmidae, Emmelichthyidae, Gonostomatidae, Lestidiidae, Melanocetidae, Myctophidae, Ogcocephalidae, Phosichthyidae, and Stomiidae are deep-sea taxa, whereas others including Caproidae, Gempylidae, Istiophoridae, and Nomeidae are oceanic groups. Both are not typically considered native to the Dongsha Atoll. These detections may represent false positives introduced by advective processes such as internal waves and tides. Wave action and monsoonal forcing drive water flow across the coral platform, while tidal currents transport particles into the lagoon during rising tides and export them during receding tides (Chen, 2023). These processes promote the transport of eDNA from the surrounding marine environment. Notably, families such as the Gempylidae, Gonostomatidae, Istiophoridae, Myctophidae, Nomeidae, Phosichthyidae, and Sillaginidae have previously been documented only at larval or egg stages in this region (Shao et al., 2011). Although hydrodynamic transport can generate false-positive eDNA signals (Shogren et al., 2017), several taxa recovered in our study have likewise been reported solely at juvenile and/or egg stages locally. Caution should therefore be exercised before concluding that species absent as adults are merely introduced contaminants, especially in areas highly influenced by oceanographic factors. Given the limitations of conventional surveys in detecting larvae or spawn in the Dongsha Atoll, eDNA metabarcoding offers a solution to identify these otherwise overlooked species.
Despite its high detection capability, eDNA metabarcoding failed to detect 68% (489 out of 718) of previously recorded species in the atoll. This likely reflects the snapshot effect of limited sampling (Monuki et al., 2021; Osathanunkul and Suwannapoom, 2024). Additionally, some rare or migratory species may not always appear in the Dongsha Atoll. For instance, Soong et al. (2012) reported that Cirrhitus pinnulatus and Labroides dimidiatus were common at Station 4 (approximately 17–32 individuals), whereas Liao et al. (2018) recorded C. pinnulatus as absent and L. dimidiatus as a single individual at the nearby Station 11-1. Their absence in this study may indicate population size fluctuations or potential local extinctions.
Species richness estimations further suggest that an additional 272 species could potentially be detected at stations 1 to 5 with increased eDNA sampling. However, this still leaves a significant gap compared to the 489 species previously recorded but undetected in this study. The efficiency of eDNA metabarcoding in recovering species observed through conventional techniques has been widely debated (Bessey et al., 2023; Collins et al., 2018). One key limitation involves taxonomic resolution and the lack of complete reference sequences in genetic database (Juhel et al., 2022; Rossouw et al., 2024). Some sequences could not be matched or assigned to taxa, likely leading to underestimation of species richness. For example, 12S rRNA sequences for two common species, Ctenogobiops mitodes and Istigobius rigilius, remain unavailable in the NCBI nucleotide database (Liao et al., 2018). Similarly, Pomacentrus alleni, P. auriventris, P. caeruleus and P. coelestis share the same 12S rRNA sequence targeted by the MiFish-U marker. Since both P. auriventris and P. coelestis are distributed around the Dongsha Atoll, it is unclear which species is detected, suggesting the inability of this fragment to differentiate closely related taxa (Siddappa et al., 2013; Yang et al., 2014). Furthermore, although four families of Chondrichthyes were recorded through conventional methods, only Myliobatidae was detected in this study using the MiFish-U primer, which was designed for bony fish (Miya et al., 2015). The influence of molecular marker choice in eDNA metabarcoding results has been emphasized in previous studies (Cawthorn et al., 2012; Chan et al., 2022). Because there is no perfect universal genetic marker for metabarcoding, marker choice should be tailored for the target group before applying eDNA metabarcoding to ensure reliable biodiversity monitoring (Deagle et al., 2014; Paz-Vinas et al., 2021).
Environmental factors also influence eDNA preservation. The physical and chemical properties of seawater, particularly high temperature, fluctuating salinity, and exposure to UV radiation, can accelerate eDNA degradation (Barnes et al., 2014; Mauvisseau et al., 2022). Consequently, eDNA in coastal or shallow areas, where conditions fluctuate rapidly, may degrade more easily (Collins et al., 2018). Zou et al. (2020) reported that only 11 species were detected by eDNA metabarcoding out of 32 fish caught by bottom trawling in the coastal wetlands of the Pearl River. Similarly, Stat et al. (2019) recorded only 24 of 56 species identified by baited remote underwater video systems (BRUV) in Jurien Bay, Western Australia, Although the ring-shaped geomorphology of the Dongsha Atoll may aid eDNA accumulation (Curtis et al., 2021; Murakami et al., 2019), its shallow depth (≤30m) and elevated sea surface temperature compared to the outer atoll, may lead to rapid eDNA degradation, and eventually resulting in reduced detection efficiency (Tkachenko and Soong, 2017).
Species-specific traits may also influence detection rates. Long-term conventional surveys have identified higher species richness in Gobiidae and Apogonidae, whereas eDNA metabarcoding detected more Carangidae. The release rate of eDNA often increases with body size and activity level (Maruyama et al., 2014; Takeuchi et al., 2019). Therefore, the small body size and sedentary, demersal habits of gobies (Bleeker, 1875; Santo and Lobel, 2017), likely contribute to their low detectability. Additionally, population size is a critical factor influencing eDNA detectability. In previous conventional surveys, the abundance of Apongonidae in the Dongsha Atoll was much lower than other coral reef fish such as the Pomacentridae, Labridae and Chaetodontidae. This may reflect their actual abundance or be influenced by their predominantly nocturnal activity (Marnane and Bellwood, 2002). Consequently, the lower abundance, density of the target species, or their reduced activity during the sampling period, may result in lower eDNA concentrations and reduced detectability (Stoeckle et al., 2022).
On the other hand, the Carangidae showed higher species richness in the present study compared to previous conventional surveys (Liao et al., 2018 and references cited therein). Fish fauna investigations in the Dongsha Atoll were primarily conducted using visual census, which tend to underestimate fast-swimming and/or cryptobenthic reef fishes (Faunce and Serafy, 2006; Ferreira et al., 2004). In the study by Liao et al. (2018), lure fishing yielded more carangids than diving observations, suggesting that earlier assessments may have underestimated their diversity.
While eDNA metabarcoding offers significant advantages in species detection, it cannot fully replace the value of conventional surveys. Our results highlight notable discrepancies in species composition between the two approaches. Factors such as primer bias, environmental conditions, and species behavior may influence eDNA based detection. Therefore, conventional surveys remain essential to ensure comprehensive and accurate biodiversity monitoring.
5 Conclusion
The present study is the first utilizing eDNA metabarcoding method on fish survey in the Dongsha Atoll and estimating a potential 693 fish species. The present eDNA study showed its ability to transcend microhabitat boundaries within the complex coral reef ecosystem, reducing the risk of missing cryptobenthic reef fish by identifying previously unrecorded reef-associated fish species. Additionally, larvae or spawn which are difficult to observe visually were also detected. As a result, eDNA enables the assessment of the entire ecosystem operation in the Dongsha Atoll. However, despite its efficiency, 68% of the species previously recorded were not detected. Certain species may still be missed due to primer bias, lack of reference databases, low DNA releasing rate, or fast DNA degradation environmental condition. Therefore, while eDNA allows for a comprehensive assessment of ecosystem status, it cannot fully replace conventional methods when conducting a complete species diversity survey. Instead, it serves as a valuable reference in the dynamic marine environment.
Statements
Data availability statement
The demultiplexed FASTQ sequences for each sample are available at GenBank: SAMN46554932 to SAMN46554968. Further inquiries can be directed to the corresponding author.
Author contributions
Y-CL: Visualization, Resources, Validation, Formal analysis, Conceptualization, Writing – review & editing, Data curation, Methodology, Writing – original draft, Investigation. Y-CY: Writing – original draft, Visualization, Writing – review & editing, Validation, Formal analysis, Data curation. K-NS: Resources, Investigation, Writing – review & editing, Data curation, Methodology, Conceptualization. C-HC: Investigation, Resources, Conceptualization, Methodology, Writing – review & editing, Data curation. T-YL: Methodology, Data curation, Conceptualization, Investigation, Resources, Supervision, Funding acquisition, Writing – review & editing, Project administration.
Funding
The author(s) declared that financial support was received for this work and/or its publication. This study is supported by the grant to TYL from the National Science and Technology Council (111-2611-M-110-026).
Acknowledgments
We are grateful to the reviewers for their insightful comments. We also extend our appreciation to Hsiang-Chun Sun and Wei-Che Hung for their valuable assistance in fieldwork. Additionally, we thank the Dongsha Atoll Research Station for their logistical support and fieldwork assistance.
Conflict of interest
The authors declared that this work was conducted in the absence of any commercial or financial relationships that could be construed as a potential conflict of interest.
Generative AI statement
The author(s) declared that generative AI was not used in the creation of this manuscript.
Any alternative text (alt text) provided alongside figures in this article has been generated by Frontiers with the support of artificial intelligence and reasonable efforts have been made to ensure accuracy, including review by the authors wherever possible. If you identify any issues, please contact us.
Publisher’s note
All claims expressed in this article are solely those of the authors and do not necessarily represent those of their affiliated organizations, or those of the publisher, the editors and the reviewers. Any product that may be evaluated in this article, or claim that may be made by its manufacturer, is not guaranteed or endorsed by the publisher.
Supplementary material
The Supplementary Material for this article can be found online at: https://www.frontiersin.org/articles/10.3389/fmars.2025.1671492/full#supplementary-material
References
1
Alford M. H. Peacock T. MacKinnon J. A. Nash J. D. Buijsman M. C. Centurioni L. R. et al . (2015). The formation and fate of internal waves in the South China Sea. Nature521, 65–69. doi: 10.1038/nature14399
2
Andrews S. (2010). FastQC: a quality control tool for high throughput sequence data ( Babraham Bioinformatics). Available online at: http://www.bioinformatics.babraham.ac.uk/projects/fastqc/ (Accessed July 31, 2019).
3
Barnes M. A. Turner C. R. Jerde C. L. Renshaw M. A. Chadderton W. L. Lodge D. M. (2014). Environmental conditions influence eDNA persistence in aquatic systems. Environ. Sci. Technol.48, 1819–1827. doi: 10.1021/es404734p
4
Bessey C. Depczynski M. Goetze J. S. Moore G. Fulton C. J. Snell M. et al . (2023). Cryptic biodiversity: A portfolio-approach to coral reef fish surveys. Limnol. Oceanogr.: Methods21, 594–605. doi: 10.1002/lom3.10567
5
Bleeker P. (1875). Gobioideorum species insulindicae novae. Arch. néerlandaises Des. Sci. exactes naturelles10, 113–134.
6
Caldwell Z. R. Zgliczynski B. J. Williams G. J. Sandin S. A. (2016). Reef fish survey techniques: assessing the potential for standardizing methodologies. PloS One11, e0153066. doi: 10.1371/journal.pone.0153066
7
Cawthorn D. M. Steinman H. A. Witthuhn R. C. (2012). Evaluation of the 16S and 12S rRNA genes as universal markers for the identification of commercial fish species in South Africa. Gene491, 40–48. doi: 10.1016/j.gene.2011.09.009
8
Chan A. H. E. Saralamba N. Saralamba S. Ruangsittichai J. Thaenkham U. (2022). The potential use of mitochondrial ribosomal genes (12S and 16S) in DNA barcoding and phylogenetic analysis of trematodes. BMC Genomics23, 104. doi: 10.1186/s12864-022-08302-4
9
Chao A. Jost L. (2015). Estimating diversity and entropy profiles via discovery rates of new species. Methods Ecol. Evol.6, 873–882. doi: 10.1111/2041-210X.12349
10
Chao A. Ma K. H. Hsieh T. C. Chiu C. H. (2016). SpadeR (Species-richness Prediction And Diversity Estimation in R): an R package in CRAN. doi: 10.32614/CRAN.package.SpadeR (Accessed July 31, 2019).
11
Chen S. M. (2023). Water exchange due to wind and waves in a monsoon prevailing tropical atoll. J. Mar. Sci. Eng.11, 109. doi: 10.3390/jmse11010109
12
Chen L. S. Shao K. T. Fang L. S. Her L. T. (1991). Preliminary checklist of fishes from the water at Tung-sha Tao (Pratas Island), South China Sea. Acta Oceanogr. Taiwan.27, 98–121.
13
Collins R. A. Wangensteen O. S. O’Gorman E. J. Mariani S. Sims D. W. Genner M. J. (2018). Persistence of environmental DNA in marine systems. Commun. Biol.1, 185. doi: 10.1038/s42003-018-0192-6
14
Cox M. P. Peterson D. A. Biggs P. J. (2010). SolexaQA: At-a-glance quality assessment of Illumina second-generation sequencing data. BMC Bioinf.11, 485. doi: 10.1186/1471-2105-11-485
15
Curtis A. N. Tiemann J. S. Douglass S. A. Davis M. A. Larson E. R. (2021). High stream flows dilute environmental DNA (eDNA) concentrations and reduce detectability. Divers. Distrib.27, 1918–1931. doi: 10.1111/ddi.13196
16
Deagle B. E. Jarman S. N. Coissac E. Pompanon F. Taberlet P. (2014). DNA metabarcoding and the cytochrome c oxidase subunit I marker: not a perfect match. Biol. Lett.10, 20140562. doi: 10.1098/rsbl.2014.0562
17
Faunce C. H. Serafy J. E. (2006). Mangroves as fish habitat: 50 years of field studies. Mar. Ecol. Prog. Ser.318, 1–18. doi: 10.3354/meps318001
18
Fediajevaite J. Priestley V. Arnold R. Savolainen V. Chang H. Zhu Y. et al . (2021). Meta-analysis shows that environmental DNA outperforms traditional surveys, but warrants better reporting standards. Ecol. Evol.11, 4803–4815. doi: 10.1002/ece3.7382
19
Ferreira C. E. L. Floeter S. R. Gasparini J. L. Ferreira B. P. Joyeux J. C. (2004). Trophic structure patterns of Brazilian reef fishes: a latitudinal comparison. J. Biogeography31, 1093–1106. doi: 10.1111/j.1365-2699.2004.01044.x
20
Ficetola G. F. Miaud C. Pompanon F. Taberlet P. (2008). Species detection using environmental DNA from water samples. Biol. Lett.4, 423–425. doi: 10.1098/rsbl.2008.0118
21
Fraija-Fernández N. Bouquieaux M. Rey A. Mendibil I. Cotano U. Irigoien X. et al . (2020). Marine water environmental DNA metabarcoding provides a comprehensive fish diversity assessment and reveals spatial patterns in a large oceanic area. Ecol. Evol.10, 7560–7584. doi: 10.1002/ece3.6482
22
Gibson J. F. Kelso S. Skevington J. H. (2010). Band-cutting no more: A method for the isolation and purification of target PCR bands from multiplex PCR products using new technology. Mol. Phylogenet. Evol.56, 1126–1128. doi: 10.1016/j.ympev.2010.05.005
23
Gold Z. Sprague J. Kushner D. J. Marin E. Z. Barber P. H. (2021). eDNA metabarcoding as a biomonitoring tool for marine protected areas. PloS One16, e0238557. doi: 10.1371/journal.pone.0238557
24
Gold Z. Wall A. R. Schweizer T. M. Pentcheff N. D. Curd E. E. Barber P. H. et al . (2022). A manager's guide to using eDNA metabarcoding in marine ecosystems. PeerJ10, e14071. doi: 10.7717/peerj.14071
25
Hammerl C. Möllmann C. Oesterwind D. (2024). Identifying fit-for purpose methods for monitoring fish communities. Front. Mar. Sci.10. doi: 10.3389/fmars.2023.1322367
26
He X. Jeffery N. W. Stanley R. R. E. Hamilton L. C. Rubidge E. M. Abbott C. L. (2023). eDNA metabarcoding enriches traditional trawl survey data for monitoring biodiversity in the marine environment. ICES J. Mar. Sci.80, 1529–1538. doi: 10.1093/icesjms/fsad083
27
Jeunen G. J. Lipinskaya T. Gajduchenko H. Golovenchik V. Moroz M. Rizevsky V. et al . (2022). Environmental DNA (eDNA) metabarcoding surveys show evidence of non-indigenous freshwater species invasion to new parts of Eastern Europe. Metabarcod Metagenom.6, e68575. doi: 10.3897/mbmg.6.e68575
28
Juhel J. B. Marques V. Utama R. S. Vimono I. B. Sugeha H. Y. Kadarusman K. et al . (2022). Estimating the extended and hidden species diversity from environmental DNA in hyper-diverse regions. Ecography2022, e06299. doi: 10.1111/ecog.06299
29
Katoh K. Toh H. (2008). Recent developments in the MAFFT multiple sequence alignment program. Briefings Bioinf.9, 286–298. doi: 10.1093/bib/bbn013
30
Knowlton N. (2001). The future of coral reefs. Proc. Natl. Acad. Sci.98, 5419–5425. doi: 10.1073/pnas.091092998
31
Kumar S. Stecher G. Tamura K. (2016). MEGA7: molecular evolutionary genetics analysis version 7.0 for bigger datasets. Mol. Biol. Evol.33, 1870–1874. doi: 10.1093/molbev/msw054
32
Liao T. Y. Soong K. Y. Chen Y. Y. (2018). Investigation of fish resources in the Dongsha Atoll. Kaohsiung: Marine National Park Headquarters.
33
Liu S. Y. V. Green J. Briggs D. Hastings R. Jondelius Y. Kensinger S. et al . (2021). Dongsha Atoll is an important stepping-stone that promotes regional genetic connectivity in the South China Sea. PeerJ9, e12063. doi: 10.7717/peerj.12063
34
Marnane M. J. Bellwood D. R. (2002). Diet and nocturnal foraging in cardinalfishes (Apogonidae) at One Tree Reef, Great Barrier Reef, Australia. Mar. Ecol. Prog. Ser.231, 261–268. doi: 10.3354/meps231261
35
Maruyama A. Nakamura K. Yamanaka H. Kondoh M. Minamoto T. (2014). The release rate of environmental DNA from juvenile and adult fish. PloS One9, e114639. doi: 10.1371/journal.pone.0114639
36
Mathon L. Marques V. Mouillot D. Albouy C. Andrello M. Baletaud F. et al . (2022). Cross-ocean patterns and processes in fish biodiversity on coral reefs through the lens of eDNA metabarcoding. Proc. R. Soc. B: Biol. Sci.289, 20220162. doi: 10.1098/rspb.2022.0162
37
Mauvisseau Q. Harper L. R. Sander M. Hanner R. H. Kleyer H. Deiner K. (2022). The multiple states of environmental DNA and what is known about their persistence in aquatic environments. Environ. Sci. Technol.56, 5322–5333. doi: 10.1021/acs.est.1c07638
38
McClenaghan B. Fahner N. Cote D. Chawarski J. McCarthy A. Rajabi H. et al . (2020). Harnessing the power of eDNA metabarcoding for the detection of deep-sea fishes. PloS One15, e0236540. doi: 10.1371/journal.pone.0236540
39
Miya M. Sato Y. Fukunaga T. Sado T. Poulsen J. Y. Sato K. et al . (2015). MiFish, a set of universal PCR primers for metabarcoding environmental DNA from fishes: detection of more than 230 subtropical marine species. R. Soc. Open Sci.2, 150088. doi: 10.1098/rsos.150088
40
Monuki K. Barber P. H. Gold Z. (2021). eDNA captures depth partitioning in a kelp forest ecosystem. PloS One16, e0253104. doi: 10.1371/journal.pone.0253104
41
Muenzel D. Bani A. Brauwer M. D. Stewart E. Djakiman C. Halwi et al . (2024). Combining environmental DNA and visual surveys can inform conservation planning for coral reefs. Proc. Natl. Acad. Sci.121, e2307214121. doi: 10.1073/pnas.2307214121
42
Murakami H. Yoon S. Kasai A. Minamoto T. Yamamoto S. Sakata M. K. et al . (2019). Dispersion and degradation of environmental DNA from caged fish in a marine environment. Fisheries Sci.85, 327–337. doi: 10.1007/s12562-018-1282-6
43
Nguyen B. N. Shen E. W. Seemann J. Correa A. M. S. O’Donnell J. L. Altieri A. H. et al . (2020). Environmental DNA survey captures patterns of fish and invertebrate diversity across a tropical seascape. Sci. Rep.10, 6729. doi: 10.1038/s41598-020-63565-9
44
Ogata M. Masuda R. Harino H. Sakata M. K. Hatakeyama M. Yokoyama K. et al . (2021). Environmental DNA preserved in marine sediment for detecting jellyfish blooms after a tsunami. Sci. Rep.11, 16830. doi: 10.1038/s41598-021-94286-2
45
Oka S. I. Doi H. Miyamoto K. Hanahara N. Sado T. Miya M. (2021). Environmental DNA metabarcoding for biodiversity monitoring of a highly diverse tropical fish community in a coral reef lagoon: Estimation of species richness and detection of habitat segregation. Environ. DNA3, 55–69. doi: 10.1002/edn3.132
46
Osathanunkul M. Suwannapoom C. (2024). A comparative study on eDNA-based detection of Siamese bat catfish (Oreoglanis siamensis) in wet and dry conditions. Sci. Rep.14, 8885. doi: 10.1038/s41598-024-58752-x
47
Paz-Vinas I. Jensen E. L. Bertola L. D. Breed M. F. Hand B. K. (2021). Macrogenetic studies must not ignore limitations of genetic markers and scale. Ecol. Lett.24, 1282–1284. doi: 10.1111/ele.13732
48
Pearson R. G. (1981). Recovery and recolonization of coral reefs. Mar. Ecol. Prog. Ser.4, 105–122. doi: 10.3354/meps004105
49
Reid E. C. DeCarlo T. M. Cohen A. L. Wong G. T. F. Lentz S. J. Safaie A. et al . (2019). Internal waves influence the thermal and nutrient environment on a shallow coral reef. Limnol. Oceanogr.64, 1949–1965. doi: 10.1002/lno.11162
50
Rossouw E. I. Landschoff J. Ndhlovu A. Neef G. Miya M. Courtaillac K. L. et al . (2024). Detecting kelp-forest associated metazoan biodiversity with eDNA metabarcoding. NPJ Biodiversity3, 4. doi: 10.1038/s44185-023-00033-3
51
Santo V. D. Lobel P. S. (2017). Body size and thermal tolerance in tropical gobies. J. Exp. Mar. Biol. Ecol.487, 11–17. doi: 10.1016/j.jembe.2016.11.007
52
Shao K. T. Chen I. S. Tsai S. C. Chen C. Y. Tsai C. Y. Ko H. L. et al . (2011). The composition and distribution of fish spawn and larvae in Dongsha lagoon. Kaohsiung: Marine National Park Headquarters.
53
Shogren A. J. Tank J. L. Andruszkiewicz E. Olds B. Mahon A. R. Jerde C. L. et al . (2017). Controls on eDNA movement in streams: transport, retention, and resuspension. Sci. Rep.7, 5065. doi: 10.1038/s41598-017-05223-1
54
Siddappa C. M. Saini M. Das A. Doreswamy R. Sharma A. K. Gupta P. K. (2013). Sequence characterization of mitochondrial 12S rRNA gene in mouse deer (Moschiola indica) for PCR-RFLP based species identification. Mol. Biol. Int.2013, 783925. doi: 10.1155/2013/783925
55
Soong K. Y. Chen J. P. Chang J. S. Liu L. L. Su Y. (2012). Investigation of biodiversity and habitat construction in the reef platform on the north side of the Dongsha Atoll. Kaohsiung: Marine National Park Headquarters.
56
Souter D. W. Linden O. (2000). The health and future of coral reef systems. Ocean Coast. Manage.43, 657–688. doi: 10.1016/S0964-5691(00)00053-3
57
Stat M. John J. DiBattista J. D. Newman S. J. Bunce M. Harvey E. S. (2019). Combined use of eDNA metabarcoding and video surveillance for the assessment of fish biodiversity. Conserv. Biol.33, 196–205. doi: 10.1111/cobi.13183
58
Stoeckle M. Y. Adolf J. Ausubel J. H. Charlop-Powers Z. Dunton K. J. Hinks G. (2022). Current laboratory protocols for detecting fish species with environmental DNA optimize sensitivity and reproducibility, especially for more abundant populations. ICES J. Mar. Sci.79, 403–412. doi: 10.1093/icesjms/fsab273
59
Stoeckle M. Y. Adolf J. Charlop-Powers Z. Dunton K. J. Hinks G. VanMorter S. M. (2021). Trawl and eDNA assessment of marine fish diversity, seasonality, and relative abundance in coastal New Jersey, USA. ICES J. Mar. Sci.78, 293–304. doi: 10.1093/icesjms/fsaa225
60
Takeuchi A. Iijima T. Kakuzen W. Watanabe S. Yamada Y. Okamura A. et al . (2019). Release of eDNA by different life history stages and during spawning activities of laboratory-reared Japanese eels for interpretation of oceanic survey data. Sci. Rep.9, 6074. doi: 10.1038/s41598-019-42641-9
61
Thomsen P. F. Willerslev E. (2015). Environmental DNA - An emerging tool in conservation for monitoring past and present biodiversity. Biol. Conserv.183, 4–18. doi: 10.1016/j.biocon.2014.11.019
62
Tkachenko K. S. Soong K. (2017). Dongsha Atoll: A potential thermal refuge for reef-building corals in the South China Sea. Mar. Environ. Res.127, 112–125. doi: 10.1016/j.marenvres.2017.04.003
63
Tsai H. Hsu T. Chen W. J. Denis V. (2023). Navigating the scales of diversity in subtropical and coastal fish assemblages ascertained by eDNA and visual surveys. Ecol. Indic.148, 110044. doi: 10.1016/j.ecolind.2023.110044
64
Utthiya S. Wonnapinij P. Napaumpaiporn P. Kittiwongwattana C. Sakulkoo J. Suttangkakul A. et al . (2022). Gel purification of gDNA for next-generation sequencing applications. BioTechniques73, 99–103. doi: 10.2144/btn-2022-0013
65
Valdivia-Carrillo T. Rocha-Olivares A. Reyes-Bonilla H. Domínguez-Contreras J. F. Munguia-Vega A. (2021). Integrating eDNA metabarcoding and simultaneous underwater visual surveys to describe complex fish communities in a marine biodiversity hotspot. Mol. Ecol. Resour.21, 1558–1574. doi: 10.1111/1755-0998.13375
66
Yamamoto S. Masuda R. Sato Y. Sado T. Araki H. Kondoh M. et al . (2017). Environmental DNA metabarcoding reveals local fish communities in a species-rich coastal sea. Sci. Rep.7, 40368. doi: 10.1038/srep40368
67
Yang R. T. Huang C. C. Lee C. H. Tsai H. J. Sun C. L. (1975). Dongsha comprehensive survey report. 1. Coral, fish, and mollusks investigation. Acta Oceanogr.Taiwan. 8, 1–15.
68
Yang L. Tan Z. Wang D. Xue L. Guan M. X. Huang T. et al . (2014). Species identification through mitochondrial rRNA genetic analysis. Sci. Rep.4, 4089. doi: 10.1038/srep04089
69
Zhang R. Y. Zou B. Yan Y. W. Jeon C. O. Li M. Cai M. et al . (2020). Design of targeted primers based on 16S rRNA sequences in meta-transcriptomic datasets and identification of a novel taxonomic group in the Asgard archaea. BMC Microbiol.20, 25. doi: 10.1186/s12866-020-1707-0
70
Zou K. Chen J. Ruan H. Li Z. Guo W. Li M. et al . (2020). eDNA metabarcoding as a promising conservation tool for monitoring fish diversity in a coastal wetland of the pearl river estuary compared to bottom trawling. Sci. Total Environ.702, 134704. doi: 10.1016/j.scitotenv.2019.134704
Summary
Keywords
environmental DNA, Dongsha Atoll, fish fauna, biodiversity monitoring, coral reef fish
Citation
Liu Y-C, Yang Y-C, Shen K-N, Chiu C-H and Liao T-Y (2026) Environmental DNA metabarcoding enriches the conventional survey of a high diverse fish community in the Dongsha atoll. Front. Mar. Sci. 12:1671492. doi: 10.3389/fmars.2025.1671492
Received
23 July 2025
Revised
23 November 2025
Accepted
03 December 2025
Published
20 January 2026
Volume
12 - 2025
Edited by
Salil Bharany, Chitkara University, India
Reviewed by
Marcelo Visentini Kitahara, Universidade de São Paulo, Brazil
Neviaty Zamani, IPB University, Indonesia
Updates
Copyright
© 2026 Liu, Yang, Shen, Chiu and Liao.
This is an open-access article distributed under the terms of the Creative Commons Attribution License (CC BY). The use, distribution or reproduction in other forums is permitted, provided the original author(s) and the copyright owner(s) are credited and that the original publication in this journal is cited, in accordance with accepted academic practice. No use, distribution or reproduction is permitted which does not comply with these terms.
*Correspondence: Te-Yu Liao, swp0117@gmail.com
†These authors have contributed equally to this work
Disclaimer
All claims expressed in this article are solely those of the authors and do not necessarily represent those of their affiliated organizations, or those of the publisher, the editors and the reviewers. Any product that may be evaluated in this article or claim that may be made by its manufacturer is not guaranteed or endorsed by the publisher.