Abstract
Frequent typhoons in the Beibu Gulf pose a significant threat to marine and coastal infrastructure. To address this issue, we applied a fully integrated tide-surge-wave model using the Holland typhoon model and Delft3D-FLOW-WAVE. The model simulates storm surge and typhoon waves generated by Super Typhoon Rammasun (2014). We generated five idealized typhoon tracks by systematically shifting Rammasun’s track to evaluate their potential impacts on storm surge and waves. The results indicate that nearshore storm surges in the Beibu Gulf exhibit a distinct rise-then-fall pattern, with the maximum surge occurring on the right-hand side of the typhoon track. Surge magnitude diminishes as the track shifts eastward. Significant wave heights undergo marked spatial redistribution upon the typhoon’s entry into the Gulf, transitioning from left- to right-biased asymmetry during passage. Coastal ports in the Beibu Gulf and the eastern Leizhou Peninsula experience pronounced positive surges, while the highest surge and wave intensities occur along northeastern Hainan Island and both sides of the Qiongzhou Strait. Although based on idealized tracks, this study offers critical insights for optimizing coastal disaster mitigation against extreme typhoons in the region.
1 Introduction
Coastal regions, especially shallow nearshore waters, experience highly dynamic processes during typhoons. These dynamics are driven by spatially heterogeneous factors, including bathymetry, topography, shoreline geometry, and tidal currents (Keen and Glenn, 1999; Yang et al., 2015; Shen et al., 2017; Bacopoulos, 2019). During typhoon events, key physical mechanisms, such as astronomical tide-surge interactions (Valle-Levinson et al., 2013; Hsiao et al., 2019), wave-current coupling, and wave-current feedback dynamics (Smith et al., 2013; Sun et al., 2018; Hegermiller et al., 2019; Wu et al., 2025), govern the spatiotemporal evolution of storm surges and the generation-propagation-dissipation cycles of typhoon waves (Lin et al., 2021; Yin et al., 2022; Ma et al., 2022).
In coastal shallows and estuarine zones, significant interactions exist between astronomical tides and storm surges (Bilskie et al., 2016; Spicer et al., 2019; Gao et al., 2020, 2024). Regions like the Taiwan Strait (Liu et al., 2016; Liu and Huang, 2019, 2020), Gulf of Mexico (Bilskie et al., 2016; Vega et al., 2021), Bay of Bengal (Murty et al., 1986; Pattanayak et al., 2016), and Australian coast experience water level anomalies exceeding 1 m due to these interactions. During typhoon landfall, local tidal phase and topographic features modulate tide-surge coupling, exerting critical controls on surge intensity (Masselink and van Heteren, 2014; Zhang et al., 2024).
The tide-surge interaction substantially modulates water levels in nearshore shallow waters, primarily through phase-dependent mechanisms: (a) positive surge components accelerate tidal propagation, amplifying extreme water levels; (b) negative surge components decelerate tidal advancement (Horsburgh and Wilson, 2007; Idier et al., 2012; Feng et al., 2019; Gao et al., 2021, 2023). Storm surge dynamics are strongly influenced by astronomical tides, with nonlinear tide-surge interactions governing surge morphology, amplitude, spatial distribution, and duration. These mechanisms must be explicitly incorporated in storm surge numerical models (Wu et al., 2019, 2020).
Wave-current interactions constitute critical coastal processes, predominantly occurring in nearshore shallow waters, particularly within the surf zone. Region-specific bathymetry, topography, and shoreline configurations determine the dominant modulation mechanisms of these interactions. Wave-current coupling manifests bidirectionally: (a) Waves influence currents through Stokes drift, radiation stress, wave-induced surface stress modification, and wave-enhanced bottom boundary layer stress (Sheng and Liu, 2011; Chen et al., 2019; Wu et al., 2024); (b) Currents modulate waves via Doppler shifting (altering wavelength/steepness) and depth-induced breaking controlled by water levels (Bolaños et al., 2014; Lin et al., 2021).
As extreme marine dynamical events, typhoons drive intense wave-current interactions between storm surges and typhoon waves under extreme wind forcing (Gong et al., 2018; He et al., 2020; Li et al., 2022). These interactions govern extreme wave heights and storm water levels in affected regions and have been extensively studied. Wave setup effects significantly modify peak surge magnitudes (Joyce et al., 2018; Thomas et al., 2019). Storm surges and typhoon waves exhibit regionally distinct characteristics modulated by local bathymetry, shoreline geometry, and tidal currents (Wu et al., 2021). As direct products of typhoon forcing, they also function as responses to external drivers including typhoon track, translation speed, storm intensity, and sea surface elevation. Typhoon genesis, evolution, and dissipation constitute inherently complex natural phenomena. Under current global warming trends, their tracks demonstrate heightened unpredictability while dynamic elements intensify toward extremes. This necessitates urgent investigation into mitigating future risks from storm surges and typhoon waves under escalating extreme events, a focus of growing scholarly attention.
Beyond tide-surge and wave-current interactions, local bathymetry and shoreline geometry are recognized as critical factors controlling the spatial distribution and magnitude of storm surge (Mori et al., 2014; Liang et al., 2024). Studies in various coastal regions have demonstrated that converging embayments can funnel water, leading to significant surge amplification. Similarly, shallow continental shelves can enhance bottom friction and wind stress effects, further modifying surge patterns (Isachsen et al., 2014; Sjur et al., 2025). The presence of islands and capes can provide sheltering or focusing effects for waves and surge. For instance, the specific concave-shaped coast of Leizhou Peninsula has been shown to be particularly prone to extreme surges due to the combined effects of wind direction and topographic amplification.
The Beibu Gulf is characterized by its semi-enclosed nature, intricate coastline, and the presence of Hainan Island and Leizhou Peninsula, which create a complex geomorphic setting. While the aforementioned studies underscore the importance of fixed topographic features, the interaction between these features and variable typhoon tracks in this region remains less quantified. Given that the relative position of a typhoon’s center to a specific coastline determines wind direction (onshore/offshore) and thus dominates surge generation, it is hypothesized that the Gulf’s response to typhoons will be highly sensitive to track variations.
Therefore, this study aims to build upon the established understanding of topographic controls by systematically investigating how different typhoon tracks modulate storm surge and wave patterns in this topographically complex region. We utilize a coupled numerical model to not only capture the essential dynamics of tide-surge-wave interactions but also to isolate the effect of track displacement against the backdrop of the Beibu Gulf’s unique topography.
In conclusion, although conducting simulations of ocean and coastal dynamic processes under the influence of typhoons has deepened our understanding of the disaster processes caused by storm surge and typhoon wave. However, as products of typhoon activity, their dynamic characteristics are directly dominated on one hand by uncontrollable factors such as the typhoon’s track, wind pressure scale, and tidal phase at landfall, and indirectly influenced on the other hand by local features such as water depth, topography, and coastline. This leads to extremely complex spatiotemporal variations worldwide, and the distribution characteristics of storm surge and typhoon wave in different regions under the influence of different typhoons are not entirely consistent. Given the strategic significance of the Beibu Gulf region, coupled with a relative lack of research on extreme storm processes in the Beibu Gulf. Therefore, the main purpose of this paper is to utilize a coupled tide-surge-wave model to assess the potential impacts of extreme typhoon track on storm surge and typhoon wave in the Beibu Gulf, especially in coastal areas. While typhoon incident angle and translation speed also critically influence surge and wave patterns, this study first focuses on the fundamental role of track position to establish a baseline understanding of spatial vulnerabilities in the Beibu Gulf.
The remainder of this paper is organized as follows. Section 2 introduces the research data and the methods employed. Section 3 describes the model validation results based on observational data. Section 4 first analyzes the storm surge and typhoon wave processes in the Beibu Gulf under the influence of Super Typhoon Rammsun, further discussing the response characteristics of storm surge and typhoon wave in the Beibu Gulf and adjacent coastal areas to different typhoon tracks. Section 5 summarizes the paper and presents the conclusions.
2 Study area and typhoon conditions
2.1 Study area
The Beibu Gulf, situated at the northwest end of the South China Sea, is one of the world crucial international regional economic cooperation zones. The Beibu Gulf is a typical semi-enclosed shallow-water bay, with an average water depth of approximately 42 meters. It borders the Guangxi Zhuang Autonomous Region of China in the north, faces the Leizhou Peninsula and Hainan Island of China in the east, and is adjacent to Vietnam in the west. Notably, the the strategy of promote economy cooperation around Beibu Gulf have been approved by the national leaders from these two countries. The bay covers approximately 105°39′E~110°02′E and 18°08′N~21°53′N, with a total area of about 130,000 km2. The coastline is winding and convoluted, showing a total length of ~ 1600 km.
The tidal characteristics in the Beibu Gulf are primarily classified as irregular diurnal tide. The average tidal range along the coast ranges from 2.3m to 2.6m. Nearshore wave in the Gulf is composed of wind waves, swell waves, and mixed waves. Wind waves have the highest annual frequency of occurrence at 100%, followed by swell waves at an annual frequency of 19.0%, and mixed waves with an annual frequency of 18.1%. The average significant wave height along the coast ranges from 0.3m to 0.6m, with an average wave period of 2.7s. Typhoons are the major natural meteorological disasters in the Beibu Gulf, and they exhibit noticeable seasonal patterns in their impact on the coast.
According to statistics, an average of 1.5 typhoons enter the Beibu Gulf each year. Among them, Typhoon Rammasun (2014) made landfall with a maximum central wind force of 17 levels and a central pressure of 910hPa. The storm surge and typhoon wave it triggered caused varying degrees of disasters in different areas of the Beibu Gulf. In recent years, due to factors such as climate change and rising sea level, typhoon events in global coastal areas have shown an increasing frequency and greater intensity[1-4]. Therefore, exploring the potential impacts under the influence of extreme typhoon events is of significant importance for coastal disaster prevention and mitigation efforts in the Beibu Gulf.
2.2 Super Typhoon Rammasun (2014)
This study focuses on the Super Typhoon Rammasun, which was acknowledged as one of the strongest typhoons that has landed the Beibu Gulf in the past 50 years (Figure 1). It formed in the northwest Pacific Ocean on July 9, 2014, and made landfall at a strong typhoon level at 07:00 on July 19, 2014, when the maximum wind force near the center reached level 15 and the central minimum pressure was 950 hPa. Specifically, it exhibits one of the most widespread and destructive typhoon tracks in the Beibu Gulf, thus providing valuable information for studying extreme typhoon events in this region.
Figure 1
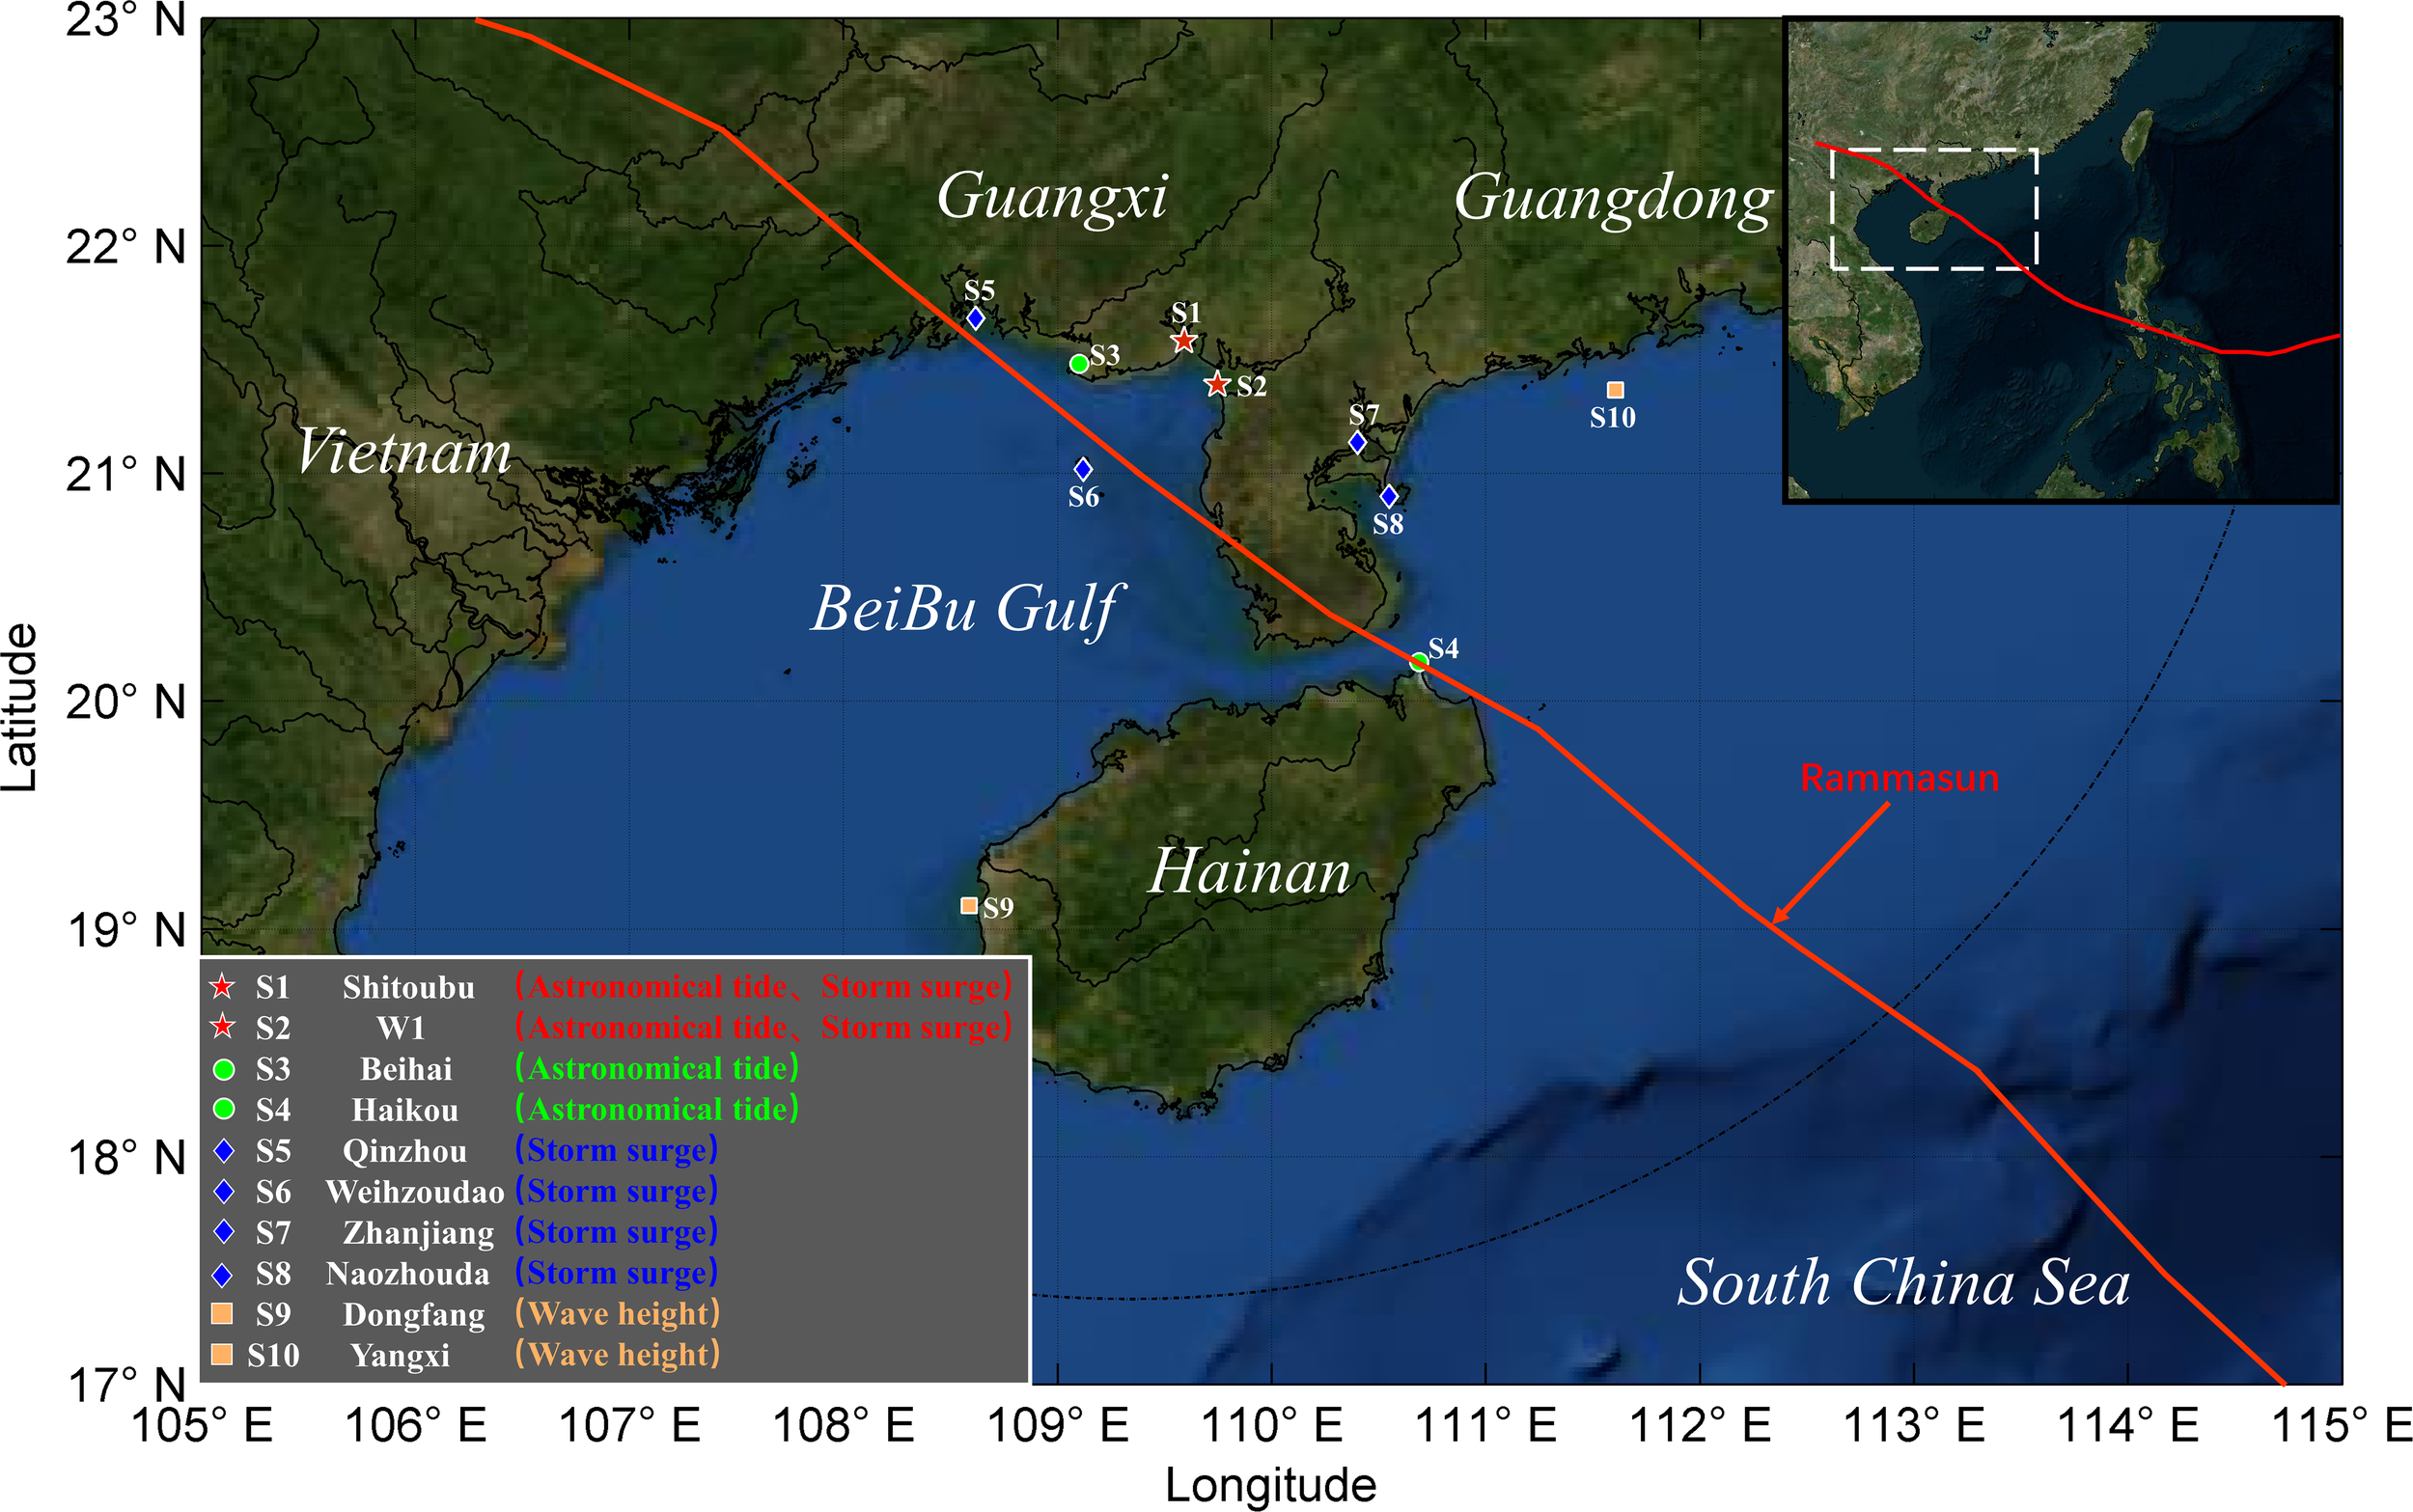
Study area of the Beibu Gulf, the track of Typhoon Rammasun (2014) and the location of validation stations.
3 Model setup and validation
3.1 Calculation of atmospheric pressures and surface winds
This study employs the Holland typhoon model (Holland, 2008, 2010), which is widely used in storm surge and typhoon wave simulation, to generate the pressure/wind field of Typhoon Rammasun. The governing equation for the pressure field is as follows:
where represents the surface pressure at a radius (distance away from the typhoon center) of , represents the central pressure of the typhoon, represents the pressure drop from a specified external pressure to the central pressure , represents the maximum wind speed radius of the typhoon, and represents a scale parameter.The governing equation for the wind field is as follows:
where represents the surface wind speed at radius , the subscript denotes the surface value (nominal height of 10 m), represents the surface scale parameter of the typhoon, and represents a profile shape parameter of the typhoon (Equations 1, 2).
Data on the track, central pressure, maximum wind speed radius, and sustained maximum wind speed of Typhoon Rammasun at a 6-hour interval are collected from the Northwest Pacific Typhoon Best Track Archive of the Joint Typhoon Warning Center, to calculate the spatiotemporally varying atmospheric pressure and surface wind fields. The ambient undisturbed synoptic background surface pressure is take to be 1010hPa, the inflow angle is take to be 20°, the wind speed factoris take to be 0.93.
3.2 Tide–surge–wave coupling model description
The Delft3D model is one of the most advanced coastal and ocean numerical simulation systems composed of five core modules, and is widely used in the prediction and hindcast of storm events in estuarine, coastal, and marine environments. In this study, the FLOW module and the WAVE module are used to describe the storm surge and wave process during Typhoon Rammasun.
The FLOW module is based on the shallow water equations and the Boussinesq assumption, solving the Navier-Stokes transport equations under the inclined pressure using finite difference method. It can be used to simulate the hydrodynamic processes of oceans and coastal areas in multi-dimensional (2DH or 3D) space. The governing equations are as follows. For the mass conservation equation:
where represents the total water depth, represents the net water depth from the reference plane, and respectively denote the velocity components in the and directions, and represents the mass intensity per unit area. For the momentum conservation equation:
where f represents the Coriolis force parameter, represents the dynamic horizontal eddy viscosity, represents the reference density, represents the irregular density, and respectively denote the wind pressure components at the sea surface in the and directions, and and respectively denote the bottom shear stress components in the and directions (Equations 3–5).
An integrally-coupled tide-surge-wave model is constructed based on the Holland typhoon model and Delft3D-FLOW-WAVE model. The interaction process of the coupled model is illustrated in Figure 2. Specifically, the Holland typhoon model provides meteorological forcing at the sea surface during the passage of typhoons for the Delft3D-FLOW-WAVE model. The FLOW and WAVE modules are bidirectionally coupled in real-time. The FLOW module computes the spatiotemporal variations of water level and flow field under the impacts of typhoons, and transmits such information such to the WAVE module. Simultaneously, the WAVE module considers the effects of wind stress and radiation stress on storm surge, providing feedback on wave radiation stress and other information to the FLOW module. This interacticve process achieves the coupling between astronomical tide, storm surge, and typhoon wave.
Figure 2
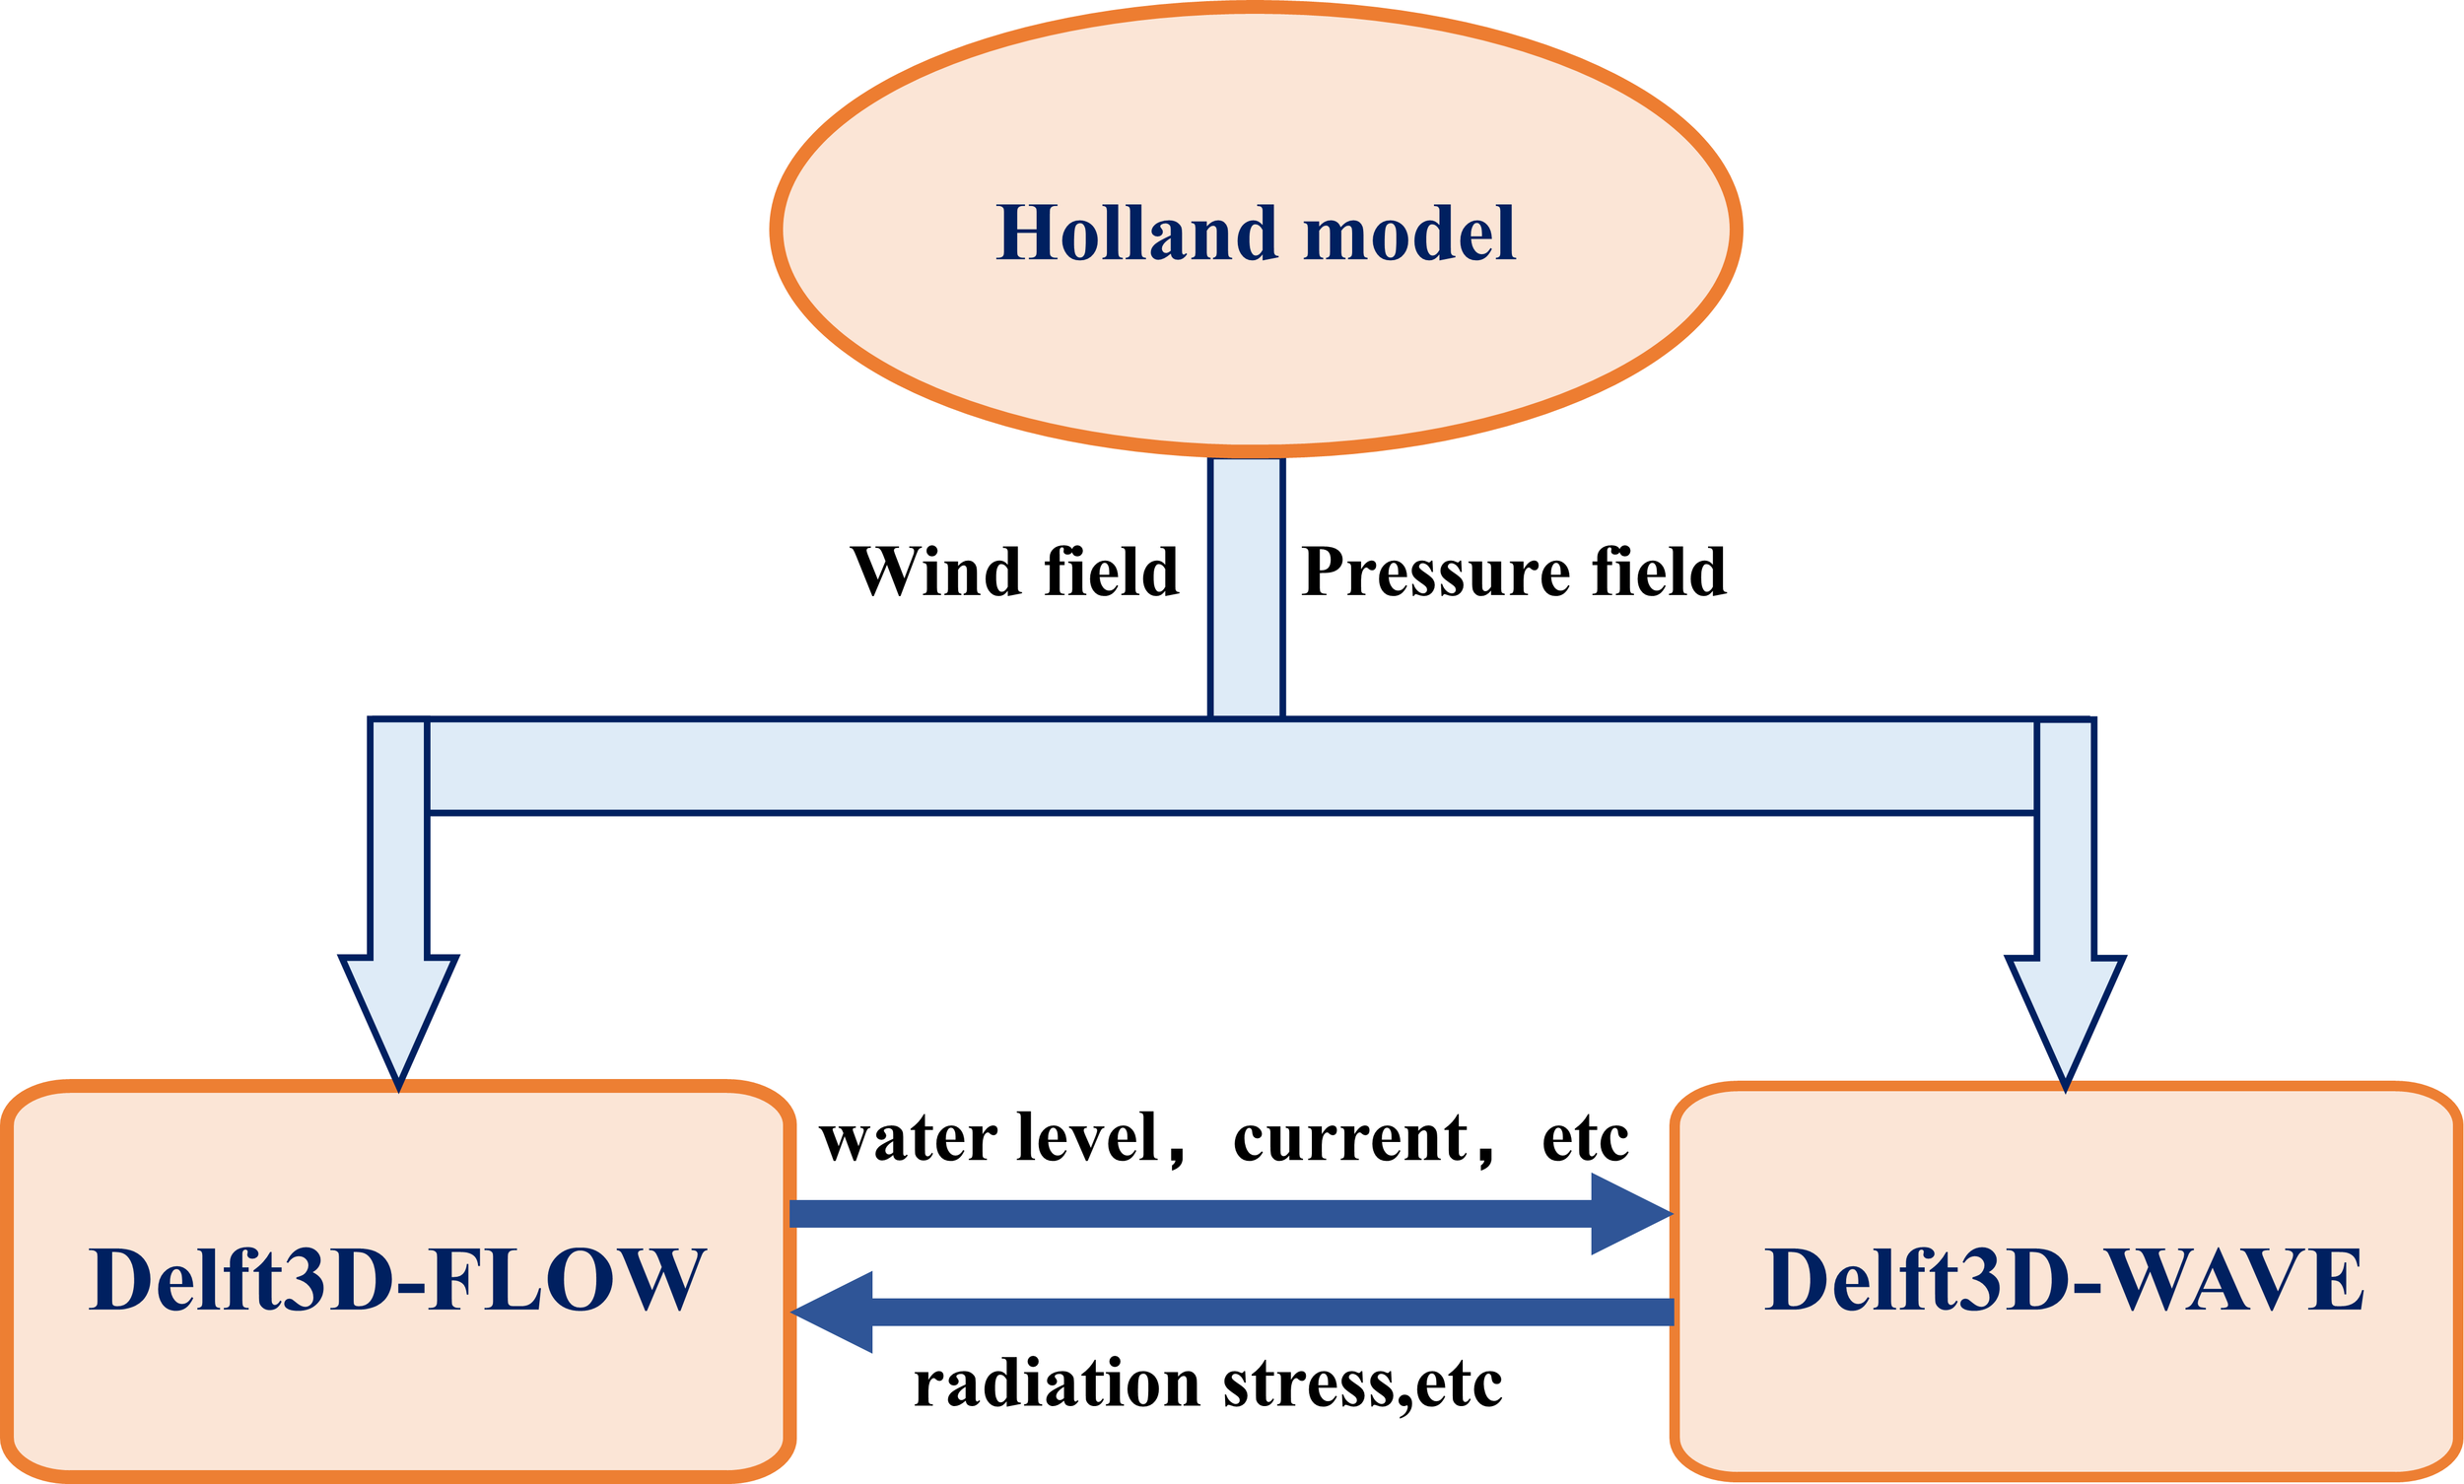
Conceptual diagram depicting variables exchanges in the coupled tide-surge-wave model.
3.3 Computational domain and parameter settings
The setting of the computational domain and mesh resolution is crucial for the simulation of storm surge and typhoon wave. Considering the impact of disturbances at the offshore boundaries and the necessity to finely depict the dynamic process in nearshore,a double-layer nested mesh system was ultilazed (see Figure 3) to respectively construct models for the whole South China Sea (SCS) and the adjacent seas of the Beibu Gulf (BBG). The open-boundary water level of the SCS model was obtained through the global tidal model TPXO, and its modelled time-varying water level further provides information for the open boundaries of the BBG model. The coastline data within the computational domain are obtained from the Globally Self-consistent, Hierarchical, High-resolution Shoorelines (GSHHS) database. Nearshore topographic data are provided by the Electronic Navigational Charts from the China Navy Hydrographic Office (CNHO), while topographic data in deeper regions are sourced from the 15″ resolution General Bathymetric Chart of the Oceans(GEBCO)dataset. For more information on nesting meshes and model parameters, see Table 1.
Figure 3
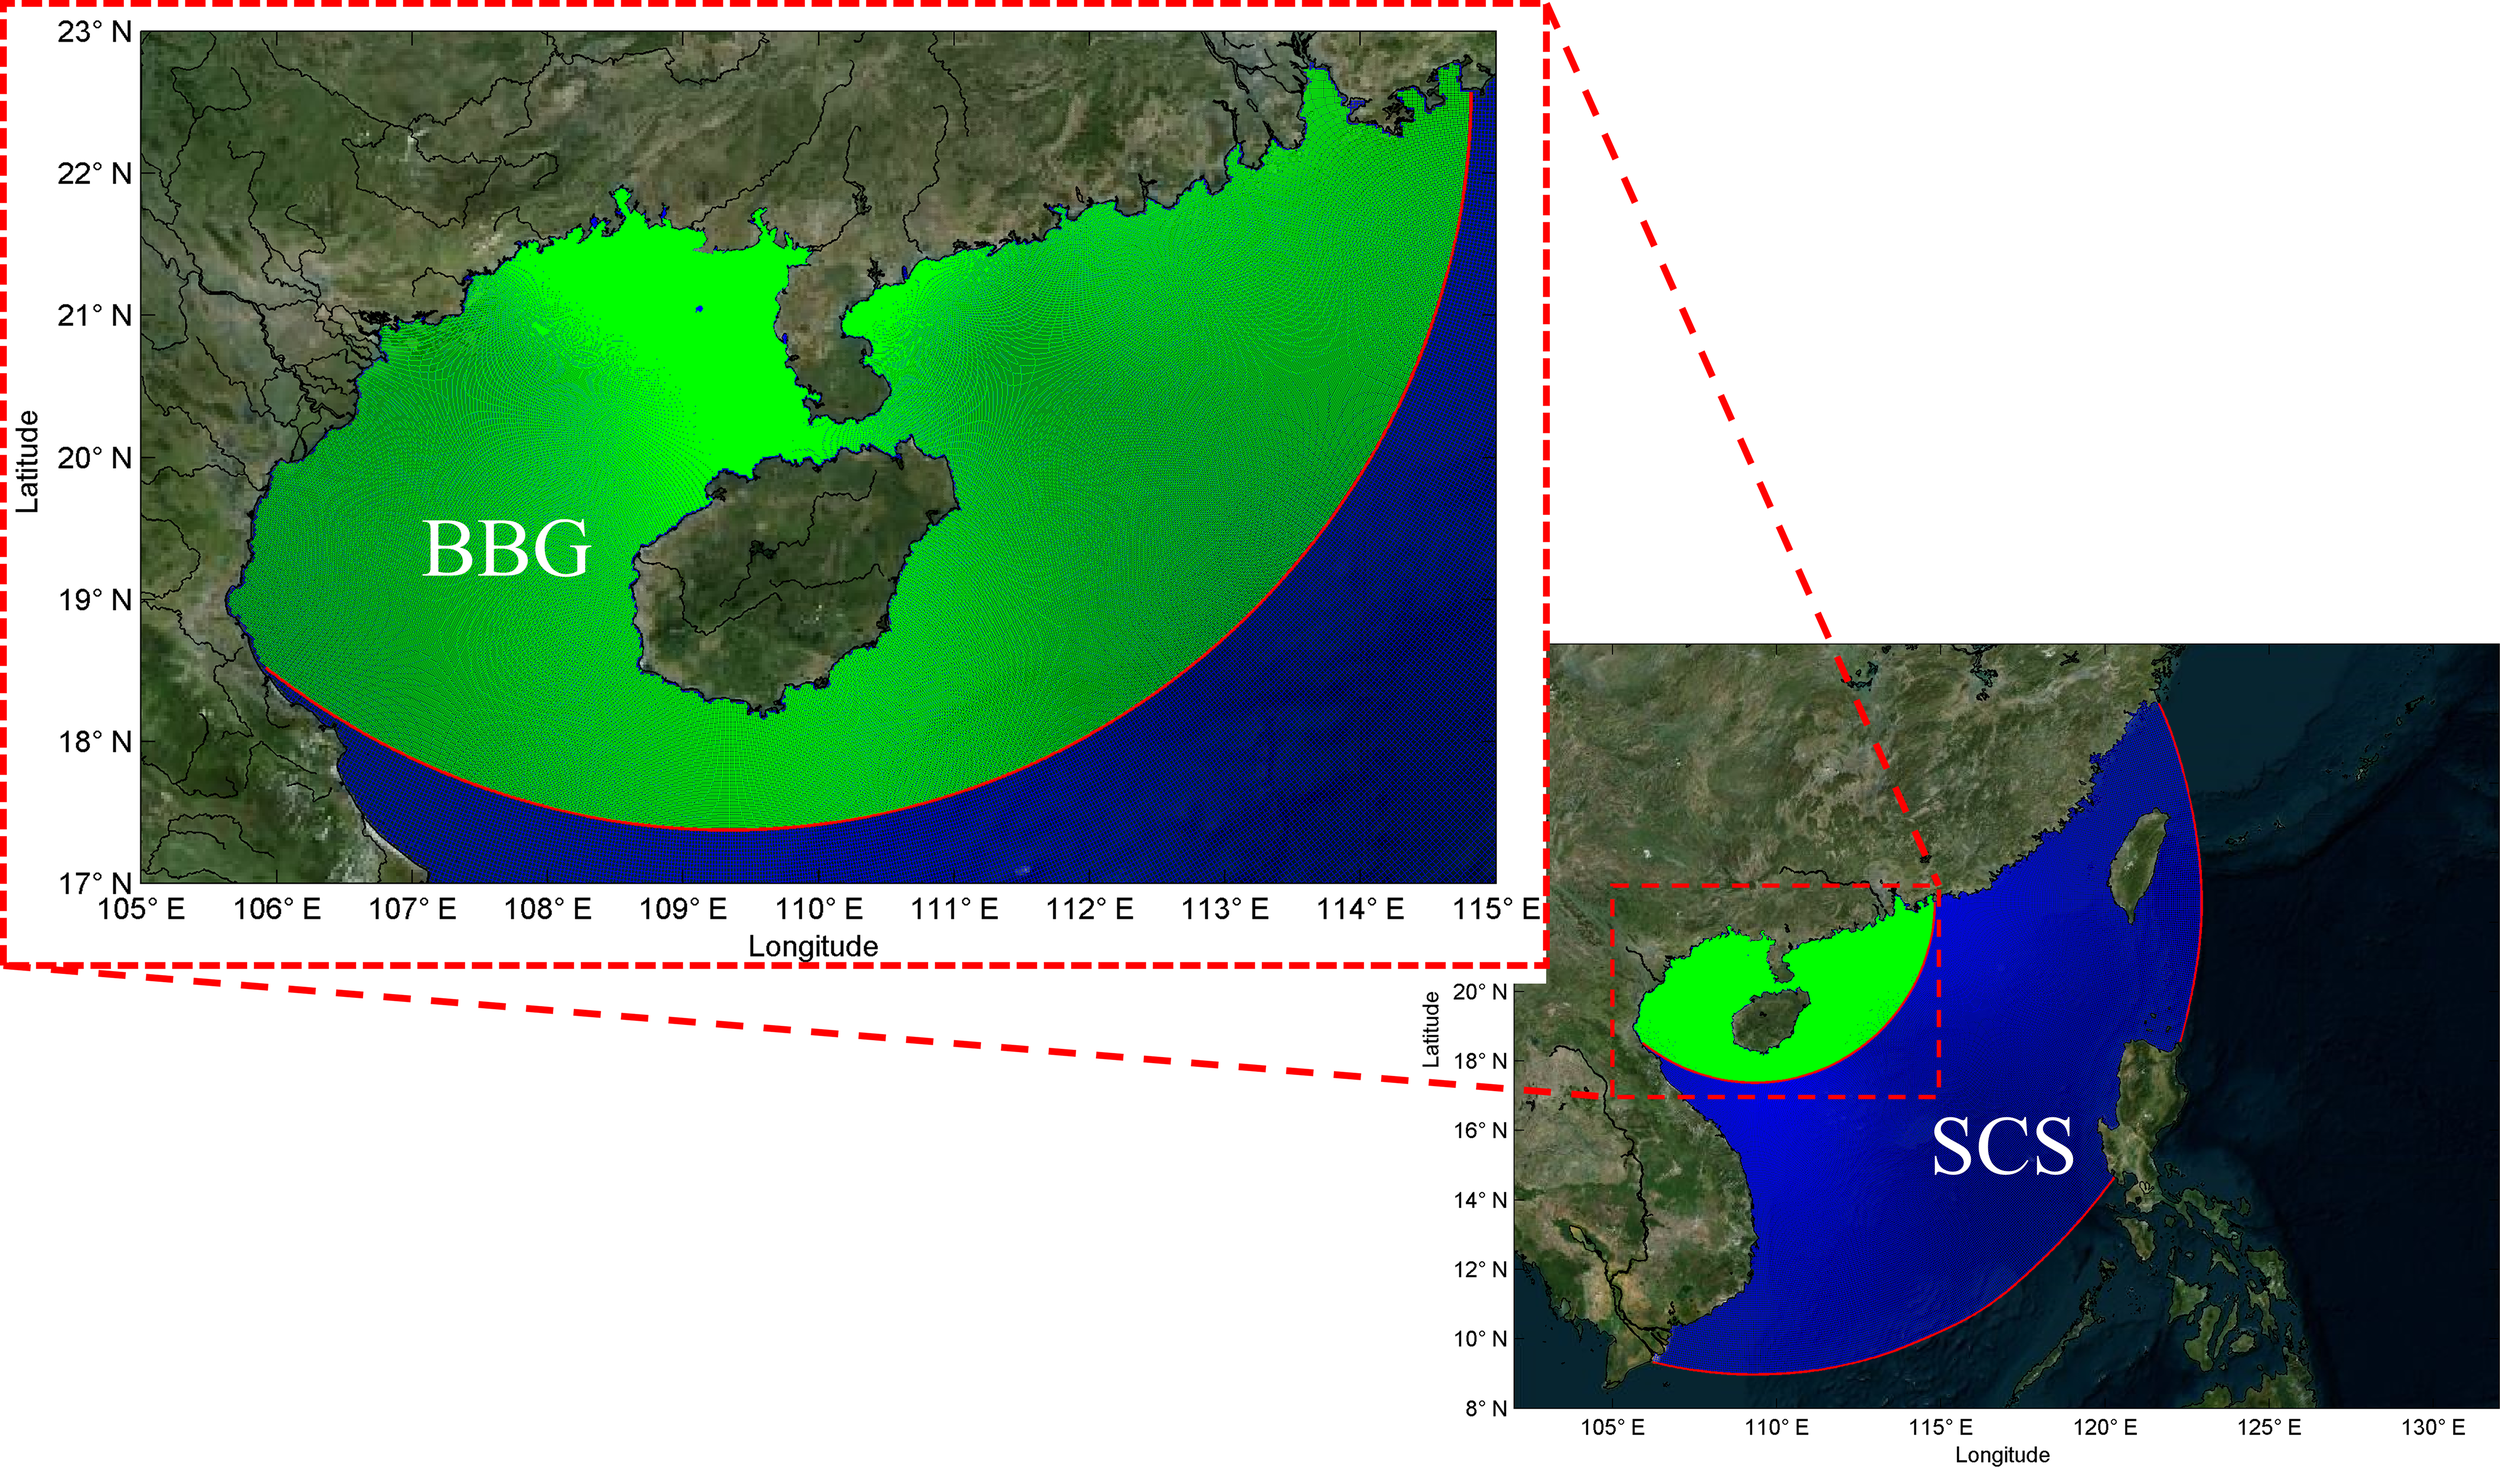
Nested meshes established in the simulation of typhoon processes.
Table 1
| Computational mesh | SCS | BBG |
|---|---|---|
| region | 105.5°E~122.9°E 8.9°N~28.5°N |
105.6°E~114.6°E 17.6°N~22.7°N |
| node | 687×671 | 986×1172 |
| resolution | 6.5km in the offshore are | 300m in the nearshore area |
| roughness formula | Manning | |
| manning coefficient | 0.020 | 0.022 |
| bottom friction type | Jonswap | |
| bottom friction coefficient | 0.067m2s-3 | |
| whitecapping | Komen | |
| astronomical tide running time | 2014-06-01 00:00~2014-08-01 00:00(UTC) | |
| storm surge and typhoon wave running time | 2014-07-10 00:00~2014-07-20 00:00(UTC) | |
| time step | 60s | |
| Smoothing time | 3600s | |
| wave-current coupling time step | 3600s | |
Parameters of nesting meshes and other parameters.
3.4 Model validation
Three widely used error statistic indicators (Root Mean Square Error, Bias and Skill Score) are employed to in the validation of the tide-surge-wave coupled model. Root Mean Square Error (RMSE) is defined as:
Bias is defined as:
Skill Score is defined as:
Where represents the observed value, represents the actual measured value, represents the modeled value, represents the average of observed value , and represents the average of modeled value (Equations 6–8).
Since the accurate simulation of astronomical tide is a prerequisite for typhoon process hindcast, the astronomical tide process was firstly verified based a simulation (without considering meteorological forcing) running between June 1, 2014 and August 1, 2014. The modelling results exhibit a good agreement with the observational data at stations S1, S2, S3, and S4, indicating that the model could accurately capture the astronomical tide process (Figure 4).
Figure 4
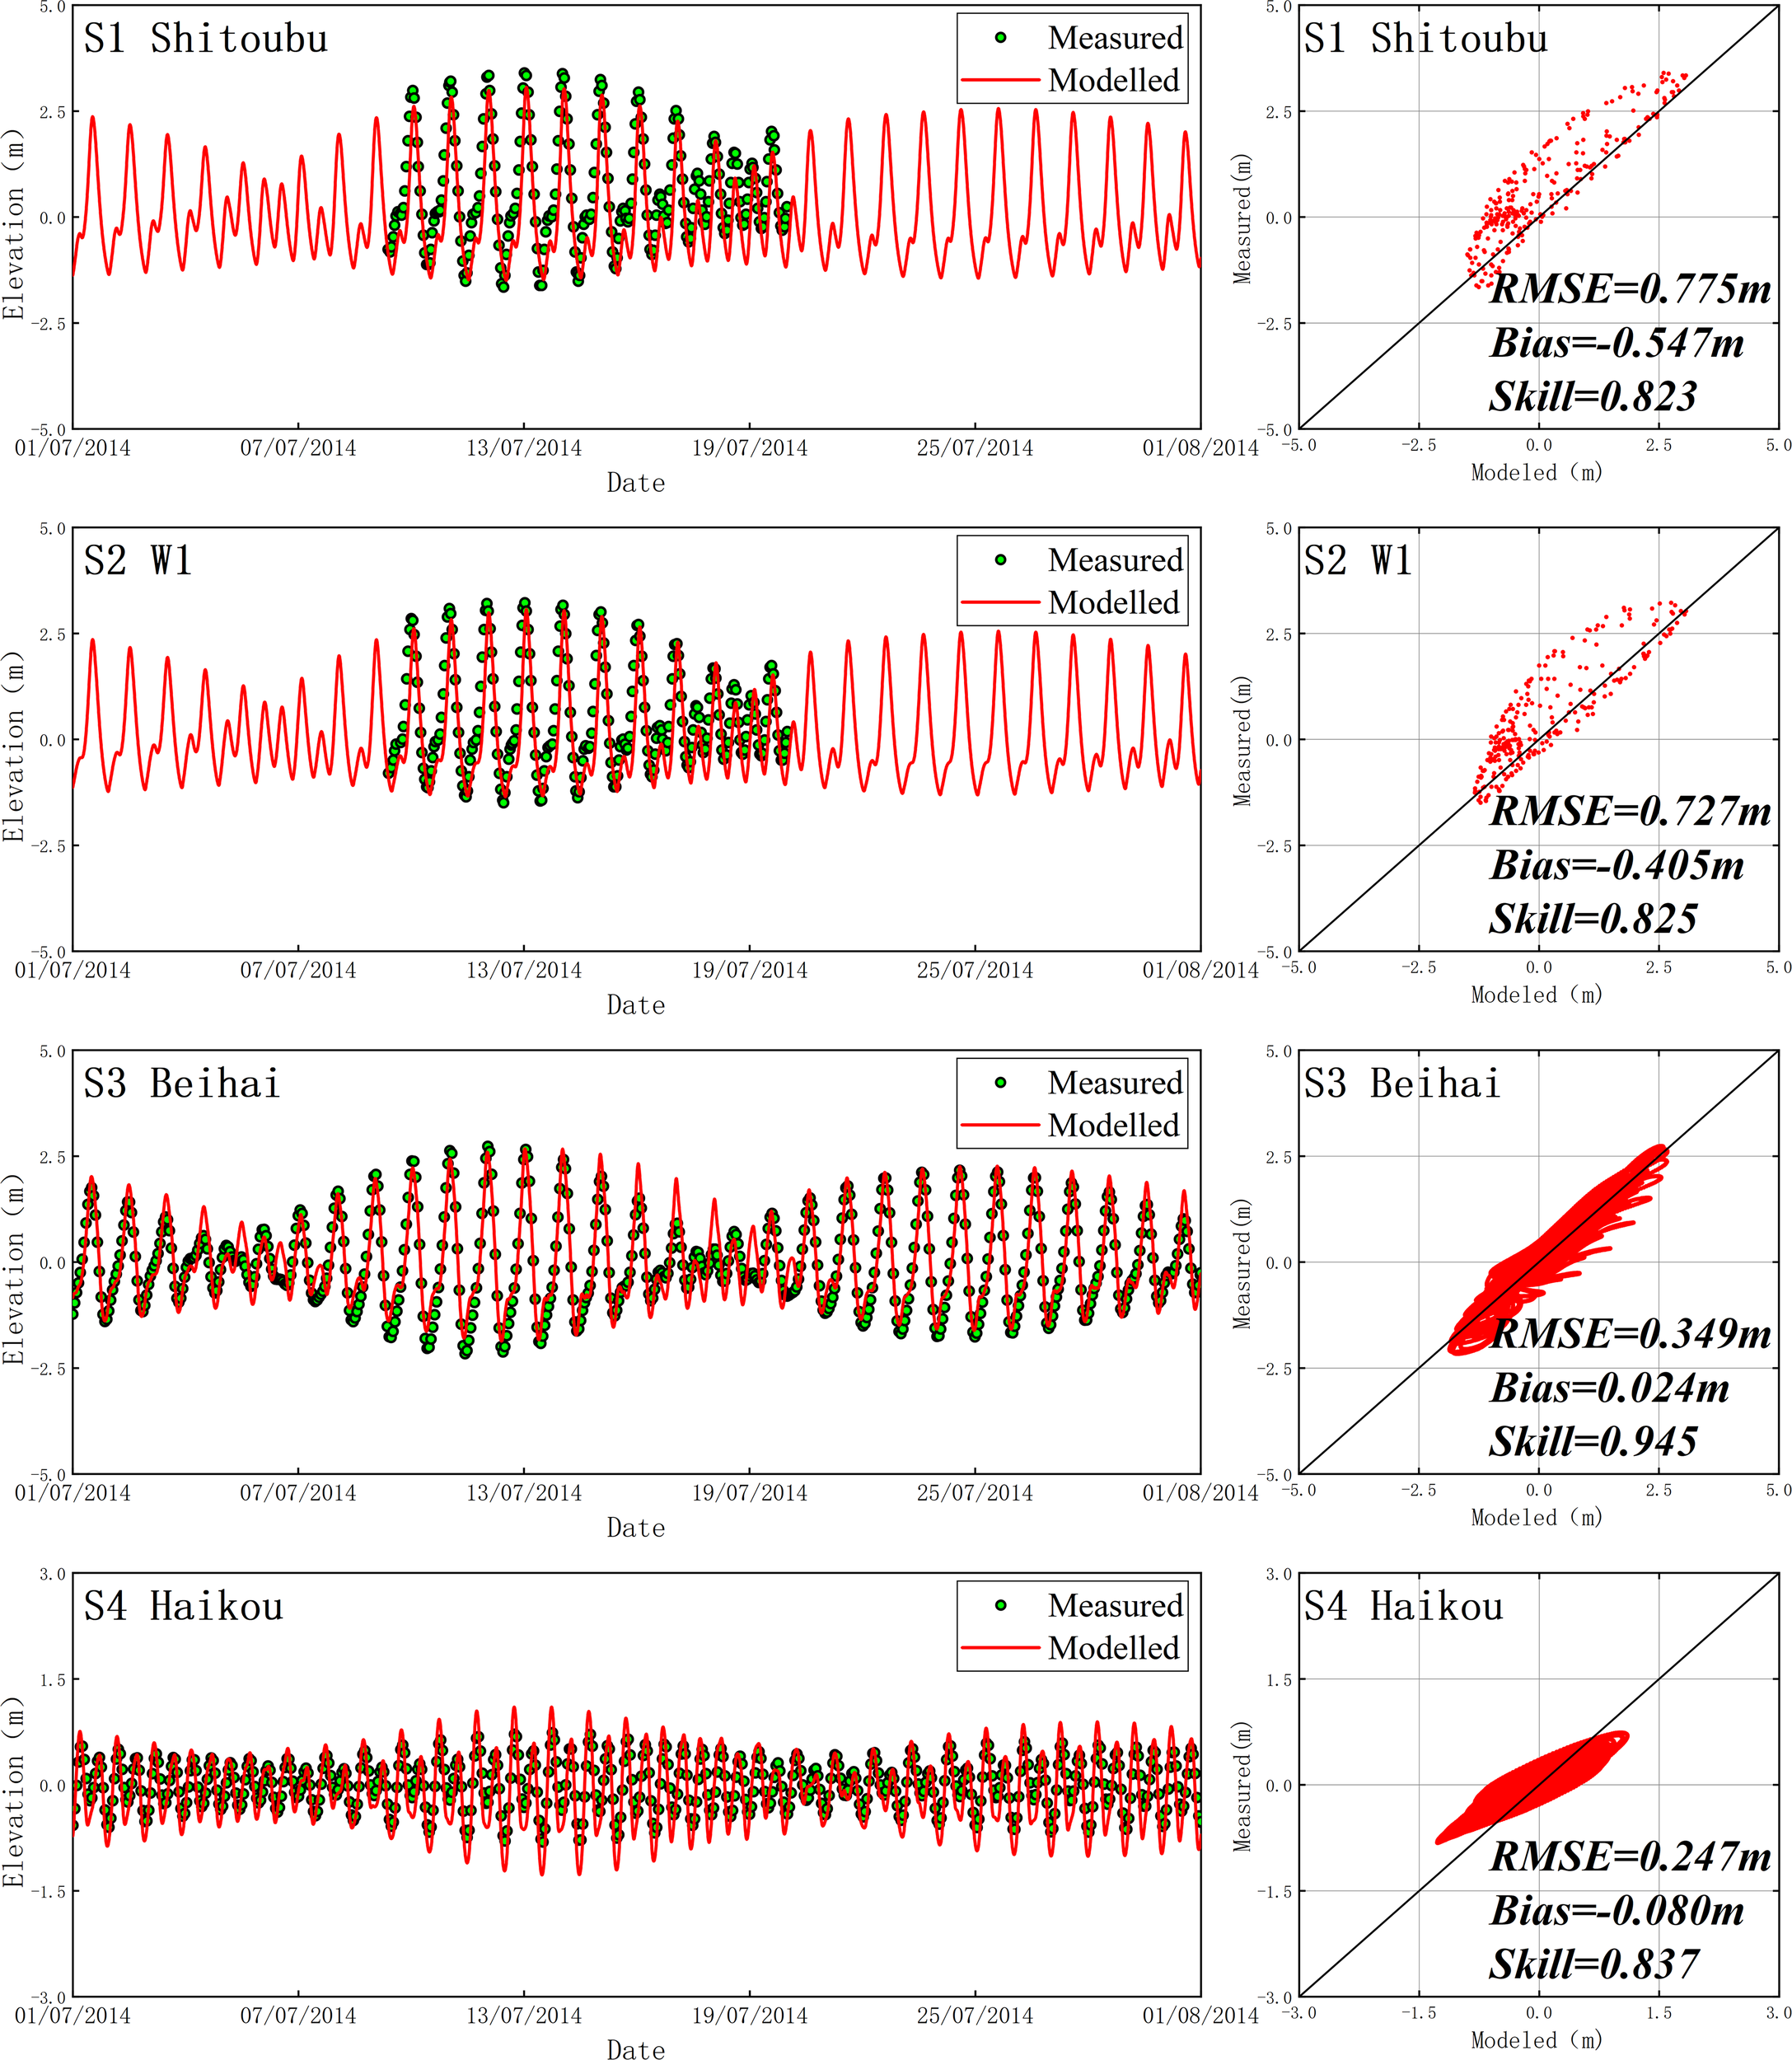
Comparison of simulated and observed astronomical tide level time series for model calibration with Typhoon Rammasun (2014). .
A time range from July 10, 2014 to July 20, 2014 (UTC) was selected in the simulation of storm surge and typhoon wave related to Typhoon Rammasun, as it encompasses the whole lifespan (e.g., formation, intensification, landfall and dissipation) of the typhoon. The observational data from stations S1, S2, S5, S6, S7, and S8 were used to validate the simulated storm surge. It is found that (Figure 5) that the model accurately captures the extremum of initial excitation phase, principal oscillation phase, and residual oscillation phase during the storm surge.
Figure 5
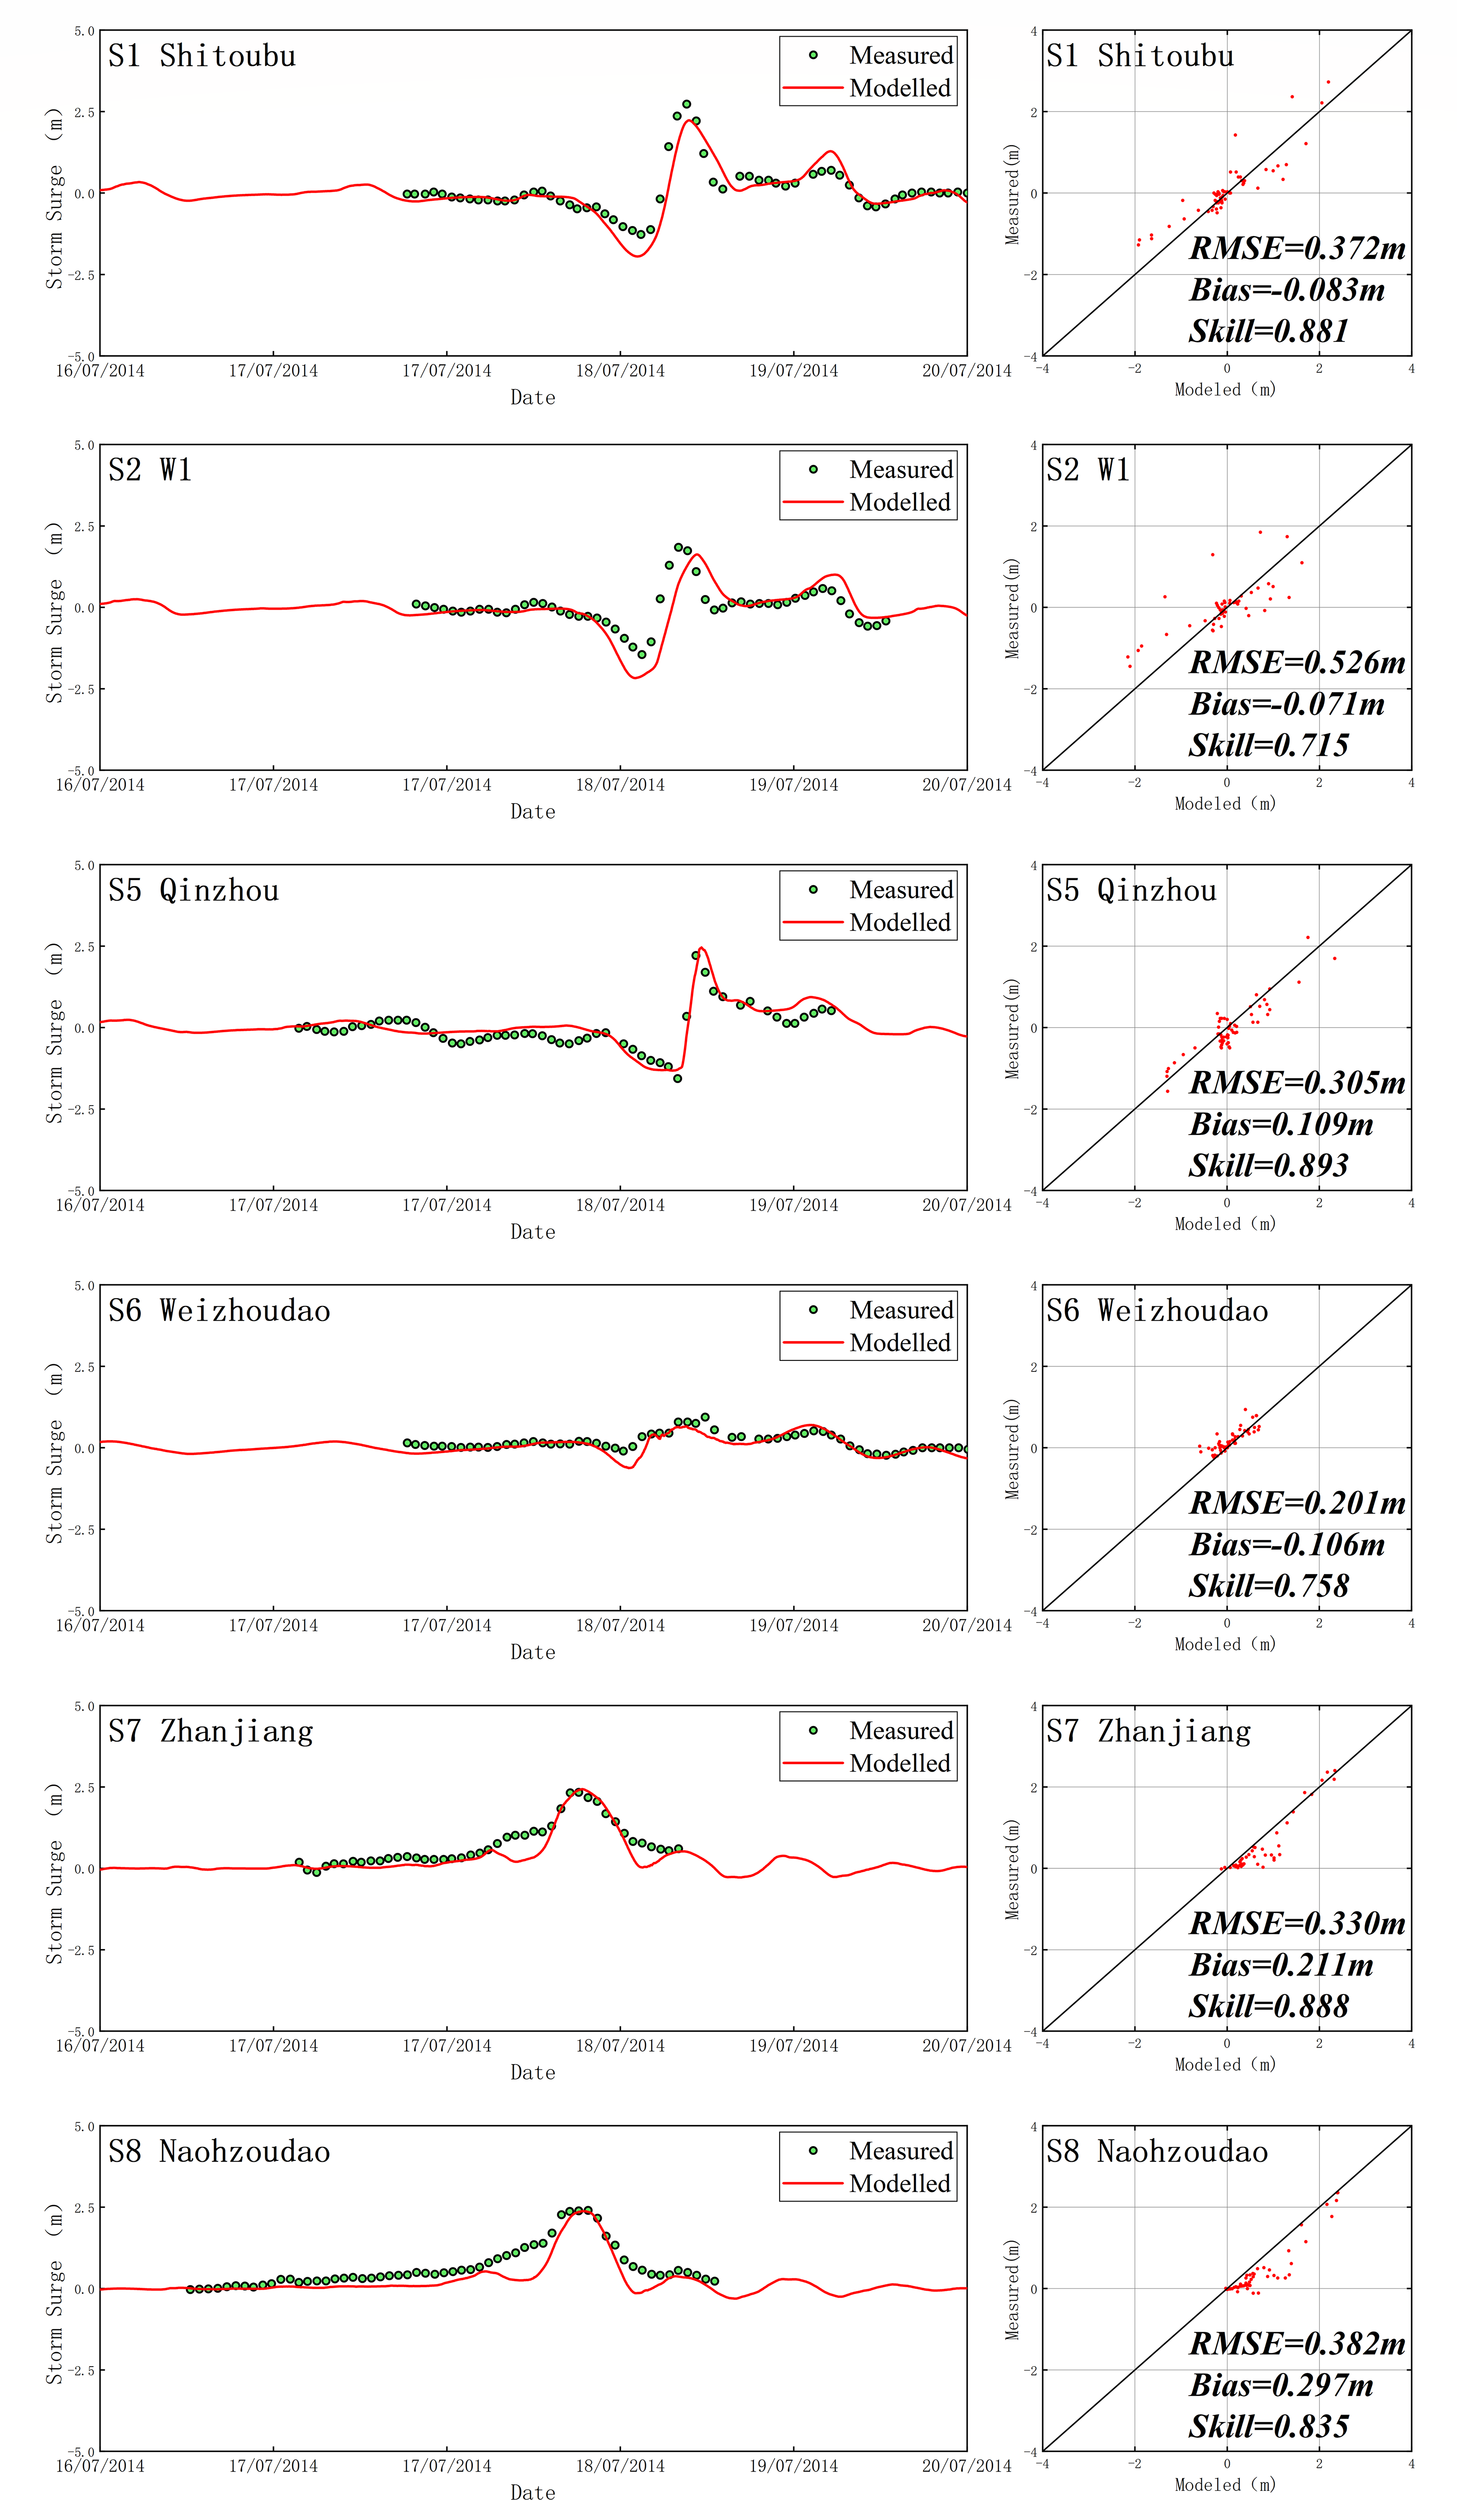
Comparison of simulated and observed storm surge level time series for model calibration with Typhoon Rammasun (1409).
Furthermore, this study selected observational data of significant wave heights from stations S9 and S10 to validate the typhoon wave simulations. As shown in Figure 6, the simulated peak value of significant wave heights align well with the observational data, reflecting the trend of wave height changes.
Figure 6
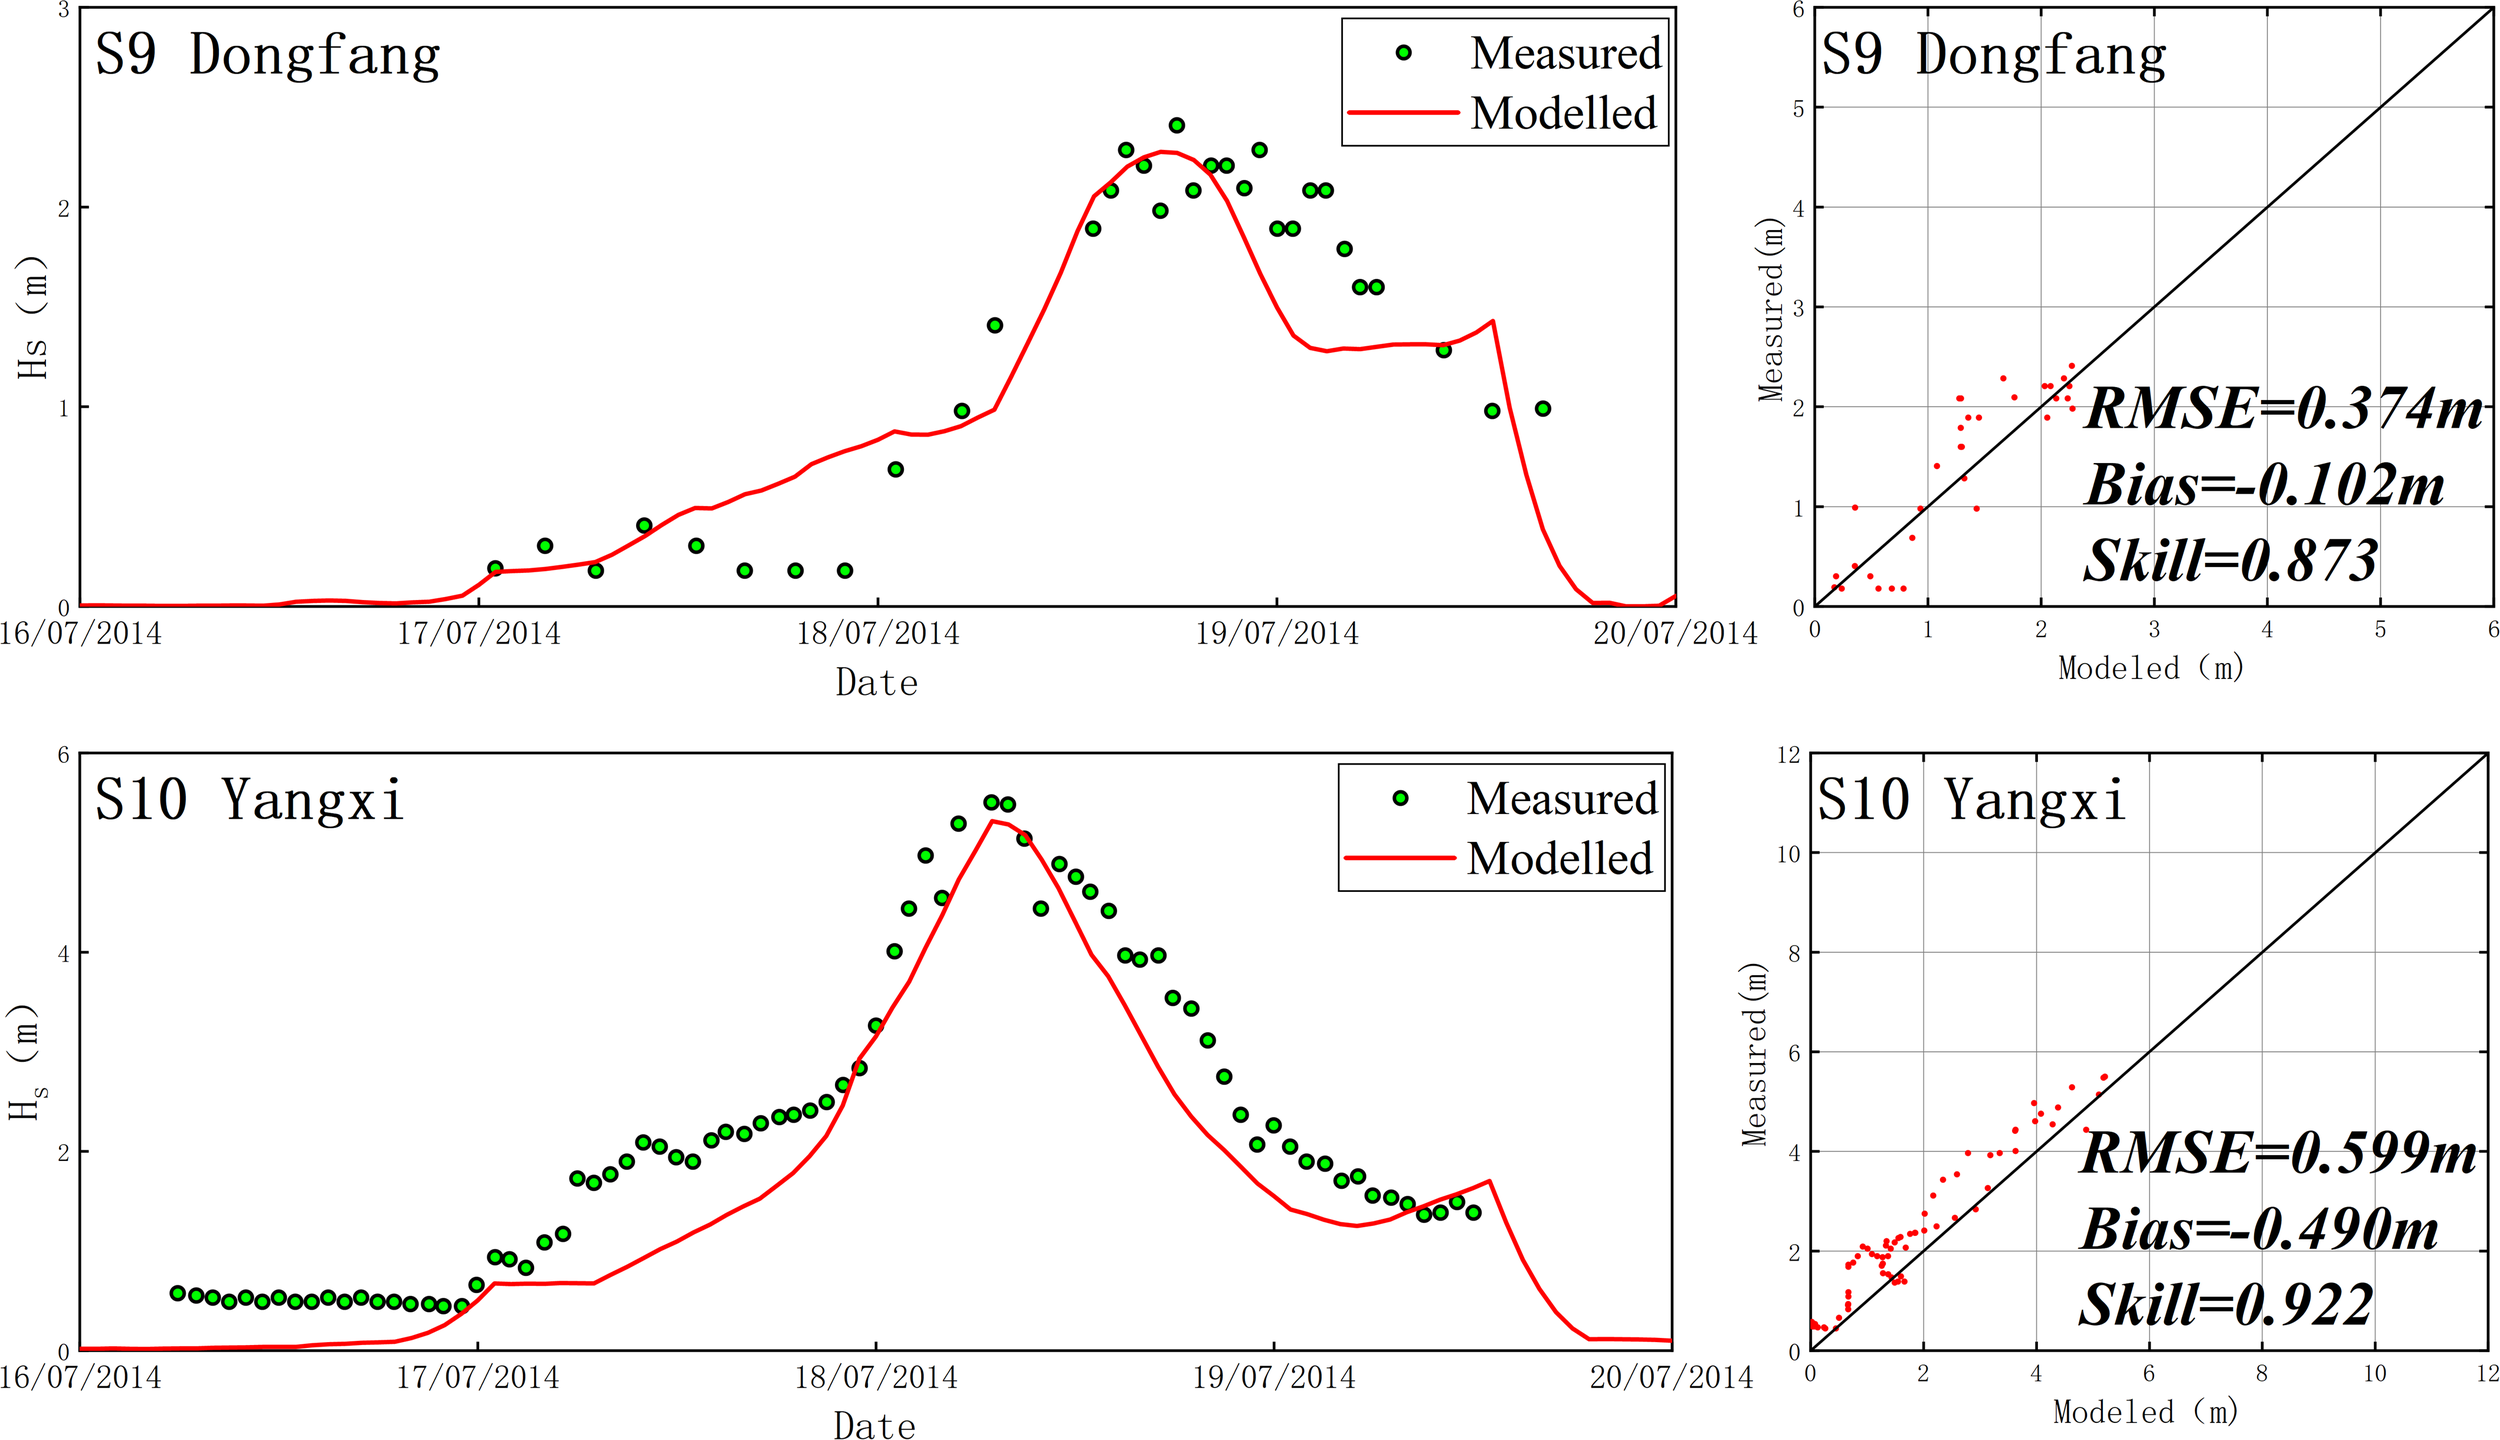
Comparison of simulated and observed significant wave height time series for model calibration with Typhoon Rammasun (1409).
4 Results and discussion
4.1 Storm surges during Super Typhoon Rammasun
The storm surge in the Beibu Gulf showed dynamic spatiotemporal distributions during the passage of Typhoon Rammasun. Before the landfall of Rammasun, offshore winds tend to generate negative storm surges (up to -3 m) northward the typhoon center; however, a localized positive surge is generally developed in the south or west under the impacts of onshore winds, with the high surge center distributed along the coast of the Leizhou Peninsula (Figures 7A-C). As Rammasun made landfall, large scale coastal areas began to experience strong positive surges, except for the ports close to the typhoon low-pressure center (Figure 7D). Particularly, the positive surges at the head of the Tieshan Port reached 3m, due to the trumpet-shaped coastal morphology. After the dissipation of Rammasun, the widespread positive surge remained due to the residual winds (Figure 7F). At this time, the maximum positive surge of > 2m primarily occurred within the Qinzhou Port, characterized by a gourd-shaped coastal morphology.
Figure 7
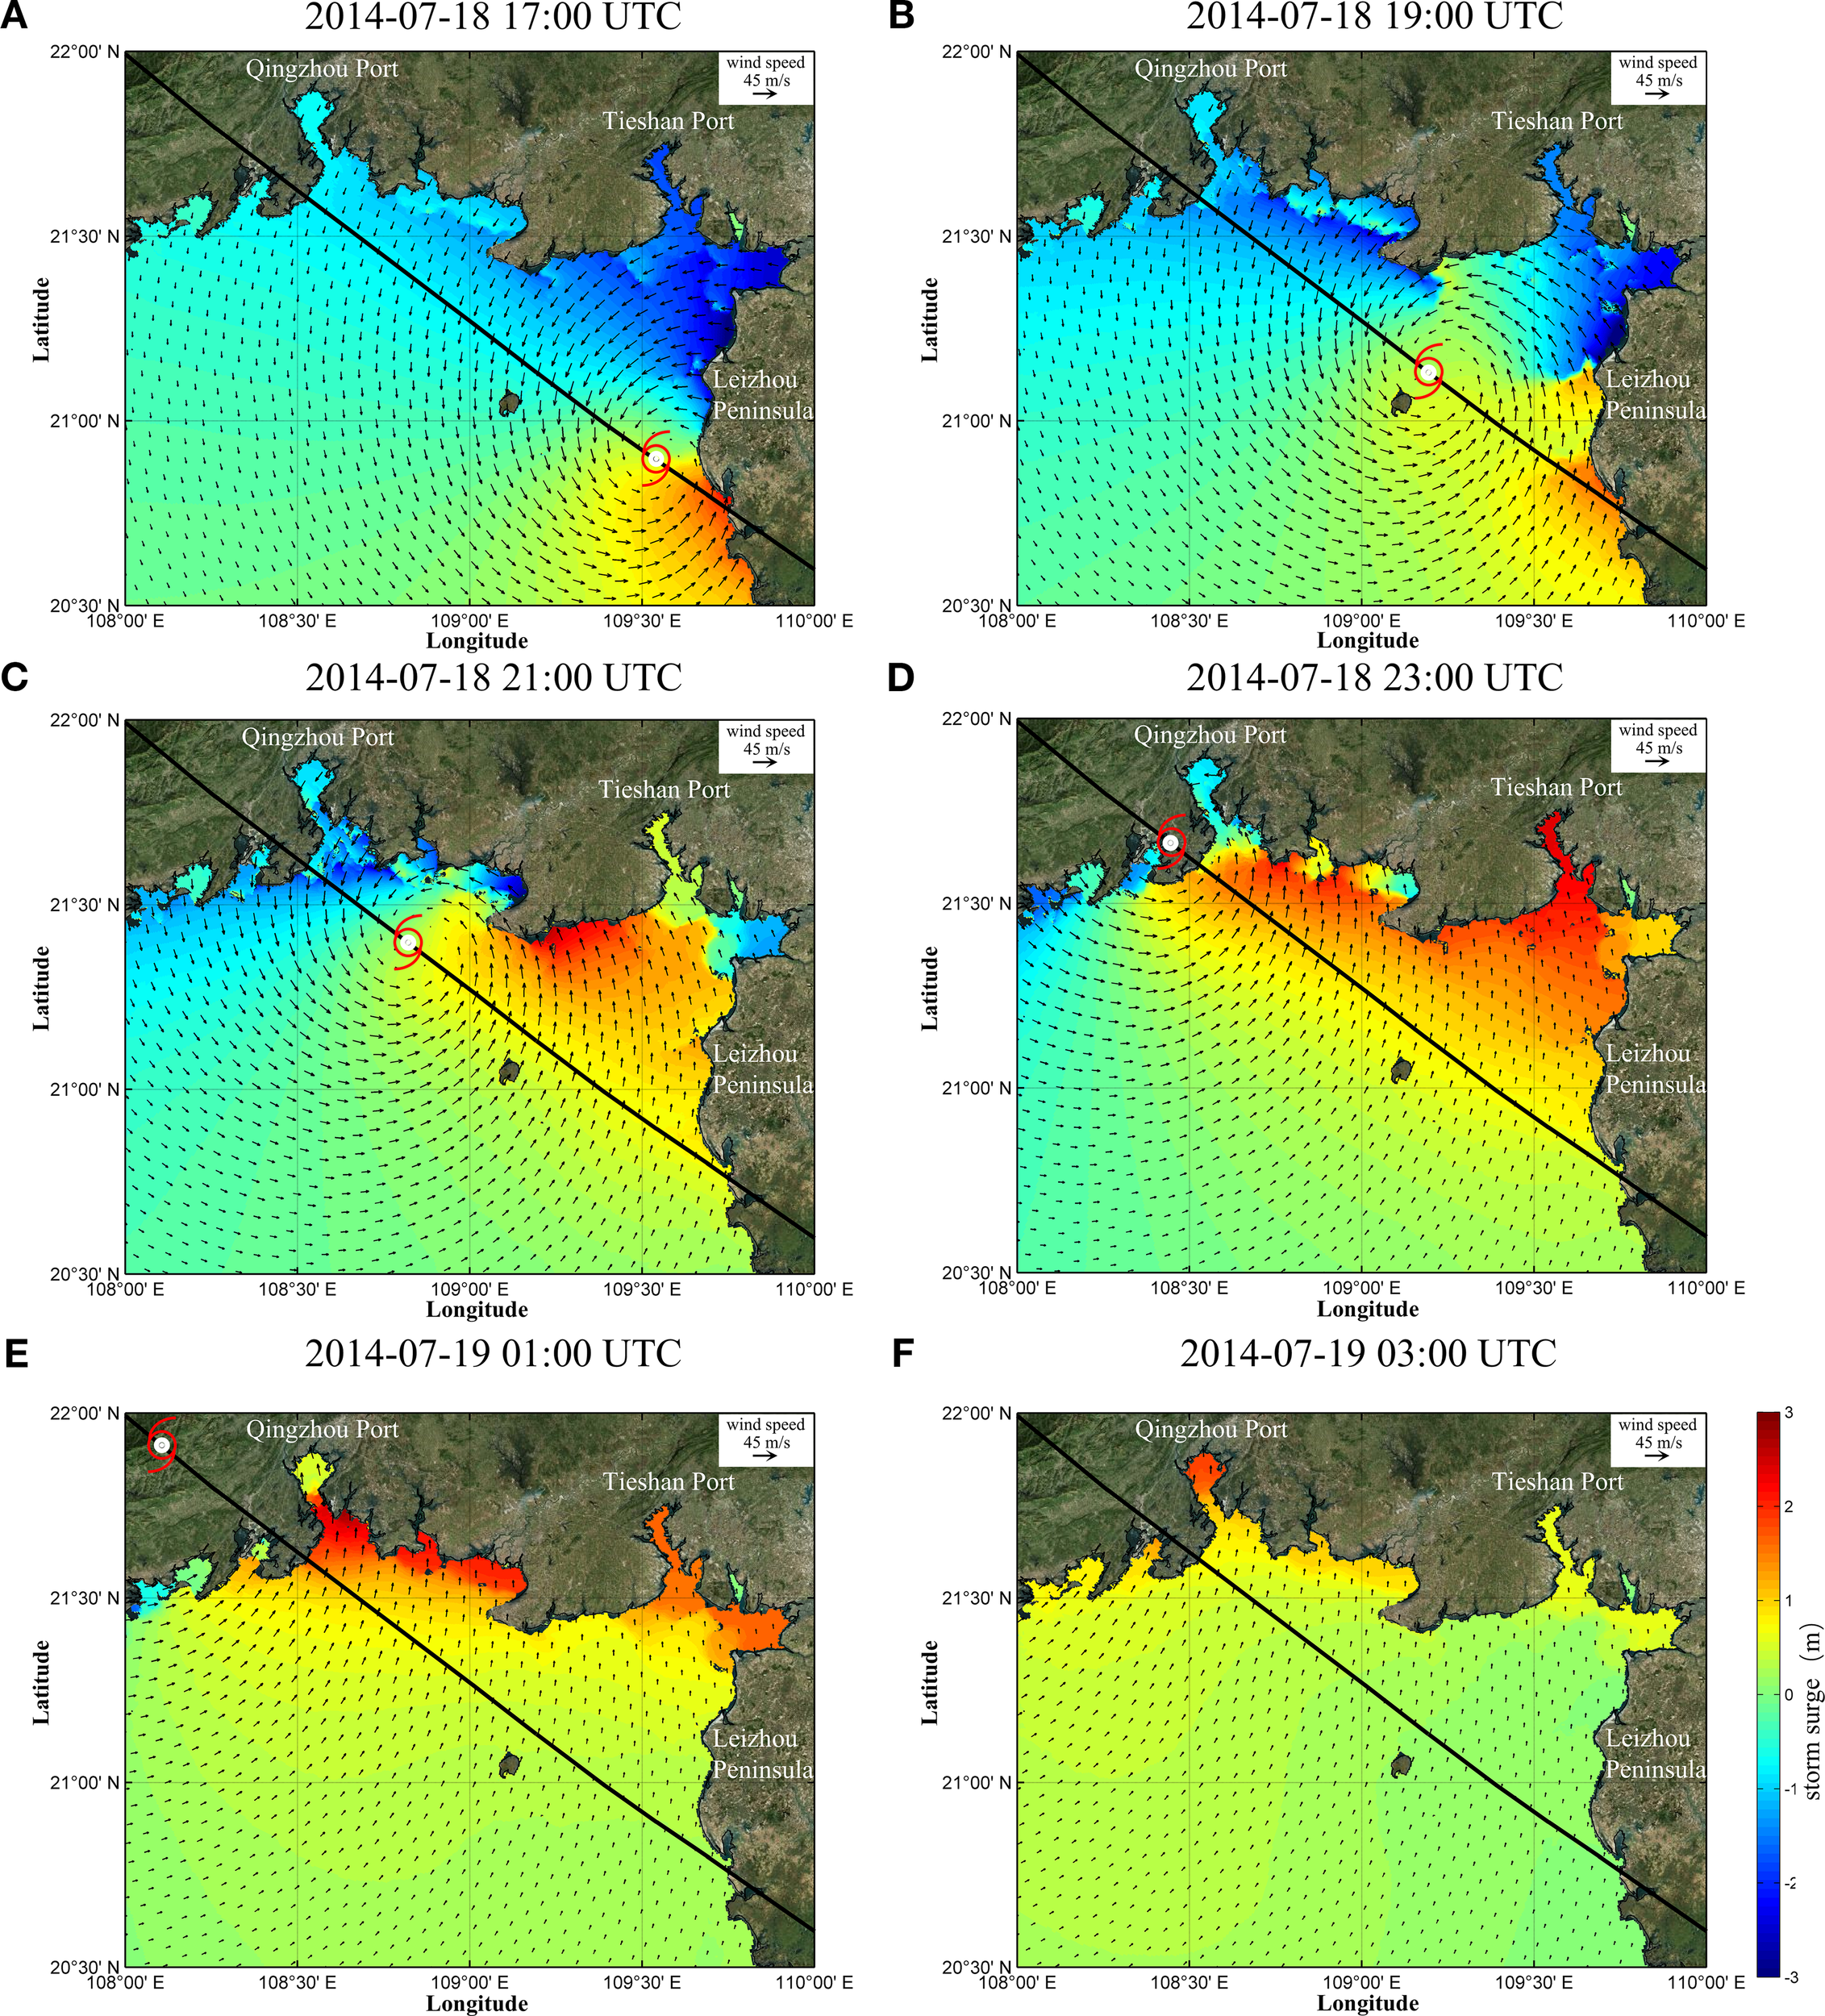
Maps showing storm surge progression in BeiBu Gulf from July 18 to 19, 2014: (A) 2014-07-18 17:00 UTC, (B) 2014-07-18 19:00 UTC, (C) 2014-07-18 21:00 UTC, (D) 2014-07-18 23:00 UTC, (E) 2014-07-19 01:00 UTC, (F) 2014-07-19 03:00 UTC.
The storm surge process is governed by interactions between wind forcing and coastal topography. As noted by Heidarzadeh et al. (2023) onshore/offshore winds during typhoons favor the development of positive/negative storm surge, tending to trigger asymmetry surge distributions around the typhoon center. Thus, typhoons do not necessarily cause increased water level, just as the case before typhoon landfall. Besides, the surge distribution is squeezed by coastal topography, which amplify regional storm surge and induces a larger absolute value of the positive surges. The amplification effects of shoreline convergence and water depth reduction on storm surges or tidal waves, as well as their differences, are of paramount importance in ocean engineering research. As shown in our modelling, maximum surge occurs in the Tieshan Port and Qinzhou Port, which are characterized by the most convergent coastline (Figure 7). Our study further indicates that the maximum surge overall follows the typhoon track along the coast of the bay, with a presence of lag of four hours. Furthermore, divergences exist between the location of largest surge and of typhoon land fall for the whole bay, and between the timing of largest surge and shortest distance to typhoon center for a specific location. This shed light on coastal defense against typhoons.
4.2 Typhoon waves during Super Typhoon Rammasun
A large-scale rotating wave field is formed in the Beibu Gulf during Typhoon Rammasun. Notably, a region of a diameter > 100 km and significant wave height > 7m gathered leftward the typhoon track, and the waves rightward the track was obviously weaker (Figure 8D). The region of strong waves continuously locates around the typhoon center, and waves in the coastal area stay weaker than those in deeper regions, despite the landfall of the typhoon. A close positive correlation is found between the wave height series and the wind speed series, and their distribution remains similar.
Figure 8
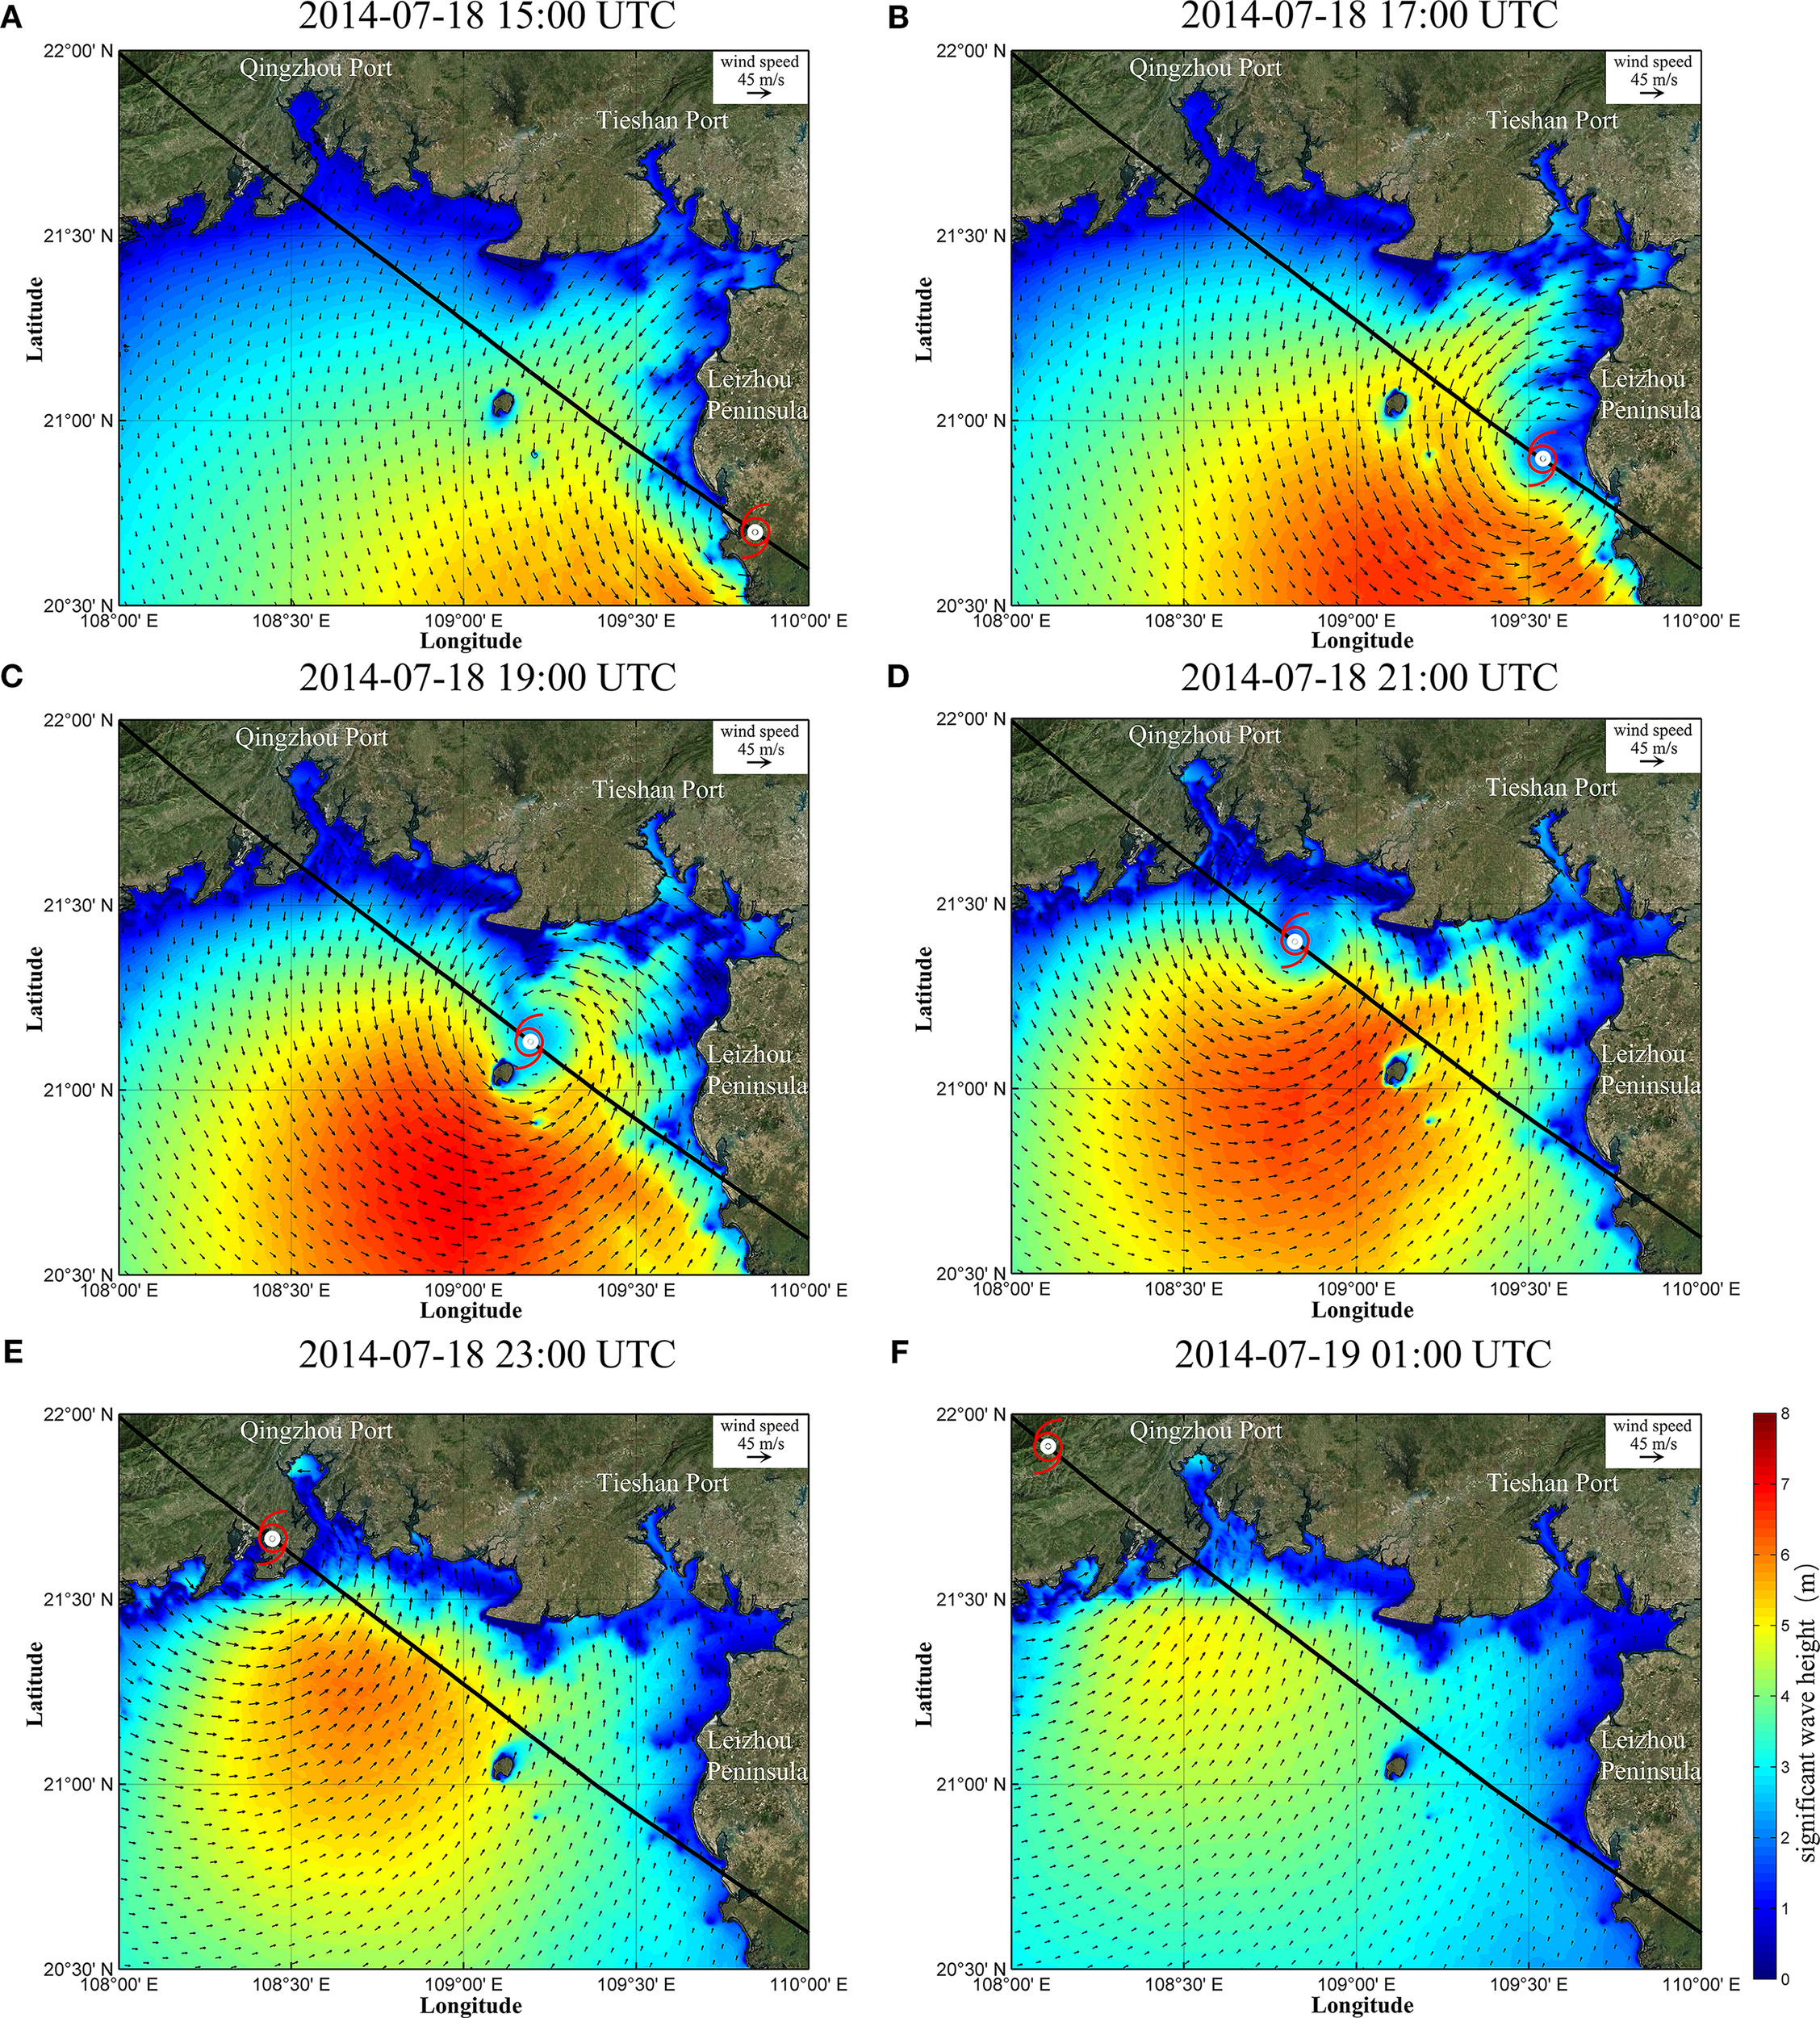
Maps showing wave progression in BeiBu Gulf from July 18 to 19, 2014: (A) 2014-07-18 15:00 UTC, (B) 2014-07-18 17:00 UTC, (C) 2014-07-18 19:00 UTC, (D) 2014-07-18 21:00 UTC, (E) 2014-07-18 23:00 UTC, (F) 2014-07-19 01:00 UTC.
Our modelling results are different from previous studies, which found that typhoons in the Northern Hemisphere generally generate strong waves rightward their tracks, owing to a larger wind area and wind time on the right front side of the typhoon center. To explore the cause of this phenomenon, the process of Typhoon Rammasun was analyzed from a larger spatiotemporal scale (Figure 9). It is found that strong wave is mainly concentrated on the right side of the typhoon track before the typhoon enters the Beibu Gulf, and a transformation from a right-biased distribution to a left-biased distribution occurs thereafter (Figure 9). Presumably, as the presence of Hainan Island and Leizhou Peninsula attenuate the winds on the sea surface, and the shallow water depth of the bay significantly dissipate the regional waves. Meanwhile, the wind direction and wave direction in the left rear side area of the typhoon low-pressure center show a cross-directionality, indicating that the typhoon wave in this area can obtain continuous wind energy input and achieve sufficient development and growth (Figure 10), which may also be one of the reasons for the left-biased distribution of the waves.
Figure 9
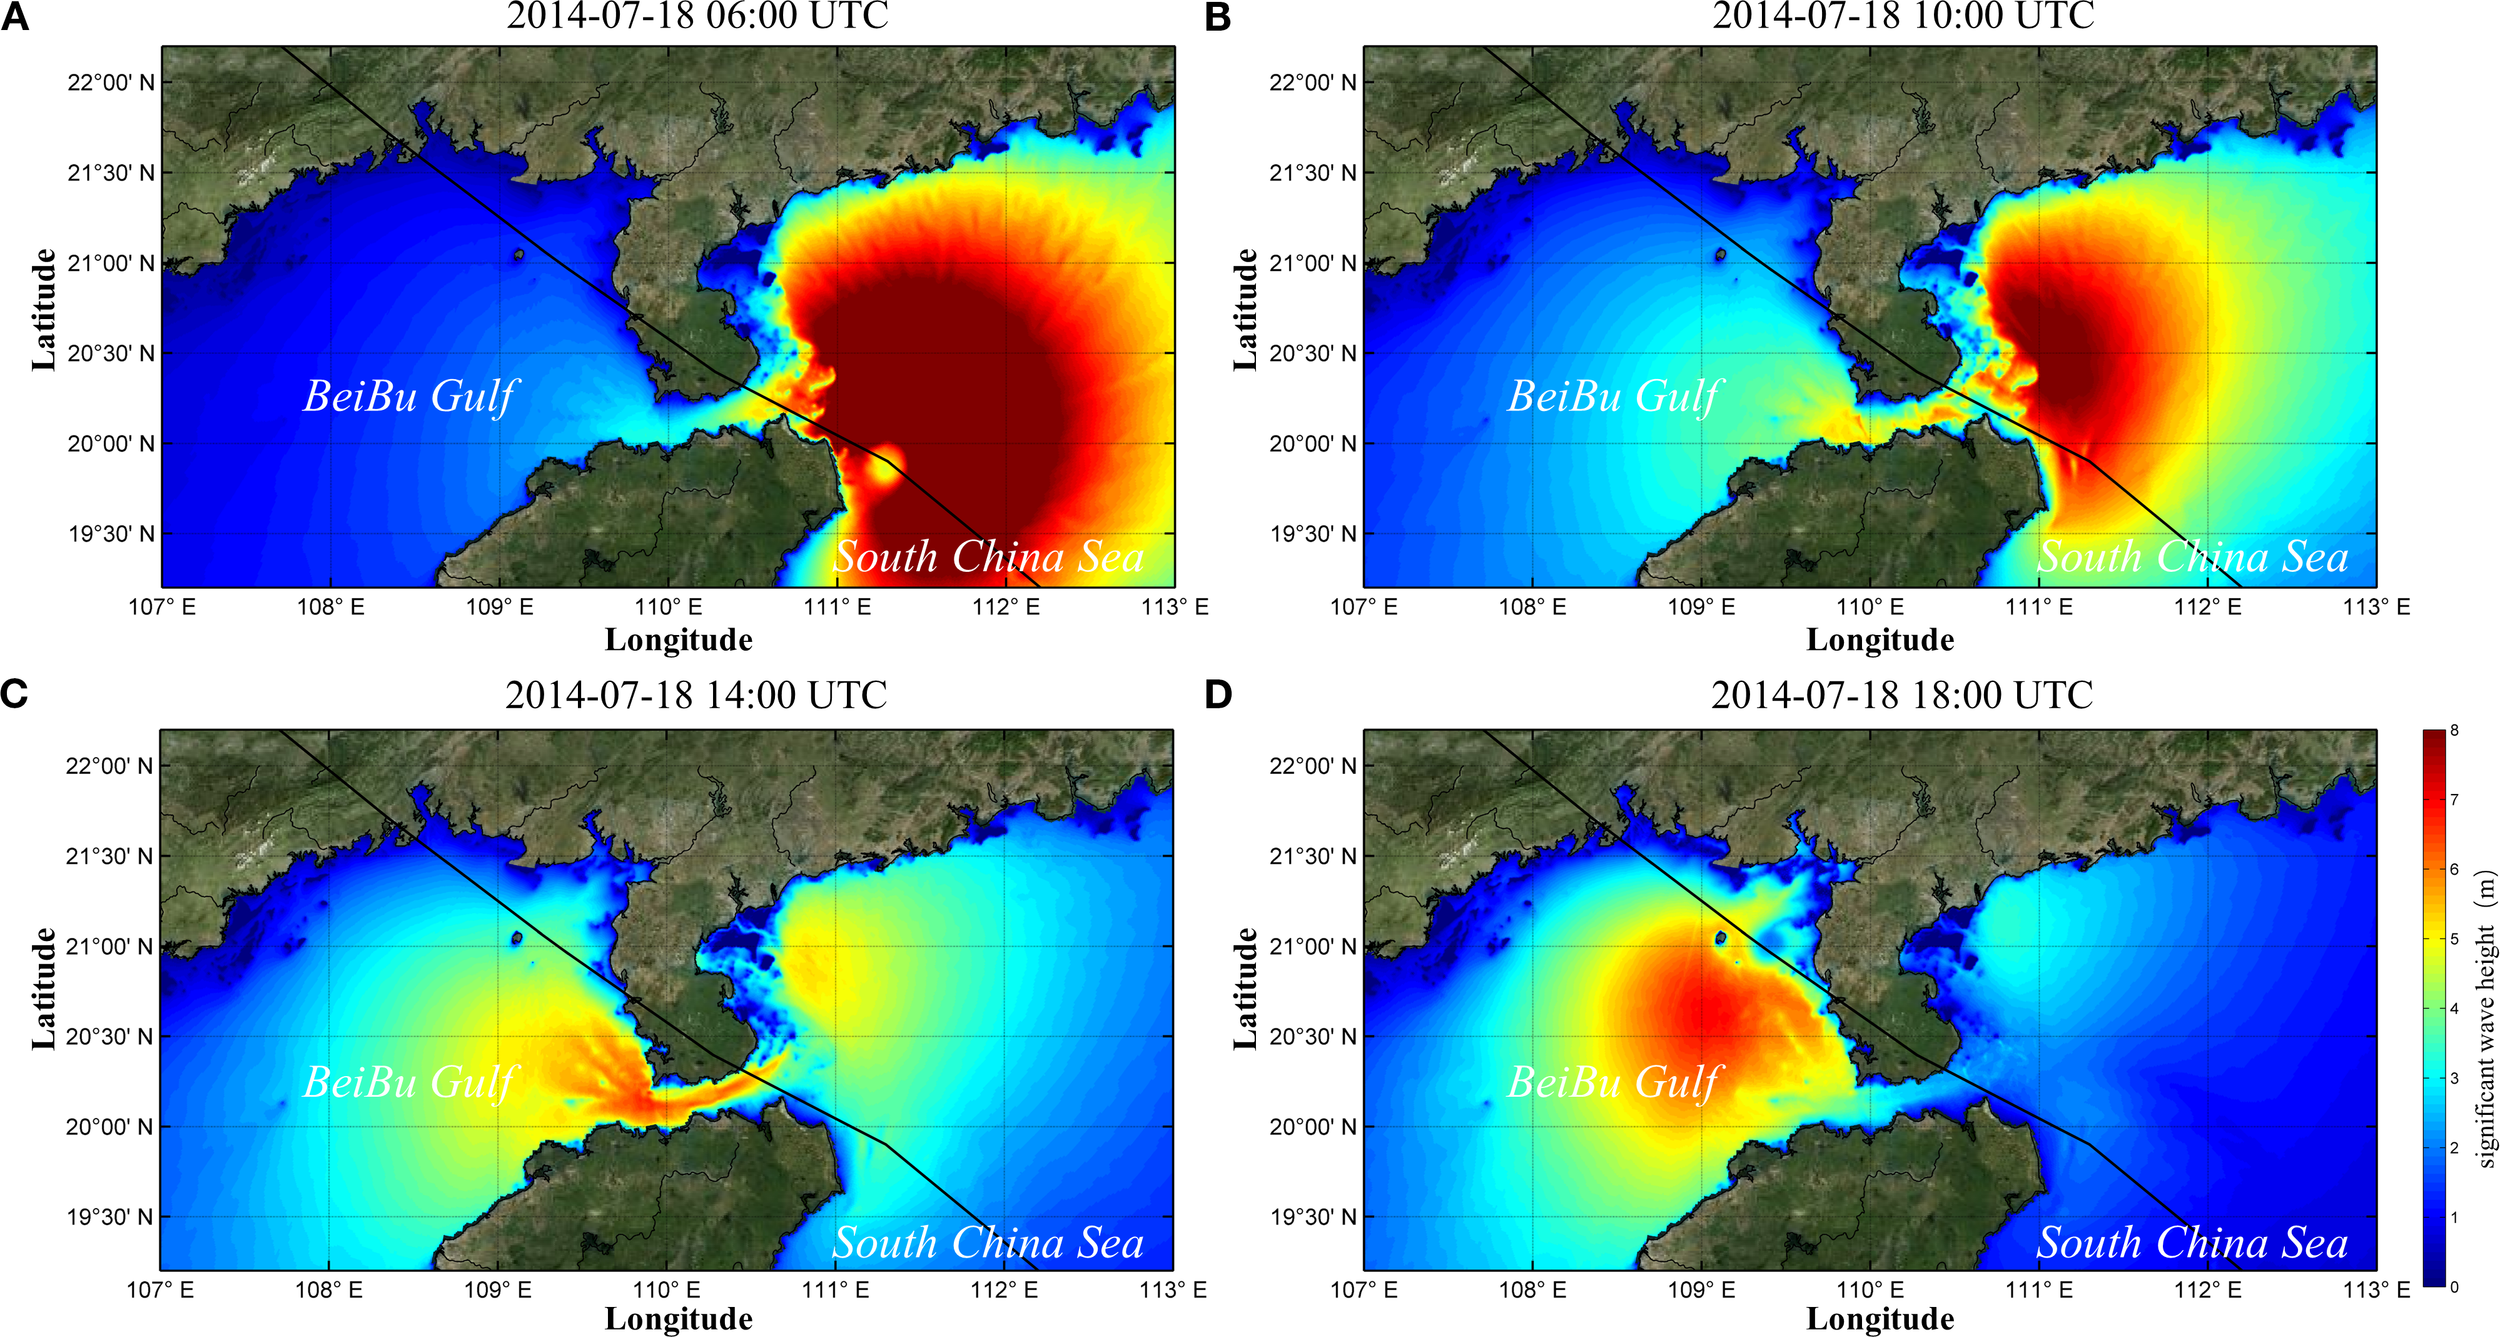
Maps showing wave progression along the northern coast of the South China Sea: (A) 2014-07-18 06:00 UTC, (B) 2014-07-18 10:00 UTC, (C) 2014-07-18 14:00 UTC, (D) 2014-07-18 18:00 UTC.
Figure 10
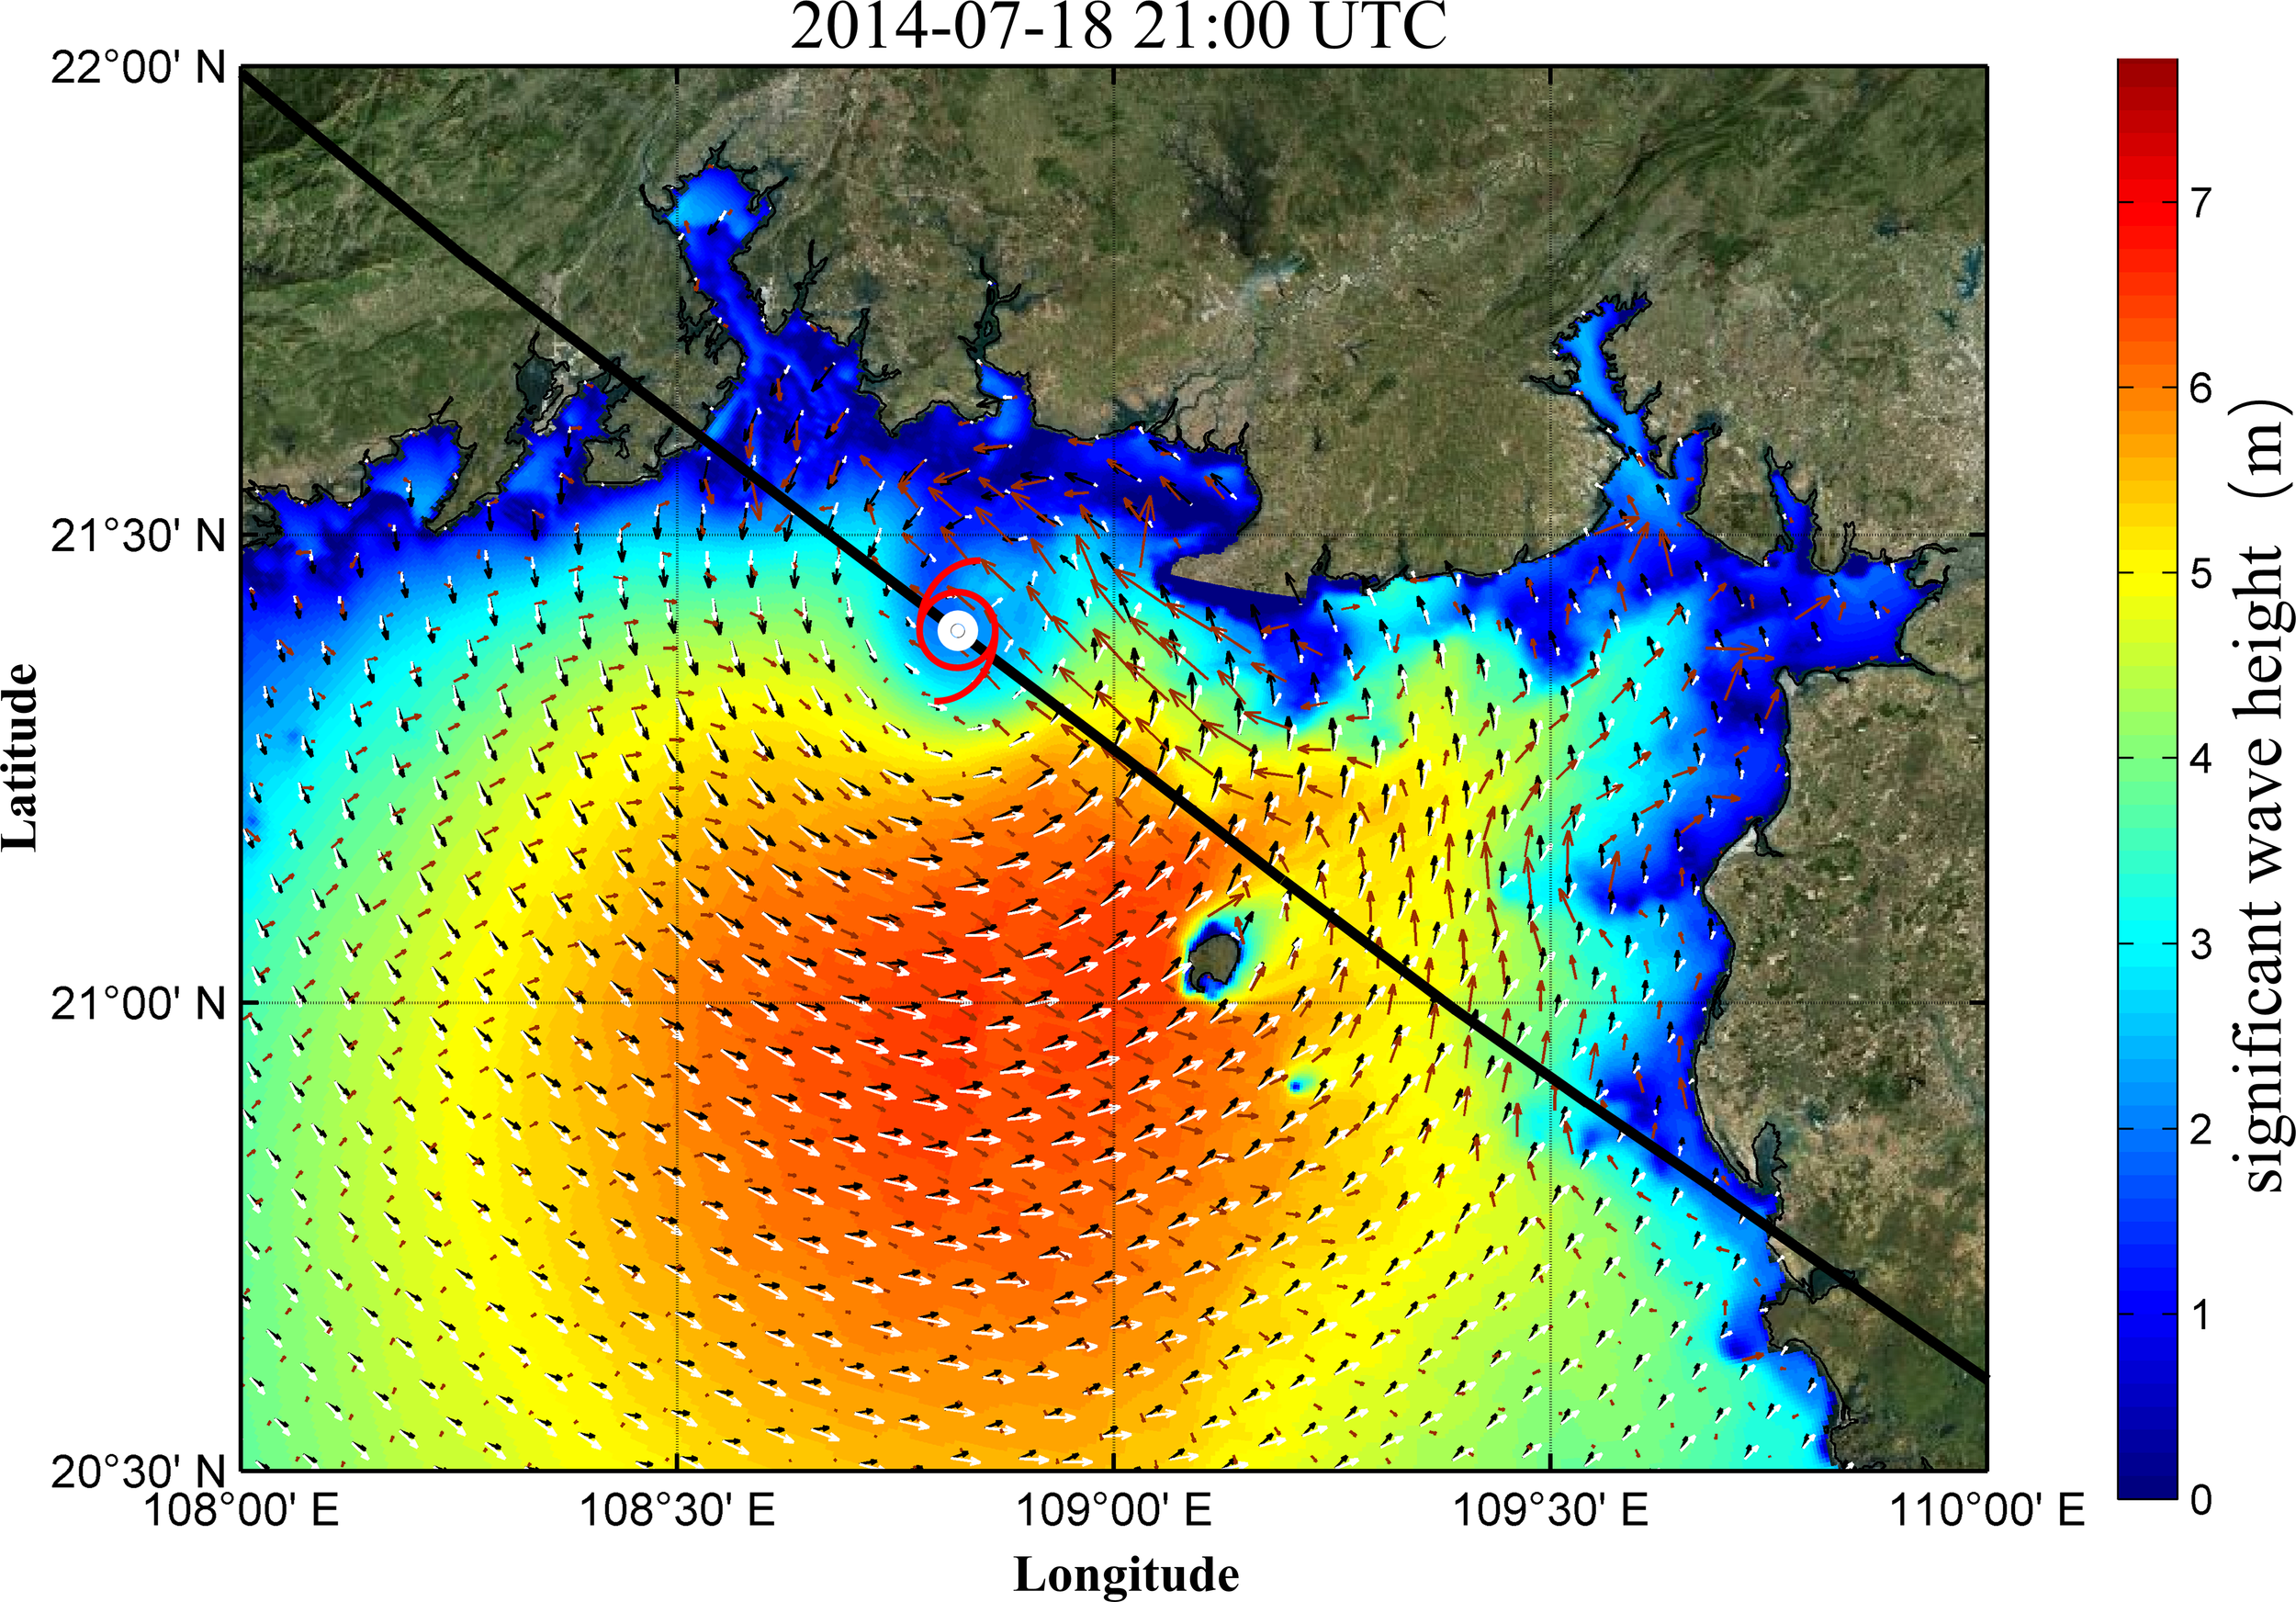
Simulated wind field (black arrows), wave field (brown arrows), and current field (white arrows) after Typhoon Rammasun (2014) entered the BBG.
The spatiotemporal distribution of typhoon waves also suffers the impacts from the interactions of wind action and coastal topography, while its response is different from that of storm surge. Firstly, the lag between wave field and typhoon movement is limited, given the universe distribution of strong waves around the typhoon center. Besides, the modulation from topography results in weak waves in the coastal area, a regime opposite to the storm surge. Thus, it is worth noting how does the combined surge (storm surge + significant wave height) distribute in the bay over the typhoon. Figure 11 illustrates the superimposed water level heights of storm surge plus significant wave height during Typhoon Rammasun, and it is clear that during the typhoon passage, the water level offshore the Beibu Gulf was determined by wave, and the water level in the nearshore was determined by surge.
Figure 11
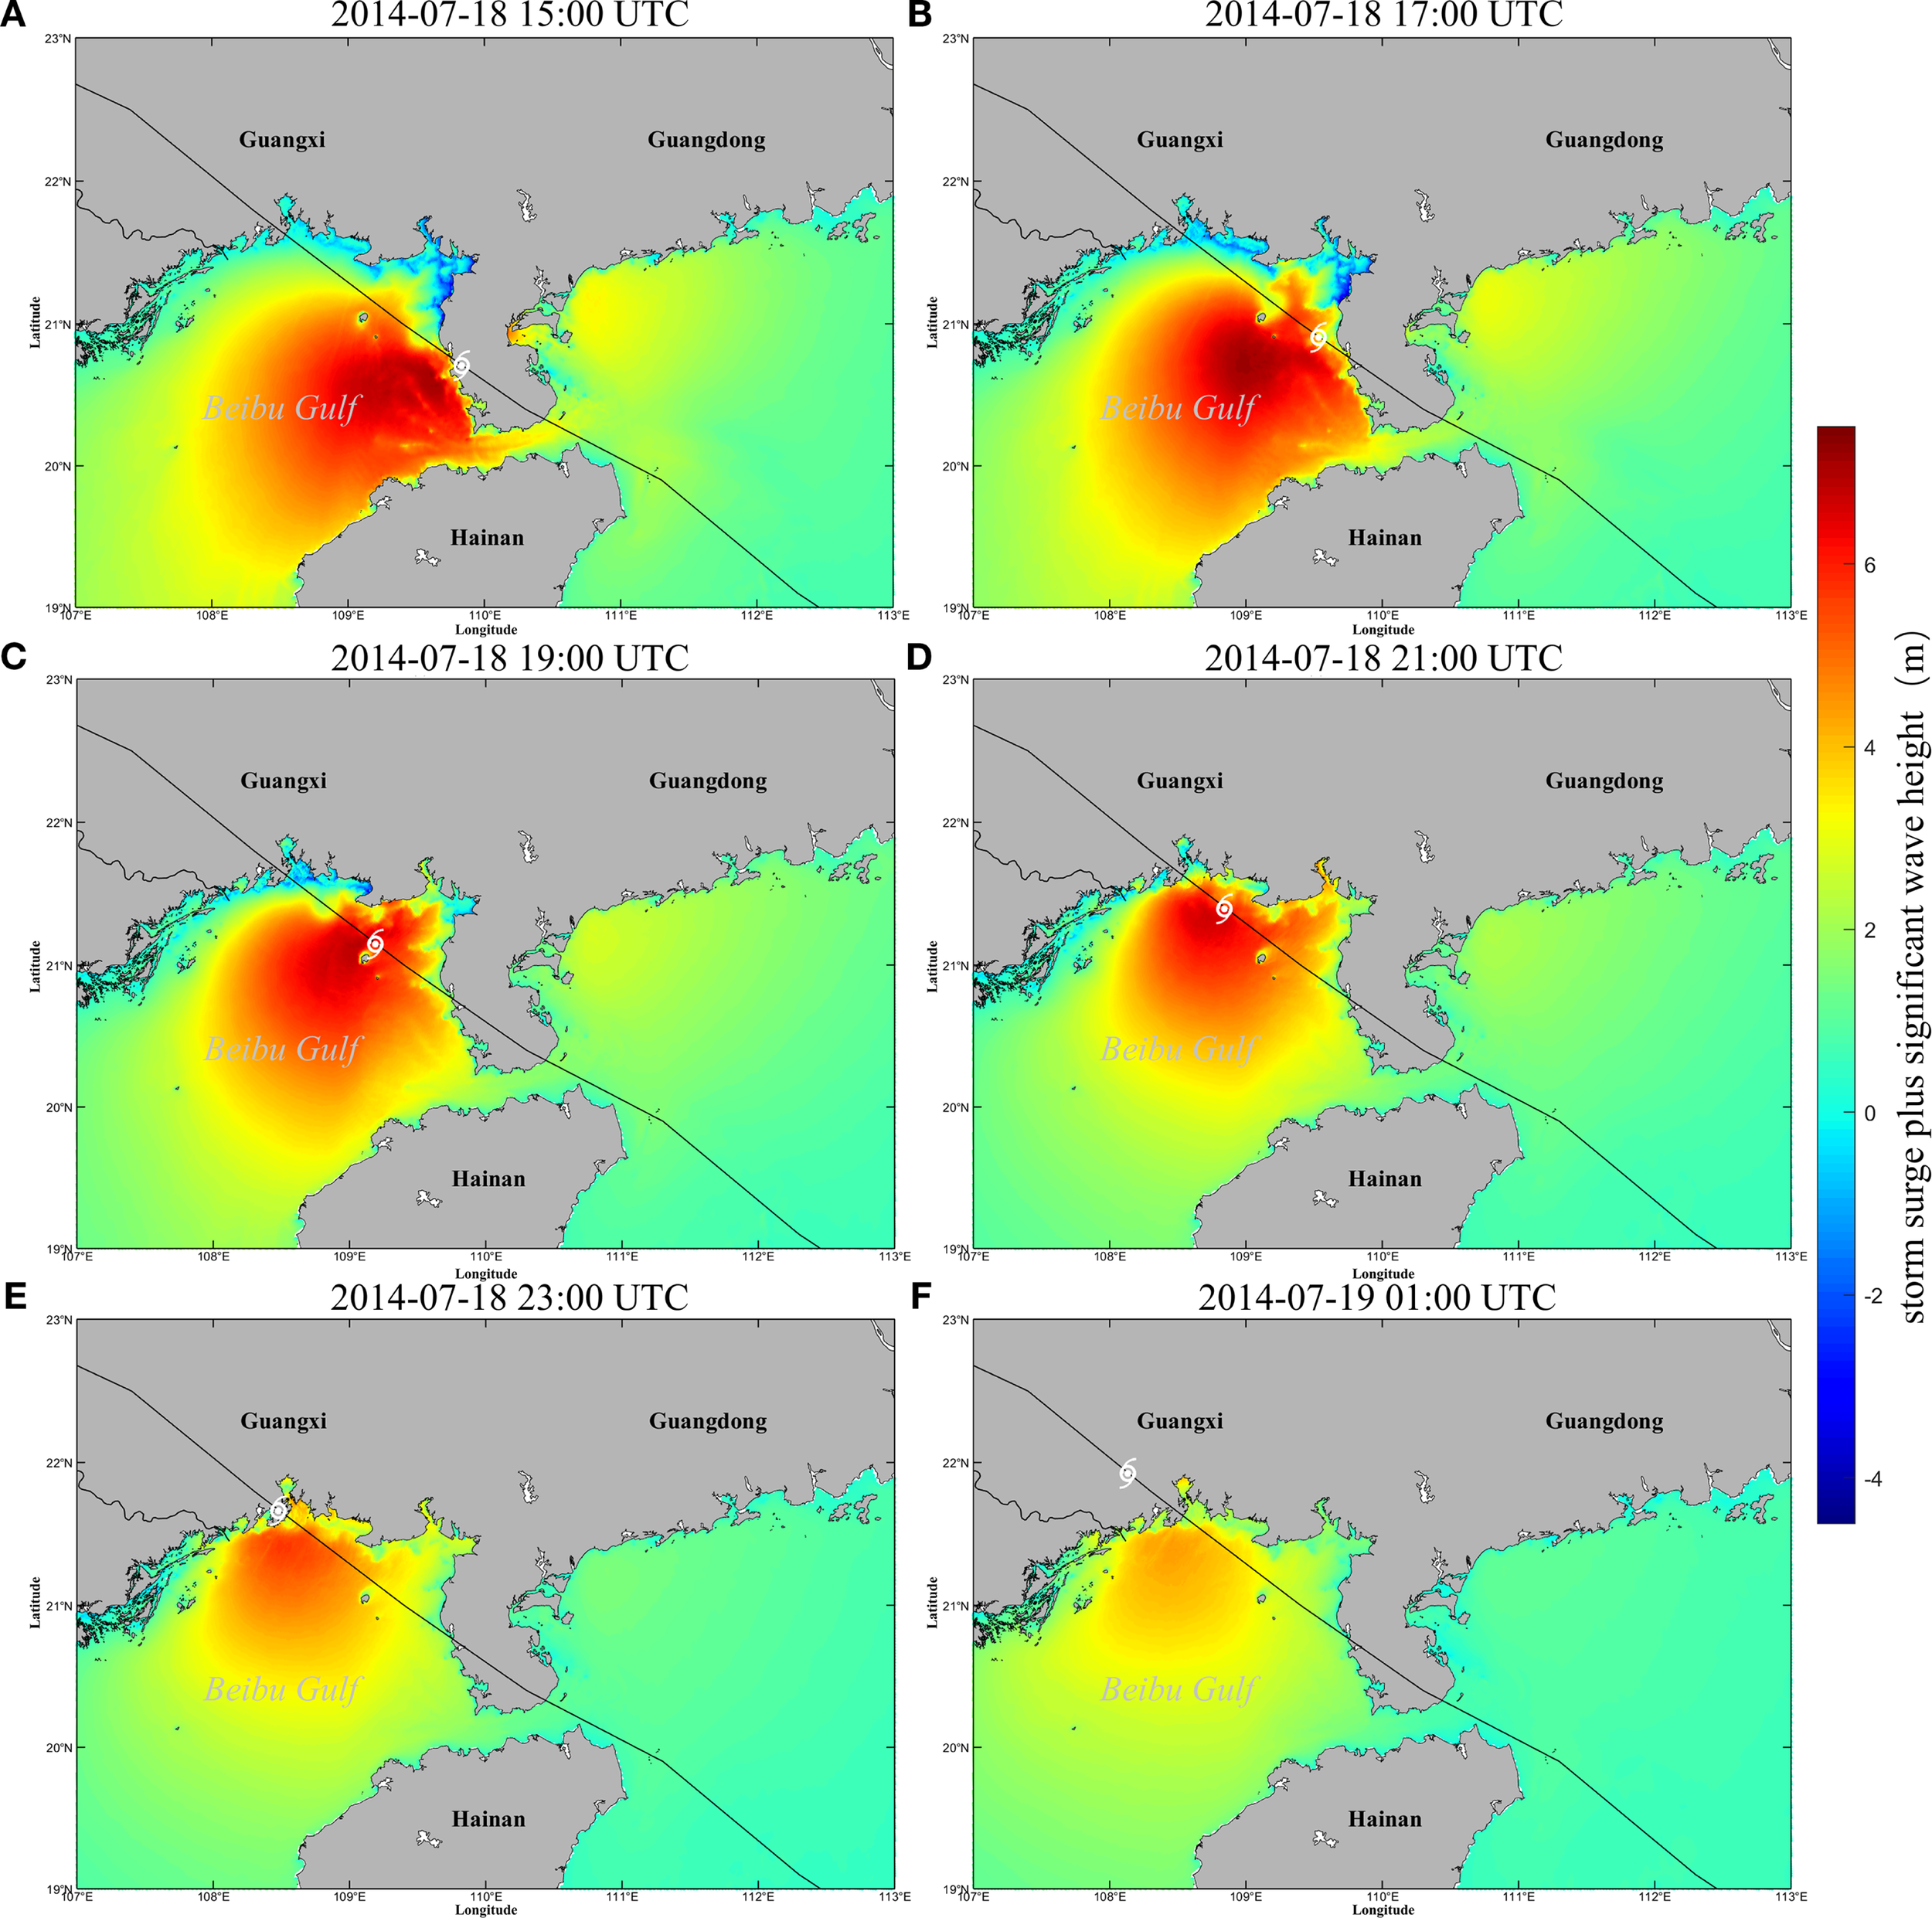
Maps showing storm surge plus significant wave height in Beibu Gulf from July 18 to 19, 2014: (A) 2014-07-18 15:00 UTC, (B) 2014-07-18 17:00 UTC, (C) 2014-07-18 19:00 UTC, (D) 2014-07-18 21:00 UTC, (E) 2014-07-18 23:00 UTC, (F) 2014-07-19 01:00 UTC.
4.3 Responses of storm surge under different typhoon track scenarios
Knowledge on future storm surge and typhoon wave in response to climate change is of significance for the design of coastal defense and construction of engineering like ports and channels. To investigate the potential impacts of typhoon tracks, this study employs a typical typhoon track construction method to re-simulate the typhoon process in the Beibu Bay. Five additional typhoon scenarios (namely T1 to T5 from west to east) have been generated, with the duration and intensity of Rammasun unchanged but the track shifted (Figure 12). The five parallel tracks (T1–T5) were designed based on historical typhoon climatology in the Beibu Gulf to cover critical landfall scenarios from west to east, ensuring representativeness of spatial surge and wave response patterns. The spatial distribution of maximum positive surges, maximum negative surges, and significant wave heights during each typhoon scenario were then analyzed.
Figure 12
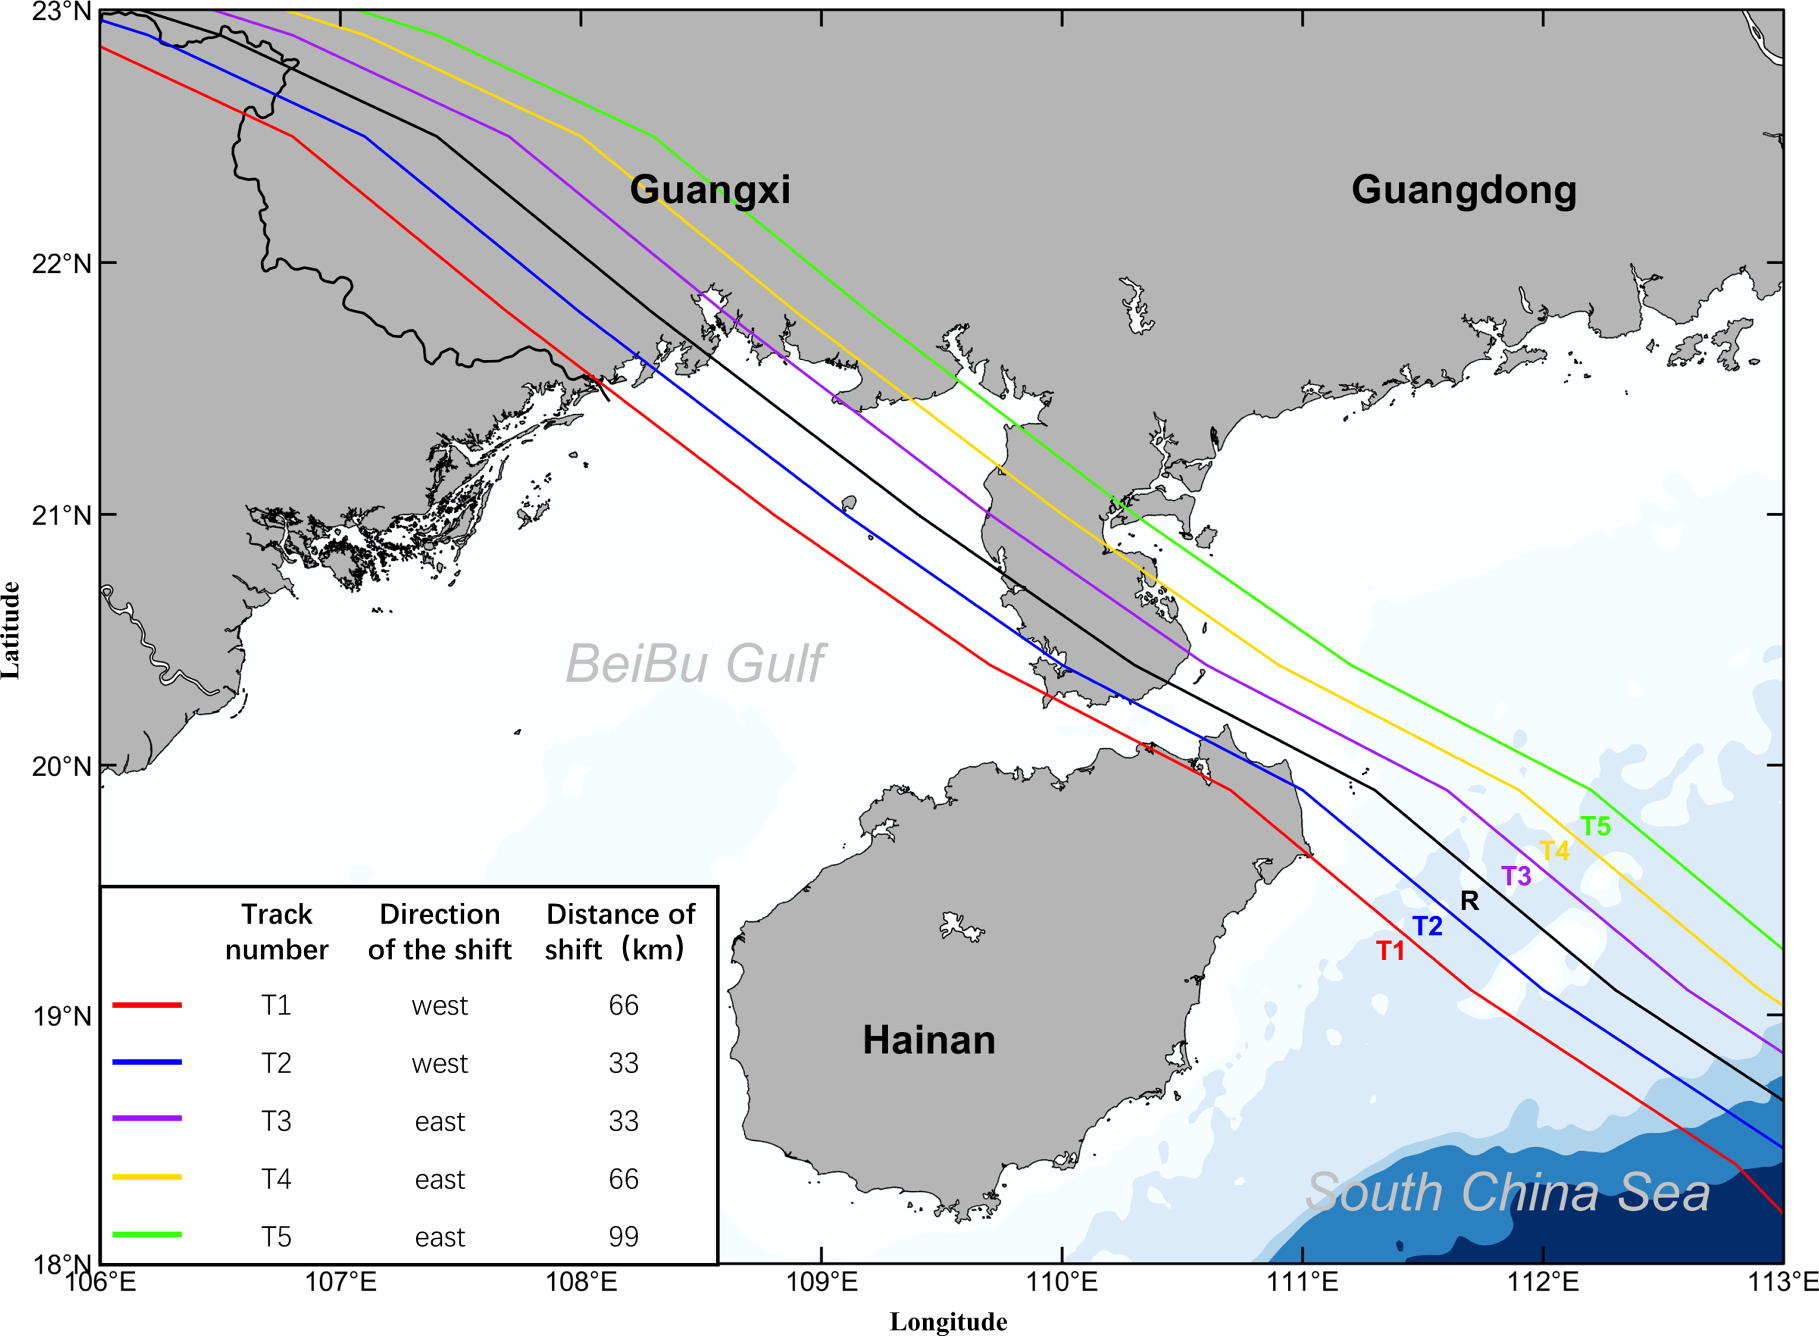
The tracks of Typhoon Rammasun (2014) and its derived typhoon events. The 5 tracks (T1, T2, T3, T4 and T5) constructed from the actual track of Typhoon Rammasun (black”-”).
The positive surges exhibit a clear right-biasd spatial distribution, despite the varying magnitudes of surges related to the five different tracks. Besides, an obvious decrease in the positive surges has been detected as the typhoons passed through the Qiongzhou Strait, and the surge maxima are located in the northeastern waters of Hainan Island, the eastern waters of Leizhou Peninsula, and the coastal ports of the Beibu Gulf. The affected area of positive surges in the Beibu Gulf gradually decreases from offshore to nearshore as typhoon tracks shift from west to east.
The intensity of positive surge along the coast of the Beibu Gulf is closely related to the typhoontrack. As the typhoon moves from west to east, the intensity of positive surge decreases along the western coast and increases along the eastern coast of the Beibu Gulf. Among them, the typhoons of a westward track (scenarios T1 and T2; Figures 13A, B) tended to induce larger positive surges of nearly 2.5 m along the western coast of the Beibu Gulf and surges of 3 m along the northeastern coast of Hainan Island and both sides of the Qiongzhou Strait, and those of an eastward (scenarios T3, T4, and T5; Figures 13D–F) could cause larger surges of 3 m along the eastern coast of the Beibu Gulf. The eastern coast of Leizhou Peninsula, of a special concave-shaped coastal morphology, exhibited an extremely large surge of up to 4.5 m under scenarioT3, but just showed surge of ~ 1 meter under scenario T5.
Figure 13
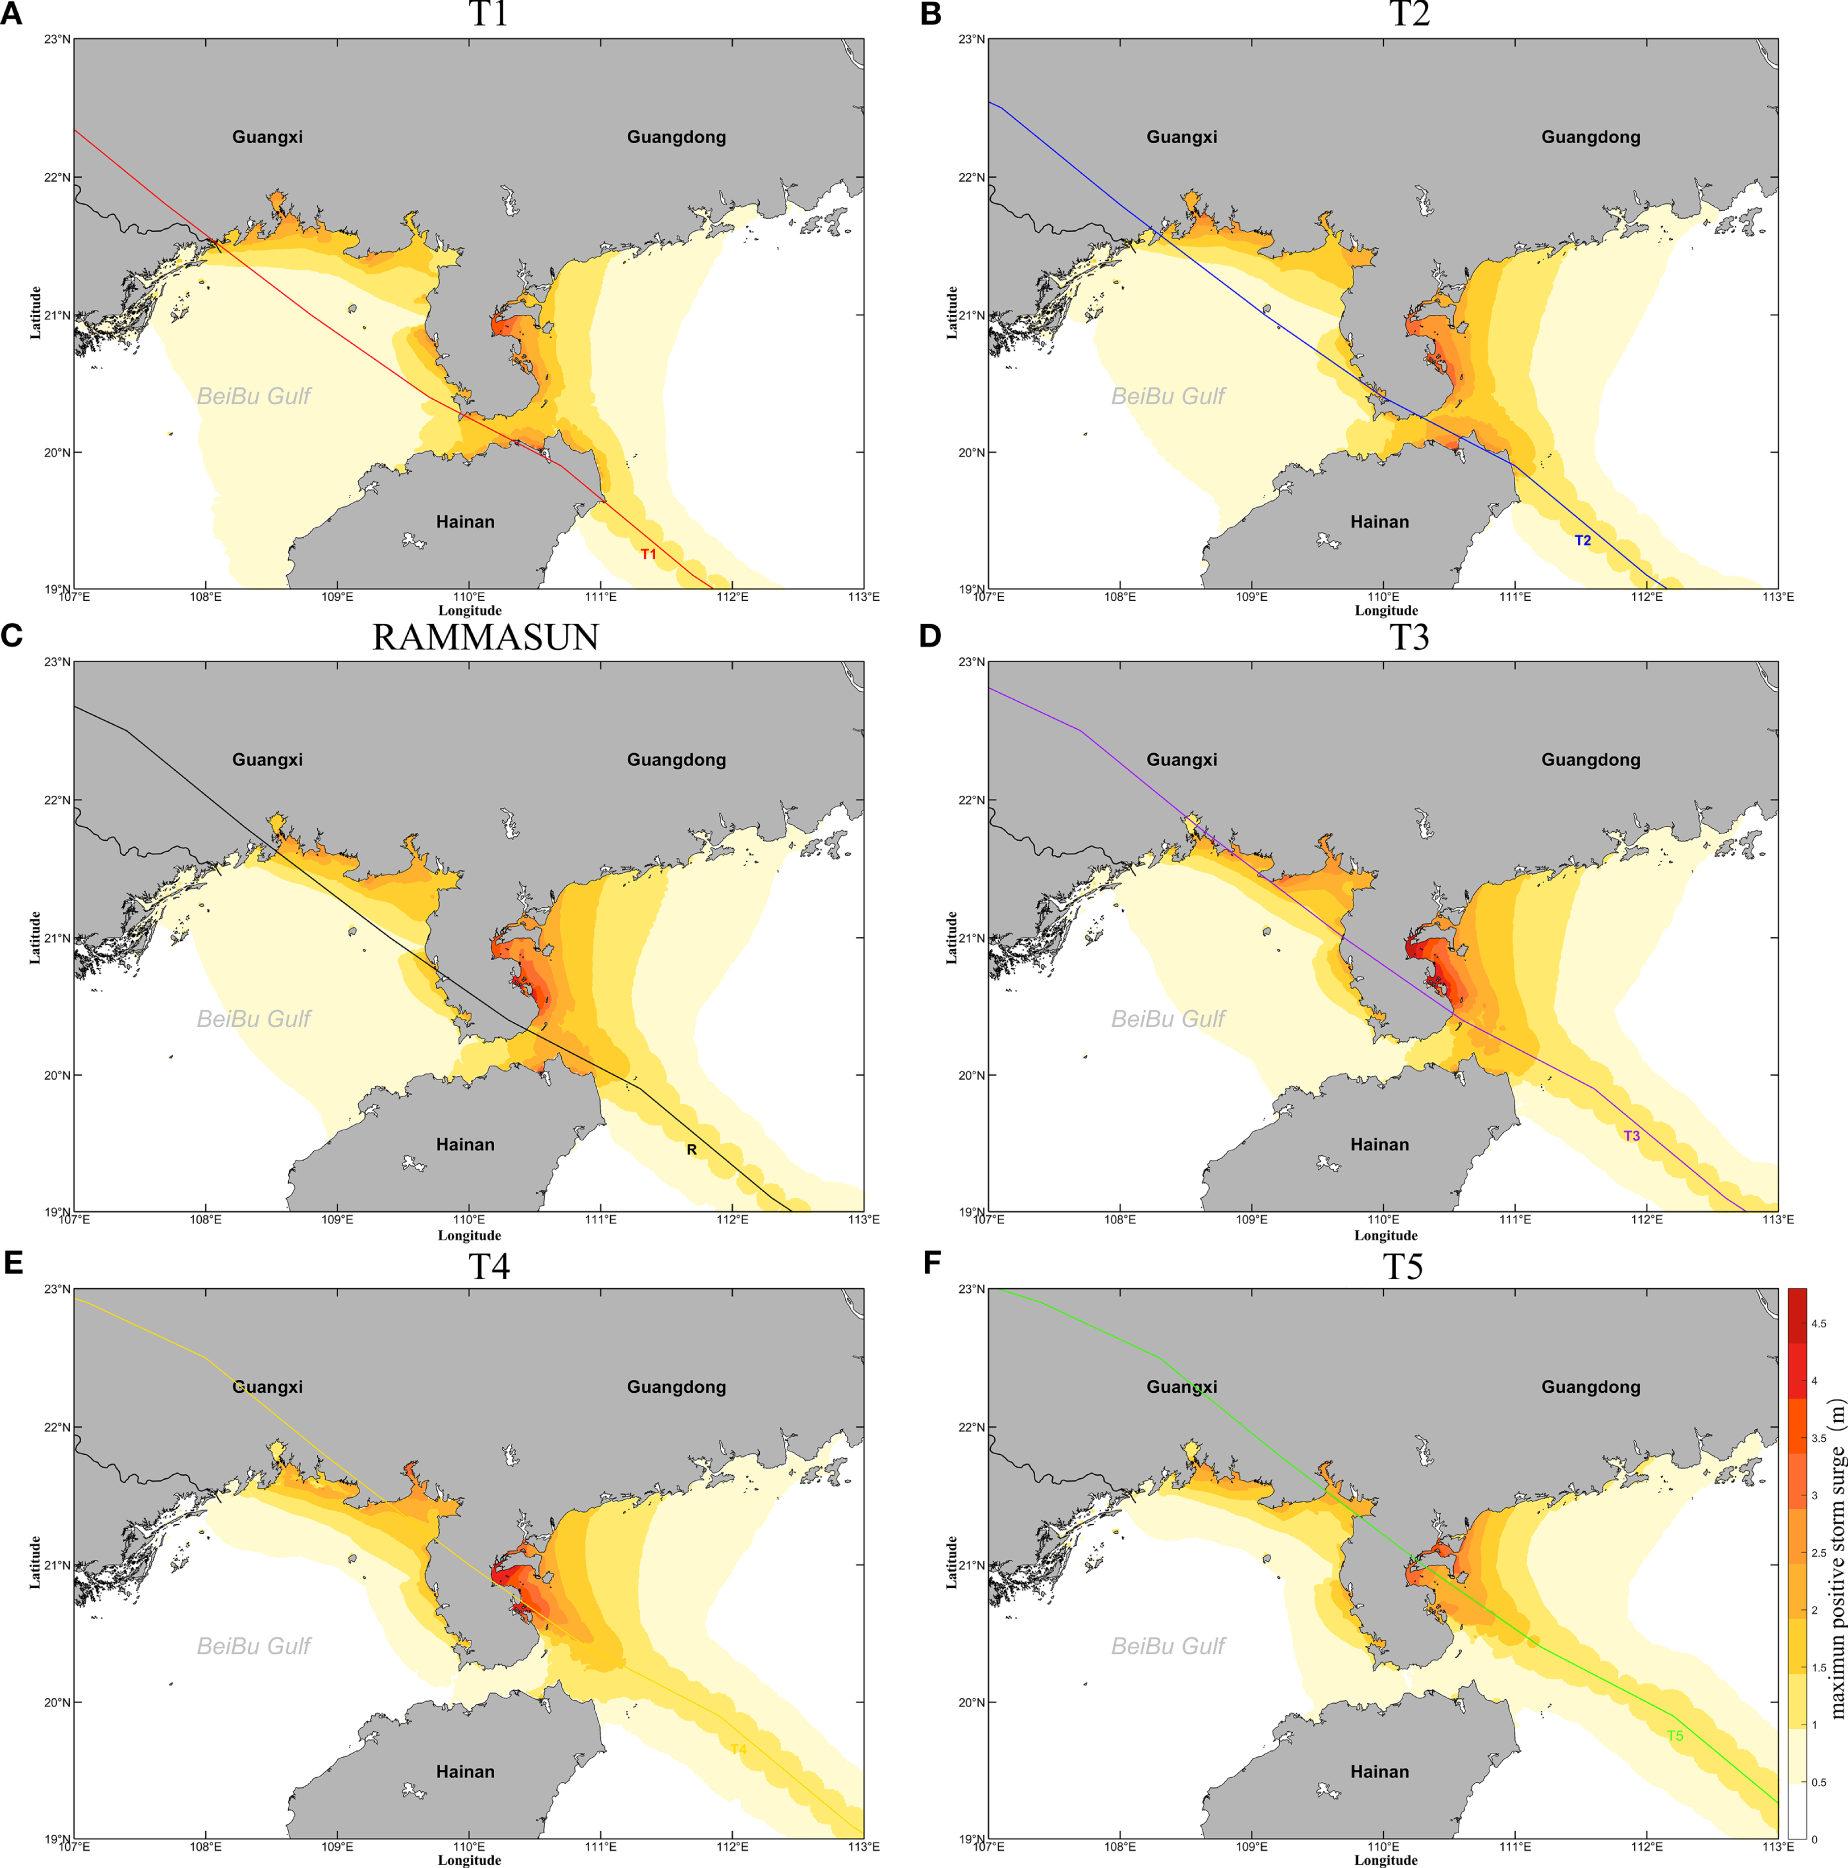
Maps showing spatial distribution of maximum positive surges in the northern South China Sea during typhoons with different tracks. (A) T1, (B) T2, (C) RAMMASUN, (D) T3, (E) T4, (F) T5.
Again, the response of storm surge to typhoon tracks is spatially different, similar to our findings based on the real case of Rammasun (see Section 4.1). These diverse response modes could be explained by the relative position between the typhoon center and a specific location. Since onshore winds, which locate at the right-hand side of the typhoon center, favors the development of the storm surge, Larger positive surges in the western coast of the Beibu Gulf during the impacts of typhoons T1, T2 and R (Figures 14A–C), and in the eastern coast during the impacts of typhoons T3, T4 and T5 (Figures 14D–F), which is due to the fact that this region is immediately to the right of the typhoons track, the influx of seawater into the Gulf under the action of the onshore winds results in a strong rise of the water level in this region, at the same time the intensity of its positive surges varies slightly due to the differences in the position of the typhoon wind circles of the different tracks of the typhoon in which this region is situated. This process is further modulated by the coastal topography of the bay. The elevation of nearshore water level caused by storm surge is a key triggering factor for inland flood disasters during extreme typhoon, often resulting in the flooding of important coastal infrastructure such as houses and factories, as well as land salinization. Therefore, in the future coastal protection of the Beibu Gulf, it should be noted that the storm surge risk level in the typhoon landfall area is not necessarily the highest, and the small bay to the east of the typhoon landfall point is often likely to be extremely destructive due to its complex topographic features.
Figure 14
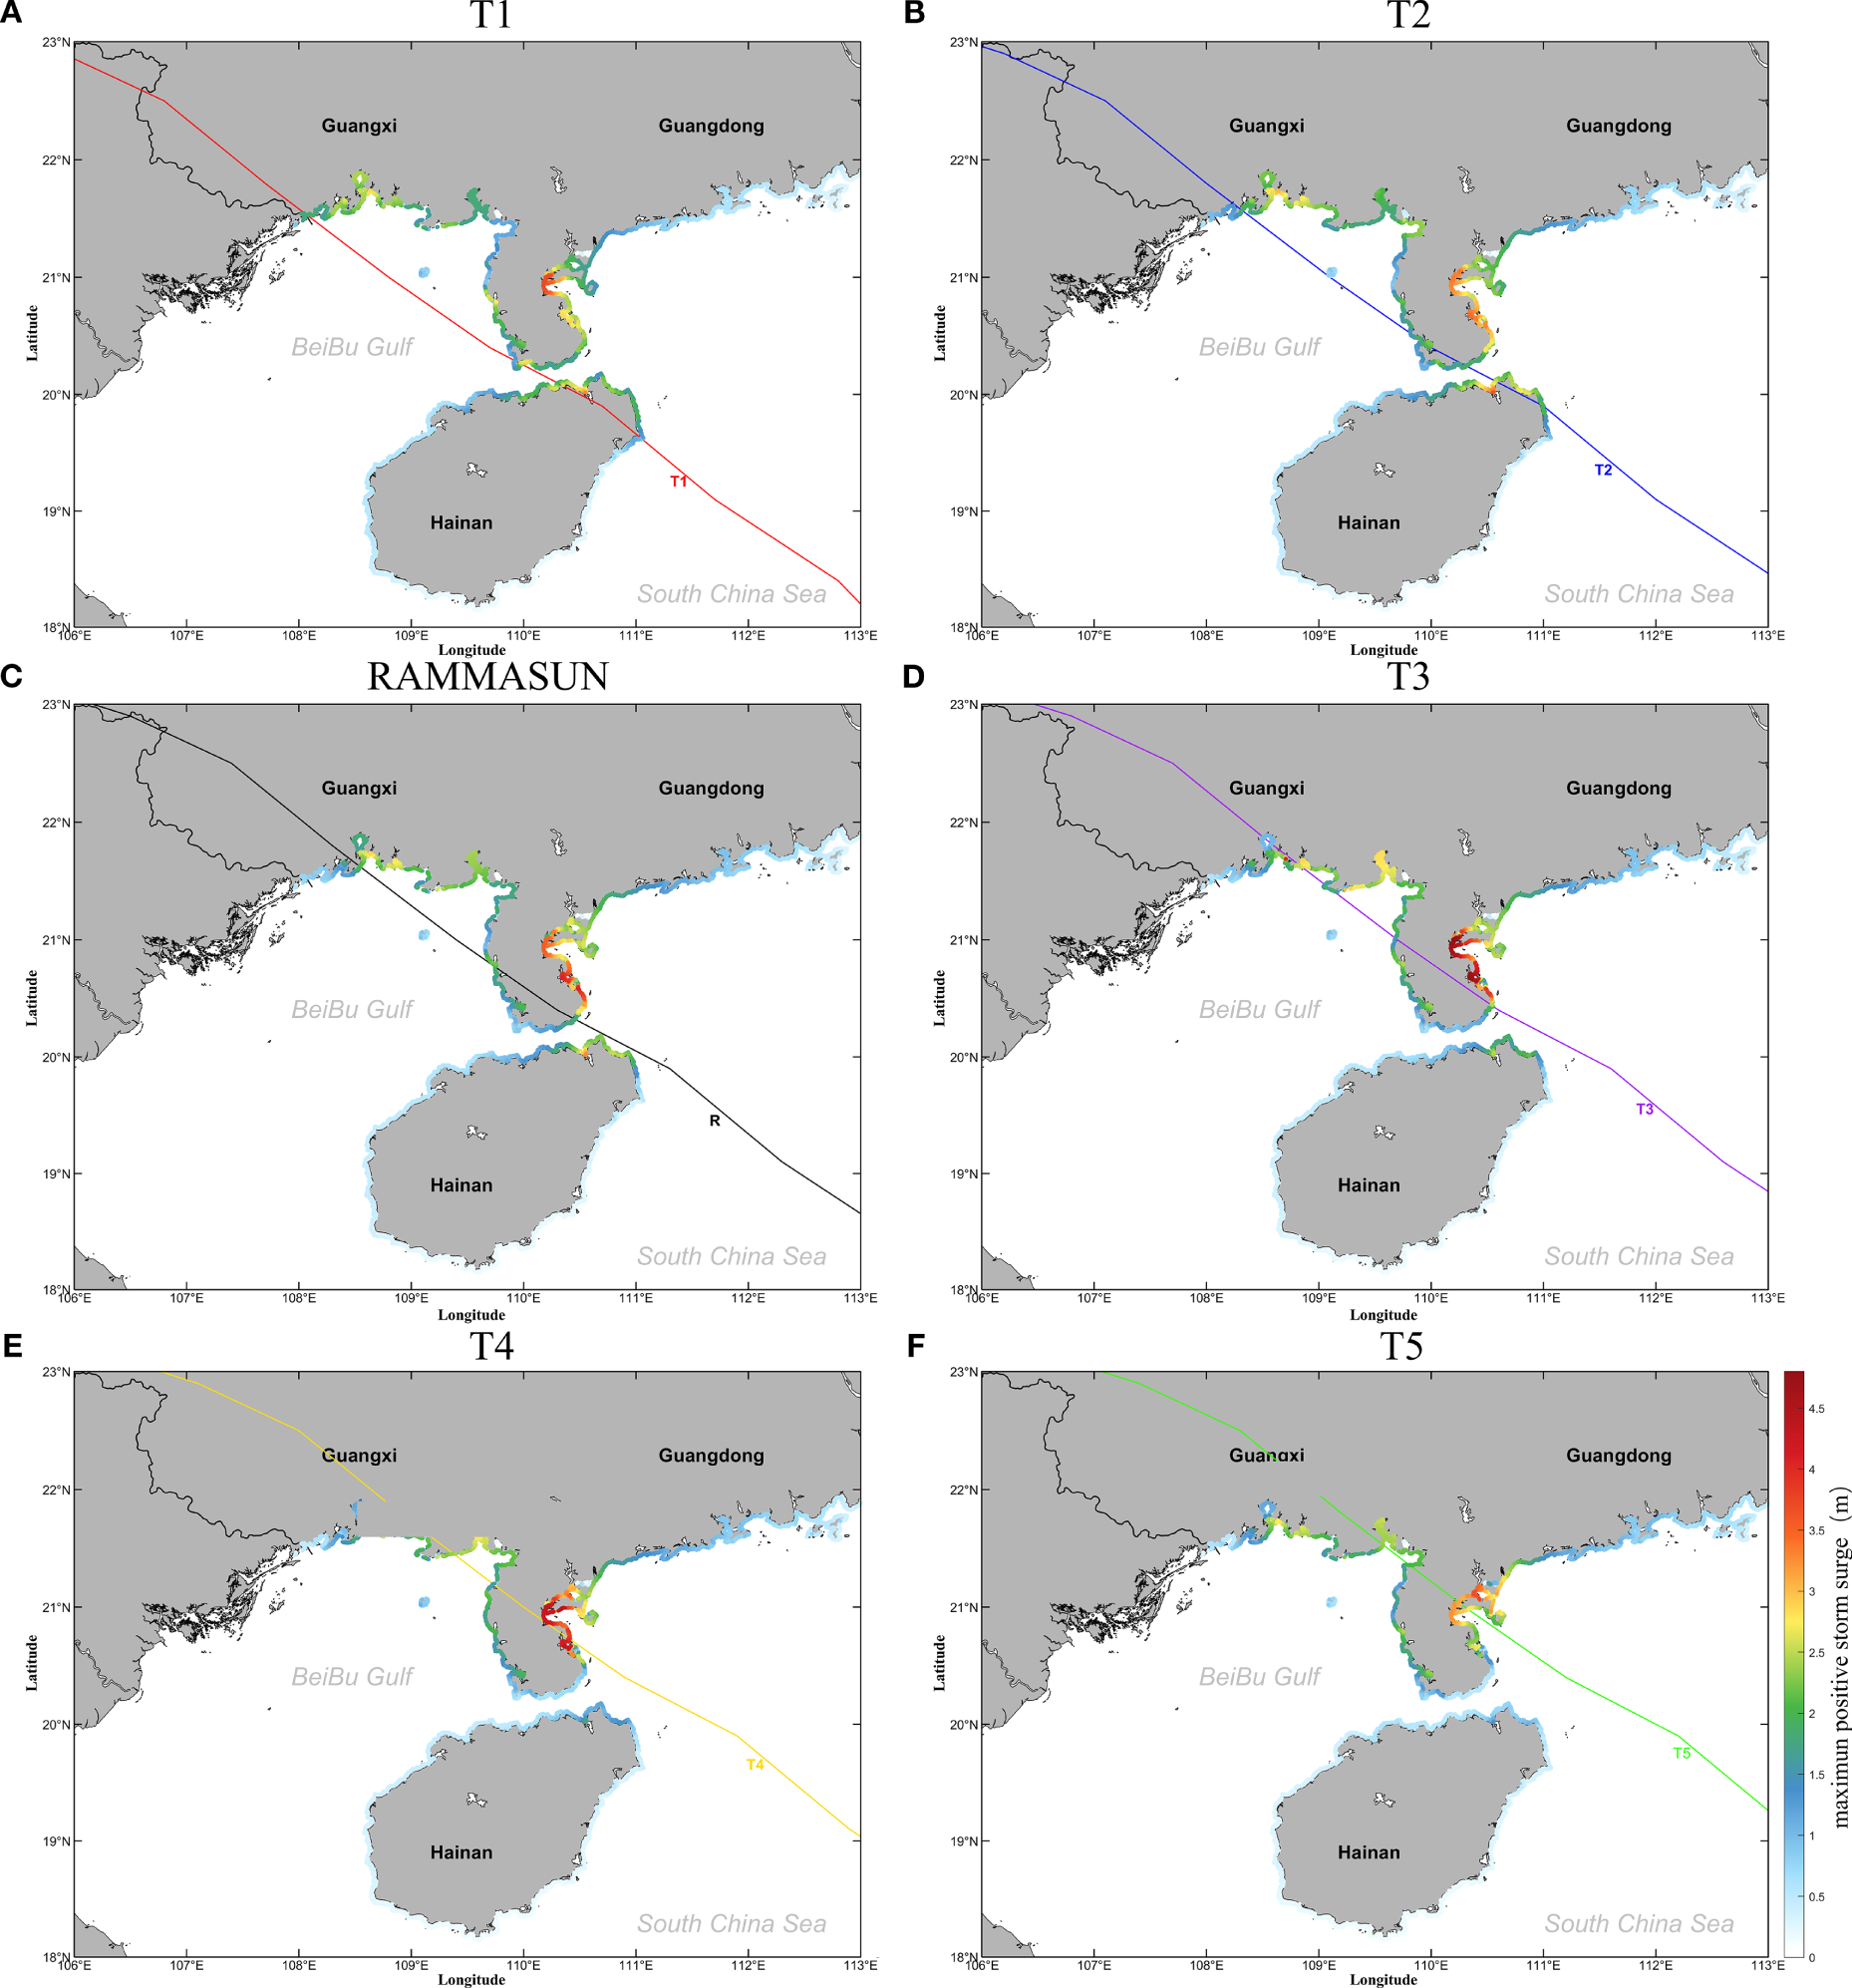
Maps showing spatial distribution of maximum positive surges along the northern coast of the South China Sea during typhoons with different tracks. (A) T1, (B) T2, (C) RAMMASUN, (D) T3, (E) T4, (F) T5.
During extreme typhoons, the offshore wind effect causes a rapid drop in water level in nearshore areas, leading to extensive exposure of beaches and other phenomena. This has a certain impact on coastal production activities and may result in consequences such as the grounding of nearshore vessels and difficulties in water intake for important units like coastal power plants. Figure 15 presents the calculated results of the maximum value of negative surges caused by typhoons with different tracks in the northern part of the South China Sea. During the typhoon passage, the negative surges in the offshore areas outside the Beibu Gulf is relatively small, with most regions experiencing negative surges of less than 1 meter. The negative surges within the Beibu Gulf are mainly concentrated in coastal areas, especially in the nearshore areas on the northeast side. This is related to the orientation of the coastline in this region relative to the typhoon track.
Figure 15

Maps showing spatial distribution of maximum negative surges in the northern South China Sea during typhoons with different tracks. (A) T1, (B) T2, (C) RAMMASUN, (D) T3, (E) T4, (F) T5.
The maximum value of negative surges caused by typhoons in the northern coastal areas of the South China Sea with different tracks is shown in Figure 16. Overall, typhoons caused serious negative surges along the coast of the Beibu Gulf.In comparison with positive surges, the distribution characteristics of negative surges along the coast of the Beibu Gulf do not exhibit clear patterns relative to the typhoon track. The negative surges are greatest along the northeastern coast of the Beibu Gulf, while it is smaller along the western coast. Typhoon T2 was the most severe typhoon causing negative surges along the coast of the Beibu Gulf. During its passage, it generally resulted in negative surges of over -1 meter along the Beibu Gulf coast, with negative surges reaching up to approximately -5 meters along the northeastern coast.
Figure 16
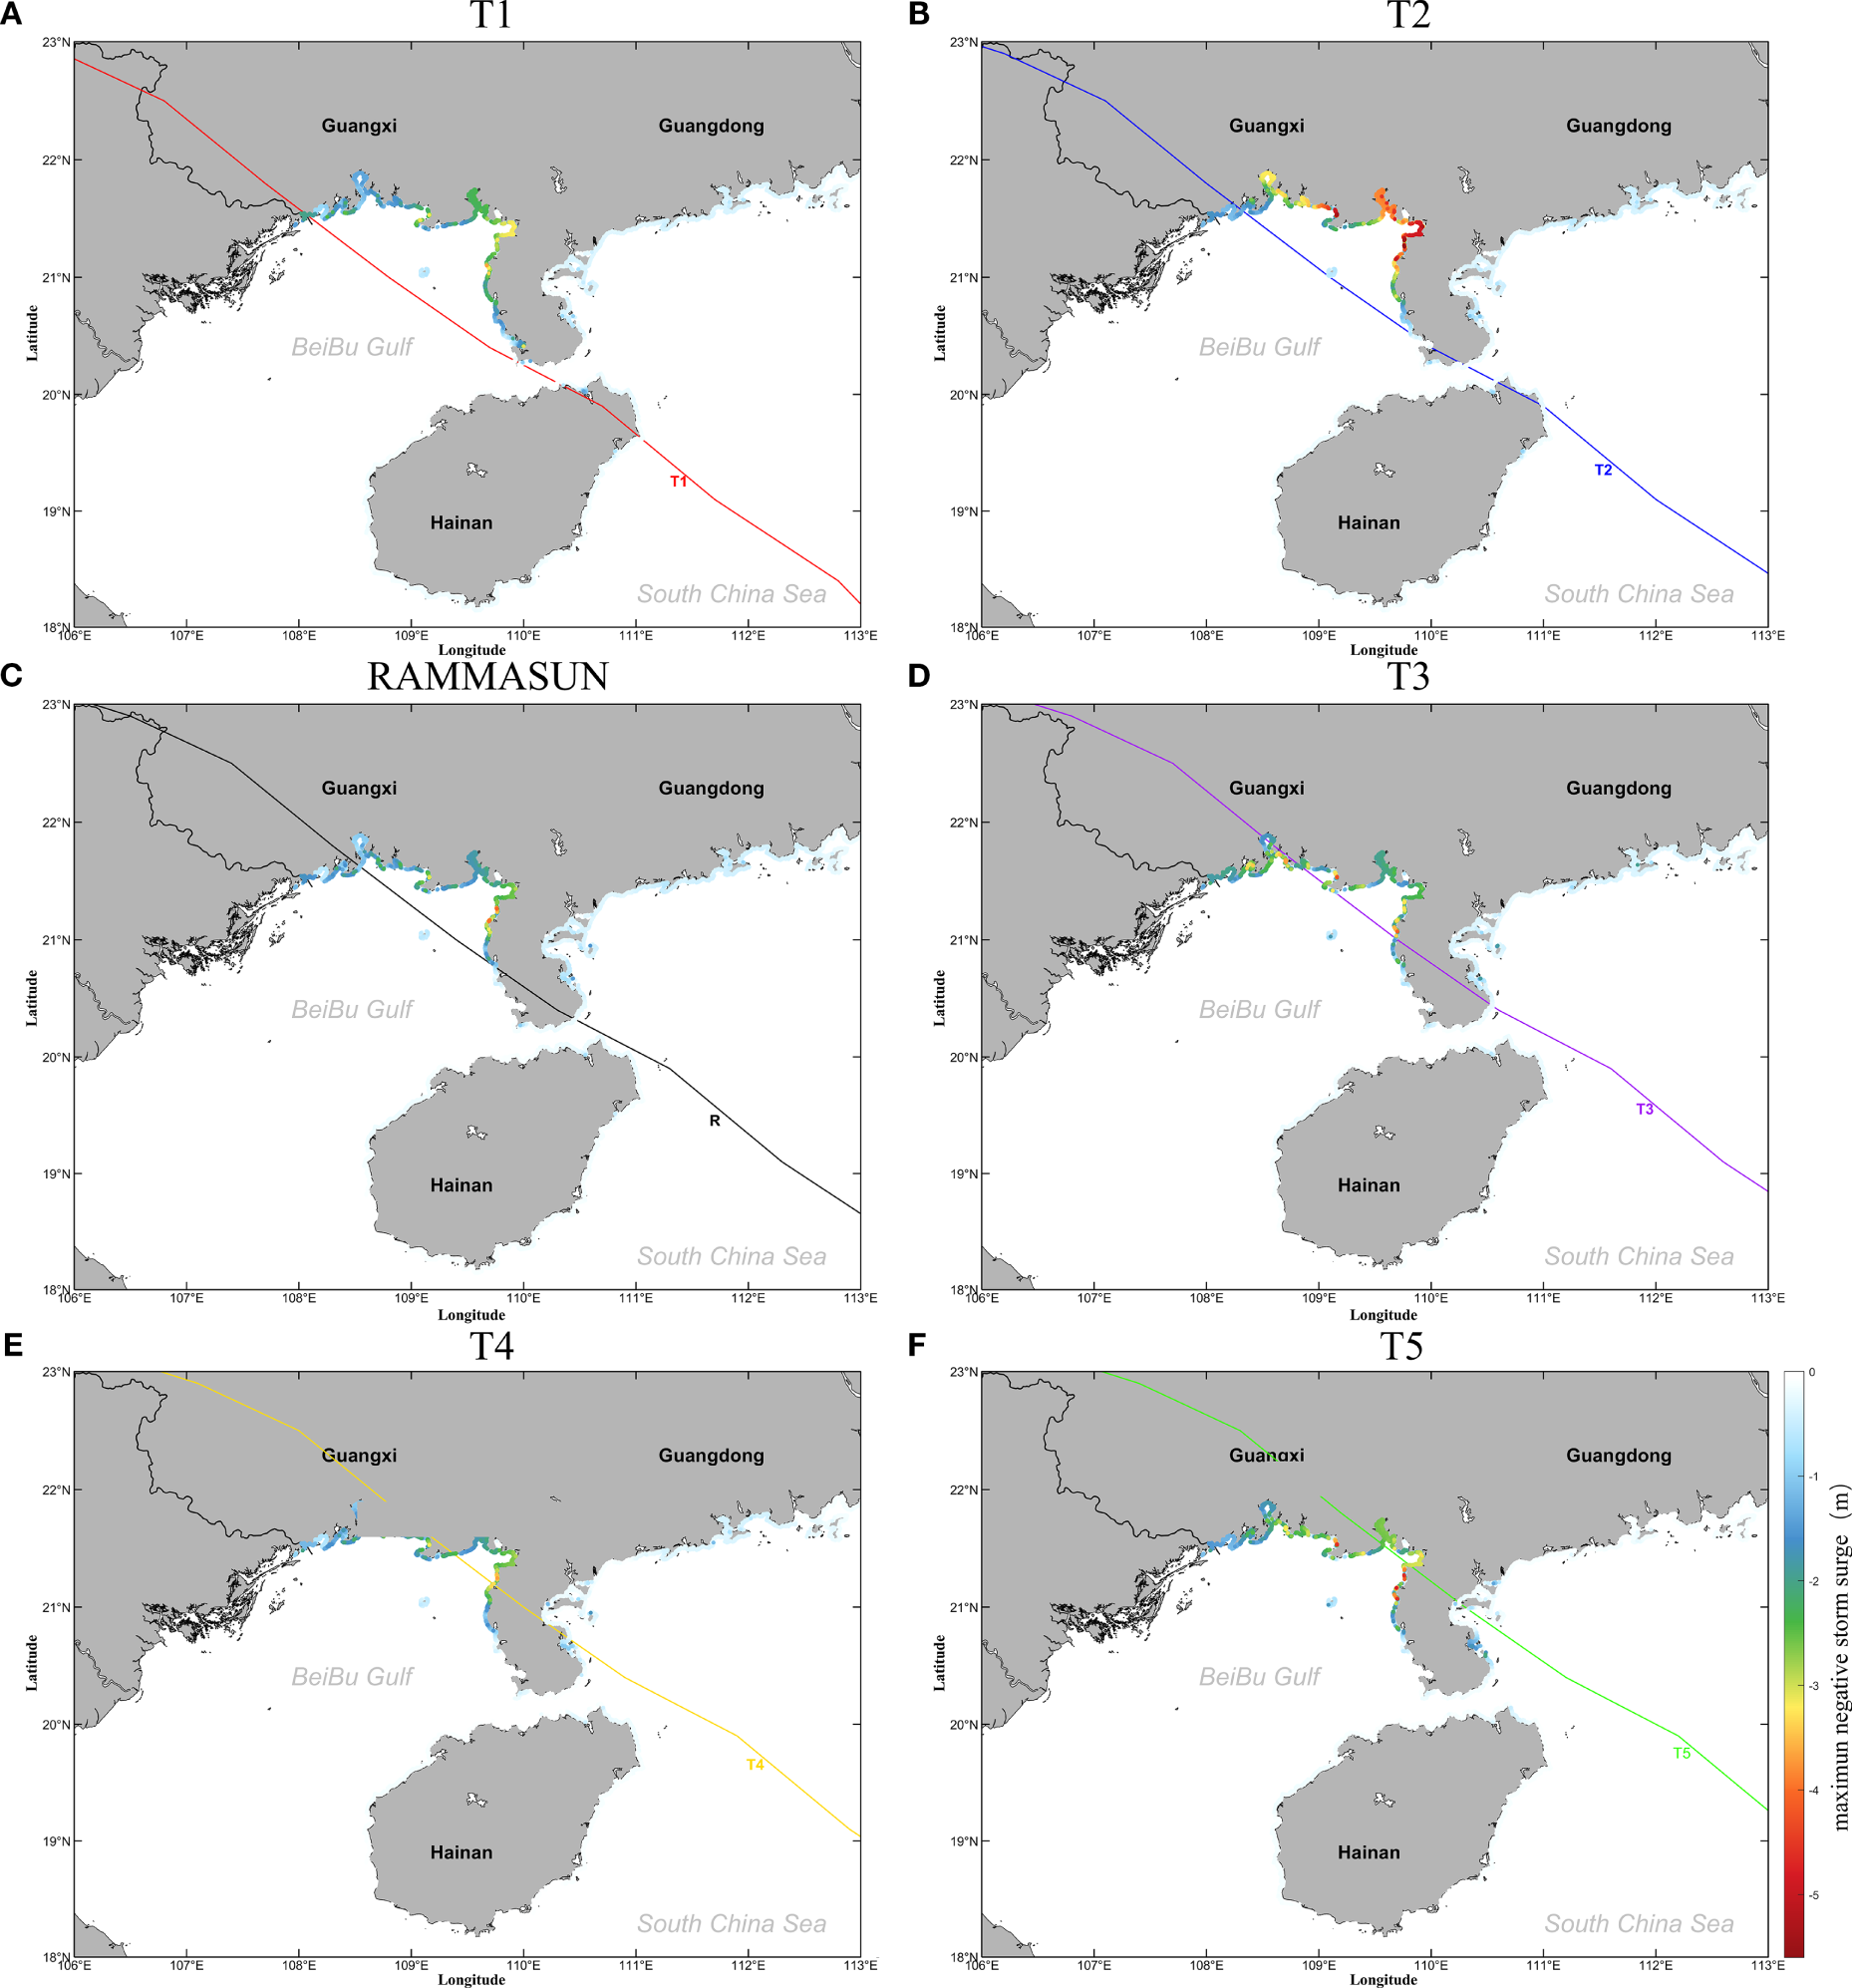
Maps showing spatial distribution of maximum negative surges along the northern coast of the South China Sea during typhoons with different tracks. (A) T1, (B) T2, (C) RAMMASUN, (D) T3, (E) T4, (F) T5.
The impacts of typhoon wave on marine and coastal engineering cannot be ignored. The combination of storm surge and higher wave from typhoon can severely exacerbate the risk of coastal flooding. The Study finds significant increase in global typhoon-induced wave height extremes in last 44 years, understanding the distribution of extreme typhoon wave in the Beibu Gulf and its nearshore areas is crucial. During the typhoon passage, strong waves are mainly concentrated around the typhoon track. As the typhoons passed through the Qiongzhou Strait, the significant wave heights experienced a sharp decrease and a transformation from being right-biased distribution to left-biased distribution. Specifically, the maximum significant wave heights gradually decrease as the typhoon track shifts eastward.
Along with the propagation towards the nearshore areas, the waves undergo attenuation due to geographical features such as topography, water depth, and coastline morphology. The eastern coast of Hainan Island and both sides of the Qiongzhou Strait are frequent areas of strong wave, and the nearshore significant wave heights is closely related to the typhoon track. Typhoons T1 and T2, crossing diagonally through the interior of the Qiongzhou Strait, caused the maximum significant wave heights in that region, reaching close to 9m. As the typhoon track shifted eastward, the maximum significant wave heights gradually decreased to around 5m under the influence of Typhoon T5. Response of the typhoon wave to typhoon tracks is similar to that of storm surge, as was attenuation is inversely proportional to water depth. Along the coasts of the Beibu Gulf, the wave heights within the ports are larger, with maximum value concentrated at the port apex. On the western side, the maximum significant wave heights at the apex of Qinzhou Port reaches around 4m under the influence of Typhoon T1, while on the eastern side, the maximum significant wave heights at the apex of Tieshan Port reaches around 3.5m under the influence of Typhoon T4. Additionally, due to its location surrounded by the sea on all sides and the relatively greater nearshore water depth, along the coast of Weizhou Island, the maximum significant wave heights consistently remain around 4 m under the influence of typhoons with various tracks (Figures 17, 18).
Figure 17
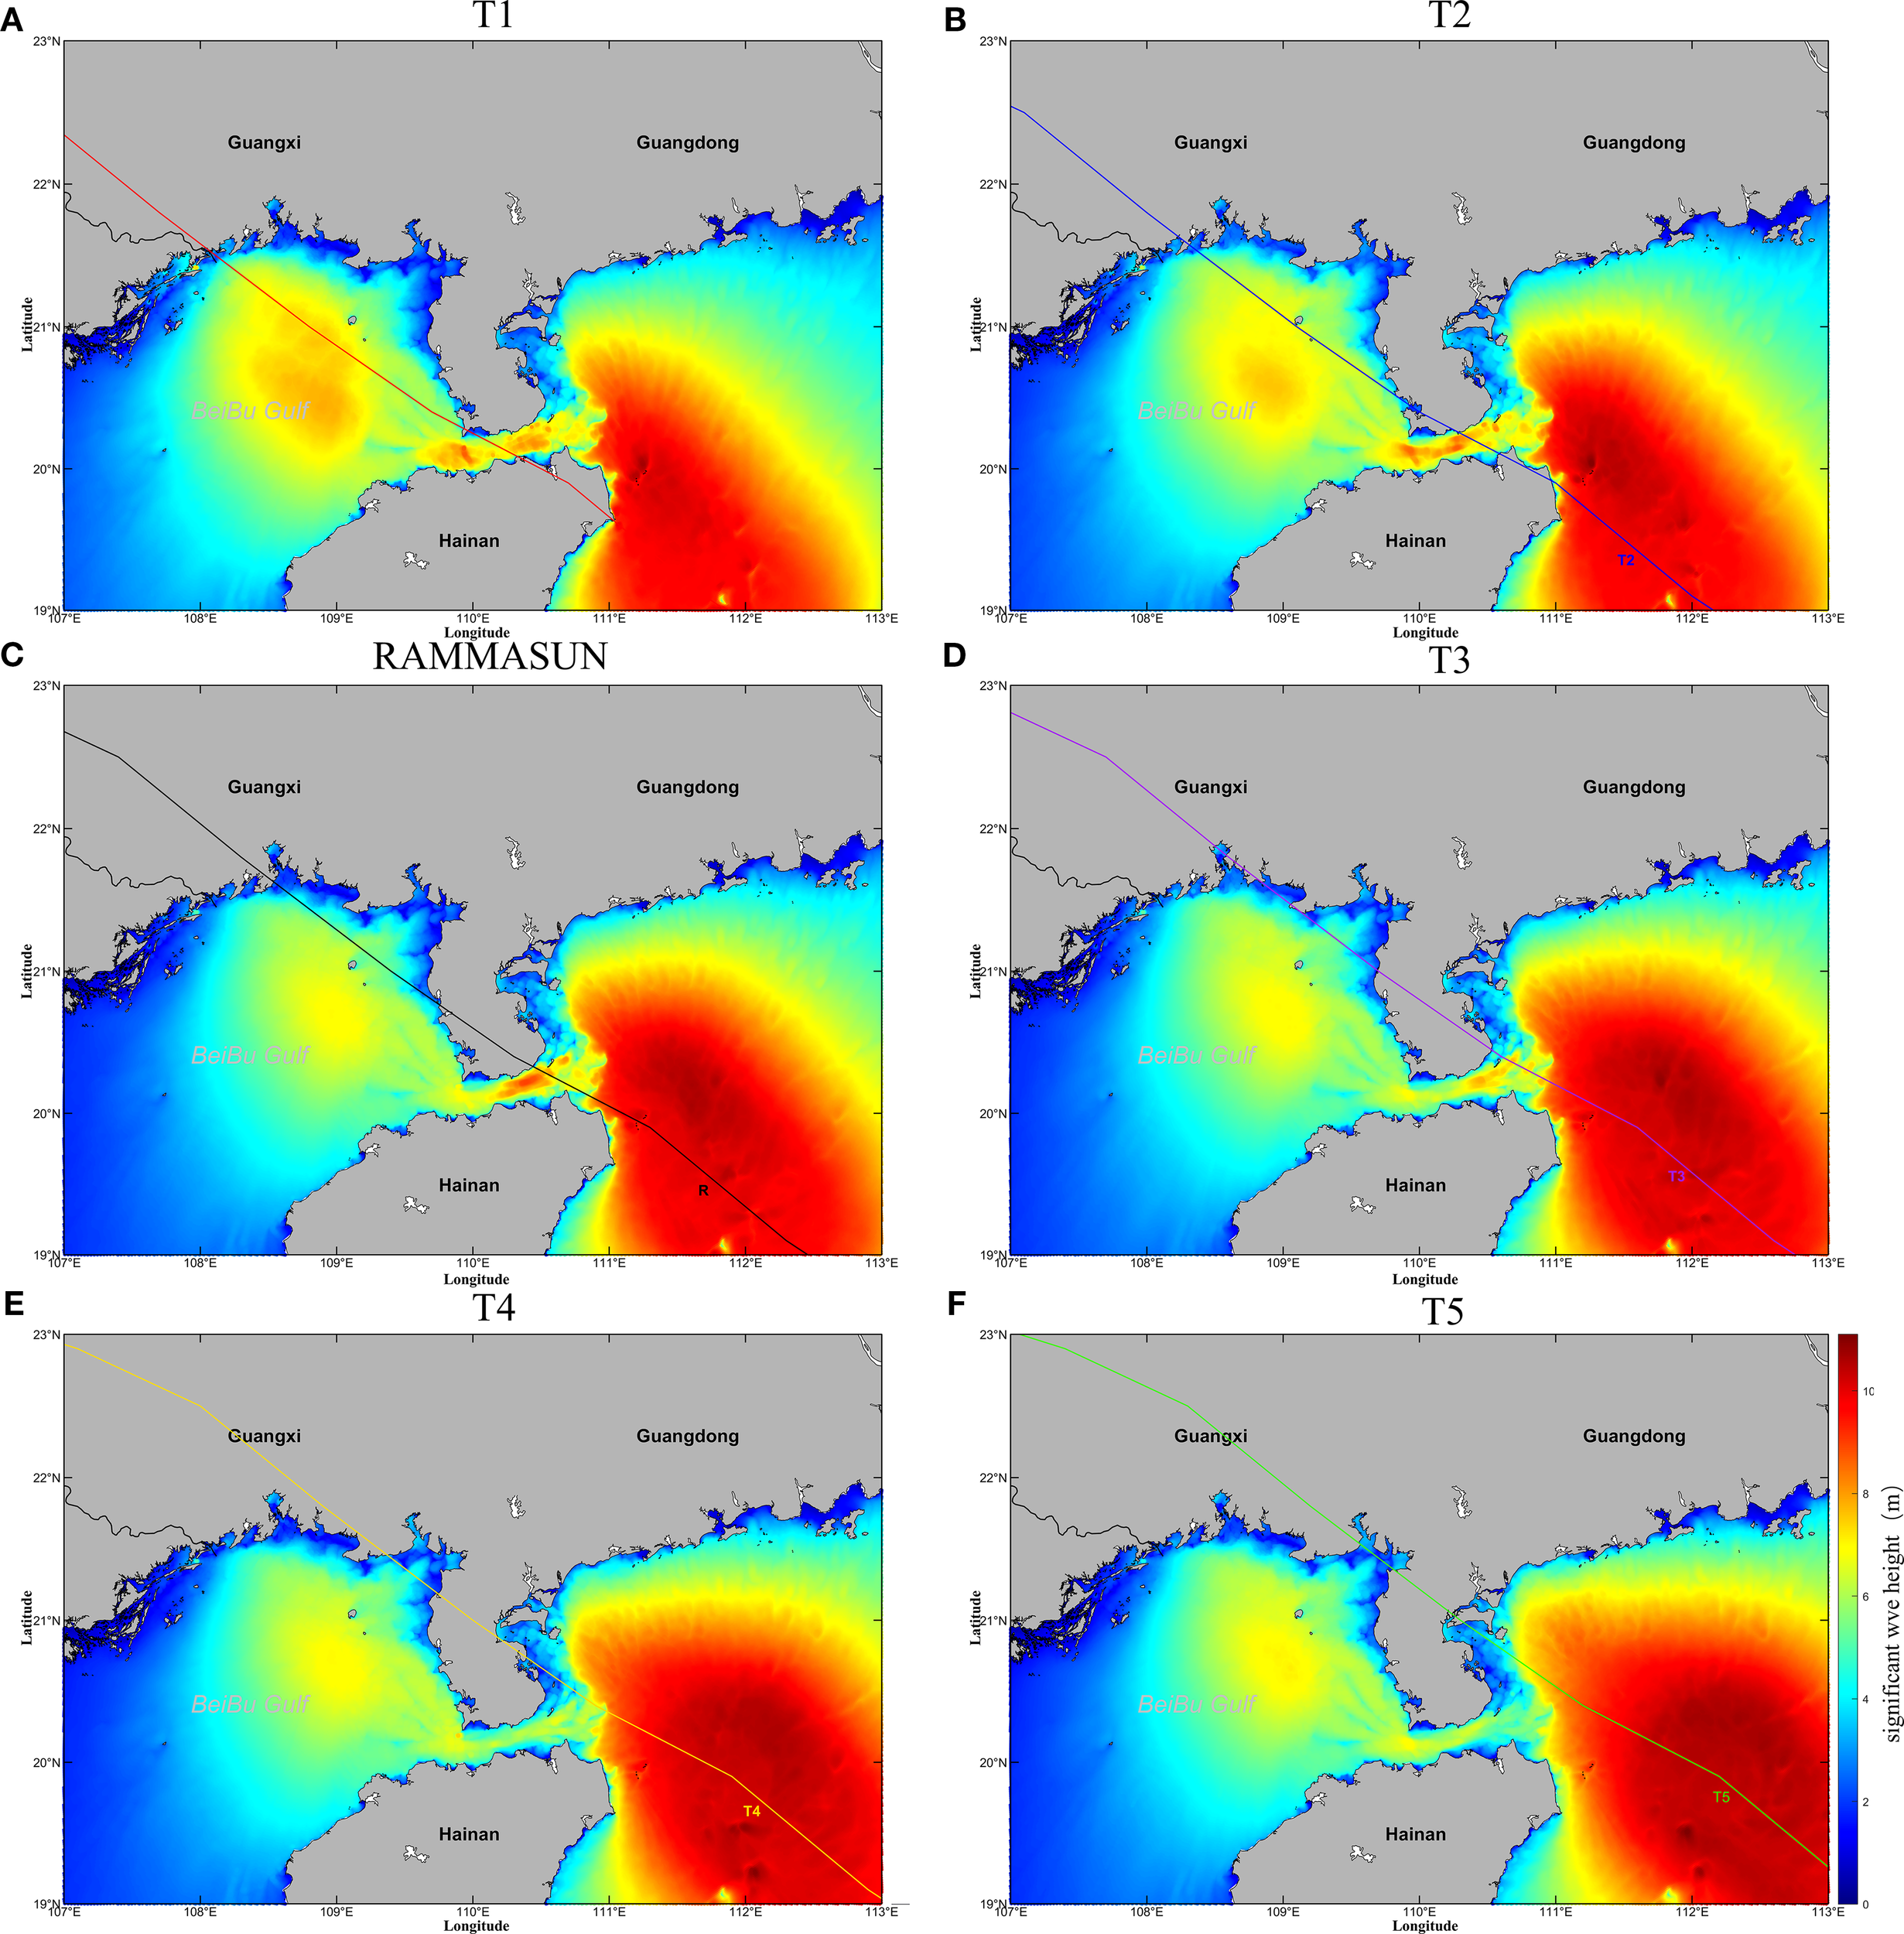
Maps showing spatial distribution of maximum significant wave heights in the northern South China Sea during typhoons with different tracks. (A) T1, (B) T2, (C) RAMMASUN, (D) T3, (E) T4, (F) T5.
Figure 18
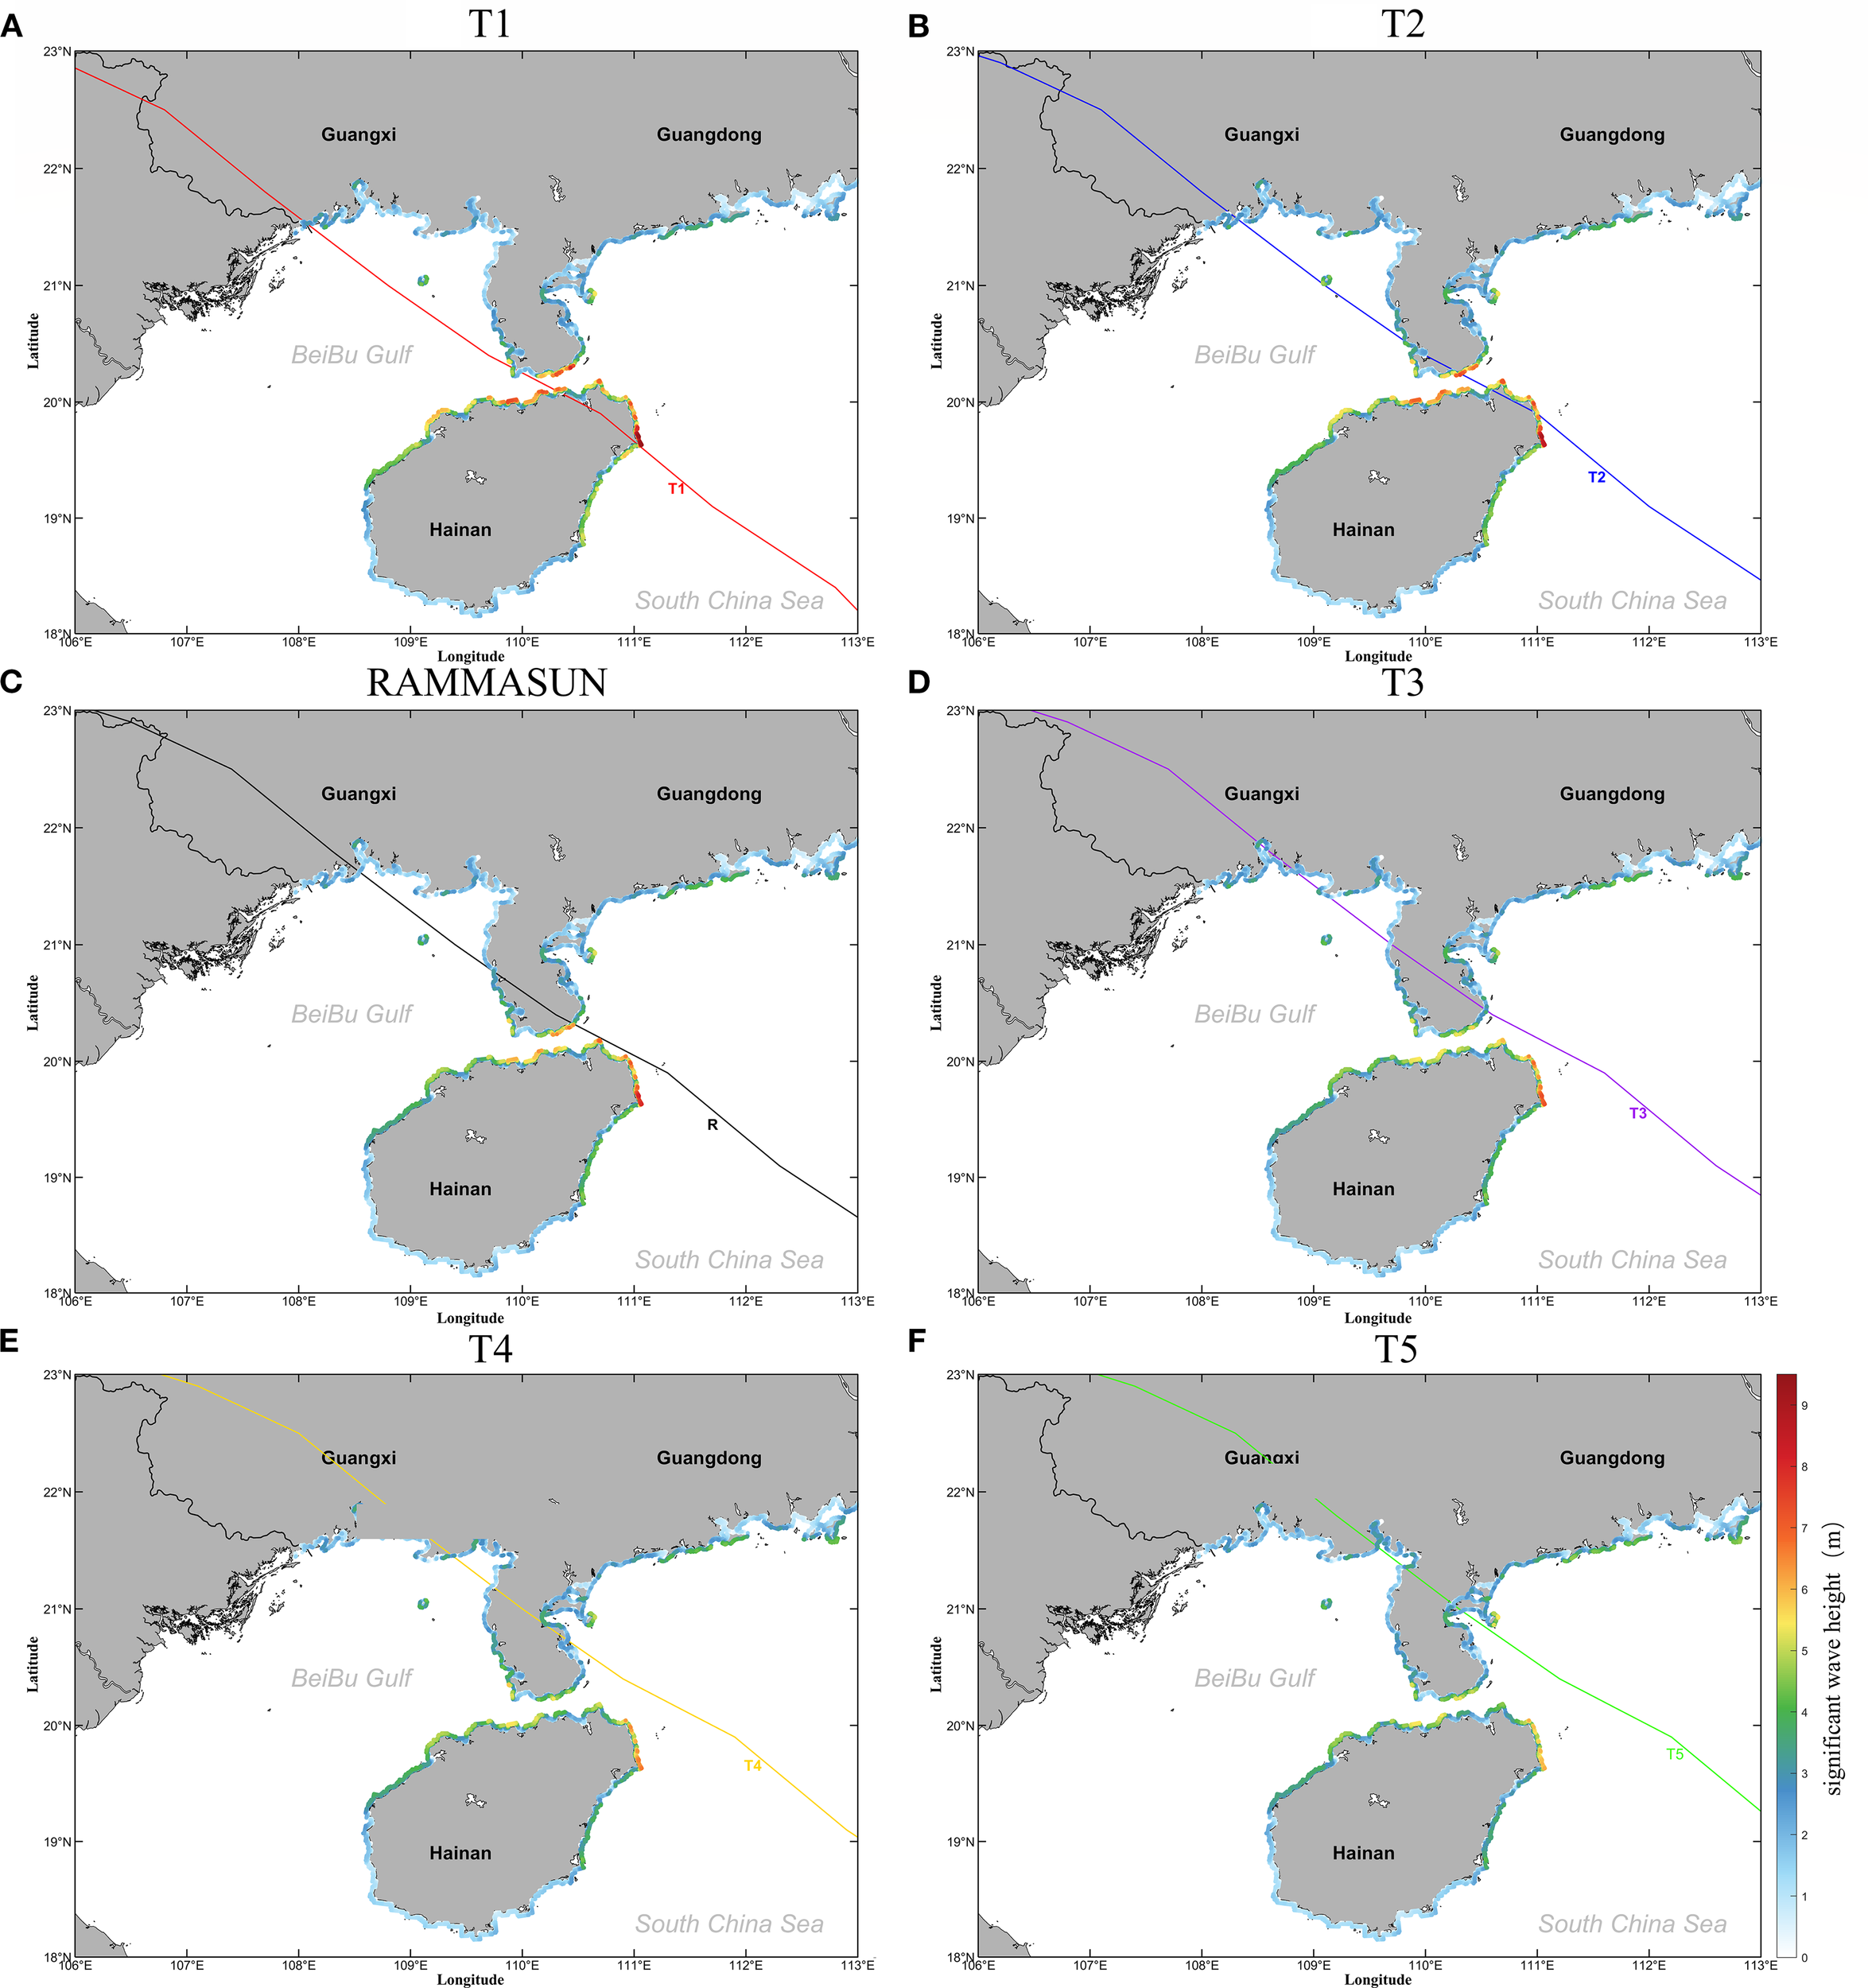
Maps showing spatial distribution of maximum significant wave heights along the northern coast of the South China Sea during typhoons with different tracks. (A) T1, (B) T2, (C) RAMMASUN, (D) T3, (E) T4, (F) T5.
The Hainan Island and Qiongzhou Strait provide important sheltering effects against both storm surge and typhoon wave for the Beibu Gulf, shown by the obviously larger positive surge and wave heights eastward the Leizhou Peninsula. However, storm surge and typhoon wave during typhoon event can still be significant and require precautions. The typhoon process in the Beibu Gulf experiences limited impacts from that occurring eastward the Leizhou Peninsula, given the small magnitude of Qiongzhou Strait, which bridges these two systems. Thus, typhoon process in the Bay functions in a similar way to enclosed bay. Even so, its response to typhoon characteristics at different locations is highly variant, owing to the complex coastline configuration and regional topography. Overall, typhoons passing through the west end of the Qiongzhou Strait likely have a more significant impacts on surge and wave of the bay. This characteristic may provide certain insights for typhoon prevention in the Beibu Gulf.
5 Conclusions
Based on the Holland typhoon model and the Delft3D-FLOW-WAVE model, a nested tide-surge-wave coupled model was applied for the Beibu Gulf. The numerical simulations were conducted for the 2014 Super Typhoon Rammasun, and the model was validated using obversional data. Building upon the well-validated model, more typhoon events were generated using a typical typhoon track scenario construction method combined with information from Typhoon Rammasun. The typhoon incident angle and translation speed critically influence surge and wave patterns, this study first focuses on the fundamental role of track position to establish a baseline understanding of spatial vulnerabilities in the Beibu Gulf. Based on the simulation results of storm surge and typhoon wave during each typhoon passage, the maximum positive surges, maximum negative surges, and maximum significant wave heights in the offshore and nearshore areas under different typhoon tracks were statistically analyzed. The potential impacts of extreme typhoon tracks on storm surge and typhoon wave in the Beibu Gulf was investigated, leading to the following main conclusions.
The storm surge process in the nearshore areas of the Beibu Gulf exhibits a characteristic of first negative surges followed by positive surges. The intensity of positive surges showing a clear spatial right-biased feature, and the affected area it as the typhoon track shifts eastward. Influenced by local factors such as the depth and coastal morphology of the Qiongzhou Strait, obvious changes occur in the distribution characteristics of the wave field before and after a typhoon enters the Northern Gulf, with the significant wave heights of the typhoon wave exhibiting a spatial trend transitioning from a right-biased spatial distribution to a left-biased spatial distribution. Storm surge is highly sensitive to complex micro-topography. The winding and tortuous characteristics of the coastline result in serious positive surges within the ports of the Beibu Gulf, and the eastern coast of Leizhou Peninsula is a severely affected area by positive surges. The intensity of positive surges and significant wave heights is greater along the northeastern coast of Hainan Island and the shores of the Qiongzhou Strait.
In conclusion, the tide-surge-wave coupled model developed in this study demonstrates high accuracy. By conducting simulations of storm surge and typhoon wave under different typhoon tracks, the research findings can serve as a reference for the construction of marine engineering and the disaster prevention and mitigation efforts in the Beibu Gulf region. However, the typhoon tracks designed in this study are overly idealized, while in actual scenarios, typhoon tracks are highly complex and variable. Therefore, in future studies on the potential impacts of storm surge and typhoon wave under different typhoon tracks, emphasis should be placed on constructing typhoon tracks more realistically. While the idealized parallel tracks effectively isolate the role of lateral displacement, future work will incorporate additional parameters such as incident angle and translation speed to enhance real-world applicability.
Statements
Data availability statement
The raw data supporting the conclusions of this article will be made available by the authors, without undue reservation.
Author contributions
ZW: Investigation, Methodology, Software, Writing – original draft, Writing – review & editing. SZ: Software, Writing – original draft. WW: Investigation, Methodology, Writing – original draft, Writing – review & editing. KG: Visualization, Writing – original draft. JC: Investigation, Writing – review & editing. CJ: Conceptualization, Investigation, Software, Writing – review & editing. BD: Investigation, Writing – review & editing.
Funding
The author(s) declare financial support was received for the research and/or publication of this article.The study is financially supported by the National Natural Science Foundation of China (52171246, 42276173). The partial support also comes from the Open Research Fund of Key Laboratory of Water Security Guarantee in Guangdong-Hong Kong-Marco Greater Bay Area of Ministry of Water Resources. (WSGBA-KJ2023012), the Science and Technology Innovation Program of Hunan Province (2023RC3136), Educational Science Foundation of Hunan Province (23A0265).
Conflict of interest
The authors declare that the research was conducted in the absence of any commercial or financial relationships that could be construed as a potential conflict of interest.
Generative AI statement
The author(s) declare that no Generative AI was used in the creation of this manuscript.
Any alternative text (alt text) provided alongside figures in this article has been generated by Frontiers with the support of artificial intelligence and reasonable efforts have been made to ensure accuracy, including review by the authors wherever possible. If you identify any issues, please contact us.
Publisher’s note
All claims expressed in this article are solely those of the authors and do not necessarily represent those of their affiliated organizations, or those of the publisher, the editors and the reviewers. Any product that may be evaluated in this article, or claim that may be made by its manufacturer, is not guaranteed or endorsed by the publisher.
References
1
Bacopoulos P. (2019). Extreme low and high waters due to a large and powerful tropical cyclone: Hurricane Irma, (2017). Natural Hazards98, 939–968. doi: 10.1007/s11069-018-3327-7
2
Bilskie M. V. Hagen S. C. Medeiros S. C. Cox A. T. Salisbury M. Coggin D. (2016). Data and numerical analysis of astronomic tides, wind-waves, and hurricane storm surge along the northern Gulf of Mexico. J. Geophys. Res.: Oceans121, 3625–3658. doi: 10.1002/2015JC011400
3
Bolaños R. Brown J. M. Souza A. J. (2014). Wave–current interactions in a tide dominated estuary. Continent. Shelf Res.87, 109–123.
4
Chen Y. Chen L. Zhang H. Gong W . (2019). Effects of wave-current interaction on the Pearl River Estuary during Typhoon Hato. Estuar. Coast. Shelf Sci.228, 106364. doi: 10.1016/j.ecss.2019.106364
5
Feng J. Jiang W. Li D. Liu Q. Wang H. Liu K. (2019). Characteristics of tide–surge interaction and its roles in the distribution of surge residuals along the coast of China. J. Oceanogr.75, 225–234. doi: 10.1007/s10872-018-0495-8
6
Gao J. Hou L. Liu Y. Shi H . (2024). Influences of bragg reflection on harbor resonance triggered by irregular wave groups. Ocean Eng.305, 117941. doi: 10.1016/j.oceaneng.2024.117941
7
Gao J. Ma X. Dong G. Chen H. Liu Q. Zang J. (2021). Investigation on the effects of Bragg reflection on harbor oscillations. Coast. Eng.170, 103977. doi: 10.1016/j.coastaleng.2021.103977
8
Gao J. Ma X. Zang J. Dong G. Ma X. Zhu Y. et al . (2020). Numerical investigation of harbor oscillations induced by focused transient wave groups. Coast. Eng.158, 103670. doi: 10.1016/j.coastaleng.2020.103670
9
Gao J. Shi H. Zang J. Liu Y . (2023). Mechanism analysis on the mitigation of harbor resonance by periodic undulating topography. Ocean Eng.281, 114923. doi: 10.1016/j.oceaneng.2023.114923
10
Gong W. Chen Y. Zhang H. Chen Z . (2018). Effects of wave–current interaction on salt intrusion during a typhoon event in a highly stratified estuary. Estuar. Coasts41, 1904–1923. doi: 10.1007/s12237-018-0393-8
11
He Z. Tang Y. Xia Y. Chen B. Xu J. Yu Z. et al . (2020). Interaction impacts of tides, waves and winds on storm surge in a channel-island system: Observational and numerical study in Yangshan Harbor. Ocean Dyn.70, 307–325. doi: 10.1007/s10236-019-01328-5
12
Hegermiller C. A. Warner J. C. Olabarrieta M. Sherwood C. R . (2019). Wave–current interaction between Hurricane Matthew wave fields and the Gulf Stream. J. Phys. Oceanogr.49, 2883–2900. doi: 10.1175/JPO-D-19-0124.1
13
Heidarzadeh M. Iwamoto T. Šepić J. Mulia I. E . (2023). Normal and reverse storm surges along the coast of Florida during the September 2022 Hurricane Ian: Observations, analysis, and modelling. Ocean Model.185, 102250. doi: 10.1016/j.ocemod.2023.102250
14
Holland G. (2008). A revised hurricane pressure–wind model. Monthly Weather Rev.136, 3432–3445. doi: 10.1175/2008MWR2395.1
15
Holland G. J. Belanger J. I. Fritz A. (2010). A revised model for radial profiles of hurricane winds. Monthly Weather Rev.138, 4393–4401. doi: 10.1175/2010MWR3317.1
16
Horsburgh K. J. Wilson C. (2007). Tide-surge interaction and its role in the distribution of surge residuals in the North Sea. J. Geophys. Res.: Oceans112.
17
Hsiao S.-C. Chen H. Chen W.-B. Chang C.-H. Lin L.-Y . (2019). Quantifying the contribution of nonlinear interactions to storm tide simulations during a super typhoon event. Ocean Eng.194, 106661. doi: 10.1016/j.oceaneng.2019.106661
18
Idier D. Dumas F. Muller H. (2012). Tide-surge interaction in the English Channel. Natural Hazards Earth Syst Sci.12, 3709–3718. doi: 10.5194/nhess-12-3709-2012
19
Isachsen P. E. Sørlie S. R. Mauritzen C. Lydersen C. Dodd P. Kovacs K. M. (2014). Upper-ocean hydrography of the Nordic Seas during the International Polar Year (2007-2008) as observed by instrumented seals and Argo floats. Deep Sea Research Part I: Oceanographic Research Papers.93, 41–59. doi: 10.1016/j.dsr.2014.07.002
20
Joyce J. Chang N. B. Harji R. et al . (2018). Cascade impact of hurricane movement, storm tidal surge, sea level rise and precipitation variability on flood assessment in a coastal urban watershed. Climate Dyn.51, 383–409. doi: 10.1007/s00382-017-3930-4
21
Keen T. R. Glenn S. M. (1999). Shallow water currents during Hurricane Andrew. J. Geophys. Res.: Oceans104, 23443–23458. doi: 10.1029/1999JC900180
22
Li Z. Li S. Hou Y. Mo D. Li J. Yin B. (2022). Typhoon-induced wind waves in the northern East China Sea during two typhoon events: the impact of wind field and wave-current interaction. J. Oceanol Limnol40, 934–949. doi: 10.1007/s00343-021-1089-7
23
Liang M. S. Dong Z. Julius S. Neal J. Yang Y. J . (2024). Storm surge projection and objective-based risk management for climate change adaptation along the US Atlantic Coast. J. Water Resour. Plann. Manage.150, 12. doi: 10.1061/JWRMD5.WRENG-5483
24
Lin S. Sheng J. Ohashi K. Song Q . (2021). Wave-current interactions during hurricanes Earl and Igor in the northwest Atlantic. J. Geophys. Res.: Oceans126, e2021JC017609.
25
Liu W. C. Huang W. C. (2019). Influences of sea level rise on tides and storm surges around the Taiwan coast. Continent. Shelf Res.173, 56–72. doi: 10.1016/j.csr.2018.12.009
26
Liu W. C. Huang W. C. (2020). Investigating typhoon-induced storm surge and waves in the coast of Taiwan using an integrally-coupled tide-surge-wave model. Ocean Eng.212, 107571. doi: 10.1016/j.oceaneng.2020.107571
27
Liu W. C. Huang W. C. Chen W. B. (2016). Modeling the interaction between tides and storm surges for the Taiwan coast. Environ. Fluid Mechanics16, 721–745. doi: 10.1007/s10652-015-9441-0
28
Ma Y. Wu Y. Shao Z. Cao T. Liang B . (2022). Impacts of sea level rise and typhoon intensity on storm surges and waves around the coastal area of Qingdao. Ocean Eng.249, 110953. doi: 10.1016/j.oceaneng.2022.110953
29
Masselink G. van Heteren S. (2014). Response of wave-dominated and mixed-energy barriers to storms. Mar. Geol352, 321–347. doi: 10.1016/j.margeo.2013.11.004
30
Mori N. Kato M. Kim S. Mase H. Shibutani Y. Takemi T. et al . (2014). Local amplification of storm surge by Super Typhoon Haiyan in Leyte Gulf. Geophys. Res. Lett.41, 5106–5113. doi: 10.1002/2014GL060689
31
Murty T. S. Flather R. A. Henry R. F. (1986). The storm surge problem in the Bay of Bengal. Prog. Oceanogr.16, 195–233. doi: 10.1016/0079-6611(86)90039-X
32
Pattanayak S. Mohanty U. C. Dube S. K. (2016). “The storm surge prediction over Bay of Bengal and Arabian Sea: A review,” in Advanced Numerical Modeling and Data Assimilation Techniques for Tropical Cyclone Prediction, New York: Springer691–723.
33
Shen J. Qiu Y. Zhang S. Kuang F . (2017). Observation of tropical cyclone-induced shallow water currents in Taiwan Strait. J. Geophys. Res.: Oceans122, 5005–5021. doi: 10.1002/2017JC012737
34
Sheng Y. P. Liu T. (2011). Three-dimensional simulation of wave-induced circulation: Comparison of three radiation stress formulations. J. Geophys. Res.: Oceans116.
35
Sjur A. L. P. Isachsen P. E. Nilsson J. LaCasce J. H. Ryseth M. D . (2025). The wind-driven time-variable circulation in the Arctic Mediterranean. J. Geophys. Res. Oceans130. doi: 10.1029/2024JC021713
36
Smith T. A. Chen S. Campbell T. Martin P. Rogers W. E. Gaberšek S. et al . (2013). Ocean–wave coupled modeling in COAMPS-TC: A study of Hurricane Ivan, (2004). Ocean Model.69, 181–194. doi: 10.1016/j.ocemod.2013.06.003
37
Spicer P. Huguenard K. Ross L. Rickard L. N . (2019). High-frequency tide-surge-river interaction in estuaries: Causes and implications for coastal flooding. J. Geophys. Res.: Oceans124, 9517–9530.
38
Sun Y. Perrie W. Toulany B. (2018). Simulation of wave-current interactions under hurricane conditions using an unstructured-grid model: Impacts on ocean waves. J. Geophys. Res.: Oceans123, 3739–3760.
39
Thomas A. Dietrich J. C. Asher T. G. Bell M. Blanton B. O. Copeland J. H. et al . (2019). Influence of storm timing and forward speed on tides and storm surge during Hurricane Matthew. Ocean Model.137, 1–19. doi: 10.1016/j.ocemod.2019.03.004
40
Valle-Levinson A. Olabarrieta M. Valle A. (2013). Semidiurnal perturbations to the surge of Hurricane Sandy. Geophys. Res. Lett.40, 2211–2217. doi: 10.1002/grl.50461
41
Vega A. J. Miller P. W. Rohli R. V. Heavilin J . (2021). Synoptic climatology of nuisance flooding along the Atlantic and Gulf of Mexico coasts, USA. Natural Hazards105, 1281–1297. doi: 10.1007/s11069-020-04354-5
42
Wu Z. Chen J. Jiang C. Deng B . (2021). Simulation of extreme waves using coupled atmosphere-wave modeling system over the South China Sea. Ocean Eng.221, 108531. doi: 10.1016/j.oceaneng.2020.108531
43
Wu Z. Gao K. Chen J. Zhang H. Deng B. Jiang C. et al . (2024). Typhoon-induced ocean waves and stokes drift: A case study of Typhoon Mangkhut, (2018). China Ocean Eng.38, 711–724. doi: 10.1007/s13344-024-0056-4
44
Wu Z. Jiang C. Deng B. Chen J. Long Y. Qu K. et al . (2020). Numerical investigation of Typhoon Kai-tak, (1213) using a mesoscale coupled WRF-ROMS model–Part II: Wave effects. Ocean Eng.196, 106805.
45
Wu Z. Jiang C. Deng B. Chen J. Long Y. Qu K. et al . (2019). Numerical investigation of Typhoon Kai-tak, (1213) using a mesoscale coupled WRF-ROMS model. Ocean Eng.175, 1–15. doi: 10.1016/j.oceaneng.2019.01.053
46
Wu Z. Zou Z. Chen J. Luo H. Deng B. Jiang C. et al . (2025). Dynamic and thermodynamic characteristics of ocean response to super typhoon Mangkhut in the South China Sea. Front. Mar. Sci.12, 1586377. doi: 10.3389/fmars.2025.1586377
47
Yang B. Hou Y. Hu P. Liu Z. Liu Y . (2015). Shallow ocean response to tropical cyclones observed on the continental shelf of the northwestern S outh C hina S ea. J. Geophys. Res.: Oceans120, 3817–3836. doi: 10.1002/2015JC010783
48
Yin C. Huang H. Wang D. Liu Y . (2022). Tropical cyclone-induced wave hazard assessment in Hainan Island, China. Natural Hazards113, 103–123. doi: 10.1007/s11069-022-05266-2
49
Zhang Z. Song Z. Zhang D. Hu D. Yu Z. Yue S. (2024). Tide–surge interactions in Lingdingyang Bay, Pearl River Estuary, China: a case study from typhoon Mangkhut 2018. Estuar. Coasts47, 330–351. doi: 10.1007/s12237-023-01297-5
Summary
Keywords
storm surge, typhoon wave, coupled tide-surge-wave model, potential impact, Beibu Gulf, Delft3D
Citation
Wu Z, Zhang S, Wei W, Gao K, Chen J, Jiang C and Deng B (2025) Potential impacts of typhoon tracks on storm surge and typhoon wave in the Beibu Gulf: a case study of Super Typhoon Rammasun. Front. Mar. Sci. 12:1673292. doi: 10.3389/fmars.2025.1673292
Received
25 July 2025
Accepted
29 August 2025
Published
22 September 2025
Volume
12 - 2025
Edited by
Li Li, Zhejiang University, China
Reviewed by
Peng Yao, Hohai University, China
Junliang Gao, Jiangsu University of Science and Technology, China
Qianjiang Zhang, Ministry of Natural Resources, China
Updates
Copyright
© 2025 Wu, Zhang, Wei, Gao, Chen, Jiang and Deng.
This is an open-access article distributed under the terms of the Creative Commons Attribution License (CC BY). The use, distribution or reproduction in other forums is permitted, provided the original author(s) and the copyright owner(s) are credited and that the original publication in this journal is cited, in accordance with accepted academic practice. No use, distribution or reproduction is permitted which does not comply with these terms.
*Correspondence: Wen Wei, weiw95@mail.sysu.edu.cn
Disclaimer
All claims expressed in this article are solely those of the authors and do not necessarily represent those of their affiliated organizations, or those of the publisher, the editors and the reviewers. Any product that may be evaluated in this article or claim that may be made by its manufacturer is not guaranteed or endorsed by the publisher.