Abstract
Fin whales (Balaenoptera physalus), humpback whales (Megaptera novaeangliae) and minke whales (Balaenoptera acutorostrata) seasonally coexist in sympatry in the Gulf of St. Lawrence (Canada) where they feed to replenish their energy reserves. Over the past decades, these three species have experienced significant shifts in resource availability as the St. Lawrence ecosystem encountered major trophodynamic changes due to climatic and anthropogenic perturbations. This study aimed to understand how the realized trophic niche of these rorqual species has changed over time. To achieve this objective, stable nitrogen and carbon isotope ratios from 1110 whale skin biopsies sampled between 1992 and 2019 were used to define the isotopic niche of each species, quantify their diet using Bayesian isotopic mixing models, and assess the degree of individual diet specialization. Resource partitioning among these three sympatric species increased during the 2011–2019 period, as highlighted by the limited overlap observed among their isotopic niches. A recent dietary shift toward an increased reliance on pelagic fish (capelin, herring and/or mackerel) in fin whale and minke whale and a reduced contribution of krill suggests a possible reduction in krill abundance in the Gulf of St. Lawrence in recent years. These findings provide a unique insight into the ability of three generalist species to coexist through partitioning food resources, and adapt to ecosystem changes. Given the climatic context, knowledge of preferred prey is crucial for the conservation of these species.
1 Introduction
The North Atlantic Ocean has been experiencing an increase in temperature for several decades, and is now approximately 1.4 °C warmer than the 1982–2011 average (Harris et al., 2014; Kuhlbrodt et al., 2024). Temperature variations can trigger abrupt changes in the trophic structure of ecosystems (Beaugrand et al., 2008), affecting species abundance, distribution, phenology, and fitness (e.g., Brosset et al., 2019; Brennan et al., 2021; Gavrilchuk et al., 2021). For instance, species may shift their distribution northward to stay in an optimal temperature zone (Perry et al., 2005; Kleisner et al., 2017; Palacios-Abrantes et al., 2022) or change their timing of presence, leading to a desynchronization between predator and prey (match-mismatch hypothesis; Cushing, 1990). The severity of repercussions on predators depends partly on their ability to modify their diet or fully exploit their fundamental trophic niche (Hutchinson, 1957). Intraspecific and interspecific competition tend to, respectively, expand and restrict realized niche breadth, which is observable through niche overlap (Pianka, 1972). Temporal fluctuations in trophic niches can reveal changes in prey availability or quality, and in the ability of species to respond to ecosystem changes (e.g., Fleming et al., 2016).
Trophic niche breadth can evolve toward two opposite feeding strategies: specialism where an optimal prey is predominantly consumed with great efficiency, and generalism where a wider variety of prey is exploited (Krebs et al., 1993). The former strategy might be more beneficial when the energetically optimal resources are predictable, i.e. abundant and stable, whereas the latter may be more advantageous when the availability of optimal resources is unstable in time or space (Krebs et al., 1993). Generalism in feeding can occur at the individual or populational level (Bolnick et al., 2003). Populations might be composed of generalist individuals, specialist individuals each feeding on different resources, or a mix of both (Bolnick et al., 2003; Bearhop et al., 2004). Choice of prey can partly be explained by the optimal foraging theory (Schoener, 1971), which states that individual preferences for alternative resources occur from a complex interaction between resource characteristics and abundance, as well as phenotype of the individual. Those preferences then interact with prey availability, escape rates, environmental heterogeneity and social interactions to shape the real use of resources by the individual (Bolnick et al., 2003). This possibility for individual specialization is an important factor to consider when interpreting potential effects of a change in prey availability. Variation in prey selection among individuals will lead to differential responses to shifts in prey availability, resulting in a population-level impact distinct from that of uniform prey selection (Bolnick et al., 2011).
The Gulf of St. Lawrence (GSL) is no exception to the North Atlantic warming, with water temperatures having increased at a pace of 1.3 °C per decade since 2009 in the near-bottom and surface layers (Galbraith et al., 2024a). This change in water temperature has been paired with a reduced ice cover (Galbraith et al., 2024b). Overfishing also has contributed to ecosystemic changes over the past decades, by affecting community structure and abundance of several species (Myers et al., 1996, Savenkoff et al., 2007). In the 1990s and 2000s, the GSL trophic community became largely dominated by invertebrates (e.g., shrimp) and small forage fish (e.g., capelin, mackerel, herring) following the collapse of groundfish stocks (Savenkoff et al., 2007). While groundfish remained generally at low levels since then, other species such as redfish (Sebastes spp.) appear to have rebounded in the 2010s (Senay et al., 2021). Increases were also noted in species such as striped bass (Morone saxatilis; DFO, 2023), pinnipeds (Hammill et al., 2021; Mosnier et al., 2023) and bluefin tuna over the same period (Hanke, 2020). However, pelagic forage fish such as Atlantic mackerel (Scomber scombrus; Smith et al., 2022) and the spring spawning Atlantic herring (Clupea harengus; DFO, 2022) have declined considerably in recent years.
Mesozooplankton biomass, which includes the lipid rich copepods, has also decreased in the GSL in recent years, likely as a result of warming conditions (Blais et al., 2023). In the North Atlantic Ocean, krill have experienced a northward compression of their geographical range without a shift, resulting in a decrease of up to 4 degrees of latitude in habitat area, and a decrease in abundance of boreal and arctic krill species (Edwards et al., 2021). Models estimate that total krill biomass of the GSL would be negatively affected if sea surface temperatures exceeded 16 °C (Plourde et al., 2016), a threshold that was surpassed multiple times in August since the late 2000s (Galbraith et al., 2024a). Arctic krill (Thysanoessa spp.) are boreal-arctic species adapted to cold water that can have their metabolism affected if temperatures reach 12 °C. The northern krill (Meganyctiphanes norvegica) is a temperate species that shows a higher heat tolerance (Huenerlage and Buchholz, 2015; Ollier et al., 2018). Both have significantly different biochemical compositions and energetic values; changes in their relative abundance would therefore likely affect energy transfers to consumers. In 2009, Thysanoessa spp. and M. norvegica represented 60% and 40%, respectively, of the krill biomass in the St. Lawrence Estuary and northwestern GSL (nwGSL; McQuinn et al., 2015), with average densities remaining relatively stable in the nwGSL from 2008 to 2015 (supplementary material Guilpin et al., 2020). Abundance data is missing to assess how biomass of these two species changed in recent years in the St. Lawrence ecosystem.
The GSL represents an important summer feeding area for rorquals in need of rebuilding their energy reserves (Lesage et al., 2007). Rorquals are filter-feeders distinguished by their ventral pleats and their lunge feeding technique that allows them to engulf large quantities of prey (Goldbogen et al., 2017). These long-lived species guide the timing and patterns of their migration using both immediate environmental cues and their memory of the location and long-term phenology of their prey (Abrahms et al., 2019; Millien et al., 2025).
Environmental changes occurring in the GSL seems to have already impacted rorquals, as decreases in local abundance (Comtois et al., 2010; Ramp and Sears, 2013; Schleimer et al., 2019) and reproduction (Kershaw et al., 2020) of some rorqual species have been documented. The minke whale (Balaenoptera acutorostrata), humpback whale (Megaptera novaeangliae), and fin whale (Balaenoptera physalus) are closely-related baleen whale species that are co-occurring seasonally in feeding areas, and may be competing for dietary resources (Doniol-Valcroze et al., 2007). Unlike the blue whale (Balaenoptera musculus) which is a krill specialist (Kawamura, 1980), those three species may feed on a variety of prey including small schooling fish and zooplankton (Sergeant, 1963, 1966; Mitchell, 1974), with selection of target krill species being possible given they form species-specific swarms at different depths (McQuinn et al., 2015). Rorquals in the GSL differed to some extent in their feeding habitat in 1997–2002 (Doniol-Valcroze et al., 2007; Doniol-Valcroze, 2008), and also in their diet in 1992–2010 (Gavrilchuk et al., 2014). The extreme changes observed in the GSL water temperatures since 2010, that were concomitant to changes in local abundance and reproduction in some of the rorqual species of the GSL (Schleimer et al., 2019; Kershaw et al., 2020), and to changes in diet of the beluga in a neighboring ecosystem (Cabrol et al., 2025) emphasize the need for recent diet information on rorqual diet in the GSL.
The goal of this retrospective study spanning 28 years is to assess long-term use of dietary resources by three sympatric and non-specialist rorqual species of the Gulf of St. Lawrence during a period of climatic and ecosystemic change. Specifically, we assessed the trophic niche, diet, degree of specialization, and potential for competition, by examining the stable isotope ratios of carbon (δ13C) and nitrogen (δ15N) from over 1,000 rorquals sampled between 1992 and 2019, and nearly 400 specimens of their potential prey. Stable isotopes have long been used to qualitatively examine dietary niches and quantify diet composition, and are particularly useful in marine species that present notable challenges for observation and tracking such as cetaceans (Newsome et al., 2010). This method is based on the premise that the biochemical values of consumers can be predicted from that of their prey (Gannes et al., 1997; Martìnez del Rio et al., 2009), with trophic position and diet predicted over periods that vary according to the metabolic activity of the tissue examined (Vander Zanden et al., 2015; Teixeira et al., 2022). The ratios of δ13C are generally used to track carbon sources (Gearing et al., 1984), whereas δ15N generally provides information about trophic position (Minagawa and Wada, 1984). Application of this approach to rorquals from the GSL may help understand how rorquals cope with current ecosystemic changes, and forecast their capacity to adapt to ongoing climate change.
2 Materials and methods
2.1 Sample collection and preparation
2.1.1 Rorqual sampling
On total, 1110 skin samples were collected mostly (97%) from June to September from fin whales (n=402), humpback whales (n=465) and minke whales (n=243) in the nwGSL, Canada, between 1992 and 2019 (Figure 1). Biopsies were obtained by projecting a hollow dart (8 mm diameter x 40 mm length) from a small vessel using a crossbow and arrow system as outlined in Palsbøll et al. (1991). Biopsied individuals were photographed and, when possible, individually identified based on pigmentation patterns, distinctive marks, scars, size and shape of the dorsal fin (Katona and Whitehead, 1981; Agler et al., 1990; Gill and Fairbainrns, 1995). It is therefore possible that duplicate samples exist for some individuals in the dataset. Minke whales are particularly difficult to recognize in the field; however, their high abundance (Lawson and Gosselin, 2009) reduces the probability of resampling. For the other two species, a single sample was randomly selected if an individual was identified and known to have been sampled more than once in a specific year. Field procedures were authorized under the Canadian Fisheries Act, and starting in 2009, also under the Species at Risk Act.
Figure 1
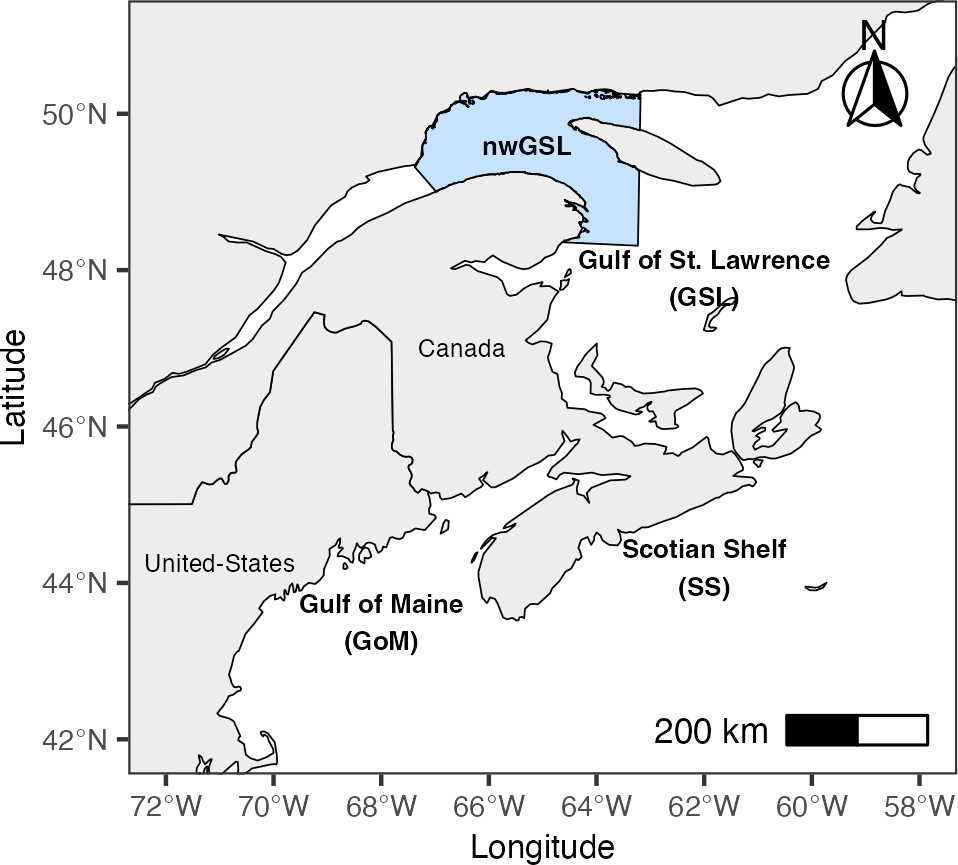
Study area ranging from the Gulf of Maine and Scotian Shelf (GoM/SS) to the Gulf of St. Lawrence (GSL). The blue colored area represents the northwestern Gulf of St. Lawrence (nwGSL), where rorquals and prey were sampled.
Samples were placed in a plastic vial on ice upon collection, and stored at -20 °C until the end of the field season. Epidermis and dermis were separated from the underlying fat using a sterile scalpel and stored at -80 °C until analyses. Total genomic DNA was extracted using the DNeasy Blood & Tissue Kit (Qiagen) with minor modifications to the manufacturer protocol (see Parent et al., 2025). Sex was determined by quantitative polymerase chain reaction (qPCR) for sex-specific gene regions according to the protocols outlined in Bérubé and Palsbøll (1996) and Rosel (2003).
Until 2005, skin samples were stored in a 20% v/v dimethyl sulfoxide solution (DMSO) of deionized water saturated with NaCl to optimize preservation conditions for genetic analyses (Amos and Hoelzel, 1991). Samples collected in 2006–2008 were preserved in sea water, whereas they were kept dry and stored at -20 °C and then -80 °C starting in 2009 (Supplementary Figure S1). The effect of sea water on δ13C and δ15N was deemed negligible for rorqual skin (Gavrilchuk et al., 2014). However, DMSO had a significant effect on isotopic values of rorqual skin and was mathematically corrected for using equations developed specifically using skin from rorquals sampled in the St. Lawrence (Lesage et al., 2010).
2.1.2 Prey sampling
Potential prey of minke, fin and humpback whales were identified based on diet composition from early studies in eastern Canada (Sergeant, 1963, 1966; Mitchell, 1974), field observations of their feeding behavior (Sergeant, 1966; Watkins and Schevill, 1979; Overholtz and Nicolas, 1979) and local abundance of potential prey (Bourdages et al., 2022; Smith et al., 2022; Brosset et al., 2019; McQuinn et al., 2015). Six species of fish or invertebrates were considered: capelin (Mallotus villosus), Atlantic herring (Clupea harengus), sand lance (Ammodytes spp.) and Atlantic mackerel (Scomber scombrus), Arctic krill (Thysanoessa spp.) and northern krill (Meganyctiphanes norvegica; Supplementary Table S1).
Prey were obtained from the nwGSL (Figure 1) mainly during the ice-free period from stock assessment cruises conducted by Fisheries and Oceans Canada, collaboration with universities (UQAR-ISMER) and from commercial fisheries over three main periods of sampling: 1995–1997, 2001–2006 and 2013–2022. Sampling methods are outlined in Lesage et al. (2001) and Rioux et al. (2023). Briefly, fishes were collected using bottom trawls or narrow-weaved wire nets. Zooplankton were collected from vertical or oblique tows using either a Bongo (333µm mesh size), a Vnet (1 m diameter; 250μm mesh size) or a jacknet (1 m diameter; 333μm mesh size) equipped with a strobe, then stored at -20 °C. Muscle was excised from the upper dorsolateral region of each fish specimen, whereas the entire muscle from the abdomen (excluding the exosqueleton) was used for invertebrates.
The turnover rate of stable isotopes in mysticete skin has never been measured in a controlled environment. In small odontocetes maintained in such conditions, full isotopic turnover has been estimated at 104 ± 35 days for carbon and 206 ± 84 days for nitrogen (common bottlenose dolphin Tursiops truncatus; Giménez et al., 2016). However, a shorter turnover rate of 163 ± 91 days has been estimated for blue whale’s skin, based on seasonal trends in nitrogen isotopic values of individuals using two isotopically distinct foraging zones (Busquets-Vass et al., 2017). These findings imply that skin integrates diet over three to five months prior to sampling. Given that some rorqual species such as fin whales and blue whales are known to forage outside their summer feeding grounds (e.g., Visser et al., 2011; Silva et al., 2013; Lesage et al., 2017; Ramp et al., 2024), the isotopic signature of some of the individuals sampled in the nwGSL may reflect feeding outside of this region. To account for this possibility, the literature was searched for existing isotopic signatures of potential prey from the Gulf of Maine and Scotian shelf region (GoM/SS; Figure 1), a possible feeding area known to be on the migratory path of minke and fin whales (Supplementary Table S2; Risch et al., 2014; Delarue et al., 2022; Ramp et al., 2024). This long turnover rate may also affect the interpretation of the isotopic signal of samples collected early in the feeding season, as the fasting behavior of rorquals during the reproductive season potentially leads to an increase in δ15N values (Doi et al., 2017).
2.2 Stable isotope analysis
Prey and skin samples were cut into small pieces, freeze-dried for 48h and homogenized into a fine powder using a mortar and pestle (Jardine et al., 2003). Lipids were extracted from rorqual skin and prey samples following the Folch method (Folch et al., 1957), except from 1995 to 1997 when a Soxhlet approach was used for prey (López-Bascón and Luque De Castro, 2020). While it has long been established that lipids negatively affect δ13C (Hobson et al., 1996; Kelly, 2000; Post et al., 2007), the positive bias in δ15N values introduced by lipid extraction has been demonstrated only more recently (Mintenbeck et al., 2008; Sotiropoulos et al., 2004; Sweeting et al., 2006; Ouellet et al., 2024). As a result, isotope ratio determination was made from a single lipid-extracted aliquot in samples acquired prior to 2006; starting in 2006, separate aliquots were sent for δ13C (lipid extracted aliquot) and δ15N (bulk aliquot) value determination. To ensure comparability of results over time, δ15N values of pre-2006 samples were mathematically corrected using equations specifically developed for muscle of fish and skin of marine mammals (see details of correction in Supplementary Figure S1; Lesage et al., 2010; Ouellet et al., 2024).
Isotope ratios were determined using a Thermo Finnigan DELTA plus XL Continuous Flow Stable Isotope Mass Spectrometer coupled to a Carla Erba Elemental Analyzer (CHN EA1110; Isotope Tracer Technologies). Ratios of heavy to light isotope are presented in delta notation (δ) relative to reference standards (Vienna PeeDee Belemnite limestone for carbon and atmospheric N2 for nitrogen), such that δ13C or δ15N (‰) = [(Rsample/Rstandard) − 1] × 1000, where Rsample is the 13C:12C or 15N:14N ratio of the sample and Rstandard is the ratio of the appropriate standard. Mean deviation among replicate samples included regularly (each batch) over the analysis period was 0.16‰ for δ13C and 0.25‰ for δ15N of rorqual skin (n=232 paired samples), and 0.27‰ for δ13C and 0.38‰ for δ15N of prey muscle (n=116 paired samples).
2.3 Data analysis
All statistical analyses were performed using the R software (version 4.2.3; R Development Core Team, 2024). A correction of -0.026 ± 0.002‰ per year (Körtzinger et al., 2003) was applied on prey and rorqual δ13C values using the SuessR package (Clark et al., 2021) to account for the Suess effect (Keeling, 1979) and allow for the comparison of values across periods. This correction accounts for the decline of 13C in atmospheric carbon dioxide (CO2) due to the release of anthropogenic low 13C-CO2, which cascades into 13C of dissolved inorganic carbon (DIC) in the ocean (Bacastow et al., 1996).
Trends in δ13C and δ15N were assessed for each species over the study period using penalized Generalized Additive Models (GAMs; Wood, 2017) assuming Gaussian distributions, and including sampling year as a smooth term, and sex when it improved the fit. Models best fitting the data were selected as those with the lowest Akaike information criterion (AIC; Konishi and Kitagawa, 2008). Temporal autocorrelation was present in our dataset (autocorrelation function ACF; Box et al., 2015), violating the independency condition. Temporal trends were therefore modeled using GlmmTMB (Generalized Linear Mixed Models using Template Model Builder; Brooks et al., 2017) while incorporating an Ornstein–Uhlenbeck autocorrelation function. All further analyses were conducted according to three separate periods to reflect the three intensive campaigns for prey sampling: 1992–2000 (Period 1), 2001–2010 (Period 2), and 2011–2022 (Period 3). These periods correspond to shifts in environmental conditions in the GSL, with Period 1 being characterized by water temperatures below long-term averages, Period 2 being near long-term averages, and Period 3 showing higher values than the long-term averages (Galbraith et al., 2024a).
2.3.1 Isotopic niche variation
The realized trophic niche is here approximated using the isotopic niche (Hette-Tronquart, 2019). Temporal variation in isotopic niche across periods was assessed using bivariate ellipses generated with SIBER (Stable Isotopes Bayesian Ellipse in R; Jackson et al., 2011). The standard ellipse area (SEA) contains 40% of the data, regardless of sample size, and represents the core population niche. The large sample size for every period and species (n > 30) in our study allows for the use of SEA, thereby excluding the biases associated with small sample size (Jackson et al., 2011). SEA was employed to represent the position and size of niches in the δ-space. The Bayesian estimate of the standard ellipse areas (SEAb), was used as a second metric to determine niche breadth. This metric is unbiased by sample size and has the advantage of capturing and propagating uncertainty arising from the sampling process (Jackson et al., 2011). The posterior distribution of SEAb along with the associated location of the centroid (LOC) were used to compare niche breadth and position. To evaluate resource partitioning among species, interspecific core niche overlap was quantified as the proportion of the shared area between species, calculated relative to each species’ own ellipse area. This approach provided species-specific estimates of niche overlap (Jackson and Parnell, 2023). Finally, the mean Euclidean distance to the centroid (CD) and the mean nearest-neighbor Euclidean distance (NND) were also calculated also from Bayesian inference to measure the inter-individual variation within each species. Differences in SEAb among species and periods were examined using permutational analysis of variance (PERMANOVA) and pairwise comparisons (Anderson, 2017).
2.3.2 Diet estimation
Diet composition was estimated using multi-source, two tracers Bayesian stable isotope mixing models which explicitly accounted for variability in prey signatures and trophic enrichment factor (MixSIAR; Stock et al., 2018). The isotopic mixing regions formed by prey groups were evaluated for each rorqual species and period using the simulated polygon approach (Smith et al., 2013). Bayesian mixing models calculate numerous times the plausible diet proportions for each data point, providing a posterior distribution of proportions from which a mean and standard deviation were extracted. Estimates were obtained separately for each species and period, with the exception of minke whales in Period 1 for which sample size was insufficient. When samples were not available for all prey species during a sampling period (1995–1997, 2001–2006 or 2013–2022), data from the nearest year was used to complete the dataset (Supplementary Table S1). The distribution of isotopic data from rorquals and prey were assessed for normality prior to analyses.
Models assumed a non-informative Dirichlet prior distribution, concentration dependencies based on the C:N ratio of each prey groups, and accounted for process and residual errors (Stock et al., 2018). Model convergence was confirmed by Gelman-Rubin metrics with at least 95% of Rc values < 1.1 (Gelman and Rubin, 1992). Bayesian models allows the inclusion of random effects to estimate and control for individual-level variability, and make inferences that generalize beyond the observed individuals. However, no more than two covariates can be considered simultaneously (Stock et al., 2018). Potential explanatory variables included sex and year as fixed effect, and individual ID as a random factor. A sex by year effect (written as Year/Sex) was used as the fixed effect when individual ID was included as a random factor. As a result, a total of seven models were tested for each species and period (Supplementary Table S4). Models were ranked based on their leave-one-out information criterion (LOOic) and Akaike weight; models with the lowest LOOic and highest AIC weight were considered best. Models including individual ID as a random effect were prioritized over models without individual ID to allow estimation of diet for each individual.
The trophic enrichment factor (TEF) is a primary parameter in the assessment of diet with stable isotopes. This factor accounts for differences in isotope ratios between a food source and a consumer’s tissue, which result from differential assimilation of the lighter and heavier isotope during metabolic processes. The only way to truly determine a TEF is to measure it experimentally (e.g., Hobson and Clark, 1992), which is impractical for our target taxa. Stable isotopes mixing models are sensitive to variations in TEF. Relying on general TEF values when specie-specific or tissue-specific values are inexistent can produce misleading results (Bond and Diamond, 2011). Alternatively, it is recommended to use values from related species with a diet comparable to the species studied (Stephens et al., 2022). For cetacean skin, the literature indicates a TEF value varying from 0.5 to 3.5 for δ13C, and from 1.57 to 2.82 for δ 15N (Supplementary Table S3). In this study, values from the longest controlled feeding experiment involving common bottlenose dolphin (Tursiops truncatus) eating capelin, herring, and sprat (Giménez et al., 2016) was used, i.e., 1.01 0.37‰ for δ13C and 1.57 0.52‰ for δ15N. Results from the latter study are likely to be particularly robust and reliable as its duration exceeded the turnover rate of skin tissue to ensure analyzed tissue had reached isotopic equilibrium. They also support a similar TEF-δ15N value (i.e., 1.7–1.9‰) estimated from field data of blue whales (Busquets-Vass et al., 2017).
Two tracers mixing models including more than seven sources are unlikely to produce precise or interpretable results (Stock et al., 2018). Therefore, a PERMANOVA and post-hoc pairwise comparisons with Bonferroni correction were used to identify isotopically similar prey in bivariate space sampled in the nwGSL that required grouping (McArdle and Anderson, 2001; Phillips et al., 2014; Anderson, 2017). Literature values for GoM/SS prey taxa (see Supplementary Table S2) were included as means and standard deviations. Aggregation of prey groups a posteriori was performed by summing posterior contributions when high negative correlation was present (< -0.8; Stock et al., 2018).
2.3.3 Individual diet specialization
The degree of dietary specialization was estimated using the Newsome et al. (2012) individual specialization index (ε) and diet compositions obtained from isotopic mixing models. Briefly, ε was calculated as the distance, in an Euclidean space, between a hypothetical diet vector of an ultra-generalist consumer which feeds equally on all prey resources (prey proportion = (1/nprey)) and the estimated diet for each individual whale.
The specialization index varies between 0 and 1, where 0 denotes an ultra-generalist consumer and 1, an ultra-specialist one. Individuals with index values up to 0.3 were considered generalists, and those between 0.7 to 1 were considered specialists. The effect of sex on specialization index was tested with a PERMANOVA.
3 Results
3.1 Sex ratio
Sex ratio (F:M) in our sample was strongly biased towards females in minke whales (6.8:1), slightly biased towards females in humpback whales (1.4:1), and towards males in fin whales (1:1.3).
3.2 Isotopic signatures
Skin of minke, fin and humpback whales sampled from 1992 to 2019 ranged in δ13C values from -20.8 to -16.9‰, and in δ15N values from 6.7 to 16.0‰ (Figure 2). The three species differed significantly in their δ15N values, both in terms of means and variances (Kruskal-Wallis’s test and Dunn’s post-hoc, p < 0.001; Levene’s F2,1107 = 47.7, p < 0.001). Overall, humpback whales exhibited the highest δ15N values and occupied the highest trophic positions, and were the least variable in their isotopic signatures, followed by minke whales, and fin whales (Figure 2). While δ13C mean values for the three species were within 0.26‰ of each other, they were statistically different (Kruskal-Wallis’s test and Dunn’s post-hoc, p < 0.001), although their variances were deemed similar (Levene’s F2,1107 = 2.14, p = 0.12).
Figure 2
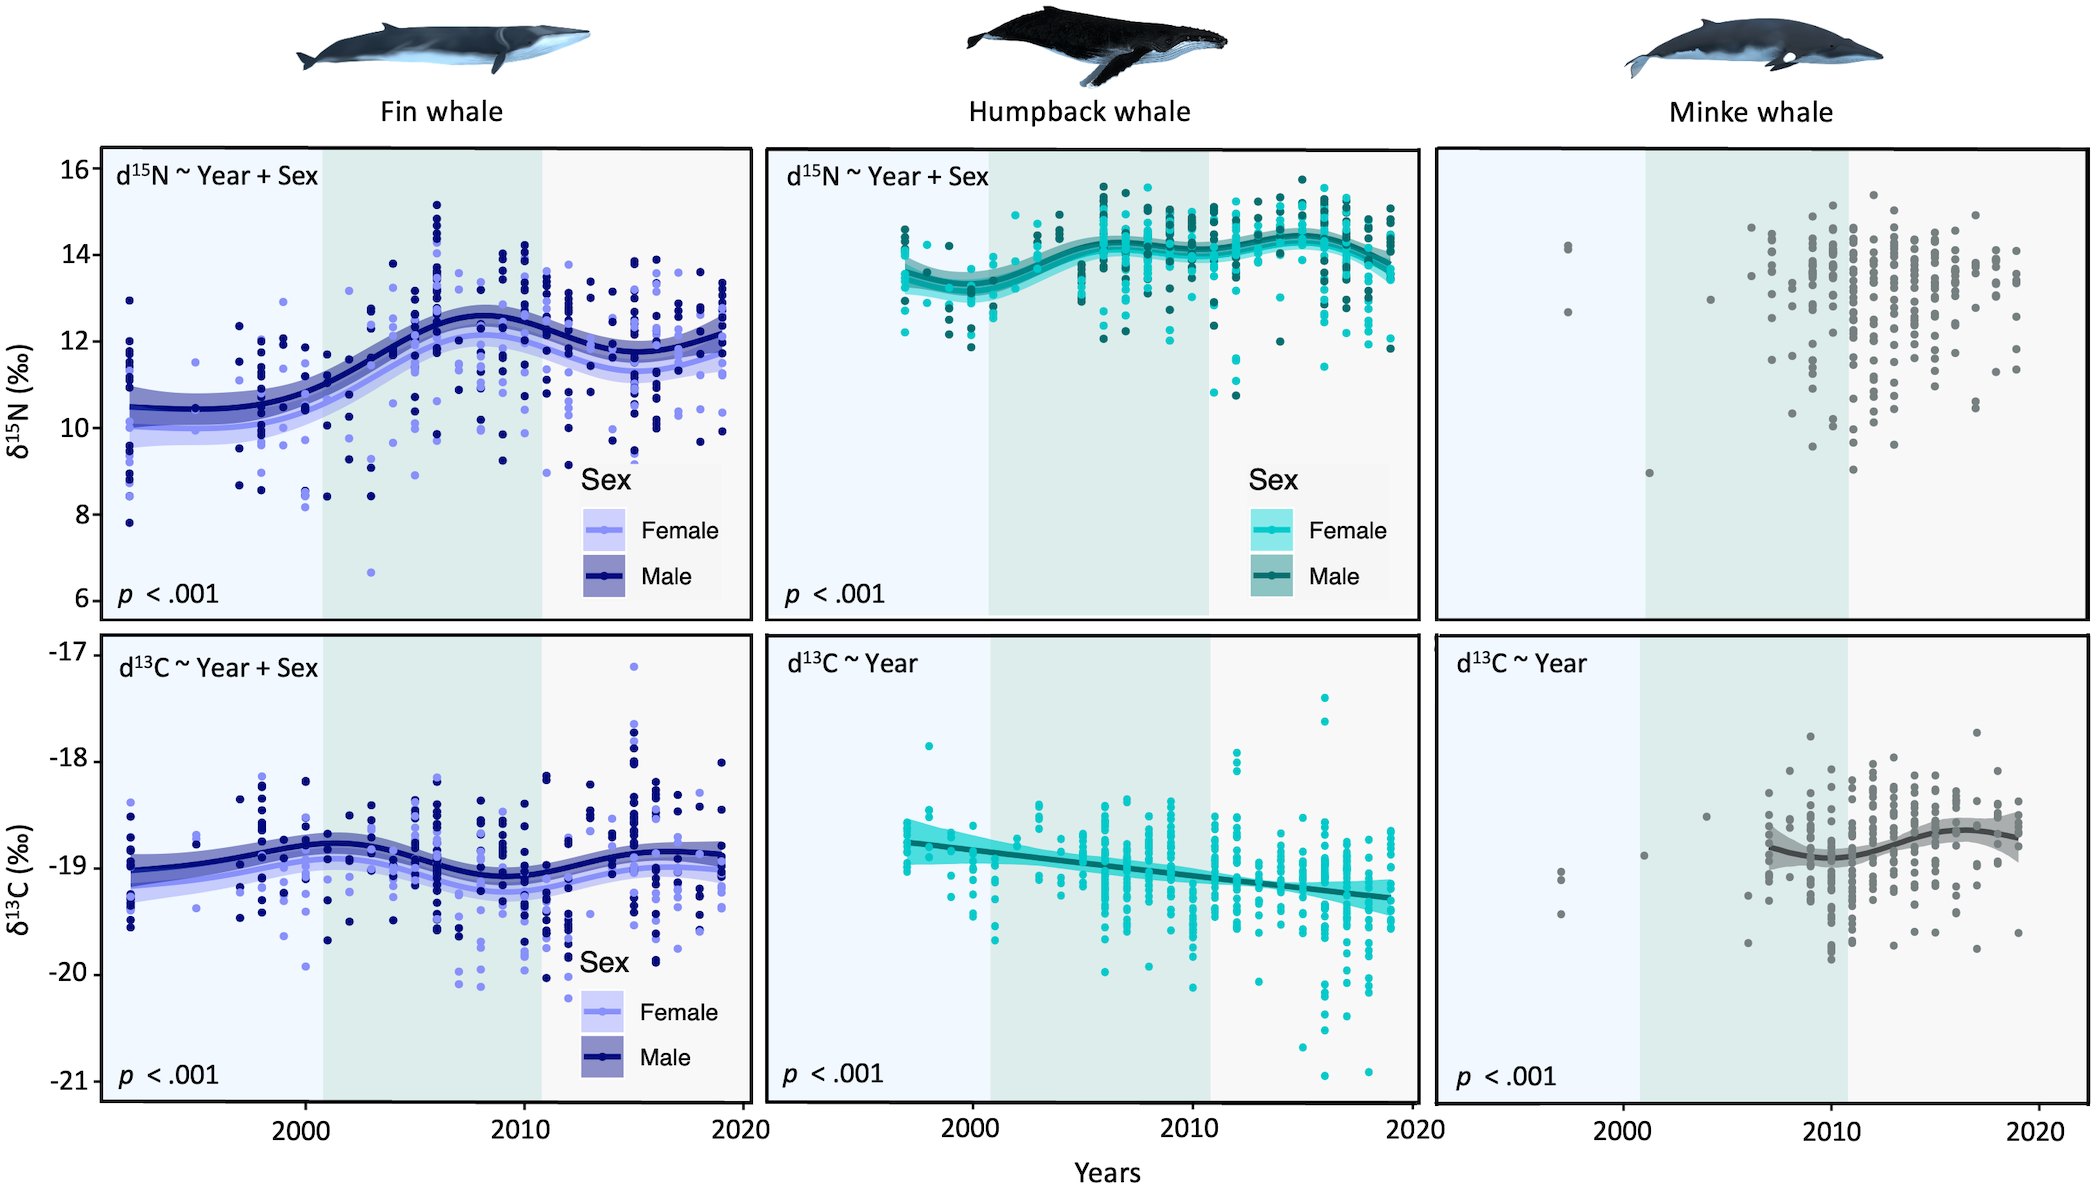
Trends in isotopic δ15N (top panel) and δ13C (bottom panel) values in fin whales (1992–2019; dark blue), humpback whales (1995–2019; light blue), and in minke whales (2006–2019; grey). Background colors represent the different periods used for analysis of trophic niches and quantitative diet composition. Each graph displays covariates included in the model (top-left corner). P-values represent significance of the smooth parameter.
Humpback whales showed a linear decrease in δ13C over the study period (-0.52‰) (Figure 2). While non-linear trends in δ13C over time were observed for the other two species, variations were overall small (< 0.09‰). For δ15N values, a non-linear but overall increase was noted for fin whales over the study period (+1.93‰), with only small non-linear variations detected for humpback whales and no trend noted for minke whales (Figure 2). Sex improved model fit in fin whales for both isotopes and in humpback whales for δ15N, with females having generally lower values than males (Figure 2).
3.3 Isotopic niche variation
3.3.1 Temporal and inter-specific comparison of isotopic niches
Isotopic niche width, represented by SEAb, was consistently the smallest for humpback whales during our study period (Table 1, Figure 3). Nonetheless, niche breadth increased in both fin whales and humpback whales over the study period, with the largest increase noted between Period 2 and 3. Specifically, a 103% overall increase in niche breadth was noted for humpback whales from Period 1 to 3, including a 22% increase between Period 1 and 2, and a 66% increase between Period 2 and 3. For fin whales, the overall niche breadth increase was 49% from Period 1 to 3, with an increase by 18% between Period 1 and 2, and a 21% increase between Period 2 and 3. In contrast, niche breadth changed little in minke whales over the study period, with a 16% decrease in mean SEAb noted between Period 2 and 3 (Figure 3). Differences in SEAb were statistically significant for all species among periods (all p-values < 0.001), and among species within a given period (all p-values < 0.001).
Table 1
| Period | Specie | n | SEAb | LOC | CD | NND | |
|---|---|---|---|---|---|---|---|
| δ13C | δ15N | ||||||
| Period 1 (1992-2000) |
Fin whale | 76 | 1.41 (1.12-1.77) | -18.94 | 10.42 | 0.53 (0.30-0.88) | 0.46 (0.22-0.79) |
| Humpback whale | 38 | 0.63 (0.45-0.86) | -18.84 | 13.32 | 0.55 (0.27-0.94) | 0.56 (0.23-1.01) | |
| Period 2 (2001-2010) |
Fin whale | 169 | 1.66 (1.42-1.93) | -19.01 | 12.05 | 0.80 (0.63-1.01) | 0.42 (0.26-0.61) |
| Humpback whale | 201 | 0.77 (0.67-0.88) | -19.06 | 14.15 | 0.56 (0.40-0.78) | 0.36 (0.21-0.55) | |
| Minke whale | 77 | 1.67 (1.34-2.10) | -18.94 | 13.23 | 0.62 (0.32-1.01) | 0.60 (0.26-0.99) | |
| Period 3 (2011-2019) |
Fin whale | 157 | 2.01 (1.73-2.33) | -18.98 | 11.76 | 0.47 (0.32-0.65) | 0.30 (0.17-0.45) |
| Humpback whale | 226 | 1.28 (1.13-1.47) | -19.19 | 14.15 | 0.41 (0.29-0.55) | 0.26 (0.15-0.37) | |
| Minke whale | 163 | 1.44 (1.43-1.68) | -18.75 | 12.97 | 0.41 (0.26-0.58) | 0.25 (0.14-0.39) | |
Sample size (n) and Bayesian metrics of isotopic niche for fin, humpback and minke whales.
Mean values for the posterior distribution of the Bayesian standard ellipse area (SEAb), location of centroid (LOC) for δ13C and δ15N, centroid distance (CD) and nearest neighbor distance (NND) are reported for the three periods. Values in parenthesis represent the 95% credible interval.
Figure 3
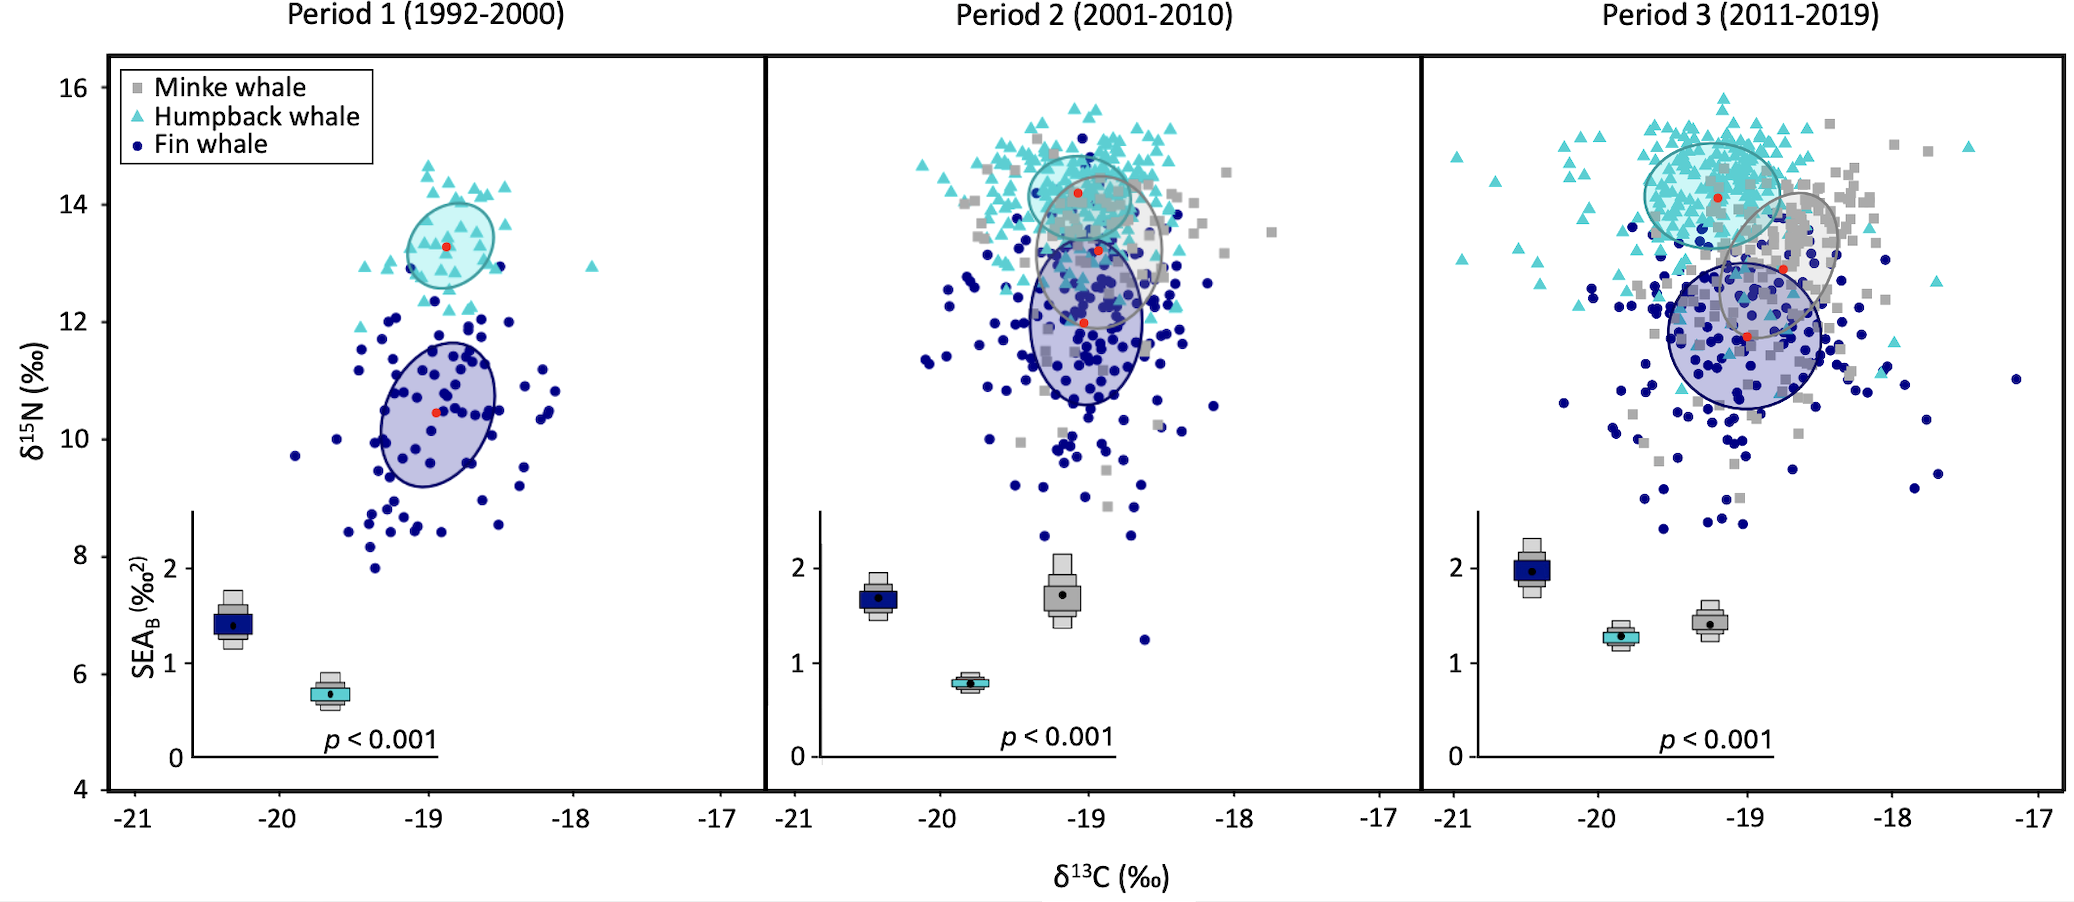
Core isotopic niche represented by the standard ellipse area (SEA), which includes approximately 40% of the individuals. The starting sampling year varied between species (1992 for fin whales, 1995 for humpback whales, and 2006 for minke whales). Modes for Bayesian standard ellipse area (SEAb) posterior distributions are represented by density plots showing the 50, 75 and 95% credible intervals. P-values represent PERMANOVA level of significance for the global comparison.
The location of centroids (LOC) differed significantly among species in each period (PERMANOVA and PAIRWISE comparisons, all p-values = 0.001; Table 1). Nevertheless, there was partial overlap in standard ellipses among species, indicating some degree of resource sharing. Mean overlap of SEAb between fin whales and humpback whales was negligible, ranging from 0% in Periods 1 and 3 to approximately 1% in Period 2. In contrast, minke whales exhibited the highest degree of overlap with other species throughout the study period (no data for Period 1). During Period 2, minke whales shared 65.6% of their core niche with fin whales (40.7%) and humpback whales (24.9%), whereas in Period 3, their niche overlap with these species represented 47.2% in total, corresponding to 39.2% with fin whales, and 8% with humpback whales. The overlap with minke whales represented a notable 55.8% of the smaller niche of humpback whales in Period 2, and 8.9% in Period 3. Fin whales, which shared their niche primarily with minke whales, exhibited a comparable degree of overlap with this species in Period 2 and 3, at 41.7% and 28.6%, respectively (Table 2, Figure 3). Among the three species, fin whales exhibited the largest deviations of individuals from centroids and thus, the biggest inter-individual variability in isotopic composition for all periods (Table 1).
Table 2
| Period | Species | Bp-Mn | Bp-Ba | Mn-Ba |
|---|---|---|---|---|
| Period 1 (1992-2000) | Bp | 0 (0) | – | – |
| Mn | 0 (0) | – | – | |
| Period 2 (2001-2010) | Bp | 0.6 (1.4) | 41.7 (8.5) | – |
| Mn | 1.3 (3.3) | – | 55.8 (15.3) | |
| Ba | – | 40.7 (8.5) | 24.9 (7.0) | |
| Period 3 (2011-2019) | Bp | 0 (0) | 28.6 (5.9) | – |
| Mn | 0 (0) | – | 8.9 (6.4) | |
| Ba | – | 39.2 (7.9) | 8.0 (5.9) |
Bayesian overlap area (%) of the core Bayesian isotopic niche (SEAb) relative to each species ellipse area for each pair of species across the three periods. Species are fin whales (Bp), humpback whales (Mn) and minke whales (Ba).
Values in parentheses are standard deviation (in %).
3.4 Diet estimation
3.4.1 Prey grouping
Seven potential prey species from the nwGSL and GoM/SS were considered to quantify the diet of rorquals. Prey with similar signatures were grouped a priori, resulting in five, seven and four different prey groups in Period 1, 2 and 3, respectively (Figure 4). The isotopic values of potential prey considered in this study changed notably during Period 3 compared to previous periods, leading to less differentiation among species and a need for further grouping. In addition, high negative correlations in estimated contributions were noted between some of the prey groups (Supplementary Figure S2), leading to a posteriori grouping and summing of their relative contributions. As a result, rorqual diet quantification is represented by four prey groups in Period 1, and six prey groups in Period 2. In Period 3, the final number of prey groups varied between species: four prey groups for humpback whales and three groups for minke whales and fin whales (Figure 5). Each prey group included one to five species. Complementary details on unaggregated data before prey groups were combined post hoc are shown in Figure 6.
Figure 4
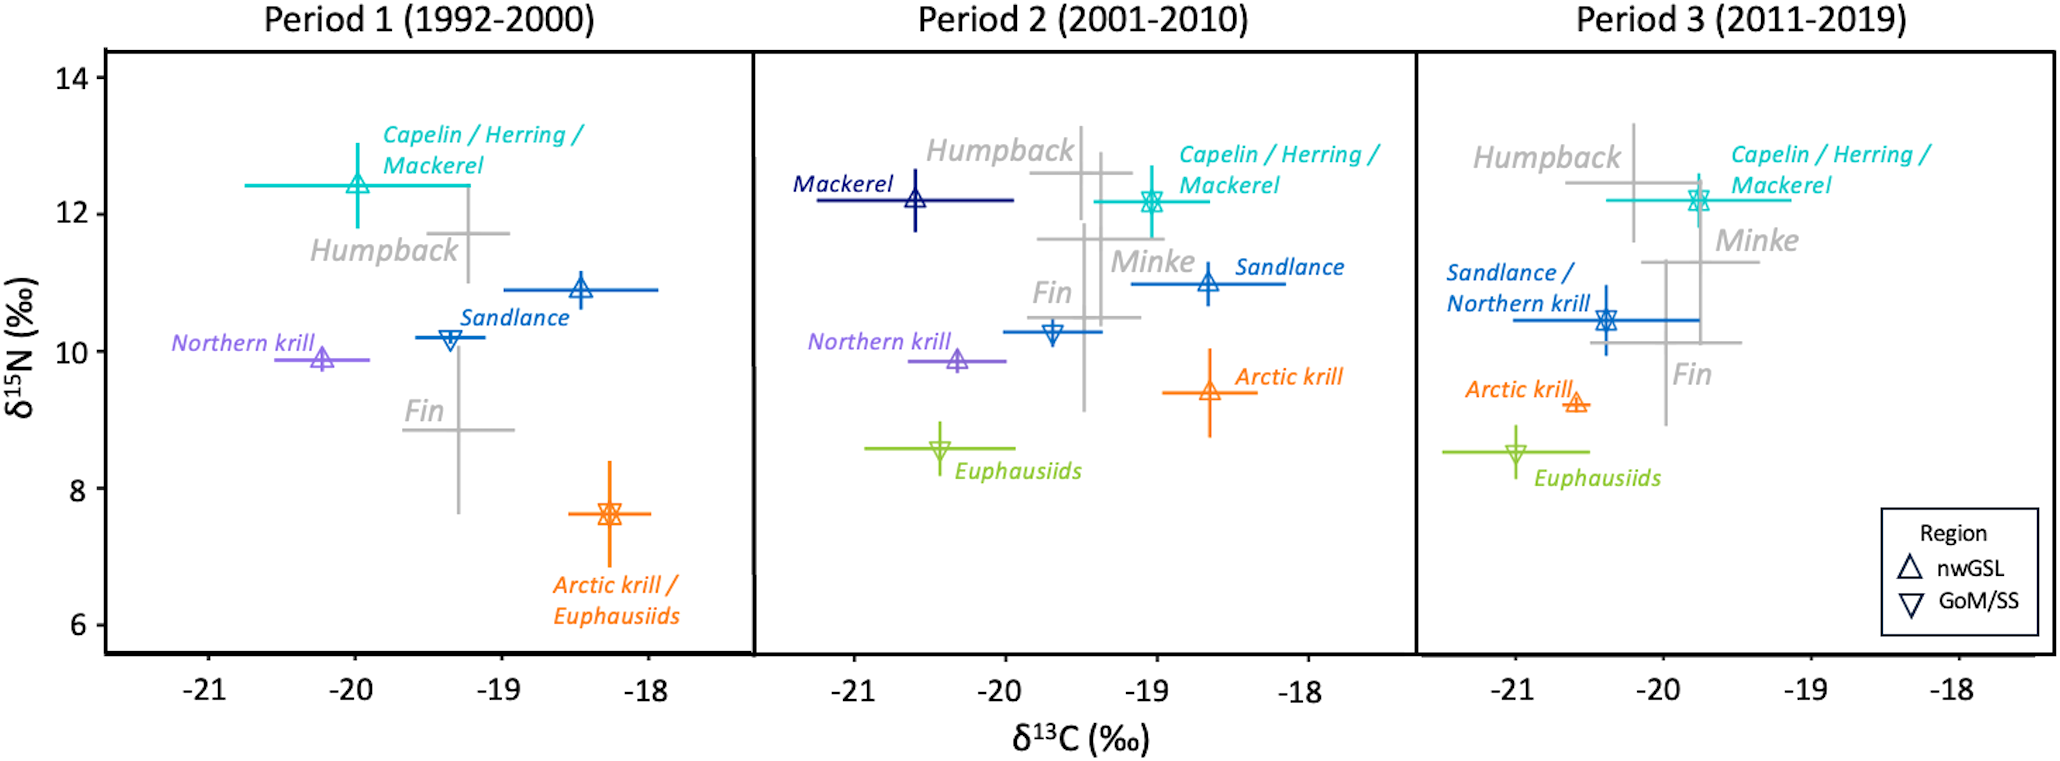
Mean and standard deviation (bars) of δ13C and δ15N values of potential prey or prey groups (when isotopically similar) from nwGSL (Δ) and GoM/SS (∇) and consumers (fin, humpback and minke whales) for the three periods. A trophic enrichment factor (1.01‰ of δ13C; 1.57‰ for δ15N) was applied to rorqual signatures.
Figure 5
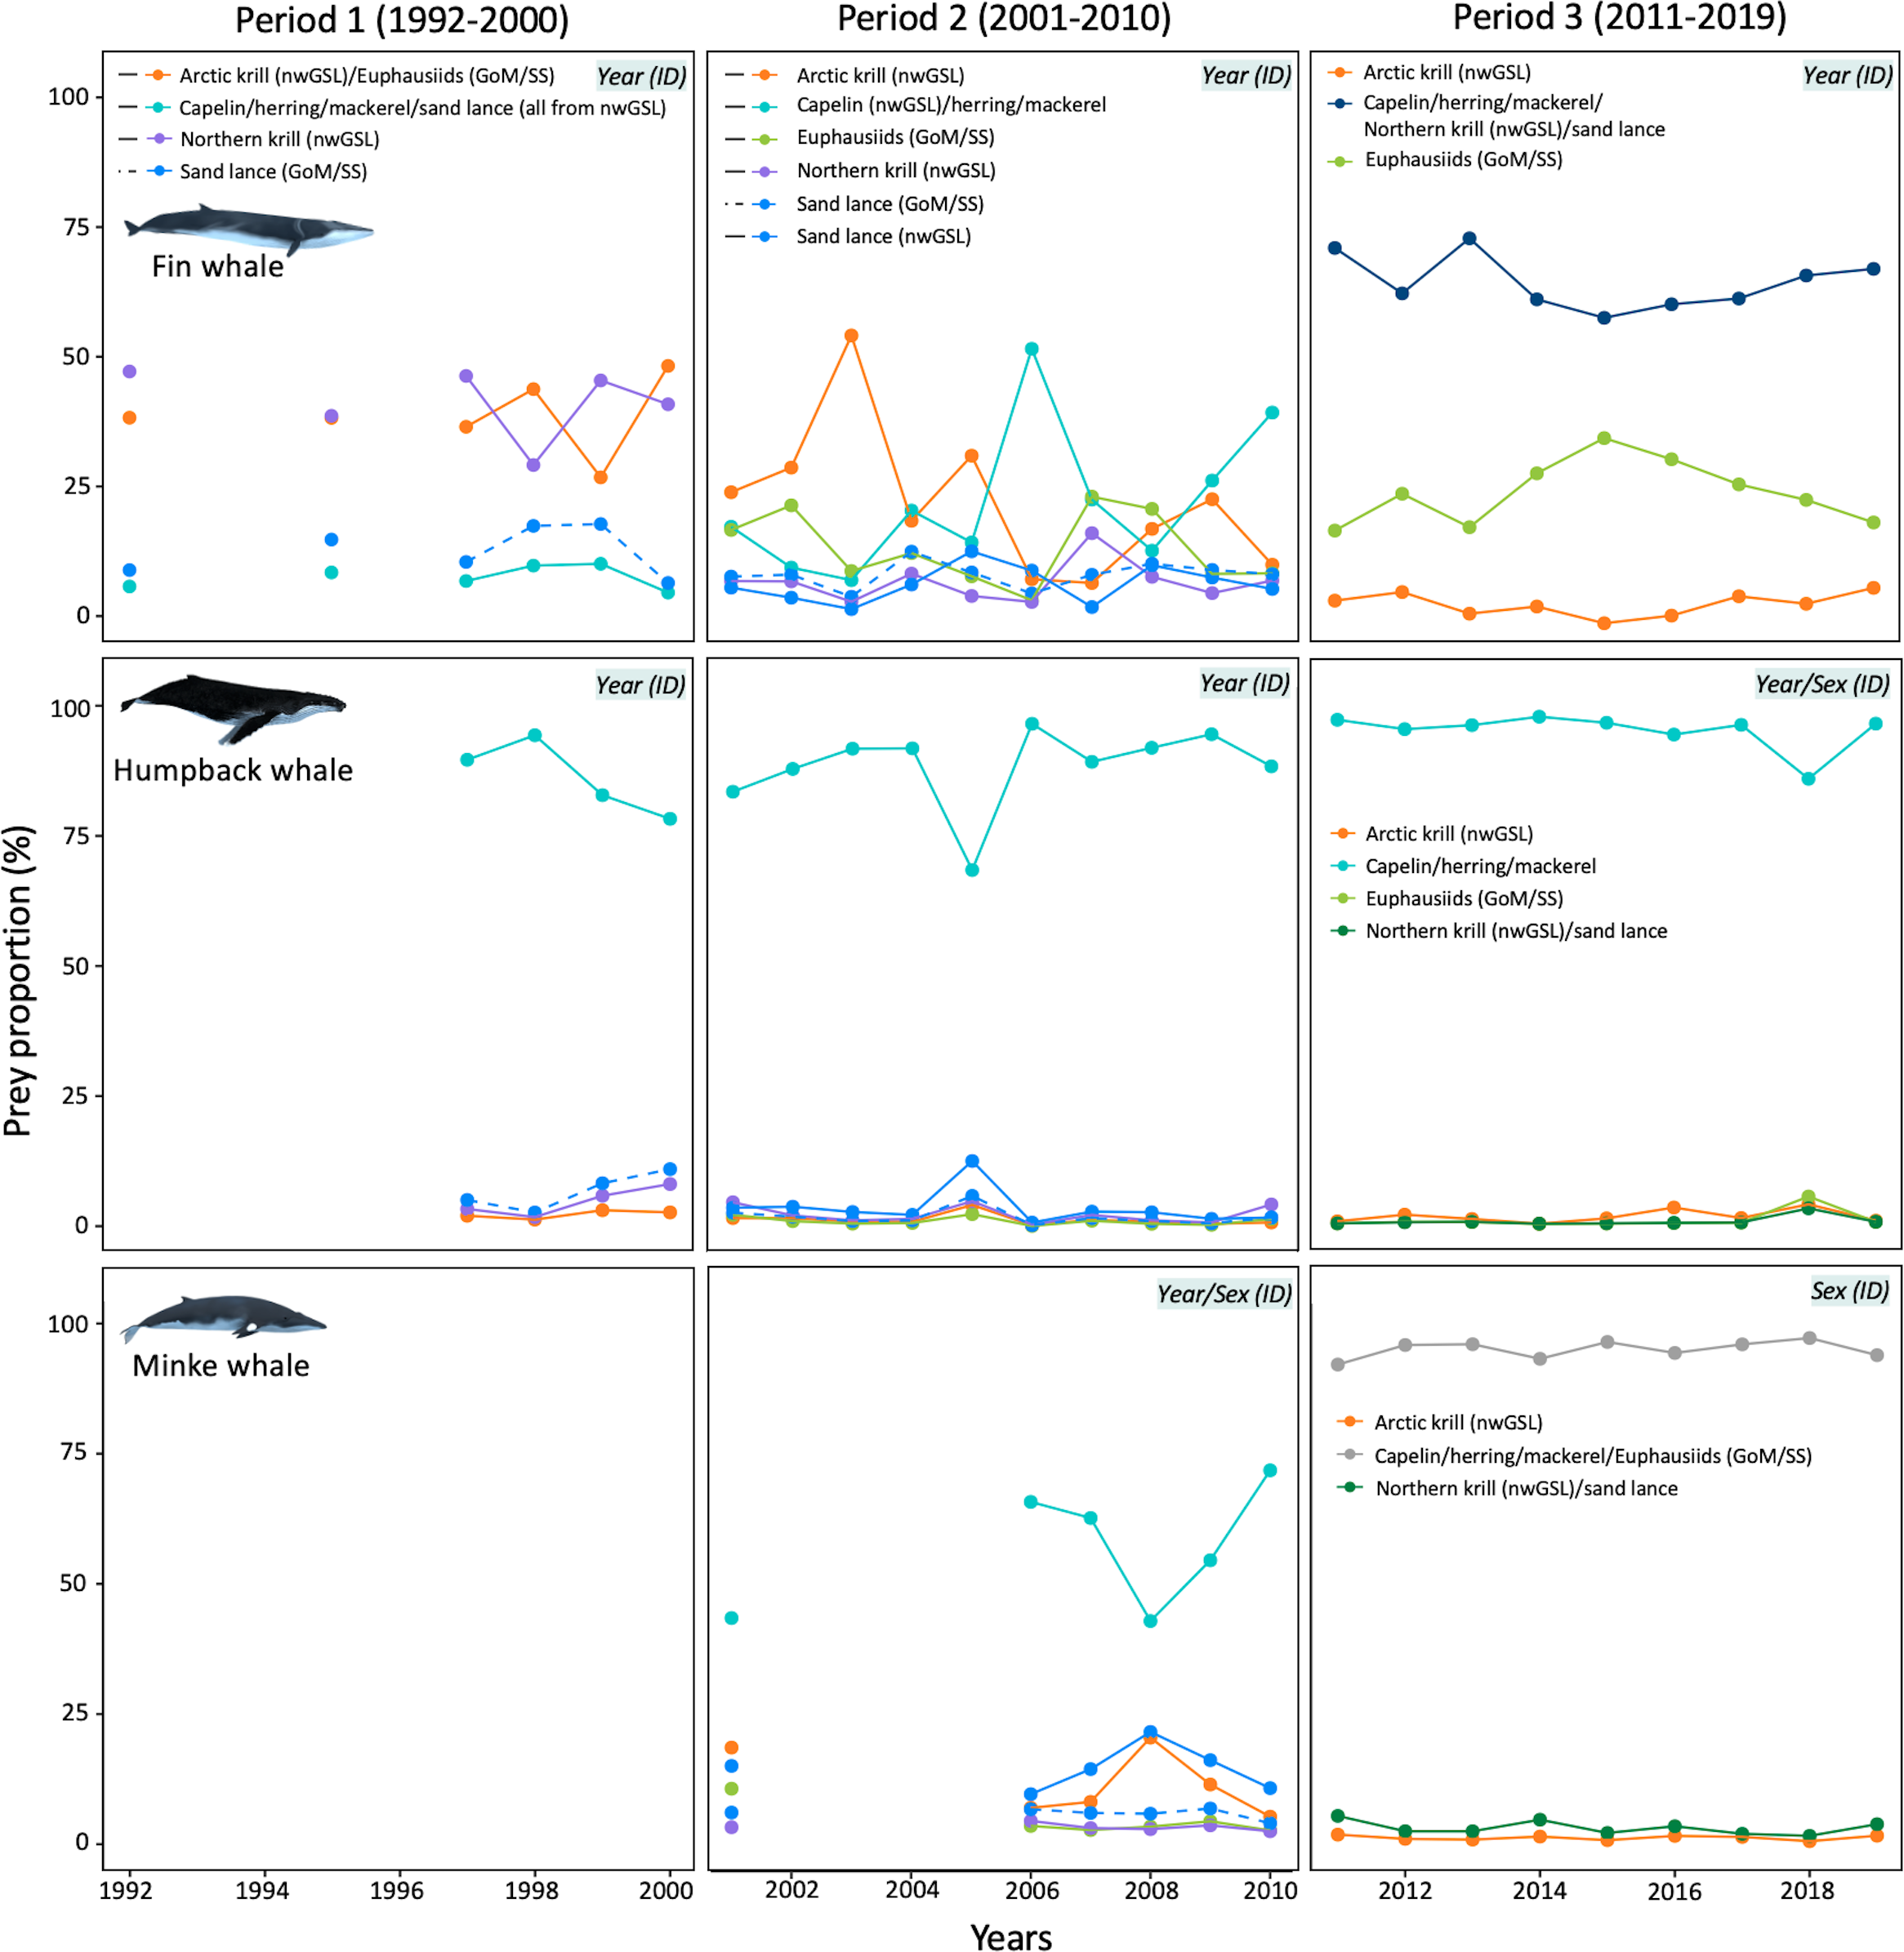
Trend in mean diet composition of fin whales, humpback whales and minke whales over the study period (1992–2019 for fin whales, 1995–2019 for humpback whales, and 2006–2019 for minke whales). Credible intervals, and sex effects were omitted for clarity (see Supplementary Figure S5 for diet composition per sex). A year effect was noted for all species except minke whale in Period 3. Nonetheless, results for the latter were presented per year for consistency with other species. Prey groups and associated contributions are the result of both a priori grouping of isotopically similar prey, and a posteriori grouping due to correlation in estimated contributions of prey to the diet. Prey were from the nwGSL and GoM/SS when location was omitted in the legend. Each graph displays the covariates included in the MixSIAR model (top-right corner).
Figure 6
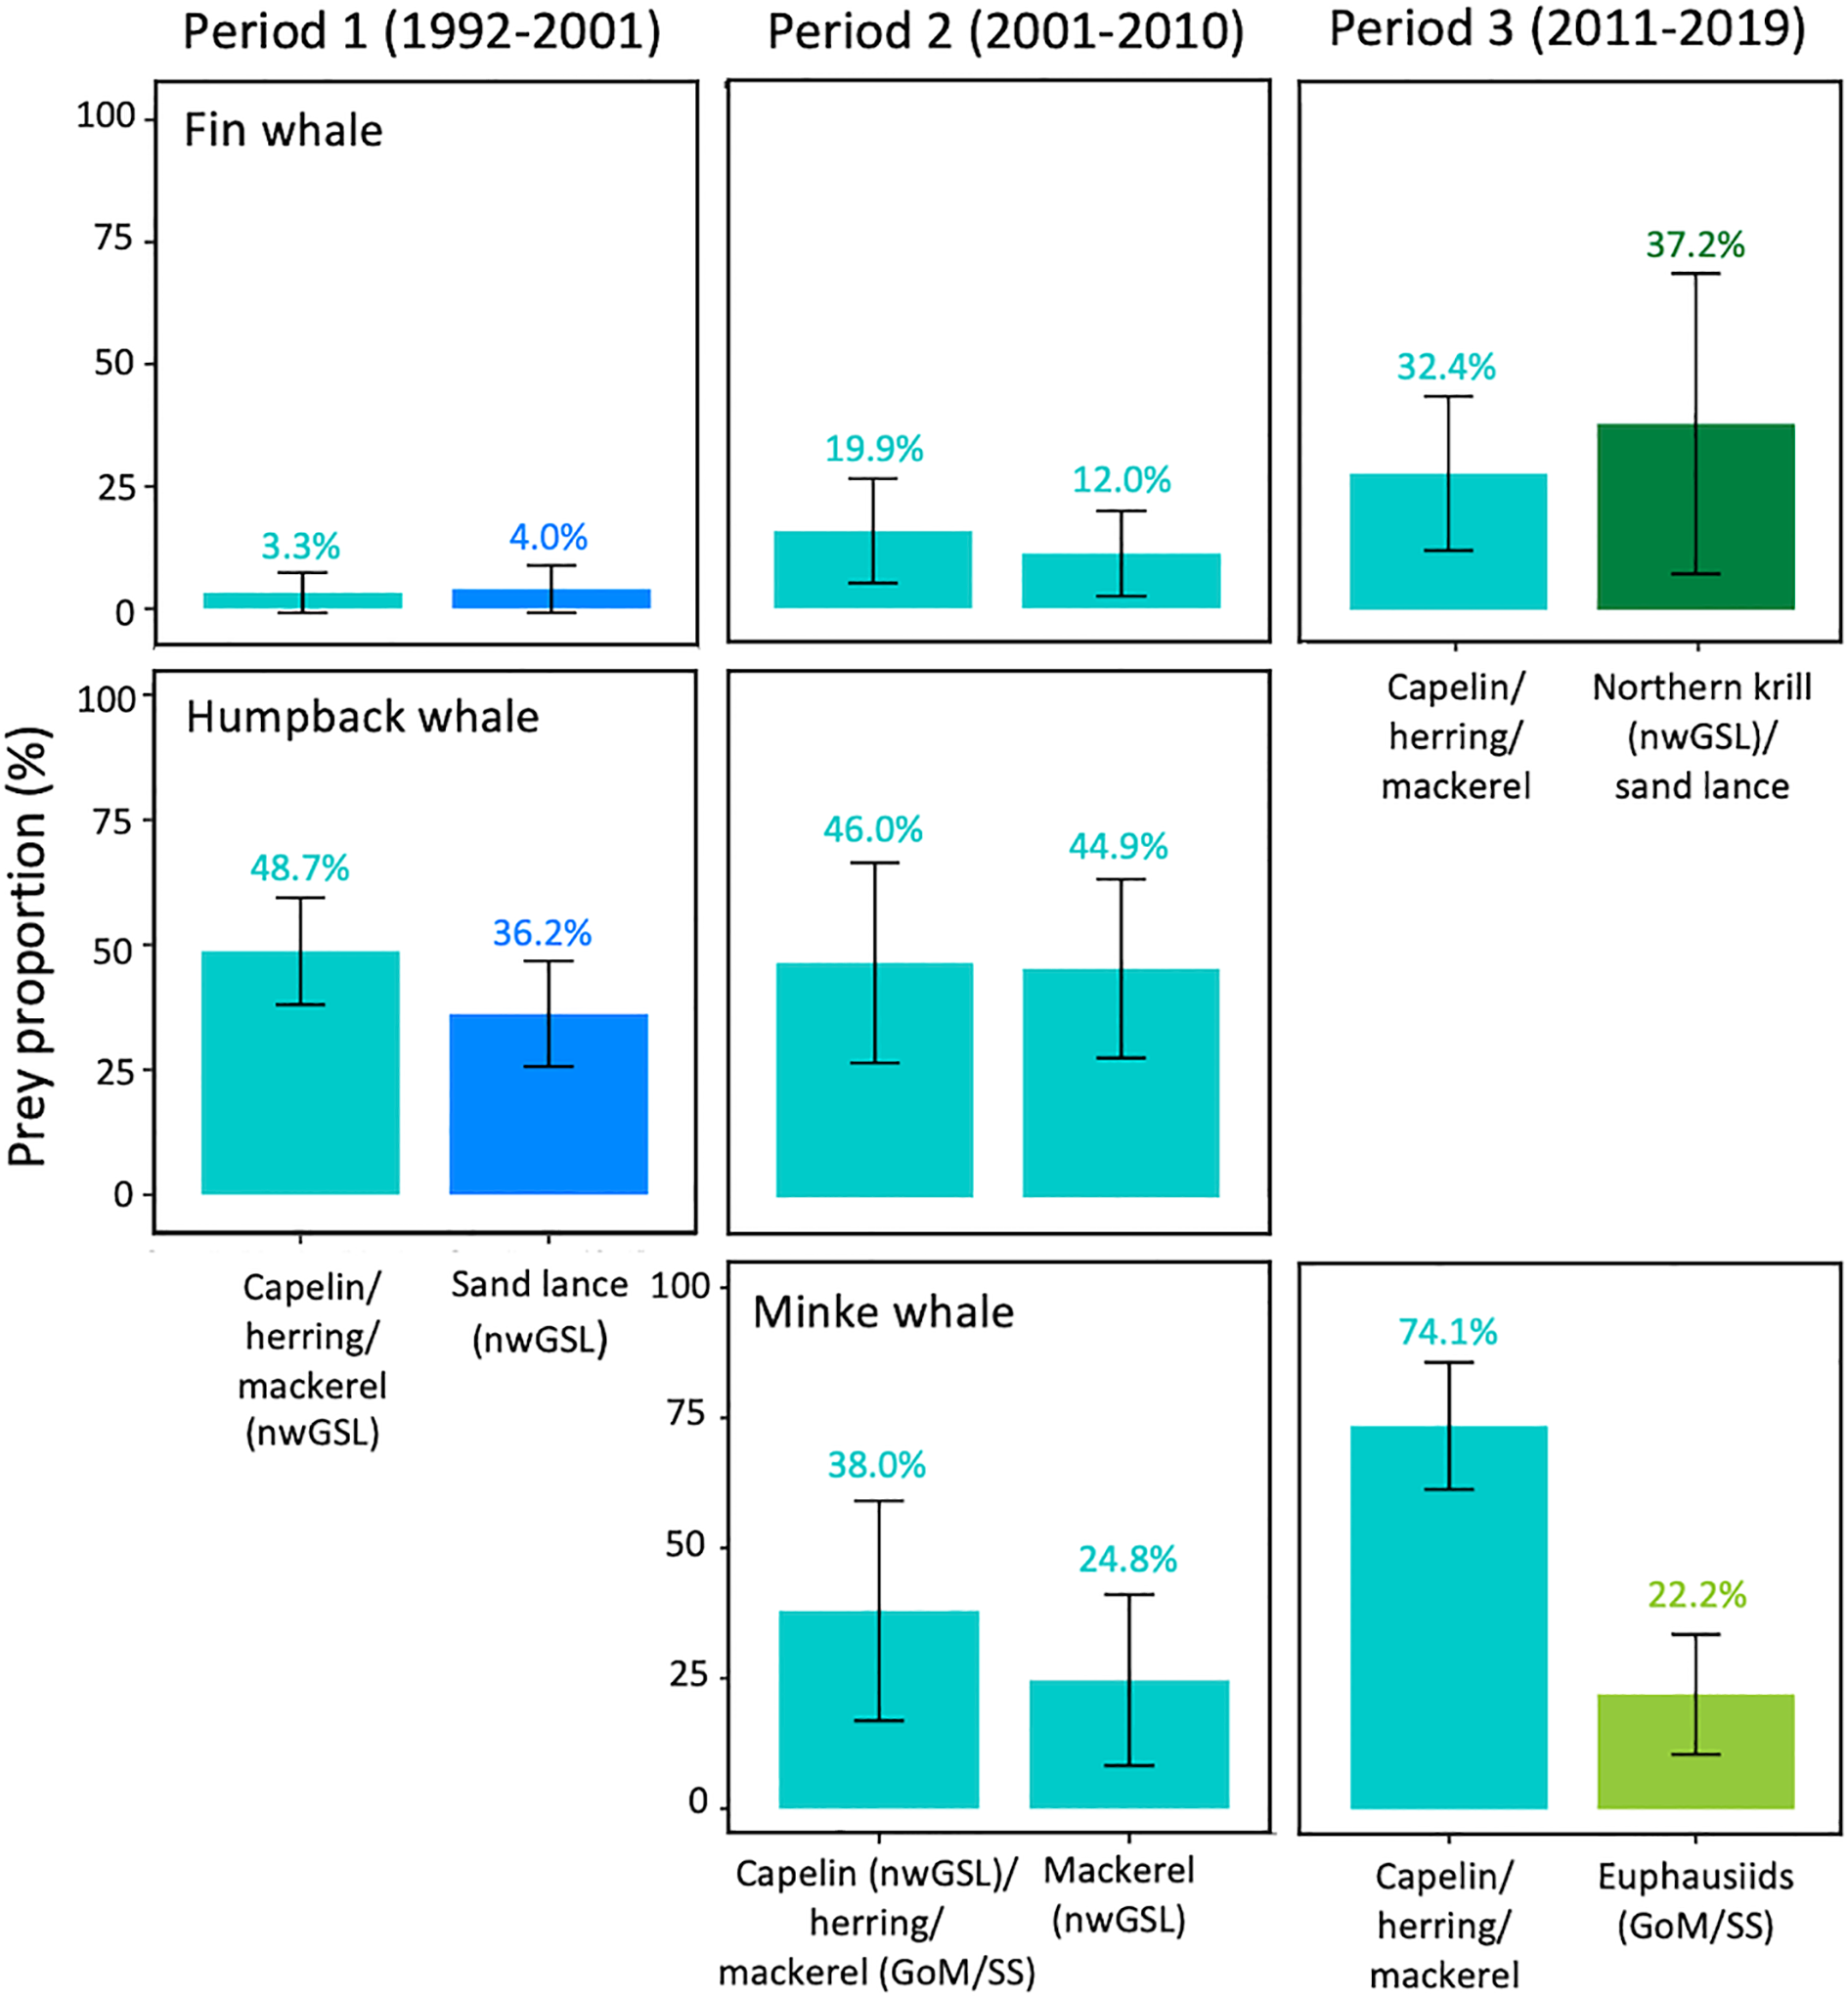
Original prey contributions to diet (% and SD) for rorqual species and periods requiring a posteriori aggregation due to inverse correlations in prey contributions (see Supplementary Figure S2). This figure shows unaggregated data before prey groups were combined post hoc.
The isotopic signatures of individual whales varied widely within periods, with some individuals falling outside the 95% mixing region (Supplementary Figure S3). While fin whales outside the mixing regions were generally below it, humpback whales and minke whales showed the opposite pattern. Using different trophic enrichment factors for δ15N would not resolve this issue, suggesting that whales may have fed on unsampled prey, in unsampled environments or are in varying physiological state (see Discussion). Therefore, diet estimation results should be interpreted with caution.
3.4.2 Model selection for predicting diet
The mixing model predicting fin whale diet using year as a covariate and Individual ID as a random effect was selected as it was within 2 dLOOic from the best model in Period 1, the model with the lowest dLOOic in Period 2, and the second best model in Period 3 with a dLOOic eight units higher than the best model (see Akaike weights, Supplementary Table S4). In the latter case, the best model did not include individual ID as a random effect, a requirement for estimating diet on an individual basis. Plotting results for the best and second best model for Period 3 indicated similar mean annual diet composition for fin whales (Supplementary Figure S4), suggesting there was no substantial bias in diet estimation introduced by our model selection.
For humpback whales in Period 1 and 2, diet composition was also best predicted using year as a covariate and individual ID as a random effect (Supplementary Table S4). However, sex was included as an additional covariate to explain diet composition in Period 3.
For minke whales, top models for both Period 2 and 3 (Period 1 absent) consistently included individual ID as a random effect (Supplementary Table S4). The model with the lowest dLOOic included sex by year (Year/Sex) for Period 2, and only sex for Period 3.
3.4.3 Temporal trends in diet composition
Isotopic mixing models indicated significant differences in diet composition among years for all periods and species (PERMANOVA; all p-value ≤ 0.01) except for minke whales in Period 3 (PERMANOVA; p > 0.05; Figure 5). During Period 1 (1992–2000), fin whale diet was dominated by an equal contribution of Northern krill from the nwGSL, and a group consisting of Arctic krill from the nwGSL and euphausiids from the GoM/SS. Krill from these two groups represented 25–50% of the diet depending on years, for a mean contribution of 40.3 ± 10.7% and 40.3 ± 8.4%, respectively. In Period 2 (2001–2010), Northern krill (nwGSL) and euphausiids (GoM/SS) both decreased to less than 14% in fin whale diet. Arctic krill (nwGSL) still stood out as important until 2006 (mean of 22.4 ± 11.5% of the diet), when the fish group consisting of capelin (nwGSL), herring and mackerel became more important from that year (mean of 31.9 ± 12.5% of the diet). In Period 3 (2011–2019), when fin whale diet composition could only be estimated from three potential prey groups, fin whales fed little (5.8 ± 9.5%) on Arctic krill from the nwGSL, and took most of their prey (69.6 ± 19.3%) from a group consisting of capelin, herring, mackerel, Northern krill from nwGSL and sand lance (Figure 5). Within that group, contributions prior to a posteriori aggregation were slightly higher for Northern krill (nwGSL) and sand lance (37.2%) than for capelin, herring, and mackerel (32.4%; Figure 6).
Humpback whales were mainly fish eaters. During Period 1 (1992–2000), they depended highly on capelin, herring and mackerel, all from the nwGSL (mean contribution of 48.7 ± 10.7%), and on sand lance also from the nwGSL (mean contribution of 36.2 ± 10.5%; Figures 5, 6). In Period 2 (2001–2010), capelin from the nwGSL, herring and mackerel (from the nwGSL and GoM/SS) dominated the diet (mean contribution of 90.8 ± 6.4%). The contribution of this multi-species group increased over time in humpback whale diet, with a mean of 96.8 ± 4% in Period 3 when considering both sexes combined (Figure 5). During the latter period, sex differences in diet composition mainly stem from one year (2018) where females consumed less capelin, herring and mackerel and more of the other prey groups.
Minke whales were not sampled in Period 1. In Period 2, they predominantly consumed capelin from the nwGSL, and herring, and mackerel (from the nwGSL and GoM/SS; 62.7 ± 17.7% of their diet), although sand lance and Arctic krill, both from the nwGSL, also contributed to the diet but to a lesser extent. For the two years where both males and females were sampled, females tended to consume more capelin (from the nwGSL), herring and mackerel (from the nwGSL and GoM/SS) than males, with the latters consuming more Arctic krill (from nwGSL) (Supplementary Figure S5). During Period 3, minke whales consumed almost exclusively prey from the group capelin, herring, mackerel and euphausiids from GoM/SS. Contributions prior to a posteriori grouping suggest that capelin, herring and mackerel were the prey group likely contributing the most to minke whale diet (74.1%; Figure 6). While a sex effect was noted for Period 3, none was apparent from mean diet proportions (Supplementary Figure S5).
3.5 Individual diet specialization
Individual specialization index () are shown by species for Period 1, 2, and 3 (Figure 7). Overall, the degree of specialization increased over time in fin whales and, to a lesser extent, in minke whales, while humpback whales remained in the ultra-specialist class throughout the study period. Comparison between periods must be done with caution given that different number of prey groups were used to calculate the specialization index, limiting comparisons among species only within each time period. In Period 1 (1992–2000), humpback whales were in the specialist and ultra-specialist range as they were feeding mostly on capelin, herring and mackerel. Fin whales showed intermediate values during this period, i.e., a majority of individuals were neither particularly specialist or generalists. A similar tendency although more accentuated was noted during Period 2 (2001–2010), with several fin whale individuals showing a generalist strategy (58.2% of individuals with a < 0.3), and a majority of humpback whales (92.5%) being either specialists ( > 0.7) or ultra-specialists ( > 0.9). Minke whales had relatively intermediate and highly variable values among individuals (range: 0.24–0.71), with a small portion of the individuals (11%) being either generalist ( < 0.3) or specialist ( > 0.7). In Period 3, only three (fin whales and minke whales) and four (humpback whales) prey groups resulted from the models, which likely enhanced the potential for specialization. During this period, individuals from all species showed intermediate or high specialization indices, with humpback whales and minke whales falling in the ultra-specialist categories (Figure 7). Fin whales all had notably lower values, with a population mean of 0.54 ± 0.05, compared to 0.94 ± 0.05 and 0.95 ± 0.04 for humpback whales and minke whales, respectively (Figure 7).
Figure 7
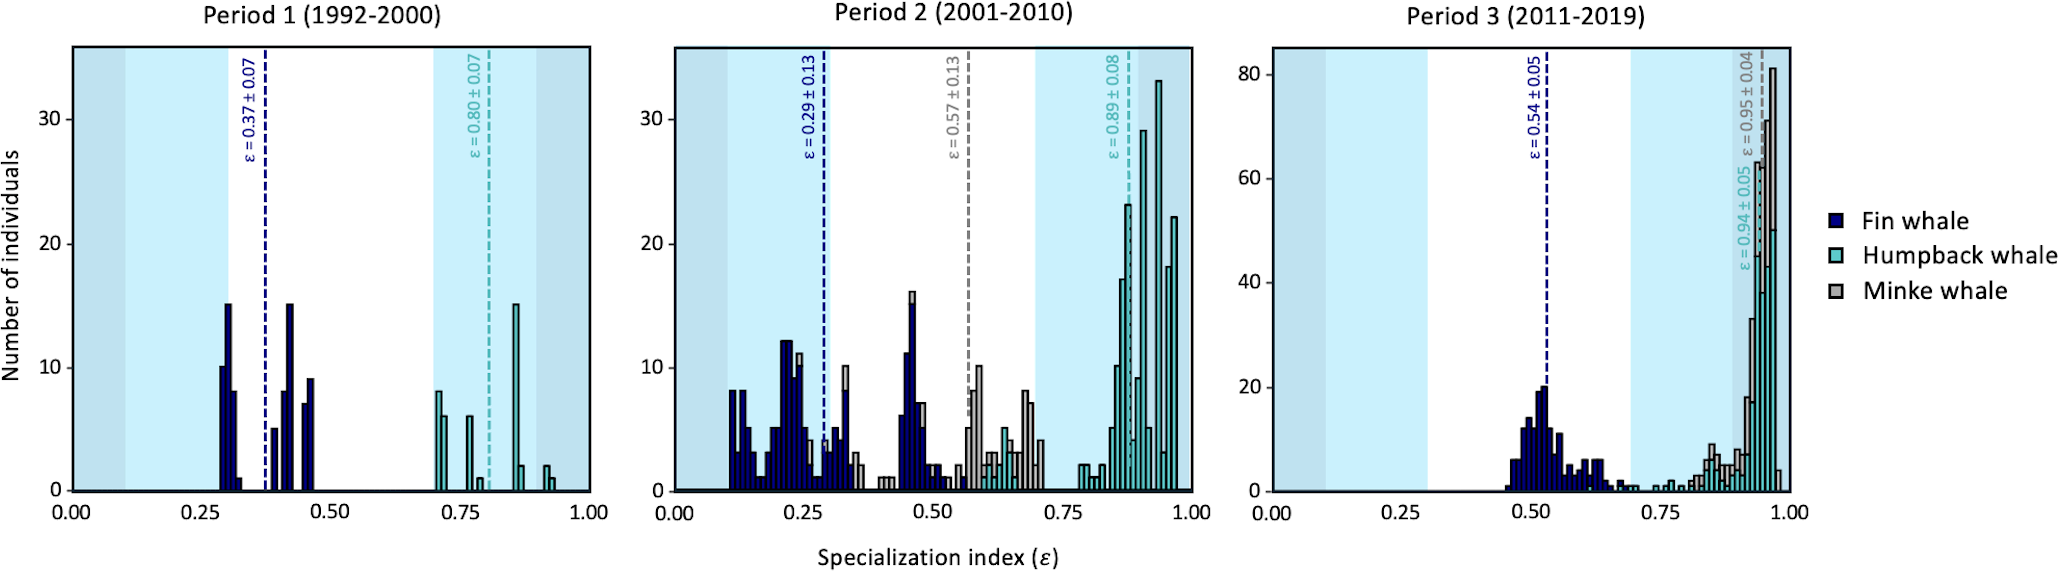
Frequency distribution of individual specialization index () for fin whale and humpback whale for Period 1 (1992–2000), and for fin whale, humpback whale and minke whale for Period 2 (2001–2010) and Period 3 (2011–2019). Sample means (dotted line) and standard deviations are shown for each species. Darker blue background indicates ultra-generalist (0-0.1) and ultra-specialist (0.9-1) ranges. Lighter blue background indicates generalist (0.1-0.3) and specialist (0.7-0.9) ranges.
Sex was a significant covariate in the top mixing models (within 2 dLOOic of best) for Period 3 in humpback whales, and for Period 2 and 3 for fin whales and minke whales (Supplementary Table S4). However, statistical differences in the specialization index were noted only in fin whales during Period 2 (PERMANOVA Period 2 F1,164 = 6.37, p = 0.02, R2 = 0.04), with males showing slightly higher values than females (Period 2 Female = 0.27 ± 0.12, Male = 0.31 ± 0.13).
4 Discussion
This study, spanning nearly 30 years for some of the species, indicates that three sympatric rorqual species using the Gulf of St. Lawrence have adapted to some extent to a period of climatic and ecosystemic change by modifying their diet and individual degree of dietary specialization. While humpback whales depended largely on fish and fin whales relied more heavily on euphausiids, all three species increased dependency on pelagic fish species during the study period. However, overlap in trophic niche remained partial (i.e., minke whales with fin whales and humpback whales) or nearly non-existent (i.e., fin whales vs. humpback whales), suggesting that resource partitioning persisted among these closely related species.
Rorquals are migratory species and capital breeders, with a capacity to separate feeding from reproduction (Lockyer and Brown, 1981). As a result, rorquals sampled in the GSL may have fed outside this region, with isotopic signature from other foraging areas persisting for some time in their skin and potentially affecting the results. Similarly, fasting during migration or while on breeding grounds could also result in residual enrichment of δ15N values (Martínez del Rio et al., 2009). Isotopic baseline of ecosystems and prey signatures can also vary over time. Ideally, potential prey would be sampled across the entire feeding range, and consistently over 28 years, but this was not logistically or financially possible. Alternatively, the study period was split to match major oceanographic changes documented in the St. Lawrence ecosystem, and prey from other potential feeding areas were included into the models. However, isotopic data remain scarce for other marine ecosystems of the Northwest Atlantic, potentially explaining why some individuals fell outside the prey mixing polygons (Supplementary Figure S3).
Estimating diet of generalist feeders using isotopic mixing models is challenging, especially if potential prey are numerous or isotopically similar. These conditions trigger a need for further selection among potential prey or a priori grouping of isotopically similar prey (see Phillips et al., 2014). This is why the use of period-specific prey to account for potential changes in baseline led to a temporal change in the number of prey groups included in the final models. In fact, an increased similarity and reversed correlations among prey groups were noted, especially during Period 3, necessitating a posteriori aggregation. This might have inflated proportional contributions of the negatively correlated groups due to the combination of prior weights given to a priori groups (Stock et al., 2018). Furthermore, this reduction in number of prey groups artificially increased the specialization indices by limiting the number of groups to draw contributions from. Given these groupings varied among periods, a direct comparison of the degree of individual specialization is possible only among species within a period, and should be avoided among periods. Despite these limitations, clear general patterns emerged from our data, providing valuable information about rorqual diets and their capacity to adapt to environmental change.
4.1 Dietary change over time
4.1.1 Fin whale
In the North Atlantic, fin whales are often described as being primarily zooplankon-eaters (Nemoto, 1959; Witteveen and Wynne, 2016; Silva et al., 2019; Garcìa-Vernet et al., 2021). However, schooling fishes are known to occupy a significant part of their diet in certain areas (Kawamura, 1980; Ryan et al., 2014; Aguilar and Garcia-Vernet, 2018), although sometimes only later in the year (Rita et al., 2023). In the GSL, fin whales fed primarily on krill in the 1990s, but then shifted to a more generalist diet with the inclusion of more forage fish (capelin, herring and/or mackerel) during the 2000s, and more sand lance and/or northern krill in the 2010s. This shift coincided with a decreasing krill availability in the North Atlantic (Edwards et al., 2021). With a generally large isotopic niche area throughout the study period, and various contributing taxa to their diet, fin whales from the nwGSL can be considered as generalists both at the individual and populational level, acknowledging GSL fin whales may or may not represent a distinct population from the rest of the North Atlantic (Ramp et al., 2024). Variability in the specialization index among individuals suggests not all fin whales consumed the same set of prey groups (i.e., fish vs zooplankton), a finding consistent with the specialization indices obtained for fin whales sampled in the estuarine portion of the St. Lawrence (Cabrol et al., 2021), and with previous suspicions (e.g., Gavrilchuk et al., 2014; Witteveen and Wynne, 2016). While their degree of specialization increased during period 3, fin whales showed a lesser degree of specialization than the other two species, with indications of krill consumption on the SS or in the GoM during that period. The occurrence of some fin whales mainly below the mixing polygon suggests a potential underestimation of zooplankton consumption, likely in unsampled regions. This hypothesis is supported by isoscape modelling of copepod δ15N values across the North Atlantic, and by krill sampling around the Azores in the mid-Atlantic, both of which indicate lower δ15N values for zooplankton in oceanic and mid-Atlantic waters (Silva et al., 2019; Espinasse et al., 2022). The spring distribution of fin whales beyond the shelf edge in the Northwest Atlantic remains largely undocumented (Davies et al., 2020; Delarue et al., 2022). However, fin whales from the GSL have been tracked performing area-restricted search, a proxy for foraging-like behavior, in open-ocean water at lower latitude in late fall and early winter, although never in mid-Atlantic waters (Ramp et al., 2024). Overall, these results suggest that zooplankton consumption by fin whales was likely underestimated across all three periods, as they might have carried an oceanic consumption signal for this type of prey that was undetected in our models.
4.1.2 Humpback whale
With their relatively small niche breadth (SEAb) and high trophic position, humpback whales sampled in the nwGSL largely depended on a small set (one to three) of fish species throughout our study period: capelin, herring and/or mackerel. These results are consistent with the piscivorous tendency of humpbacks elsewhere (Ryan et al., 2014; Witteveen and Wynne, 2016), including coastal Newfoundland (eastern Canada), where capelin accounted for ~90% of their diet (Johnson and Davoren, 2021). The parallel increase noted in niche breadth and reliance on a single prey group seems contradictory to the principle that specialists have narrower trophic niche (Krebs et al., 1993). Given the prey group that humpback whales exploited was composed of three species that were similar but not identical isotopically, it is possible that during the most recent period, humpback whale individuals focused on different prey species within that group, increasing inter-individual variability and trophic niche breadth. Because several individual humpback whales were above the mixing polygon, it suggested an underestimated consumption of fish species at higher trophic levels, e.g., small arctic cod (Boreogadus saida) or Atlantic cod (Gadus morhua) (Lesage et al., 2001). Samples for these species were unavailable for the study period and though, could not be tested. Further sampling and the use of complementary ecological tracers such as fatty acids may be required to improve our understanding of diet composition and inter-individual variability in prey selection in this fish specialist (e.g., Iverson et al., 2004; Budge et al., 2006).
4.1.3 Minke whale
Minke whales were intermediate in trophic position between fin whales and humpback whales, and fed primarily on small pelagic fish species, although Arctic krill from the nwGSL (Period 2) and euphausiids from the GoM/SS (Period 3) were also consumed in smaller amounts. This dietary pattern aligns with findings from the Northeast Atlantic, where studies report a diet composed mainly of fish, supplemented with krill (Neve, 2000; Windsland et al., 2008; Eerkes-Medrano et al., 2021). Morphology of the minke whale feeding apparatus, which allows for a lesser engulfment capacity than that of Antarctic minke whale feeding exclusively on krill, appears better adapted to fish consumption (Nishimura et al., 2021). Recent research in the Barents Sea indicates that minke whales eating fish may accumulate more energy than krill-focused individuals (Haug et al., 2024). Minke whales are known for their dietary flexibility (Haug et al., 2024), and the population visiting the nwGSL seem to be no exception. Their large inter-individual variability in specialization index depicts feeding strategies varying from generalism to specialism among individuals. Minke whales exhibited a niche breadth comparable to that of fin whales, except in Period 3 when niche breadth expanded for fin whales, and decreased slightly for minke whales. An increased focus of minke whales on fish prey during Period 3, with little contribution from euphausiids, appears to be responsible for the reduction in niche breadth and increased degree of specialization during this period. Again, grouping of multiple species in a single isotopic group impaired our ability to identify the specific fish taxa consumed within that group. A seasonal change in prey species targeted is also plausible, as observed in other regions (e.g., Macleod et al., 2004; Tamura and Fujise, 2002), although hard evidence of this for minke whales in the GSL is currently lacking. As for the other two rorqual species, some individuals fell above (mostly) or below the mixing polygon in Period 3, suggesting a potential bias in diet composition. Little is known about seasonal movement and distribution of minke whales in the Northwest Atlantic, although they are suspected to undertake north-south seasonal movements (Risch et al., 2014). The importance of oceanic feeding cannot be ascertained based on isotopic results alone for this species.
4.2 Sex-related patterns
All three species of rorquals exhibit minor sexual dimorphism, with females being generally slightly larger than males (Ralls, 1976). This sexual dimorphism may affect aerobic dive limit and prey access, and multiple other aspects of rorqual ecology, including timing of migration (Brown et al., 1995; Stevick et al., 2003; Craig et al., 2003; Franklin et al., 2017), vocalizations (Croll et al., 2002; Herman, 2016; Indeck et al., 2021) and habitat use (Laidre et al., 2009; Irvine et al., 2019). Some of these differences might arise from varying energetic demands between gender associated with reproductive status (Würsig et al., 2023), or from the need of pregnant females or cow-calf pairs to avoid males or predators (Laidre et al., 2009; Craig et al., 2014; Indeck et al., 2021).
For diet, a larger body size may allow a sex or age class to reach deeper depths or to ingest larger prey than smaller conspecifics (e.g. McIntyre et al., 2010; Louis et al., 2021). While occupation of higher trophic levels by females than males would be expected in our three rorqual species based on sexual dimorphism, the reverse was observed, with females generally having slightly lower δ15N values compared to males when a sex difference was noted over the study period. Because rorquals feed on zooplankton and small forage fish that are accessible to both sexes, the concept of differential access to larger prey based on body size may not apply. Our diet composition estimations suggest that the slight differences observed in isotopic signatures between sex classes did not result in striking differences in prey selection or levels of consumption, supporting equal access to prey in our study environment. However, differences in diet composition may arise from spatial segregation among sex. For instance, a clear latitudinal segregation by sex has been documented for minke whales in the North Atlantic (Born et al., 2003; Laidre et al., 2009, this study, Gardiner et al., 2025), with documented effects on diet composition in some cases (Haug et al., 2002). No such clear effects on diet have been documented in fin or humpback whales, although biased sex ratios exist for humpback whales in some regions (Weinrich and Kuhlberg, 1991). In minke whales sampled in the nwGSL where females largely dominate, females were found to occupy higher trophic positions than males in a study using part of our dataset (Gavrilchuk et al., 2014), a finding consistent with females consuming larger proportions of fish than zooplankton compared to males (this study). Whether this differential consumption arises from sex segregation within the nwGSL or elsewhere prior to their arrival in the GSL is unknown. A study from the mid 2000s examining this question in our sampling area (nwGSL) failed to detect a spatial segregation for any of the three rorquals species (Doniol-Valcroze, 2008). Whether such segregation emerged since then in the nwGSL cannot be excluded.
4.3 Resource partitioning
According to the niche overlap hypothesis (Pianka, 1972), overlap in ecological niches inversely correlates with competition intensity. This rationale is supported by numerous studies showing that overlap between sympatric predator changes with prey availability (e.g., Pianka, 1974; Croxall et al., 1999; Barger and Kitaysky, 2012). Niche overlap tends to increase when resources are sufficiently abundant to limit competition, allowing the exploitation of the same prey by many species (MacArthur and Levins, 1967; Schoener, 1982). By the same principle, scarce resources can lead to lesser niche overlap to limit interspecific competition, enabling similar species to coexist on the long-term (Polechová and Storch, 2019). However, it is noteworthy that isotopic niche breadth (i.e., SEAb) and overlap alone cannot inform on competition levels per se, as they represent the balance between intraspecific and interspecific competition, each exerting opposite effects on niche breadth (Abrams, 1980). Specifically, interspecific competition tends to restrict niche breadth while intraspecific competition tends to expand it.
In our study, niche overlap among species was maximal in Period 2 (2001–2010), with a decrease observed during Period 3 (2011–2019; Figure 3, Table 2). In the GSL, the abundance of capelin, herring, mackerel and krill is estimated to have decreased in recent years (Boudreau et al., 2023; DFO, 2022; Smith et al., 2022; Edwards et al., 2021), suggesting a decrease in the availability of several potential prey for rorquals. According to the niche overlap hypothesis, resource limitation in recent years has likely increased competition, leading rorqual species, especially minke whales, to increase dietary segregation to limit this competition, thereby reducing their niche overlap. The niche of minke whale showed the most overlap with the niche of the other species, suggesting they are the most likely to be affected by interspecific competition. This hypothesized increase in interspecific competition does not consider other potential competitors of rorquals that have exhibited a growing presence in the ecosystem, such as striped bass (DFO, 2023), redfish (Senay et al., 2021) and several species of seals (Hammill et al., 2021; Mosnier et al., 2023), and that might also have affected the niche dynamics and trophic structure of the ecosystem.
The absence of overlap between the core isotopic niche of fin and humpback whales indicates clear niche segregation and reinforces the notion of partitioning of resources within the GSL. This lack of overlap contrasts with recent dietary studies of the same species in the Azores area (Lebon et al., 2024). Minke whales and humpback whales in our study showed differentiated niche position in the isotopic space, and exhibited minimal overlap in the recent period, despite the fact that both species relied increasingly more on lipid-rich pelagic fish such as capelin, herring and mackerel over time. These findings suggest that minke and humpback whales may consume different proportions of each species within this prey group, that were not possible to detect in our study given the isotopic resolution among prey and prey pooling. It also supports a potentially reduced availability of krill in the North Atlantic (Edwards et al., 2021). Change in resource consumption is one of many strategies to avoid competition; others include shifts in feeding grounds (Davis et al., 2020), or changes in temporal (Ramp et al., 2015) or spatial use of feeding areas (Doniol-Valcroze et al., 2007). However, our study context did not allow sufficient resolution to explore this fine-scale segregation.
At the intra-population level, the relatively larger niche breadth of fin whales, and the presence of sexual disparity in specialization index indicate variability in the population, which may reveal stronger intraspecific competition relatively to interspecific competition in comparison with the other species. The niche breadth expansion of fin whales in Period 3 (2011–2019), and the variability in individual feeding strategies (ϵ) highlighted greater variability in prey consumption between individuals during a time thought to be food limited. When preferred resources are scarce, individuals might expand their niche to consume unutilized resources (Araújo et al., 2011). The observed increase in fin whale niche breadth was concomitant with diminishing krill availability in the North Atlantic (Edwards et al., 2021), a lipid-rich prey that we found was highly consumed by fin whales in the GSL in the 1990s. How the energetic budget of rorquals has been impacted by these shifts in diet remains to be evaluated.
5 Conclusions
Our 28-year data collection provided unique insights into the evolution of rorqual trophic niche across a period of climate change and increasing anthropogenic pressures. Despite the biases identified in diet composition due to the absence of prey sampling in oceanic waters, our study revealed a dietary shift over time toward a growing reliance on forage fish for all three rorqual species, and a reduction in niche overlap, most likely in response to an increased interspecific competition. These results help clarify the strategies that may be adopted by the three rorqual species under varying conditions of intra- and interspecific competition and resource availability. Together, they suggest that when abundant, krill may serve as a preferred prey for species such as fin whales, which relied most heavily on zooplankton among the three rorquals. The estimation of individual specialization index has helped understand rorqual feeding strategies at a finer level. The use of complementary tracers such as sulfur isotopes which distinct sediment-bound food webs from pelagic one (Raoult et al., 2024) could help distinguish prey species further by using 3-tracers mixing models and provide a greater resolution of dietary patterns. This is especially needed in recent years (2011–2019) given the lesser differentiation in prey isotopic signatures. Considering regional climate predictions (Lavoie et al., 2020) and the ongoing decline of many prey populations within the GSL (Edwards et al., 2021; Smith et al., 2022; DFO, 2022; Boudreau et al., 2023), the monitoring of trophic niche of rorqual whales, including their prey across their feeding range, is crucial for tracking their response to the environmental variability and inform conservation measures.
Statements
Data availability statement
The original contributions presented in the study are included in the article/Supplementary Material. Further inquiries can be directed to VL (veronique.lesage@dfo-mpo.gc.ca).
Ethics statement
The animal study was approved by Animal Welfare & Ethics Committee, School of Biology University of St. Andrews Fife, KY16 8LB St. Andrews, UK. The study was conducted in accordance with the local legislation and institutional requirements.
Author contributions
CT-L: Writing – original draft. JC: Writing – review & editing, Supervision. VL: Writing – review & editing, Conceptualization, Funding acquisition, Supervision. CR: Writing – review & editing. MB: Writing – review & editing. RS: Writing – review & editing. GW: Writing – review & editing, Supervision.
Funding
The author(s) declared that financial support was received for this work and/or its publication. This study was supported by the St. Lawrence Action Plan – Vision 2000 and Species-At-Risk programs of Fisheries and Oceans Canada, and by Québec-Océan (scholarships to CT-L). This paper is a contribution to the research cluster Québec-Océan (https://ror.org/04ya1kq07).
Acknowledgments
We thank the Mingan Islands Cetacean Study (MICS) research teams who have ensured a continuous collection of samples over decades. Special thanks to the many people who have helped with sample preparation over the years, and to G. Parent and her team for part of the genetic sexing of rorquals. We also thank the technical staff from the Isotope Tracer Technologies Inc. laboratory (Ontario, Canada) for the isotopic analyses. This manuscript is based on work previously published as a master’s thesis submitted to the Université du Québec à Rimouski in 2025 (Tessier-Larivière, 2025).
Conflict of interest
The author(s) declared that this work was conducted in the absence of any commercial or financial relationships that could be construed as a potential conflict of interest.
Generative AI statement
The author(s) declared that generative AI was not used in the creation of this manuscript.
Any alternative text (alt text) provided alongside figures in this article has been generated by Frontiers with the support of artificial intelligence and reasonable efforts have been made to ensure accuracy, including review by the authors wherever possible. If you identify any issues, please contact us.
Publisher’s note
All claims expressed in this article are solely those of the authors and do not necessarily represent those of their affiliated organizations, or those of the publisher, the editors and the reviewers. Any product that may be evaluated in this article, or claim that may be made by its manufacturer, is not guaranteed or endorsed by the publisher.
Supplementary material
The Supplementary Material for this article can be found online at: https://www.frontiersin.org/articles/10.3389/fmars.2025.1679523/full#supplementary-material
References
1
Abrahms B. Hazen E. L. Aikens E. O. Savoca M. S. Goldbogen J. A. Bograd S. J. et al . (2019). Memory and resource tracking drive blue whale migrations. Pro. Natl. Acad. Sci. U. S. A.116, 5582–5587. doi: 10.1073/pnas.1819031116
2
Abrams P. (1980). Some comments on measuring niche overlap. Ecol.61, 44–49. doi: 10.2307/1937153
3
Agler B. A. Beard J. A. Bowman R. S. Corbett H. D. Frohock S. T. Hawvermale M. P. et al . (1990). Fin whale (Balaenoptera physalus) photographic identification: methodology and preliminary results from the western North Atlantic. Rep. Int. Whal. Commun.12, 349–356.
4
Aguilar A. Garcia-Vernet R. (2018). “ Fin whale,” in Encyclopedia of marine mammals (3rd ed.), WürsigB.ThewissenJ. G. M.KovacsK. M. (London: Academic Press) 368–371.
5
Amos B. Hoelzel A. R. (1991). Long-term preservation of whale skin for DNA analysis. Rep. Int. Whal. Commun.13, 99–103.
6
Anderson M. J. (2017). Permutational multivariate analysis of variance (PERMANOVA). In Wiley StatsRef: Statistics Reference Online, eds. BalakrishnanN.ColtonT.EverittB.PiegorschW.RuggeriF.TeugelsJ. L. ( John Wiley & Sons), 1–15. doi: 10.1002/9781118445112.stat07841
7
Araújo M. Bolnick D. Layman C. (2011). The ecological causes of individual specialisation. Ecol. Lett.14, 948–958. doi: 10.1111/j.1461-0248.2011.01662.x
8
Bacastow R. B. Keeling C. D. Lueker T. J. Wahlen M. Mook W. G. (1996). The C-13 Suess effect in the world surface oceans and its implications for oceanic uptake of CO2: Analysis of observations at Bermuda. Global Biogeochem. Cycles10, 335–346. doi: 10.1029/96GB00192
9
Barger C. P. Kitaysky A. S. (2012). Isotopic segregation between sympatric seabird species increases with nutritional stress. Biol. Lett.8, 442–445. doi: 10.1098/rsbl.2011.1020
10
Bearhop S. Adams C. E. Waldron S. Fuller R. A. Macleod H. (2004). Determining trophic niche width: A novel approach using stable isotope analysis: Stable isotopes as measures of niche width. J. Anim. Ecol.73, 1007–1012. doi: 10.1111/j.0021-8790.2004.00861.x
11
Beaugrand G. Edwards M. Brander K. Luczak C. Ibanez F. (2008). Causes and projections of abrupt climate-driven ecosystem shifts in the North Atlantic. Ecol. Lett.11, 1157–1168. doi: 10.1111/j.1461-0248.2008.01218.x
12
Bérubé M. Palsbøll P. (1996). Identification of sex in cetaceans by multiplexing with three ZFX and ZFY specific primers. Mol. Ecol.5, 283–287. doi: 10.1111/j.1365-294X.1996.tb00315.x
13
Blais M. Galbraith P. S. Plourde S. Lehoux C. Devine L. (2023). Chemical and biological oceanographic conditions in the estuary and gulf of st. Lawrence during 2021. DFO Can. Sci. Advis. Sec. Res. Doc., 2023/045. iv + 74.
14
Bolnick D. I. Amarasekare P. Araújo M. S. Bürger R. Levine J. M. Novak M. et al . (2011). Why intraspecific trait variation matters in community ecology. Trends Ecol. Evol.26, 183–192. doi: 10.1016/j.tree.2011.01.009
15
Bolnick D. I. Svanbäck R. Fordyce J. A. Yang L. H. Davis J. M. Hulsey C. D. et al . (2003). The ecology of individuals: incidence and implications of individual specialization. Am. Nat.161, 1–28. doi: 10.1086/343878
16
Bond A. L. Diamond A. W. (2011). Recent Bayesian stable-isotope mixing models are highly sensitive to variation in discrimination factors. Ecol. Appl.21, 1017–1023. doi: 10.1890/09-2409.1
17
Born E. W. Outridge P. Riget F. F. Hobson K. A. Dietz R. Øien N. et al . (2003). Population substructure of North Atlantic minke whales (Balaenoptera acutorostrata) inferred from regional variation of elemental and stable isotopic signatures in tissues. J. Mar. Syst.43, 1–17. doi: 10.1016/S0924-7963(03)00085-X
18
Boudreau M. Chamberland J. M. Girard L. Boudreau M. Benoît H. Lehoux C. et al . (2023). Capelin in the estuary and gulf of st. Lawrence (NAFO divs. 4RST) in 2021. DFO Can. Sci. Advis. Sec. Res. Doc.2023/018, v + 51.
19
Bourdages H. Brassard C. Chamberland J.-M. Desgagnés M. Galbraith P. Isabel L. et al . (2022). Preliminary results from the ecosystemic survey in August 2021 in the Estuary and northern Gulf of St. Lawrence. DFO Can. Sci. Advis. Sec. Res. Doc.2022/011, iv + 95.
20
Box G. E. P. Jenkins G. M. Reinsel G. C. Ljung G. M. (2015). Time series analysis: forecasting and control (5th ed) (New Jersey: John Wiley & Sons).
21
Brennan C. E. Maps F. Gentleman W. C. Lavoie D. Chassé J. Plourde S. et al . (2021). Ocean circulation changes drive shifts in Calanus abundance in North Atlantic right whale foraging habitat: A model comparison of cool and warm year scenarios. Prog. Oceanogr.197, 102629. doi: 10.1016/j.pocean.2021.102629
22
Brooks M. E. Kristensen K. van Benthem K. J. Magnusson A. Berg C. W. Nielsen A. et al . (2017). glmmTMB Balances Speed and Flexibility Among Packages for Zero-inflated Generalized Linear Mixed Modeling. The R Journal. 9, 378–400. doi: 10.32614/RJ-2017-066
23
Brosset P. Doniol-Valcroze T. Swain D. P. Lehoux C. Van Beveren E. Mbaye B. C. et al . (2019). Environmental variability controls recruitment but with different drivers among spawning components in Gulf of St. Lawrence herring stocks. Fish. Oceanogr.28, 1–17. doi: 10.1111/fog.12272
24
Brown M. R. Corkeron P. J. Hale P. T. Schultz K. W. Bryden M. M. (1995). Evidence for a sex-segregated migration in the humpback whale (Megaptera novaeangliae). Pro. R. Soc Lond. B.259, 229–234. doi: 10.1098/rspb.1995.0034
25
Budge S. M. Iverson S. J. Koopman H. N. (2006). Studying trophic ecology in marine ecosystems using fatty acids: A primer on analysis and interpretation. Mar. Mammal Sci.22, 759–801. doi: 10.1111/j.1748-7692.2006.00079.x
26
Busquets-Vass G. Newsome S. D. Calambokidis J. Serra-Valente G. Jacobsen J. K. Aguíñiga-García S. et al . (2017). Estimating blue whale skin isotopic incorporation rates and baleen growth rates: Implications for assessing diet and movement patterns in mysticetes. PloS One12, e0177880. doi: 10.1371/journal.pone.0177880
27
Cabrol J. Lesage V. Leclerc A. Giard J. Iverson S. Bérubé M. et al . (2021). Individual and population dietary specialization decline in fin whales during a period of ecosystem shift. Sci. Rep.11, 17181. doi: 10.1038/s41598-021-96283-x
28
Cabrol J. Lesage V. Rioux È. (2025). Changing ecosystems promote generalism and enhanced heterogeneity in diet composition in the endangered St. Lawrence Estuary beluga. Sci. Rep.15, 6239. doi: 10.1038/s41598-025-91083-z
29
Clark C. T. Cape M. R. Shapley M. D. Mueter F. J. Finney B. P. Misarti N. (2021). SuessR: Regional corrections for the effects of anthropogenic CO2 on δ13C data from marine organisms. Methods Ecol. Evol.12, 1508–1520. doi: 10.1111/2041-210X.13622
30
Comtois S. Savenkoff C. Bourassa M. N. Brêthes J. C. Sears R. (2010). Regional distribution and abundance of blue and humpback whales in the Gulf of St. Lawrence. Can. Tech. Rep. Fish. Aquat. Sci.2877, viii+38.
31
Craig A. S. Herman L. Gabriele C. Pack A. (2003). Migratory timing of humpback whales (Megaptera novaeangliae) in the central north pacific varies with age, sex and reproductive status. Behaviour140, 981–1001. doi: 10.1163/156853903322589605
32
Craig A. S. Herman L. M. Pack A. A. Waterman J. O. (2014). Habitat segregation by female humpback whales in Hawaiian waters: Avoidance of males? Behaviour151, 613–631. doi: 10.1163/1568539X-00003151
33
Croll D. A. Clark C. W. Acevedo A. Tershy B. Flores S. Gedamke J. et al . (2002). Only male fin whales sing loud songs. Nature417, 809–809. doi: 10.1038/417809a
34
Croxall J. Reid K. Prince P. (1999). Diet, provisioning and productivity responses of marine predators to differences in availability of Antarctic krill. Mar. Ecol. Prog. Ser.177, 115–131. doi: 10.3354/meps177115
35
Cushing D. H. (1990). Plankton production and year-class strength in fish populations: an update of the match/mismatch hypothesis. In Advances in marine biology. Adv. Mar. Biol.26, 249–293. doi: 10.1016/S0065-2881(08)60202-3
36
Davis G. E. Baumgartner M. F. Corkeron P. J. Bell J. Berchok C. Bonnell J. M. et al . (2020). Exploring movement patterns and changing distributions of baleen whales in the western North Atlantic using a decade of passive acoustic data. Glob. Change Biol.26, 4812–4840. doi: 10.1111/gcb.15191
37
Delarue J. J. Y. Moors-Murphy H. Kowarski K. A. Davis G. E. Urazghildiiev I. R. Bruce Martin S. (2022). Acoustic occurrence of baleen whales, particularly blue, fin, and humpback whales, off eastern Canada 2015-2017. Endangered Species Res.47, 265–289. doi: 10.3354/esr01176
38
DFO (2022). Assessment of the southern Gulf of St. Lawrence (NAFO Division 4TVn) spring and fall spawner components of Atlantic Herring (Clupea harengus) with advice for the 2022 and 2023 fisheries. DFO Can. Sci. Advis. Sec. Sci. Advis. Rep.2022/021, 1–24.
39
DFO (2023). Update of spawner abundance and biological characteristics of Striped Bass (Morone saxatilis) in the southern Gulf of St. Lawrence to 2022. DFO Can. Sci. Advis. Sec. Sci. Resp.2023/004, 1–11.
40
Doi H. Akamatsu F. González A. L. (2017). Starvation effects on nitrogen and carbon stable isotopes of animals: an insight from meta-analysis of fasting experiments. R. Soc Open Sci.4, 170633. doi: 10.1098/rsos.170633
41
Doniol-Valcroze T. (2008). Habitat selection and niche characteristics of rorqual whales in the northern Gulf of St. Lawrence (Canada). [Doctoral thesis] ( McGill University). Available online at: https://escholarship.mcgill.ca/concern/theses/08612r448 (Accessed September 18, 2023).
42
Doniol-Valcroze T. Berteaux D. Larouche P. Sears R. (2007). Influence of thermal fronts on habitat selection by four rorqual whale species in the Gulf of St. Lawrence. Mar. Ecol. Prog. Ser.335, 207–216. doi: 10.3354/meps335207
43
Edwards M. Hélaouët P. Goberville E. Lindley A. Tarling G. A. Burrows M. T. et al . (2021). North Atlantic warming over six decades drives decreases in krill abundance with no associated range shift. Commu. Biol.4, 1–10. doi: 10.1038/s42003-021-02159-1
44
Eerkes-Medrano D. Aldridge D. C. Blix A. S. (2021). North Atlantic minke whale (Balaenoptera acutorostrata) feeding habits and migrations evaluated by stable isotope analysis of baleen. Ecol. Evol.11, 16344–16353. doi: 10.1002/ece3.8224
45
Espinasse B. Sturbois A. Basedow S. L. Hélaouët P. Johns D. G. Newton J. et al . (2022). Temporal dynamics in zooplankton δ13C and δ15N isoscapes for the North Atlantic Ocean: Decadal cycles, seasonality, and implications for predator ecology. Front. Ecol. Evol.10, 1–21. doi: 10.3389/fevo.2022.986082
46
Fleming A. H. Clark C. T. Calambokidis J. Barlow J. (2016). Humpback whale diets respond to variance in ocean climate and ecosystem conditions in the California. Glob. Change Biol.22, 1214–1224. doi: 10.1111/gcb.13171
47
Folch J. Lees M. Stanley G. H. S. (1957). A simple method for the isolation and purification of total lipidesfrom animal tissues. J. Biol. Chem.226, 497–509. doi: 10.1016/S0021-9258(18)64849-5
48
Franklin T. Franklin W. Brooks L. Harrison P. (2017). Site-specific female-biased sex ratio of humpback whales (Megaptera novaeangliae) during a stopover early in the southern migration. Can. J. Zoo.96, 533–544. doi: 10.1139/cjz-2017-0086
49
Galbraith P. S. Chassé J. Shaw J.-L. Dumas J. Bourassa M.-N. (2024a). Physical oceanographic conditions in the gulf of st. Lawrence during 2023. Can. Tech. Rep. Hydrogr. Ocean Sci.378, v + 91.
50
Galbraith P. S. Sévigny C. Bourgault D. Dumont D. (2024b). Sea ice interannual variability and sensitivity to fall oceanic conditions and winter air temperature in the gulf of st. Lawrence, Canada. J. Geophys. Res.: Oceans129, e2023JC020784. doi: 10.1029/2023JC020784
51
Gannes L. Z. O’Brien D. M. del Rio C. M. (1997). Stable isotopes in animal ecology: assumptions, caveats, and a call for more laboratory experiments. Ecology78, 1271–1276. doi: 10.1890/0012-9658(1997)078[1271:SIIAEA]2.0.CO;2
52
García-Vernet R. Borrell A. Víkingsson G. Halldórsson S. D. Aguilar A. (2021). Ecological niche partitioning between baleen whales inhabiting Icelandic waters. Prog. Oceanogr.199, 102690. doi: 10.1016/j.pocean.2021.102690
53
Gardiner D. Ramp C. Sears R. Paling L. Derous D. Bérubé M. et al . (2025). Sexual segregation and stable pregnancy rates in the Gulf of St. Lawrence’s minke whales Balaenoptera acutorostrata amidst environmental changes. Mar. Ecol. Prog. Ser.758, 143–159. doi: 10.3354/meps14825
54
Gavrilchuk K. Lesage V. Fortune S. Trites A. Plourde S. (2021). Foraging habitat of North Atlantic right whales has declined in the Gulf of St. Lawrence, Canada, and may be insufficient for successful reproduction. Endanger. Species Res.44, 113–136. doi: 10.3354/esr01097
55
Gavrilchuk K. Lesage V. Ramp C. Sears R. Berube M. Bearhop S. et al . (2014). Trophic niche partitioning among sympatric baleen whale species following the collapse of groundfish stocks in the Northwest Atlantic. Mar. Ecol. Prog. Ser.497, 285–301. doi: 10.3354/meps10578
56
Gearing J. N. Gearing P. J. Rudnick D. T. Requejo A. G. Hutchins M. J. (1984). Isotopic variability of organic carbon in a phytoplankton-based, temperate estuary. Geochim. Cosmochim. Acta48, 1089–1098. doi: 10.1016/0016-7037(84)90199-6
57
Gelman A. Rubin D. B. (1992). Inference from iterative simulation using multiple sequences. Stat. Sci.7, 457–472. doi: 10.1214/ss/1177011136
58
Gill A. Fairbainrns R. S. (1995). “ Photo-identification of the minke whale Balaenoptera acutorostrata off the Isle of Mull, Scotland,” in Developments in marine biology, vol. 4. Eds. BlixA. S.WalløeL.Ulltang&Ø. (Norway: Elsevier Science), 129–132. doi: 10.1016/S0163-6995(06)80016-8
59
Giménez J. Ramírez F. Almunia J. G. Forero M. de Stephanis R. (2016). From the pool to the sea: Applicable isotope turnover rates and diet to skin discrimination factors for bottlenose dolphins (Tursiops truncatus). J. Exp. Mar. Biol. Ecol.475, 54–61. doi: 10.1016/j.jembe.2015.11.001
60
Goldbogen J. A. Cade D. E. Calambokidis J. Friedlaender A. S. Potvin J. Segre P. S. et al . (2017). How baleen whales feed: the biomechanics of engulfment and filtration. Annu. Rev. Mar. Sci.9, 367–386. doi: 10.1146/annurev-marine-122414-033905
61
Guilpin M. Lesage V. McQuinn I. Brosset P. Doniol-Valcroze T. Jeanniard-du-Dot T. et al . (2020). Repeated vessel interactions and climate- or fishery-driven changes in prey density limit energy acquisition by foraging blue whales. Front. Mar. Sci.7. doi: 10.3389/fmars.2020.00626
62
Hammill M. O. Stenson G. B. Mosnier A. Doniol-Valcroze T. (2021). Trends in abundance of harp seals, Pagophilus groenlandicus, in the Northwest Atlantic 1952-2019. DFO can. Sci. Advis. Sec. Res. Doc. 2021/006, iv + 30.
63
Hanke A. R. (2020). Update of Canadian fishery dependent indicators of relative bluefin tuna abundance. Collect. Vol. Sci. Pap. ICCAT, 76, 100–116.
64
Harris V. Edwards M. Olhede S. C. (2014). Multidecadal Atlantic climate variability and its impact on marine pelagic communities. J. Mar. Syst.133, 55–69. doi: 10.1016/j.jmarsys.2013.07.001
65
Haug T. Biuw M. Kovacs K. M. Lindblom L. Lindstrøm U. Lydersen C. et al . (2024). Trophic interactions between common minke whales (Balaenoptera acutorostrata) and their prey during summer in the northern Barents Sea. Prog. Oceanogr.224, 103267. doi: 10.1016/j.pocean.2024.103267
66
Haug T. Lindstrøm U. Nilssen K. (2002). Variations in minke whale (Balaenoptera acutorostrata) diet and body condition in response to ecosystem changes in the barents sea. Sarsia87, 409–422. doi: 10.1080/0036482021000155715
67
Herman L. M. (2016). The multiple functions of male song within the humpback whale (Megaptera novaeangliae) mating system: Review, evaluation, and synthesis. Biol. Rev.92, 1795–1818. doi: 10.1111/brv.12309
68
Hette-Tronquart N. (2019). Isotopic niche is not equal to trophic niche. Ecol. Lett.22, 1987–1989. doi: 10.1111/ele.13218
69
Hobson K. A. Clark R. G. (1992). Assessing avian diets using stable isotopes II: factors influencing diet-tissue fractionation. Condor: Ornithol. Appl.94, 189–197. doi: 10.2307/1368808
70
Hobson K. A. Schell D. M. Renouf D. Noseworthy E. (1996). Stable carbon and nitrogen isotopic fractionation between diet and tissue of captive red fox: Implications for dietary reconstruction. Can. J. Fish. Aqu. Sci.53, 528–533. doi: 10.1139/z00-008
71
Huenerlage K. Buchholz F. (2015). Thermal limits of krill species from the high-Arctic Kongsfjord (Spitsbergen). Mar. Ecol. Prog. Ser.535, 89–98. doi: 10.3354/meps11408
72
Hutchinson G. E. (1957). Concluding remarks. Cold Spring Harb. Symp. Quant. Biol.22, 415–427. doi: 10.1101/SQB.1957.022.01.039
73
Indeck K. L. Noad M. J. Dunlop R. A. (2021). The conspecific avoidance strategies of adult female-calf humpback whales. Behav. Ecol.32, 845–855. doi: 10.1093/beheco/arab031
74
Irvine L. M. Palacios D. M. Lagerquist B. A. Mate B. R. (2019). Scales of blue and fin whale feeding behavior off california, USA, with implications for prey patchiness. Front. Ecol. Evol.7. doi: 10.3389/fevo.2019.00338
75
Iverson S. J. Field C. Don Bowen W. Blanchard W. (2004). Quantitative fatty acid signature analysis: A new method of estimating predator diets. Ecol. Monogr.74, 211–235. doi: 10.1890/02-4105
76
Jackson A. L. Parnell A. (2023). SIBER: Stable Isotope Bayesian Ellipses in R. R package version 2.1.9. doi: 10.32614/CRAN.package.SIBER
77
Jackson A. L. Inger R. Parnell A. C. Bearhop S. (2011). Comparing isotopic niche widths among and within communities: SIBER – Stable Isotope Bayesian Ellipses in R. J. Anim. Ecol.80, 595–602. doi: 10.1111/j.1365-2656.2011.01806.x
78
Jardine T. D. McGeachy S. A. Paton C. M. Savoie M. Cunjak R. A. (2003). Stable isotopes in aquatic systems: Sample preparation, analysis, and interpretation. Can. Manuscr. Rep. Fish. Aqu. Sci.2656, 39.
79
Johnson K. F. Davoren G. K. (2021). Stable isotope analysis reveals that humpback whales (Megaptera novaeangliae) primarily consume capelin (Mallotus villosus) in coastal Newfoundland, Canada. Can. J. Zoo.99, 564–572. doi: 10.1139/cjz-2020-0257
80
Katona S. K. Whitehead H. P. (1981). Identifying humpback whales using their natural markings. Polar Rec.20, 439–444. doi: 10.1017/S003224740000365X
81
Kawamura A. (1980). A review of food of balaenopterid whales. Sci. Rep. Whales Res. Inst.32, 155–197.
82
Keeling C. D. (1979). The Suess effect: 13Carbon-14Carbon interrelations. Environ. Int.2, 229–300. doi: 10.1016/0160-4120(79)90005-9
83
Kelly J. F. (2000). Stable isotopes of carbon and nitrogen in the study of avian and mammalian trophic ecology. Can. J. Zoo.78, 1–27. doi: 10.1139/z99-165
84
Kershaw J. L. Ramp C. A. Sears R. Plourde S. Brosset P. Miller P. J. O. et al . (2020). Declining reproductive success in the Gulf of St. Lawrence’s humpback whales (Megaptera novaeangliae) reflects ecosystem shifts on their feeding grounds. Glob. Change Biol.27, 1027–1041. doi: 10.1111/gcb.15466
85
Kleisner K. M. Fogarty M. J. McGee S. Hare J. A. Moret S. Perretti C. T. et al . (2017). Marine species distribution shifts on the U.S. Northeast Continental Shelf under continued ocean warming. Prog. Oceanogr.153, 24–36. doi: 10.1016/j.pocean.2017.04.001
86
Konishi S. Kitagawa G. (2008). Information criteria and statistical modeling (New York: Springer Science & Business Media).
87
Körtzinger A. Quay P. D. Sonnerup R. E. (2003). Relationship between anthropogenic CO2 and the 13C Suess effect in the North Atlantic Ocean. Glob. Biogeochem. Cycles. 17, 1–20. doi: 10.1029/2001GB001427
88
Krebs J. R. Davies N. B. West S. A. (1993). An introduction to behavioural ecology (United Kingdom: John Wiley & Sons).
89
Kuhlbrodt T. Swaminathan R. Ceppi P. Wilder T. (2024). A glimpse into the future: the 2023 ocean temperature and sea ice extremes in the context of longer-term climate change. Bull. Am. Meteorol. Soc105, E474–E485. doi: 10.1175/BAMS-D-23-0209.1
90
Laidre K. L. Heagerty P. J. Heide-Jørgensen M. P. Witting L. Simon M. (2009). Sexual segregation of common minke whales (Balaenoptera acutorostrata) in Greenland, and the influence of sea temperature on the sex ratio of catches. ICES J. Mar. Sci.66, 2253–2266. doi: 10.1093/icesjms/fsp191
91
Lavoie D. Lambert N. Rousseau S. Dumas J. Chassé J. Long Z. et al . (2020). Projections of future physical and biochemical conditions in the Gulf of St. Lawrence, on the Scotian Shelf and in the Gulf of Maine using a regional climate model. Can. Tech. Rep. Hydrogr. Ocean Sci.334, xiii + 102.
92
Lawson. J. W. Gosselin J.-F. (2009). Distribution and preliminary abundance estimates for cetaceans seen during Canada’s marine megafauna survey - A component of the 2007 TNASS. DFO Can. Sci. Advis. Sec. Res. Doc. 2009/031., vi + 28.
93
Lebon M. Colac A. Prieto R. Cascao I. Oliveira C. Tobeña M. et al . (2024). Isotopic niches reveal the trophic structure of the cetacean community in the oceanic waters around the Azores. Front. Mar. Sci.11. doi: 10.3389/fmars.2024.1283357
94
Lesage V. Gavrilchuk K. Andrews R. Sears R. (2017). Foraging areas, migratory movements and winter destinations of blue whales from the western North Atlantic. Endangered Species Res.34, 27–43. doi: 10.3354/esr00838
95
Lesage V. Gosselin J.-F. Hammill M. Kingsley M. C. S. Lawson J. (2007). Ecologically and Biologically Significant Areas (EBSAs) in the Estuary and Gulf of St. Lawrence – A marine mammal perspective. DFO Can. Sci. Advis. Sec. Res. Doc.iii+92.
96
Lesage V. Hammill M. Kovacs K. (2001). Marine mammals and the community structure of the Estuary and Gulf of St Lawrence, Canada: Evidence from stable isotope analysis. Mar. Ecol. Prog. Ser.210, 203–221. doi: 10.3354/meps210203
97
Lesage V. Morin Y. Rioux È. Pomerleau C. Ferguson S. Pelletier E. (2010). Stable isotopes and trace elements as indicators of diet and habitat use in cetaceans: Predicting errors related to preservation, lipid extraction, and lipid normalization. Mar. Ecol. Prog. Ser.419, 249–265. doi: 10.3354/meps08825
98
Lockyer C. H. Brown S. G. (1981). “ The migration of whales,” in Animal migration. Ed. AidleyD. J. (New York: Cambridge University press), 105–137.
99
López-Bascón M. A. Luque De Castro M. D. (2020). doi: 10.1016/B978-0-12-816911-7.00011-6
100
Louis M. Skovrind M. Garde E. Heide-Jørgensen M. P. Szpak P. Lorenzen E. D. (2021). Population-specific sex and size variation in long-term foraging ecology of belugas and narwhals. R. Soc Open Sci,.8, 1–8. doi: 10.1098/rsos.202226
101
MacArthur R. Levins R. (1967). The limiting similarity, convergence, and divergence of coexisting species. Am. Nat.101, 377–385. doi: 10.1086/282505
102
Macleod K. Fairbairns R. Gill A. Fairbairns B. Gordon J. Blair-Myers C. et al . (2004). Seasonal distribution of minke whales Balaenoptera acutorostrata in relation to physiography and prey off the Isle of Mull, Scotland. Mar. Ecol. Prog. Ser.277, 263–274. doi: 10.3354/meps277263
103
Martínez del Rio C. Wolf N. Carleton S. A. Gannes L. Z. (2009). Isotopic ecology ten years after a call for more laboratory experiments. Biol. Rev.84, 91–111. doi: 10.1111/j.1469-185X.2008.00064.x
104
McArdle B. H. Anderson M. J. (2001). Fitting multivariate models to community data: A comment on distance-based redundancy analysis. Ecology82, 290–297. doi: 10.1890/0012-9658(2001)082[0290:FMMTCD]2.0.CO;2
105
McIntyre T. Tosh C. Plötz J. Bornemann H. Bester M. (2010). Segregation in a sexually dimorphic mammal: a mixed-effects modelling analysis of diving behaviour in southern elephant seals. Mar. Ecol. Prog. Ser.412, 293–304. doi: 10.3354/meps08680
106
McQuinn I. H. Plourde S. St. Pierre J.-F. Dion M. (2015). Spatial and temporal variations in the abundance, distribution, and aggregation of krill (Thysanoessa raschii and Meganyctiphanes norvegica) in the lower estuary and Gulf of St. Lawrence. Prog. Oceanogr.131, 159–176. doi: 10.1016/j.pocean.2014.12.014
107
Millien V. Stafiej N. Félix F. Guzman H. M. (2025). Migratory behaviour of humpback whales in the southeastern Pacific under climate change. Sci. Rep.15, 3989. doi: 10.1038/s41598-025-87489-4
108
Minagawa M. Wada E. (1984). Stepwise enrichment of 15N along food chains: Further evidence and the relation between δ15N and animal age. Geochim. Cosmochim. Acta. 48, 1135–1140. doi: 10.1016/0016-7037(84)90204-7
109
Mintenbeck K. Brey T. Jacob U. Knust R. Struck U. (2008). How to account for the lipid effect on carbon stable-isotope ratio (δ13C): Sample treatment effects and model bias. J. Fish Biol. 72, 815–830. doi: 10.1111/j.1095-8649.2007.01754.x
110
Mitchell E. (1974). “ Chapter 5. Present status of Northwest Atlantic Fin and other whale stocks,” in The whale problem: A status report. Ed. SchevillW. ( Harvard University Press, Cambridge, MA and London, England), 108–169. doi: 10.4159/harvard.9780674367128.c8
111
Mosnier A. Dispas A. Hammill M. O. (2023). Spatial distribution and count of harbour seals (Phoca vitulina) and grey seals (Halichoerus grypus) in the Estuary and Gulf of St. Lawrence from an aerial survey conducted in June 2019. Can. Tech. Rep. Fish. Aquat. Sci.3541, v + 60.
112
Myers R. Barrowman N. J. Hoenig J. M. Qu Z. (1996). The collapse of cod in Eastern Canada: The evidence from tagging data. ICES J. Mar. Sci.53, 629–640. doi: 10.1006/jmsc.1996.0083
113
Nemoto T. (1959). Food of baleen whales in reference to whale movements. Sci. Rep. Whales Res. Inst.14, 149–290.
114
Neve P. B. (2000). The diet of the minke whale in Greenland—A short review. NAMMCO Sci. Publ. 2, 92–96. doi: 10.7557/3.2974
115
Newsome S. D. Clementz M. T. Koch P. L. (2010). Using stable isotope biogeochemistry to study marine mammal ecology. Mar. Mammal Sci.26, 509–572. doi: 10.1111/j.1748-7692.2009.00354.x
116
Newsome S. D. Yeakel J. D. Wheatley P. V. Tinker M. T. (2012). Tools for quantifying isotopic niche space and dietary variation at the individual and population level. J. Mammal.93, 329–341. doi: 10.1644/11-MAMM-S-187.1
117
Nishimura F. Kim Y. Bando T. Fujise Y. Nakamura G. Murase H. et al . (2021). Morphological differences in skulls and feeding apparatuses between Antarctic (Balaenoptera bonaerensis) and common (Balaenoptera acutorostrata) minke whales, and the implication for their feeding ecology. Can. J. Zoo.99, 1067–1079. doi: 10.1139/cjz-2020-0237
118
Ollier A. Chabot D. Audet C. Winkler G. (2018). Metabolic rates and spontaneous swimming activity of two krill species (Euphausiacea) under different temperature regimes in the St. Lawrence Estuary, Canada. J. Crustac. Biol.38, 697–706. doi: 10.1093/jcbiol/ruy028
119
Ouellet J. Cabrol J. Rioux È. Bordeleau X. Lesage V. (2024). Dealing with biases introduced by lipids in stable carbon and nitrogen isotope analyses: A solution based on 28 marine invertebrate, fish, and mammal species. Mar. Ecol. Prog. Ser.738, 75–87. doi: 10.3354/meps14595
120
Overholtz W. J. Nicolas J. R. (1979). Apparent feeding by the fin whale, Balaenoptera physalus, and humpback whale, Megaptera novaengliae, on the americain sandlance, Ammodytes americanus, in the northwest Atlantic. Fish. Bull.77, 285–287.
121
Palacios-Abrantes J. Frölicher T. L. Reygondeau G. Sumaila U. R. Tagliabue A. Wabnitz C. C. C. et al . (2022). Timing and magnitude of climate-driven range shifts in transboundary fish stocks challenge their management. Glob. Change Biol.28, 2312–2326. doi: 10.1111/gcb.16058
122
Palsbøll P. J. Larsen F. Sigurd Hansen E. (1991). Sampling of skin biopsies from free-ranging large cetaceans in West Greenland: Development of new biopsy tips and bolt designs. Rep. Int. Whal. Commn.13, 71–79.
123
Parent G. J. Montana L. Bonnet C. Parent É. Sauvé C. St-Pierre A. P. et al . (2025). Genetic monitoring program for beluga (Delphinapterus leucas) harvested in the Nunavik and Nunavut (Belcher Islands) regions. Can. Tech. Rep. Fish. Aquat. Sci.3643, vii+34. doi: 10.60825/erys-r351.
124
Perry A. L. Low P. J. Ellis J. R. Reynolds J. D. (2005). Climate change and distribution shifts in marine fishes. Science308, 1912–1915. doi: 10.1126/science.1111322
125
Phillips D. L. Inger R. Bearhop S. Jackson A. L. Moore J. W. Parnell A. C. et al . (2014). Best practices for use of stable isotope mixing models in food-web studies. Can. J. Zoo.92, 823–835. doi: 10.1139/cjz-2014-0127
126
Pianka E. R. (1972). R and K Selection or b and d Selection? Am. Nat.106, 581–588.
127
Pianka E. R. (1974). Niche overlap and diffuse competition. Pro. Natl. Acad. Sci.71, 2141–2145. doi: 10.1073/pnas.71.5.2141
128
Plourde S. Lehoux C. McQuinn I. Lesage V. (2016). Describing krill distribution in the western North Atlantic using statistical habitat models. Can. Sci. Advi. Sec. Res. Doc.v + 34.
129
Polechová J. Storch D. (2019). Ecological niche, in encyclopedia of ecology. 2nd. Ed. FathB. (Amsterdam: Elsevier) 3, 72–80. doi: 10.1016/B978-0-12-409548-9.11113-3
130
Post D. M. Layman C. A. Arrington D. A. Takimoto G. Quattrochi J. Montaña C. G. (2007). Getting to the fat of the matter: Models, methods and assumptions for dealing with lipids in stable isotope analyses. Oecologia152, 179–189. doi: 10.1007/s00442-006-0630-x
131
Ralls K. (1976). Mammals in which females are larger than males. Q. Rev. Biol.51, 245–276. doi: 10.1086/409310
132
Ramp C. Delarue J. Palsbøll P. J. Sears R. Hammond P. S. (2015). Adapting to a warmer ocean—Seasonal shift of baleen whale movements over three decades. PloS One10, e0121374. doi: 10.1371/journal.pone.0121374
133
Ramp C. Lesage V. Ollier A. Auger-Méthé M. Sears R. (2024). Migratory movements of fin whales from the Gulf of St. Lawrence challenge our understanding of the Northwest Atlantic stock structure. Sci. Rep.14, 11472. doi: 10.1038/s41598-024-62173-1
134
Ramp C. Sears R. (2013). Distribution, densities, and annual occurrence of individual blue whales (Balaenoptera musculus) in the Gulf of St. Lawrence, Canada from 1980-2008. DFO Can. Sci. Advis. Sec. Res. Doc.2012/157, vii + 37.
135
Raoult V. Phillips A. A. Nelson J. Niella Y. Skinner C. Tilcock M. B. et al . (2024). Why aquatic scientists should use sulfur stable isotope ratios (δ34S) more often. Chemosphere355, 141816. doi: 10.1016/j.chemosphere.2024.141816
136
R Core Team (2024). R: A language and environment for statistical computing ( R Foundation for Statistical Computing).
137
Rioux È. Cabrol J. Lesage V. (2023). Long-term evolution of the structure of the St. Lawrence (Canada) marine ecosystem in 1 the context of climate change and anthropogenic activities: An isotopic perceptive. Ecol. Evol.13, 1–21. doi: 10.1002/ece3.10740
138
Risch D. Castellote M. Clark C. W. Davis G. E. Dugan P. J. Hodge L. E. et al . (2014). Seasonal migrations of North Atlantic minke whales: Novel insights from large-scale passive acoustic monitoring networks. Mov. Ecol.2, 24. doi: 10.1186/s40462-014-0024-3
139
Rita D. Borrell A. Wodarg D. Víkingsson G. Garcia-Vernet R. Aguilar A. et al . (2023). Amino acid-specific nitrogen stable isotope analysis reveals the trophic behavior of Icelandic fin whales in winter and suggests variable feeding strategies. Mar. Mammal Sci.40, e13097. doi: 10.1111/mms.13097
140
Rosel P. E. (2003). PCR-based sex determination in Odontocete cetaceans. Conserv. Genet.4, 647–649. doi: 10.1023/A:1025666212967
141
Ryan C. Berrow S. D. McHugh B. O’Donnell C. Trueman C. N. O’Connor I. (2014). Prey preferences of sympatric fin (Balaenoptera physalus) and humpback (Megaptera novaeangliae) whales revealed by stable isotope mixing models. Mar. Mammal Sci.30, 242–258. doi: 10.1111/mms.12034
142
Savenkoff C. Castonguay M. Chabot D. Hammill M. O. Bourdages H. Morissette L. (2007). Changes in the northern Gulf of St. Lawrence ecosystem estimated by inverse modelling: Evidence of a fishery-induced regime shift? Estuar. Coast. Shelf Sci.73, 711–724. doi: 10.1016/j.ecss.2007.03.011
143
Schleimer A. Ramp C. Delarue J. Carpentier A. Bérubé M. Palsbøll P. J. et al . (2019). Decline in abundance and apparent survival rates of fin whales (Balaenoptera physalus) in the northern Gulf of St. Lawrence. Ecol. Evol.9, 4231–4244. doi: 10.1002/ece3.5055
144
Schoener T. W. (1971). Theory of feeding strategies. Annu. Rev. Ecol. Syst.2, 369–404. doi: 10.1146/annurev.es.02.110171.002101
145
Schoener T. W. (1982). The Controversy over Interspecific Competition: Despite spirited criticism, competition continues to occupy a major domain in ecological thought. Am. Sci.70, 586–595.
146
Senay C. Ouellette-Plante J. Bourdages H. Bermingham T. Gauthier J. Parent G. et al . (2021). Unit 1 Redfish (Sebastes mentella and S. fasciatus) stock status in 2019 and updated information on population structure, biology, ecology, and current fishery closures. DFO Can. Sci. Advis. Sec. Res. Doc.2021/015, xi + 119.
147
Sergeant D. E. (1963). Minke whales, balaenoptera acutorostrata lacépède, of the western north atlantic. J. Fish. Res. Board Can.20, 1489–1504. doi: 10.1139/f63-101
148
Sergeant D. E. (1966). Populations of large whale species in the western North Atlantic with special reference to the fin whale. Fisheries Research Board of Canada. 9, 1–41. Available online at: http://archive.org/details/populationsoflar00serg (Accessed December 8, 2023).
149
Silva M. A. Borrell A. Prieto R. Gauffier P. Bérubé M. Palsbøl P. J. et al . (2019). Stable isotopes reveal winter feeding in different habitats in blue, fin and sei whales migrating through the Azores. R. Soc Open Sci.6, 181800. doi: 10.1098/rsos.181800
150
Silva M. A. Prieto R. Jonsen I. Baumgartner M. F. Santos R. S. (2013). North atlantic blue and fin whales suspend their spring migration to forage in middle latitudes: building up energy reserves for the journey? PloS One8, e76507. doi: 10.1371/journal.pone.0076507
151
Smith A. D. Girard L. Boudreau M. Van Beveren E. Plourde S. (2022). Assessment of the northern contingent of Atlantic Mackerel (Scomber scombrus) in 2020. DFO Can. Sci. Advis. Sec. Res. Doc.2022/045, iv + 44.
152
Smith J. A. Mazumder D. Suthers I. M. Taylor M. D. (2013). To fit or not to fit: Evaluating stable isotope mixing models using simulated mixing polygons. Methods Ecol. Evol.4, 612–618. doi: 10.1111/2041-210X.12048
153
Sotiropoulos M. A. Tonn W. M. Wassenaar L. I. (2004). Effects of lipid extraction on stable carbon and nitrogen isotope analyses of fish tissues: Potential consequences for food web studies. Ecol. Freshw. Fish13, 155–160. doi: 10.1111/j.1600-0633.2004.00056.x
154
Stephens R. B. Ouimette A. P. Hobbie E. A. Rowe R. J. (2022). Reevaluating trophic discrimination factors (Δδ13C and Δδ15N) for diet reconstruction. Ecol. Monogr.92, e1525. doi: 10.1002/ecm.1525
155
Stevick P. T. Allen J. Bérubé M. Clapham P. J. Katona S. K. Larsen F. et al . (2003). Segregation of migration by feeding ground origin in North Atlantic humpback whales (Megaptera novaeangliae). J. Zoo.259, 231–237. doi: 10.1017/S0952836902003151
156
Stock B. C. Jackson A. L. Ward E. J. Parnell A. C. Phillips D. L. Semmens B. X. (2018). Analyzing mixing systems using a new generation of Bayesian tracer mixing models. PeerJ6, e5096. doi: 10.7717/peerj.5096
157
Sweeting C. J. Polunin N. V. C. Jennings S. (2006). Effects of chemical lipid extraction and arithmetic lipid correction on stable isotope ratios of fish tissues. Rapid Commun. Mass Spectrom.20, 595–601. doi: 10.1002/rcm.2347
158
Tamura T. Fujise Y. (2002). Geographical and seasonal changes of the prey species of minke whale in the Northwestern Pacific. ICES J. Mar. Sci.59, 516–528. doi: 10.1006/jmsc.2002.1199
159
Teixeira C. R. Troina G. C. Daura-Jorge F. G. Simões-Lopes P. C. Botta S. (2022). A practical guide on stable isotope analysis for cetacean research. Mar. Mammal Sci.2020, 1–16. doi: 10.1111/mms.12911
160
Tessier-Larivière C. (2025). Évolution de la niche trophique des grands rorquals du Saint-Laurent en contexte de changements climatiques. [dissertation/master’s thesis. (Rimouski QC: Université du Québec à Rimouski, Institut des sciences de la mer de Rimouski (ISMER)).
161
Vander Zanden M. J. Clayton M. K. Moody E. K. Solomon C. T. Weidel B. C. (2015). Stable isotope turnover and half-life in animal tissues: A literature synthesis. PloS One10, e0116182. doi: 10.1371/journal.pone.0116182
162
Visser F. Hartman K. Pierce G. Valavanis V. Huisman J. (2011). Timing of migratory baleen whales at the Azores in relation to the North Atlantic spring bloom. Mar. Ecol. Prog. Ser.440, 267–279. doi: 10.3354/meps09349
163
Watkins W. A. Schevill W. E. (1979). Aerial Observation of Feeding Behavior in Four Baleen Whales: Eubalaena glacialis, Balaenoptera borealis, Megaptera novaeangliae, and Balaenoptera physalus. J. Mammal.60, 155–163. doi: 10.2307/1379766
164
Weinrich M. T. Kuhlberg A. E. (1991). ). Short-term association patterns of humpback whale (Megaptera novaeangliae) groups on their feeding grounds in the southern Gulf of Maine. Can. J. Zoo.69, 3005–3011. doi: 10.1139/z91-424
165
Windsland K. Lindstrøm U. Nilssen K. Haug T. (2008). Relative abundance and size composition of prey in the common minke whale diet in selected areas of the northeastern Atlantic during 2000-04. J. Cetac. Res. Manage.9, 167–178. doi: 10.47536/jcrm.v9i3.665
166
Witteveen B. H. Wynne K. M. (2016). Trophic niche partitioning and diet composition of sympatric fin (Balaenoptera physalus) and humpback whales (Megaptera novaeangliae) in the Gulf of Alaska revealed through stable isotope analysis. Mar. Mammal Sci.32, 1319–1339. doi: 10.1111/mms.12333
167
Wood S. N. (2017). Generalized additive models: an introduction with R. 2nd ed. (New York: Chapman and Hall/CRC). doi: 10.1201/9781315370279
168
Würsig B. Rich J. Orbach D. N. (2023). Sex and behaviour, in Sex in cetaceans. Eds. WürsigB.OrbachD. N. (Switzerland: Springer), 1–27. doi: 10.1007/978-3-031-35651-3
Summary
Keywords
trophic niche, stable isotopes, δ15N, δ13C, isotopic mixing models, rorquals, ecosystemic changes, climate change
Citation
Tessier-Larivière C, Cabrol J, Lesage V, Ramp C, Bérubé M, Sears R and Winkler G (2026) A 28-year record of the isotopic niche of baleen whales in the Gulf of St. Lawrence, Canada: a perspective on ecosystem changes and potential for food competition. Front. Mar. Sci. 12:1679523. doi: 10.3389/fmars.2025.1679523
Received
04 August 2025
Revised
20 November 2025
Accepted
29 November 2025
Published
23 January 2026
Volume
12 - 2025
Edited by
Mark Meekan, University of Western Australia, Australia
Reviewed by
Damián Gustavo Vales, CONICET Centro de Estudios de Sistemas Marinos (CESIMAR), Argentina
Fabio Ercoli, Estonian University of Life Sciences, Estonia
Luis Cardona, University of Barcelona, Spain
Updates
Copyright
© 2026 Tessier-Larivière, Cabrol, Lesage, Ramp, Bérubé, Sears and Winkler.
This is an open-access article distributed under the terms of the Creative Commons Attribution License (CC BY). The use, distribution or reproduction in other forums is permitted, provided the original author(s) and the copyright owner(s) are credited and that the original publication in this journal is cited, in accordance with accepted academic practice. No use, distribution or reproduction is permitted which does not comply with these terms.
*Correspondence: Charlotte Tessier-Larivière, charlotte.tessier-lariviere@uqar.ca
†These authors have contributed equally to this work and share last authorship
Disclaimer
All claims expressed in this article are solely those of the authors and do not necessarily represent those of their affiliated organizations, or those of the publisher, the editors and the reviewers. Any product that may be evaluated in this article or claim that may be made by its manufacturer is not guaranteed or endorsed by the publisher.