Abstract
The development of the ocean economy plays a vital role in national strategic planning, yet it faces persistent financing challenges due to high risks, long investment cycles, and significant information asymmetries. This study constructs a tripartite evolutionary game model involving government, banks, and marine enterprises to explore effective financial support strategies for the ocean economy. Through replicator dynamic equations, simulation analysis, and sensitivity testing, the study examines how different policy incentives, industry characteristics, and stakeholder behaviors shape stable cooperation outcomes. The findings reveal that the optimal strategy is characterized by government intervention, enterprise investment, and bank exclusive marine financial products establishment, which depends on the alignment of risk compensation, financial incentives, and expected returns. A comparative analysis across three marine sectors—shipping, desalination, and marine equipment—demonstrates that financial support pathways must be tailored to industry-specific risk-return profiles. Policy recommendations include phased subsidies, differentiated incentive mechanisms, and adaptive financial product designs are given. This study provides theoretical support and implementation pathways for marine finance to deliver targeted support for the development of the marine economy.
1 Introduction
The strategic importance of the ocean economy to national development has long been recognized, dating back to the era of Alfred Thayer Mahan. In his seminal 1890 work, Mahan asserted that “control of the sea means control of the world.” His concept of sea power implied more than just naval strength—it encompassed economic dominance, control over trade routes, security assurance, and global resource allocation capacity (Mahan, 2012). These ideas formed the early strategic prototype of what is now known as the “ocean economy”.
In today’s complex and ever-changing global environment, the development of the ocean economy has become a vital pillar of progress for coastal nations. For major powers with long coastlines—such as China—it has risen to the level of national strategy such as the Belt and Road Initiative (Li et al., 2020). Marine resources and maritime space are closely tied to energy security, food security, shipping security, and ecological stability (Narula, 2019; Suárez-De Vivero et al., 2019; Liu et al., 2024).
The ocean economy spans a wide range of industries, including port logistics, distant-water fisheries, offshore oil and gas, marine renewable energy, ocean engineering and equipment manufacturing, coastal tourism, and marine biopharmaceuticals. These emerging and high value-added sectors are crucial for promoting industrial upgrading and achieving sustainable development under carbon neutrality goals. Notable examples include smart port and shipping systems, offshore wind power, blue carbon initiatives, and green shipping.
Despite its strategic significance, the ocean economy is characterized by high risks, substantial investment requirements, long return cycles, and severe information asymmetry (Sumaila et al., 2021). These features hinder the efficient allocation of financial resources by the market alone, resulting in what has been widely recognized as “financial under-provision”. In other words, due to poor risk-return profiles, a lack of industry-specific knowledge, and insufficient regulatory incentives, financial institutions are often reluctant to engage in marine projects proactively.
In response to such market failures, economic theory suggests that governments can intervene through incentive mechanisms—such as subsidies, risk compensation, and tax incentives—to guide financial flows toward strategic areas that the market shuns but the state deems essential. For instance, Singapore has implemented a full-industry-chain preferential policy framework, including tax exemptions for shipping companies, discounted vessel registration fees, and tax relief for the maritime industry (Maritime and Port Authority of Singapore, 2018). In China, some local governments have introduced marine-supportive financial measures. These include encouraging financial institutions to partner with the Tianjin Emissions Exchange in developing carbon-related financial products, or awarding a 2% incentive on ship finance lease volumes over one year provided to local shipping companies (Tianjin Municipal People’s Government, 2023).
While these policy frameworks have prompted some financial institutions to take initial steps—such as launching marine-specific loans or setting up dedicated marine finance divisions (e.g., Minsheng Financial Leasing’s Shipping Division, or the Shipping Finance Center at Bank of China Tianjin Branch)—interviews reveal a lack of in-depth understanding of the marine industry within these banks. Many institutions remain unsure about how to design differentiated financial products tailored to the diverse needs of marine sub-sectors. Furthermore, uncertainty over the continuity of government policies hinders institutional responsiveness, thereby weakening sustained financial support for high-quality development of the ocean economy. Overall, banks face challenges such as policy uncertainties, market volatility, and sector-specific risks (e.g., natural disasters, resource depletion). These risk factors make banks more cautious when supporting ocean industries, necessitating risk-sharing mechanisms and policy incentives to mitigate participation barriers.
Against this backdrop, this study conducts field investigations and interviews with marine-related enterprises and a commercial bank. Furthermore, this study constructs an evolutionary game model involving the government, banks, and marine enterprises to analyze optimal strategies for financial support for the ocean economy under different policy and market conditions.
The reminder of this study is organized as below. Section 2 conducts literature review on financial support for ocean economy and applications of evolutionary game theory in the field of ocean economy. Section 3 establishes the tripartite evolutionary game model and Section 4 gets the model solutions and conducts stability analysis. Section 5 conducts simulation and sensitivity analysis. Section 6 provides government and bank strategies by considering marine industry heterogeneity. Section 7 concludes the study and highlights financial support pathways for ocean economy.
2 Literature review
2.1 Financial support for ocean economy
The ocean economy, defined as the economic system directly dependent on marine resources (Xu et al., 2023), encompasses fisheries, transportation, oil and gas exploration, tourism, and technological research. It has emerged as a strategic priority for coastal nations and regions, demonstrating substantial growth potential (Weidong and Yindan, 2024). Academic consensus confirms that financial support mechanisms—including targeted credit, specialized subsidies, and industrial investment funds—play a pivotal role in advancing high-quality development by fostering marine technology innovation, green infrastructure, and eco-friendly initiatives (Ma et al., 2023; Lin et al., 2019; Wang et al., 2021b). This capital allocation not only accelerates industrial upgrading (Ding et al., 2023; Ling and Zeming, 2020) but also establishes an integrated empowerment framework through optimized resource utilization (Su et al., 2021), facilitating technological breakthroughs (Wang et al., 2021a), infrastructure enhancement, and sustainable marine development (Jie et al., 2024).
Beyond the academic discourse, major international organizations have also emphasized the financial underpinnings of sustainable ocean economic development. The Organization for Economic Co-operation and Development (OECD) highlights that achieving long-term ocean growth requires institutionalized financial mechanisms and cross-sector investment coordination to align profitability with ecological goals (OECD, 2022). Similarly, the United Nations Development Programme (UNDP) advances a similar perspective through its Financing the Blue Economy and Ocean Promise initiatives, underscoring the need for innovative financing instruments (e.g., blue bonds, blended finance, and public-private partnerships) to mobilize capital for inclusive, resilient marine industries (UNDP, 2022). Meanwhile, the United Nations Conference on Trade and Development (UNCTAD), in its Review of Maritime Transport (2022-2023), identifies maritime transport and port infrastructure as both key drivers of the ocean economy and critical gateways for channeling green transition finance (UNCTAD, 2023). Collectively, these frameworks converge on the principle that financial intermediation and policy instruments are indispensable to translating ocean-based growth potential into sustainable economic outcomes.
Current research on financial support for ocean economy primarily concentrates on four thematic clusters. First, the research themes are influence mechanisms, encompassing the effects of marine financial policies (Lin et al., 2019; Ma and Hou, 2024), the emerging environmental performance and carbon transition policy impacts (Jie et al., 2024; Wang et al., 2025; Xiao et al., 2025; Xu et al., 2025a, b), along with the impacts of sci-tech finance investments (Sheng et al., 2021; Sun et al., 2024b; Zeyu et al., 2023) and education synergies (Wang et al., 2021a; Zeyu et al., 2023); Second, efficiency evaluation and disparity analysis, spanning regional comparisons (Lin et al., 2019; Ling and Zeming, 2020; Su et al., 2021; Sun et al., 2024b; Wang et al., 2021b; Guo et al., 2025) and industrial benchmarking are discussed (Ma et al., 2023; Shi-Jun, 2024); Third, market financing frameworks, encompassing banking operations (Yong, 2020; Zhuang, 2020) and project-specific financing strategies are explored (Sumaila et al., 2021; Vanderklift et al., 2019; Wabnitz and Blasiak, 2019); Fourth, financial instrument innovation including specialized products are studied (Han et al., 2019; Jie et al., 2024; Jie, 2024; Thompson, 2022; Zhuang, 2020). Methodologically, these studies predominantly employ quantitative approaches featuring panel data analysis, econometric modeling (e.g., grey relational analysis, entropy method, variation coefficient analysis and dynamic evolution model), complemented by case study validations.
2.2 Evolutionary game theory
Evolutionary game theory is a dynamic game analysis framework based on the assumption of bounded rationality, modeling the strategic evolution of multiple interacting agents over the long term (Greiner et al., 2017; Friedman, 1998). Through continuous learning and strategy adjustment, participants eventually reach an Evolutionarily Stable Strategy (ESS). This framework, emphasizing dynamic adaptation and stability, is well-suited for complex economic and financial analyses, particularly in examining investor behavior and market dynamics. In the financial domain, evolutionary game theory has been widely applied to research on regulatory strategies (An et al., 2021), bank-firm competition and cooperation (Yan et al., 2024; Du et al., 2023), risk-sharing mechanisms (Johari and Hosseini-Motlagh, 2024) and other fields. In the field of ocean economy, evolutionary game theory has also seen extensive application (see in Table 1), providing a quantitative analysis tool for addressing complex system issues such as marine infrastructure investment and financing, marine environmental governance and policy coordination, and industrial collaborative innovation.
Table 1
| Research | Game participants |
|---|---|
| (Ma and Hou, 2024) | Financial Institutions/Marine Enterprises/Research Institutes |
| (Wang et al., 2024) | Local Government/Shipping Companies |
| (Sun et al., 2024a) | Central/Local Governments/Marine Ranch Enterprises |
| (Jiang et al., 2023) | Maritime Regulators/Ship Owners |
| (Peng and Wang, 2023) | Shipping Companies/Freight Forwarders |
| (Xiao and Cui, 2023) | Government/Shipping Enterprises |
| (Gao et al., 2023) | Government/Port Enterprises |
| (Gao et al., 2022) | Central government/Local governments/Marine enterprises |
| (Chen et al., 2021) | Government/Port Enterprises/Power Companies |
| (Xu et al., 2021a) | Upstream/Downstream Governments/Shipping Companies |
| (Xu et al., 2021b) | Government/Ports/Shipping Companies |
Applications of evolutionary game theory in the field of ocean economy.
2.3 Literature gaps
Existing studies on financial support for the ocean economy exhibit three limitations: 1) while industrial financial mechanisms are well-researched, marine-specific frameworks remain underdeveloped. General models overlook the unique risks (e.g., long investment cycles, ecological constraints) and spatial heterogeneity of marine industries, limiting their applicability. 2) a macro-micro disconnect persists. Macro studies emphasize broad policy design (e.g., national marine funds, regulatory frameworks) and aggregate economic impacts, while micro analyses focus on enterprise financing behaviors and tools. Few bridge these scales to explain how policies translate into operational strategies (e.g., regional bank adaptations or enterprise compliance trade-offs), leaving implementation pathways fragmented. 3) despite advances in evolutionary game theory, tripartite dynamic interactions (government-bank-enterprise) are rarely modeled, especially in the context of ocean financial systems. Existing studies often simplify stakeholder relationships, lacking the participation of financial intermediaries such as banks and financial instruments.
To bridge these gaps, this study makes four key contributions.
-
It constructs a tripartite evolutionary game model involving government, banks, and marine enterprises, extending existing analyses from bilateral to system-level interactions.
-
It integrates macro policy instruments (subsidies, risk compensation) with micro behavioral mechanisms (bank product design, enterprise investment), forming a unified framework linking incentives and cooperative equilibria.
-
It performs cross-sector comparative analysis—covering shipping, desalination, and marine equipment—to capture industry heterogeneity in financial support pathways.
-
It proposes phased, sector-specific policy recommendations that translate theoretical insights into actionable financial strategies.
Collectively, these contributions advance evolutionary game applications in marine finance and provide a practical decision-support framework for policymakers and financial institutions.
3 Tripartite evolutionary game model
As we know, three players-government, bank and marine enterprises have their own tradeoffs. Governments are pivotal in steering ocean economic development (Xu et al., 2025b). Through measures including policy guidance, market-based incentives, and risk compensation, they effectively intervene in the behaviors of banks and enterprises, optimize resource allocation, and enhance industrial competitiveness (Sumaila et al., 2021). However, designing balanced policies to optimize tripartite collaboration among governments, banks, and enterprises remains complex, particularly given the need for scientific and flexible regulatory frameworks to enhance financial efficiency and effectiveness in ocean sectors.
Banks, as core financial intermediaries, play an increasingly vital role by providing capital and innovating financial products to advance industrial upgrading and technological breakthroughs. Yet, banks face challenges such as policy uncertainties, market volatility, and sector-specific risks (OECD, 2025). These risk factors make banks more cautious when supporting ocean industries, necessitating risk-sharing mechanisms and policy incentives to mitigate participation barriers.
Marine enterprises typically base their investment decisions on factors such as business development needs, potential benefits, and associated costs. Government subsidy policies and bank favorable policies, like preferential loans and streamlined approval processes, can positively impact their cost structures (Leng and Qi, 2024). When faced with these incentives, marine enterprises are more inclined to take action. However, if policies lack clarity—for instance, if it is unclear whether they will be short - term or long - term—this uncertainty can cast a shadow over their decision.
3.1 Model assumptions
Based on the above information, strategies of each player are set as below (see Table 2). The government’s strategies are intervention () and non-intervention (). Under intervention, the government supports banks and enterprises through measures such as incentive subsidies (, ) and risk compensation (), while non-intervention implies that decisions are entirely market-driven. This setting is consistent with the implementation rules of the Tianjin’s policy (Tianjin Municipal People’s Government, 2023). Marine enterprises adopt strategies of investment () or non-investment (). If an enterprise invests, it bears investment costs ( or ), gains returns (), and risks losses () from potential failure. Banks choose to establish exclusive marine financial products () or not establish () the products. Establishing such products incurs costs () but generates returns (), reputational benefits (), and potential credit losses (). If banks do not establish these products, they earn traditional returns () without additional costs or risks. The variables are set based on both the deep interviews and the existing reference (Mu et al., 2023). Further, the payoff matrix under different strategic scenarios (Table 3) is derived based on the cost-benefit structures of the three parties.
Table 2
| Player | Government | Marine enterprises | Banks |
|---|---|---|---|
| Cost-Benefit Components | Expected returns brought to the government by enterprise investment without intervention | Enterprise’s investment cost without intervention | Bank’s cost to establish exclusive marine financial products (e.g., developing new products and assessing the risks of marine economic projects) |
| Expected returns brought to the government by enterprise investment under intervention, mainly reflected in economic growth, social benefits (e.g., economic growth, tax revenue, industrial upgrading) and environmental benefits | : Enterprise’s investment cost under the establishment of exclusive marine financial products by banks | Product returns brought to the bank by marine enterprise customers without establishing exclusive marine financial products | |
| : Government’s risk compensation for exclusive products | Enterprise’s investment income (e.g., project returns, expansion of market share) | Product returns brought to the bank by marine enterprise customers under the establishment of exclusive marine financial products | |
| Government’s intervention and regulatory costs | Government’s incentive subsidies for marine enterprises | Bank’s reputational benefits from establishing exclusive marine financial products | |
| Government’s incentive subsidies for marine enterprises | Enterprise’s potential losses due to the investment failure | Bank’s potential credit loss caused by enterprise’s breach of trust. | |
| Government’s incentive subsidies for banks | Bank’s recovered losses via government risk compensation | ||
| Strategies | Intervention | Investment | Establishment |
| Non- Intervention | Not Investment | Not Establishment |
Cost-benefit components and strategies of game players.
Table 3
| Payoff | Bank (establishment) () | Bank (not establishment) () | ||
|---|---|---|---|---|
| Marine enterprises (investment) () | Marine enterprises (not investment) () | Marine enterprises (investment) () | Marine enterprises (not investment) () | |
| Government (Intervention) () | ||||
| Government (Non-Intervention) () | ||||
Payoff matrix of game players.
Assumption 1: All three players are boundedly rational decision-makers. Their strategic choices prioritize self-interest maximization, mutually influence one another during decision-making, and dynamically adjust over time until converging to stable strategies.
Assumption 2: Banks’ establishment of exclusive financial products streamlines financing processes and shortens financing timelines. Consequently, enterprises’ financing costs are reduced when banks offer exclusive marine financial products, i.e., .
Assumption 3: Banks only extend loans to enterprises that meet their risk assessment criteria. Thus, in the case of not establishing exclusive marine financial products, banks’ product returns from marine enterprise customers () are assumed to exceed potential credit losses () caused by enterprise’s breach of trust, i.e., .
3.2 Model establishment
3.2.1 Government
Government’s expected payoff for Intervention (Equation 1):
Government’s expected payoff for Non-Intervention (Equation 2):
Government’s average expected payoff (Equation 3):
Replicator dynamic equation of the government’s game strategy (Equation 4):
3.2.2 Marine enterprise
Marine enterprise’s expected payoff for Investment (Equation 5):
Marine enterprise’s expected payoff for Not Investment (Equation 6):
Marine enterprise’s average expected payoff (Equation 7):
Replicator dynamic equation of the marine enterprise’s game strategy (Equation 8):
3.2.3 Bank
Bank’s expected payoff for establishing exclusive marine financial products (Equation 9):
Bank’s expected payoff for not establishing exclusive marine financial products (Equation 10):
Bank’s average expected payoff (Equation 11):
Replicator dynamic equation of the bank’s game strategy (Equation 12):
4 Model solution and stability analysis
Based on the expected payoffs and replicator dynamics equations, the stability of the tripartite game model can be analyzed. By solving the system of replicator dynamics equations:
Eight local equilibrium points are derived: (0,0,0), (0,0,1), (0,1,0), (0,1,1), (1,0,0), (1,0,1), (1,1,0), (1,1,1). To identify the evolutionary stable strategies (ESS), these points are substituted into the Jacobian matrix to compute eigenvalues. An ESS exists if all eigenvalues are negative. The Jacobian matrix is:
Where the partial derivatives are:
The eigenvalues for each equilibrium point are listed in Table 4.
Table 4
| Equilibrium Point | Eigenvalues | ||
|---|---|---|---|
| (0, 0, 0) | |||
| (0, 0, 1) | |||
| (0, 1, 0) | |||
| (0, 1, 1) | |||
| (1, 0, 0) | |||
| (1, 0, 1) | |||
| (1, 1, 0) | |||
| (1, 1, 1) | |||
Eigenvalues of each equilibrium point.
Based on the negativity of eigenvalues, (0, 1, 0), (0, 1, 1), and (1, 0, 0) cannot be ESS.
Proposition 1: If and , the stable strategy is (0, 0, 0). That is, when government subsidies to enterprises are insufficient to offset the risks of increased investment, and government incentives to banks and the reputational benefits of establishing exclusive financial products fail to compensate for the associated costs, the stable strategy for all parties is (Non-intervention, Non-Investment, Non-Establishment) (Table 5).
Table 5
| Equilibrium point | Eigenvalues | ESS | ||
|---|---|---|---|---|
| (0, 0, 0) | – | – | – | Stable Point |
| (0, 0, 1) | +, – | +, – | + | Unstable Point |
| (0, 1, 0) | +, – | + | + | Unstable Point |
| (0, 1, 1) | +, – | + | + | Unstable Point |
| (1, 0, 0) | + | – | – | Unstable Point |
| (1, 0, 1) | +, – | – | + | Unstable Point |
| (1, 1, 0) | +, – | + | +, – | Unstable Point |
| (1, 1, 1) | +, – | + | +, – | Unstable Point |
Stability analysis of (0, 0, 0).
Proposition 2: If , and , the stable strategy is (0, 0, 1). That is, when government subsidies to enterprises are insufficient to offset investment risks, the reputational benefits of establishing exclusive financial products outweigh their costs for banks, and government incentives to banks exceed regulatory intervention costs, the stable strategy for all parties is (Non-intervention, Non-Investment, Establishment) (Table 6).
Table 6
| Equilibrium point | Eigenvalues | ESS | ||
|---|---|---|---|---|
| (0, 0, 0) | – | – | + | Unstable Point |
| (0, 0, 1) | – | – | – | Stable Point |
| (0, 1, 0) | +, – | + | + | Unstable Point |
| (0, 1, 1) | +, – | + | + | Unstable Point |
| (1, 0, 0) | + | – | + | Unstable Point |
| (1, 0, 1) | + | – | – | Unstable Point |
| (1, 1, 0) | +, – | + | +, – | Unstable Point |
| (1, 1, 1) | +, – | + | +, – | Unstable Point |
Stability analysis of (0, 0, 1).
Proposition 3: If , and , the stable strategy is (1, 0, 1). That is, when government subsidies to enterprises are insufficient to offset investment risks, government incentives and reputational gains from establishing exclusive financial products compensate for their costs for banks, and government incentive costs are lower than regulatory intervention costs, the stable strategy for all parties is (Intervention, Non-Investment, Establishment) (Table 7).
Table 7
| Equilibrium point | Eigenvalues | ESS | ||
|---|---|---|---|---|
| (0, 0, 0) | – | – | + | Unstable Point |
| (0, 0, 1) | + | – | – | Unstable Point |
| (0, 1, 0) | +, – | + | + | Unstable Point |
| (0, 1, 1) | +, – | + | + | Unstable Point |
| (1, 0, 0) | + | – | + | Unstable Point |
| (1, 0, 1) | – | – | – | Stable Point |
| (1, 1, 0) | +, – | + | +, – | Unstable Point |
| (1, 1, 1) | +, – | + | +, – | Unstable Point |
Stability analysis of E6(1, 0, 1).
Proposition 4: If , and , the stable strategy is (1, 1, 0). That is, when government intervention benefits exceed incentive and intervention costs, and the combined incentives, risk compensation, and reputational gains for banks from establishing exclusive financial products are outweighed by their costs, the stable strategy for all parties is (Intervention, Investment, Non-Establishment) (Table 8).
Table 8
| Equilibrium point | Eigenvalues | ESS | ||
|---|---|---|---|---|
| (0, 0, 0) | – | + | +, – | Unstable Point |
| (0, 0, 1) | +, – | + | +, – | Unstable Point |
| (0, 1, 0) | + | – | + | Unstable Point |
| (0, 1, 1) | +, – | – | + | Unstable Point |
| (1, 0, 0) | + | + | +, – | Unstable Point |
| (1, 0, 1) | +, – | + | +, – | Unstable Point |
| (1, 1, 0) | – | – | – | Stable Point |
| (1, 1, 1) | +, – | – | + | Unstable Point |
Stability analysis of (1, 1, 0).
Proposition 5: If , and , the stable strategy is (1, 1, 1). That is, when government intervention benefits exceed costs, enterprise investment returns with subsidies outweigh risks and costs, and the combined incentives, risk compensation, and reputational gains for banks from establishing exclusive financial products exceed their costs, the stable strategy for all parties is (Intervention, Investment, Establishment) (Table 9).
Table 9
| Equilibrium point | Eigenvalues | ESS | ||
|---|---|---|---|---|
| (0, 0, 0) | – | + | +, – | Unstable Point |
| (0, 0, 1) | +, – | + | +, – | Unstable Point |
| (0, 1, 0) | + | – | + | Unstable Point |
| (0, 1, 1) | + | – | + | Unstable Point |
| (1, 0, 0) | + | + | +, – | Unstable Point |
| (1, 0, 1) | +, – | + | +, – | Unstable Point |
| (1, 1, 0) | – | – | + | Unstable Point |
| (1, 1, 1) | – | – | – | Stable Point |
Stability analysis of (1, 1, 1).
5 Simulation and sensitivity analysis
Based on the proposed model, numerical simulations were conducted using parameter values derived from a local government policies and survey data from a commercial bank, which capture the relative relationships among variables (e.g., the balance between subsidies, costs, risks, and returns) in order to reflect realistic decision-making dynamics. Since the stable strategy (Intervention, Investment, Establishment) under Proposition 5 represents an ideal state for all parties, this study focuses on sensitivity analysis for Proposition 5. Parameter assignments are as follows: , , , = , = , , , , , , , , , , , , , , , . Among the variables, means the loan volume of the enterprise and means the total mortgage loan volume of the bank.
The evolutionary trajectories (Figure 1) demonstrate that when: 1) Government intervention benefits exceed its costs, 2) Enterprise investment returns and subsidies outweigh investment risks and costs, 3) The combined government incentives, risk compensation, and reputational benefits for banks from establishing exclusive financial products surpass the difference between input costs and additional benefits, the stable strategy for all parties remains ((intervention, Investment, Establishment).
Figure 1
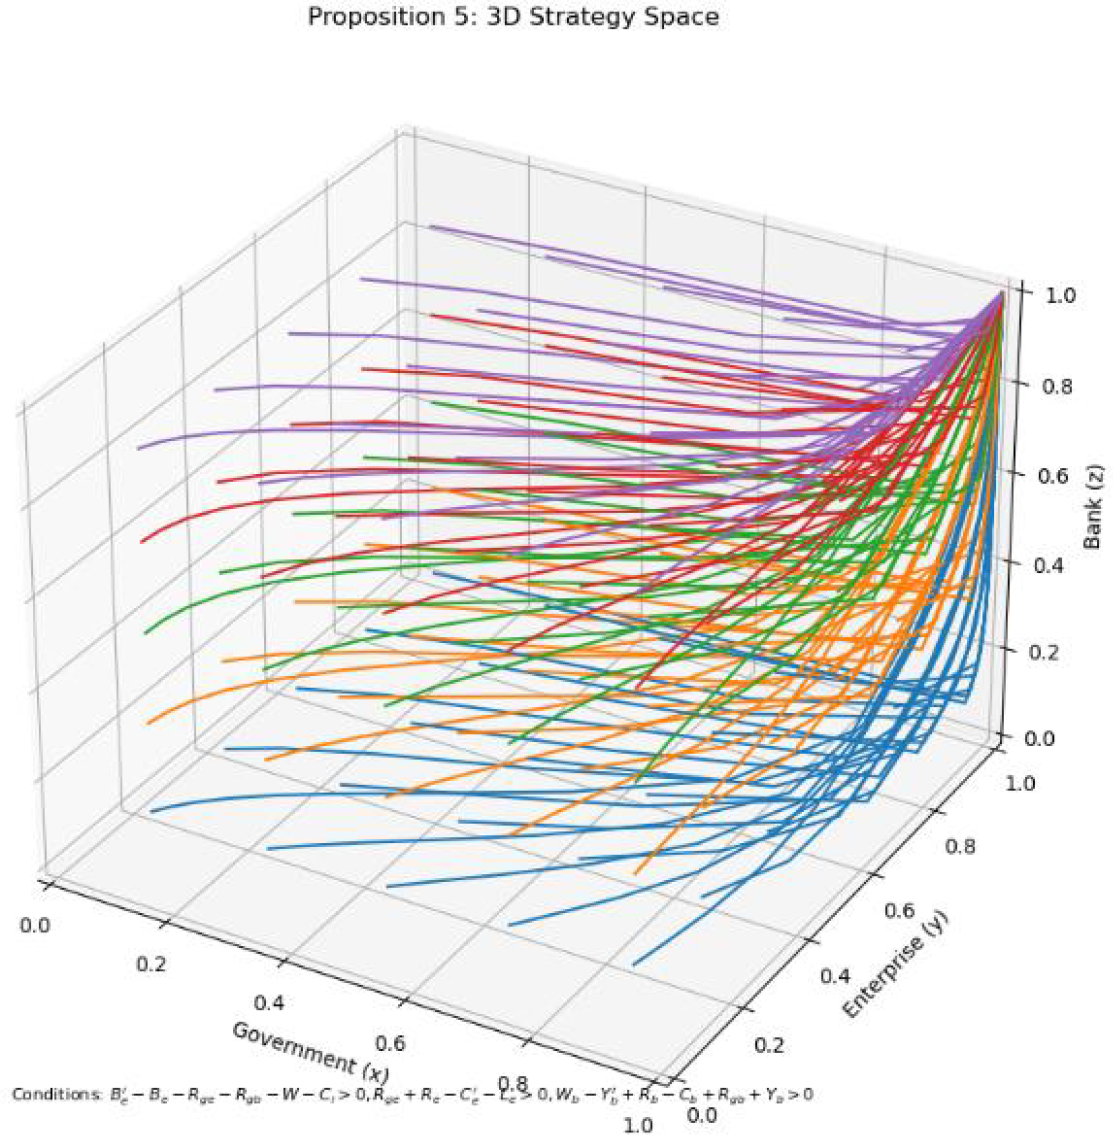
The evolutionary game trajectories of proposition 5.
5.1 Adjustment to enterprise investment returns ()
The evolutionary trends, as illustrated in Figure 2, reveal that when is low (e.g., ), enterprise returns are insufficient to offset investment costs () and risks (), leading to suppressed participation from enterprises (), banks (), and government (). However, as increases to higher levels (e.g., ), enterprise profits significantly surpass costs and risks, driving enterprise participation () toward full engagement (). This surge in enterprise activity stimulates market vibrancy, prompting banks () to actively participate by establishing exclusive financial products, while government intervention () intensifies to its maximum level. Notably, at high , the strategies of all three parties converge toward comprehensive cooperation (), demonstrating that robust enterprise returns not only incentivize investment but also amplify market-driven participation from banks and governments through synergistic effects.
Figure 2
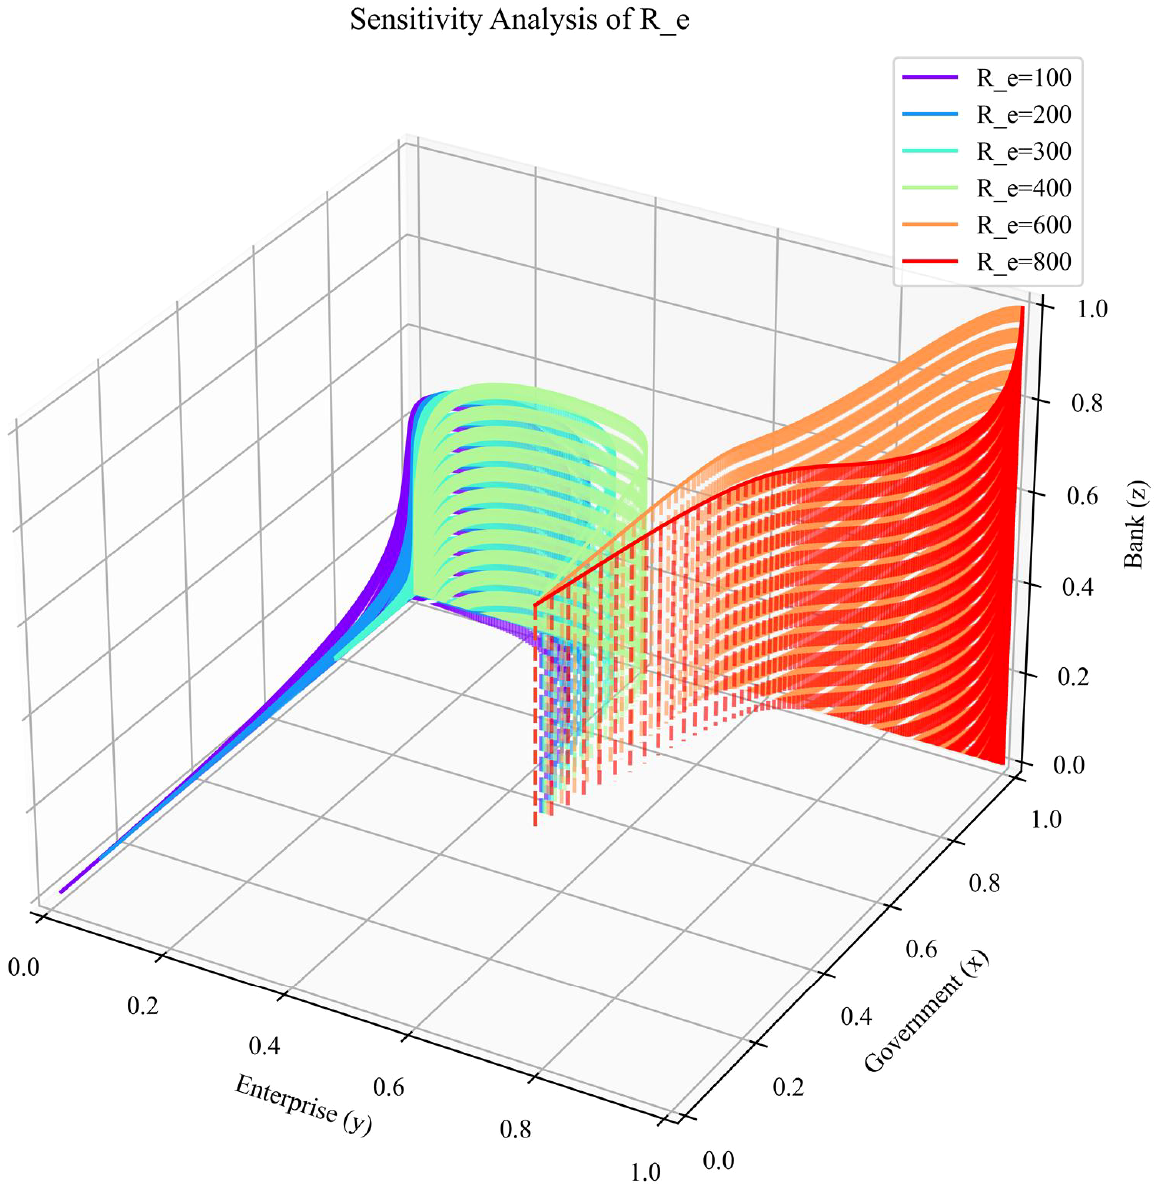
Sensitivity analysis on enterprise investment returns ().
These findings yield practical insights for policymakers and stakeholders. First, enterprise profitability emerges as the key of collaboration. Without sufficient returns, neither policy support nor financial incentives can sustain effective cooperation. Second, bank behavior exhibits a dependency on market dynamics. Increased enhances market activity, enabling banks to offset costs through profits from exclusive financial products, though their participation often lags behind enterprise engagement. Third, government intervention plays a pivotal but context-dependent role. At low , targeted policies are essential to stimulate enterprise and bank participation. As rises, market mechanisms gradually dominate, suggesting that policies should focus on leveraging critical thresholds rather than sustained intervention.
For banks, optimizing financial product design is recommended. Tailored financing solutions for high-risk, high-reward sectors such as marine equipment and shipping could attract enterprises while enhancing profitability through differentiated services.
5.2 Adjustment to government incentives for enterprises ()
The evolutionary trends, as illustrated in Figure 3, highlight that at minimal incentive levels (e.g., ), enterprises face insufficient compensation for costs () and risks (), necessitating high bank participation () to achieve full cooperation (). As increases, enterprises progressively shift toward participation even under lower bank engagement, underscoring the substitutive relationship between government subsidies and market-driven bank support.
Figure 3
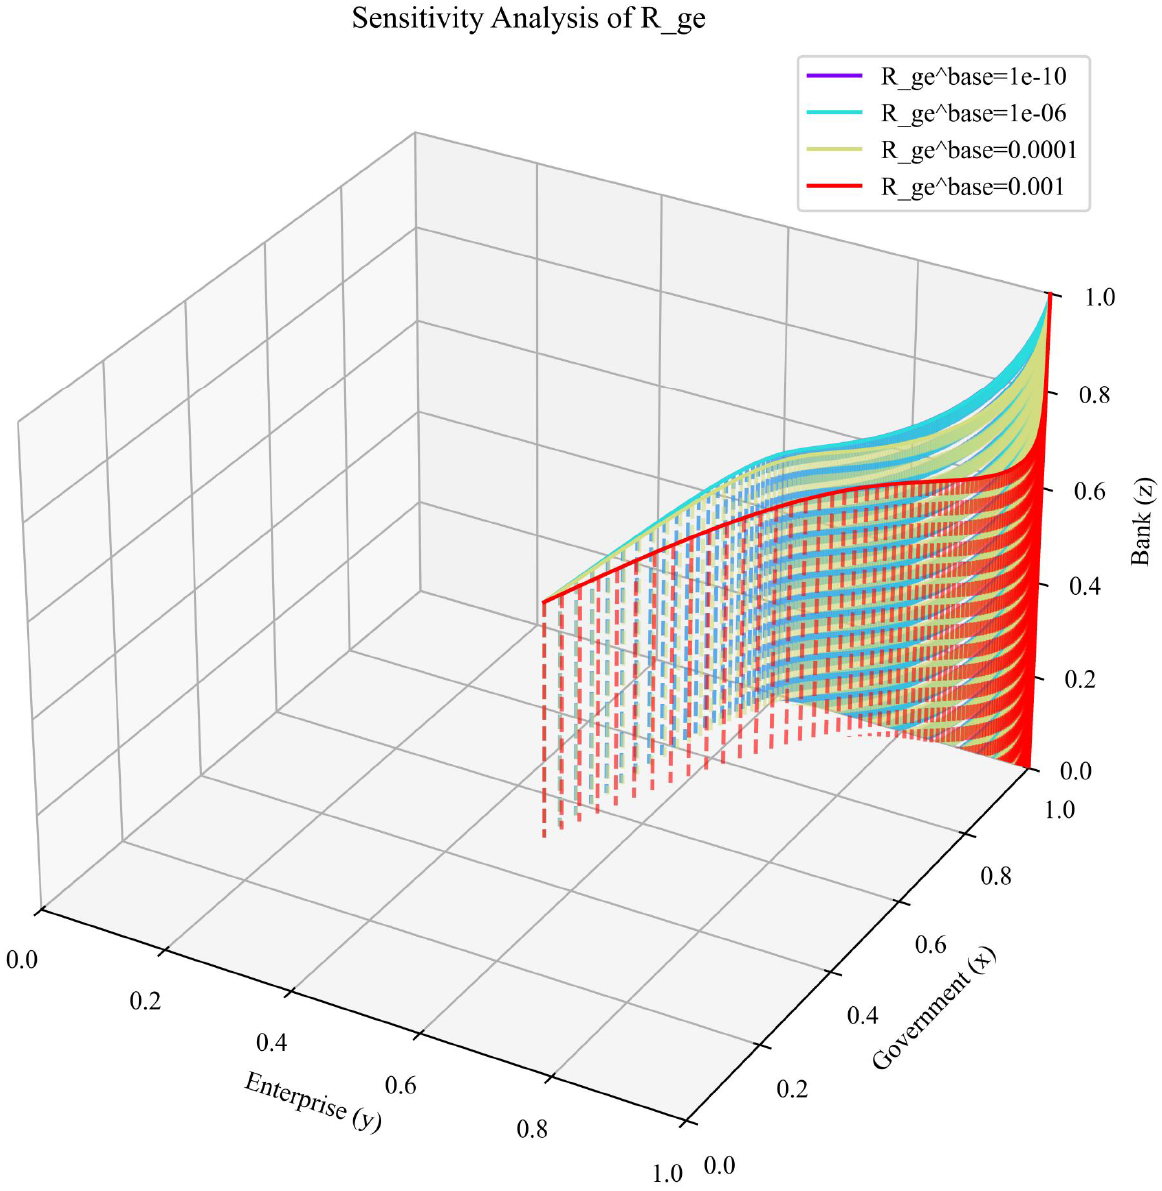
Sensitivity analysis on government incentives for enterprises ().
This analysis underscores the interconnectedness of market actors. Enterprise participation amplifies bank engagement, reflecting a feedback loop where policy effects propagate across stakeholders. Policymakers must account for such synergies to maximize intervention efficacy. For banks, aligning with government subsidy phases presents strategic opportunities. During periods of heightened subsidies, expanding client acquisition and refining sector-specific financial products could enhance profitability.
5.3 Adjustment to government incentives for banks ()
The evolutionary trends, as illustrated in Figure 4, demonstrates that at low incentive levels (e.g., ), banks exhibit minimal participation (), which cascades into suppressed engagement from enterprises () and government (). Raising (e.g., ) significantly boosts bank profitability, driving rapid convergence toward full cooperation (). This emphasizes the dual role of : offsetting initial costs for banks while catalyzing broader market participation.
Figure 4
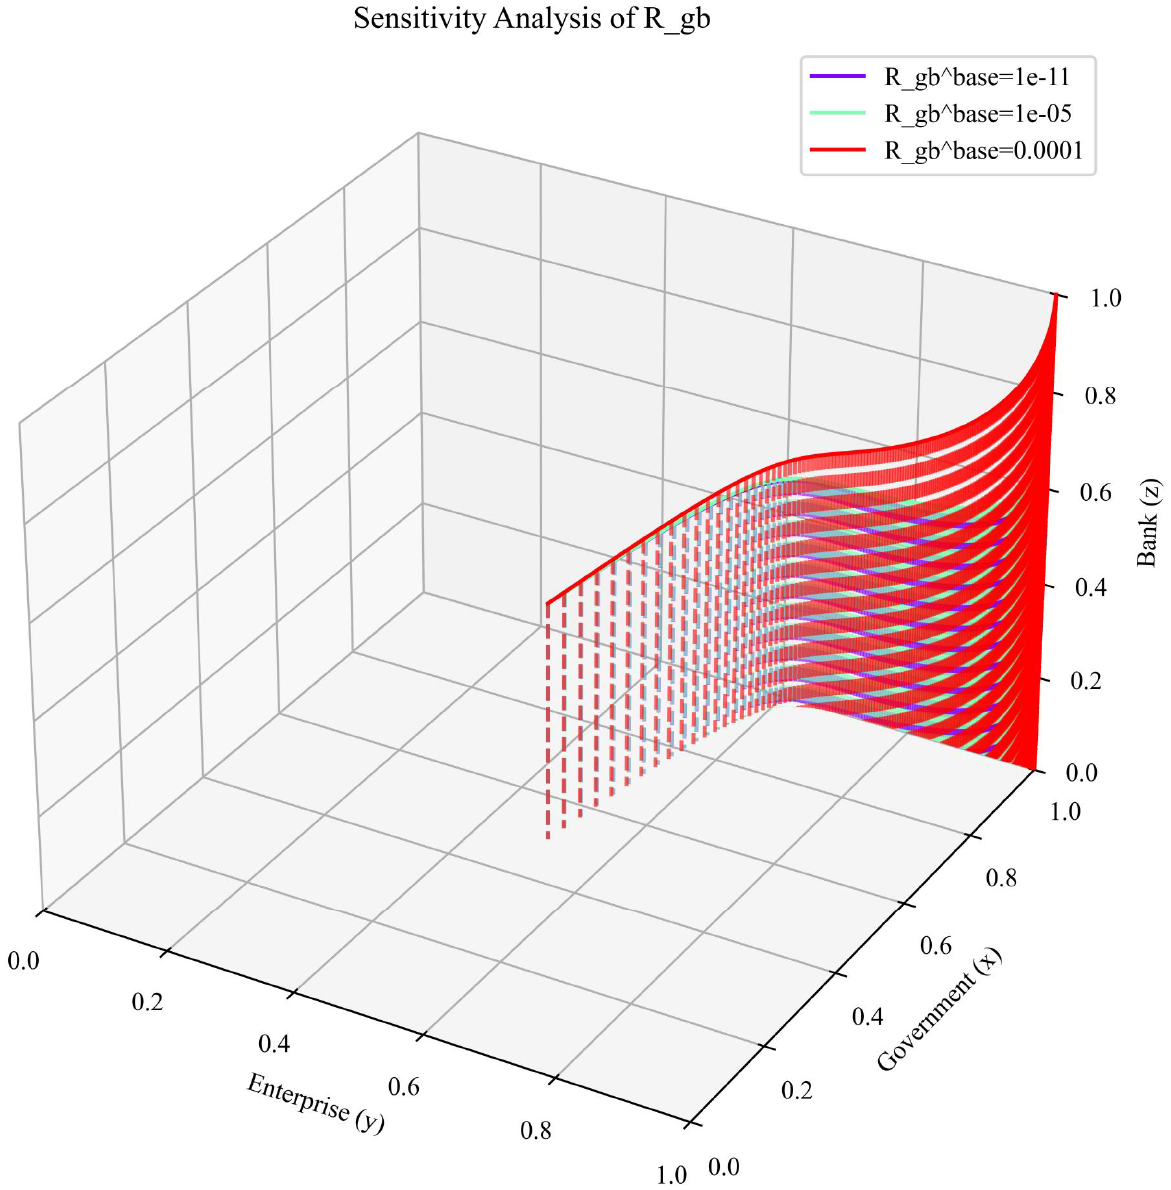
Sensitivity analysis on government incentives for banks ().
This analysis illustrates a phased incentive strategy is recommended. During early market phases, elevated can mitigate bank costs for establishing exclusive financial products. As market mechanisms mature, incentives should taper to allow banks to transition toward self-sustaining, market-driven revenue models.
6 Government and bank strategies considering marine industry heterogeneity
6.1 Parameter setting
To analyze diverse marine sectors, distinct parameter sets are defined as shown in Table 10. First, baseline parameters are established for three marine sectors—shipping, desalination, and marine equipment—capturing industry-specific characteristics (e.g., risk, expected returns, and investment costs). Second, parameters are calibrated and adjusted based on sectoral attributes to reflect differentiated dynamics among stakeholders (government, banks, and enterprises).
Table 10
| Parameter | Shipping | Desalination | Marine equipment |
|---|---|---|---|
| Risk | 0.6 | 0.2 | 0.4 |
| Expected Return | 1.8 | 1.1 | 1.5 |
| Investment Cost | 2000 | 800 | 1500 |
| Government Support | 1.5 | 1.8 | 1.3 |
| Bank Interest | 1.2 | 0.9 | 1.0 |
| Initial Participation | 0.3 | 0.7 | 0.5 |
Parameter settings for different marine industries.
The rationales of parameter setting are as follows:
-
Shipping: Characterized by high risk (0.6) and investment costs (2000), this sector exhibits substantial expected returns (1.8) and strong government support (1.5). A bank interest rate (1.2) reflects higher profitability for banks but may elevate financing costs for enterprises. The low initial enterprise participation (0.3) suggests high entry barriers, necessitating policy interventions (e.g., subsidies, reduced financing costs) to enhance engagement during the evolutionary process.
-
Desalination: With the lowest risk (0.2) and investment costs (800), this sector offers modest returns (1.1) but benefits from the highest government support (1.8). High initial enterprise participation (0.7) indicates a policy-driven market. A low bank interest rate (0.9) reduces financing costs but may dampen bank enthusiasm. While collaboration between enterprises and banks stabilizes easily due to low risk, sustaining bank engagement remains critical.
-
Marine Equipment: Moderate risk (0.4), investment costs (1500), and returns (1.5) define this sector. Government support (1.3) and bank interest (1.0) are balanced, requiring coordinated incentives to align stakeholder interests. Evolutionary outcomes depend on balancing risk, returns, and financing costs through targeted policy measures.
6.2 Comparative analysis of evolutionary results
The evolutionary trajectories of three marine industries—shipping, desalination, and marine equipment—are analyzed under distinct parameter configurations, as illustrated in Figure 5.
Figure 5
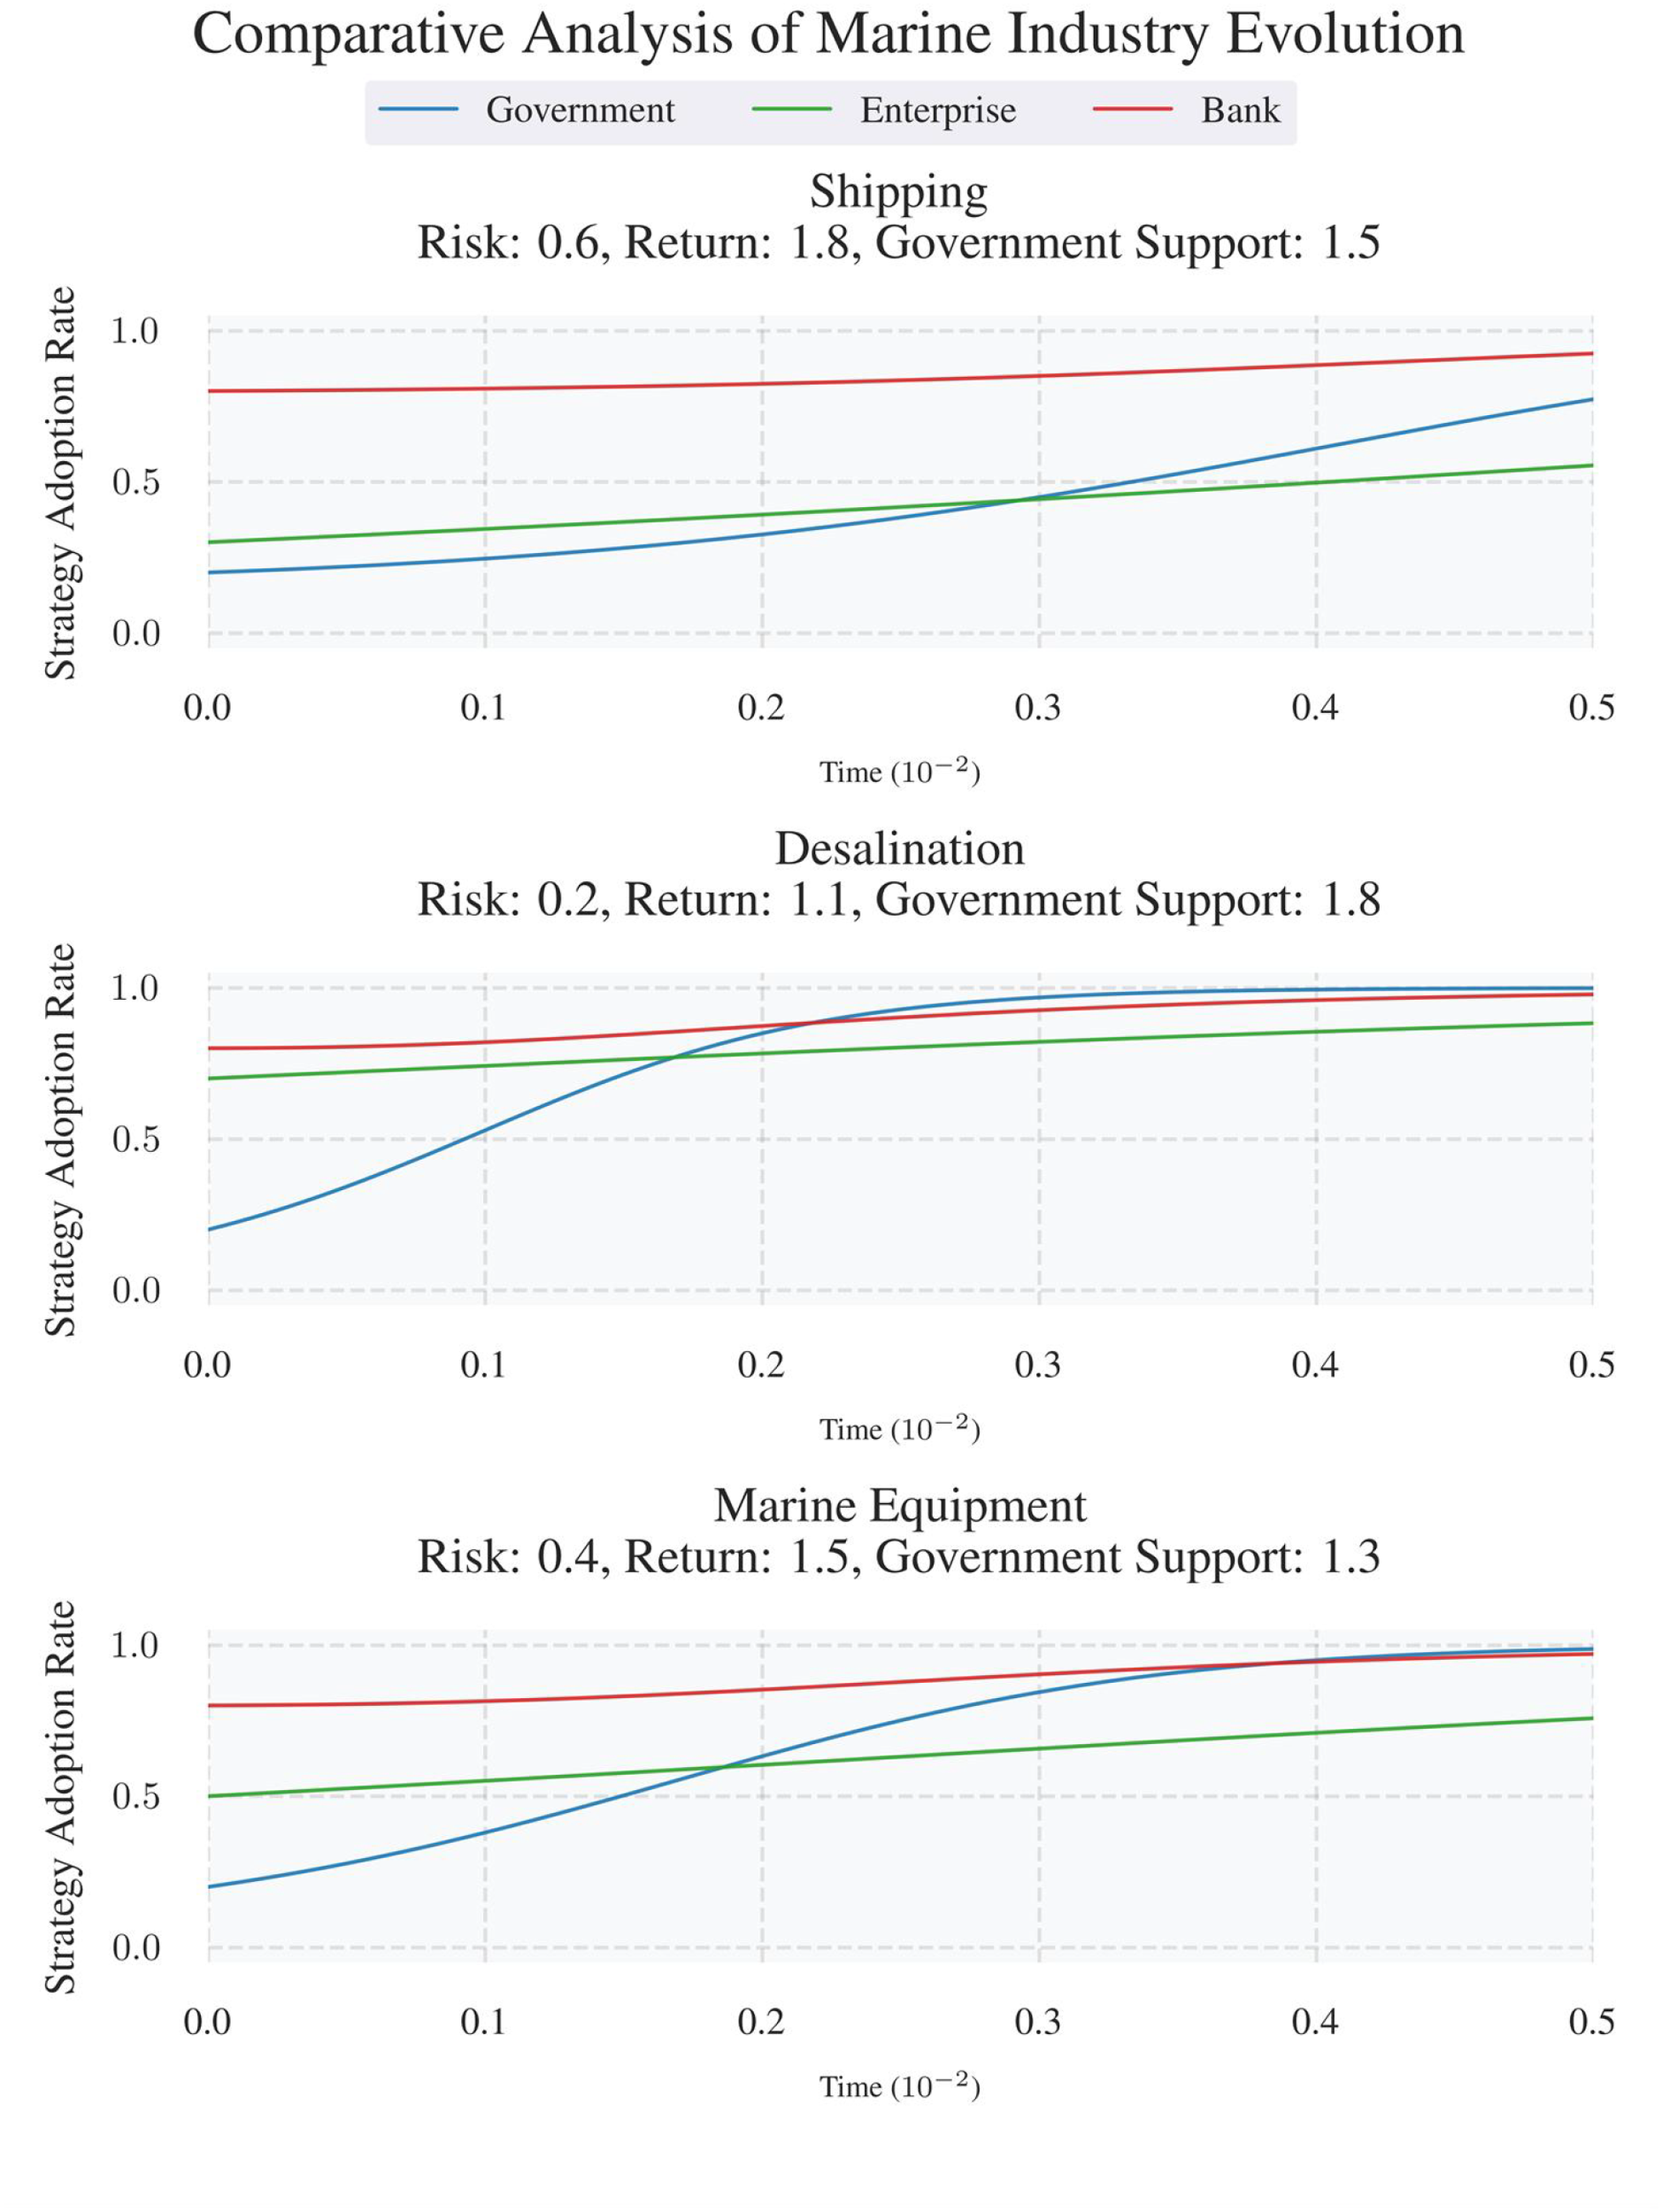
Comparative evolutionary analysis of different marine industries.
The shipping industry, characterized by the highest risk profile, shows a distinct balance between risk and return. Despite high operational risks, its strong profit potential attracts policy support and allows banks to charge higher interest rates. In contrast, desalination carries low risk but offers limited returns, making it heavily dependent on government initiatives while struggling to attract banks due to weak profitability incentives. The marine equipment sector lies in between, with moderate risk–return dynamics that require balanced coordination among stakeholders to sustain growth.
Initial enterprise participation also plays a critical role. Desalination, with relatively high early participation, quickly stabilizes collaborative networks. Shipping, however, requires longer resource allocation and targeted policy support to overcome entry barriers. This contrast highlights the importance of early-stage engagement in accelerating industry development.
Furthermore, government support intensity and financing costs significantly influence evolutionary outcomes. For instance, desalination benefits from the strongest policy backing, which facilitates stakeholder collaboration, yet its low bank interest rates undermine financial institution participation. Conversely, the shipping industry’s high returns incentivize bank involvement but necessitate policy safeguards to mitigate excessive financing costs for enterprises.
Guided by these insights, sector-specific policy recommendations are proposed. For the shipping industry, policymakers should prioritize mechanisms to reduce enterprise financing costs while maintaining risk-compensatory subsidies, ensuring that high interest rates do not stifle participation. Desalination requires enhanced bank engagement through fiscal subsidies or risk-sharing frameworks to counterbalance low profitability-driven disincentives. For marine equipment, a balanced strategy is advised, combining dynamic adjustments to bank interest rates and calibrated government support to stabilize growth amid moderate risk-return conditions. These recommendations emphasize adaptive governance models that align policy tools with sector-specific risk profiles, financing structures, and stakeholder incentives.
7 Conclusions
To find optimal strategies for financial support, this study constructs an evolutionary game model involving the government, banks, and marine enterprises. Through theoretical modeling, numerical simulations, sensitivity analyses, and comparative assessments across marine industries such as shipping, desalination, and marine equipment, the following key conclusions and policy implementation are given:
For banks, a phased incentive mechanism should be implemented according to the level of enterprise investment activity and market maturity.
(1) Initial stage – Stimulating market participation:
When enterprise investment and overall market activity remain low, the government should increase subsidies to banks while providing necessary risk compensation. For instance, a 0.01% subsidy on the bank’s total loan volume could be granted to offset the costs of establishing exclusive marine financial products and encourage lending to maritime sectors. This fiscal support helps banks overcome the high entry costs and perceived credit risks associated with early-stage marine projects.
(2) Growth stage – Transitioning toward market-based returns:
As the market mechanism gradually becomes effective and enterprise participation increases, the government should reduce direct subsidies while maintaining a moderate level of risk compensation. At this stage, banks are expected to obtain profits primarily through market-oriented operations—such as differentiated interest rates, service innovation, or portfolio diversification—thereby promoting a self-sustaining financial ecosystem for the ocean economy.
For maritime enterprises, differentiated policy approaches are given based on different categories of risks and returns across marine sectors.
-
For high-risk and high-return sectors such as shipping, in addition to general policy support—such as government-provided risk compensation or carbon reduction rewards—attention should be paid to reducing enterprise financing costs to ensure that high lending rates do not excessively discourage participation. Targeted measures, including interest subsidies or credit guarantee schemes, can effectively balance financial risks while sustaining long-term investment incentives. From the financial institution perspective, banks should design risk-linked marine finance instruments, such as ESG-linked ship loans, blue carbon bonds, or marine insurance–backed credit facilities, to internalize environmental performance and risk control within loan pricing. These instruments can simultaneously reduce default risk and enhance banks’ reputational benefits.
-
For low-risk and low-return sectors such as desalination, it is necessary to enhance banks’ willingness to participate through fiscal subsidies or risk-sharing mechanisms. These instruments can compensate for the limited profitability and low interest margins of desalination projects, thereby improving banks’ motivation to provide long-term financing and supporting steady industrial expansion. Banks can further introduce green finance products such as long-term concessional loans for desalination infrastructure, water-rights–backed asset financing, or environmental performance credit lines. These products align with the sector’s sustainability goals while providing predictable, low-risk returns that fit banks’ regulatory capital requirements.
-
For medium-risk and medium-return sectors such as marine equipment, a balanced and adaptive strategy is recommended. The government may provide tax deductions or technological upgrading grants to stimulate innovation, while closely monitoring and dynamically adjusting both interest rate levels and fiscal support intensity. Such coordination can help maintain industry stability and promote sustained, innovation-driven growth. Correspondingly, banks are encouraged to develop supply-chain and innovation-oriented financing models, such as order-based financing, equipment leasing credit, and R&D-linked revolving loans. These products connect financing with production and innovation activities, improving liquidity across the industrial chain while reducing overall credit risk.
Overall, this study demonstrates that effective financial support for the ocean economy hinges on dynamic coordination among government policy tools, bank financial innovations, and enterprise investment behavior. The evolutionary game framework offers a valuable approach to capturing these interdependencies and guiding the construction of a resilient marine financial ecosystem. Nevertheless, several limitations remain. In particular, the practical implementation of the proposed recommendations may face barriers such as regulatory requirements across different regions and marine industries, and uncertain market responses. While the model offers useful theoretical insights, translating them into practice calls for further empirical validation and case-specific investigation, which represents an important direction for future research.
Statements
Data availability statement
The original contributions presented in the study are included in the article/supplementary material. Further inquiries can be directed to the corresponding author.
Author contributions
ZC: Writing – original draft, Supervision, Conceptualization. SW: Formal Analysis, Project administration, Writing – review & editing. CL: Writing – review & editing, Methodology.
Funding
The author(s) declared that financial support was received for this work and/or its publication. The authors declare that this study received funding from Zhejiang Provincial Soft Science Research Program Project (160100-F92501). The funder was not involved in the study design, collection, analysis, interpretation of data, the writing of this article, or the decision to submit it for publication.
Conflict of interest
The authors declared that this work was conducted in the absence of any commercial or financial relationships that could be construed as a potential conflict of interest.
Generative AI statement
The author(s) declared that generative AI was not used in the creation of this manuscript.
Any alternative text (alt text) provided alongside figures in this article has been generated by Frontiers with the support of artificial intelligence and reasonable efforts have been made to ensure accuracy, including review by the authors wherever possible. If you identify any issues, please contact us.
Publisher’s note
All claims expressed in this article are solely those of the authors and do not necessarily represent those of their affiliated organizations, or those of the publisher, the editors and the reviewers. Any product that may be evaluated in this article, or claim that may be made by its manufacturer, is not guaranteed or endorsed by the publisher.
References
1
An H. Yang R. Ma X. Zhang S. Islam S. M. N. (2021). An evolutionary game theory model for the inter-relationships between financial regulation and financial innovation. North Am. J. Econ Finance55, 101341. doi: 10.1016/j.najef.2020.101341
2
Chen J. Xiong W. Xu L. Di Z. (2021). Evolutionary game analysis on supply side of the implement shore-to-ship electricity. Ocean Coast. Manage.215, 105926. doi: 10.1016/j.ocecoaman.2021.105926
3
Ding L. Zhao Z. Wang L. (2023). Exploring the role of technical and financial support in upgrading the marine industrial structure in the Bohai Rim region: Evidence from coastal cities. Ocean Coast. Manage.243, 106659. doi: 10.1016/j.ocecoaman.2023.106659
4
Du J. Li J. Li J. Li W. (2023). Competition–cooperation mechanism of online supply chain finance based on a stochastic evolutionary game. Operational Res.23, 55. doi: 10.1007/s12351-023-00792-8
5
Friedman D. (1998). On economic applications of evolutionary game theory. J. Evolutionary Econ8, 15–43. doi: 10.1007/s001910050054
6
Gao W. Guo W. Zhou S. Wu S. Yang Z. (2023). The evolution of the relationship among stakeholders in port integration: Evidence from tripartite evolutionary game analysis. Ocean Coast. Manage.240, 106628. doi: 10.1016/j.ocecoaman.2023.106628
7
Gao L. Yan A. Yin Q. (2022). An evolutionary game study of environmental regulation strategies for marine ecological governance in China. Front. Mar. Sci.9. doi: 10.3389/fmars.2022.1048034
8
Greiner D. Periaux J. Emperador J. M. Galván B. Winter G. (2017). Game theory based evolutionary algorithms: A review with Nash applications in structural engineering optimization problems. Arch. Comput. Methods Eng.24, 703–750. doi: 10.1007/s11831-016-9187-y
9
Guo R. Xiao G. Zhang C. Li Q. (2025). A study on influencing factors of port cargo throughput based on multi-scale geographically weighted regression. Front. Mar. Sci.12. doi: 10.3389/fmars.2025.1637660
10
Han H. Yuanyuan H. Shuyu L. WeiweI L. (2019). Marine financial development and China’s marine economic strategy. J. Coast. Res.94, 585–588. doi: 10.2112/SI94-116.1
11
Jiang J. Ma Z. Lin L. Yuan Y. Fu X. (2023). Analysis of the evolutionary game between maritime regulators and carriers under the discharge of ballast nuclear wastewater from ships. Ocean Coast. Manage.238, 106558. doi: 10.1016/j.ocecoaman.2023.106558
12
Jie P. (2024). The mechanism and path of financial system empowering high quality development of marine economy. Ind. Economic Rev.15, 86–94. 10.14007/j.cnki.cjpl.2024.03.006
13
Jie S. Gui-Ming L. Zhe-Li H. Xiao-Fan L. (2024). The impact of green finance on the ESG performanceof marine-related enterprises. Ind. Economic Rev.15, 95–109. 10.14007/j.cnki.cjpl.2024.03.007
14
Johari M. Hosseini-Motlagh S.-M. (2024). An evolutionary game theory approach for analyzing risk-based financing schemes. Ann. Operations Res.336, 1637–1660. doi: 10.1007/s10479-023-05308-3
15
Leng J. Qi X . (2024). A differential game model for marine ranching development decisions between government and marine ranching enterprises considering myopic behavior. Marine Development2 (1), 1–26.
16
Li K. X. Lin K. C. Jin M. Yuen K. F. Yang Z. Xiao Y . (2020). Impact of the belt and road initiative on commercial maritime power. Transp. Res. A Policy Pract., 135, 160–167.
17
Lin X. Qian-Ru L. Chen Y. (2019). An analysis of the correlation between financial development and marine economy and measuring the financial support efficiency in marine industry in China. J. Stat Inf.34, 64–75. doi: CNKI:SUN:TJLT.0.2019-03-009
18
Ling N. Zeming S. (2020). Marine environmental regulation, marine financial support and marine industrial structure upgrade: an empirical analysis based on GMM estimation of dynamic panel. Ecol. Economy36, 151–156. doi: CNKI:SUN:STJJ.0.2020-06-027
19
Liu J. Wang J. Xu C. Jiang J. J. E. I. (2024). Spatial and temporal change assessment of marine ecological security in regions along the Maritime Silk Road. Ecol. Indic.166, 112576. doi: 10.1016/j.ecolind.2024.112576
20
Ma H. Hou G. (2024). Study on the evolution of collaborative innovation in marine economy considering the participation of financial institutions and two types of cooperation. Heliyon10, e26450. doi: 10.1016/j.heliyon.2024.e26450
21
Ma W. Li Y. Ding L. (2023). Does marine financial policy affect total factor productivity of marine enterprises? An empirical evidence based on Chinese first guidance on strengthening finance for marine economy. Mar. pollut. Bull.195, 115493. doi: 10.1016/j.marpolbul.2023.115493
22
Mahan A. T. (2012). The influence of sea power upon history 1660-1783 (Scientia Militaria: South African Journal of Military Studies, Courier Corporation).
23
Maritime and Port Authority of Singapore . (2018). Enhancement of the maritime sector incentive – SHIPPING ENTERPRISE (SINGAPORE REGISTRY OF SHIPS) (MSI-SRS). Available online at: https://www.mpa.gov.sg/docs/mpalibraries/circulars-and-notices/shipping-circulars/-sc_no_16_of_2018.pdf?sfvrsn=6e486e3f_0.
24
Mu G. Wang Y. Gao N. Li X . (2023). A novel tripartite evolutionary game model for internet consumer financial regulation. Sage Open, 13 (3). doi: 21582440231194212
25
Narula K. (2019). The maritime dimension of sustainable energy security, Lecture Notes in Energy, ( Springer).
26
OECD (2022). OECD work in support of a sustainable ocean. Available online at: https://intaros.nersc.no/sites/intaros.nersc.no/files/OECD-work-in-support-of-a-sustainable-ocean.pdf (Accessed October 15, 2025).
27
OECD . (2025). Resilient Growth but with Increasing Fragilities, OECD Economic Outlook. 2025 (2). Available online at: https://www.oecd-ilibrary.org/en/publications/oecd-economic-outlook-volume-2025-issue-2_9f653ca1-en.html?utm_source (Accessed October 15, 2025).
28
Peng Q. Wang C. (2023). Dynamic evolutionary game and simulation with embedded pricing model for channel selection in shipping supply chain. Appl. Soft Computing144, 110519. doi: 10.1016/j.asoc.2023.110519
29
Sheng X. U. Lu B. Yue Q. (2021). Impact of sci-tech finance on the innovation efficiency of China’s marine industry. Mar. Policy133, 104708. doi: 10.1016/j.marpol.2021.104708
30
Shi-Jun D. (2024). Marine financial policies and financing constraints of marine-related enterprises: who can benefit? Ind. Economic Rev.15, 110–126. doi: 10.14007/j.cnki.cjpl.2024.03.008
31
Su C.-W. Song Y. Umar M. (2021). Financial aspects of marine economic growth: From the perspective of coastal provinces and regions in China. Ocean Coast. Manage.204, 105550. doi: 10.1016/j.ocecoaman.2021.105550
32
Suárez-De Vivero J. L. Mateos J. C. R. Del Corral D. F. Barragán M. J. Calado H. Kjellevold M. et al . (2019). Food security and maritime security: A new challenge for the European Union’s ocean policy. Mar. Policy, 108, 103640. doi: 10.1016/j.marpol.2019.103640
33
Sumaila U. R. Walsh M. Hoareau K. Cox A. Teh L. Abdallah P. et al . (2021). Financing a sustainable ocean economy. Nat. Commun.12, 3259. doi: 10.1038/s41467-021-23168-y
34
Sun Y. Chen D. Geng Z. (2024b). The coordination of technological and financial innovation concepts on the marine economy and its ecological development. J. Sea Res.197, 102468. doi: 10.1016/j.seares.2024.102468
35
Sun Y.-L. Du Y.-W. Wang Y.-C. (2024a). Ecodevelopment strategy selection and case simulation of marine ranching enterprises based on evolutionary games. Regional Stud. Mar. Sci.69, 103336. doi: 10.1016/j.rsma.2023.103336
36
Tianjin Municipal People’s Government . (2023). Notice on Issuing the Detailed Rules for the Implementation of Encouraging Shipping Finance Development in Tianjin Municipality (Trial). Available online at: https://jrgz.tj.gov.cn/xxfb/tzggl_1/202306/t20230619_6326964.html (Accessed March 10, 2025).
37
Thompson B. S. (2022). Blue bonds for marine conservation and a sustainable ocean economy: Status, trends, and insights from green bonds. Mar. Policy144, 105219. doi: 10.1016/j.marpol.2022.105219
38
UNCTAD (2023). Review of maritime transport. Available online at: https://unctad.org/publication/review-maritime-transport-2023 (Accessed October 30, 2025).
39
UNDP (2022). Financing the blue economy. Available online at: https://www.undp.org/sites/g/files/zskgke326/files/2022-09/Financing%20the%20Blue%20Economy.pdf (Accessed October 30, 2025).
40
Vanderklift M. A. Marcos-Martinez R. Butler J. R. A. Coleman M. Lawrence A. Prislan H. et al . (2019). Constraints and opportunities for market-based finance for the restoration and protection of blue carbon ecosystems. Mar. Policy107, 103429. doi: 10.1016/j.marpol.2019.02.001
41
Wabnitz C. C. C. Blasiak R. (2019). The rapidly changing world of ocean finance. Mar. Policy107, 103526. doi: 10.1016/j.marpol.2019.103526
42
Wang S. Lu B. Yin K. (2021b). Financial development, productivity, and high-quality development of the marine economy. Mar. Policy130, 104553. doi: 10.1016/j.marpol.2021.104553
43
Wang Q. Man S. Wang Y. (2024). Evolutionary game analysis between regional governments and shipping companies: Considering the impact of government subsidy on shipping companies. Mar. pollut. Bull.205, 116655. doi: 10.1016/j.marpolbul.2024.116655
44
Wang J. Shi X. Du Y. (2021a). Exploring the relationship among marine science and technology innovation, marine finance, and marine higher education using a coupling analysis: A case study of China’s coastal areas. Mar. Policy132, 104706. doi: 10.1016/j.marpol.2021.104706
45
Wang T. Xiao G. Li Q. Biancardo S. A. (2025). The impact of the 21st-Century Maritime Silk Road on sulfur dioxide emissions in Chinese ports: based on the difference-in-difference model. Front. Mar. Sci.12. doi: 10.3389/fmars.2025.1608803
46
Weidong C. Yindan Y. (2024). Marine Economy Development and Financial Support: Current Status, Prospects, and Policy Recommendations. Southwest Finance11, 3–15.
47
Xiao G. Amamoo-Otoo C. Wang T. Li Q. Biancardo S. A. (2025). Evaluating the impact of ECA policy on sulfur emissions from the five busiest ports in America based on difference in difference model. Front. Mar. Sci.12. doi: 10.3389/fmars.2025.1609261
48
Xiao G. Cui W. (2023). Evolutionary game between government and shipping enterprises based on shipping cycle and carbon quota. Front. Mar. Sci.10. doi: 10.3389/fmars.2023.1132174
49
Xu L. Di Z. Chen J. (2021a). Evolutionary game of inland shipping pollution control under government co-supervision. Mar. pollut. Bull.171, 112730. doi: 10.1016/j.marpolbul.2021.112730
50
Xu L. Di Z. Chen J. Shi J. Yang C. (2021b). Evolutionary game analysis on behavior strategies of multiple stakeholders in maritime shore power system. Ocean Coast. Manage.202, 105508. doi: 10.1016/j.ocecoaman.2020.105508
51
Xu T. Dong J. Qiao D. (2023). China’s marine economic efficiency: A meta-analysis. Ocean Coast. Manage.239, 106633. doi: 10.1016/j.ocecoaman.2023.106633
52
Xu L. Huang J. Fu S. Chen J. (2025a). Evaluation of navigation capacity in the Northeast Arctic passage: evidence from multiple factors. Maritime Policy Manage.52, 497–513. doi: 10.1080/03088839.2024.2376126
53
Xu L. Wu J. Yan R. Chen J. (2025b). Is international shipping in right direction towards carbon emissions control? Transport Policy166, 189–201. doi: 10.1016/j.tranpol.2025.03.009
54
Yan B. Zhuo C. Chang Y. Zhenyu Z. And Kang H. (2024). Evolutionary multiplayer game analysis of accounts receivable financing based on supply chain financing. Int. J. Production Res.62, 8110–8128. doi: 10.1080/00207543.2021.1976432
55
Yong Y. (2020). The development and strategy of marine finance businesses in commercial banks. J. Coast. Res.107, 241–244. doi: 10.2112/JCR-SI107-061.1
56
Zeyu W. Linhui C. Yanxi W. Zenglin H. (2023). Development level measurement and dynamic evolution of the modern marine industrial system: based on the synergetic development perspective. Economic Geogr.43, 77–87. doi: 10.15957/j.cnki.jjdl.2023.07.008
57
Zhuang X. (2020). Relationship between financial innovation and marine economic growth: A VAR-based model. J. Coast. Res.106, 61–64. doi: 10.2112/SI106-016.1
Summary
Keywords
ocean economy, marine finance, evolutionary game theory, policy incentives, shipping industry
Citation
Chen Z, Wang S and Lin C (2026) Designing effective financial pathways for ocean economy: a tripartite evolutionary game perspective. Front. Mar. Sci. 12:1683262. doi: 10.3389/fmars.2025.1683262
Received
12 August 2025
Revised
31 October 2025
Accepted
09 December 2025
Published
08 January 2026
Volume
12 - 2025
Edited by
Lang Xu, Shanghai Maritime University, China
Reviewed by
Min Xu, Chinese Academy of Fishery Sciences, China
Guangnian Xiao, Shanghai Maritime University, China
Mingshuo Cao, Shanghai Maritime University, China
Updates
Copyright
© 2026 Chen, Wang and Lin.
This is an open-access article distributed under the terms of the Creative Commons Attribution License (CC BY). The use, distribution or reproduction in other forums is permitted, provided the original author(s) and the copyright owner(s) are credited and that the original publication in this journal is cited, in accordance with accepted academic practice. No use, distribution or reproduction is permitted which does not comply with these terms.
*Correspondence: Su Wang, wangsu07@126.com
Disclaimer
All claims expressed in this article are solely those of the authors and do not necessarily represent those of their affiliated organizations, or those of the publisher, the editors and the reviewers. Any product that may be evaluated in this article or claim that may be made by its manufacturer is not guaranteed or endorsed by the publisher.