Abstract
Cetaceans are highly mobile marine species that pose substantial research challenges due to their wide home ranges, migratory behavior, and low detectability across vast and remote oceanic regions. These realities, combined with the high costs of systematic surveys, have created significant gaps in understanding their spatial distribution, habitat use, and vulnerability to human-induced threats, which are critical for effective conservation management. This study presents the first dedicated aerial transect survey of cetacean assemblages off the western coast of Sumatra in the southeastern tropical Indian Ocean, a region previously understudied despite its recognized importance for marine biodiversity. Conducted between May and July 2024, the survey covered 15,043 km of aerial transects and recorded 77 sightings of 10 species, including the first aerial confirmations of killer whales and pygmy killer whales. With these additions, a total of 23 species has now been documented in the region, representing 68% of Indonesia’s known cetaceans. Our non-metric multidimensional scaling revealed seven distinct cetacean assemblage clusters strongly influenced by seafloor geomorphology and productivity gradients. High-density hotspots, dominated by spinner and striped dolphins, were found predominantly in non-protected areas, with 93% located outside existing or proposed MPAs. The overlap of cetacean habitats with intensive fishing activities and maritime traffic highlights potential risks for species such as killer whales, Omura’s whales, and sperm whales. These findings emphasize the need for targeted spatial protection, adaptive marine spatial planning, and species-specific mitigation measures to complement Indonesia’s 30×45 MPA expansion efforts. Given its exceptional biodiversity and the presence of threatened species such as sperm whales, western Sumatra is a strong candidate for designation as an important marine mammal area, consistent with its status as an ecologically or biologically significant marine area. This study establishes a critical ecological baseline, demonstrating the value of large-scale aerial surveys for informing evidence-based cetacean conservation in Indonesia’s offshore habitats.
1 Introduction
Highly mobile species such as cetaceans are inherently difficult to study due to their extensive home ranges, migratory behavior, and low detectability across vast and often remote oceanic regions (Read, 2018; Hupman et al., 2018). These challenges, combined with the high costs of field surveys, often lead to significant data gaps, particularly in understanding their spatial distribution, habitat use, and the threats they face (Kaschner et al., 2012). Yet, such knowledge is fundamental for developing effective conservation strategies (Pace et al., 2019). A clear understanding of where cetaceans feed, reproduce, and their migration routes is essential for ensuring that management measures can support population recovery and long-term resilience (IJsseldijk et al., 2021; Wild et al., 2023). Without these insights, conservation planning risks overlooking critical habitats and high-use areas that are vital for sustaining healthy cetacean populations (Hoyt, 2012).
Cetaceans provide crucial ecosystem functions and services, acting as ecosystem engineers that regulate food webs, recycle nutrients, and contribute to carbon sequestration through mechanisms such as the whale pump and whale conveyor (Sheehy et al., 2022; Kiszka et al., 2022). Their role as apex predators maintains ecological balance (Katona and Whitehead, 1988), and their sensitivity to environmental change makes them valuable bioindicators of ocean health (Zantis et al., 2021; Garcia-Bustos et al., 2024). However, poorly informed management, combined with persistent threats including bycatch (Read, 2008; Reeves et al., 2013), vessel traffic (Pennino et al., 2017), noise pollution (Barlow and Gisiner, 2005; Henderson et al., 2014), habitat degradation (Weir and Pierce, 2013), and marine debris (Williams et al., 2011), continues to endanger cetacean populations, puts these invaluable ecosystem services at risk, many of which are irreplaceable.
Marine Protected Areas (MPAs) play a central role in mitigating these pressures, especially where human activity overlaps with critical habitats (Avila et al., 2018). Their effectiveness depends on integrating fisheries management measures such as gear restrictions and seasonal closures with spatial planning based on empirical data (Grau Tomás and García Sanabria, 2022). Yet, many MPAs have been established with limited ecological information, often excluding key cetacean habitats (Mouton et al., 2022; Filatova et al., 2022). In Indonesia, for example, only two of more than 170 MPAs were specifically designed for cetaceans (Sahri et al., 2020a). Static MPA boundaries typically protect coral reefs or coastal ecosystems, but frequently overlook pelagic and deep-sea habitats including canyons, seamounts, and upwelling zones used by cetaceans for foraging and migration (Grantham et al., 2011; Bearzi, 2012; Giménez et al., 2023; Lezama-Ochoa et al., 2025). Consequently, a significant mismatch persists between protected areas and the spatial needs of cetaceans (Sequeira et al., 2025).
To close this gap, large-scale observation methods such as aerial surveys are critical for mapping cetacean distribution and abundance across wide, data-poor regions (Panigada et al., 2024; Paiu et al., 2024). Aerial transect surveys offer broad coverage but remain challenging in Indonesia’s vast archipelagic setting due to high operational costs, limited infrastructure, and dependence on favorable weather and sea-state conditions (Ender et al., 2014; Sahri et al., 2020b). These challenges have restricted previous research mostly to coastal waters, leaving offshore habitats largely unexplored.
In line with the global 30×30 conservation target (Sequeira et al., 2025), Indonesia has adopted the 30×45 vision, aiming to protect 30% of its marine territory by 2045 (Direktorat Konservasi Ekosistem dan Biota Perairan, 2024). To support this vision, we conducted a dedicated aerial transect survey along western Sumatra, one of Indonesia’s least studied yet ecologically significant regions. Previous reports documented approximately 21 cetacean species in the area (Mustika et al., 2015), highlighting its potential as a biodiversity hotspot within Indonesia’s total of 34 known species. However, most of these records come from coastal surveys or opportunistic strandings, with minimal information on offshore distribution.
This study provides the first large-scale aerial assessment of cetaceans in western Sumatra, aiming to (1) estimate relative abundance and diversity, (2) identify spatial distribution patterns, and (3) evaluate overlap with existing and proposed MPAs, as well as potential anthropogenic threats. The findings offer crucial insights to guide Indonesia’s forthcoming MPA expansion and ensure that high-density cetacean habitats are effectively integrated into evidence-based conservation planning.
2 Materials and methods
2.1 Site description
The western coast of Sumatra (8°N–10°S, 92°E–105°E) lies along the Southeastern Indian Ocean, where shallow coastal shelves drop steeply to over 6,500 m (Figure 1). Its oceanography is dominated by tropical monsoons and equatorial currents, with the southeast monsoon (June–October) driving strong upwelling that brings nutrient-rich, cooler waters to the surface, enhancing productivity (Susanto et al., 2001; Du et al., 2005; Halkides and Lee, 2009). Upwelling intensity is strongest off southern Sumatra due to wind forcing and bathymetric influence and weakens during the northwest monsoon when downwelling Kelvin waves deepen the thermocline (Susanto et al., 2001). Interannual variability is closely tied to ENSO events, where El Niño strengthens upwelling and cools SSTs by up to 4°C, while La Niña deepens the thermocline through the Indonesian Throughflow, reducing productivity (Horii et al., 2020).
Figure 1
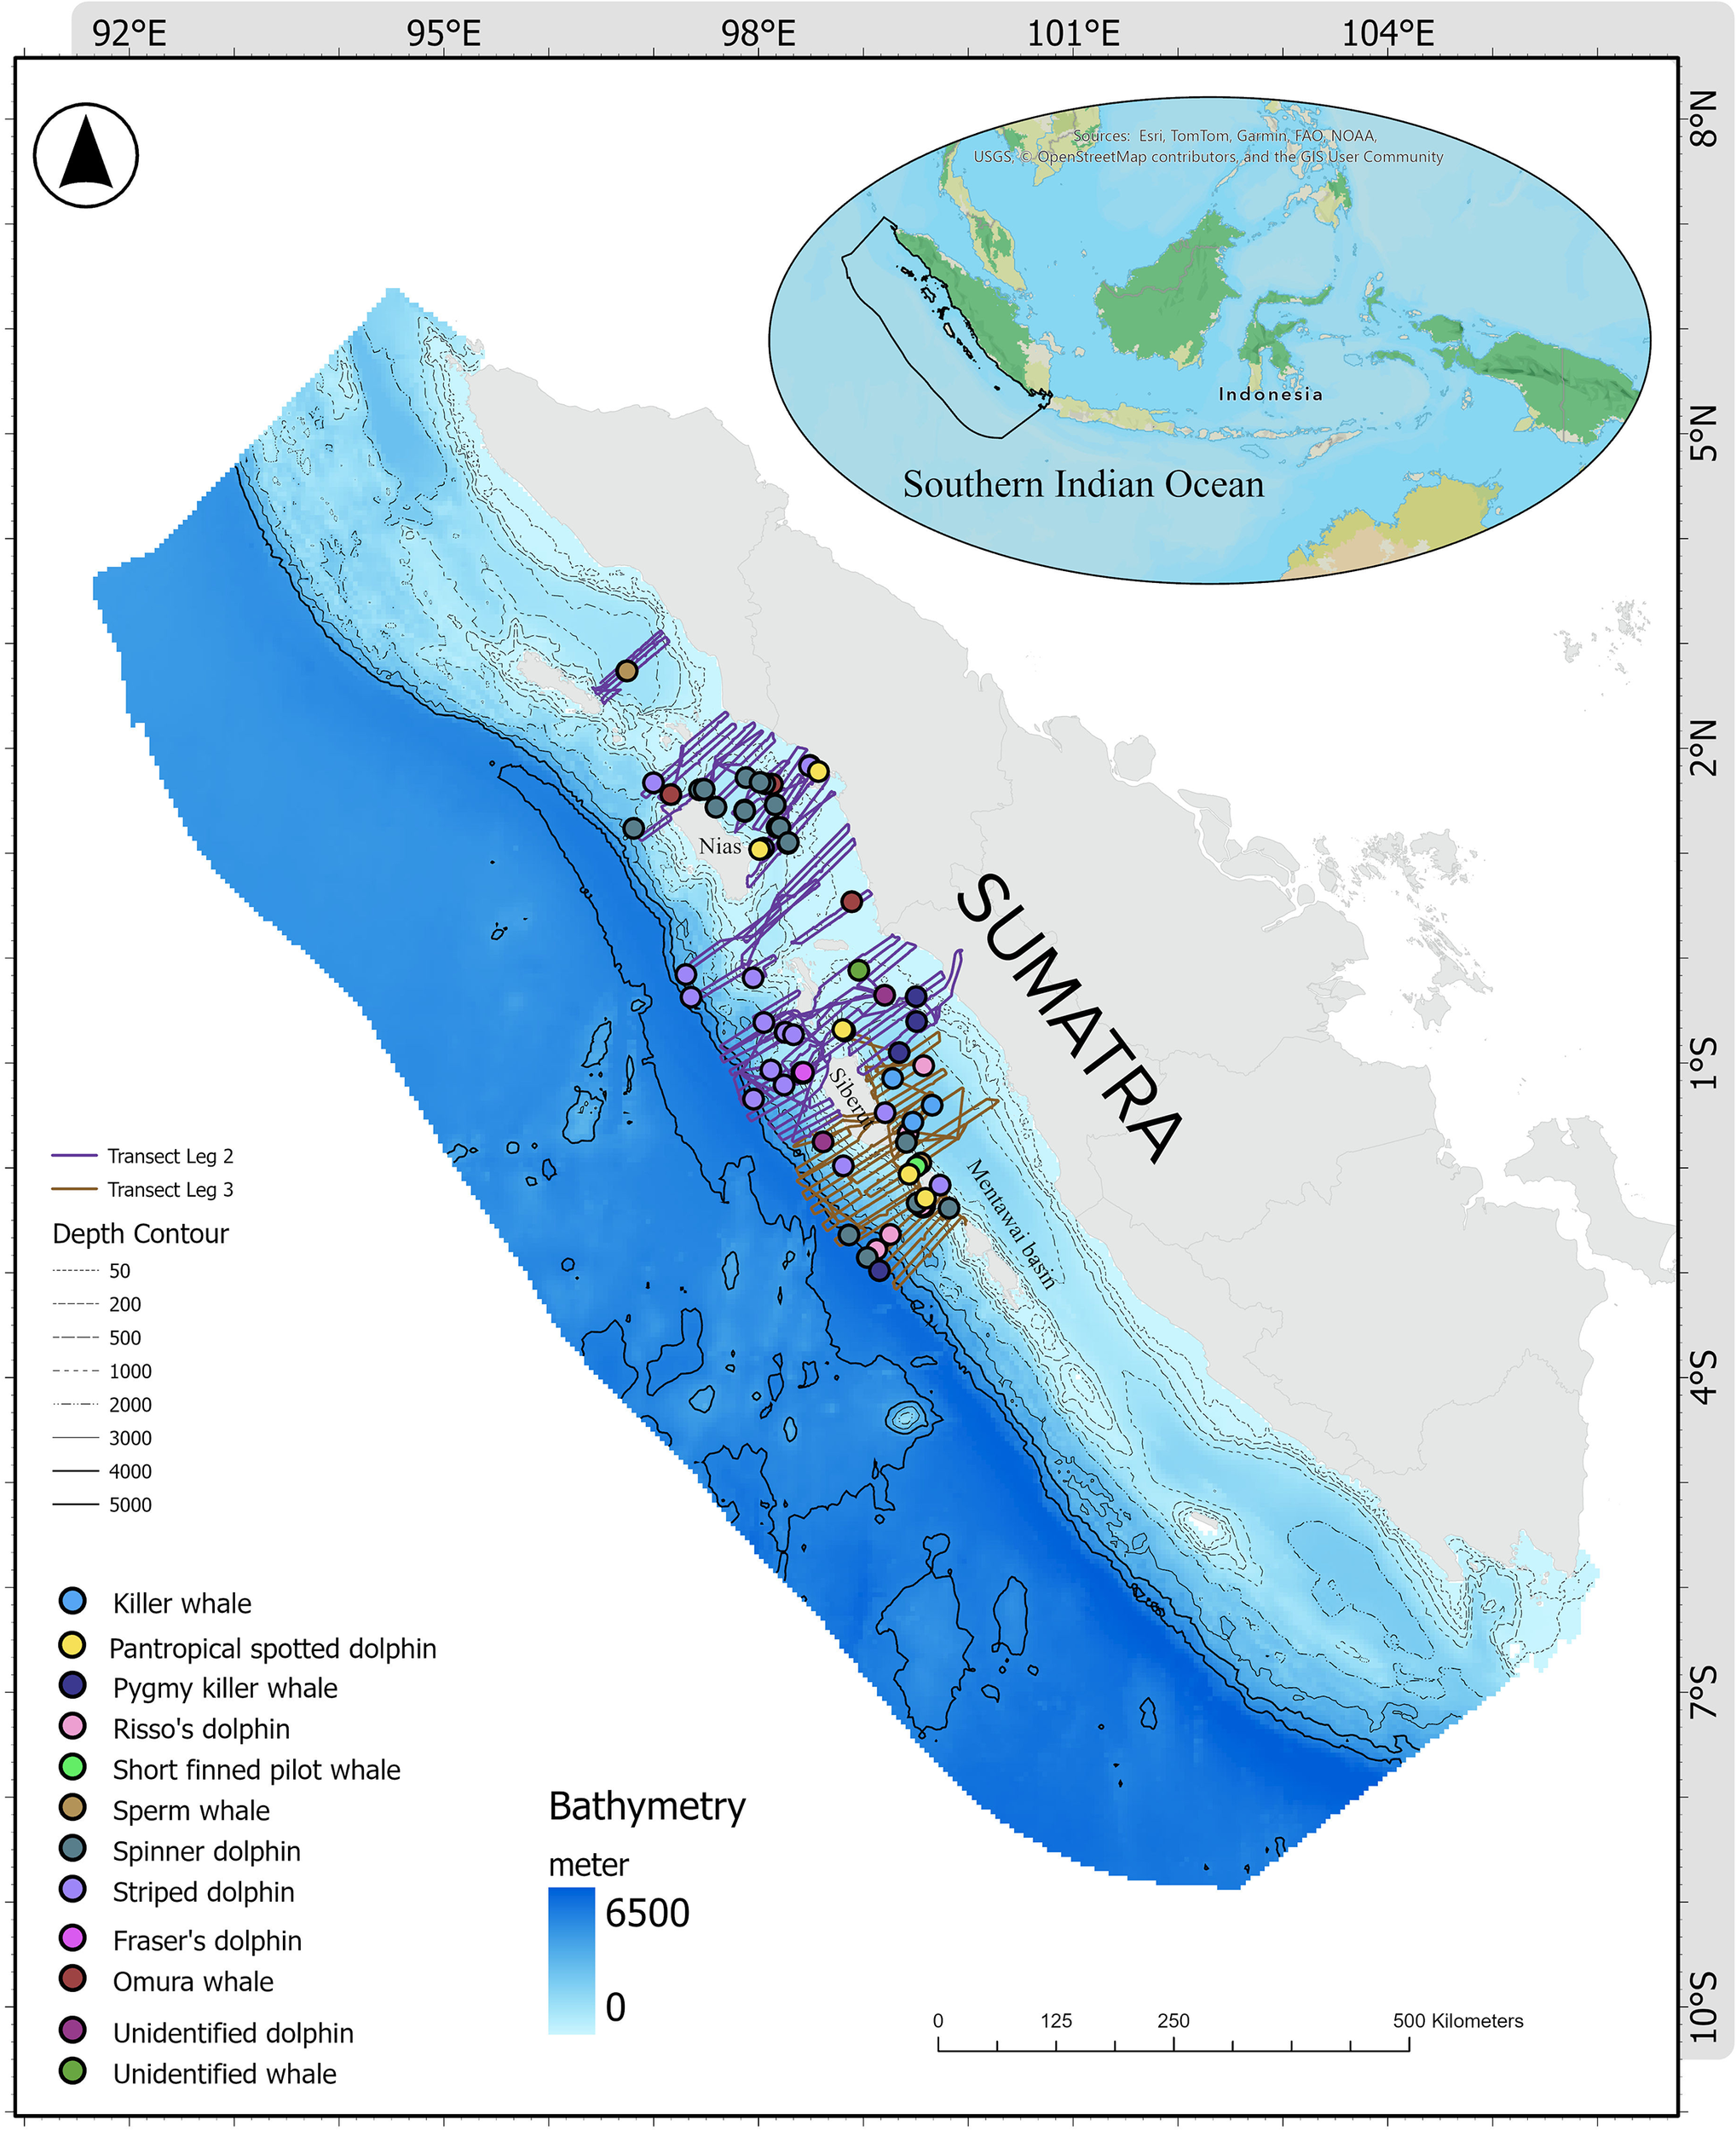
Aerial survey transect lines for cetacean observation off West Coast Sumatra, Southeastern Tropical Indian Ocean.
These monsoon and ENSO-driven dynamics underpin the region’s high biological productivity, sustaining dense phytoplankton blooms, zooplankton, and fish populations that support local fisheries (Puspasari et al., 2021). While cooler upwelling waters can mitigate coral bleaching, extreme warming still causes mass mortality, with slower reef recovery along Sumatra’s west coast (Corvianawatie et al., 2018).
The nutrient-enriched waters also sustain diverse marine megafauna. Around Pieh Island Marine Protected Area, at least eight cetacean species, including Gray’s spinner dolphin (Stenella longirostris longirostris) and Omura’s whale (Balaenoptera omurai) have been recorded, with frequent sightings of calves and near-threatened species, indicating high ecological significance (Daniel et al., 2025). Overall, the western Sumatran coast represents a dynamic upwelling ecosystem where monsoonal and interannual variability drives productivity, biodiversity, and ecosystem resilience across trophic levels.A survey design was developed using Distance software for R (Miller et al., 2019), with transects evenly distributed across oceanic and coastal strata (Thomas et al., 2007). A stratified transect design was established within a minimum bounding rectangle, facilitating an aerial survey via helicopter to assess cetacean biodiversity, abundance, distribution, and the environmental factors influencing their habitats (Figure 1). This robust large-scale data collection is crucial for the conservation and management of cetacean populations, as demonstrated in regions like the Mediterranean (Panigada et al., 2024), Black Sea (Paiu et al., 2024), and European Atlantic waters (Lambert et al., 2019), where it has yielded valuable baseline data supporting conservation efforts.
Although the survey employed a line-transect design generated in Distance, perpendicular distances to detected groups were not recorded. Consequently, a distance-sampling detection function and effective strip width could not be derived. Instead, relative abundance was expressed as encounter rates (individuals per unit effort, IPUE), calculated from total estimated individuals, survey duration, and transect length. This approach assumes uniform detectability among species and group sizes; however, potential biases may arise, as highly visible or gregarious taxa such as spinner and striped dolphins are more easily detected than rare or deep-diving species, potentially leading to inflated IPUE rates.
The aerial survey team comprised four personnel, including a pilot, recorder, videographer, and safety officer. All observers conducted continuous visual scanning along the transect lines. Upon a cetacean sighting, the pilot temporarily deviated from the transect, and survey effort was paused to allow visual and video documentation. Flight altitude during documentation ranged from approximately 160 to 260 ft above sea level, depending on weather and visibility conditions. High-resolution footage was captured using a 100–300 mm telephoto lens to facilitate accurate species identification. In some instances, however, adverse weather or sea conditions prevented the helicopter from approaching cetacean pods closely. Consequently, only high-resolution and close-range footage proved useful for reliable species identification, while distant recordings provided limited taxonomic detail. After documentation and data recording were completed, the pilot returned to the original transect line to resume the survey, and observation effort was again recorded. The recorded video material was later reviewed during post-survey data processing to confirm species identity.
From 27 May to 2 July 2024, aerial transect surveys were performed using an Airbus AS350 B3e Helicopter (H125), achieving a total coverage of 15,043 km (mean ± SD, 327 ± 61 km per trip) across 46 trips over 23 days, with a total flight time of 83.35 hours (1.8 ± 0.4 hours per trip). Surveys were conducted along the pre-defined transects at an average speed of 83 ± 9 knots per trip and an altitude of 399 ± 103 ft per trip. The OceanX Indonesia Mission 2024 carried out five survey legs across Indonesian waters of which only Leg 2 and Leg 3 along the western coast of Sumatra were used in this study. Leg 2, spanning 16 days and covering both national and the provincial waters of Aceh, North Sumatra, and West Sumatra, consisted of 31 trips with a total flight time of 54.99 hours (1.77 ± 0.43 hours per trip) and a total distance of 10,048.97 km (324.16 ± 65.94 km per trip). Leg 3, which focused on national and provincial waters of West Sumatra, was carried out over 7 days with 15 trips, covering 28.36 hours of flight time (1.89 ± 0.33 hours per trip) and 4,993.94 km (332.93 ± 50.57 km per trip; Table 1). The survey effort data for each trip includes information on average speed and altitude, survey duration, transect length, number of cetacean sightings, and total individuals observed. Cetacean observation data, on the other hand, record the geographic location of each sighting, species identification, estimated number of individuals per species, observed behaviors, as well as photo and video documentation used to validate species identification.
Table 1
| Statistics | Leg 2 | Leg 3 | Total |
|---|---|---|---|
| Numbers of days | 16 (69.6%) | 7 (30.4%) | 23 |
| Numbers of trips | 31 | 15 | 46 |
| Total Survey Duration (h) | 54.99 | 28.36 | 83.35 |
| Average Survey Duration (h) | 1.77 | 1.89 | 1.81 |
| Total Survey Distance (km) | 10,048.97 | 4,993.94 | 15,042.91 |
| Average Survey Distance (km) | 324.16 | 332.93 | 327.02 |
| Total Sightings | 45 | 32 | 77 |
| Average Sightings per trip | 1.45 | 2.13 | 1.67 |
| Total Individuals Observed | 2,127 | 1,418 | 3,545 |
| Average Individuals per trip | 68.61 | 94.53 | 77.07 |
| Mean SPUE (h) | 0.83 | 1.09 | 0.91 |
| Mean IPUE (h) | 38.54 | 49.52 | 42.12 |
| Mean SPUE (km) | 0.005 | 0.01 | 0.01 |
| Mean IPUE (km) | 0.22 | 0.31 | 0.25 |
Summary of aerial survey effort for cetacean observation.
Although total survey duration and distance differed between Leg 2 and Leg 3 (Table 1), the average survey distance and duration per trip were comparable (324.16 km vs. 332.93 km; 1.77 h vs. 1.89 h, respectively). Each leg represented a distinct area of operation during the expedition rather than separate analytical strata; therefore, data from both legs were pooled and analyzed as a single regional dataset.
Furthermore, data analysis often integrates environmental parameters such as depth, sea surface temperature, and chlorophyll-a to assess habitat preferences, offering a better understanding of the environmental drivers and distribution patterns of cetaceans (Supplementary Figure 1). This study utilizes bathymetric (Group GEBCO Compilation, 2024), and seafloor geomorphic features such as distance to basins, canyons, continental slopes, and escarpments (Harris et al., 2023). Additionally, some species prefer nearshore environments or areas adjacent to deep waters. Therefore, distance to land data (Indonesian Geospatial Information Agency, 2022), is employed to evaluate this preference. In this study, we also evaluated the influence of oceanographic variables on cetacean habitat preferences using monthly mean datasets of physical and biological parameters, including sea surface temperature (monthly mean ± SD = 30.92 ± 0.75°C) and sea surface chlorophyll a (0.18 ± 0.35 mg/m-3), derived from Ocean Color data at a spatial resolution of 4 km (NASA Ocean Biology Processing Group, 2018). Additional datasets were retrieved from E.U. Copernicus Marine Service Information, including total current velocity (0.1 ± 0.08 m/s) (GLOBAL_MULTIYEAR_PHY_001_030, spatial resolution 0.083° × 0.083°, https://doi.org/10.48670/moi-00021), zooplankton mole concentration expressed as carbon in seawater (GLOBAL_ANALYSISFORECAST_BGC_001_028, 0.25° × 0.25°, https://doi.org/10.48670/moi-00015) at both the surface (0.45 m; 0.9 ± 0.34 mmol/m³) and subsurface (35 m; 0.59 ± 0.18 mmol/m³), as well as sea level anomaly data (0.24 ± 0.03 m SEALEVEL_GLO_PHY_CLIMATE_L4_MY_008_057, 0.25° × 0.25°, https://doi.org/10.48670/moi-00145).
To evaluate cetacean abundance within national and provincial waters, buffer zones were generated in ArcGIS Pro 3.0.3, with areas within 12 nautical miles (nm) from the coastline classified under provincial jurisdiction, and areas beyond 12 nm toward offshore designated as national waters. In addition, the boundaries of marine protected areas (MPAs) including established (operationalized MPA), designated (allocated MPA in marine spatial planning), and proposed expanded MPAs aligned with the 30% by 2045 commitment under the Kunming-Montreal Global Biodiversity Framework were obtained from the Ministry of Marine Affairs and Fisheries of the Republic of Indonesia (https://sidako.kkp.go.id/sidako/map). Finally, potential threat features such as high fishing pressure area provided by Global Fishing Watch (https://globalfishingwatch.org), high marine traffic area (Cerdeiro et al., 2020), and designated shipping lanes in Indonesia’s marine spatial planning were also considered.
2.3 Data analysis
Sightings per unit effort (SPUE) and Individuals per unit effort (IPUE) were used to quantify cetacean sighting frequency and individual abundance during the study. SPUE was calculated by dividing the number of sightings, and IPUE by the total number of individuals observed, by both the survey duration (hours) and transect length (km). These standardized metrics account for variations in observation effort, providing a consistent basis for comparing sightings and abundance across different trip efforts. By normalizing the data, SPUE and IPUE offer a clearer and more reliable assessment of species abundance in the study area. For statistical analysis, nonparametric Kruskal-Wallis H tests were applied to evaluate differences in SPUE and IPUE across MPA categories (i.e., established, designated, proposed expanded MPA area of interest “AOI” for 30 x 45 by 2045, and non-MPA area). When significant differences were detected, post-hoc Dunn’s tests with Holm correction were performed to determine which pairs of species were significantly different. Meanwhile, A Wilcoxon rank-sum test was applied to evaluate differences in IPUE between jurisdictions (national vs provincial).
To identify areas of high cetacean concentration, we applied two complementary spatial hotspot approaches in ArcGIS Pro (version 3.0.3). First, sighting intensity was analyzed using Kernel Density with the expected counts estimation, where output values represent the calculated density of sightings per cell area. A search radius of 100 km was applied, meaning that the density at each grid cell is based on the expected number of sightings within a 100-km neighborhood. Second, abundance-based hotspots were identified using the Getis-Ord Gi* statistic applied to effort-standardized abundance (IPUE: individuals per hour). The Gi* statistic evaluates whether high or low IPUE values cluster spatially by comparing the local sum of each point and its surrounding neighbors within the same 100-km neighborhood distance to the expected value under spatial randomness (Getis and Ord, 1992; Ord and Getis, 1995). The 100-km distance threshold was selected because it reflects the scale of mesoscale oceanographic processes in the eastern Indian Ocean such as upwelling cells, eddies, and shelf-break productivity that typically occur at spatial scales of 50–200 km (Chelton et al., 2011).
A high positive z-score indicates a statistically significant hotspot (a spatial cluster of high IPUE values), while a low negative z-score indicates a cold spot (a cluster of low IPUE values). The associated p-values represent the confidence level of clustering, commonly reported as p < 0.10 (90% confidence), p < 0.05 (95% confidence), and p < 0.01 (99% confidence). The Gi* output generates contiguous spatial clusters (hotspot envelopes) when multiple neighboring locations exhibit significant positive z-scores, ensuring that hotspots are based on true spatial clustering rather than isolated high observations. This allowed us to identify persistent cetacean aggregation areas that may serve as priority zones for conservation planning (Hamilton et al., 2021).
Environmental variables and potential threats associated with cetacean sighting locations were extracted using the Extract Multi Values to Points tool in the Spatial Analyst toolbox of ArcGIS Pro 3.0.3. The resulting dataset was then visualized using boxplot and ridge plots generated with the ggplot2 (Wickham, 2016) and ggridges package in R (Wilke, 2024) illustrating the environmental niches of spatial segregation in relation to seafloor features, physical, and biological oceanographic variables, as well as their potential exposure to fishing activities and maritime traffic.
Before performing the multivariate analysis, we conducted a collinearity test among all environmental predictors using Pearson correlation coefficients (Supplementary Figure 2). A cutoff of r > 0.7 was applied, and when two variables were highly correlated, only one was retained. Testing collinearity is important, as including highly correlated predictors can obscure ecological interpretation (Dormann et al., 2013). Based on this filtering, the final predictors included in the NMDS were sea surface temperature (SST), zooplankton concentration at 0.45 m (zoo_0_45), sea level anomaly (SLA), current velocity (velocity), bathymetry, distance to continental slope (d_cslope), distance to canyon (d_canyon), and zooplankton concentration at 35 m (zoo_35).
Non-metric Multidimensional Scaling (NMDS) was performed in R using the vegan package (Oksanen et al., 2025) to assess ecological segregation among cetacean species based on all environmental predictors. All predictors were standardized, and Partitioning Around Medoids (PAM) clustering (k = 7) with the cluster package was applied to identify environmental clusters, with silhouette width used to evaluate clustering quality. The envfit function (vegan) was used to assess the contribution (R²) and significance of environmental variables, which were visualized as directional vectors in the NMDS plot. For statistical testing, nonparametric Kruskal-Wallis H tests were conducted to evaluate differences in environmental characteristics shaping distributional clusters and potential threat exposure (proximity to risk areas). When significant differences were detected, post-hoc Dunn’s tests with Holm correction were applied to identify which species pairs showed significant differences.
3 Results
A total of 77 cetacean sightings were recorded during the study period, comprising 45 sightings in Leg 2 and 32 sightings in Leg 3 (Table 1; Supplementary Table 2). The average number of sightings per trip was 1.45 (SD, ± 1.57) in Leg 2 and 2.13 (± 2.80) in Leg 3, with an overall mean of 1.67 (± 2.04) sightings per trip. In total, 3,545 individuals were recorded across both survey legs, with an overall mean of 77.07 ± 130.79 individuals per trip. Of these, 2,127 individuals were observed during Leg 2 (68.61 ± 2.80 individuals per trip) and 1,418 individuals during Leg 3 (94.53 ± 155.40 individuals per trip).
Effort-standardized metrics showed that mean SPUE was higher in Leg 3 (1.09 ± 1.32 sightings h−1) than in Leg 2 (0.83 ± 0.82 sightings h−1). Mean IPUE also followed this pattern, with Leg 3 recording 49.52 ± 78.44 individuals h−1, compared to 38.54 ± 61.15 individuals h−1 in Leg 2. When standardized by distance, mean SPUE was 0.25 sightings km−1, and mean IPUE was 11.60 individuals km−1 (Table 1).
Spinner dolphin was the most frequently sighted species (25 sightings; Table 2), followed by striped dolphin (21) and Risso’s dolphin (23), indicating that delphinids dominated the assemblage. In contrast, large or rare species such as killer whale, Omura’s whale, and sperm whale were each recorded only three times, highlighting their infrequent occurrence during the survey. Kruskal–Wallis test showed no significant difference in sighting frequency among species (χ² = 11, df = 11, p = 0.443). Post-hoc Dunn tests confirmed that no species pair differed significantly after Holm correction. This result reflects the limited number of sightings per species category and indicates that sighting frequency alone does not statistically distinguish species occurrence patterns across the survey.
Table 2
| Name | Sightings | Group size (Individual per sightings) | Individual per unit effort (h) | ||||||||
|---|---|---|---|---|---|---|---|---|---|---|---|
| Total | Mean | SE | Min | Max | Total | Mean | SE | Min | Max | ||
| Fraser’s dolphin | 4 | 149.0 | 37.3 | 11.9 | 3.0 | 56.0 | 67.4 | 16.9 | 5.4 | 1.4 | 25.3 |
| Killer whale | 3 | 5.0 | 1.7 | 0.3 | 1.0 | 2.0 | 2.4 | 0.8 | 0.2 | 0.5 | 1.0 |
| Omura whale | 3 | 3.0 | 1.0 | 0 | 1.0 | 1.0 | 1.9 | 0.6 | 0.1 | 0.5 | 0.7 |
| Pantropical spotted dolphin | 8 | 215.0 | 26.9 | 13.5 | 2.0 | 115.0 | 155.5 | 19.4 | 10.7 | 1.0 | 89.2 |
| Pygmy killer whale | 5 | 86.0 | 17.2 | 5.5 | 3.0 | 36.0 | 45.5 | 9.1 | 2.6 | 1.4 | 17.7 |
| Risso’s dolphin | 23 | 288.0 | 12.5 | 2.7 | 1.0 | 50.0 | 131.1 | 5.7 | 1.2 | 0.5 | 22.7 |
| Short finned pilot whale | 5 | 20.0 | 4.0 | 0.9 | 2.0 | 7.0 | 9.4 | 1.9 | 0.5 | 0.9 | 3.5 |
| Sperm whale | 3 | 17.0 | 5.7 | 1.2 | 4.0 | 8.0 | 11.3 | 3.8 | 1.1 | 2.0 | 5.7 |
| Spinner dolphin | 25 | 1171.0 | 46.8 | 10.4 | 1.0 | 200.0 | 642.2 | 25.7 | 5.4 | 0.5 | 98.5 |
| Striped dolphin | 21 | 980.0 | 46.7 | 15.4 | 1.0 | 300.0 | 593.3 | 28.3 | 9.6 | 0.5 | 147.8 |
| Unidentified dolphin | 7 | 600.0 | 85.7 | 69.2 | 6.0 | 500.0 | 272.7 | 39.0 | 31.3 | 3.2 | 226.2 |
| Unidentified whale | 2 | 11.0 | 5.5 | 2.5 | 3.0 | 8.0 | 5.1 | 2.5 | 1.1 | 1.5 | 3.6 |
Descriptive statistics of cetacean group size and effort-standardized abundance (per hour).
3.1 Species diversity
Ten cetacean species were positively identified during the survey (Figure 2). Six species were recorded in both survey legs: pantropical spotted dolphin (Stenella attenuata), spinner dolphin (Stenella longirostris), striped dolphin (Stenella coeruleoalba), short-finned pilot whale (Globicephala macrorhynchus), sperm whale (Physeter macrocephalus), and pygmy killer whale (Feresa attenuata). In Leg 2, which covered the waters between Simeulue to northern Mentawai, two additional species were encountered: Fraser’s dolphin (Lagenodelphis hosei) and Omura’s whale (Balaenoptera omurai). In Leg 3, which surveyed the waters from southern Mentawai Islands, two species not recorded in Leg 2 were observed: killer whale (Orcinus orca) and Risso’s dolphin (Grampus griseus). Overall, this survey increases the confirmed list of marine mammal species along the west coast of Sumatra from 21 to 23, including new occurrence records of killer whale and pygmy killer whale in this region (Supplementary Table 1).
Figure 2
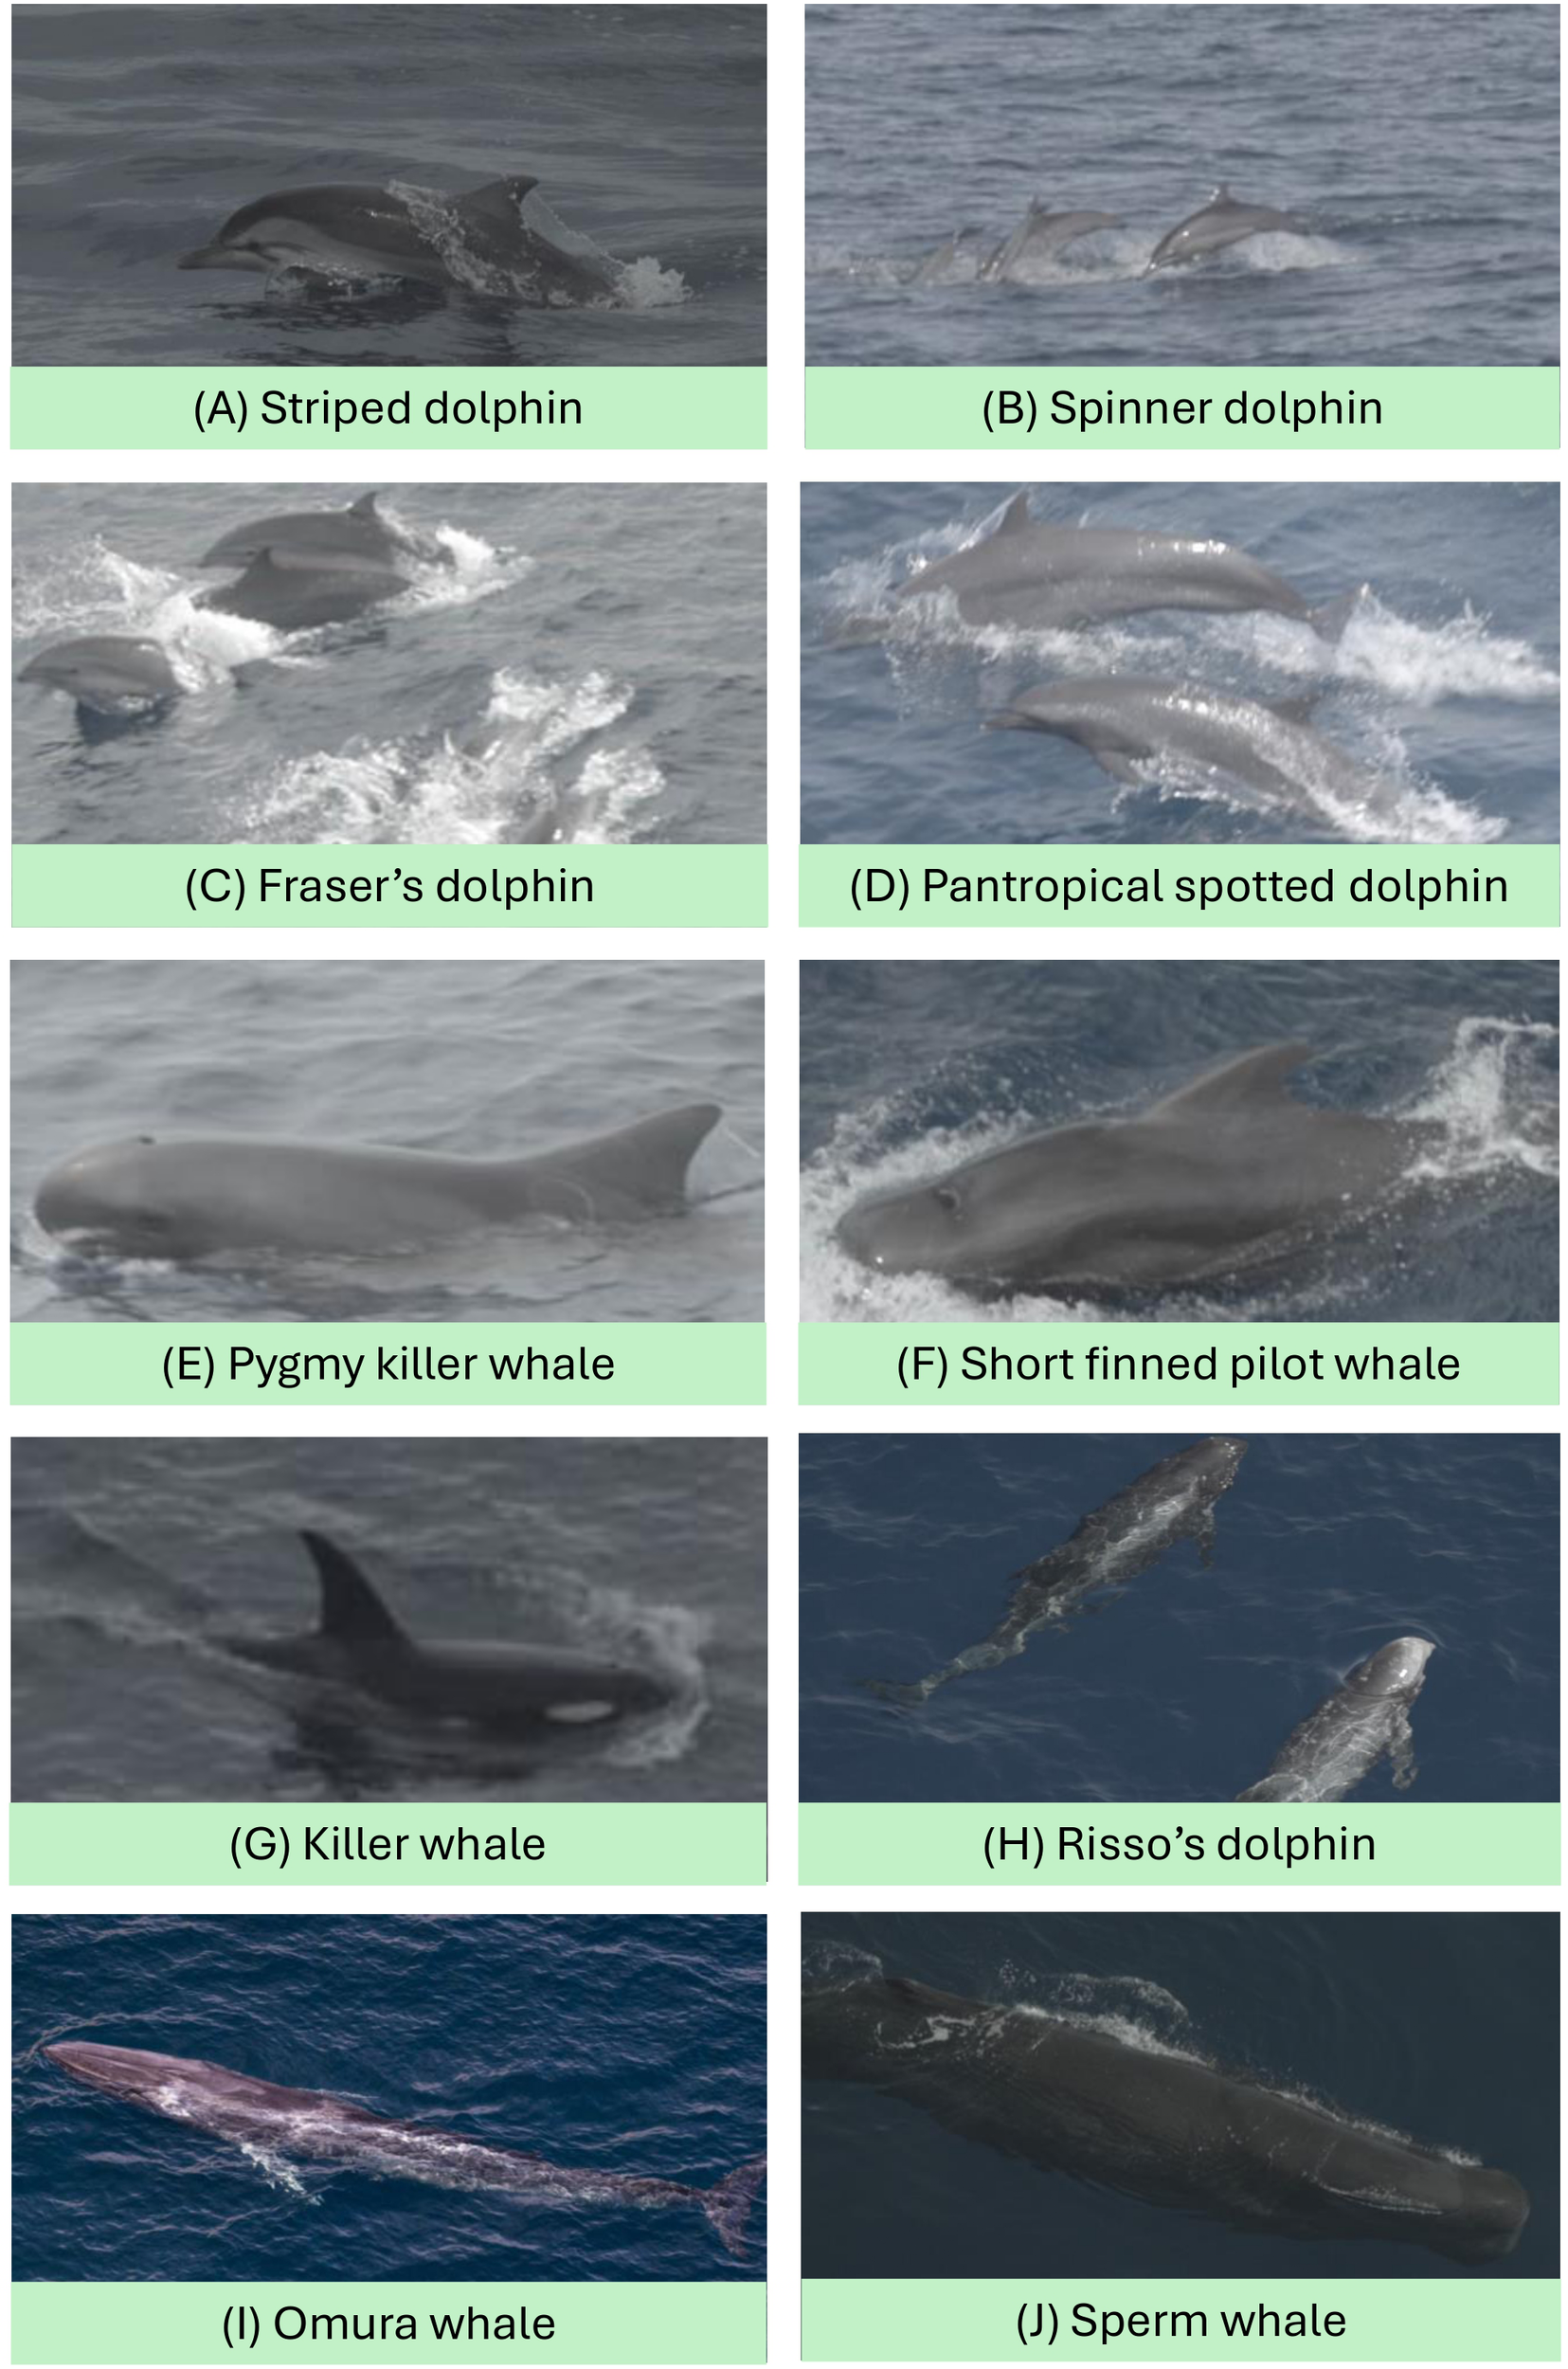
Images of cetacean species observed during the aerial survey.
3.2 Abundance per species
Striped dolphin and spinner dolphin showed the largest average group sizes (46.7 ± 15.4 and 46.8 ± 10.4 individuals per sighting). Both species also recorded the highest mean individuals per hour (28.3 ± 9.6 h−1 and 25.7 ± 5.4 h−1; Table 2). Spinner dolphin had the highest number of sightings overall (n = 25), followed closely by striped dolphin (n = 21) and Risso’s dolphin (n = 23). In contrast, Omura’s whale formed the smallest group size (1 individual per sighting) and had one of the lowest individuals per hour values (0.6 h−1).
Pantropical spotted dolphin and Fraser’s dolphin showed moderately large group sizes (26.9 ± 13.5 and 37.3 ± 11.9 individuals per sighting) with corresponding mean individuals per hour of 19.4 ± 10.7 h−1 and 16.9 ± 5.4 h−1. Meanwhile, pygmy killer whale, Risso’s dolphin, and short-finned pilot whale formed smaller group sizes (4–17 individuals per sighting), which was reflected in their lower individuals per hour (9.1 ± 2.6 h−1, 5.7 ± 1.2 h−1, and 1.9 ± 0.5 h−1).
In national waters, the mean IPUE was 23.03 ± 5.97 h−1 and 0.136 ± 0.037 km−1 (Figure 3A). In contrast, provincial waters had a lower mean IPUE of 13.79 ± 3.27 h−1 and 0.084 ± 0.020 km−1. Statistical comparison indicated that the difference in IPUE between national and provincial waters was significant for the distance-based metric (IPUE km−1, p < 0.05), while no significant difference was detected for the time-based metric (IPUE h−1).
Figure 3
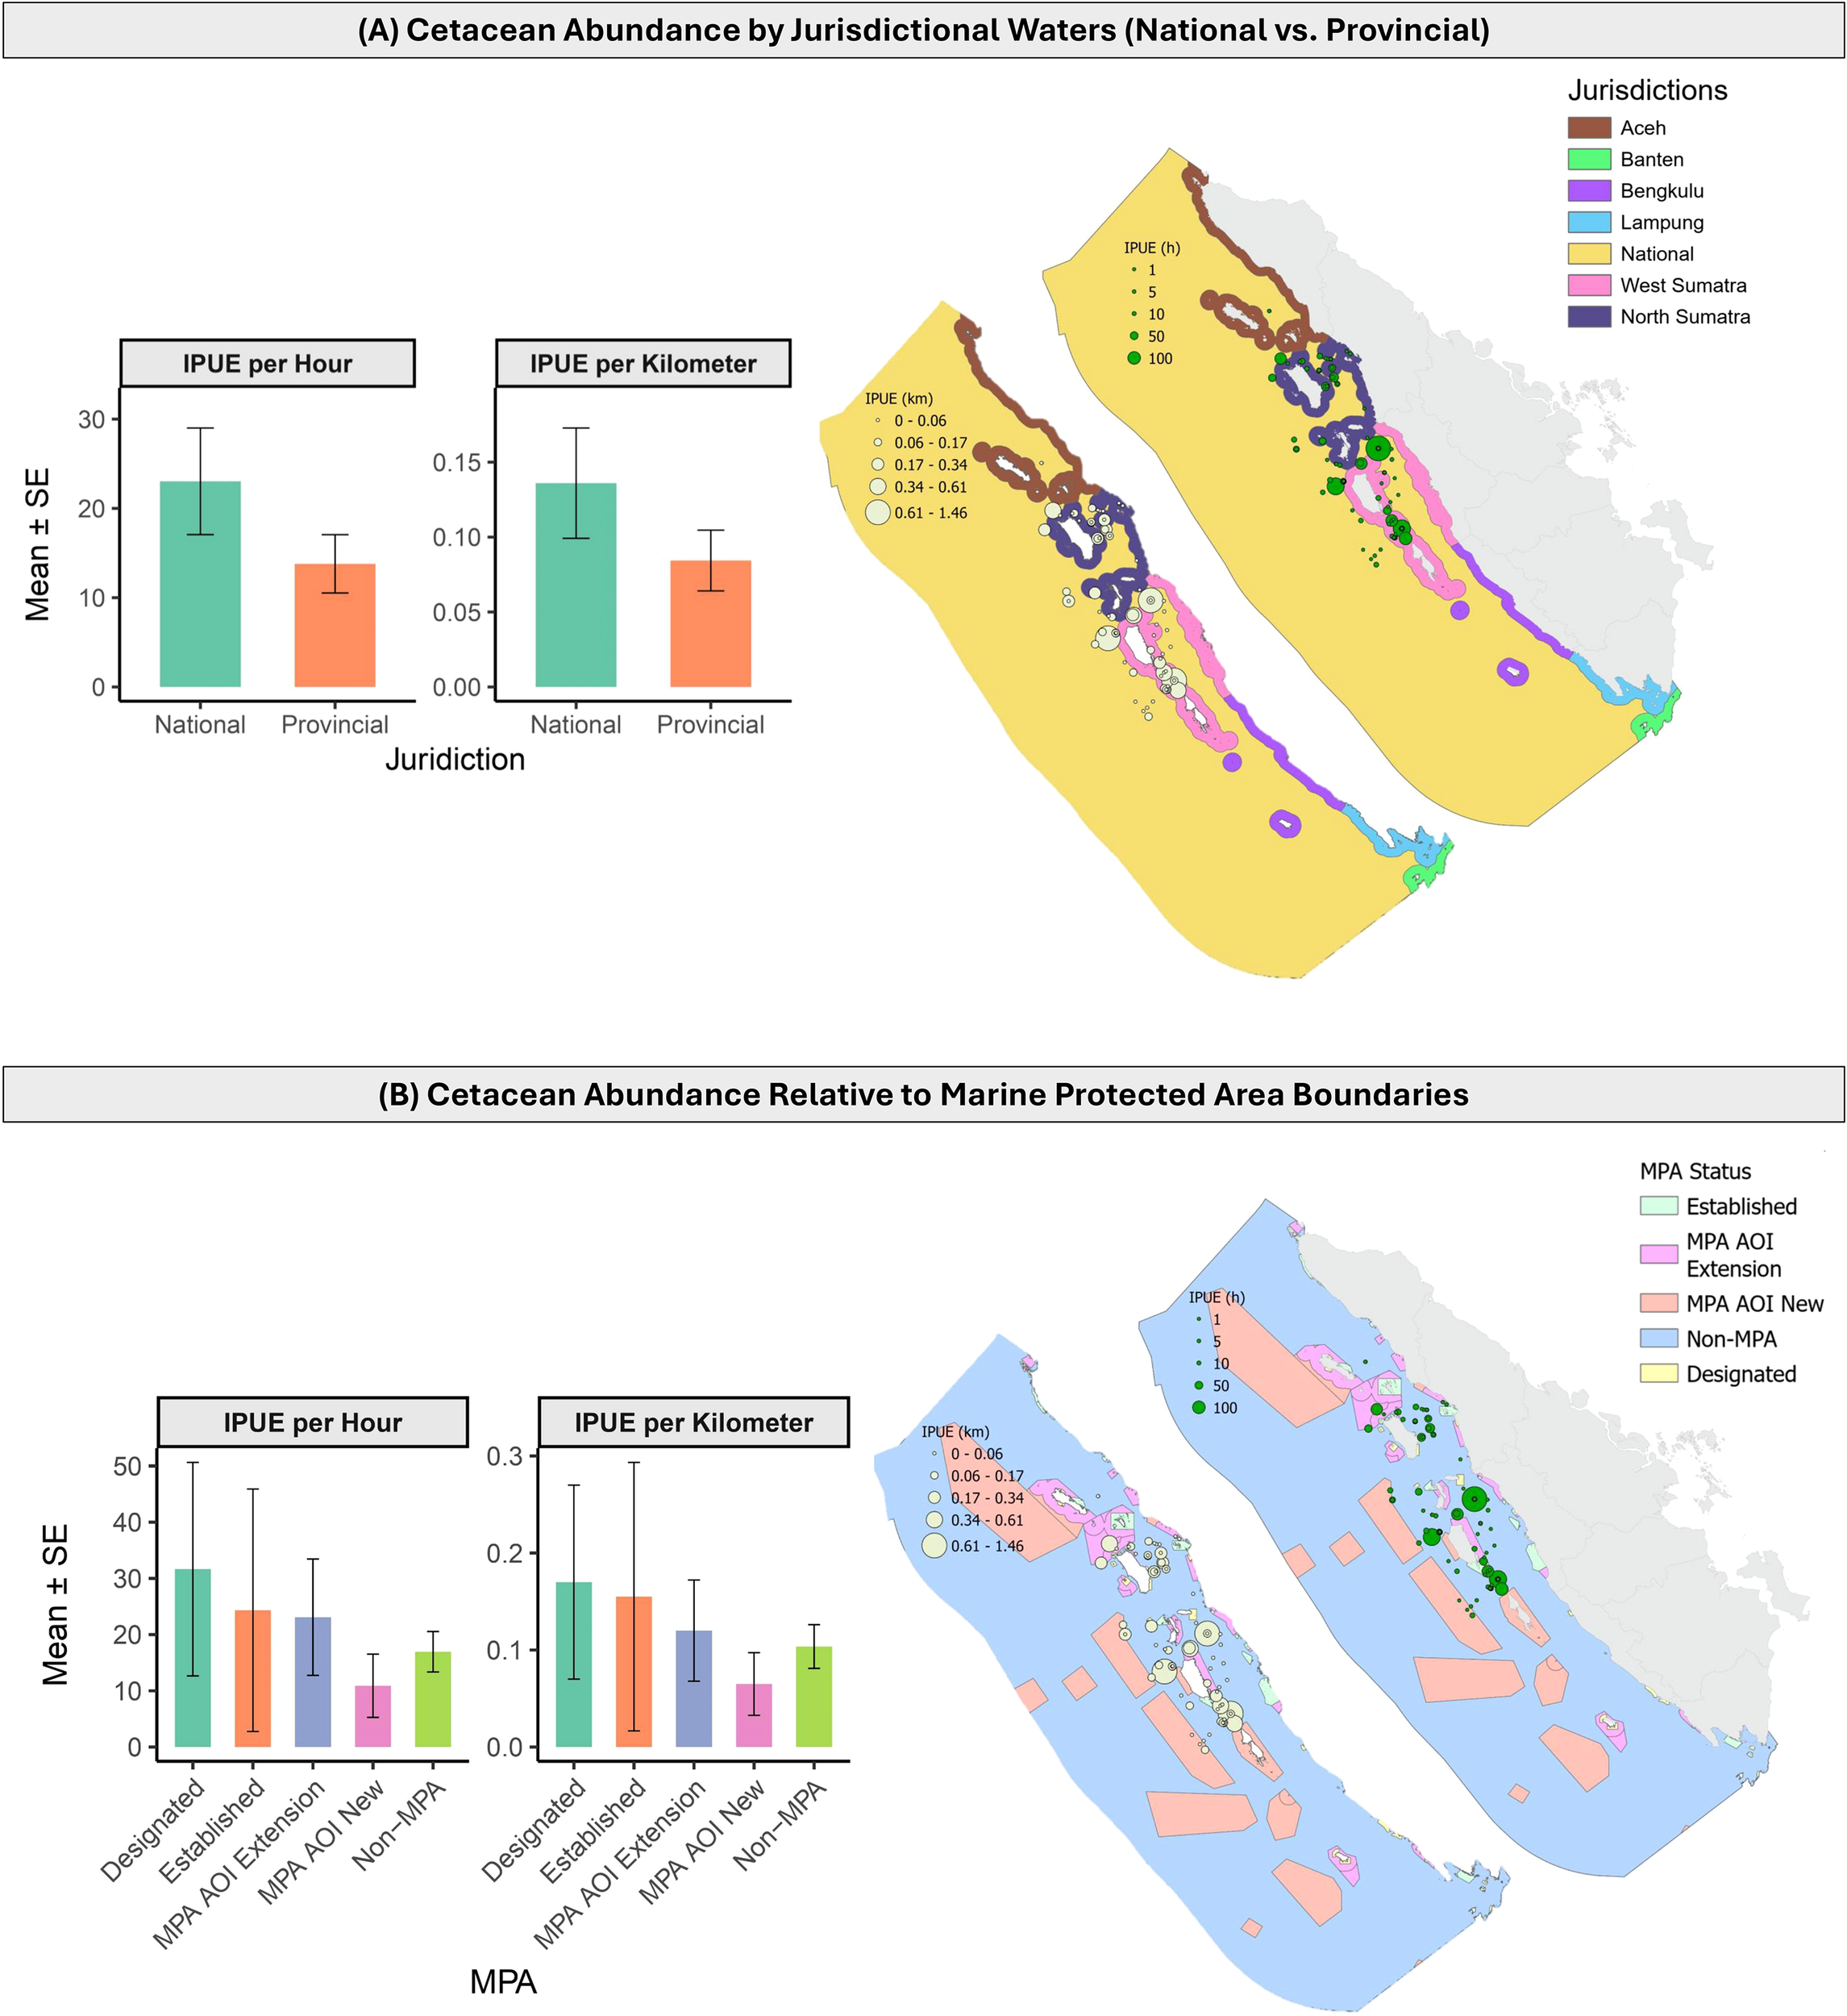
Variations in cetacean abundance were examined across (A) jurisdictional and (B) protected area boundaries, using both time-based (individual per hour) and distance-based (individual per km) indices of abundance (IPUE). Waters within 12 nautical miles fall under provincial jurisdiction, while those beyond 12 nautical miles are under national jurisdiction. Marine Protected Areas (MPAs) were categorized as follows: established MPAs, which are operational; designated MPAs, which are formally allocated in marine spatial planning but not yet established or operational; Areas of Interest (AOIs), which represent proposed MPA expansions or new delineations to support the 30×45 vision; and non-MPA areas, which are not designated or planned for protection.
Cetacean IPUE varied across MPA categories, although no statistically significant differences were detected (all comparisons, p > 0.05). Among the protected areas, designated MPAs showed the highest mean IPUE (31.65 ± 18.99 h−1; 0.17 ± 0.10 km−1; Figure 3B), followed by established MPAs (24.34 ± 21.56 h−1; 0.16 ± 0.14 km−1) and MPA AOI extension (23.10 ± 10.36 h−1; 0.12 ± 0.05 km−1). The lowest mean abundance was observed in MPA AOI new areas (10.91 ± 5.63 h−1; 0.07 ± 0.03 km−1).
3.3 Cetacean hotspots
Kernel density analysis showed that the average sighting intensity was 1.26 sightings per cell (SD = 4.64, range = 0–25 per 100 × 100 km cell). Three distinct clusters of high sighting intensity were detected around Siberut Island (Figure 4). The strongest cluster occurred in Northwest Siberut (25 sighting intensity), where sightings included short-finned pilot whale, Fraser’s dolphin, and striped dolphin. Northeast Siberut (23 sighting intensity) was dominated by unidentified dolphins and whales, along with pygmy killer whale. In addition to a high sighting intensity (22), South Siberut supported the widest range of cetacean species observed in the survey, with detections of sperm whale, spinner dolphin, short-finned pilot whale, Risso’s dolphin, striped dolphin, pygmy killer whale, and pantropical spotted dolphin.
Figure 4
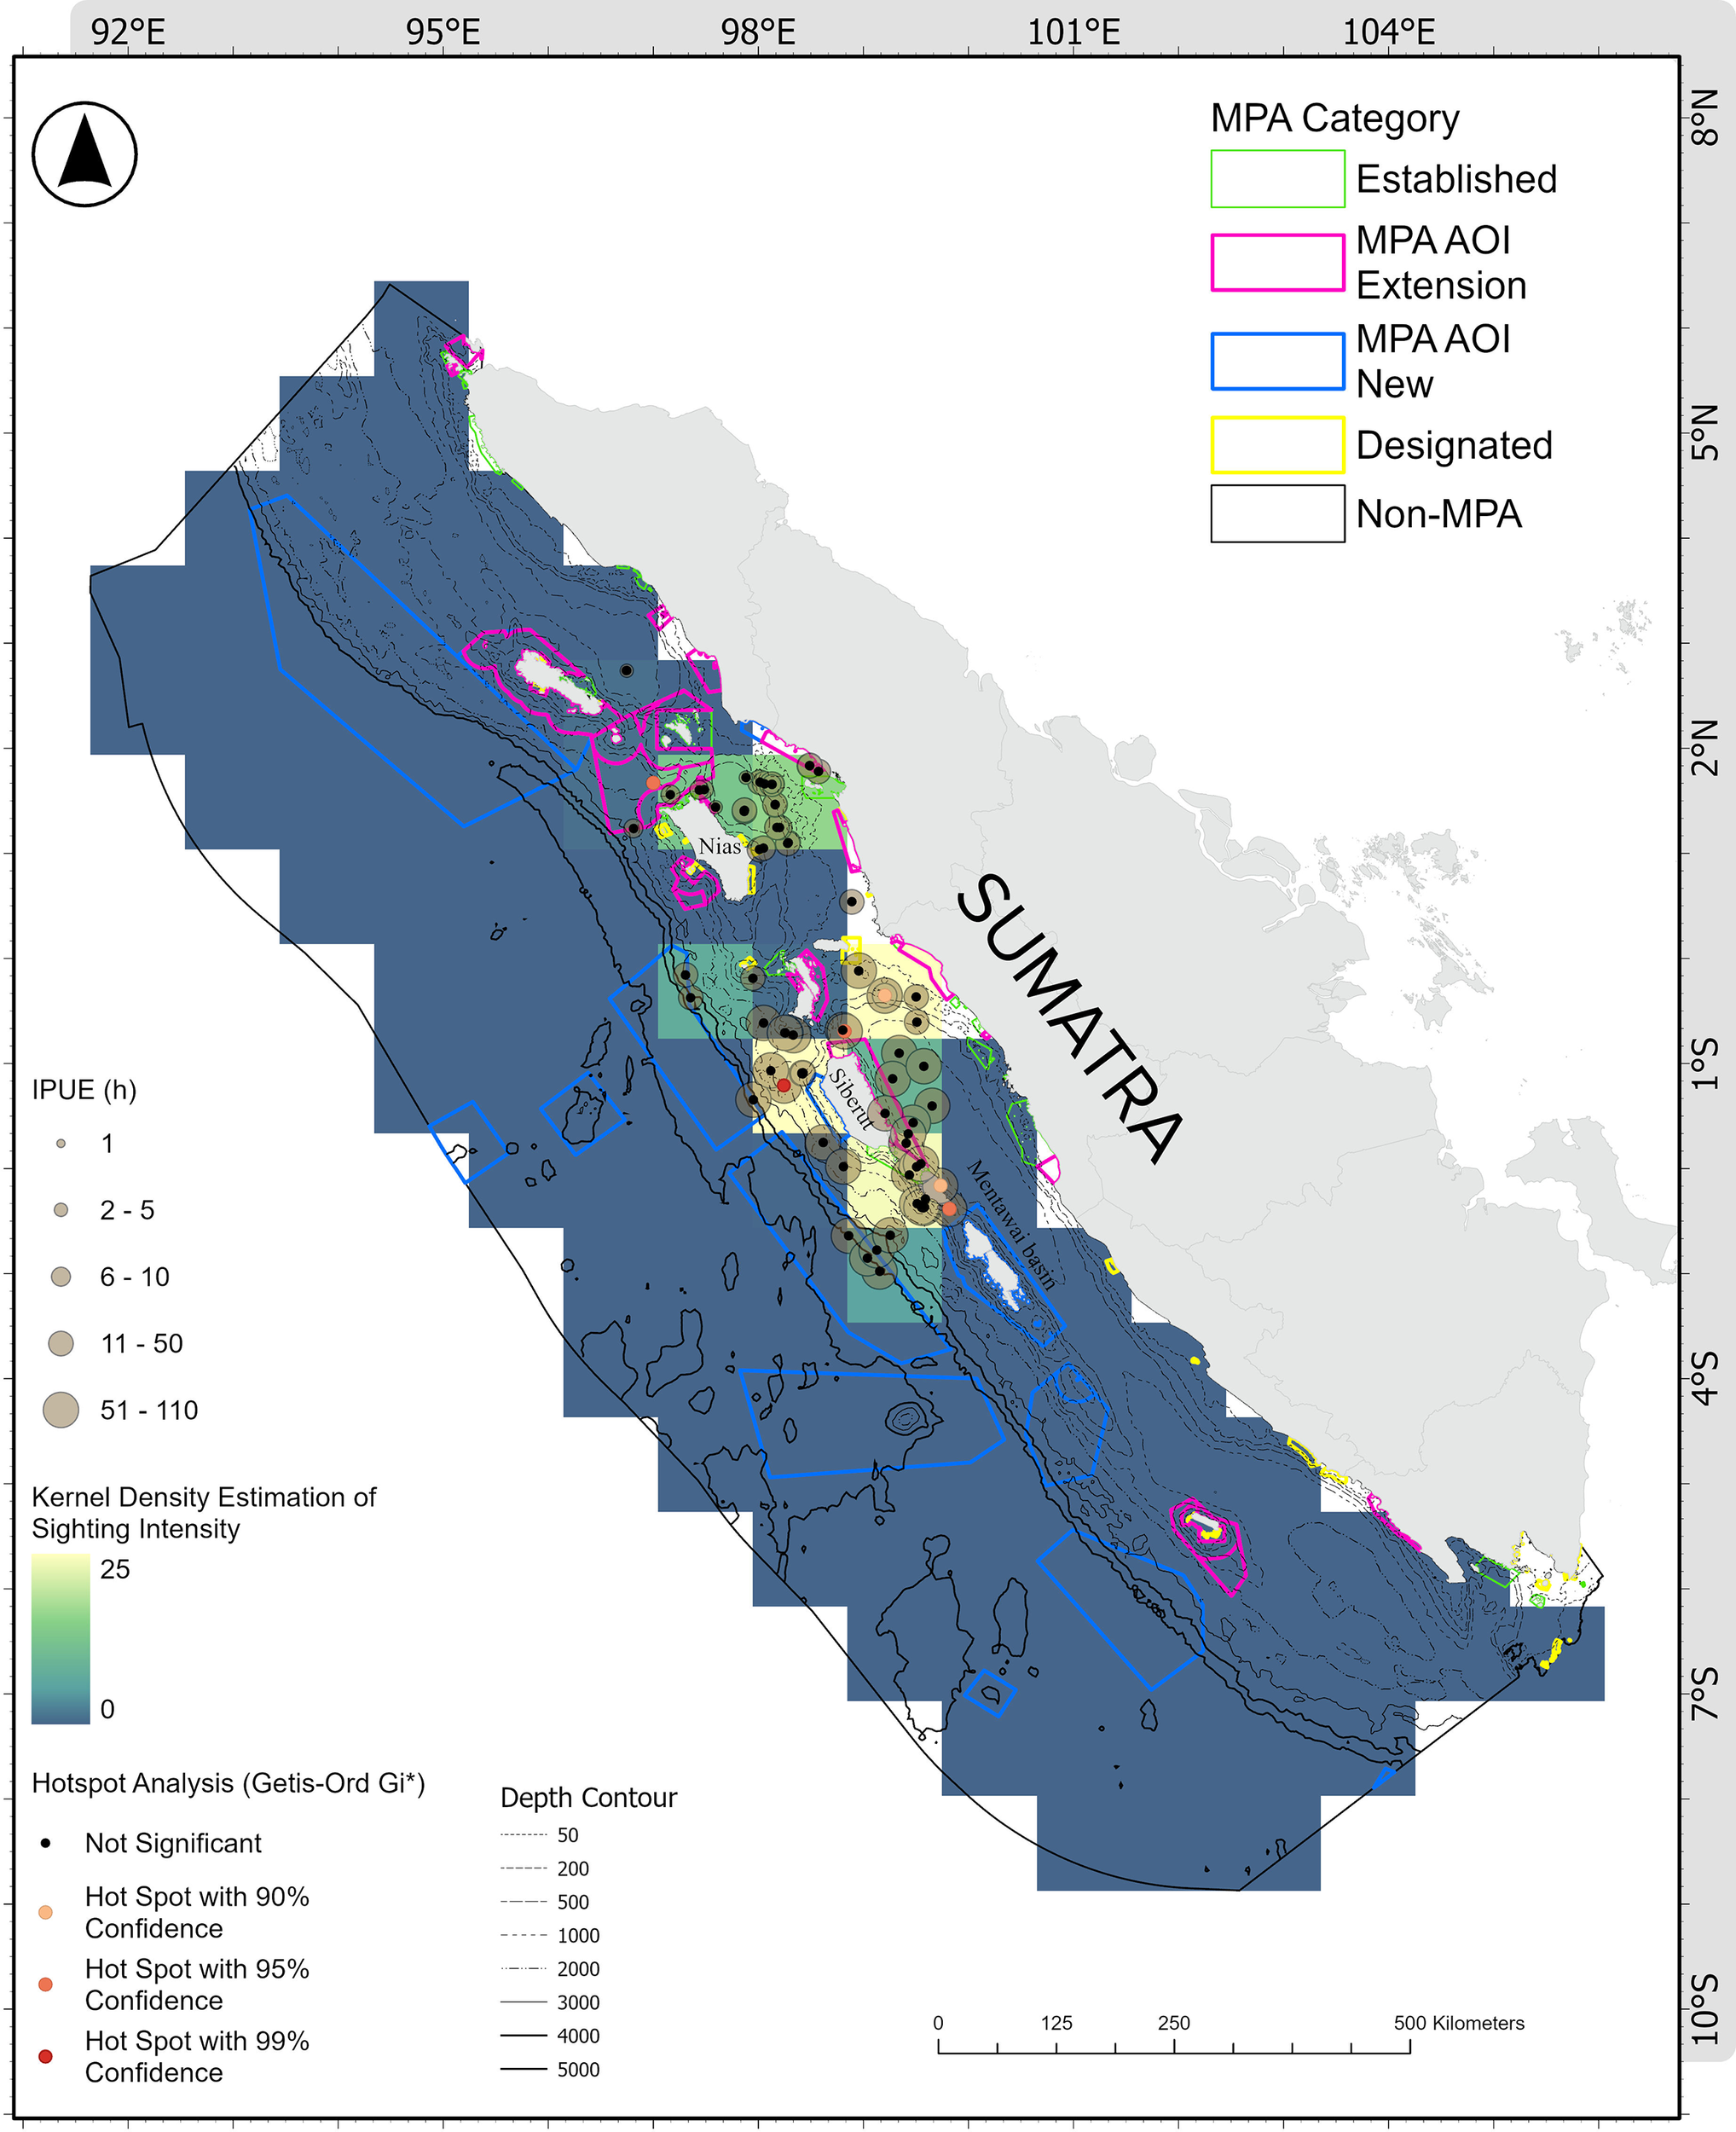
Hotspots analysis of individual per unit effort (hour) in relation to marine protected areas. Marine Protected Areas (MPAs) were categorized as follows: established MPAs, which are operational; designated MPAs, which are formally allocated in marine spatial planning but not yet established or operational; Areas of Interest (AOIs), which represent proposed MPA expansions or new delineations to support the 30×45 vision; and non-MPA areas, which are not designated or planned for protection.
The abundance-based hotspot analysis using Getis-Ord Gi* yielded a complementary pattern. Out of 109 species-specific sighting records, 14 locations were identified as significant IPUE hotspots (Z = 1.74–3.86; Figure 4). Hotspots were dominated by striped and spinner dolphins due to their consistently large group sizes and high IPUE. The highest Gi* hotspot was also found in Northwest Siberut, where striped dolphins recorded an IPUE of 145.63 h−1, confirming that this area is both a high sighting-intensity zone and a high-abundance aggregation area. Additional IPUE hotspots were associated with spinner dolphins in national waters (IPUE = 89.15 h−1, Z = 2.15, p < 0.05) and within the MPA AOI Extension (IPUE = 87.59 h−1, Z = 2.11, p < 0.05).
Most hotspots (71%, 10 of 14) were located in national waters, while the remaining four occurred in provincial waters. Furthermore, 93% (13 of 14) of detected hotspots were outside existing MPAs, with only one hotspot falling inside the proposed MPA expansion area.
3.4 Niche segregation
NMDS revealed seven distinct cetacean spatial clusters (NMDS stress = 0.14), driven primarily by biological and physical oceanographic factors, as well as seafloor geomorphic (Figures 5A, B). Surface zooplankton concentration was the strongest predictor of clustering (R² = 0.75, p < 0.001), followed by sea level anomaly (R² = 0.71, p < 0.001), whereas bathymetry contributed the least (R² = 0.19, p < 0.001; Figure 5D). Environmental conditions differed significantly among clusters (Kruskal–Wallis, all p < 0.001), confirming clear ecological niche partitioning across the region (Figure 5C).
Figure 5
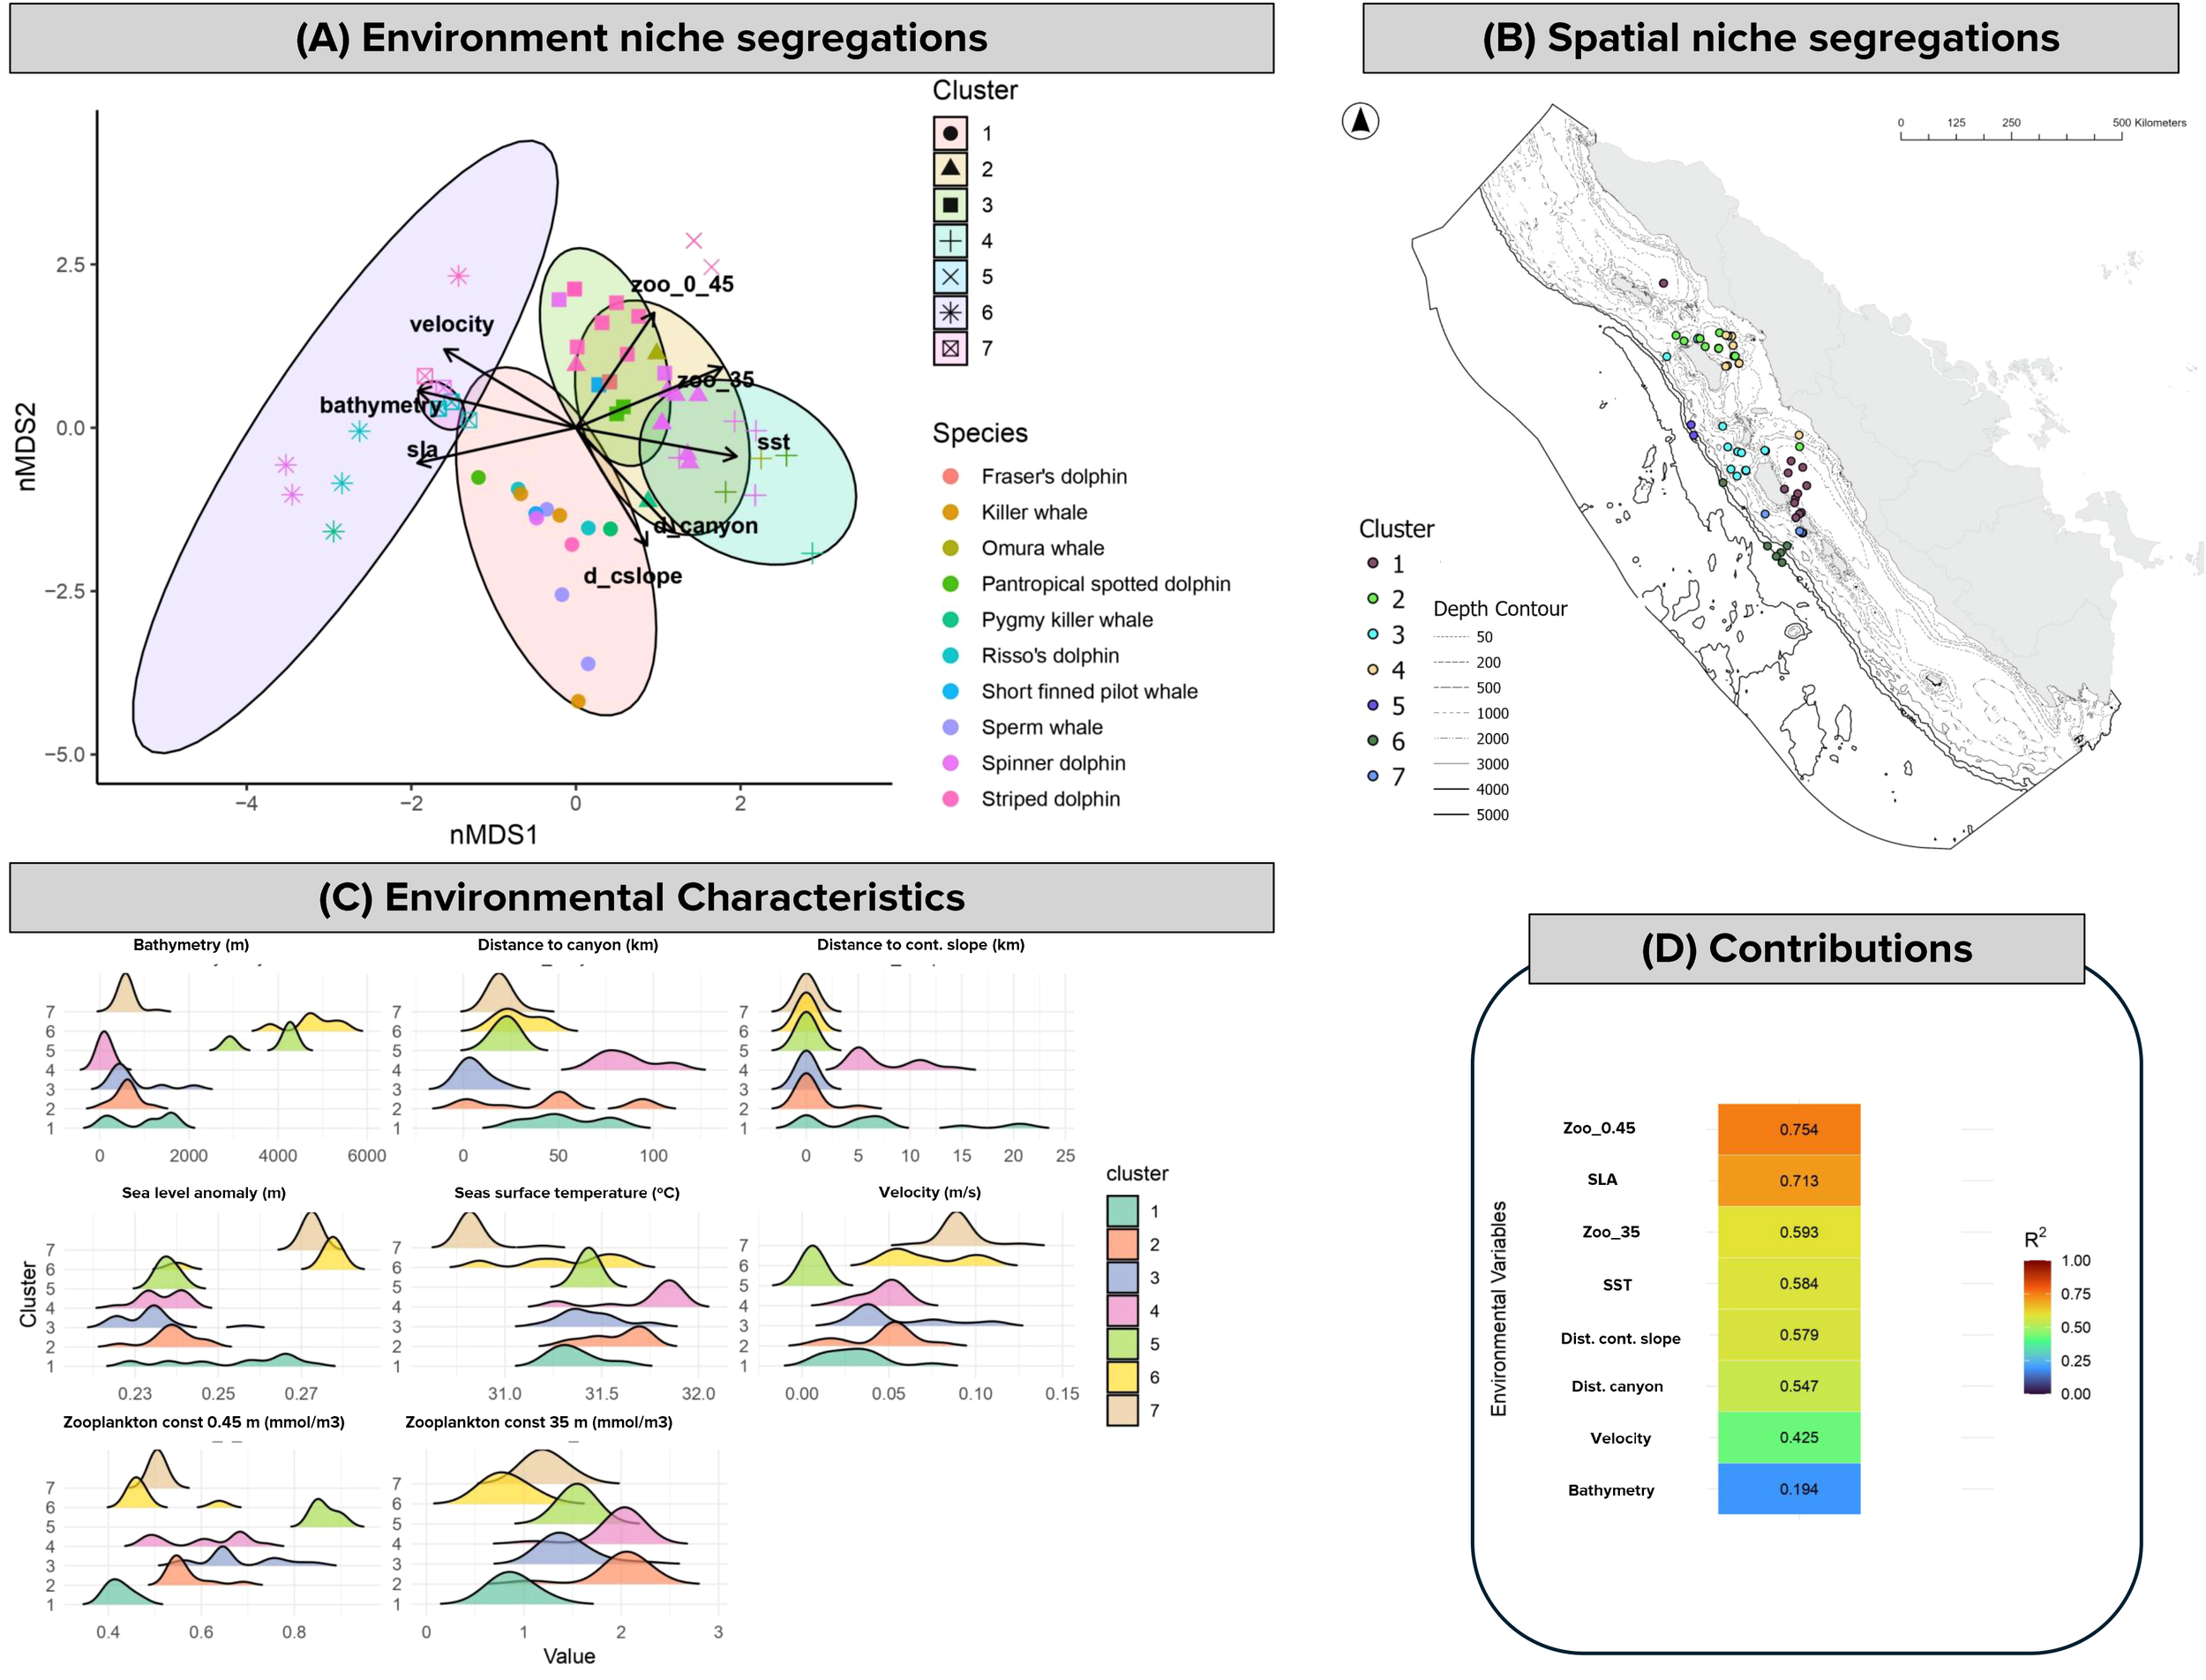
Segregation of environmental niches reflecting spatial patterns in cetacean occurrence. (A) NMDS plot showing clustering patterns in relation to environmental gradients. Each species is represented by a different marker color, while different circle colors and symbols indicate cluster grouping. (B) Spatial distribution of NMDS clusters, showing where each environmental niche type occurs geographically. (C) Ridge plot of key environmental variables describing the conditions associated with each cluster. (D) Contribution of environmental variables to species–cluster separation.
Cluster 1 had the highest species richness, comprising eight species including spinner, striped, and pantropical spotted dolphins, pygmy killer whales, Risso’s dolphins, short-finned pilot whales, killer whales, and sperm whales. It occupied mid-slope habitats (mean depth: 955 m). Post-hoc Dunn’s tests confirmed this depth was significantly deeper than Cluster 4 (p < 0.001) and Cluster 6 (p < 0.05). Cluster 1 was closer to continental slopes (p < 0.01). Zooplankton availability was moderate and significantly lower than highly productive Clusters 2–5 (p < 0.001).
Cluster 3, dominated by striped dolphins (7 of 21 sightings; IPUE = 232 h−1), showed the highest overall abundance (440 h−1). This cluster was strongly linked to canyon and slope habitats (~6 km from canyons; 0 km from slope) and moderate bathymetry (720 ± 588 m). High prey availability characterized this cluster, with elevated surface and subsurface zooplankton (0.68 ± 0.09 and 1.45 ± 0.24 mmol/m³), significantly higher than offshore clusters (cluster 6-7, p < 0.001).
Clusters 2 and 4 were strongly associated with shallow, highly productive environments and were the only clusters where Omura’s whales were recorded. Cluster 2 was dominated by spinner dolphins (9 of 25 sightings) and accounted for the highest abundance within this cluster (205 h−1 of 544 h−1). It was linked to shallow shelf waters (593 ± 267m) with elevated subsurface zooplankton concentrations (2 ± 0.31 mmol/m³), significantly higher compared to oligotrophic offshore clusters (cluster 6-7, p < 0.001). Cluster 4, which included Omura’s whales, pygmy killer whale, spinner dolphins, striped dolphin, and pantropical spotted dolphins, represented the most coastal and productive habitat, characterized by the shallowest bathymetry (114 ± 87 m), and consistently high surface (0.60 ± 0.09 mmol/m³) and subsurface zooplankton (2 ± 0.25 mmol/m³). Both clusters showed significantly greater zooplankton concentrations at subsurface (35 m) compared to clusters 6 and 7 (p < 0.001), underlining their strong association with productive foraging grounds.
In contrast, cluster 5 (offshore striped dolphins) and Cluster 6 (striped dolphins, spinner dolphins, Risso’s dolphin, and pygmy killer whales) were associated with deep, oligotrophic waters (3,821 ± 781 m and 4,791 ± 572 m, respectively), characterized by weak current velocities (~0.006–0.07 m/s), suggesting calm pelagic waters. Cluster 7, dominated by Risso’s dolphins with some spinner and striped dolphins, was linked to slope-associated habitats (599 ± 176 m) and stronger currents (0.09 ± 0.01 m/s), significantly higher than Clusters 1–5 (p < 0.001).
3.5 Threat exposure
The analysis shows that cetaceans are exposed to potential threats from intensive fishing, busy maritime traffic, and government-designated shipping lanes, with several species regularly inhabiting areas that coincide with these high-risk human activities (Figure 6). Kruskal-Wallis tests revealed significant interspecific differences in proximity to fishing pressure (χ² = 25.83, df = 9, p = 0.002), maritime traffic (χ² = 39.49, df = 9, p < 0.001), and shipping lanes (χ² = 37.04, df = 9, p < 0.001).
Figure 6
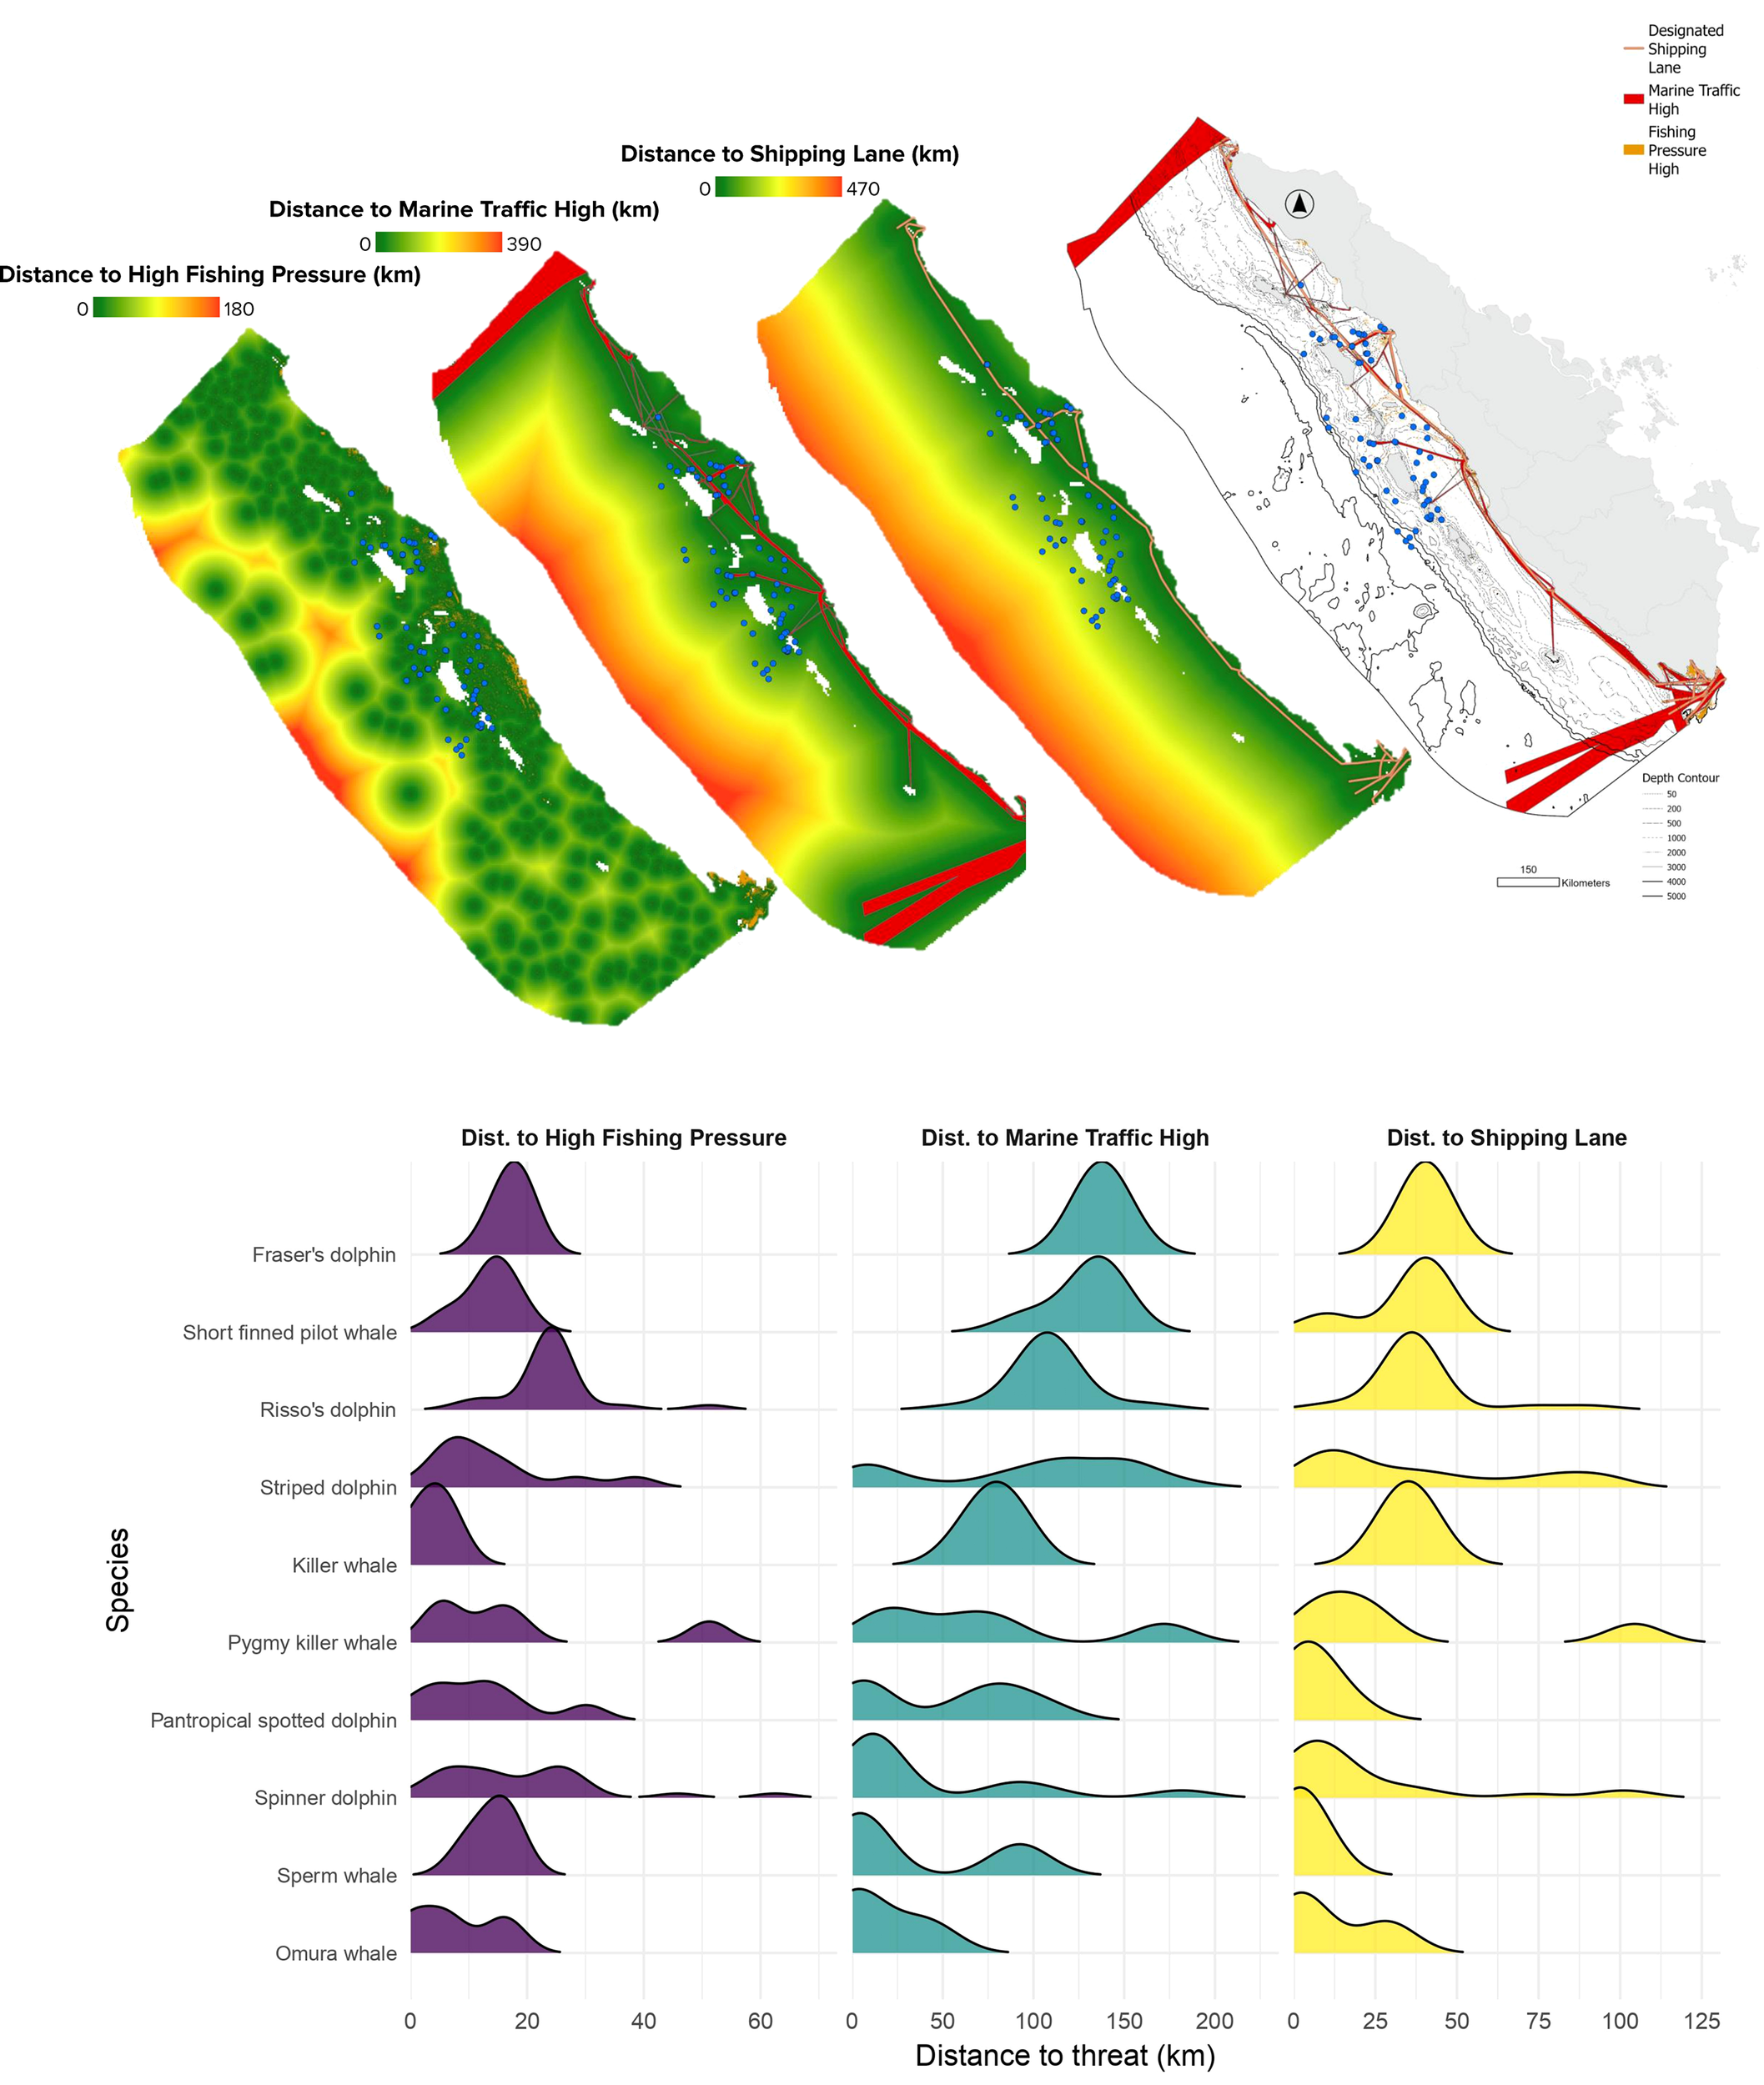
Potential threat exposure of cetaceans to fishing activity and maritime traffic.
Regarding the species-specific potential threats, Killer whales were found closest to intensive fishing zones (mean = 3.6 km), significantly closer than Risso’s dolphins (Dunn’s test, p = 0.021). In contrast, Risso’s dolphins (24.3 km) and spinner dolphins (18.9 km) were detected farther from fishing areas. Omura’s whales were nearest to high maritime traffic zone (mean = 15.3 km), significantly closer than Fraser’s dolphins (p = 0.048), which were recorded much farther away (137.7 km). Regarding shipping lanes, sperm whales exhibited the closest overlap (mean = 2.1 km), followed by Omura’s whales (11.1 km) and pantropical spotted dolphins (5.9 km), while Risso’s (38.3 km) and striped dolphins (38.0 km) were significantly farther (p < 0.01).
4 Discussion
To our knowledge, this is the first dedicated aerial transect survey of cetacean assemblages off the western coast of Sumatra in the southeastern tropical Indian Ocean. This pioneering survey provides novel insights into the species diversity, relative abundance, spatial distribution, and habitat preferences of cetaceans in a region where baseline information has previously been scarce. By integrating aerial survey data with geomorphological, biological, and physical oceanographic variables, we were able to identify species-specific niche segregation, and high-density hotspots. Furthermore, our results reveal how cetacean spatial patterns intersect with anthropogenic pressures, including fishing activity and maritime traffic, highlighting both ecological drivers and potential threats to cetacean populations in this underexplored area.
4.1 Limitation
Despite these advances, several limitations should be acknowledged when interpreting the results. The survey represents a single rapid assessment conducted over a short period (May–July 2024), coinciding with the onset of the southeast monsoon, when upwelling and productivity along the Sumatran coast are elevated (Susanto et al., 2001). Thus, the dataset reflects only one seasonal window and does not capture potential shifts in cetacean distribution during other monsoon phases or migratory periods. Additionally, aerial surveys inherently risk availability bias (Caughley 1974; Hodgson et al., 2017), where animals are underwater and therefore unavailable to be detected. This bias increases at high helicopter speeds (Quang & Lanctot, 1991; Whitworth et al., 2022) and may affect species differently depending on diving behavior and group size. Without replicated transects, missed detections cannot be quantified (Delaney et al., 2025), which means that abundance-based hotspot results are more vulnerable to underestimation (Brack et al., 2023) and should be interpreted cautiously when comparing with other regions.
Furthermore, low sample sizes for deep-diving and rare species reduce statistical power, making it difficult to detect true differences and requiring cautious interpretation. Moreover, because perpendicular detection distances were not recorded, density estimates could not be derived using distance sampling; instead, IPUE (hour and kilometer) were used as a relative abundance index. Future surveys should include replicated transects, systematic recording of perpendicular distances (Panigada et al., 2024), and multi-season temporal coverage to better account for detection probability and seasonal shifts, while extending temporal coverage to capture multi-seasonal patterns in cetacean distribution and habitat use. Consequently, the observed patterns should be interpreted as indicative outcomes of a rapid assessment, providing preliminary insights into spatial and ecological patterns.
4.2 Key species findings and biogeographic significance
By increasing the known cetacean diversity from 21 to 23 species and providing the first confirmed aerial records of killer whales (Orcinus orca) and pygmy killer whales (Feresa attenuata), this study fills a critical knowledge gap in the biogeography of cetaceans in Indonesian waters, where both species are considered cosmopolitan but have not previously been documented in the literature for this region. Killer whales and pygmy killer whales are both recognized as species that inhabit deep oceanic waters, though their specific distributions and behaviors differ. Our study confirms that their presence in the study area with respect to more than 1,500 meters depth (Supplementary Table 4).
Although killer whales are one of the most wide-ranging mammals, they are typically associated with cold, productive waters and are rarely found in tropical regions like Indonesia, with densities as low as 0–0.10 whales per 100 km² (Dahlheim and Ridgway, 1998; Forney et al., 2006; Ford, 2009). Historical records in Indonesia are scarce, with only three confirmed strandings reported between 1995 and 2021 (Mustika et al., 2022), and previous sightings limited to areas such as the Savu Sea (Barnes, 1996; Mustika, 2006), Bali (Mustika, 2011), Wakatobi (Sahri et al., 2020b), Ceram (Soede et al., 2019), Banda and Timor Seas (Sivasubramaniam, 1964; Leatherwood, 1991), Gorontalo (Mustika et al., 2021; Madjowa et al., 2024), Raja Ampat (Ender et al., 2014), and Kaimana (Putra et al., 2025). Beyond Indonesia, killer whales have been recorded at multiple sites across the Indian Ocean, reinforcing the idea that these tropical waters act as a migratory corridor. They occurrence has been recorded in Sri Lanka’s waters (Ilangakoon et al., 2010), India (Kumarran, 2012), and Maldive (Andersen et al., 2012).
Pygmy killer whales have been recorded in the waters of more than 100 countries, yet they are considered naturally rare across their global range (Braulik, 2018). For instance, the estimated population in the northern Gulf of Mexico is only 152 individuals (Waring et al., 2013), and during a 22-year cetacean survey around the main Hawaiian Islands, this species accounted for just 1.2% of all odontocete sightings (McSweeney et al., 2009). Reflecting this rarity, our study found that pygmy killer whales represented only 5% of the species-specific sightings (5 of 109; Table 2). Stranding data also confirm their rarity in Indonesia, comprising only 2% (12 of 568 cases), with records from Bali, East Java, Central Java, East Nusa Tenggara, East Kalimantan, North Maluku, and the Riau Islands (Mustika et al., 2022). Additional rare sightings have been documented in nearby areas, such as Maldive (Andersen et al., 2012), Balikpapan Bay (Kreb et al., 2020), Morotai-North Maluku (Soede et al., 2019), Savu Sea (Putra and Mustika, 2021), Raja Ampat (Ender et al., 2014).
Beyond these two species, our survey also confirmed the presence of Omura’s whale, a recently identified and still poorly understood baleen whale. In Indonesia, the species exhibits a surprisingly wide distribution, with verified sightings from West Sumatra through the southern Java Sea, Bali, Komodo, Solor Archipelago, Seram, Raja Ampat, North Sulawesi, and East Kalimantan (Cerchio et al., 2019). Earlier work in the Pieh MPA detected the species only in July, September, and December (Daniel et al., 2025), whereas our observations occurred in May and June 2024. This temporal pattern implies that Omura’s whales may use the area seasonally, possibly tracking increased productivity associated with monsoon-driven coastal upwelling (Susanto et al., 2001).
Finally, our combined dataset of 23 cetacean species (Supplementary Table 1) accounts for approximately 68% (23 of 34) of Indonesia’s known cetacean species (Mustika et al., 2015), highlighting the ecological significance of this region. In comparison, other IUCN-designated Important Marine Mammal Areas (IMMAs) for cetacean diversity hotspots report fewer species, such as Wakatobi and Adjacent Waters (11 species; (IUCN-MMPATF, 2022a)), Southern Bali Peninsula and Adjacent Slope (18 species; (IUCN-MMPATF, 2022b)), or slightly higher diversity such as the Savu Sea (24 species; (IUCN-MMPATF, 2022c)) and Berau–East Kutai District (25 species; (IUCN-MMPATF, 2022d)). The high cetacean diversity in western Sumatra waters is closely linked to the region’s heterogeneous habitats (Figure 5; Supplementary Figure 1), shaped by deep basins, steep slopes, canyons, and escarpments that promote localized upwelling and nutrient mixing (Roberts et al., 2016; Di Tullio et al., 2016; Ramírez-León et al., 2021).
From a conservation perspective, the high species diversity of this region, coupled with the presence of threatened species such as sei whales, blue whales, sperm whales, and Indo-Pacific humpback dolphins (Supplementary Table 1), underscores its strong potential for designation as an Important Marine Mammal Area (IMMA) in the near future. This recommendation is further supported by the region’s recognition as an Ecologically or Biologically Significant Marine Area (UN Environment, 2017), specifically the Upwelling Zone of the Sumatra-Java Coast, which highlights its exceptional ecological value and significance for marine biodiversity.
4.3 Environmental drivers of cetacean assemblages
Environmental variables, particularly seafloor oceanographic productivity and geomorphology, play a central role in shaping cetacean distributions in this region (Supplementary Figure 3). Species segregate across depth gradients, from shallow productive shelves (~257 m) favored by Omura whales (Cerchio et al., 2019; Daniel et al., 2025) to deep basin waters (~1,641 m) occupied by killer whales (McInnes et al., 2024). Spinner dolphins exhibit the broadest depth range from 6 to 5,484 m (Moreno et al., 2005), while striped (Azzolin et al., 2020) and Fraser’s dolphins (Valdivia et al., 2024) are associated with mid-depth habitats near canyons and escarpments. Risso’s dolphins occur closer to shore (~21 km) in dynamic slope habitats with stronger currents, reflecting potential coastal feeding areas (Arranz et al., 2019). In contrast, pygmy killer whales (Braulik, 2018) and short-finned pilot (Abecassis et al., 2015) whales favor offshore or slope environments, while sperm whales rely on deep slope waters despite lower surface productivity. The key reason is that these habitats offer rich prey resources at depth, which are not reflected by surface productivity measures. Sperm whales rely on deep-water prey and oceanographic features below the surface, making deep slope waters critical for their foraging success (Virgili et al., 2022). Species such as Omura’s, spinner, spotted, and striped dolphins are linked to high zooplankton concentrations, whereas killer, and sperm whales occupy more oligotrophic waters, indicating clear environmental niche segregation driven by seafloor geomorphology and oceanographic productivity.
Cluster 3 illustrates how geomorphic complexity supports prey aggregation. Moderate surface and subsurface zooplankton concentrations in this cluster are significantly greater than those in less complex offshore areas (Clusters 6–7; Supplementary Figure 4). This makes cluster 3 as a potential foraging hotspot, particularly for striped and spinner dolphins, which were also the primary contributors to significant hotspots identified through the Getis-Ord Gi* analysis around Northwest Siberut Island and adjacent national waters.
Additionally, a rare feeding event of an Omura’s whale was recorded on 3 June 2025 near Northeast Nias Island, within Cluster 2—a shallow (~75 m), highly productive shelf area (~2 mmol/m³ subsurface zooplankton). Comparable feeding behavior and repeated sightings, including mother–calf pairs, have recently been documented in several locations in Indonesia such as Pieh MPA in West Sumatra, East Kalimantan, and Raja Ampat, mostly occurring in shallow and productive shelf waters (27–180 m; (Daniel et al., 2025). These observations match global reports of Omura’s whales lunge feeding in coastal waters rich in zooplankton (Cerchio et al., 2015, 2019), underscoring the role of localized oceanographic conditions in shaping foraging opportunities.
These findings reveal niche partitioning among cetacean assemblages shaped by seafloor geomorphology and oceanographic processes. Coastal clusters (2–4) were dominated by spinner, striped, pantropical spotted dolphins, and Omura’s whales in shallow, productive waters. Slope and canyon clusters (1 and 3) hosted Risso’s dolphins, Fraser’s dolphins, and pilot whales linked to upwelling and mid-slope productivity. Offshore clusters (5 and 6) were dominated by striped dolphins, pygmy killer whales, and some spinner dolphins in deep pelagic waters, while cluster 7, mainly Risso’s dolphins, was associated with dynamic slope currents. This habitat stratification from coastal, zooplankton-rich zones utilized by Omura’s whales to deep-basin habitats favored by apex predators like killer whales, reduces interspecific competition and sustains a diverse cetacean community (Lebon et al., 2024). The interplay of geomorphic features and seasonal upwelling creates critical foraging hotspots, reinforcing the importance of conserving this full spectrum of habitats to sustain the ecological integrity, recovery, and resilience of cetacean populations in western Sumatra (Stephenson et al., 2021; Kiszka et al., 2022).
4.4 Management implications
A critical management insight from this study is that most of cetacean hotspots (sightings and relative abundance) lie outside current and planned MPAs (Figure 4). This demonstrates that current MPA expansions have not yet secured several key cetacean habitats, leaving critical areas unprotected. It should be noted, however, that this study was conducted only during a part of the year and is constrained by the limitations described in Section 4.1. Although the 30×45 MPA initiative incorporates cetacean distributions (Direktorat Konservasi Ekosistem dan Biota Perairan, 2024), detailed information on hotspots such as those in the waters off western Sumatra remains limited. The discovery of additional critical cetacean habitat outside known ranges highlights the need for MPA planning to integrate findings from rapid assessments so that key habitats are properly considered in management.
Since our study identified that many cetacean hotspots remain outside existing and planned MPA, this emphasizes the need for targeted and strategic conservation planning to safeguard these species. There is an urgent need for spatially focused protection and adaptive management (Sahri et al., 2021; Carlucci et al., 2021). In Indonesia, the establishment of an MPA does not automatically mean that an area becomes fully protected. MPAs are managed through multiple zoning categories, including core zone, limited-use zone, and other zone (Nugraha, 2021). In Indonesia, core zones generally cover between 10% and 70% of key conservation habitats and are strictly protected, allowing only research activities. A limited-use zone allows regulated activities such as sustainable fisheries and tourism. Other zones are designed to accommodate socio-economic functions, including cultural activities, infrastructure, and shipping. Therefore, cetacean hotspots do not necessarily need to be placed strictly within fully protected zones. Because cetaceans are mobile and use habitats dynamically, core zones alone may not always accommodate their spatial and temporal needs (Dwyer et al., 2020). Hotspots can instead be incorporated into limited-use zones, which generally constitute the largest portion of MPAs, provided that appropriate mitigation measures are applied. These measures may include vessel speed reduction to minimize collision risk (Rockwood et al., 2020), bycatch prevention strategies (Hamilton and Baker, 2019), and spatial operating rules that reduce disturbances (Gormley et al., 2012). This approach allows cetacean habitats to be managed while still supporting the multi-use nature of Indonesia’s MPA system.
Our results indicate species-specific potential vulnerabilities based on spatial overlap with human activities. Killer whales may face interaction risks with intensive fishing operations, while Omura’s whales and sperm whales show higher potential exposure to ship strikes along commercial shipping lanes. These represent potential risks rather than confirmed impacts, underscoring the need for further research linking spatial patterns with stranding or bycatch data to better assess actual threats.
The large-scale aerial observations conducted in this study highlight the effectiveness of this approach in understanding species diversity and distribution across diverse habitats, particularly in offshore waters where most regional research has relied on coastal-based (Daniel et al., 2025) or opportunistic surveys. Future research should integrate aerial surveys (Roberts et al., 2016), with opportunistic sighting records (Sahri et al., 2021), and satellite telemetry data (Kelly et al., 2024) to develop more robust habitat suitability and habitat-use models, enabling the evaluation of spatial and temporal mismatches between predicted critical habitats and existing marine protected areas, thereby improving the design and effectiveness of conservation measures (Stephenson et al., 2021; Kiani et al., 2023).
Finally, the findings highlight the need to re-evaluate MPA design in western Sumatra to protect key cetacean habitats and support Indonesia’s 30×45 vision through the creation of offshore MPAs. In parallel, these results should be communicated to fisheries management authorities at both national and provincial levels to support the integration of measures that reduce the risk of cetacean bycatch and other fishing-related threats. Furthermore, it is essential to engage with other relevant sectors, particularly maritime transportation, to encourage coordinated actions that can mitigate additional pressures on cetacean populations across their range.
5 Conclusions
As the first dedicated aerial transect survey of cetaceans off western Sumatra, this study offers novel insights into species diversity, spatial distribution, and habitat preferences in one of Indonesia’s least explored marine regions. We documented 10 species, adding 2 new records from this study and bringing the regional total to 23 species, representing 68% of Indonesia’s known cetaceans. This includes the first aerial confirmations of killer whales and pygmy killer whales, providing important biogeographic updates. The analysis reveals strong niche partitioning driven by seafloor geomorphology and biological oceanographic factors, with coastal upwelling zones, mid-slope canyons, and offshore oligotrophic waters each supporting distinct cetacean assemblages. Alarmingly, 93% of high-density hotspots occur outside current and planned expanded MPAs, underscoring the need for strategic protection, species-specific mitigation (e.g., reducing vessel strikes and bycatch), and manifestation of MPA expansion plans. With its exceptional biodiversity and the presence of threatened species such as sei, blue, and sperm whales, this region merits prioritization for designation as an IMMA and alignment with its recognized Ecologically or Biologically Significant Marine Area status.
Statements
Data availability statement
The raw data supporting the conclusions of this article will be made available by the authors, without undue reservation.
Ethics statement
The animal study was approved by Coordinating Ministry for Maritime Affairs and Investment and National Research and Innovation Agency. The study was conducted in accordance with the local legislation and institutional requirements.
Author contributions
MP: Conceptualization, Validation, Writing – review & editing, Writing – original draft, Investigation, Formal analysis. AH: Writing – review & editing, Investigation, Data curation. HP: Data curation, Writing – review & editing, Conceptualization, Investigation. IS: Writing – review & editing, Data curation, Investigation. EW: Writing – review & editing, Investigation, Data curation.JK: Writing – review & editing, Investigation, Data curation. AL: Data curation, Investigation, Writing – review & editing. RP: Project administration, Writing – review & editing. YH: Writing – review & editing. AS: Writing – review & editing. SH: Writing – review & editing. BP: Writing – review & editing, Funding acquisition, Project administration. MI: Writing – review & editing, Project administration, Supervision. MR: Supervision, Writing – review & editing, Project administration. JT-F: Writing – review & editing, Conceptualization. VN: Supervision, Writing – review & editing.
Funding
The author(s) declared financial support was received for this work and/or its publication. The research was generously funded by OceanX in facilitating the research.
Acknowledgments
The authors extend their deepest gratitude to the Government of Indonesia, particularly the Coordinating Ministry for Maritime Affairs and Investment and the National Research and Innovation Agency, for their exceptional support and facilitation of the Indonesia Mission 2024. Their commitment to advancing marine science and conservation in Indonesian waters was instrumental in enabling this pioneering research. We also wish to highlight the critical role played by the OceanX crew, whose expertise, logistical support, and technical capabilities during the aerial survey ensured the successful execution of data collection across challenging environments.
Conflict of interest
Author JT-F was employed by the company Buro Happold.
The remaining author(s) declared that this work was conducted in the absence of any commercial or financial relationships that could be construed as a potential conflict of interest.
Generative AI statement
The author(s) declared that generative AI was not used in the creation of this manuscript.
Any alternative text (alt text) provided alongside figures in this article has been generated by Frontiers with the support of artificial intelligence and reasonable efforts have been made to ensure accuracy, including review by the authors wherever possible. If you identify any issues, please contact us.
Publisher’s note
All claims expressed in this article are solely those of the authors and do not necessarily represent those of their affiliated organizations, or those of the publisher, the editors and the reviewers. Any product that may be evaluated in this article, or claim that may be made by its manufacturer, is not guaranteed or endorsed by the publisher.
Supplementary material
The Supplementary Material for this article can be found online at: https://www.frontiersin.org/articles/10.3389/fmars.2025.1687272/full#supplementary-material.
References
1
Abecassis M. Polovina J. Baird R. W. Copeland A. Drazen J. C. Domokos R. et al . (2015). Characterizing a foraging hotspot for short-finned pilot whales and Blainville’s beaked whales located off the west side of Hawai ‘i Island by using tagging and oceanographic data. PloS One10, e0142628. doi: 10.1371/journal.pone.0142628
2
Andersen R. C. Sattar S. A. Adam M. S . (2012). Cetaceans in the Maldives: a review. J. Cetacean Res. Manage., 12(2), 219–225. doi: 10.47536/jcrm.v12i2.579
3
Arranz P. Benoit-Bird K. J. Friedlaender A. S. Hazen E. L. Goldbogen J. A. Stimpert A. K. et al . (2019). Diving behavior and fine-scale kinematics of free-ranging Risso’s dolphins foraging in shallow and deep-water habitats. Front. Ecol. Evol.7, 53. doi: 10.3389/fevo.2019.00053
4
Avila I. Kaschner K. Dormann C. (2018). Current global risks to marine mammals: taking stock of the threats. Biol. Conserv.221, 44–58. doi: 10.1016/j.biocon.2018.02.021
5
Azzolin M. Arcangeli A. Cipriano G. Crosti R. Maglietta R. Pietroluongo G. et al . (2020). Spatial distribution modelling of striped dolphin (Stenella coeruleoalba) at different geographical scales within the EU Adriatic and Ionian Sea Region, central-eastern Mediterranean Sea. Aquat. Conservation: Mar. Freshw. Ecosyst.30, 1194–1207. doi: 10.1002/aqc.3314
6
Barlow J. Gisiner R. (2005). Mitigating, monitoring and assessing the effects of anthropogenic sound on beaked whales. J. Cetacean Res. Manage.7, 239–249. doi: 10.47536/jcrm.v7i3.734
7
Barnes R. (1996). Sea hunters of Indonesia: Fishers and weavers of Lamalera (New York: Oxford University Press). doi: 10.1093/oso/9780198280705.001.0001
8
Bearzi M. (2012). Cetaceans and MPAs should go hand in hand: A case study in Santa Monica Bay, California. Ocean Coast. Manage.60, 56. doi: 10.1016/j.ocecoaman.2011.12.019
9
Braulik G. (2018). Feresa attenuata., s.l.: The IUCN Red List of Threatened Species. doi: 10.2305/IUCN.UK.2018-2.RLTS.T8551A50354433.en
10
Carlucci R. Manea E. Ricci P. Cipriano G. Fanizza C. Maglietta R. et al . (2021). Managing multiple pressures for cetaceans’ conservation with an Ecosystem-Based Marine Spatial Planning approach. J. Environ. Manage.287, 112240. doi: 10.1016/j.jenvman.2021.112240
11
Caughley G . (1974). Bias in aerial survey. The Journal of Wildlife Management, 921–933. doi: 10.2307/3800067
12
Cerchio S. Andrianantenaina B. Lindsay A. Rekdahl M. Andrianarivelo N. Rasoloarijao T. et al . (2015). Omura’s whales (Balaenoptera omurai) off northwest Madagascar: ecology, behaviour and conservation needs. R. Soc. Open Sci.2, 150301. doi: 10.1098/rsos.150301
13
Cerchio S. Yamada T. K. Brownell J. R.L. (2019). Global distribution of Omura’s whales (Balaenoptera omurai) and assessment of range-wide threats. Front. Mar. Sci.6. doi: 10.3389/fmars.2019.00067
14
Cerdeiro D. Komaromi A. Liu Y. Saeed M. (2020). IMF’s world seaborne trade monitoring system: A Proof of Concept for Building AIS-based Nowcasts from Scratch, s.l ( International Monetary Fund). Available online at: https://www.imf.org/en/publications/wp/issues/2020/05/14/world-seaborne-trade-in-real-time-a-proof-of-concept-for-building-ais-based-nowcasts-from-49393.
15
Chelton D. B. Schlax M. G. Samelson R. M . (2011). Global observations of nonlinear mesoscale eddies. Progress in oceanography, 91(2), 167–216. doi: 10.1016/j.pocean.2011.01.002
16
Corvianawatie C. Abrar M. Wouthuyzen S. Kusumo S. Salatalohi A. Hanif A. et al . (2018). The ocean-atmospheric condition around Pieh Islands–Western Sumatra, Indonesia and its role on coral reef resilience. IOP Conf. Series: Earth Environ. Sci.200, 12063. doi: 10.1088/1755-1315/200/1/012063
17
Dahlheim M. Ridgway S. (1998). “ Killer whale,” in The second book of dolphins and the porpoises handbook of marine mammals, 2nd ed. Eds. RidgwayS. H.HarrisonR. ( Academic Press, London).
18
Daniel N. A. Kreb D. Damanhuri H . (2025). Cetacean diversity, distribution, and population estimation of Stenella dolphins in Pieh Marine Protected Area and the surrounding seas, West Sumatra Province. Raffles Bulletin of Zoology, 73, 454–470. doi: 10.26107/RBZ-2025-0029
19
Delaney D. M. Harms T. M. Harris J. P. Kaminski D. J. Elliott J. R. Dinsmore S. J. et al . (2025). Repeatability of wildlife surveys for estimating abundance: A method to assess the consistency of detection probability and animal availability. PloS one, 20(4), e0321619. doi: 10.1371/journal.pone.0321619
20
Direktorat Konservasi Ekosistem dan Biota Perairan (2024). Perancangan Spasial bagi Perluasan Liputan Kawasan Konservasi untuk Mencapai Visi Kawasan Konservasi 30x45. 1st ed (Jakarta: Direktorat Jenderal Pengelolaan Kelautan dan Ruang Laut, Kementerian Kelautan dan Perikanan).
21
Dormann C. F. Elith J. Bacher S. Buchmann C. Carl G. Carré G. et al . (2013). Collinearity: a review of methods to deal with it and a simulation study evaluating their performance. Ecography, 36(1), 27–46. doi: 10.1111/j.1600-0587.2012.07348.x
22
Di Tullio J. Gandra T. Zerbini A. Secchi E. (2016). Diversity and distribution patterns of cetaceans in the subtropical southwestern atlantic outer continental shelf and slope. PloS One11, e0155841. doi: 10.1371/journal.pone.0155841
23
Du Y. Qu T. Meyers G. Masumoto Y. Sasaki H . (2005). Seasonal heat budget in the mixed layer of the southeastern tropical Indian Ocean in a high-resolution ocean general circulation model. J. Geophysical Research: Oceans110. doi: 10.1029/2004JC002845
24
Dwyer S. L. Pawley M. D. Clement D. M. Stockin K. A . (2020). Modelling habitat use suggests static spatial exclusion zones are a non-optimal management tool for a highly mobile marine mammal. Marine Biology, 167(5), 62. doi: 10.1007/s00227-020-3664-4
25
Ender A. Mangubhai S. Wilson J. Muljadi A. (2014). Cetaceans in the global centre of marine biodiversity. Mar. Biodiversity Records7, e18. doi: 10.1017/S1755267214000207
26
Filatova O. A. Hoyt E. Burdin A. M. Burkanov V. N. Fedutin I. D. Ovsyanikova E. N. et al . (2022). Important areas for cetaceans in Russian Far East waters. Aquat. Conservation: Mar. Freshw. Ecosyst.32, 687–701. doi: 10.1002/aqc.3782
27
Ford J. K. (2009). “ Killer whale: Orcinus orca,” in Encyclopedia of marine mammals ( Academic Press, Amsterdam), 650–657. doi: 10.1016/B978-0-12-373553-9.00150-4
28
Forney K. Wade P. Estes J. (2006). “ Worldwide distribution and abundance of killer whales,” in Whales, whaling and ocean ecosystems, Oakland, California: University of California Press vol. 145. , 162.
29
Garcia-Bustos V. Rosario Medina I. Cabañero Navalón M. D. Ruiz Gaitán A. C. Pemán J . (2024). Candida spp. in cetaceans: neglected emerging challenges in marine ecosystems. Microorganisms6, 1128. doi: 10.3390/microorganisms12061128
30
Getis A. Ord J. (1992). The analysis of spatial association by use of distance statistics. Geographical Anal.24, 189–206. doi: 10.1111/j.1538-4632.1992.tb00261.x
31
Giménez J. Waggitt J. Jessopp M. (2023). Identification of priority cetacean areas in the north-east Atlantic using systematic conservation planning. Aquat. Conservation: Mar. Freshw. Ecosyst.33, 1571–1579. doi: 10.1002/aqc.4015
32
Grantham H. S. Game E. T. Lombard A. T. Hobday A. J. Richardson A. J. Beckley L. E. et al . (2011). Accommodating dynamic oceanographic processes and pelagic biodiversity in marine conservation planning. PloS One6, e16552. doi: 10.1371/journal.pone.0016552
33
Grau Tomás E. García Sanabria J. (2022). Comparative analysis of marine-protected area effectiveness in the protection of marine mammals: Lessons learned and recommendations. Front. Mar. Sci.9. doi: 10.3389/fmars.2022.940803
34
Gormley A. M. Slooten E. Dawson S. Barker R. J. Rayment W. du Fresne S. et al . (2012). First evidence that marine protected areas can work for marine mammals. Journal of Applied Ecology, 49(2), 474–480. doi: 10.1111/j.1365-2664.2012.02121.x
35
Group GEBCO Compilation (2024). GEBCO 2024 grid, s.l (Liverpool, United Kingdom: British Oceanographic Data Centre (BODC).
36
Halkides D. Lee T. (2009). Mechanisms controlling seasonal-to-interannual mixed layer temperature variability in the southeastern tropical Indian Ocean. J. Geophysical Research: Oceans114. doi: 10.1029/2008JC004949
37
Hamilton S. Baker G. (2019). Technical mitigation to reduce marine mammal bycatch and entanglement in commercial fishing gear: lessons learnt and future directions. Rev. Fish Biol. Fisheries29, 223–247. doi: 10.1007/s11160-019-09550-6
38
Hamilton C. D. Lydersen C. Aars J. Biuw M. Boltunov A. N. Born E. W. et al . (2021). Marine mammal hotspots in the Greenland and Barents Seas. Mar. Ecol. Prog. Ser.659, 3–28. doi: 10.3354/meps13584
39
Harris P. Westerveld L. Zhao Q. Costello M. (2023). Rising snow line: Ocean acidification and the submergence of seafloor geomorphic features beneath a rising carbonate compensation depth. Mar. Geology463, 107121. doi: 10.1016/j.margeo.2023.107121
40
Henderson E. Smith M. H. Gassmann M. Wiggins S. M. Douglas A. B. Hildebrand J. A. (2014). Delphinid behavioral responses to incidental mid-frequency active sonar. J. Acoustical Soc. America136, 2003–2014. doi: 10.1121/1.4895681
41
Hodgson A. Peel D. Kelly N . (2017). Unmanned aerial vehicles for surveying marine fauna: assessing detection probability. Ecological Applications, 27(4), 1253–1267. doi: 10.1002/eap.1519
42
Horii T. Ueki I. Ando K. (2020). Coastal upwelling events, salinity stratification, and barrier layer observed along the southwestern coast of Sumatra. J. Geophysical Research: Oceans125, e2020JC016287. doi: 10.1029/2020JC016287
43
Hoyt E. (2012). Marine protected areas for whales dolphins and porpoises: A world handbook for cetacean habitat conservation. 1st Edition (London: Routledge). doi: 10.4324/9781849771948
44
Hupman K. Stockin K. A. Pollock K. Pawley M. D. Dwyer S. L. Lea C. et al . (2018). Challenges of implementing Mark-recapture studies on poorly marked gregarious delphinids. PloS One13, e0198167. doi: 10.1371/journal.pone.0198167
45
Ijsseldijk L. L. Hessing S. Mairo A. Ten Doeschate M. T. Treep J. van den Broek J. et al . (2021). Nutritional status and prey energy density govern reproductive success in a small cetacean. Sci. reports11, 19201. doi: 10.1038/s41598-021-98629-x
46
Ilangakoon A. D. Jayewardene R. Perera L. D . (2010). First confirmed sightings of the killer whale (Orcinus orca) in Sri Lanka's waters. Marine Biodiversity Records, 3, e14. doi: 10.1017/S1755267210000047
47
Indonesian Geospatial Information Agency (2022). Coastline map, scale 1:25,000 (Bogor: Geospatial Information Agency).
48
IUCN-MMPATF (2022a). Wakatobi and adjacent waters IMMA ( Marine Mammal Protected Areas Task Force). Available online at: https://www.marinemammalhabitat.org/.
49
IUCN-MMPATF (2022b). Southern bali peninsula and adjacent slope IMMA ( Marine Mammal Protected Areas Task Force). Available online at: https://www.marinemammalhabitat.org/.
50
IUCN-MMPATF (2022c). Savu sea and surrounding areas IMMA ( Marine Mammal Protected Areas Task Force). Available online at: https://www.marinemammalhabitat.org/.
51
IUCN-MMPATF (2022d). Berau and east kutai district, kalimantan IMMA ( Marine Mammal Protected Areas Task Force). Available online at: https://www.marinemammalhabitat.org/.
52
Kaschner K. Quick N. J. Jewell R. Williams R. Harris C. M . (2012). Global coverage of cetacean line-transect surveys: status quo, data gaps and future challenges. PloS One7, e44075. doi: 10.1371/journal.pone.0044075
53
Katona S. Whitehead H. (1988). Are Cetacea ecologically important. Oceanography Mar. Biol.26, 553–568. doi: 10.1371/journal.pone.0044075
54
Kiani M. Siddiqui P. Gore M. Huang S. (2023). Suitable habitats of two coastal cetaceans along the northern Arabian Sea: Important marine mammal areas susceptible to conservation gaps. Aquat. Conservation: Mar. Freshw. Ecosyst.33, 276–285. doi: 10.1002/aqc.3919
55
Kiszka J. Woodstock M. Heithaus M. (2022). Functional roles and ecological importance of small cetaceans in aquatic ecosystems. Front. Mar. Sci.25. doi: 10.3389/fmars.2022.803173
56
Kelly N. Raudino H. C. Panigada S. Pierantonio N. Panigada S. Pierantonio N. et al . (2024). The ACCOBAMS survey initiative: the first synoptic assessment of cetacean abundance in the Mediterranean Sea through aerial surveys. Front. Mar. Sci.10. doi: 10.3389/fmars.2023.1270513
57
Kumarran R. P . (2012). Cetaceans and cetacean research in India. J. Cetacean Res. Manage., 12(2), 159–172. doi: 10.47536/jcrm.v12i2.573
58
Kreb D. Lhota S. Porter L. Redman A. Susanti I. Lazecky M. et al . (2020). Long-term population and distribution dynamics of an endangered Irrawaddy dolphin population in Balikpapan Bay, Indonesia in response to coastal development. Front. Mar. Sci.7, 533197. doi: 10.3389/fmars.2020.533197
59
Lambert C. Authier M. Doremus G. Gilles A. Hammond P. Laran S. et al . (2019). The effect of a multi-target protocol on cetacean detection and abundance estimation in aerial surveys. R. Soc. Open Sci.9, 6. doi: 10.1098/rsos.190296
60
Leatherwood S. (1991). Recorded of the” Blackfish”(Killer, False Killer, Pilot, Pygmy Killer and Melonheaded whales) in the Indian Ocean 1772-1986 (Nairobi: United Nations Environment Programme).
61
Lebon M. Colaço A. Prieto R. Cascão I. Oliveira C. Tobeña M. et al . (2024). Isotopic niches reveal the trophic structure of the cetacean community in the oceanic waters around the Azores. Front. Mar. Sci.11, 1283357. doi: 10.3389/fmars.2024.1283357
62
Lezama-Ochoa N. Welch H. Brown J. A. Benson S. R. Forney K. A. Abrahms B. et al . (2025). Identifying climate refugia and bright spots for highly mobile species. NPJ Ocean Sustainability4, 35. doi: 10.1038/s44183-025-00136-3
63
Madjowa V. Olii A. Baruadi A. Salam A. (2024). Occurrence and photo-identification of killer whale in the gulf of tomini. Jambura Edu Biosfer J.6, 43–52. doi: 10.34312/jebj.v6i2.24487
64
McInnes J. D. Lester K. M. Dill L. M. Mathieson C. R. West-Stap P. J. Marcos S. L. et al . (2024). Foraging behaviour and ecology of transient killer whales within a deep submarine canyon system. PloS One19, e0299291. doi: 10.1371/journal.pone.0299291
65
McSweeney D. J. Baird R. W. Mahaffy S. D. Webster D. L. Schorr G. S . (2009). Site fidelity and association patterns of a rare species: pygmy killer whales (Feresa attenuata) in the main Hawaiian Islands. Mar. Mammal Sci.25, 557–572. doi: 10.1111/j.1748-7692.2008.00267.x
66
Miller D. L. Rexstad E. Thomas L. Marshall L. Laake J. L . (2019). Distance sampling in R. J. Stat. Software89, 1–28. doi: 10.18637/jss.v089.i01
67
Moreno I. B. Zerbini A. N. Danilewicz D. de Oliveira Santos M. C. Simões-Lopes P. C . (2005). Distribution and habitat characteristics of dolphins of the genus Stenella (Cetacea: Delphinidae) in the southwest Atlantic Ocean. Mar. Ecol. Prog. Ser.300, 229–240. doi: 10.3354/meps300229
68
Mouton T. L. Stephenson F. Torres L. G. Rayment W. Brough T. McLean M. et al . (2022). Spatial mismatch in diversity facets reveals contrasting protection for New Zealand’s cetacean biodiversity. Biol. Conserv.267, 109484. doi: 10.1016/j.biocon.2022.109484
69
Mustika P. (2006). Marine mammals in the Savu Sea (Indonesia): Indigenous knowledge, threat analysis and management options (Townsville: James Cook University). doi: 10.25903/qxya-t904
70
Mustika P. (2011). Towards sustainable dolphin watching tourism in Lovina, Bali, Indonesia (Townsville: James Cook University). doi: 10.25903/qf1k-bg09
71
Mustika P. L. K. Sadili D. Sunuddin A. Kreb D. Sarmintohadi R. I. Suprapti D. et al . (2015). Rencana aksi nasional (RAN) konservasi cetacea Indonesia 2016-2020 (the cetacean national plan of action (NPOA) for Indonesia 2016-2020) (Jakarta: Direktorat Konservasi dan Keanekaragaman Hayati Laut, Ditjen Pengelolaan Ruang Laut, Kementerian Kelautan dan Perikanan Indonesia).
72
Mustika P. L. K. High K. K. Putra M. I. H. Sahri A. Ratha I. M. J. Prinanda M. O. et al . (2022). When and where did they strand? The spatio-temporal hotspot patterns of cetacean stranding events in Indonesia. Ocean3, 509–526. doi: 10.3390/oceans3040034
73
Mustika P. Wonneberger E. Erzini K. Pasisingi N. (2021). Marine megafauna bycatch in artisanal fisheries in Gorontalo, northern Sulawesi (Indonesia): An assessment based on fisher interviews. Ocean Coast. Manage.208, 105606. doi: 10.1016/j.ocecoaman.2021.105606
74
NASA Ocean Biology Processing Group (2018). In moderate-resolution imaging spectroradiometer (MODIS) aqua level-3 mapped remote-sensing reflectance (Greenbelt, MD, USA: NASA OB.DAAC).
75
Nugraha A . (2021). Legal analysis of current Indonesia's marine protected areas development. Sriwijaya Law Review, 5(1), 14–28. doi: 10.28946/slrev.Vol5.Iss1.851.pp14-28
76
Oksanen J. Simpson G. Blanchet F. Kindt R. Legendre P. Minchin P. et al . (2025). Vegan: community ecology package, s.l.: R package version 2.8-0. Available online at: https://github.com/vegandevs/vegan.
77
Ord J. Getis A. (1995). Local spatial autocorrelation statistics: distributional issues and an application. Geographical Anal.27, 286–306. doi: 10.1111/j.1538-4632.1995.tb00912.x
78
Pace D. S. Giacomini G. Campana I. Paraboschi M. Pellegrino G. Silvestri M. et al . (2019). An integrated approach for cetacean knowledge and conservation in the central Mediterranean Sea using research and social media data sources. Aquat. Conservation: Mar. Freshw. Ecosyst.29, 1302–1323. doi: 10.1002/aqc.3117
79
Paiu R. M. Cañadas A. Dede A. Meshkova G. Murariu D. Amaha Ozturk A. et al . (2024). Density and abundance estimates of cetaceans in the Black Sea through aerial surveys (ASI/CeNoBS). Front. Mar. Sci.11, 1248950. doi: 10.3389/fmars.2024.1248950
80
Panigada S. Donovan G. P. Druon J. N. Lauriano G. Pierantonio N. Pirotta E. et al . (2017). Satellite tagging of Mediterranean fin whales: working towards the identification of critical habitats and the focussing of mitigation measures. Sci. Rep.7, 3365. doi: 10.1038/s41598-017-03560-9
81
Pennino M. G. Arcangeli A. Prado Fonseca V. Campana I. Pierce G. J. Rotta A. et al . (2017). A spatially explicit risk assessment approach: Cetaceans and marine traffic in the Pelagos Sanctuary (Mediterranean Sea). PloS One12, e0179686. doi: 10.1371/journal.pone.0179686
82
Puspasari R. Rahmawati P. Prianto E. (2021). The effect of ENSO (El Nino Southern Oscillation) phenomenon on fishing season of small pelagic fishes in Indonesia waters. IOP Conf. Series: Earth Environ. Sci.934, 12018. doi: 10.1088/1755-1315/934/1/012018
83
Putra M. I. H. Malaiholo Y. Sahri A. Setyawan E. Herandarudewi S. M. Hasan A. W. et al . (2025). Insights into cetacean sightings, abundance, and feeding associations: observations from the boat lift net fishery in the Kaimana important marine mammal area, Indonesia. Front. Mar. Sci.11, 1431209. doi: 10.3389/fmars.2024.1431209
84
Quang P. X. Lanctot R. B . (1991). A line transect model for aerial surveys. Biometrics, 1089–1102. doi: 10.2307/2532661
85
Putra M. Mustika P. (2021). Maximum entropy model: Estimating the relative suitability of cetacean habitat in the northern Savu Sea, Indonesia. Mar. Mammal Sci.37, 6–28. doi: 10.1111/mms.12719
86
Ramírez-León M. R. García-Aguilar M. C. Romo-Curiel A. E. Ramírez-Mendoza Z. Fajardo-Yamamoto A . (2021). Habitat suitability of cetaceans in the Gulf of Mexico using an ecological niche modeling approach. PeerJ9, e10834. doi: 10.7717/peerj.10834
87
Read A. (2008). The looming crisis: interactions between marine mammals and fisheries. J. Mammalogy89, 541–548. doi: 10.1644/07-MAMM-S-315R1.1
88
Read A. (2018). “ Biotelemetry,” in Encyclopedia of marine mammals, 3rd edn. Eds. WürsigB.ThewissenJ.KovacsK. ( Academic Press, San Diego), 103–106.
89
Reeves R. McClellan K. Werner T. (2013). Marine mammal bycatch in gillnet and other entangling net fisheries 1990 to 2011. Endangered Species Res.20, 71–97. doi: 10.3354/esr00481
90
Roberts J. J. Best B. D. Mannocci L. Fujioka E. I. Halpin P. N. Palka D. L. et al . (2016). Habitat-based cetacean density models for the U.S. Atlantic and Gulf of Mexico. Sci. Rep.6, 22615. doi: 10.1038/srep22615
91
Rockwood R. Adams J. Silber G. Jahncke J. (2020). Estimating effectiveness of speed reduction measures for decreasing whale-strike mortality in a high-risk region. Endangered Species Res.43, 145–166. doi: 10.3354/esr01056
92
Sahri A. Mustika P. L. K. Purwanto P. Murk A. J. Scheidat M . (2020b). Using cost-effective surveys from platforms of opportunity to assess cetacean occurrence patterns for marine park management in the heart of the Coral Triangle. Front. Mar. Sci.7, 569936. doi: 10.3389/fmars.2020.569936
93
Sahri A. Putra M. I. H. Mustika P. L. K. Kreb D. Murk A. J . (2021). Cetacean habitat modelling to inform conservation management, marine spatial planning, and as a basis for anthropogenic threat mitigation in Indonesia. Ocean Coast. Manage.205, 105555. doi: 10.1016/j.ocecoaman.2021.105555
94
Sahri A. Mustika P. Dewanto H. Murk A. (2020a). A critical review of marine mammal governance and protection in Indonesia. Mar. Policy117, 103893. doi: 10.1016/j.marpol.2020.103893
95
Sequeira A. M. Rodríguez J. P. Marley S. A. Calich H. J. van der Mheen M. VanCompernolle M. et al . (2025). Global tracking of marine megafauna space use reveals how to achieve conservation targets. Science388, 1086–1097. doi: 10.1126/science.adl0239
96
Sheehy J. M. Taylor N. L. Zwerschke N. Collar M. Morgan and Merayo V. E . (2022). Review of evaluation and valuation methods for cetacean regulation and maintenance ecosystem services with the joint cetacean protocol data. Front. Mar. Sci.9, 872679. doi: 10.3389/fmars.2022.872679
97
Sivasubramaniam K. (1964). Predation of tuna longline catches in the Indian Ocean, by killer-whales and sharks. Bull. Fish. Res. Station Ceylon17, 221–236. Available online at: http://hdl.handle.net/1834/32494.
98
Soede L. Natasasmita D. Mahendra I. G. Rizki (2019). “ Marine mammals interactions with tuna fishing activities in Indonesian seas,” in IOP Conference Series: Earth and Environmental Science, Vol. 399. doi: 10.1088/1755-1315/399/1/012128
99
Stephenson F. Hewitt J. E. Torres L. G. Mouton T. L. Brough T. Goetz K. T. et al . (2021). Cetacean conservation planning in a global diversity hotspot: dealing with uncertainty and data deficiencies. Ecosphere12, e03633. doi: 10.1002/ecs2.3633
100
Susanto R. D. Gordon A. L. Zheng Q. (2001). Upwelling along the coasts of Java and Sumatra and its relation to ENSO. Geophys. Res. Lett.28, 1599–1602. doi: 10.1029/2000GL011844
101
Thomas L. Williams R. Sandilands D. (2007). Designing line transect surveys for complex survey regions. J. Cetacean Res. Manage.9, 1–13. doi: 10.47536/jcrm.v9i1.687
102
UN Environment (2017). Upwelling zone of the sumatra-java coast (Canada: CBD Secretariat).
103
Valdivia M. Valenzuela L. O. Berriel V. Rodríguez D. Laporta P. Drago M. et al . (2024). Resource partitioning in a cetacean community from Uruguayan waters. Mar. Mammal Sci.40, e13077. doi: 10.1111/mms.13077
104
Virgili A. Teillard V. Dorémus G. Dunn T. E. Laran S. Lewis M. et al . (2022). Deep ocean drivers better explain habitat preferences of sperm whales Physeter macrocephalus than beaked whales in the Bay of Biscay. Sci. Rep.12, 9620. doi: 10.1038/s41598-022-13546-x
105
Waring G. Josephson E. Maze-Foley K. Rosel P. (2013). U.S. Atlantic and gulf of Mexico marine mammal stock assessment (Massachusetts: National Marine Fisheries Service, Woods Hole). NOAA Technical Memorandum NMFS-NE-223.
106
Weir C. Pierce G. (2013). A review of the human activities impacting cetaceans in the eastern tropical Atlantic. Mammal Rev.43, 258–274. doi: 10.1111/j.1365-2907.2012.00222.x
107
Wickham H. (2016). “ Data analysis,” in ggplot2. Use R! ( Springer-Verlag, New York). doi: 10.1007/978-3-319-24277-4_9
108
Wild L. A. Riley H. E. Pearson H. C. Gabriele C. M. Neilson J. L. Szabo A. et al . (2023). Biologically Important Areas II for cetaceans within US and adjacent waters–Gulf of Alaska Region. Front. Mar. Sci.10, 1134085. doi: 10.3389/fmars.2023.1134085
109
Wilke C. (2024). ggridges: Ridgeline Plots in ‘ggplot2’, s.l.: R package version 0.5.6.
110
Williams R. Ashe E. O’Hara P. (2011). Marine mammals and debris in coastal waters of British Columbia, Canada. Mar. pollut. Bull.62, 1303–1316. doi: 10.1016/j.marpolbul.2011.02.029
111
Whitworth A. Pinto C. Ortiz J. Flatt E. Silman M (2022). Flight speed and time of day heavily influence rainforest canopy wildlife counts from drone-mounted thermal camera surveys. Biodiversity and Conservation, 31(13), 3179–3195. doi: 10.1007/s10531-022-02483-w
112
Zantis L. Carroll E. Nelms S. Bosker T. (2021). Marine mammals and microplastics: A systematic review and call for standardisation. Environ. pollut.269, 116142. doi: 10.1016/j.envpol.2020.116142
Summary
Keywords
aerial transect survey, cetacean, abundance, ecological niche, Southeastern Tropical Indian Ocean
Citation
Putra MIH, Hasan AW, Prasetio H, Syakurachman I, Wibisono E, Kalther J, Lestari AP, Prasetia R, Herdiana Y, Sahri A, Herandarudewi SMC, Prasetiamartati B, Irmadhiany M, Rodrigue M, Torres-Florez JP and Nikijuluw V (2026) From the air to the ocean: revealing cetacean assemblages in the Southeastern Indian Ocean. Front. Mar. Sci. 12:1687272. doi: 10.3389/fmars.2025.1687272
Received
17 August 2025
Revised
21 November 2025
Accepted
01 December 2025
Published
02 January 2026
Volume
12 - 2025
Edited by
Xuelei Zhang, Ministry of Natural Resources, China
Reviewed by
Kartik Shanker, Indian Institute of Science (IISc), India
Abhijeet Purkayastha, Osaka University, Japan
Updates
Copyright
© 2026 Putra, Hasan, Prasetio, Syakurachman, Wibisono, Kalther, Lestari, Prasetia, Herdiana, Sahri, Herandarudewi, Prasetiamartati, Irmadhiany, Rodrigue, Torres-Florez and Nikijuluw.
This is an open-access article distributed under the terms of the Creative Commons Attribution License (CC BY). The use, distribution or reproduction in other forums is permitted, provided the original author(s) and the copyright owner(s) are credited and that the original publication in this journal is cited, in accordance with accepted academic practice. No use, distribution or reproduction is permitted which does not comply with these terms.
*Correspondence: Mochamad Iqbal Herwata Putra, iqbalherwata@gmail.com
Disclaimer
All claims expressed in this article are solely those of the authors and do not necessarily represent those of their affiliated organizations, or those of the publisher, the editors and the reviewers. Any product that may be evaluated in this article or claim that may be made by its manufacturer is not guaranteed or endorsed by the publisher.