Abstract
The development of marine fisheries is critical to China’s food security and national livelihoods, although many fishermen face limited income growth due to resource and operational constraints. Smart fishery technologies have the potential to transform production and increase fishermen’s income, yet their socio-economic impacts remain underexplored. Using panel data from China’s marine fisheries (2011–2023), this paper empirically examines the impact of fishery intelligence on fishermen’s income. The results show that fishery intelligence significantly increases income by promoting technological progress, improving talent quality, and enhancing ecological conditions. This positive effect is stronger in regions with higher levels of regional fisheries innovation. Heterogeneity analysis indicates that income growth is significant in southern regions, large-scale fisheries, and areas with high trade volumes, while it is insignificant in northern regions, small-scale operations, and areas with low trade volumes. These findings suggest that policymakers should prioritize smart fishery adoption, invest in training programs to enhance fishermen’s skills, support ecological management, and implement region-specific interventions to promote high-quality development in marine fisheries.
1 Introduction
In 2023, China’s total fishery production reached 71.16 million tons, with a total economic value of 3.27 trillion yuan (Food and Agriculture Organization of the United Nations, 2024), making it the world’s largest producer of fishery products. The fishery industry not only ensures national food security but also drives the economic development of coastal regions and provides a livelihood for millions of fishermen. Traditional fisheries have long been plagued by issues such as overcapacity, resource depletion, and low efficiency, which have constrained fishermen’s income growth and threatened the long-term development of the fisheries sector. The Chinese government has designated fisheries modernization as a national strategic priority. The “14th Five-Year National Fisheries Development Plan” (2021–2025) emphasizes the role of scientific and technological innovation in enhancing fisheries efficiency. The “Digital Agriculture and Rural Development Plan (2019–2025)” states that integrating Internet of Things (IoT), big data technology, and artificial intelligence into fisheries production, operations, and management is crucial for optimizing resource allocation and driving further fisheries development (Yu et al., 2021).
Under this policy framework, emerging smart fisheries are regarded as the primary strategic direction for the future development of the fisheries sector. The application of intelligent production technologies in aquaculture and capture fisheries is becoming increasingly widespread, as it can enhance fisheries production efficiency, optimize resource allocation, and reduce ecological risks. Advances in the automation and intelligence of capture operations include artificial intelligence feeding systems, IoT-based water quality monitoring, and disease prediction based on multi-source big data (Chang et al., 2021; Kaur et al., 2023; Tina et al., 2025). Intelligence helps simplify logistics, enhance information flow, promote innovation, and improve the resilience and competitiveness of the fisheries economy (Jiang et al., 2024; Xia et al., 2025).
As research progresses, there remain significant gaps in the exploration of smart fisheries and fishermen’s livelihoods. Existing studies have not conducted a comprehensive assessment of the current state of smart fisheries development, particularly in terms of indicator construction and spatio-temporal changes, making it difficult to grasp the overall development process of smart fisheries. While existing studies have focused on the contribution of smart fisheries to the fisheries economy and the digital economy, they lack a detailed examination of the direct impact of smart fisheries on fishermen’s incomes and the underlying mechanisms. The background factors influencing the relationship between smart fisheries and fishermen’s livelihoods have received limited attention. Existing studies have not examined whether regional innovation can moderate this relationship, and regional heterogeneity deserves more attention. To address these shortcomings, this paper analyzes the direct impact of smart fisheries on fishermen’s income from a theoretical perspective, conducts empirical tests using provincial panel data from 2011 to 2023 to examine the moderating role of regional innovation levels, and finally conducts heterogeneity analysis combining regional characteristics, fishery scale, and fishery distribution.
This paper makes the following contributions: First, in response to the lack of quantitative evaluation of the level of fishery intelligence in previous studies, I develop fishery digital infrastructure, fishery technology application, and factor input as an indicator system to quantify the level of fishery intelligence. The TOPSIS–entropy method is used to quantitatively and digitally measure the development process of smart fishery, so as to provide a reference measure and basis for the future assessment of smart fishery level. Second, this paper studies the influence mechanism between smart fishery and fishermen’s income. This paper makes an empirical test from the three dimensions of technological development, human capital quality, and ecological environment, reveals its internal logic, and provides a theoretical basis for improving the modernization level of China’s marine fishery and the livelihood level of fishermen. Third, in view of the lack of consideration of the moderating effect in the literature, this paper introduces the regional innovation level and examines the moderating effect of regional fisheries innovation capacity on the relationship between smart fishery and fishermen’s income, which provides new ideas for how smart fishery can improve efficiency and achieve sustainable development and has policy implications for promoting inclusive growth in coastal areas.
2 Literature review and hypothesis formulation
The global fisheries sector is facing multiple pressures, including declining resources, increasing environmental stress, and rising concerns about food security, prompting the industry to search for new pathways toward sustainability and improved efficiency (FAO, 2022). Against this backdrop, smart fisheries—representing the integration of digital technologies with the marine economy—have emerged as a promising direction for enhancing production efficiency and ecological performance (Li P. et al., 2025). Although policymakers and industry stakeholders have shown growing interest in smart fisheries, empirical evidence on how these technologies improve economic outcomes remains limited. Existing studies often focus on individual technologies or isolated agricultural and aquaculture cases, lacking a comprehensive and context-specific analysis (Adebayo et al., 2025). To fill this gap, this study investigates how smart fisheries influence economic efficiency and under what conditions their effects become stronger or weaker. The results contribute to a deeper understanding of digital transformation in the marine sector and offer practical guidance for formulating policies that promote sustainable and inclusive development in fisheries.
2.1 H1: Smart fishery enhances fishermen’s income
China’s fisheries sector is characterized by dispersed production, small-scale operations, and relatively low efficiency. The emergence of smart fisheries has brought new opportunities for modernization to this traditional industry. As digital tools and infrastructure extend into the fisheries sector, technologies such as the Internet of Things (IoT) and artificial intelligence (AI) are increasingly integrated into production and daily operations. These tools improve the collection, sharing, and utilization of information, while supporting the entire value chain from aquaculture, processing, to sales, helping to address long-standing issues of low production efficiency and dispersed operations (Guo, 2010; Barboza et al., 2024; Benard et al., 2018; Chen and Gao, 2023).
Smart production technologies directly increase fishermen’s incomes. IoT sensors, AI, automation, and other tools facilitate water quality monitoring, feeding management, and efficient resource allocation. Research shows that such systems can increase yields and reduce costs. For example, IoT-based water quality monitoring helps stabilize yields in small-scale aquaculture farms, while precision aquaculture reduces waste, improves feed efficiency, and prevents disease outbreaks, all of which increase profits (Ramanathan et al., 2023; Nayoun et al., 2024; Tsai et al., 2022). The application of AI in fishing vessel operations, input management, and disease prediction further enhances real-time monitoring, reduces risks, and supports higher incomes (Cheng et al., 2023; Lloyd Chrispin et al., 2020; Kilinc et al., 2025; Nagajothi, 2023).
Smart fisheries also drive income growth by improving market access and sales conditions. Since the outbreak of the COVID-19 pandemic, digital platforms have become particularly important, helping small-scale producers connect more directly with consumers (Zhang, 2024; Qalati et al., 2021). These platforms reduce reliance on intermediaries, enhance price transparency, and make logistics faster and more reliable (Li et al., 2023). By narrowing information gaps and reducing unfair pricing, they help fishermen obtain better returns for their products and open up more sustainable pathways to increased income.
2.2 Impact pathways
The impact of smart fisheries on fishermen’s incomes can be understood through three main channels: technological progress, improvements in human capital, and enhancements in ecological conditions. This paper examines the mechanisms through which smart fisheries influence fishermen’s incomes from these three perspectives (Figure 1).
Figure 1
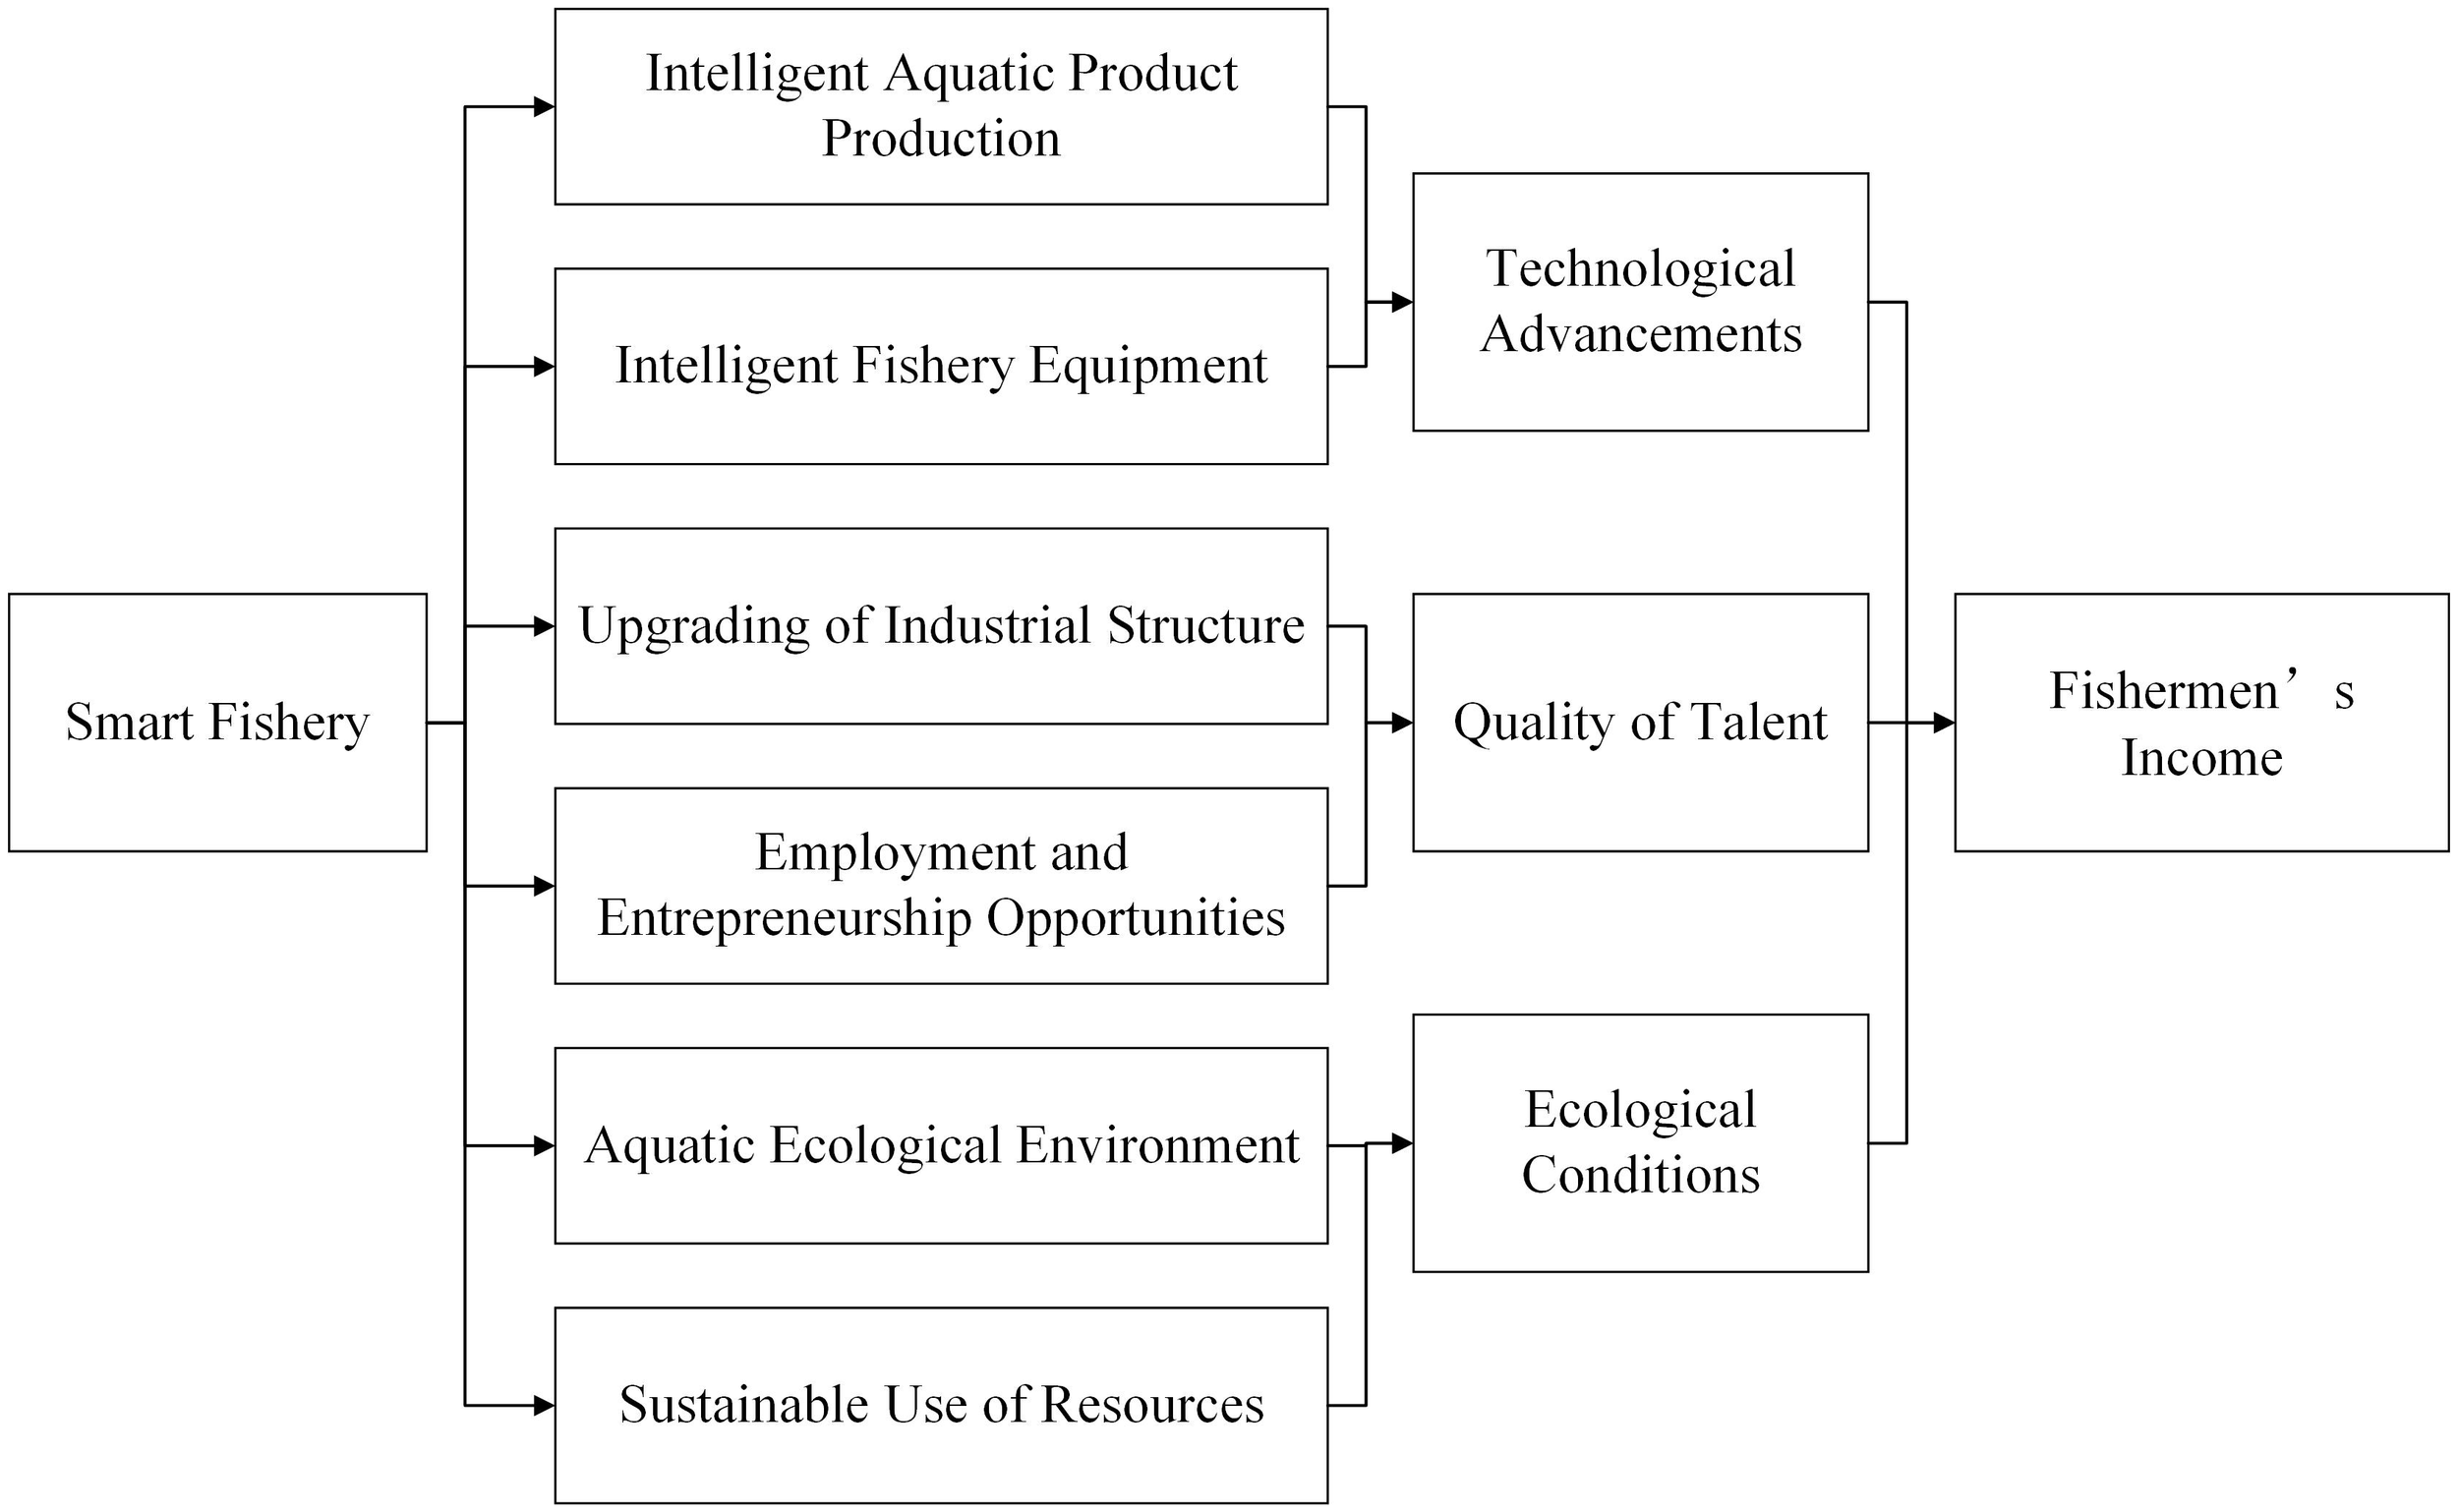
The influence path of smart fishery on fishermen’s income.
2.2.1 H2a: smart fishery enhances fishermen’s income by driving technological progress
Smart fishery can increase fishermen’s income by improving production accuracy and efficiency. Technologies such as IoT sensors, satellite remote sensing, and AI-based predictive models can accurately monitor and manage water quality, temperature, feed intake, and fish population distribution (Li L. et al., 2025; Li P. et al., 2025; Fernandes and Dmello, 2025). This precise management not only reduces feed waste and environmental pollution but also lowers the risk of disease outbreaks, thereby improving aquaculture output and product quality (Nagothu et al., 2025; Mandal and Ghosh, 2024). Big data analysis can predict optimal harvest times and market demand, helping fishermen avoid low-price periods, achieve higher profit margins, and reduce seasonal fluctuations in production, thus stabilizing income sources. Digital management systems enable small-scale fishermen to achieve production control capabilities comparable to those of large aquaculture enterprises, narrowing efficiency gaps and enhancing the market competitiveness of vulnerable groups (Anthon et al., 2024).
The adoption of smart fishing equipment can also contribute to higher income. High-performance fishing vessels, automated fishing systems, sonar-based fish-finding equipment, and unmanned vessels significantly improve fishing efficiency while meeting sustainable marine capture requirements, thereby enhancing economic returns (Landge et al., 2025). Intelligent onboard processing systems enable real-time cutting, grading, and sorting of catches, accelerating post-harvest processing workflows, ensuring high-quality, safe, and efficient production of fish products, and increasing the profitability of processing operators (Fu et al., 2024). Cold-chain logistics extend the shelf life of seafood products, enabling fishermen to access distant markets and obtain price premiums (Zhang et al., 2024), while also supporting the development of distant-water fisheries. Intelligent equipment reduces reliance on manual labor and shortens operational cycles, allowing fishermen to allocate more time to value-added activities such as brand building and market expansion, thereby optimizing income structures. Improvements in harvesting and processing efficiency also reduce economic losses caused by spoilage, enhancing the sustainability of fishermen’s livelihoods.
2.2.2 H2b: smart fishery enhances fishermen’s income through improving human capital
The upgrading of the fishing industry and the widespread adoption of smart tools have significantly improved fishermen’s skills. An increasing number of companies are adopting smart aquaculture systems, automated fishing equipment, and data-driven analytical tools. These technologies help address long-standing issues of information fragmentation and inefficiency, making aquaculture more cost-effective, productive, and profitable (Wang et al., 2021a, b; Gu, 2022). As fishermen learn to use these new tools, their work efficiency and organization improve, directly leading to income growth. Smart fisheries are opening up new employment and business opportunities. With the emergence of new monitoring tools and digital platforms, new job roles such as fisheries monitoring, illegal fishing control, and market information services have emerged, enabling fishermen to earn income beyond traditional fishing (Willette et al., 2023). Smart fisheries also integrate upstream and downstream segments of the value chain, including processing, brand building, and online sales, which require higher skills but offer greater rewards (Li et al., 2022). By creating more diverse income sources, smart fisheries not only increase fishermen’s incomes but also enhance their livelihood security and resilience.
2.2.3 H2c: smart fishery promotes income growth through ecological improvements
As the aquatic environment improves, fishermen’s income tends to rise as well. Advanced smart-fishery tools—such as online water quality monitoring, smart aeration, and automatic feeding—allow fishermen to track key indicators like dissolved oxygen, pH, ammonia nitrogen, and temperature in real time. With these data, the system can adjust the farming environment instantly, lowering the risk of water deterioration and disease outbreaks and making the ecosystem more stable and resilient (Lin et al., 2023; Wang et al., 2021a).
A healthier ecosystem does not translate into higher income overnight; rather, it works through several intermediate steps. First, better water quality reduces the incidence of fish diseases, lowers mortality, and creates more favorable growing conditions. This helps fishermen cut back on disease-control expenses and other emergency inputs. Second, healthier fish typically have better texture, appearance, and safety, allowing them to reach higher market grades and command better prices. As production becomes more stable and product quality improves, fishermen naturally earn more from each production cycle.
In addition, smart fisheries increase income by promoting more sustainable use of fishery resources. Smart fishing gear and satellite remote sensing help fishermen locate fish stocks more accurately, control catch volumes, and avoid harvesting juveniles or non-target species (Abangan et al., 2023; Tian et al., 2022). Likewise, integrating traditional aquaculture with closed or recirculating systems reduces dependence on natural water bodies and encourages more responsible resource use (Rajesh et al., 2023). A sustainable approach also supports more stable long-term income. Once a resource is overfished, ecosystems tend to deteriorate and yields can drop sharply. By preventing such collapses, smart fisheries help protect fishermen from severe and painful economic losses.
2.3 H3: The contribution of smart fishery to income growth is greater in regions with higher innovation capacity
In regions with strong innovation capacity, local scientific research teams, enterprises and government departments tend to invest more resources in the research and development, pilot and commercial promotion of smart fishery technology (Fu et al., 2022), which speeds up the introduction of advanced technology into fishery production. It also lowers the threshold for fishermen to understand, accept and effectively use new technologies (Ding and Du, 2024). For fishermen with high income, they have stronger financial bearing capacity and learning and absorption capacity, and are more qualified to invest in equipment, model innovation and market development. On the one hand, low-income fishermen are faced with more prominent financial constraints and financing difficulties, and it is difficult to bear the upfront investment costs of smart fishery related equipment, systems and training, and the risk tolerance of new technologies is also weak. On the other hand, their digital skills, education level and market bargaining power are relatively limited, and even if there are relatively complete research institutions and technical service systems in the region, they may not be able to fully connect, absorb and utilize these innovative resources due to information asymmetry, insufficient capacity or limited time and energy. At the same time, regions with a higher level of regional innovation usually have more perfect industrial support, more flexible market mechanism and richer value-added links such as brands, e-commerce and cold chain (Moreau and Garaway, 2021), which form a synergistic effect with the technological upgrading of smart fishery. It makes it easier for industries to upgrade towards specialization, greening and high value added. Fishermen not only benefit from yield and quality improvement, but also earn higher profits by participating in branding, deep processing and online sales. It can be seen that the more perfect the innovation ecology is, especially for the group with higher income, the greater the value created by smart fishery in the whole industrial chain is, and the stronger its positive impact on fishermen’s income is.
3 Models and variables
3.1 Methodologies and models
3.1.1 Benchmark model and mediating effect model
To provide an intuitive assessment of the impact of smart fisheries on fishermen’s income, this study first establishes the following baseline model (Equation 1).
Where, i and t denote province and year, respectively; Income represents fishermen’s income; Inti,t captures the level of smart fishery development; Controlj refers to the j-th control variable; μi and vt denote region and time fixed effects, respectively; and ϵi,t represents the random error term.
To further explore the mechanisms through which smart fisheries affect fishermen’s income, we extend the baseline framework and construct a set of mechanism testing models (Equations 2-4).
Where, Teci,t indicates technological progress in fisheries, Tali,t reflects the quality of fishery-related human capital, and Envi,t measures the local ecological conditions. The remaining components of the models are consistent with Equation 1.
3.1.2 Moderating effect model
To investigate the moderating role of regional fisheries innovation capacity in the relationship between smart fisheries and fishermen’s income, we introduce an interaction term and specify the following moderation model (Equation 5).
Where Inni,t denotes the level of regional innovation, with other variables defined as in Equation 1.
3.2 Variable selection and data description
3.2.1 Fishermen’s income
In this study, the variable for fishermen’s income is measured as the per capita net income of fishermen, with price effects excluded and then log-transformed (Income). The data are sourced from the China Fishery Statistical Yearbook.
3.2.2 Smart fishery
The level of smart fishery is used to assess the overall progress of a region in terms of fisheries modernization and intelligence (Li et al., 2025). This study constructs an evaluation system based on three core dimensions: infrastructure, technology application, and production factor input, comprising 15 specific indicators (Table 1). The infrastructure dimension primarily reflects the hardware and basic conditions of smart fisheries, including internet penetration rate, per capita telecommunications service volume, number of fisheries-related websites, and optical cable length. The technology application dimension emphasizes the practical application of intelligent technologies in fisheries production, operations, and management, such as the number of promotion institutions, fisheries e-commerce sales, fisheries hotline services, and aquatic product processing capacity. The production factor input dimension focuses on the input of various production resources, including the proportion of fisheries science and technology promotion funds and the number of skilled personnel. To determine the weights of each indicator, this study used the Topsis entropy weight method to calculate the comprehensive scores for each province, thereby quantitatively assessing the smart fisheries level of each region.
Table 1
| First-level indicators | Secondary indicators | Unit |
|---|---|---|
| Smart Fishery Infrastructure | Internet penetration rate | % |
| Length of long-distance optical cable lines | 10000 km | |
| Per capita telecommunication service volume | 100 million yuan | |
| Number of fishery-related websites | 10000 sites | |
| Smart Fishery Technology Application | Number of fishery technology extension institutions | Units |
| Fishery e-commerce sales | 100 million yuan | |
| Aquatic product processing capacity of enterprises | Tons/year | |
| Factory-based aquaculture/total aquaculture output | % | |
| Power of marine fishing vessels | Kilowatts | |
| Fishery hotline lines per number of fishermen | Lines per 10000 people | |
| Smart Fishery Factor Input | Fishery technology extension demonstration bases | Hectares |
| Number of fishery technology extension personnel | 10000 persons | |
| Fishery technology extension funding | 10000 yuan |
Selection of smart fishery indicators.
The level of smart fishery is used to assess the overall progress of a region in terms of fisheries modernization and intelligence (Li et al., 2025). For instance, the OECD report on agricultural digitalization emphasizes connectivity and the use of digital devices, while the recent research on the digital transformation of the fishing industry highlights that infrastructure implementation, technological implementation, and talent development are key components of intelligent development (Ji and Li, 2024). Based on this, the smart fishery indicator system constructed in this study is based on a three-dimensional framework of “infrastructure - technology application - factor input” (Table 1), having a clear logical basis and practical relevance. Internet penetration rate, optical cable length, and telecommunications business volume can reflect digital networks and communication conditions, which are the basis for the access of artificial intelligence, IoT devices, and data transmission; the number of fishery websites, although not directly measuring the level of intelligence, can reflect the supply of regional fishery information services and the status of digital ecological construction. In terms of technology application, indicators such as factory farming output, fishing vessel power, aquatic product processing capacity, and e-commerce sales are widely used to measure the level of fishery digitalization, and are directly related to the popularization of intelligent equipment use, automated processing, and digital transactions; technology promotion institutions and hotline services can also reflect the maturity of technology dissemination and service mechanisms. At the factor input level, demonstration bases, scientific researchers, and funds are the core indicators for measuring the supporting capacity of intelligent development, which are highly consistent with the domestic agricultural digitalization and smart fishery measurement systems. Overall, this indicator system can comprehensively reflect the level of regional smart fishery from three aspects: basic conditions, technology implementation, and investment guarantee. Its validity has sufficient theoretical basis and empirical research support.
This method has been widely applied in the evaluation of the digital economy and agricultural modernization. In terms of measurement methods, this study employs the entropy weight TOPSIS method to evaluate this indicator. The entropy method provides objective weights based on the information contribution of each indicator, avoiding the subjectivity of weight selection compared to other methods. This method has been widely applied in the evaluation of the digital economy and agricultural modernization. At the same time, the TOPSIS method compares each region with the ideal reference point and the negative reference point, generating an intuitive comprehensive development score. The entropy method provides objective weights based on the information contribution of each indicator, avoiding the subjectivity of weight selection compared to other methods. At the same time, the TOPSIS method compares each region with the ideal reference point and the negative reference point, generating an intuitive comprehensive development score. This combined method is highly suitable for analyzing complex multi-dimensional systems such as intelligent aquaculture, ensuring that the assessment reflects the true differences between various regions while maintaining robustness and interpretability. This combined method is highly suitable for analyzing complex multi-dimensional systems such as intelligent aquaculture, ensuring that the assessment reflects the true differences between various regions while maintaining robustness and interpretability.
3.2.3 Control variables
Based on data availability and previous studies, the following control variables were included: fishery industry scale, aquaculture yield per unit, dependence on fishery trade (Xilin et al., 2022), aquatic product circulation (Su and Huang, 2023), human capital level (Fan et al., 2021), and industrial structure. The fishery GDP (log-transformed) was used to measure the scale of the fishery industry (GDP). Aquaculture yield per unit was calculated as the ratio of aquaculture output to fishing vessel power (AC). Dependence on fishery trade (TD) was measured as the ratio of fishery import and export values to fishery GDP. Aquatic product circulation (AP) was proxied by the log-transformed value of aquatic product trade and distribution. The level of human capital (CAP) is measured by the proportion of employees with a bachelor’s degree or above. Industrial structure (INS) was assessed using the ratio of secondary industry output to tertiary industry output.
3.2.4 Mediating and moderating variables
In this study, regional fisheries innovation capacity (Inn) is treated as a moderating variable. Considering data availability, the number of fisheries-related patents, transformed by a natural logarithm, is used as the measurement indicator, with higher values indicating stronger regional innovation capability. Additionally, technological progress (Tec), human capital quality (Tal), and ecological conditions (Env) are introduced as mediating variables. Specifically, Tec is measured by the logarithm of demonstrated key technologies, Tal is measured by the logarithm of employees with a bachelor’s degree or higher, and Env is measured by the logarithm of pollutant emissions, including nitrogen, phosphorus, and chemical oxygen demand (COD). Descriptive statistics of the variables are presented in Table 2.
Table 2
| Variable | Observations | Mean | Std. dev. | Min | Max |
|---|---|---|---|---|---|
| Income | 143 | 9.8848 | 0.3101 | 9.1248 | 10.4217 |
| Int | 143 | 0.1947 | 0.0782 | 0.0593 | 0.5524 |
| GDP | 143 | 15.3359 | 1.2521 | 10.5084 | 16.7702 |
| AC | 143 | 2.5909 | 1.7199 | 0.4128 | 7.8909 |
| TD | 143 | 0.0853 | 0.1746 | 0.0027 | 1.1825 |
| AP | 143 | 13.1583 | 3.0323 | 3.4012 | 16.6695 |
| CAP | 143 | 0.0025 | 0.0052 | 0.0001 | 0.0300 |
| INS | 143 | 0.8077 | 0.2550 | 0.3095 | 1.3270 |
| Tec | 143 | 4.6708 | 1.1195 | 1.6094 | 6.1841 |
| Tal | 143 | 5.8073 | 0.8824 | 3.4340 | 7.0984 |
| Env | 143 | 2.4085 | 0.1133 | 2.1661 | 2.5205 |
| Inn | 143 | 6.7358 | 1.5164 | 1.6450 | 8.6957 |
Descriptive statistics results.
3.3 Data sources
To investigate the impact of smart fisheries on fishermen’s income, this study utilizes panel data from China’s coastal provinces from 2011 to 2023. The data are sourced from the China Fisheries Statistical Yearbook, the China Statistical Yearbook, and the China Industrial Statistical Yearbook. Missing values in the dataset were addressed using linear interpolation.
4 Results
4.1 Baseline regression results
When estimating the parameters of Equation 1, this paper first adopts the two-way fixed effect model and the random effect model respectively, and compares the applicability of the two through the Hausman test. The test results show that the p-value is less than 0.05, rejecting the null hypothesis, so the two-way fixed effect model is more reasonable. Subsequently, this paper conducts Wald test and Lagrange multiplier (LM) test on the error term in the framework of fixed effects. Both tests reject the null hypothesis, indicating significant heteroscedasticity and serial correlation in the panel data. In view of the above error structure characteristics, if the default standard errors are continued, the t-statistics may be biased, thus affecting the validity of inference. In order to improve the robustness of the estimation results, this paper uniformly uses clustered robust standard errors at the province level in the final regression (Tables 3–7). This method allows the error term to have any form of heteroscedasticity and time-series correlation within the same province, while maintaining mutual independence between different provinces, and is a standard practice for dealing with the error structure of panel data. After the robust standard errors of provincial clustering are adopted, the significance test of model coefficients is more reliable, which can effectively avoid the false significance problem caused by small standard errors. The regression results shown in Tables 3–7 are presented based on this robust standard error, and relevant conclusions are also discussed on this basis.
Table 3
| Variables | (1) OLS | (2) OLS | (3) FE | (4) FE | (5) FE |
| Int | 1.545*** (0.307) |
0.681** (0.292) |
1.218*** (0.225) |
0.625** (0.266) |
1.112* (0.659) |
| Int2 | -0.755 (0.935) |
||||
| GDP | 0.096*** (0.035) |
-0.026 (0.031) |
-0.025 (0.031) |
||
| AC | 0.045*** (0.013) |
0.024** (0.010) |
0.022** (0.011) |
||
| TD | 0.114 (0.150) |
-0.048 (0.116) |
-0.052 (0.116) |
||
| AP | 0.006 (0.014) |
0.010 (0.011) |
0.007 (0.011) |
||
| CAP | 24.040*** (5.762) |
14.050*** (4.550) |
12.650** (4.876) |
||
| INS | -0.539*** (0.091) |
0.058 (0.091) |
0.054 (0.091) |
||
| Constant | 9.584*** (0.065) |
8.457*** (0.421) |
9.232*** (0.065) |
9.467*** (0.358) |
9.443*** (0.360) |
| Observations | 143 | 143 | 143 | 143 | 143 |
| R-squared | 0.152 | 0.462 | 0.687 | 0.726 | 0.727 |
Benchmark regression results.
Standard errors in parentheses.
*** p<0.01, ** p<0.05, * p<0.1.
Table 4
| Variables | IV1 | IV2 | ||
|---|---|---|---|---|
| (1) Int | (2) Income | (1) Int | (2) Income | |
| IV1 | 0.061*** (0.014) |
|||
| IV2 | 0.184*** (0.024) |
|||
| Int | 2.630*** (0.673) |
3.096*** (0.471) |
||
| Constant | -0.333* (0.190) |
9.272*** (0.415) |
0.139* (0.074) |
9.090*** (0.368) |
| Control | Y | Y | Y | Y |
| Observations | 132 | 132 | 132 | 132 |
| R2 | 0.679 | 0.641 | ||
| F | 19.955 | 24.641 | 59.130 | 20.037 |
| CD Wald F | 31.810 | 89.542 | ||
| SW S stat. | 28.332 | 37.838 | ||
Endogeneity tests results.
Standard errors in parentheses.
*** p<0.01, ** p<0.05, * p<0.1.
Table 5
| Variables | (1) Income | (2) Income | (3) Income | (4) Pro |
|---|---|---|---|---|
| L.Int | 0.725*** (0.273) |
|||
| Int | 0.636** (0.292) |
0.876** (0.403) |
0.960*** (0.340) |
|
| Constant | 9.554*** (0.344) |
9.217*** (0.344) |
9.448*** (0.468) |
2.065*** (0.458) |
| Control | Y | Y | Y | Y |
| Observations | 132 | 99 | 44 | 143 |
| R-squared | 0.683 | 0.747 | 0.676 | 0.752 |
| Fixed Effects | Y | Y | Y | Y |
Robust tests results.
Standard errors in parentheses.
*** p<0.01, ** p<0.05, * p<0.1.
Table 6
| Variables | (1) Income | (2) Tec | (3) Income | (4) Tal | (5) Income | (6) Env | (7) Income |
|---|---|---|---|---|---|---|---|
| Int | 0.625** (0.266) |
10.48*** (2.981) |
0.744*** (0.263) |
2.283*** (0.850) |
0.575** (0.263) |
-0.144*** (0.038) |
0.670** (0.265) |
| Tec | 0.0360*** (0.014) |
||||||
| Tal | 0.0590** (0.028) |
||||||
| Env | -1.691*** (0.599) |
||||||
| Constant | 9.467*** (0.358) |
4.667* (2.404) |
9.399*** (0.351) |
0.568 (1.171) |
9.529*** (0.355) |
1.271*** (0.052) |
11.94*** (0.836) |
| Control | Y | Y | Y | Y | Y | Y | Y |
| Fixed Effects | Y | Y | Y | Y | Y | Y | Y |
| Obs | 143 | 143 | 143 | 143 | 143 | 143 | 143 |
| R-squared | 0.726 | 0.296 | 0.741 | 0.602 | 0.735 | 0.953 | 0.722 |
Mechanism tests results.
Standard errors in parentheses.
*** p<0.01, ** p<0.05, * p<0.1.
Table 7
| Variables | (1) Income | (2) Income | (3) 0.1 | (4) 0.25 | (5) 0.5 | (6) 0.75 | (7) 0.9 |
|---|---|---|---|---|---|---|---|
| Int | 0.625** | 0.236 | 0.775*** | 0.0828 | -0.045 | 0.031 | 0.229 |
| (0.266) | (0.286) | (0.114) | (0.356) | (0.395) | (0.400) | (0.139) | |
| Int×Inn | 0.207*** | -0.0513 | 0.123 | 0.149 | 0.312*** | 0.322*** | |
| (0.067) | (0.027) | (0.083) | (0.093) | (0.094) | (0.033) | ||
| Constant | 9.467*** | 9.923*** | 8.398*** | 9.047*** | 10.010*** | 10.710*** | 10.800*** |
| (0.358) | (0.377) | (0.151) | (0.468) | (0.520) | (0.526) | (0.182) | |
| Control | Y | Y | Y | Y | Y | Y | Y |
| Fixed Effects | Y | Y | Y | Y | Y | Y | Y |
| Observations | 143 | 143 | 143 | 143 | 143 | 143 | 143 |
| R-squared | 0.726 | 0.746 | 0.625 | 0.573 | 0.539 | 0.503 | 0.514 |
Moderating effect test results.
Standard errors in parentheses.
*** p<0.01, ** p<0.05, * p<0.1.
As shown in Table 3, regardless of the two-way fixed effect model or OLS regression, the coefficient of Int is significantly positive at least at the level of 5%. This clearly demonstrates that smart fisheries contribute to increasing fishermen’s income, thereby supporting hypothesis H1. Enhancing the level of fisheries intelligence improves the efficiency of resource allocation in the industry, promotes fisheries modernization, increases aquaculture production, reduces input costs, and ultimately leads to a significant increase in fishermen’s income. To further explore the potential nonlinear effects of intelligence on sustainable fisheries development, the squared term of Int (Int2) was included in the regression, with results shown in column (5) of Table 3. The coefficient of Int2 is not statistically significant, indicating that the relationship between fisheries intelligence and fishermen’s income is generally linear. That is, the higher the level of fisheries intelligence, the more sustained and significant its promotional effect on fishermen’s income growth.
4.2 Endogeneity tests
To address the potential endogeneity issue caused by the reverse causality between smart fisheries and sustainable fishery development, this study adopted the analytical method proposed by Huang et al. (2019), and selected the number of fixed-line telephones per 100 people (Phone) and the number of post offices per million people (Post) as instrumental variables to measure smart fisheries. Regions with better communication infrastructure in the early stage are more likely to integrate digital tools into fishery production and management in the later stage, thereby shaping the current level of smart fishery development. These historical indicators can serve as effective alternative variables for local technological development, meeting the requirement of relevance. Moreover, historical data are unlikely to directly affect current fishermen’s income, satisfying the requirement of exogeneity. Given that single-year historical cross-sectional data are not suitable for use as panel instrumental variables that change over time, this study interacted telephones, postal services, and the local internet penetration rate of the previous year to construct the final instrumental variables (IV1, IV2), and re-examined the impact of smart fisheries on fishermen’s income using two-stage least squares (2SLS). The results are presented in Table 4.
As shown in Table 4, in the first stage, both instrumental variables had a significant positive effect on Int, satisfying the correlation condition. Additionally, the F statistic, Wald F statistic, and Hansen J statistic all indicated that the selected instrumental variables had high validity. After addressing the endogeneity issue using two-stage least squares (2SLS) in the second stage, the impact of smart fisheries on fishermen’s income remains significantly positive, consistent with the direction of the benchmark regression. These results indicate that even when considering potential endogeneity, the evidence supporting hypothesis H1 remains robust.
4.3 Robust tests
To ensure the robustness of the research conclusions, this study conducted multiple robustness tests, including using lagged values of the explanatory variables, performing segmented regression for the COVID-19 pandemic period, and replacing the measurement indicators of the explained variables. The results are shown in Table 5.
This study incorporated lagged terms of the explanatory variables in the regression analysis. As shown in Column (1) of Table 5, the impact of smart fisheries on fishermen’s income is positive and statistically significant at the 1% level, indicating the robustness of the baseline regression results. Considering the uncertainty caused by the COVID-19 pandemic, a split-sample method was used to estimate the benchmark model with 2020 as the cutoff point. The results are shown in columns (2) and (3) of Table 5. The results are shown in columns (2) and (3) of Table 5. The coefficients of smart fishery before and after the pandemic are positive and statistically significant at least at the 5% level, which further confirms the robustness of the benchmark conclusion. Additionally, to address potential estimation errors caused by differences in the measurement of fishermen’s income, given that fishermen’s income is largely determined by production levels (Lein and Setiawina, 2018), per capita aquatic product output (Pro) was used as an alternative explanatory variable. The regression results are shown in Column (4) of Table 5. At this point, the coefficient for smart fisheries remains positive and statistically significant at the 1% level, further supporting the robustness of the impact of smart fisheries on fishermen’s income.
5 Further analysis
5.1 Analysis of impact pathways
In order to gain a clearer understanding of how smart fisheries can effectively increase fishermen’s incomes and thereby propose targeted policy recommendations, this study examined the specific pathways through which smart fisheries exert their influence. The study used a mediation effect model, focusing on three key dimensions: technological progress, talent quality, and ecological conditions. The detailed regression results are shown in Table 6.
As shown in columns (2) and (3) of Table 6, the regression coefficient for smart fisheries on technological progress is positive and significant at the 1% level, indicating that smart fisheries can effectively promote technological progress in the industry. On the one hand, smart fisheries promote the research and development of smart production systems and enhance advanced technological innovation capabilities; on the other hand, through the research and application of smart equipment, they reduce aquaculture production costs and thereby increase fishermen’s income. These findings support hypothesis H2a. Columns (4) and (5) further show that smart fisheries have a significant positive impact on local human capital, and improvements in talent quality significantly increase fishermen’s income. The introduction of advanced intelligent manufacturing equipment and the creation of new positions related to smart production attract high-quality talent, which not only improves production efficiency but also drives income growth, providing empirical support for hypothesis H2b. Columns (6) and (7) indicate that smart fisheries significantly improve ecological conditions by integrating smart green technologies, and the sustainable use of resources effectively extends production cycles, enabling fishermen to achieve significant income growth. These results validate hypothesis H2c.
5.2 Analysis of the moderating effect
The impact of smart fisheries on fishermen’s income depends not only on the application of smart devices and green technologies but also on regional fisheries innovation capacity (Wang et al., 2023). To examine the moderating role of regional innovation in the process of smart fisheries improving fishermen’s income, this study introduces regional fisheries innovation capacity as a moderating variable. The specific regression results are shown in column (2) of Table 7. The interaction term between smart fisheries and regional fisheries innovation capacity is positive and statistically significant at the 1% level, indicating that regional innovation has a positive moderating effect on the relationship between smart fisheries and fishermen’s income. Higher regional fisheries innovation capacity facilitates the conversion of R&D outcomes into smart production processes, enabling smart fisheries to adopt more advanced production technologies during implementation. By improving production efficiency and reducing input costs, regional innovation enhances the profitability of fisheries practitioners, thereby increasing their income. Furthermore, this paper uses 0.10, 0.25, 0.50, 0.75, and 0.90 quantile regression to test the moderating effect across different income distribution intervals. The results show that the coefficient of the interaction term is not significant at the 0.10, 0.25, and 0.50 quantiles, while the interaction term between smart fisheries and regional fisheries innovation capacity is positive and significant at the 0.75 and 0.90 quantiles. This shows that the positive moderating effect of regional fisheries innovation capacity is mainly concentrated in fishermen groups with higher income distribution. That is, at higher income quantiles, the better the regional innovation environment is, the stronger the driving effect of smart fisheries on fishermen’s income is. On the one hand, high-income fishermen usually have stronger financial bearing capacity and learning and absorption capacity, and are more able to invest in equipment and innovate models in high-innovation regional environments, so as to fully release the marginal benefits brought by smart fisheries. On the other hand, regions with stronger innovation capabilities tend to be supported by more mature industrial systems and market mechanisms, making it easier for high-income groups to obtain additional benefits through brand building, e-commerce sales, and the development of high value-added products. The results of the quantile regression further confirm the key role of regional innovation in strengthening the income-increasing effect of smart fisheries from the perspective of income distribution, and also suggest that the synergy between smart fisheries and regional innovation is more likely to be activated in high-income groups. These results confirm Hypothesis H3, highlighting the critical role of regional innovation in reinforcing the positive impact of smart fisheries on fishermen’s income.
5.3 Heterogeneity analysis
The above results indicate that smart fishery can increase the income levels of Chinese fishermen. However, due to significant differences among regions in terms of economic foundations, fisheries infrastructure, and production scale, the implementation costs and development potential of smart fisheries exhibit regional variations, and their impact on fisheries production may exhibit regional heterogeneity. To further investigate whether the impact of smart fisheries on fishermen’s income exhibits such heterogeneity, this study examines regional differences by combining geographical factors, fishery scale, and fishery circulation conditions. Specifically, geographical heterogeneity is identified by dividing regions into northern and southern groups. Fishery scale is determined based on the ranking of total fishery output value, with regions above the median classified as large-scale and those at or below the median classified as small-scale. In addition, fishery circulation conditions are grouped according to fishery import–export volume rankings, where regions at or above the median are classified as high-trade-volume areas and those below the median as low-trade-volume areas. The specific regression results are presented in Table 8.
Table 8
| Variables | (1) Income | (2) Income | (3) Income | (4) Income | (5) Income | (6) Income |
|---|---|---|---|---|---|---|
| dig | -0.627 (0.495) |
1.997*** (0.605) |
0.369 (0.535) |
0.591** (0.267) |
0.862 (0.613) |
1.331*** (0.407) |
| Constant | 8.333*** (0.517) |
11.230*** (0.631) |
9.778*** (0.466) |
11.740*** (0.436) |
9.456*** (0.385) |
11.110*** (0.417) |
| Control | Y | Y | Y | Y | Y | Y |
| Observations | 52 | 91 | 78 | 65 | 65 | 78 |
| R-squared | 0.941 | 0.778 | 0.799 | 0.964 | 0.921 | 0.935 |
Heterogeneity analysis results.
Standard errors in parentheses.
*** p<0.01, ** p<0.05, * p<0.1.
Table 8 columns (1) and (2) present the regression results based on regional factors, with column (1) showing the results for the northern region and column (2) showing the results for the southern region. It is evident that the impact of smart fishery on fishermen’s income differs significantly between the two groups. Specifically, the coefficient for smart fisheries in the southern region is positive and statistically significant at the 1% level, while the coefficient for the northern region is not significant. This difference may stem from two factors: first, the southern coastal regions have a warm and humid climate with a diverse range of fisheries; second, the southern coastal economy is relatively developed, with a mature industrial chain and a concentration of smart fisheries equipment manufacturers and service providers, creating favorable conditions for sustained capital investment and technological diffusion.
Table 8 columns (3) and (4) present the results of a heterogeneity analysis based on the scale of the fisheries industry. Regression results show that the coefficient for smart fisheries in the large-scale group is positive and statistically significant at the 5% level, while the coefficient for the small-scale group is not significant. This may be because regions with larger fisheries scales can access more capital, labor, and land, facilitating the adoption of smart fishing equipment and investment in digital fisheries development, thereby enhancing production efficiency and fishermen’s income.
Table 8 columns (5) and (6) present the results of a heterogeneity analysis based on fishery trade volume. The results indicate that the impact of smart fisheries on fishermen’s income is positive and statistically significant at the 1% level in high-trade regions, while it is not significant in low-trade regions. This can be explained by the fact that regions with higher trade volumes typically have more developed market networks and sales channels, enabling the efficiency gains from smart fisheries in production, processing, and transportation to be translated into tangible economic benefits for fishermen.
6 Discussion
The empirical results of this study indicate that smart fisheries have a significant positive impact on fishermen’s income, extending existing research into the context of marine fisheries and enriching the related literature. Smart fishery technologies—such as IoT-based precision monitoring, intelligent feeding, disease early-warning systems, and automated harvesting—help reduce production risks, improve the yield and quality of aquatic products, and minimize resource wastage, thereby providing fishermen with more stable and sustainable income sources. Furthermore, the analysis confirms three key mechanisms through which smart fisheries enhance income: technological progress, improvements in human capital, and better ecological conditions. These findings highlight the systematic income-enhancing effects of intelligent technologies, spanning from production processes to ecological outcomes.
The mechanism analysis also reveals that regional innovation levels exert a significant positive moderating effect. This suggests that the income-enhancing benefits of smart fishery technologies depend on local scientific research capacity, technical service systems, and innovation ecosystems. Regions with stronger innovation capabilities typically possess more advanced infrastructure, higher levels of digital literacy, and more mature industrial systems, which facilitate more efficient adoption and greater economic returns from smart fishery technologies. This finding indicates that digital transformation is not a linear process; its economic effects are strongly shaped by regional development conditions, helping explain why digital technologies may produce differentiated benefits across regions.
The heterogeneity analysis further uncovers notable regional and industrial patterns: smart fisheries significantly promote income growth in southern regions, large-scale fishery operations, and areas with high trade volumes, while the effects are insignificant in northern regions, small-scale operations, and low-trade-volume areas. This implies that the benefits of smart fisheries depend on factors such as infrastructure quality, industrial clustering, market connectivity, and fishermen’s capacity. In regions or groups with weaker foundations, smart fishery adoption may face challenges such as high costs and limited willingness or ability to adopt new technologies. Therefore, this study recommends that governments account for regional disparities and operational characteristics when promoting smart fisheries, avoid widening the “digital divide” and enhance the applicability of smart fishery technologies through infrastructure investment, talent training, and market support.
7 Conclusions
What is the current state of smart fisheries development in China’s marine industry? Can this new model increase fishermen’s income while improving production efficiency and reducing costs? What is its mechanism of action? What impact will regional fisheries innovation have? To answer these questions, this study uses regional innovation as a moderating variable and utilizes panel data from 11 coastal provinces in China from 2011–2023 panel data from 11 coastal provinces in China to examine the impact of smart fisheries on fishermen’s income. Against the backdrop of China’s fisheries sector transitioning toward high-quality development, this study provides theoretical references and practical guidance for addressing capacity issues, improving efficiency, and promoting sustainable growth in fishermen’s income.
The research findings indicate that smart fisheries significantly increase fishermen’s income through three primary channels: enhancing efficiency through technological progress, strengthening profitability through human capital development, and supporting sustainable production through optimized ecological conditions. Endogeneity and robustness tests confirm the reliability of these results.
Regional innovation further amplifies these benefits. In regions with stronger innovation capabilities, the economic benefits generated by smart fisheries are more pronounced, indicating that well-developed innovation networks can enhance their impact. Heterogeneity analysis also reveals that smart fisheries yield significant benefits for fishermen in southern regions, those with larger operational scales, and those with larger trade scales, while benefits for fishermen in northern regions, those with smaller operational scales, and those with smaller trade scales are weaker or insignificant. These findings suggest that policy formulation should consider local characteristics, industry scale, and market conditions to ensure fair and sustainable outcomes.
Based on the above research findings, this study proposes targeted recommendations.
The government should accelerate the construction of smart fisheries infrastructure and promote the application of technology in production, processing, and distribution. This can be achieved through fiscal incentives (such as subsidies, credit support, and tax breaks) combined with demonstration farms and case studies to lower the barriers to application and increase fishermen’s awareness and acceptance.
Emphasis should be placed on technological innovation and talent cultivation, fostering collaboration between enterprises, universities, and research institutions to tackle technologies such as smart aquaculture, precision feeding, and disease monitoring. Training programs covering digital skills, smart device operation, and data analysis should be conducted to attract young, highly skilled talent, achieving skill upgrades and increased production capacity. Real-time monitoring of water quality, feed, and emissions, coupled with ecological compensation policies, should support eco-friendly practices to maintain sustainable production and income stability.
Efforts should be made to address regional disparities. Regions with stronger innovation capabilities can establish smart fisheries demonstration zones to leverage technological spillover and industrial agglomeration effects. Regions with lower innovation levels can narrow the gap and improve overall efficiency through technology localization. Strategies should also be tailored to geographical, scale, and trade differences: Southern regions should deepen technological integration, while Northern regions should increase infrastructure investment and develop cold-water aquaculture. Larger operators should expand the application of smart supply chain technologies, while smaller operators or those in less developed trade regions should leverage subsidies, cooperatives, and digital marketing to enhance technology adoption rates and market access capabilities.
Statements
Data availability statement
The raw data supporting the conclusions of this article will be made available by the authors, without undue reservation.
Author contributions
CL: Methodology, Funding acquisition, Writing – review & editing, Project administration. CY: Writing – original draft, Conceptualization. PW: Writing – review & editing, Conceptualization.
Funding
The author(s) declared that financial support was received for this work and/or its publication. This research is funded by the Social Sciences Planning and Research Project Fund of Shandong Province. School of Economics, Ocean University of China Project Title: “Research on the Decoupling Effect and Emission Reduction Strategies of Hidden Carbon Emissions in Export Trade under the ‘Carbon Neutrality’ Goal” Project Number: 23CJJJ38.
Acknowledgments
I would like to express my sincere gratitude to the instructors for their meticulous guidance and constructive suggestions. At the same time, I would also like to express my gratitude to all the students and the research group present for their help and support during the process of data collection and analysis. It was their selfless cooperation and encouragement that enabled this research to be successfully completed.
Conflict of interest
PW was employed by company China Merchants Bank Co., Ltd.
The remaining author(s) declared that this work was conducted in the absence of any commercial or financial relationships that could be construed as a potential conflict of interest.
The reviewer MQ declared a shared affiliation with the authors CL and CY to the handling editor at the time of review.
Generative AI statement
The author(s) declared that generative AI was not used in the creation of this manuscript.
Any alternative text (alt text) provided alongside figures in this article has been generated by Frontiers with the support of artificial intelligence and reasonable efforts have been made to ensure accuracy, including review by the authors wherever possible. If you identify any issues, please contact us.
Publisher’s note
All claims expressed in this article are solely those of the authors and do not necessarily represent those of their affiliated organizations, or those of the publisher, the editors and the reviewers. Any product that may be evaluated in this article, or claim that may be made by its manufacturer, is not guaranteed or endorsed by the publisher.
References
1
Abangan A. S. Kopp D. Faillettaz R. (2023). Artificial intelligence for fish behavior recognition may unlock fishing gear selectivity. Front. Mar. Sci.10. doi: 10.3389/fmars.2023.1010761
2
Adebayo I. T. Ajibola S. Ahmad A. Cartujo P. Muritala I. Elegbede I. O. et al . (2025). Understanding the application of digital technologies in aquaculture supply chains through a systematic literature review. Aquaculture Int.33, 397. doi: 10.1007/s10499-025-02069-7
3
Anthon E. Mariyana S. Nurjannati U. T. Triawan P. A. (2024) Strengthening the economy of small-scale fishermen: the role of entrepreneurial marketing processes in enhancing financial performance to reduce poverty. Russian Journal of Agricultural and Socio-Economic Sciences, 155 (11), 164-176.
4
Barboza A. Macusi E. D. Borazon E. Q. Santos M. D. Muallil R. N. Nallos I. M. (2024). Small-scale fisheries (SSF) management and conservation schemes and their application in the Philippines. Mar. Policy161, 106018. doi: 10.1016/j.marpol.2024.106018
5
Benard R. Dulle F. Lamtane H. (2018). The influence of ICT usage in sharing information on fish farming productivity in the southern highlands of Tanzania. Available online at: https://scecsal.org/publications/papers2018/034_bernard_2018.pdf.
6
Chang C. C. Wang J. H. Wu J. L. Hsieh Y. Z. Wu T. D. Cheng S. C. et al . (2021). Applying artificial intelligence (AI) techniques to implement a practical smart cage aquaculture management system. J. Med. Biol. Eng.41, 652–658. doi: 10.1007/s40846-021-00621-3
7
Chen W. Gao S. (2023). Current status of industrialized aquaculture in China: a review. Environ. Sci. pollut. Res.30, 32278–32287. doi: 10.1007/s11356-023-25601-9
8
Cheng X. Zhang F. Chen X. Wang J. (2023). Application of artificial intelligence in the study of fishing vessel behavior. Fishes8, 516. doi: 10.3390/fishes8100516
9
Ding Q. Du J. (2024). Impact of innovative capacity on agri-environmental efficiency and mechanism research. Int. Rev. Econ Finance94, 103391. doi: 10.1016/j.iref.2024.103391
10
Fan S. Y. Li Y. L. Ma X. J. Liu H. (2021). Empirical research on the impact of digital level on the green agricultural development-based on panel data from 30 provinces in China. World Agric.69, 4–15.
11
FAO (2022). The State of World Fisheries and Aquaculture 2022 ( FAO website). Available online at: https://www.fao.org/3/cc0461en/cc0461en.pdf.
12
Fernandes S. Dmello A. (2025). Artificial intelligence in the aquaculture industry: Current state, challenges and future directions. Aquaculture598, 742048. doi: 10.1016/j.aquaculture.2024.742048
13
Food and Agriculture Organization of the United Nations (2024). The State of the World’s Forests 2024: Forest-sector innovations towards a more sustainable future (Rome: FAO). doi: 10.4060/cd1211en
14
Fu J. He Y. Cheng F. (2024). Smart cutting in fish processing: efficient, high-quality, and safe production of fish products. Food Bioprocess Technol.17, 828–849. doi: 10.1007/s11947-023-03163-5
15
Fu X. M. Wu W. Y. Lin C. Y. Ku H. L. Wang L. X. Lin X. H. et al . (2022). Green innovation ability and spatial spillover effect of marine fishery in China. Ocean Coast. Manage.228, 106310. doi: 10.1016/j.ocecoaman.2022.106310
16
Gu Y. (2022). Application of big data analysis in cost control of marine fishery breeding. Discrete Dynamics Nat. Soc.2022, 6827469. doi: 10.1155/2022/6827469
17
Guo Y. (2010). Boosting to fishery economy and management by satellite navigation and information-based communication. J. Chin. Fisheries Econ28, 37–42.
18
Huang Q. Yu Y. Zhang S. (2019). Internet development and productivity growth in manufacturing industry: Internal mechanism and China experiences. China Ind. Econ8, 1019581. doi: 10.19581/j.cnki.ciejournal.2019.08.001
19
Ji J. Li Y. (2024). Does fishery digitalization matter in the sustainable development of fisheries? Evidence China. Sustain. Dev.32, 7382–7396. doi: 10.1002/sd.3091
20
Jiang Y. Huang L. Liu Y. Wang S. (2024). Impact of digital development and technology innovation on the marine fishery economy quality. Fishes9, 266. doi: 10.3390/fishes9070266
21
Kaur G. Adhikari N. Krishnapriya S. Wawale S. G. Malik R. Q. Zamani A. S. et al . (2023). Recent advancements in deep learning frameworks for precision fish farming opportunities, challenges, and applications. J. Food Qual.2023, 4399512. doi: 10.1155/2023/4399512
22
Kilinc I. Kilinc B. Takma C. Gevrekci Y. (2025). Smart tools and artificial intelligence for enhanced quality and safety in agriculture, fisheries, and aquaculture: A review. Iranian J. Fisheries Sci.24, 913–951.
23
Landge A. T. Mano A. Akansha Nikhil K. Abuthagir Iburahim S. (2025). “ IoT and AI applications in fishing: smart fishing for sustainable practices,” in Information Technology in Fisheries and Aquaculture ( Springer Nature Singapore, Singapore), 59–70. doi: 10.1007/978-981-97-8553-7_4
24
Lein A. A. Setiawina N. D. (2018). Factors affecting the fishermen household income and welfare. Int. Res. J. management IT Soc. Sci.5, 80–90.
25
Li P. Han H. Zhang S. Fang H. Fan W. Zhao F. et al . (2025). Reviews on the development of digital smart fisheries technology in aquaculture. Aquaculture Int.33, 191. doi: 10.1007/s10499-025-01870-8
26
Li L. Jiang S. Lin Y. (2025). The impact of the digital economy on sustainable fisheries: insights from green total factor productivity in China’s coastal regions. Sustainability17, 2673. doi: 10.3390/su17062673
27
Li L. Yuan L. Tian J. (2023). Influence of online E-commerce interaction on consumer satisfaction based on big data algorithm. Heliyon9, 8. doi: 10.1016/j.heliyon.2023.e18322
28
Li Z. Zhang L. Wang W. Ma W. (2022). Assessment of carbon emission and carbon sink capacity of China’s marine fishery under carbon neutrality target. J. Mar. Sci. Eng.10, 1179. doi: 10.3390/jmse10091179
29
Lin C. Y. Shen Y. T. Tsai Y. A. Chen C. C. (2023). An analysis on the preliminary benefits of aquaculture smart aeration control. IET Smart Cities5, 35–40. doi: 10.1049/smc2.12046
30
Lloyd Chrispin C. Jothiswaran V. V. Velumani T. Agnes Daney Angela S. Jayaraman R. (2020). Application of artificial intelligence in fisheries and aquaculture. Biotica Res. Today2, 499–502.
31
Mandal A. Ghosh A. R. (2024). Role of artificial intelligence (AI) in fish growth and health status monitoring: A review on sustainable aquaculture. Aquaculture Int.32, 2791–2820. doi: 10.1007/s10499-023-01297-z
32
Moreau M. A. Garaway C. J. (2021). Trading fast and slow: Fish marketing networks provide flexible livelihood opportunities on an East African floodplain. Front. Sustain. Food Syst.5. doi: 10.3389/fsufs.2021.742803
33
Nagajothi V. (2023). Artificial intelligence (AI) possesses the capacity to fundamentally transform various aspects of fisheries management and operations. Int. J. Sci. Res. Modern Sci. Technol.2, 10–15. Available online at: https://ijsrmst.com/index.php/ijsrmst/article/view/129.
34
Nagothu S. K. Bindu P. Sri Anitha G. Vincent S. Kumar O. P. (2025). Advancing aquaculture: fuzzy logic-based water quality monitoring and maintenance system for precision aquaculture. Aquaculture Int. 33 (1), 32. doi: 10.1007/s10499-024-01701-2
35
Nayoun M. N. I. Hossain S. A. Rezaul K. M. Siddiquee K. N. E. A. Islam M. S. Jannat T. (2024). Internet of Things-Driven Precision in Fish Farming: A Deep Dive into Automated Temperature, Oxygen, and pH Regulation. Computers13, 267. doi: 10.3390/computers13100267
36
Qalati S. A. Yuan L. W. Khan M. A. S. Anwar F. (2021). A mediated model on the adoption of social media and SMEs’ performance in developing countries. Technol. Soc64, 101513. doi: 10.1016/j.techsoc.2020.101513
37
Rajesh M. Kamalam B. S. Sarma D. (2023). “ Recirculating aquaculture system for intensive fish farming in Indian himalayan region: an overview,” in Fisheries and Aquaculture of the Temperate Himalayas. Eds. PandeyP. K.PandeyN.AkhtarM. S. ( Springer, Singapore). doi: 10.1007/978-981-19-8303-0_11
38
Ramanathan R. Duan Y. Valverde J. Van Ransbeeck S. Ajmal T. Valverde S. (2023). Using ioT sensor technologies to reduce waste and improve sustainability in artisanal fish farming in Southern Brazil. Sustainability15, 2078. doi: 10.3390/su15032078
39
Su X. Huang S. (2023). An improved machine learning model Shapley value-based to forecast demand for aquatic product supply chain. Front. Ecol. Evol.11. doi: 10.3389/fevo.2023.1160684
40
Tian H. Liu Y. Tian Y. Alabia I. D. Qin Y. Sun H. et al . (2022). A comprehensive monitoring and assessment system for multiple fisheries resources in the Northwest Pacific based on satellite remote sensing technology. Front. Mar. Sci.9. doi: 10.3389/fmars.2022.808282
41
Tina F. W. Afsarimanesh N. Nag A. Alahi M. E. E. (2025). Integrating AIoT technologies in aquaculture: A systematic review. Future Internet17, 199. doi: 10.3390/fi17050199
42
Tsai K. L. Chen L. W. Yang L. J. Shiu H. J. Chen H. W. (2022). IoT based smart aquaculture system with automatic aerating and water quality monitoring. J. Internet Technol.23, 177–184.
43
Wang B. Han L. Zhang H. (2021a). The impact of regional industrial structure upgrading on the economic growth of marine fisheries in China—the perspective of industrial structure advancement and rationalization. Front. Mar. Sci.8. doi: 10.3389/fmars.2021.693804
44
Wang C. Li Z. Wang T. Xu X. Zhang X. Li D. (2021b). Intelligent fish farm—the future of aquaculture. Aquacult Int.29, 2681–2711. doi: 10.1007/s10499-021-00773-8
45
Wang L. M. Wu X. L. Chu N. C. (2023). Financial development, technological innovation and urban-rural income gap: Time series evidence from China. PLoS One18, e0279246. doi: 10.1371/journal.pone.0279246
46
Willette D. A. Ababouch L. Barber P. H. Bunje P. M. Cauzac J. P. Conchon A. et al . (2023). Emerging monitoring technologies to reduce illegal fishing activities at sea and prevent entry of fraudulent fish into markets. Front. Sustain. Food Syst.7. doi: 10.3389/fsufs.2023.1166131
47
Xia Z. Zeng H. Chen X. (2025). Digital economy and high-quality development of fishery economy: evidence from China. Sustainability17, 4338. doi: 10.3390/su17104338
48
Xilin L. Wu Y. Zeng Y. Ma T. Wang Y. Zhang Q. (2022). Empathy of marine aquaculture on aquatic products consumption. Front. Psychol.13. doi: 10.3389/fpsyg.2022.902889
49
Yu N. Xu T. Wang Q. Tan L. Li K. Jia P. (2021). Research on the development status and countermeasures of smart fishery. Chin. Fisheries Econ39, 13–21. Available online at: https://kns.cnki.net/kcms2/article/abstract?v=QUtgg5W7F1-tPVkqHU4UVEs8E7X2J3Kl4t_9k4swoEEUDeZH01ATSxSoYPvm_yBRP0c8ah5fNmbLmbK-5nE7cUNDLiHEW0Y3HFAIVrd5TikqXBh6ouu4cZSVDpxJg_UdX3NUKoHvpddr5xIKo2wrYHvAS3uawNcXe3yIaJC_7t50_PwdBxyUVBoiVETOt_fRanduniplatform=NZKPTandlanguage=CHS.
50
Zhang Y. (2024). Research on China’s agricultural product sales transformation: online marketing mix strategy and performance on post pandemic area. Front. Sustain. Food Syst.7. doi: 10.3389/fsufs.2023.1297732
51
Zhang Z. Zhu H. Liang H. (2024). Blockchain-based cold chain traceability with nr-pbft and iov-ims for marine fishery vessels. J. Mar. Sci. Eng.12, 1371. doi: 10.3390/jmse12081371
Summary
Keywords
fishermen’s income, heterogeneity, marine fisheries, moderating effect, smart fishery
Citation
Li C, Yin C and Wang P (2026) Promoting or inhibiting? The impact of smart fishery on fishermen’s income in China’s marine fisheries. Front. Mar. Sci. 12:1687771. doi: 10.3389/fmars.2025.1687771
Received
18 August 2025
Revised
12 December 2025
Accepted
22 December 2025
Published
09 February 2026
Volume
12 - 2025
Edited by
Yuan-Wei Du, Yunnan University, China
Reviewed by
Shen Weiteng, Zhejiang Wanli University, China
Man Qin, Ocean University of China, China
Wei Wang, Guangdong Ocean University, China
Updates
Copyright
© 2026 Li, Yin and Wang.
This is an open-access article distributed under the terms of the Creative Commons Attribution License (CC BY). The use, distribution or reproduction in other forums is permitted, provided the original author(s) and the copyright owner(s) are credited and that the original publication in this journal is cited, in accordance with accepted academic practice. No use, distribution or reproduction is permitted which does not comply with these terms.
*Correspondence: Chengxi Yin, lucaswan0107@163.com
Disclaimer
All claims expressed in this article are solely those of the authors and do not necessarily represent those of their affiliated organizations, or those of the publisher, the editors and the reviewers. Any product that may be evaluated in this article or claim that may be made by its manufacturer is not guaranteed or endorsed by the publisher.