Abstract
As climate change and human pressures intensify, advancing our understanding of biodiversity and ecological shifts in vulnerable regions, such as the Baltic Sea, is becoming increasingly important. In this study, we analyzed the diversity of microeukaryotes in the Gulf of Gdańsk, the southern Baltic Sea, using environmental DNA (eDNA) collected from the water column and surface sediment samples. Three primer sets were used, including two targeting universal eukaryotic regions (V4 and V9) and one specific to foraminifera (37F) of the 18S rDNA. The results showed that eukaryotic community composition varied depending on the type of samples and the time of sampling. We observed an increase in alpha diversity from the surface to the sediments, along with dynamic patterns in eukaryotic comunities in water samples. Numerous amplicon sequence variants (ASVs) could not be classified in any eukaryotic group at 90% similarity. Moreover, a significant proportion of ASVs could not be assigned to the genus or species level within the groups such as Cercozoa, parasitic Perkinsea, nematodes, fungi, and benthic foraminifera. Our study highlights the importance of this cryptic diversity and demonstrates the usefulness of metabarcoding as a tool for expanding our understanding of eukaryotic communities in this brackish environment.
1 Introduction
The Gulf of Gdańsk is a large bay located in the southeastern part of the Baltic Sea, one of the largest brackish seas in the world (Snoeijs-Leijonmalm and Andrén, 2017). Covering an area of approximately 4,950 km2 (Majewski, 1994), the bay reaches a maximum depth of 110 m in the Gdańsk Deep. The Vistula, the largest river discharging into the Baltic Sea, strongly shapes the bay’s hydrography, with an average annual flow of 1080 m3s-1 and flood peaks over 8,000 m3s-1 (Pruszak et al., 2005; Cyberski et al., 2010). With an average salinity of 7 practical salinity unit (psu), the Gulf of Gdańsk is classified as a brackish water body (Mazur-Marzec et al., 2005). Salinity levels range from about 1 psu near the Vistula River mouth to a maximum of around 12 psu as recorded in the Gdańsk Deep (Kruk-Dowgiałło and Szaniawska, 2008). Its geographical location and hydrographical features create unique environmental gradients that shape species distribution patterns (Herlemann et al., 2011; Piwosz et al., 2018; Broman et al., 2019). The Baltic Sea’s ecosystem is further impacted by anthropogenic pressures (Österblom et al., 2007; Reckermann et al., 2022). One major issue is eutrophication, caused by excessive nutrient inputs from agriculture, urban wastewater, and industrial discharges (Andersen et al., 2017). This leads to harmful algal blooms, oxygen-depleted zones, and other threats to marine biodiversity. The Baltic Sea is often considered a “low-biodiversity” system (Dippner et al., 2000; Johannesson et al., 2011). However, substantial gaps in our knowledge of its biodiversity remain (Ojaveer et al., 2010; Piwosz et al., 2018). In addition to the inherent limitations of reference sequence databases, these gaps are further amplified by mixtures of freshwater and marine species, which are continuously exposed to strong selective pressures from dynamic environmental gradients. Together, these factors contribute to the complexity of biodiversity, including the presence of cryptic or region-specific lineages, much of which is poorly represented in current databases. This highlights the need for molecular approaches to monitor and preserve this particular ecosystem.
Environmental DNA (eDNA) metabarcoding, in combination with high-throughput sequencing, is gaining momentum as a powerful method for surveying biodiversity and identifying multiple species simultaneously, from micro- to macroorganisms (Taberlet et al., 2012). It holds great potential as a standard approach for assessing the state and functioning of aquatic ecosystems (Pawlowski et al., 2022; Altermatt et al., 2025). However, several inherent limitations and potential biases can affect data quality, e.g., especially during the extraction of eDNA or PCR amplification (Pawlowski et al., 2021), or due to rRNA gene copy number variations across taxa (Vasselon et al., 2018; Pierella Karlusich et al., 2023). Primer bias and preferential amplification in complex samples remain major challenges, often leading to taxonomic under- or overrepresentation (Beentjes et al., 2019). In the last decade, metabarcoding approaches for microeukaryotes have advanced considerably, with the development and evaluation of highly specific primers for various research targets (Thakur et al., 2022; Vaulot et al., 2022). At the same time, reference databases focusing on protists, e.g., PR2 (Guillou et al., 2013) or specific microeukaryotic groups, e.g., diatoms (Rimet et al., 2016), foraminifera (Holzmann et al., 2024; Morard et al., 2024), have undergone continuous improvement, enhancing taxonomic coverage and accuracy.
Among genetic markers used in metabarcoding-based biodiversity assessments, hypervariable regions of the 18S ribosomal RNA gene are widely applied to survey global eukaryotic biodiversity (Kezlya et al., 2023) or to target specific taxa and uncover patterns of their occurrences (Bailet et al., 2020; Thakur et al., 2022). The V4 and V9 regions of 18S rDNA are commonly used, and several studies have evaluated their ability to capture eukaryotic diversity (De Vargas et al., 2015; Choi and Park, 2020; Cordier et al., 2022; Stuart et al., 2024). However, most of this work has focused on overall diversity and depth of taxonomic identification, with fewer comparative studies examining community composition within brackish ecosystems (Piredda et al., 2016; Choi and Park, 2020). Moreover, some ecologically important groups, such as foraminifera, are poorly represented in surveys using universal eukaryotic primers. Employing multiple gene regions, therefore, provides a high-resolution analysis of microbial communities in complex environments (Choi and Park, 2020; Fonseca et al., 2022). Within the Baltic Sea, the metabarcoding approaches have been previously applied to investigating eukaryotic communities along the environmental gradients (Piwosz et al., 2018; Rojas-Jimenez et al., 2019), in different seasons and environmental conditions, from water (Majaneva et al., 2012; Bunse et al., 2016) and sediments (Salonen et al., 2018). However, none of these DNA-based studies attempted to assess the level of taxonomic knowledge of Baltic Sea microeukaryotes.
In this study, we investigated eukaryotic communities in the Gulf of Gdańsk using the metabarcoding approach with universal eukaryotic (V4 and V9) and foraminiferal-specific (37F) 18S markers. Water and sediment samples were collected in March 2022 and 2023. Our aims were: (a) to compare eukaryotic diversity and community structure between water and sediment samples, and between two sampling years; and (b) to assess the level of taxonomic assignment of different eukaryotic groups. Moreover, our study provides the first DNA-based assessment of foraminiferal diversity in this region of the Baltic Sea. By integrating both universal and taxon-specific markers, this work expands baseline knowledge of microeukaryotic diversity in transitional coastal environments and contributes to understanding how molecular tools can be applied to assess ecosystem complexity in brackish waters.
2 Material and methods
2.1 Collection of samples
Sea water and surface sediment samples were collected repeatedly around three stations on the Gulf of Gdańsk (Figure 1A), during the cruises of R/V Oceania on 21st March 2022 and 14th March 2023. At each station, seawater samples were retrieved with Niskin bottles from the surface (5 m, SUR), middle (25 or 35 m, MID), and bottom (approximately 10 m above the sea floor, BOT) layers. From 2 to 5 litres of seawater per depth were filtered directly onboard using a vacuum pump through sterile Sterivex filter units (Millipore, USA) with a pore size of 0.22 µm. Two filter units were prepared as negative controls at each station, one by filtering 1 L of Milli-Q water and the other by pressing air through the filter 10 times with a 50-ml plastic syringe, respectively. Approximately 10 g of surface sediment (SED) was collected using a box corer and stored in 50 ml sterile Falcon tubes. In total, 54 seawater and 18 sediment samples were collected and placed in individual plastic bags and frozen at -20°C for further experiments. Salinity, temperature, and turbidity were measured in situ with a Mini CTD (Conductivity-Temperature-Depth) Sensordata SD202, provided in Supplementary Table S1.
Figure 1
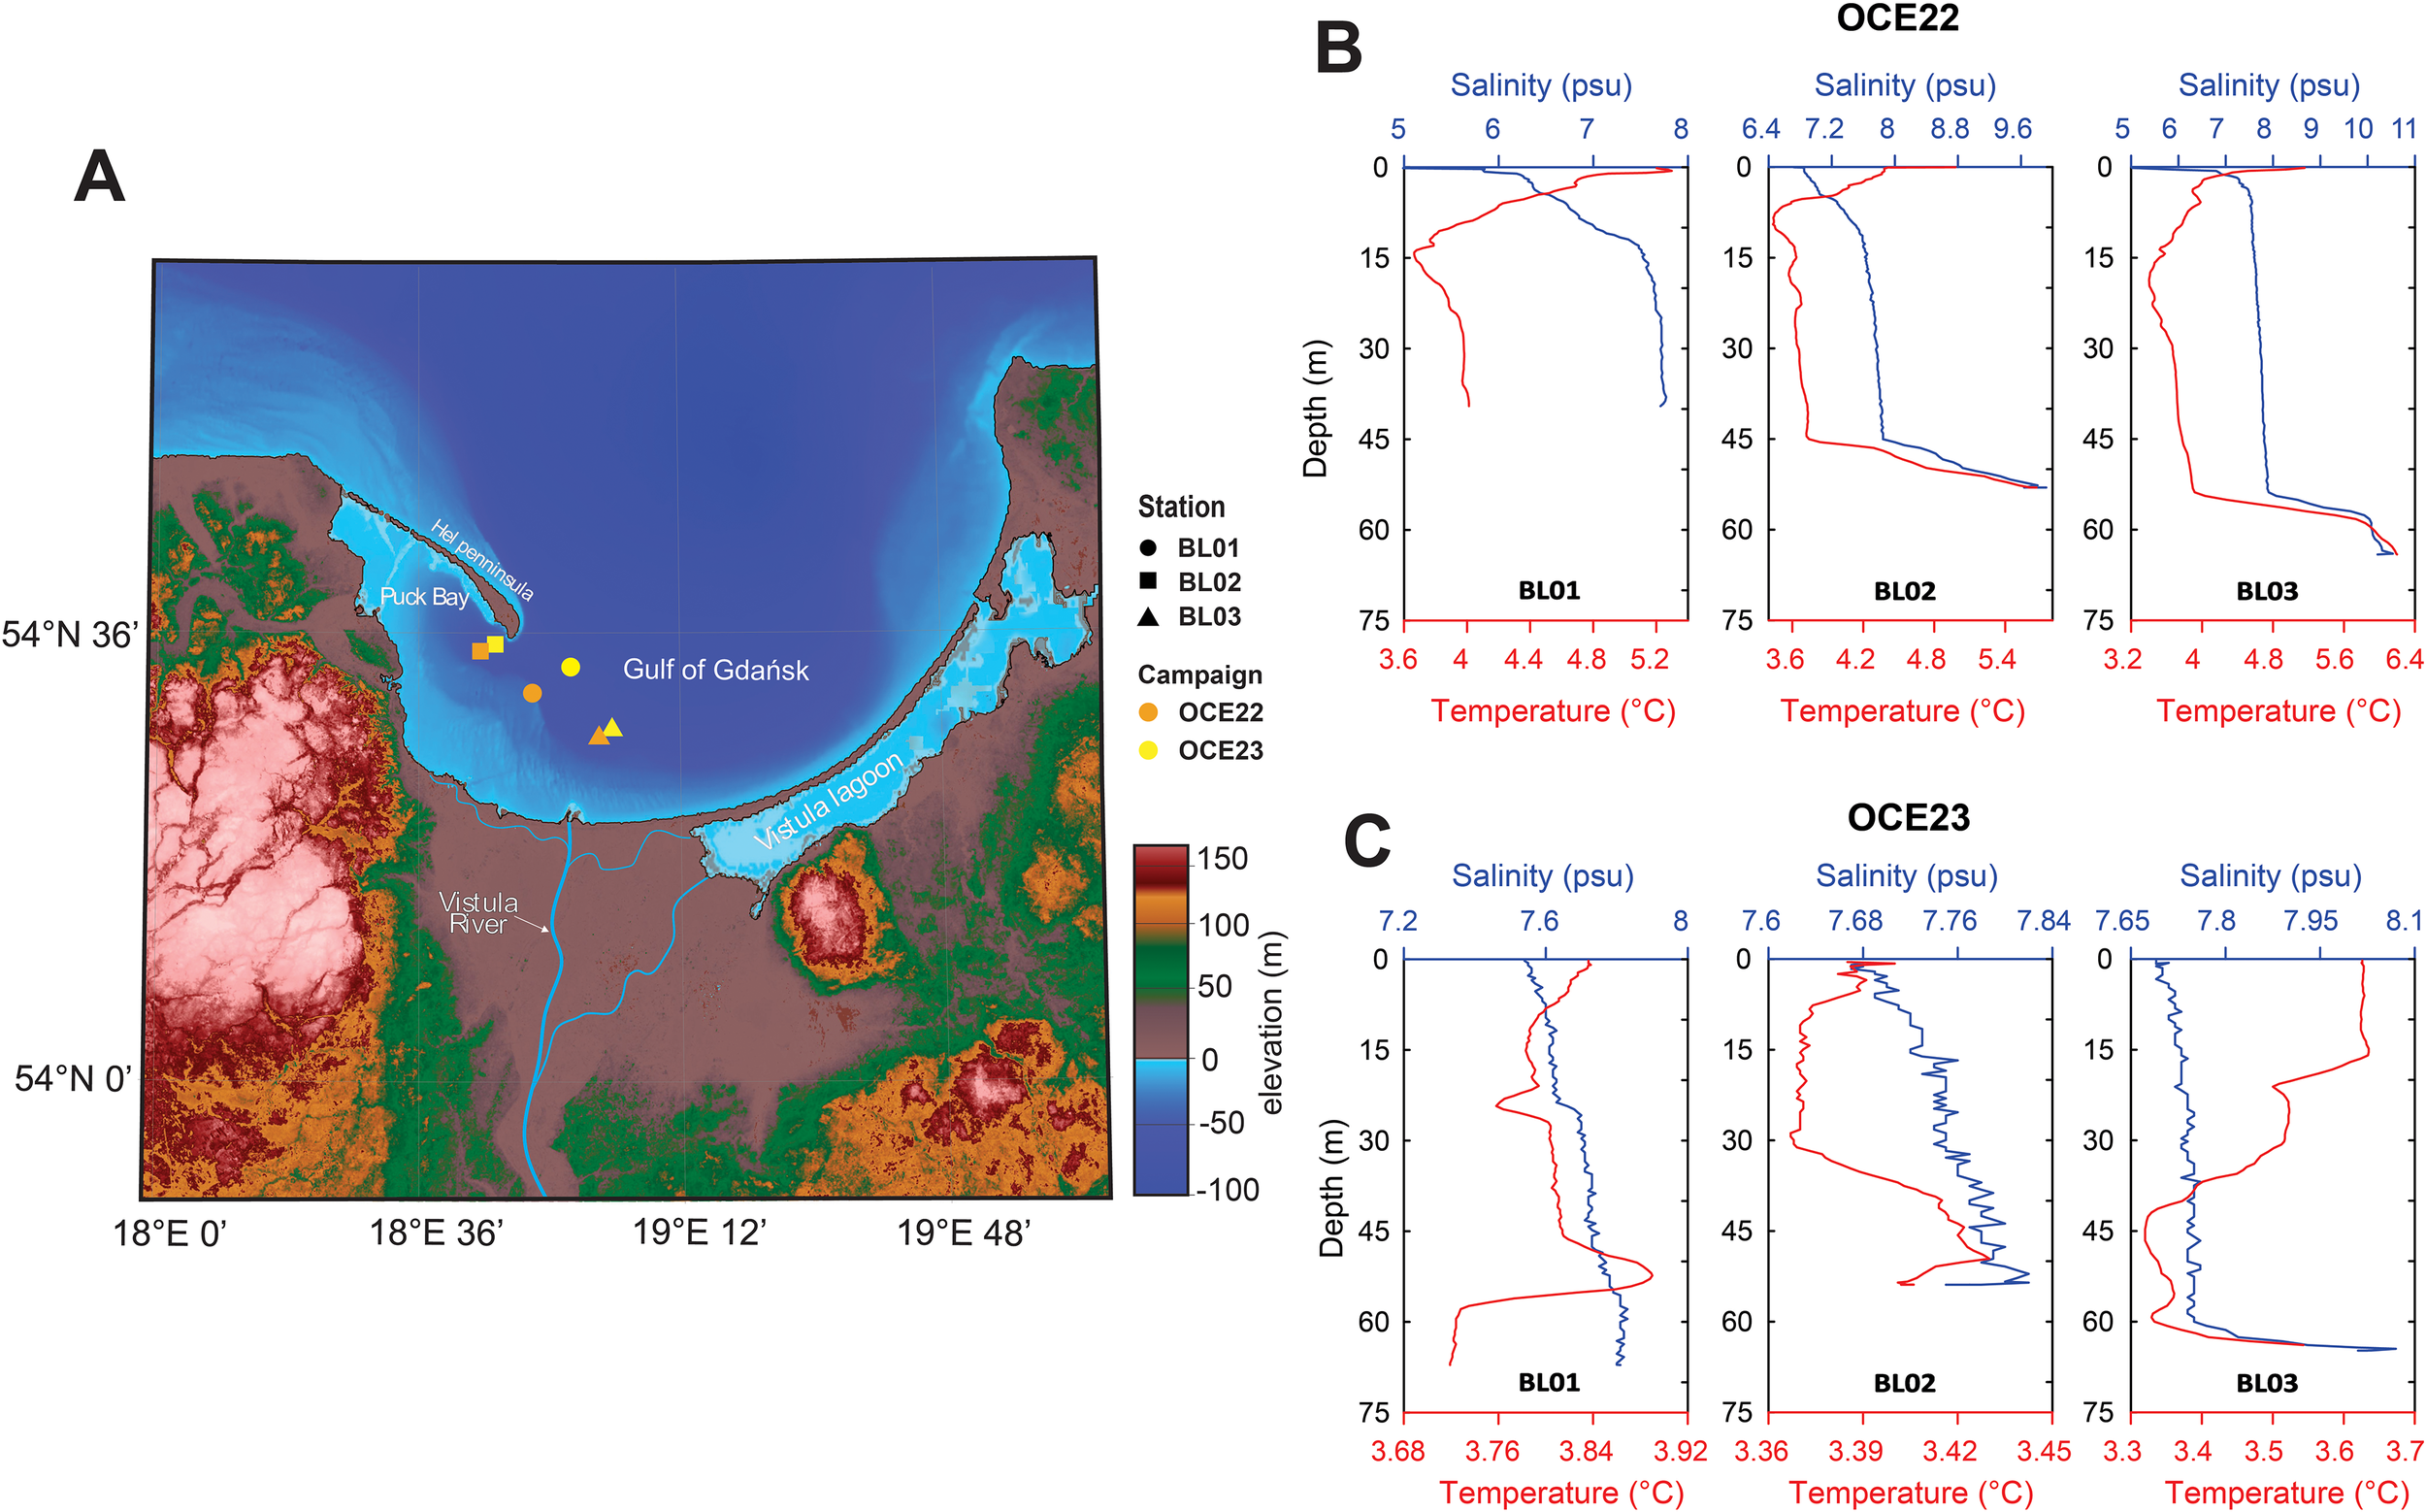
(A) Map showing the location of sampling stations in the Gulf of Gdańsk from two campaigns, OCE22 and OCE23. Salinity (psu), temperature (°C), and depth profiles measured in March 2022 (B) and March 2023 (C), with temperature in red and salinity in blue.
2.2 DNA extraction, amplification, and sequencing
Seawater DNA was extracted using the DNeasy PowerWater kit (Qiagen, Germany) and the QIAvac Vacuum Systems (Qiagen, Germany) according to the manufacturer’s instructions. Sedimentary DNA was extracted using the DNeasy PowerMax Soil Kit (Qiagen, Germany) from up to 10 g of sediment. Then all DNA extracts were stored at −20°C until PCR amplifications.
The obtained DNA samples were amplified by polymerase chain reaction (PCR) for three regions of 18S rDNA. Two universal primer sets, TAReuk454FWD1/TAReukREV3 (Stoeck et al., 2010) and 1389F/1510R (Amaral-Zettler et al., 2009), were used to target the V4 (~387 bp length) and V9 (~130 bp length) regions of the 18S rRNA gene. The foraminiferal-specific 37F region of the 18S rRNA gene (~68–196 bp length) was amplified using the primers s14F1/s15 (Pawlowski and Lecroq, 2010). All primer combinations were designed to include unique sequences of 8 nucleotides appended at 5′ ends (Esling et al., 2015) to allow differentiation of sequenced samples. PCR amplification of the targeted gene regions was performed in a final volume of 25 μL, which included 1.5 μL of 1.5 mM MgCl2 (Applied 124 Biosystems, USA), 2.5 μL of 10× PCR buffer II (Applied Biosystems, USA), 0.5 μL of 0.2 mM deoxynucleotide triphosphates (Promega, USA), 0.5 μL of 20 mg mL−1 bovine serum albumin (Invitrogen Ultrapure, USA), 1 μL of 10 μM of each primer, 0,2 μL of AmpliTaq Gold DNA polymerase (Applied Biosystems, USA) and 2 μL of template DNA. Triplicate PCR reactions were performed for each sample, alongside negative controls including on-board blanks (i.e., filter units with air or Milli-Q water), in-laboratory extraction blanks for DNA amplification experiments, and no-template blanks. All the PCR products were verified by agarose gel electrophoresis, and the triplicates were subsequently pooled.
PCR products were purified using the Clean-Up kit (A&A Biotechnology, Poland) and pooled in equimolar concentration within each multiplexed library. Libraries were then constructed using the KAPA Unique Dual-Indexed Adapter Kit (Roche, Basel, Switzerland), and then were quantified by quantitative PCR using the Kapa Library Quantification kit (Roche, Basel, Switzerland). Sequencing was performed on the Illumina NovaSeq 6000 instrument (Illumina, USA), using NovaSeq 6000 SP Reagent Kit v.1.5 (500 cycles) in pair-end read mode 2×250 cycles at the Center of New Technologies (CeNT, University of Warsaw, Poland).
2.3 Bioinformatics
Bioinformatics analyses were performed using the web application SLIM (https://trtcrd.github.io/SLIM) (Dufresne et al., 2019). The reads were first demultiplexed using the “double-tag-demultiplexing” algorithm based on their unique barcode sequences. The software package DADA2 (Callahan et al., 2019) was used for filtering the low-quality sequences, trimming the primers, merging the paired-end reads, removing chimeric sequences, and inferring amplicon sequence variants (ASVs). Using the microDecon R package with default settings (Mcknight et al., 2019), the samples were decontaminated using negative control samples as reference. We also removed sequences not having “GTCG” adjacent to the eukaryotic-specific hypervariable region V9, or “GACAG” adjacent to the foraminifera-specific hypervariable region 37F. Reads from the three eDNA replicates were combined and then calculated per sample and station.
The taxonomic annotation of ASVs was generated using “assignment-fasta-search” of VSEARCH v.2.2.2 software (Rognes et al., 2016). Taxonomic annotations were the consensus among up to three candidate reference sequences (at least 90% of similarity or directly assigned 99% of similarity) by VSEARCH. For the 18S V4 and V9 datasets, the ASVs were compared to the curated DNA reference databases PR2 v.5.0.0 (Guillou et al., 2013) and SILVA v.138 (Quast et al., 2012). For the foraminiferal 18S 37F, the ASVs were compared to foraminifera reference databases for benthic BFR2 v.1 (Holzmann et al., 2024) and planktonic PRF2 v.2 (Morard et al., 2024). Before further analysis, any artifactual ASVs, e.g., prokaryotic, planktonic foraminiferal, plastidic ASVs, a small number of reads (having <10 reads), or singletons were discarded.
2.4 Diversity and structural analysis
Analyses were conducted using the R statistical environment (http://www.r-project.org/). Rarefaction curves were used to assess sequencing depth sufficiency and to compare ASV richness among samples, using the rarecurve function in the vegan package in R (Oksanen et al., 2019), which plots the number of observed ASVs as a function of the number of sequences sampled. Each marker dataset was normalized to the same sequencing depth by rarefying all samples to the read count of the sample with the lowest number of reads. Then, alpha diversity metrics, including normalized richness and Shannon diversity, were calculated using the vegan package. To assess differences in beta diversity of community composition, the Bray–Curtis dissimilarity matrices were calculated from normalized ASV tables using the cumulative sum scaling method (Paulson et al., 2013), and then performed non-metric multidimensional scaling (nMDS). The dissimilarity matrices were also used as input for permutational multivariate analysis of variance (PERMANOVA) models, via the adonis2 function with 999 permutations. The beta diversity dispersion within each sample type was evaluated using the betadisper function and compared among sample types via analysis of variance (ANOVA). The function envfit was used to fit environmental variables onto the ordination to identify potential correlations between community structure and environmental gradients. The community dynamics were assessed using the function clamtest (alpha = 0.05) to classify ASVs as “generalists”, evenly distributed across habitats or environmental conditions, or “specialists”, showing a strong preference for a particular sample type or environmental condition (Chazdon et al., 2011), from two campaigns (for V4 and V9) and habitats (for 37F).
3 Results
3.1 CTD data
The temperature and salinity measurements indicate that the waters were warmer, more variable, and slightly less saline waters in 2022 compared to 2023 (Figures 1B, C). In 2022, temperatures at all stations ranged from 3.6°C to 6°C, while they ranged from 3.3°C to 3.9°C in 2023. In all profiles, salinity increased toward the bottom. The least saline station was BL01, with surface salinity below 6 psu in 2022 and below 7.7 psu in 2023. Stations BL02 and BL03 in 2022, as well as station BL03 in 2023, exhibited a sharp increase in both salinity and temperature in the bottom layer, reaching up to 8 psu in salinity and 6°C in 2022 and up to 8 psu in salinity and 3.9°C in 2023, respectively.
3.2 Metabarcoding data
In total, demultiplexing sequences resulted in a total number of ~ 42.4 million paired-end reads. After quality filtering, trimming, denoising, chimera removal, and decontamination for each marker, the total number of reads was 13.01 million in the V4 dataset, 9.94 million in the V9 dataset, and 9.33 million in the 37F dataset. Strict filtering of ASVs (artifactual ASVs, rare ASVs, and singletons) removed 0.87% of the V4, 2.2% of the V9, and 2.27% of the 37F sequences. The reads were then assembled into 3,868 ASVs for V4, 2,140 ASVs for V9, and 165 ASVs for 37F datasets (Supplementary Tables S2–S4). Summary statistics of read counts per sample at each processing step are provided in Supplementary Table S5. The average number of sequences per station was 537,563 for the V4 dataset, 405,120 for the V9 dataset, and 380,084 for the 37F dataset. All the samples in the three datasets tended to plateau based on the number of retained ASVs and sequencing depth (Figure 2). This saturation suggests that most of the eukaryotic and foraminiferal diversity was captured, supporting reliable comparisons of ASV richness among stations for each campaigns and marker.
Figure 2
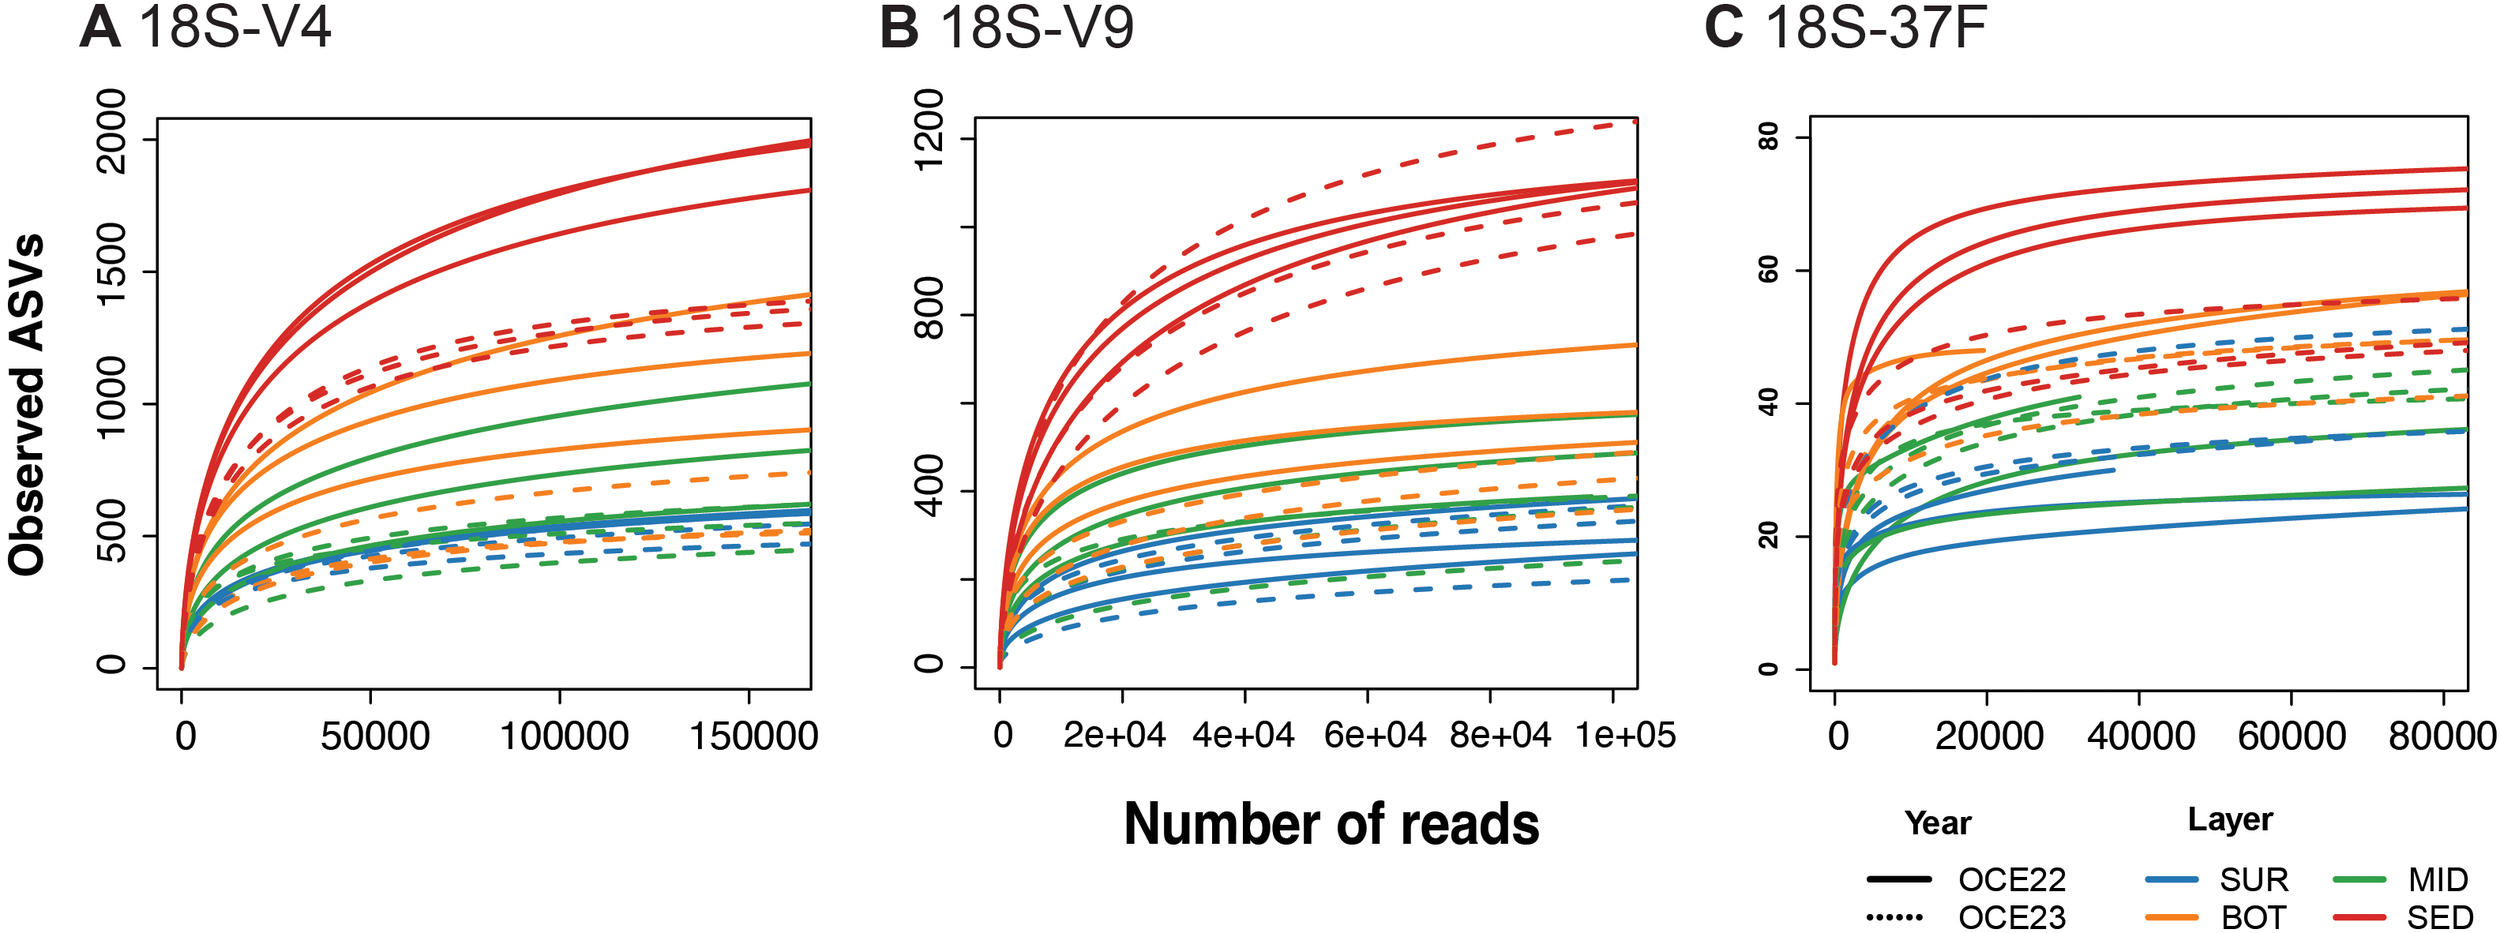
Rarefaction curves depicting the relationship between sequencing depth and species richness measured as amplicon sequence variants (ASVs) for each marker, along with the taxonomic assignments of ASVs. Rarefaction curves are shown for the eukaryotic 18S-V4 (A), 18S-V9 (B), and foraminifera-specific 18S-37F (C) markers, derived from water and sediment samples collected during two campaigns (OCE22 and OCE23).
3.3 Eukaryotic diversity and taxonomic composition
The universal markers revealed a large proportion of unclassified eukaryotes (Figure 3A), with 859 unassigned ASVs (23% of total ASVs) detected in the 18S-V4 dataset and 678 unassigned ASVs (33.3%) in the 18S-V9 dataset (Figures 3B, C). Among the assigned ASVs, the dominant taxa showed comparable patterns of richness. The SAR (Stramenopiles, Alveolates, and Rhizaria) supergroup dominated in both V4 and V9 datasets, with Alveolata comprising 810 and 438 ASVs, Stramenopiles with 594 and 288 ASVs, and Rhizaria with 389 and 213 ASVs, respectively. Among other groups, the most ASV-rich in both datasets were Metazoa (Arthropoda and Nematoda), Fungi (Chytridiomycota), and Chlorophytes (Chlorophyceae and Trebouxiophyceae).
Figure 3
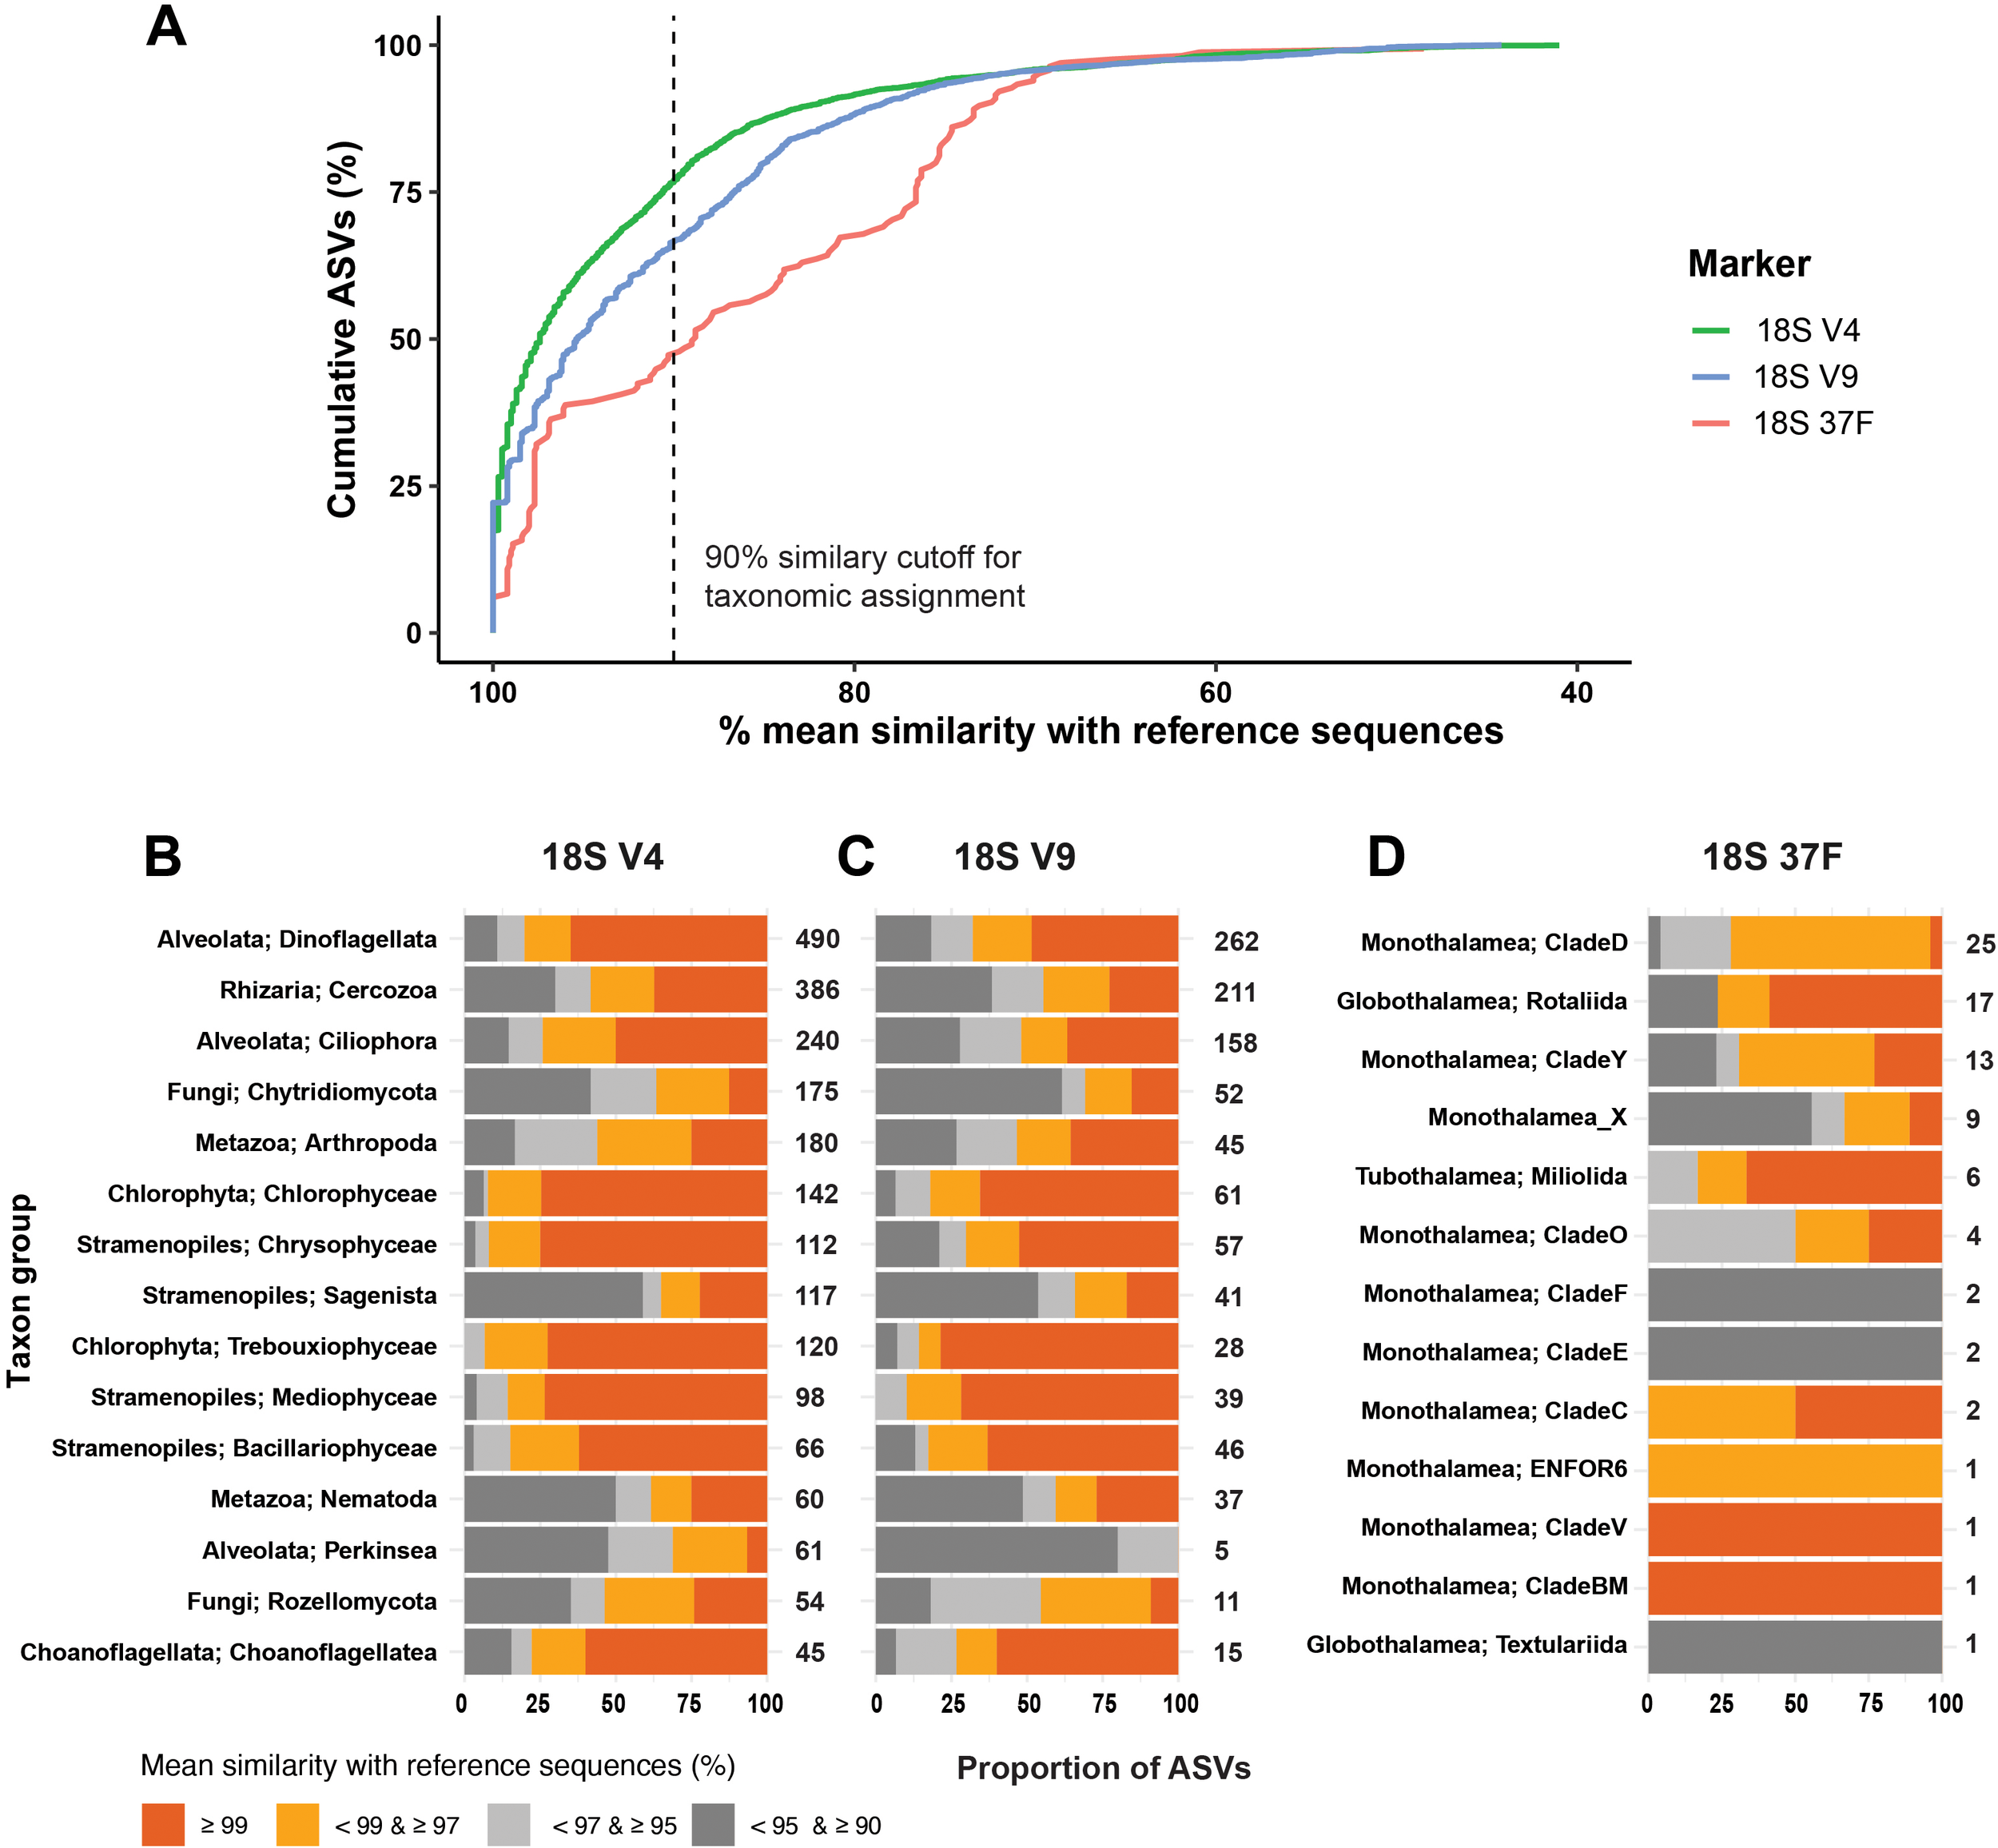
(A) Cumulative proportion of ASVs as a function of their mean similarity with the reference sequence. The vertical dash lines indicate the similarity cutoff (90%) for taxonomic assignment used in this study. Corresponding taxonomic assignment summaries are presented as barplots for 18S-V9 (B), 18S-V4 (C), and 18S-37F (D) with a three-level cutoff.
The foraminifera-specific 37F dataset was also dominated by unassigned ASVs (Figure 3D). Among the assigned ASVs, we identified 60 ASVs belonging to the class Monothalamea, 18 ASVs to the class Globothalamea, and 6 ASVs to the class Tubothalamea (Figure 3D). At the order/clade level, monothalamid CladeD (25 ASVs) dominated the foraminiferal assemblage, followed by Rotaliida (17 ASVs), CladeY (13 ASVs), and 10 other clades with less than 10 ASVs.
The level of taxonomic assignment in both V9 and V4 datasets showed consistent patterns, with variation across groups (Figures 3B, C). For the most abundant groups, including Dinoflagellata, Cercozoa, and Ciliophora, the V4 dataset assigned 74.2 – 80.2% of ASVs at ≥97% similarity, while the V9 dataset assigned only 44.5 – 67.9% at the same threshold, respectively. Stramenopiles (Mediophyceae, Bacillariophyceae, Chrysophyceae), Chlorophyta (Trebouxiophyceae, Chlorophyceae), and Choanoflagellata (Choanoflagellatea) also showed > 70% of ASVs with high similarity in both markers. In contrast, groups such as Fungi (Chytridiomycota), Sagenista, Nematoda, and Perkinsea had >60% of ASVs assigned with lower similarity (< 97%). In the 37F dataset, the most abundant taxa, i.e., Clades D, Clade Y, and Rotaliida, showed 69.2–76.5% of ASVs with > 97% similarity. The remaining ASVs were mainly rare taxa, assigned either to undescribed monothalamid lineages or to higher taxonomic levels.
Across stations and sample layers, the V4 and V9 datasets revealed similar taxonomic composition, with the eukaryotic community being dominated by dinoflagellates, ciliates, and cercozoans (Supplementary Figures S1A, B). The main differences were observed between two campaigns: OCE22 and OCE23. In V4 dataset of the OCE22, Chlorophyta dominated surface water samples (16.6%), while Chytridiomycota fungi were particularly abundant in the sediments (10.2%). In OCE23, metazoans (mainly Arthropoda) dominated surface and mid-depth samples (24.4%). The V9 dataset showed a comparable pattern, but with lower richness of arthropodes in OCE23 and a higher number of diatom ASVs (3.7%). In the foraminiferal 37F dataset (Supplementary Figure S1), OCE22 was dominated by unassigned ASVs (43.9–67.9%), whereas OCE23 featured more Monothalamea (39.5–63.0%), Globothalamea (5.5–26.1%), and Tubothalamea (up to 12%).
In contrast, the relative abundance of eukaryotic groups varied markedly between sample layers (i.e., three water layers and sediment) and different campaigns (Figure 4). Both V4 and V9 markers revealed similar overall patterns, whereas the proportion of dominant taxonomic groups differed. In OCE22, planktonic diatoms (mainly Mediophyceae and Coscinodiscophyceae) dominated surface water, reaching 79.76% in V9 and 81.36% in V4 at the station BL01, while ciliates and dinoflagellates dominated mid- and bottom waters (40.86% - 65.5%). Dinoflagellata were most abundant in sediments (21.53 - 41.02%). Rhizaria dominated at stations BL02 and BL03, with the highest proportion in the surface water of BL02 (36.31% in V4, 18.61% in V9). In contrast, OCE23 water samples were dominated by metazoans (Figure 4B), mainly Arthropoda, with abundance increasing from surface to bottom (12.21% to 90.06%). In sediment, Mollusca dominated in station BL01 in the V4 (44.64%), together with Dinoflagellata and Mediophyceae.
Figure 4
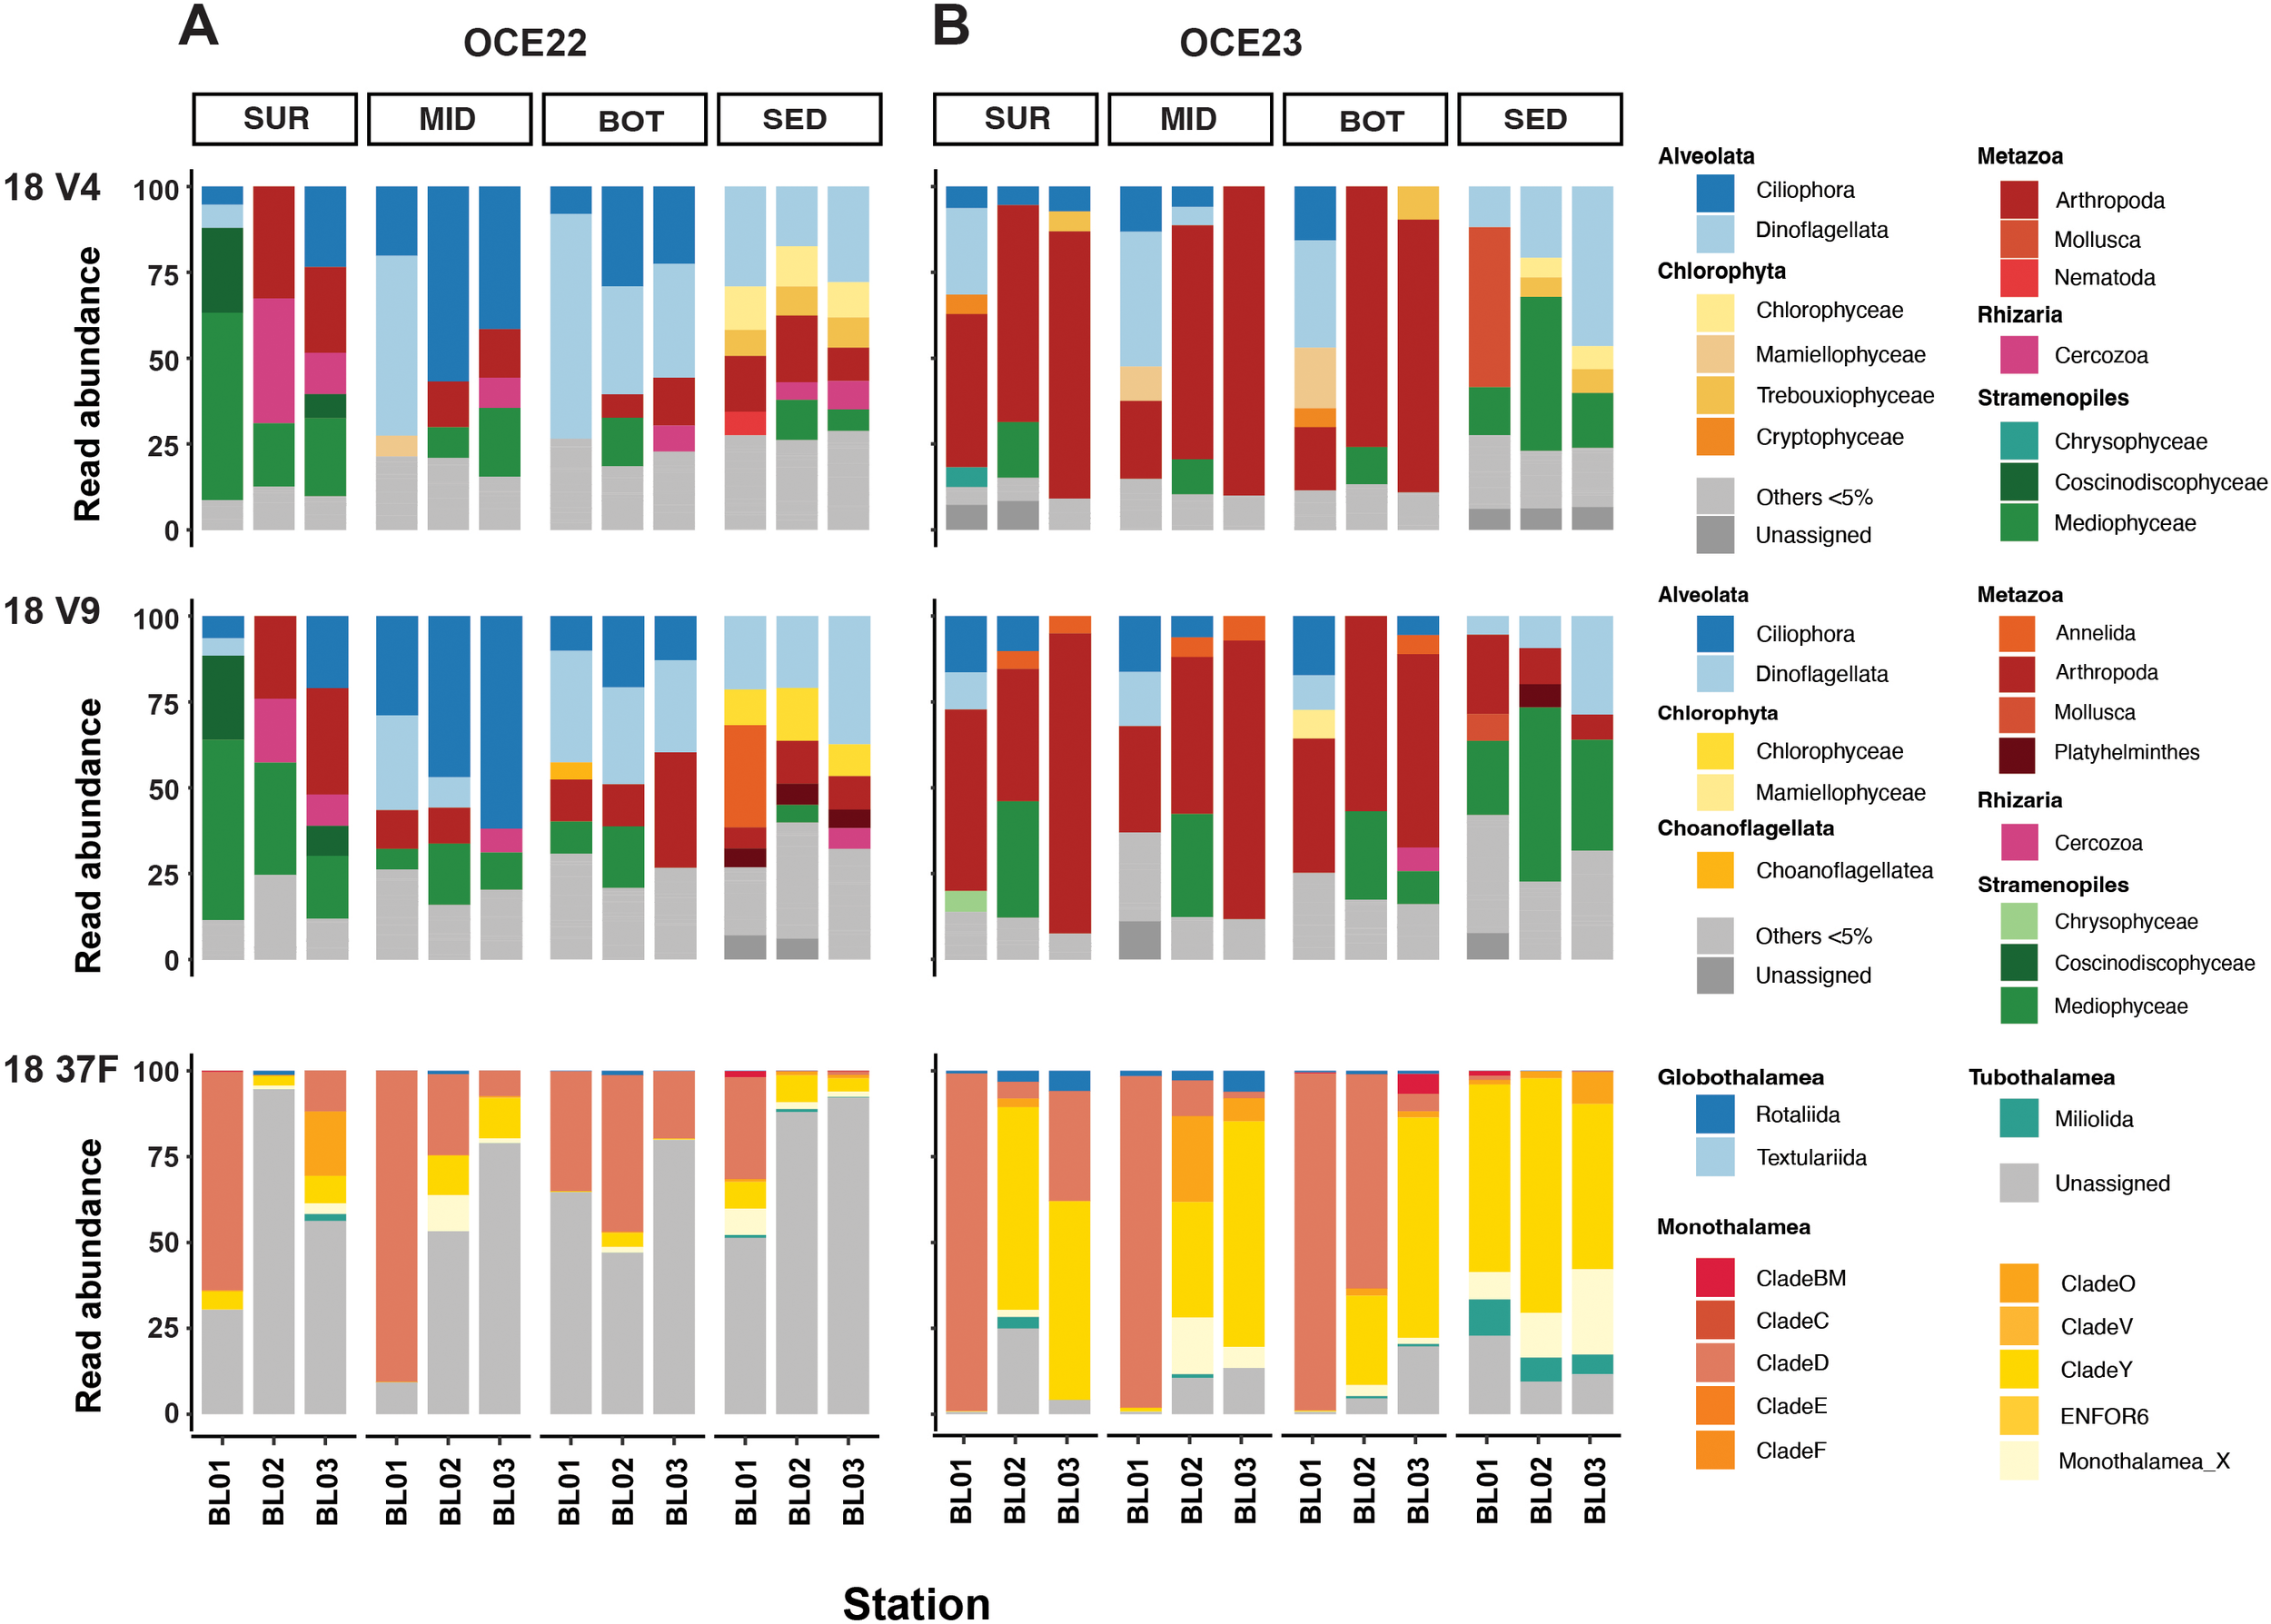
The relative abundance of eukaryotic communities in the water and sediment samples collected in two campaigns: OCE22 (A) and OCE23 (B), based on different markers, including the 18S-V4, 18S-V9, and 18S-37F markers.
In the foraminiferal 37F dataset, OCE22 samples were dominated by unclassified sequences, ranging from 30.38% to 94.6%, while OCE23 samples had a notably high abundance of Monothalamea. The monothalamid Clade D was the dominant group in water samples from station BL01, with relative abundances ranging from 34.87% to 98.16%. In contrast, Clade Y exhibited an increasing abundance in water samples of stations BL02 and BL03 and a high abundance in sediment samples. Globothalamea and Tubothalamea were detected mainly in OCE23, but their number was relatively low.
3.4 Alpha and beta diversity patterns
Overall, alpha diversity metrics showed a consistent increase in eukaryotic diversity from the water column to the sediments, with OCE22 samples generally more diverse than those from OCE23. Normalized richness of sediment samples was significantly higher than in water samples across all three markers (V4, V9, and 37F; Wilcoxon test, p < 0.05; Figure 5). A similar pattern was obtained for the Shannon diversity with the V4 and V9 datasets, whereas no significant difference was detected with the 37F dataset.
Figure 5
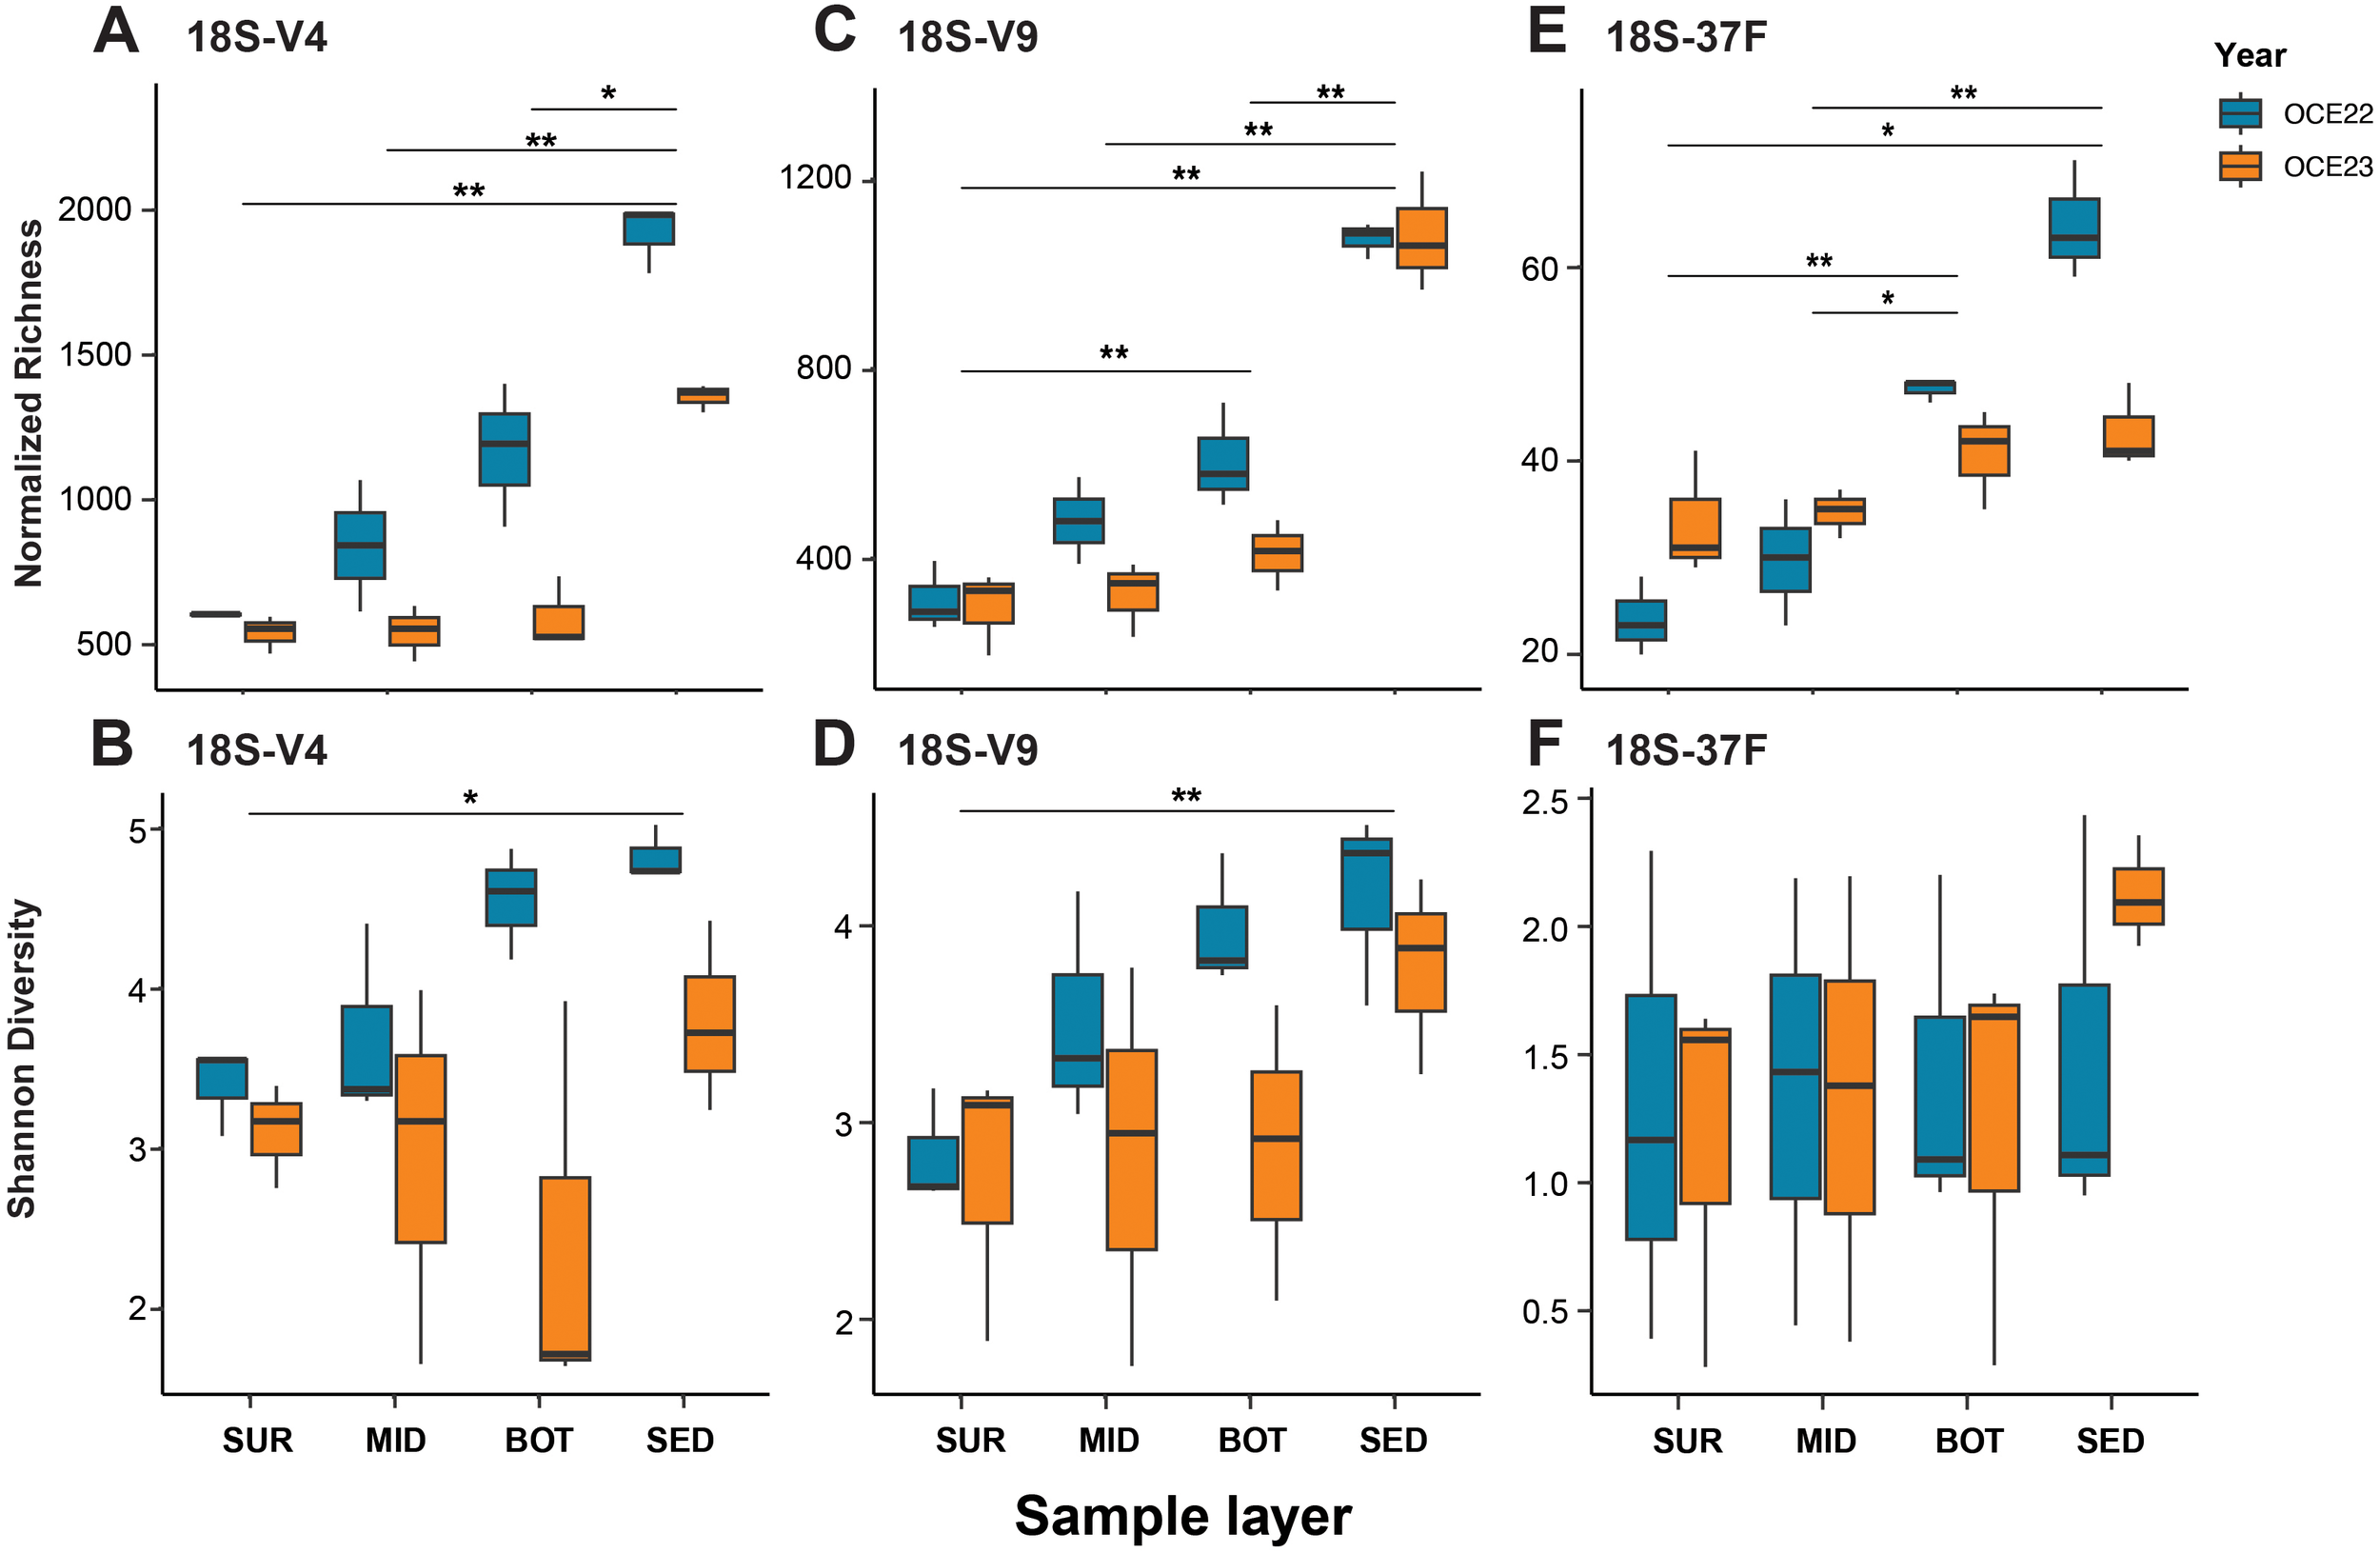
Normalized richness and Shannon diversity indices of eukaryotic communities across water column layers (surface - SUR, middle - MID, bottom - BOT) and sediments (SED) collected during the OCE22 and OCE23 campaigns. Diversity was assessed using three molecular markers: 18S-V4 (A, B), 18S-V9 (C, D), and 18S-37F (E, F). Statistical significance was tested with the Wilcoxon test: **p < 0.01, *p < 0.05.
Analysis of community beta diversity was conducted using the nMDS method based on Bray–Curtis distance similarity coefficient (Figure 6). Eukaryotic communities were clearly differentiated between water and sediment samples, with distinct clustering patterns observed across the three markers. These patterns were supported by non-parametric PERMANOVA tests (p < 0.001), showing significant effects for V9 (R² = 0.40, F = 14.83), V4 (R² = 0.33, F = 11.17), and 37F (R² = 0.12, F = 3.2). Dispersion analysis also revealed significant differences among sample types in different markers (ANOVA, p <0.001), whereas variation of two campaigns was not significant. The communities of sediment samples formed tight clusters within each campaign, while those of the waters showed higher variability. In the V9 dataset, water samples from different campaigns overlapped substantially, whereas those in the V4 dataset were distinctly separated. In the 37F dataset, community composition estimates were not only highly differentiated between water and sediment samples but also between the two campaigns, i.e., OCE22 and OCE23. The envfit results indicated that salinity and density were the strongest environmental correlates of community turnover in both the V4 and V9 datasets. Additionally, depth showed a strong correlation with community structure in the V9 dataset, while turbidity and temperature were more strongly associated with variation in the V4 dataset. In contrast, no environmental variables were significantly correlated with community patterns in the 37F dataset.
Figure 6
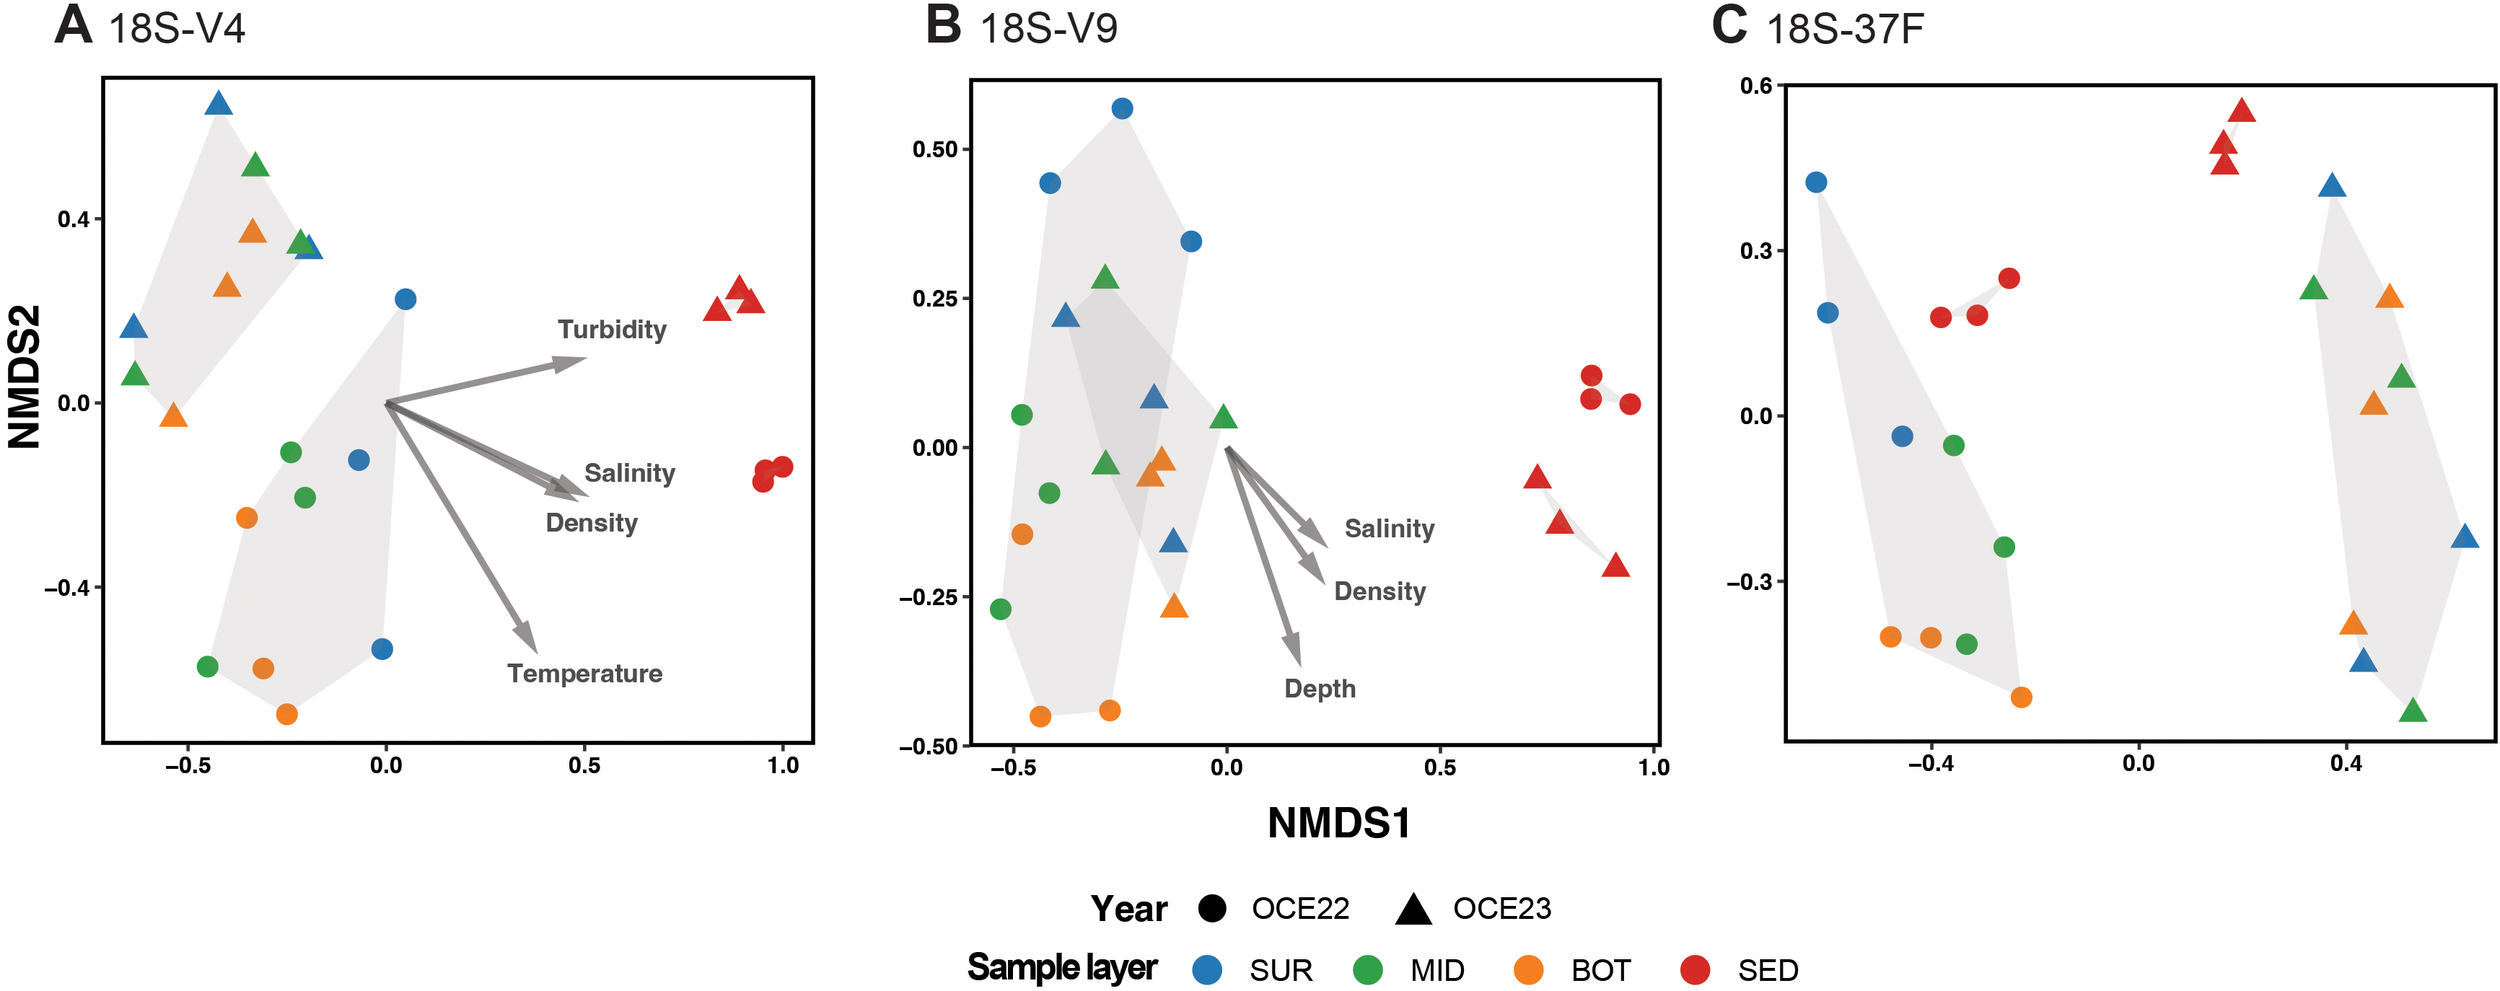
Non-metric multidimensional scaling plots of eukaryotic communities based on Bray–Curtis similarity based on 18S-V4 (A), 18S-V9 (B), and 18S-37F (C). Stress values are indicated in the plots. Fitted vectors are overlain by using the envfit (p < 0.05).
3.5 Specialist taxa
The CLAM analysis revealed clear differences in eukaryotic composition based on two univeral markers between OCE22 and OCE23, which classified most of the ASVs as specialists (Figures 7A, B). In both V4 and V9, the proportion of specialist ASVs was higher in OCE22 than in OCE23, respectively. Most specialist ASVs were assigned to Dinoflagellata, Cercozoa, and Ciliophora (Figures S2, S3). In terms of read abundance, the specialist ASVs in OCE22 were primarily composed of Dinoflagellata and Ciliophora, Arthropoda, and Mediophyceae, whereas in OCE23, it was dominated by Arthropoda. In the 37F dataset, the CLAM analysis was applied to assess the distribution of ASVs across different sample types, aiming to identify taxa that were specialists for specific environments (Figure 7C). As expected, a higher proportion of ASVs, mainly unasigned sequences, were classified as sediment specialists compared to water specialists. Several ASVs, particularly monothalamids, were identified as water specialists with notably high relative abundances, including members of Clade D (Supplementary Figure S4).
Figure 7
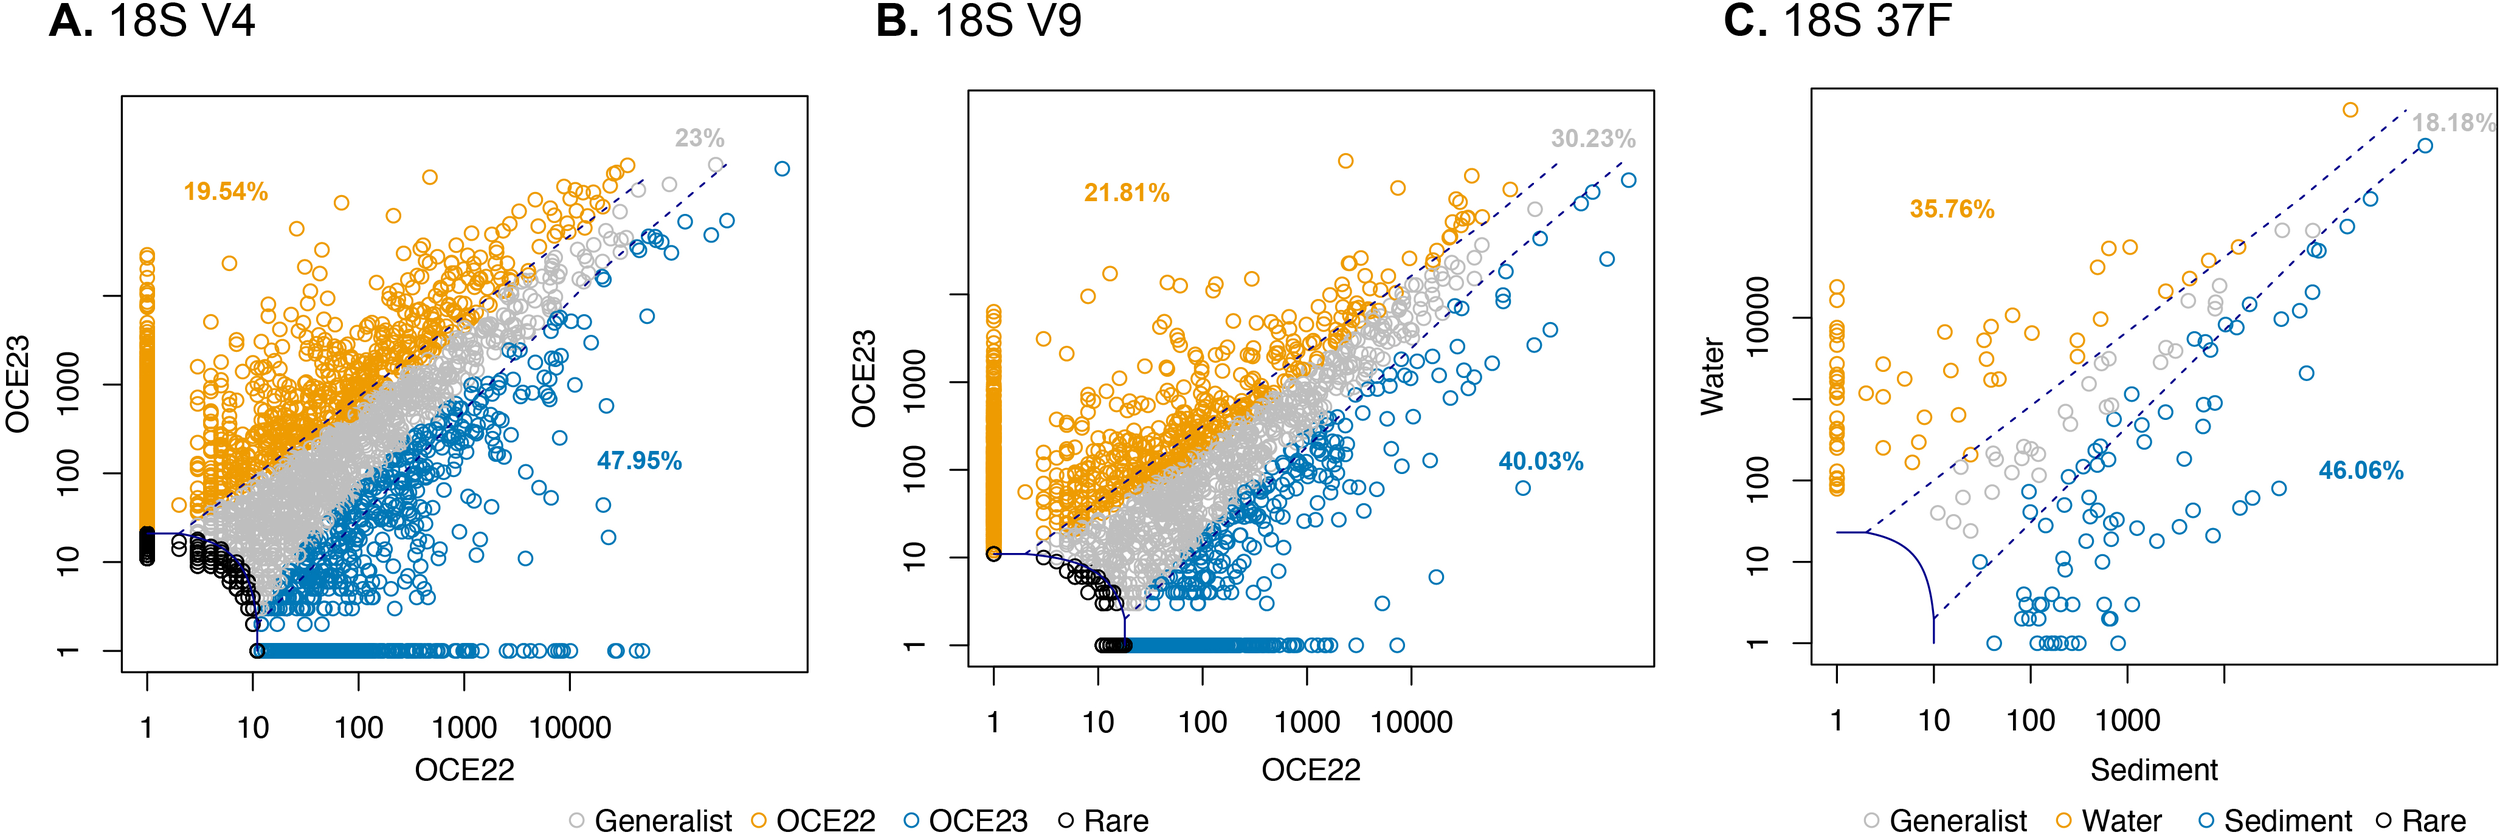
CLAM test results classifying specialist ASVs in eukaryotic communities of OCE22 and OCE23 campaigns, i.e., for 18S-V4 (A) and 18S-V9 (B), and foraminiferal communities of water and sediment samples (C). Summary plot generated by the CLAM test in vegan, showing generalists, specialists, and rare taxa between two conditions tested (i.e., OCE22 vs. OCE23 and water vs. sediments).
5 Discussion
Our study is one of the first attempts to assess eukaryotic diversity in the Gulf of Gdańsk using eDNA metabarcoding. Micro- and meio-eukaryotic biodiversity in the Baltic Sea has largely been studied using light and electron microscopy (Wasmund et al., 2008; Kownacka et al., 2013; Kotwicki et al., 2016). However, these morphology-based methods often focus on selected taxa and overlook many inconspicuous eukaryotic groups. They also fail to detect cryptic diversity and offer limited taxonomic resolution. Despite their ecological importance, comprehensive data on eukaryotic biodiversity remain scarce for the Baltic Sea region (Mazur-Marzec et al., 2024). Although eDNA metabarcoding is increasingly recognized as a powerful tool for biodiversity assessment in aquatic ecosystems, its application in the southern Baltic Sea remains relatively limited (Piwosz et al., 2018; Sachs et al., 2023).
By using the multimarker metabarcoding approach, we completed the inventory of Gulf of Gdańsk eukaryotic biodiversity, as inferred using traditional methods. We selected two universal 18S eukaryotic markers, which are widely used in the marine environment (De Vargas et al., 2015; Cordier et al., 2022; Nguyen et al., 2024; Pierella Karlusich et al., 2025) and for which a comprehensive reference database is available (Guillou et al., 2013). We also used a foraminifera-specific 18S marker, which is a standard foraminiferal DNA barcode, commonly used in metabarcoding studies (Pawlowski et al., 2014; Nguyen et al., 2023b; Barrenechea Angeles et al., 2024), for which an extensive reference database is also available (Holzmann et al., 2024). Analysis of these three markers showed taxonomic composition and general patterns of alpha and beta diversity similar to other metabarcoding studies of European coastal waters (López-Escardó et al., 2018), with some particularities related to the unique environmental character of the Baltic Sea (Ojaveer et al., 2010; Piwosz et al., 2018).
The most striking result of our study is the high level of cryptic diversity revealed by both universal and taxon-specific eukaryotic markers. This result is particularly surprising in the case of V4 and V9 markers, which show a high number of ASVs (23% in the V4 dataset and 33% in the V9 dataset) remaining unassigned at 90% similarity. The length and the variability level of the markers can explain the difference between the number of unassigned ASVs. The greater length of the V4 marker offers enhanced capacity to capture true biological variation and deeper taxonomic resolution, while the shorter V9 marker typically produces higher sequencing depth and may recover more overall, especially rare lineages, even if each is identified at a higher taxonomic rank (Choi and Park, 2020; Stuart et al., 2024; Pierella Karlusich et al., 2025).
In addition to this high proportion of ASVs unassigned at 90% similarity, we also found several groups of eukaryotes represented by poorly identified ASVs. In fact, only the planktonic algal groups such as diatoms, chlorophytes, and chrysophytes are well identified, reflecting a good knowledge of their taxonomy and comprehensive reference databases (Guillou et al., 2013). For example, among diatom assigned sequences we have found several genera and species, which presence in the Gulf of Gdańsk was reported previously (Pniewski et al., 2010; Piwosz et al., 2018). In other eukaryotic groups, less than 50% of ASVs are identified at more than 95% similarity. Among these groups, the less well identified were Cercozoa, Chytridiomycota and Rozeliomycota fungi, stramenopile Sagenista (mainly labyrinthulids), and Perkinsea. Some of these groups occur in benthic environments, and their taxonomic knowledge is limited compared to the planktonic taxa; others are parasites, which are more difficult to isolate and properly identify. More surprising was the presence of nematodes among the poorly assigned groups. Nematodes are relatively well studied in the Southern Baltic Sea (Urban-Malinga, 2015; Kotwicki et al., 2016), although clearly not at the genetic level.
Our study also demonstrates low diversity and poor taxonomic assignment in the case of benthic foraminifera. Metabarcoding data are consistent with previous surveys reporting sparse and low-density foraminiferal communities in Baltic sediments (Brodniewicz, 1965; Ponomarenko and Krechik, 2018; Ponomarenko et al., 2020; Jernas, 2024). Commonly studied hard-shelled (calcareous or agglutinated) taxa are represented in our dataset by only 17 ASVs. Among them, a few ASVs are assigned to the genus Ammonia, which has been recently reported from the Gulf of Gdańsk (Szymańska et al., 2025). The other ASVs correspond to the genera, which have not been found in microscopic surveys. These results confirm the previous studies showing that the unique environmental conditions of the Baltic Sea, particularly its low salinity, profoundly limit the richness of hard-shelled benthic foraminifera (Brodniewicz, 1965). Both abundance and species richness decline with decreasing salinity, along a coastal transect from the Skagerrak (∼35 psu) into the Baltic Sea (⪅14 psu), and foraminiferal densities and richness dropped steadily with salinity (Charrieau et al., 2018).
In metabarcoding data, the Gulf of Gdańsk foraminiferal community is dominated by soft-walled monothamid taxa, characterized by fragile tests and indistinctive morphology (Majewski et al., 2005; Holzmann et al., 2022). This group is largely overlooked in traditional morphology-based surveys of foraminifera (Holzmann et al., 2022), but it is usually very abundant in metabarcoding datasets (Lecroq et al., 2011; Lejzerowicz et al., 2014; Nguyen et al., 2023b). The high relative abundance of monothalamous foraminifera in the Gulf of Gdańsk suggests their tolerance to the environmental stress caused by the river outflow, in particular to the induced conditions of low salinity concentrations. Most importantly, none of the monothalamous ASVs identified in our data could be classified at the genus or species level. These results highlight the hidden diversity of monothalamous foraminifera in the Gulf of Gdańsk and indicate the need for extensive integrated taxonomic efforts to describe this diversity.
The unassigned eukaryotic ASVs present significant challenges for ecological and taxonomic research. Yet, they also represent a key source of hidden biodiversity and warrant careful consideration. Some of them may indicate potentially novel or region-specific lineages of interest (Choi and Park, 2020; Ewers et al., 2023). Although their classification based on ultra-short nucleotide sequence is sometimes challenging (Ganser et al., 2022), integrating them with environmental metadata or exploring their co-occurrence with assigned taxa can provide insights into ecological roles and habitat associations (Barrenechea Angeles et al., 2024). Even when taxonomically unassigned, these ASVs can be included in diversity and community analyses to capture overall patterns of ecosystem structure (Cordier et al., 2022).
In our study, we include unassigned ASVs in the analysis of alpha and beta diversity in water and sediment samples during two campaigns. The alpha diversity of both V4 and V9 markers confirmed that eukaryotic diversity in sediments is distinct and substantially higher than that of the water column (Cordier et al., 2022; Nguyen et al., 2024). This pattern likely reflects the accumulation of sinking organic material and resting stages of various taxa in sediments, leading to a more complex and stable benthic community structure. Additionally, differences in environmental conditions such as oxygen availability, microbial activity, and the persistence of extracellular DNA may further contribute to the distinct eukaryotic assemblages observed between sediments and the water column, see review in Nguyen et al. (2023a). Interestingly, this distinction is also visible in the number of unassigned ASVs, whose proportion increases in sediment compared to water samples. The same trend is observed in the analysis of relative abundance, with a much higher number of unassigned reads in the sediment compared to the surface and mid-layer water samples. This is possibly due to more complete barcoding data on planktonic eukaryotes compared to the benthic community. A similar increase in alpha diversity is observed in the foraminiferal data, but to a much lesser degree, which could be due to the presence of foraminiferal propagules transported by water samples (Alve and Goldstein, 2003; 2010) as well as the ability of benthic foraminifera to be dispersed with water currents (Nguyen et al., 2026).
The beta diversity of eukaryotic communities supports previous findings that sediment samples often exhibit high spatial heterogeneity in species composition within a single station (Nguyen et al., 2024). At the same time, water-derived eDNA typically reflects a more homogenized community due to the mixing of water. However, distinct community patterns in water samples could still be detected when using the V4 region. In terms of taxonomic composition, the results likely show a temporal change in different blooming stages, with phytoplankton (diatoms and dinoflagellates) dominating during the early bloom phase (Sildever et al., 2021), followed by arthropods becoming more prominent. However, abundance patterns must be interpreted with caution due to potential biases in eDNA signal strength and taxon-specific detection efficiency. In our study, dinoflagellates dominated in molecular dataset, possibly due to higher number of 18S gene copies, compared to diatoms, which dominated in traditional counts (Martin et al., 2022; Wang et al., 2024).
This illustrates that eDNA surveys often reveal hidden or cryptic bloom taxa and that using multiple 18S markers can capture different genera. It also comfirms that eDNA metabarcoding can track temporal shifts in plankton community composition, including bloom events, although it requires further fine-scale studies to improve its reliability and ecological interpretation. Combined with efforts to improve reference databases, we expect that this and other eDNA metabarcoding studies will help closing the biodiversity gap and contribute to better monitoring and converving the unique ecosystem of the southern Baltic Sea.
6 Conclusion
This study provides the first 18S rRNA metabarcoding data on community composition and diversity of benthic and pelagic eukaryotes in the southern Baltic Sea. Our results show that benthic habitats harbor significantly higher eukaryotic diversity than the water column, likely due to greater spatial heterogeneity. Shift patterns revealed a clear ecological dynamic, with phytoplankton and arthropods alternately dominating the water column across different sampling times. These results also reveal significant gaps in our taxonomic knowledge on micro- and meio-eukaryotic biodiversity. Numerous ASVs remain unassigned, particularly in the sediment samples, emphasizing the need for more taxonomic efforts targeting the diversity of benthic communities. As demonstrated by our study, integrating molecular tools with ecological context and traditional observations remains essential for robust biodiversity assessments in dynamic coastal systems such as the southern Baltic Sea.
Statements
Data availability statement
The raw reads of rRNA amplicon sequencing have been deposited in the NCBI Short Read Archive (SRA) database under Bioproject accession no. PRJNA1291696.
Author contributions
N-LN: Conceptualization, Data curation, Formal Analysis, Investigation, Methodology, Visualization, Writing – original draft, Writing – review & editing. DD: Investigation, Methodology, Visualization, Writing – review & editing. NS: Investigation, Methodology, Writing – review & editing. JF: Investigation, Methodology, Writing – review & editing. MB: Investigation, Methodology, Writing – review & editing. MZ: Conceptualization, Investigation, Methodology, Resources, Supervision, Validation, Writing – review & editing. JaP: Conceptualization, Funding acquisition, Investigation, Methodology, Project administration, Resources, Supervision, Writing – original draft, Writing – review & editing. JoP: Conceptualization, Data curation, Funding acquisition, Investigation, Methodology, Project administration, Resources, Supervision, Writing – original draft, Writing – review & editing.
Funding
The author(s) declared that financial support was received for this work and/or its publication. The research was financially supported by the National Science Centre (NCN) in Poland through project 2024/53/B/ST10/03361. N-LN was supported by NCN through project 2023/49/N/ST10/01626, and DD was supported by NCN through project 2024/53/N/ST10/02876.
Acknowledgments
The authors thank the scientific team and the crew of R/V Oceania for their help in collecting samples. NGS was performed thanks to the Genomics Core Facility CeNT UW (RRID: SCR_022718), using NovaSeq 6000 platform financed by Polish Ministry of Science and Higher Education (Decision No. 6817/IA/SP/2018 of 2018-04-10).
Conflict of interest
The author(s) declared that this work was conducted in the absence of any commercial or financial relationships that could be construed as a potential conflict of interest.
Generative AI statement
The author(s) declared that generative AI was not used in the creation of this manuscript.
Any alternative text (alt text) provided alongside figures in this article has been generated by Frontiers with the support of artificial intelligence and reasonable efforts have been made to ensure accuracy, including review by the authors wherever possible. If you identify any issues, please contact us.
Publisher’s note
All claims expressed in this article are solely those of the authors and do not necessarily represent those of their affiliated organizations, or those of the publisher, the editors and the reviewers. Any product that may be evaluated in this article, or claim that may be made by its manufacturer, is not guaranteed or endorsed by the publisher.
Supplementary material
The Supplementary Material for this article can be found online at: https://www.frontiersin.org/articles/10.3389/fmars.2025.1695900/full#supplementary-material
References
1
Altermatt F. Couton M. Carraro L. Keck F. Lawson-Handley L. Leese F. et al . (2025). Utilizing aquatic environmental DNA to address global biodiversity targets. Nat. Rev. Biodivers.1, 332–346. doi: 10.1038/s44358-025-00044-x
2
Alve E. Goldstein S. T. (2003). Propagule transport as a key method of dispersal in benthic foraminifera (Protista). Limnol. Oceanogr.48, 2163–2170. doi: 10.4319/lo.2003.48.6.2163
3
Alve E. Goldstein S. T. (2010). Dispersal, survival and delayed growth of benthic foraminiferal propagules. J. Sea Res.63, 36–51. doi: 10.1016/j.seares.2009.09.003
4
Amaral-Zettler L. A. Mccliment E. A. Ducklow H. W. Huse S. M. (2009). A method for studying protistan diversity using massively parallel sequencing of V9 hypervariable regions of small-subunit ribosomal RNA genes. PloS One4, e6372. doi: 10.1371/journal.pone.0006372
5
Andersen J. H. Carstensen J. Conley D. J. Dromph K. Fleming-Lehtinen V. Gustafsson B. G. et al . (2017). Long-term temporal and spatial trends in eutrophication status of the Baltic Sea. Biol. Rev.92, 135–149. doi: 10.1111/brv.12221
6
Bailet B. Apothéloz-Perret-Gentil L. Baričević A. Chonova T. Franc A. Frigerio J.-M. et al . (2020). Diatom DNA metabarcoding for ecological assessment: Comparison among bioinformatics pipelines used in six European countries reveals the need for standardization. Sci. Total Environ.745, 140948. doi: 10.1016/j.scitotenv.2020.140948
7
Barrenechea Angeles I. Nguyen N.-L. Greco M. Tan K. S. Pawlowski J. (2024). Assigning the unassigned: A signature-based classification of rDNA metabarcodes reveals new deep-sea diversity. PloS One19, e0298440. doi: 10.1371/journal.pone.0298440
8
Beentjes K. K. Speksnijder A. G. C. L. Schilthuizen M. Hoogeveen M. Pastoor R. Van Der Hoorn B. B. et al . (2019). Increased performance of DNA metabarcoding of macroinvertebrates by taxonomic sorting. PloS One14, e0226527. doi: 10.1371/journal.pone.0226527
9
Brodniewicz I. (1965). Recent and some Holocene Foraminifera of the southern Baltic Sea. Acta Palaeontologica Polonica10, 131–226.
10
Broman E. Raymond C. Sommer C. Gunnarsson J. S. Creer S. Nascimento F. J. A. et al . (2019). Salinity drives meiofaunal community structure dynamics across the Baltic ecosystem. Mol. Ecol.28, 3813–3829. doi: 10.1111/mec.15179
11
Bunse C. Bertos-Fortis M. Sassenhagen I. Sildever S. Sjöqvist C. Godhe A. et al . (2016). Spatio-temporal interdependence of bacteria and phytoplankton during a baltic sea spring bloom. Front. Microbiol.7. doi: 10.3389/fmicb.2016.00517
12
Callahan B. J. Wong J. Heiner C. Oh S. Theriot C. M. Gulati A. S. et al . (2019). High-throughput amplicon sequencing of the full-length 16S rRNA gene with single-nucleotide resolution. Nucleic Acids Res.47, e103–e103. doi: 10.1093/nar/gkz569
13
Charrieau L. M. Filipsson H. L. Ljung K. Chierici M. Knudsen K. L. Kritzberg E. et al . (2018). The effects of multiple stressors on the distribution of coastal benthic foraminifera: A case study from the Skagerrak-Baltic Sea region. Mar. Micropaleontol.139, 42–56. doi: 10.1016/j.marmicro.2017.11.004
14
Chazdon R. L. Chao A. Colwell R. K. Lin S.-Y. Norden N. Letcher S. G. et al . (2011). A novel statistical method for classifying habitat generalists and specialists. Ecology92, 1332–1343. doi: 10.1890/10-1345.1
15
Choi J. Park J. S. (2020). Comparative analyses of the V4 and V9 regions of 18S rDNA for the extant eukaryotic community using the Illumina platform. Sci. Rep.10, 6519. doi: 10.1038/s41598-020-63561-z
16
Cordier T. Angeles I. B. Henry N. Lejzerowicz F. Berney C. Morard R. et al . (2022). Patterns of eukaryotic diversity from the surface to the deep-ocean sediment. Sci. Adv.8, eabj9309. doi: 10.1126/sciadv.abj9309
17
Cyberski J. GrzeŚ M. Gutry-Korycka M. Nachlik E. Kundzewicz Z. W. (2010). History of floods on the river vistula. Hydrol. Sci. J.51, 799–817. doi: 10.1623/hysj.51.5.799
18
De Vargas C. Audic S. Henry N. Decelle J. Mahé F. Logares R. et al . (2015). Eukaryotic plankton diversity in the sunlit ocean. Science348, 1261605. doi: 10.1126/science.1261605
19
Dippner J. W. Kornilovs G. Sidrevics L. (2000). Long-term variability of mesozooplankton in the Central Baltic Sea. J. Mar. Syst.25, 23–31. doi: 10.1016/S0924-7963(00)00006-3
20
Dufresne Y. Lejzerowicz F. Perret-Gentil L. A. Pawlowski J. Cordier T. (2019). SLIM: a flexible web application for the reproducible processing of environmental DNA metabarcoding data. BMC Bioinform.20, 88. doi: 10.1186/s12859-019-2663-2
21
Esling P. Lejzerowicz F. Pawlowski J. (2015). Accurate multiplexing and filtering for high-throughput amplicon-sequencing. Nucleic Acids Res.43, 2513–2524. doi: 10.1093/nar/gkv107
22
Ewers I. Rajter L. Czech L. Mahé F. Stamatakis A. Dunthorn M. et al . (2023). Interpreting phylogenetic placements for taxonomic assignment of environmental DNA. J. Eukaryotic Microbiol.70, e12990. doi: 10.1111/jeu.12990
23
Fonseca V. G. Kirse A. Giebner H. Vause B. J. Drago T. Power D. M. et al . (2022). Metabarcoding the Antarctic Peninsula biodiversity using a multi-gene approach. ISME Commun.2, 37. doi: 10.1038/s43705-022-00118-3
24
Ganser M. H. Santoferrara L. F. Agatha S. (2022). Molecular signature characters complement taxonomic diagnoses: A bioinformatic approach exemplified by ciliated protists (Ciliophora, Oligotrichea). Mol. Phylogenet. Evol.170, 107433. doi: 10.1016/j.ympev.2022.107433
25
Guillou L. Bachar D. Audic S. Bass D. Berney C. Bittner L. et al . (2013). The Protist Ribosomal Reference database (PR2): a catalog of unicellular eukaryote small sub-unit rRNA sequences with curated taxonomy. Nucleic Acids Res.41, D597–D604. doi: 10.1093/nar/gks1160
26
Herlemann D. P. R. Labrenz M. Jürgens K. Bertilsson S. Waniek J. J. Andersson A. F. et al . (2011). Transitions in bacterial communities along the 2000 km salinity gradient of the Baltic Sea. ISME J.5, 1571–1579. doi: 10.1038/ismej.2011.41
27
Holzmann M. Gooday A. J. Majewski W. Pawlowski J. (2022). Molecular and morphological diversity of monothalamous foraminifera from South Georgia and the Falkland Islands: Description of four new species. Eur. J. Protistol.85, 125909. doi: 10.1016/j.ejop.2022.125909
28
Holzmann M. Nguyen N.-L. Angeles I. B. Pawlowski J. (2024). BFR2: a curated ribosomal reference dataset for benthic foraminifera. Sci. Data11, 1292. doi: 10.1038/s41597-024-04137-8
29
Jernas P. (2024). “ Benthic foraminifera in the surface sediments of the southern Baltic Sea-paleoenvironmental proxy perspectives,” in EGU General Assembly Conference Abstracts, Vienna, Austria. 12019. doi: 10.5194/egusphere-egu24-12019
30
Johannesson K. Smolarz K. Grahn M. André C. (2011). The future of baltic sea populations: local extinction or evolutionary rescue? AMBIO40, 179–190. doi: 10.1007/s13280-010-0129-x
31
Kezlya E. Tseplik N. Kulikovskiy M. (2023). Genetic markers for metabarcoding of freshwater microalgae: review. Biology12, 1038. doi: 10.3390/biology12071038
32
Kotwicki L. Grzelak K. Bełdowski J. (2016). Benthic communities in chemical munitions dumping site areas within the Baltic deeps with special focus on nematodes. Deep-Sea Res. II: Top. Stud. Oceanogr.128, 123–130. doi: 10.1016/j.dsr2.2015.12.012
33
Kownacka J. Edler L. Gromisz S. Łotocka M. Olenina I. Ostrowska M. et al . (2013). Non-indigenous species Chaetoceros cf. lorenzianus Grunow 1863 – A new, predominant component of autumn phytoplankton in the southern Baltic Sea. Estuar. Coast. Shelf Sci.119, 101–111. doi: 10.1016/j.ecss.2013.01.010
34
Kruk-Dowgiałło L. Szaniawska A. (2008). “ Gulf of Gdańsk and Puck Bay”, in Ecology of baltic coastal waters (Berlin, Heidelberg: Springer), 139–165. doi: 10.1007/978-3-540-73524-3_7
35
Lecroq B. Lejzerowicz F. Bachar D. Christen R. Esling P. Baerlocher L. et al . (2011). Ultra-deep sequencing of foraminiferal microbarcodes unveils hidden richness of early monothalamous lineages in deep-sea sediments. Proc. Natl. Acad. Sci. U. S. A.108, 13177–13182. doi: 10.1073/pnas.1018426108
36
Lejzerowicz F. Esling P. Pawlowski J. (2014). Patchiness of deep-sea benthic Foraminifera across the Southern Ocean: Insights from high-throughput DNA sequencing. Deep-Sea Res. II: Top. Stud. Oceanogr.108, 17–26. doi: 10.1016/j.dsr2.2014.07.018
37
López-Escardó D. Paps J. De Vargas C. Massana R. Ruiz-Trillo I. Del Campo J. (2018). Metabarcoding analysis on European coastal samples reveals new molecular metazoan diversity. Sci. Rep.8, 9106. doi: 10.1038/s41598-018-27509-8
38
Majaneva M. Rintala J.-M. Piisilä M. Fewer D. P. Blomster J. (2012). Comparison of wintertime eukaryotic community from sea ice and open water in the Baltic Sea, based on sequencing of the 18S rRNA gene. Polar Biol.35, 875–889. doi: 10.1007/s00300-011-1132-9
39
Majewski A. (1994). “ Natural evironmental conditions of the Gulf of Gdańsk and its surroundings,” in Pollution Renewal of the Gulf of Gdank, Gdańsk: Gdańsk University33–42.
40
Majewski W. Pawlowski J. Zajączkowski M. (2005). Monothalamous foraminifera from West Spitsbergen fjords, Svalbard: A brief overview. Pol. Polar Res.26, 269–285.
41
Martin J. L. Santi I. Pitta P. John U. Gypens N. (2022). Towards quantitative metabarcoding of eukaryotic plankton: an approach to improve 18S rRNA gene copy number bias. Metabarcoding Metagenom.6, e85794. doi: 10.3897/mbmg.6.85794
42
Mazur-Marzec H. Żeglińska L. Pliński M. (2005). The effect of salinity on the growth, toxin production, and morphology of Nodularia spumigena isolated from the Gulf of Gdańsk, southern Baltic Sea. JJ. Appl. Phycol.17, 171–179. doi: 10.1007/s10811-005-5767-1
43
Mazur-Marzec H. Andersson A. F. Błaszczyk A. Dąbek P. Górecka E. Grabski M. et al . (2024). Biodiversity of microorganisms in the Baltic Sea: the power of novel methods in the identification of marine microbes. FEMS Microbiol. Ecol.48, fuae024. doi: 10.1093/femsre/fuae024
44
Mcknight D. T. Huerlimann R. Bower D. S. Schwarzkopf L. Alford R. A. Zenger K. R. (2019). microDecon: A highly accurate read-subtraction tool for the post-sequencing removal of contamination in metabarcoding studies. Environ. DNA1, 14–25. doi: 10.1002/edn3.11
45
Morard R. Darling K. F. Weiner A. K. M. Hassenrück C. Vanni C. Cordier T. et al . (2024). The global genetic diversity of planktonic foraminifera reveals the structure of cryptic speciation in plankton. Biol. Rev.99, 1218–1241. doi: 10.1111/brv.13065
46
Nguyen N.-L. Devendra D. Szymańska N. Greco M. Angeles I. B. Weiner A. K. M. et al . (2023a). Sedimentary ancient DNA: a new paleogenomic tool for reconstructing the history of marine ecosystems. Front. Mar. Sci.10. doi: 10.3389/fmars.2023.1185435
47
Nguyen N.-L. Pawłowska J. Angeles I. B. Zajaczkowski M. Pawłowski J. (2023b). Metabarcoding reveals high diversity of benthic foraminifera linked to water masses circulation at coastal Svalbard. Geobiology21, 133–150. doi: 10.1111/gbi.12530
48
Nguyen N.-L. Pawłowska J. Szymańska N. Zajaczkowski M. Weiner A. K. M. De Schepper S. et al . (2026). Assessing the passive dispersal of benthic foraminifera through environmental DNA. Limnol. Oceanogr.71, e70294. doi: 10.1002/lno.70294
49
Nguyen N.-L. Pawłowska J. Zajaczkowski M. Weiner A. Cordier T. Grant D. et al . (2024). Taxonomic and abundance biases affect the record of marine eukaryotic plankton communities in sediment DNA archives. Mol. Ecol. Resour.24, e14014. doi: 10.1111/1755-0998.14014
50
Ojaveer H. Jaanus A. Mackenzie B. R. Martin G. Olenin S. Radziejewska T. et al . (2010). Status of biodiversity in the baltic sea. PloS One5, e12467. doi: 10.1371/journal.pone.0012467
51
Oksanen J. Blanchet F. G. Friendly M. Kindt R. Legendre P. Mcglinn D. et al . (2019). Package ‘vegan’. Community ecology package, version 2 2. doi: 10.32614/CRAN.package.vegan
52
Österblom H. Hansson S. Larsson U. Hjerne O. Wulff F. Elmgren R. et al . (2007). Human-induced trophic cascades and ecological regime shifts in the baltic sea. Ecosystems10, 877–889. doi: 10.1007/s10021-007-9069-0
53
Paulson J. N. Stine O. C. Bravo H. C. Pop M. (2013). Differential abundance analysis for microbial marker-gene surveys. Nat. Methods10, 1200–1202. doi: 10.1038/nmeth.2658
54
Pawlowski J. Bonin A. Boyer F. Cordier T. Taberlet P. (2021). Environmental DNA for biomonitoring. Mol. Ecol.30, 2931–2936. doi: 10.1111/mec.16023
55
Pawlowski J. Bruce K. Panksep K. Aguirre F. I. Amalfitano S. Apothéloz-Perret-Gentil L. et al . (2022). Environmental DNA metabarcoding for benthic monitoring: A review of sediment sampling and DNA extraction methods. Sci. Total Environ.818, 151783. doi: 10.1016/j.scitotenv.2021.151783
56
Pawlowski J. Lecroq B. (2010). Short rDNA barcodes for species identification in foraminifera. J. Eukaryot. Microbiol.57, 197–205. doi: 10.1111/j.1550-7408.2009.00468.x
57
Pawlowski J. Lejzerowicz F. Esling P. (2014). Next-generation environmental diversity surveys of foraminifera: preparing the future. Biol. Bull.227, 93–106. doi: 10.1086/BBLv227n2p93
58
Pierella Karlusich J. J. Cosnier K. Zinger L. Henry N. Nef C. Bernard G. et al . (2025). Patterns and drivers of diatom diversity and abundance in the global ocean. Nat. Commun.16, 3452. doi: 10.1038/s41467-025-58027-7
59
Pierella Karlusich J. J. Pelletier E. Zinger L. Lombard F. Zingone A. Colin S. et al . (2023). A robust approach to estimate relative phytoplankton cell abundances from metagenomes. Mol. Ecol. Resour.23, 16–40. doi: 10.1111/1755-0998.13592
60
Piredda R. Tomasino M. P. D’erchia A. M. Manzari C. Pesole G. Montresor M. et al . (2016). Diversity and temporal patterns of planktonic protist assemblages at a Mediterranean Long Term Ecological Research site. FEMS Microbiol. Ecol.93, fiw200. doi: 10.1093/femsec/fiw200
61
Piwosz K. Całkiewicz J. Gołębiewski M. Creer S. (2018). Diversity and community composition of pico- and nanoplanktonic protists in the Vistula River estuary (Gulf of Gdańsk, Baltic Sea). Estuar. Coast. Shelf Sci.207, 242–249. doi: 10.1016/j.ecss.2018.04.013
62
Pniewski F. Friedl T. Latała A. (2010). Identification of diatom isolates from the Gulf of Gdańsk: Testing of species identifications using morphology, 18S rDNA sequencing and DNA barcodes of strains from the Culture Collection of Baltic Algae (CCBA). Oceanological Hydrobiological Stud.39, 3–20. doi: 10.2478/v10009-010-0031-7
63
Ponomarenko E. Krechik V. (2018). Benthic foraminifera distribution in the modern sediments of the Southeastern Baltic Sea with respect to North Sea water inflows. Russ. J. Earth Sci.18, 1–7. doi: 10.2205/2018ES000632
64
Ponomarenko E. Krechik V. Dorokhova E. (2020). Environmental factors affecting recent benthic foraminiferal distribution in the south-eastern Baltic Sea. Baltica33, 58–70. doi: 10.5200/baltica.2020.1.6
65
Pruszak Z. Van Ninh P. Szmytkiewicz M. Hung N. M. Ostrowski R. (2005). Hydrology and morphology of two river mouth regions (temperate Vistula Delta and subtropical Red River Delta). Oceanologia47, 365–385.
66
Quast C. Pruesse E. Yilmaz P. Gerken J. Schweer T. Yarza P. et al . (2012). The SILVA ribosomal RNA gene database project: improved data processing and web-based tools. Nucleic Acids Res.41, D590–D596. doi: 10.1093/nar/gks1219
67
Reckermann M. Omstedt A. Soomere T. Aigars J. Akhtar N. Bełdowska M. et al . (2022). Human impacts and their interactions in the Baltic Sea region. Earth Syst. Dynam.13, 1–80. doi: 10.5194/esd-13-1-2022
68
Rimet F. Chaumeil P. Keck F. Kermarrec L. Vasselon V. Kahlert M. et al . (2016). R-Syst::diatom: an open-access and curated barcode database for diatoms and freshwater monitoring. Database2016, baw016. doi: 10.1093/database/baw016
69
Rognes T. Flouri T. Nichols B. Quince C. Mahé F. (2016). VSEARCH: a versatile open source tool for metagenomics. PeerJ4, e2584. doi: 10.7717/peerj.2584
70
Rojas-Jimenez K. Rieck A. Wurzbacher C. Jürgens K. Labrenz M. Grossart H.-P. (2019). A salinity threshold separating fungal communities in the baltic sea. Front. Microbiol.10. doi: 10.3389/fmicb.2019.00680
71
Sachs M. Dünn M. Arndt H. (2023). Benthic heterotrophic protist communities of the southern baltic analyzed with the help of curated metabarcoding studies. Biology12, 1010. doi: 10.3390/biology12071010
72
Salonen I. S. Chronopoulou P.-M. Leskinen E. Koho K. A. (2018). Metabarcoding successfully tracks temporal changes in eukaryotic communities in coastal sediments. FEMS Microbiol. Ecol.95, fiy226. doi: 10.1093/femsec/fiy226
73
Sildever S. Laas P. Kolesova N. Lips I. Lips U. Nagai S. (2021). Plankton biodiversity and species co-occurrence based on environmental DNA – a multiple marker study. Metabarcoding Metagenom.5, e72371. doi: 10.3897/mbmg.5.72371
74
Snoeijs-Leijonmalm P. Andrén E. (2017). “ Why is the Baltic Sea so special to live in?,” in Biological oceanography of the baltic sea. Eds. Snoeijs-LeijonmalmP.SchubertH.RadziejewskaT. ( Springer Netherlands, Dordrecht), 23–84. doi: 10.1007/978-94-007-0668-2_2
75
Stoeck T. Bass D. Nebel M. Christen R. Jones M. D. M. Breiner H.-W. et al . (2010). Multiple marker parallel tag environmental DNA sequencing reveals a highly complex eukaryotic community in marine anoxic water. Mol. Ecol.19, 21–31. doi: 10.1111/j.1365-294X.2009.04480.x
76
Stuart J. Ryan K. G. Pearman J. K. Thomson-Laing J. Hampton H. G. Smith K. F. (2024). A comparison of two gene regions for assessing community composition of eukaryotic marine microalgae from coastal ecosystems. Sci. Rep.14, 6442. doi: 10.1038/s41598-024-56993-4
77
Szymańska N. Devendra D. Nguyen N.-L. Holzmann M. Garbień A. Stachowiak M. et al . (2025). First record of the foraminiferal species Ammonia confertitesta in southeastern Baltic sea. Sci. Rep.15, 33562. doi: 10.1038/s41598-025-18578-7
78
Taberlet P. Coissac E. Pompanon F. Brochmann C. Willerslev E. (2012). Towards next-generation biodiversity assessment using DNA metabarcoding. Mol. Ecol.21, 2045–2050. doi: 10.1111/j.1365-294X.2012.05470.x
79
Thakur R. Collens A. B. Greco M. Sleith R. S. Grattepanche J.-D. Katz L. A. et al . (2022). Newly designed foraminifera primers identify habitat-specific lineages through metabarcoding analyses. J. Eukaryot. Microbiol.69, e12913. doi: 10.1111/jeu.12913
80
Urban-Malinga B. (2015). Biodiversity of meiobenthic free-living nematodes of the southern Baltic Sea – Preliminary results of the community composition and structure in sandy sediments of Puck Bay. Mar. Biol. Res.11, 887–892. doi: 10.1080/17451000.2015.1041530
81
Vasselon V. Bouchez A. Rimet F. Jacquet S. Trobajo R. Corniquel M. et al . (2018). Avoiding quantification bias in metabarcoding: Application of a cell biovolume correction factor in diatom molecular biomonitoring. Methods Ecol. Evol.9, 1060–1069. doi: 10.1111/2041-210X.12960
82
Vaulot D. Geisen S. Mahé F. Bass D. (2022). pr2-primers: An 18S rRNA primer database for protists. Mol. Ecol. Resour.22, 168–179. doi: 10.1111/1755-0998.13465
83
Wang C. Gu J. Li W. Wang J. Wang Z. Lin Q. et al . (2024). Metabarcoding reveals a high diversity and complex eukaryotic microalgal community in coastal waters of the northern Beibu Gulf, China. Front. Microbiol.15. doi: 10.3389/fmicb.2024.1403964
84
Wasmund N. Göbel J. Bodungen B. V. (2008). 100-years-changes in the phytoplankton community of Kiel Bight (Baltic Sea). J. Mar. Syst.73, 300–322. doi: 10.1016/j.jmarsys.2006.09.009
Summary
Keywords
18S rDNA, eDNA, eukaryotic diversity, Gulf of Gdańsk, metabarcoding
Citation
Nguyen N-L, Devendra D, Szymańska N, Falkowska J, Bernard MN, Zajączkowski M, Pawłowski J and Pawłowska J (2026) Multi-marker eDNA metabarcoding reveals significant eukaryotic biodiversity gaps in the Gulf of Gdańsk, Southeastern Baltic Sea. Front. Mar. Sci. 12:1695900. doi: 10.3389/fmars.2025.1695900
Received
30 August 2025
Revised
16 December 2025
Accepted
22 December 2025
Published
16 January 2026
Volume
12 - 2025
Edited by
Alexander Eiler, University of Oslo, Norway
Reviewed by
Alexandra Meziti, International Hellenic University, Greece
Jeeva Susan Abraham, Columbia University, United States
Updates
Copyright
© 2026 Nguyen, Devendra, Szymańska, Falkowska, Bernard, Zajączkowski, Pawłowski and Pawłowska.
This is an open-access article distributed under the terms of the Creative Commons Attribution License (CC BY). The use, distribution or reproduction in other forums is permitted, provided the original author(s) and the copyright owner(s) are credited and that the original publication in this journal is cited, in accordance with accepted academic practice. No use, distribution or reproduction is permitted which does not comply with these terms.
*Correspondence: Ngoc-Loi Nguyen, loinguyen@iopan.pl
Disclaimer
All claims expressed in this article are solely those of the authors and do not necessarily represent those of their affiliated organizations, or those of the publisher, the editors and the reviewers. Any product that may be evaluated in this article or claim that may be made by its manufacturer is not guaranteed or endorsed by the publisher.