Abstract
Population risk assessments are important tools for understanding the sustainability of shark populations and informing their conservation. In the Philippines, policy makers have made inroads to progress legislative protection for sharks in recent years, yet a ban on targeted shark fisheries has not guaranteed the sustainability of their populations and bycatch and illegal fishing still represent a significant threat to elasmobranchs across the archipelago. Pelagic thresher sharks (Alopias pelagicus) are important to the region’s tourism economy but little is known of the status of their populations. We designed, tested, and deployed a remote stereo camera system (stereocam) to survey pelagic thresher sharks in the Central Visayan Sea and investigated their population dynamics over a 4-month period from December 2019 to March 2020. The stereocam was effective and accurate in taking key morphometric measurements from in situ observations that we used to assess the maturity of individual male and female pelagic thresher sharks. We then constructed a continuous four-stage model from our demographic data and best life history parameter estimates to determine the sustainability of A. pelagicus populations in the region. Our model projections showed that pelagic thresher sharks in the Central Visayan Sea would be vulnerable to a hypothetical fishing mortality of 5.3% per annum, with the removal of 15–18 females resulting in a decline in the population. Our study represents the first attempt to characterise the demographics of pelagic thresher sharks with stereo videography and provides a framework for future non-invasive assessments of threatened pelagic species.
Introduction
The past five decades have seen significant declines in oceanic shark populations with an estimated 71% decrease in global abundances (Pacoureau et al., 2021; Dulvy et al., 2014). When challenged by pressure from fisheries, oceanic sharks are at high risk of extinction because they are slow growing, long lived and have long gestation periods that produce few offspring per litter (Booth et al., 2019; Adams et al., 2018; Liu et al., 2015; Dulvy et al., 2014). The pelagic thresher shark (Alopias pelagicus) is a particularly vulnerable species with relatively low productivity among its oceanic heterospecifics (Dulvy et al., 2008; Smith et al., 2008). Pelagic thresher sharks are listed under Annex II (Co17) of the Convention on International Trade in Endangered Species of Wild Fauna and Flora (CITES) due to their declining global populations and are classified as endangered by the International Union for Conservation of Nature’s (IUCN) Red List (Rigby et al., 2019). The primary cause for their decline in the Indo-Pacific is commercial fishing (Tsai and Huang, 2022; Tsai et al., 2010; Liu et al., 2006; Last and Compagno, 2002).
The Central Visayas of the Philippines are well known for pelagic thresher shark dive tourism where the sharks can be observed regularly at seamounts (Monad and Kimud shoals) and are an important socio-economic resource for the region (Oposa et al., 2016; Oliver, 2012). Oliver et al. (2019) showed that the daily movements of pelagic thresher sharks visiting Monad Shoal have a potential range that overlaps with five jurisdictional regions in which governance and enforcement vary according to local interest groups. Sardine fisheries operating in the Visayas often catch thresher sharks as bycatch, which adds uncertainty to the extent of their exploitation (Oliver et al., 2019, 2013). This knowledge gap is further confounded by a lack of species-specific fisheries-dependent data, which is a common issue in the Philippines, and one that presents a challenge for estimating stock abundances and total mortality rates.
A number of legislative measures have been introduced to reduce shark exploitation across the Philippines, which offer protection for pelagic thresher sharks. These include the Philippine Fisheries Code of 1998 (RA 8550) and its 2014 amendment (RA 10654), which prohibits the capture and trade of all CITES-listed species, and Senate Bill 525 (2019), which extends full protection to all sharks and rays nationwide. Although these policies represent substantial progress, inconsistent enforcement and the absence of species-specific catch data continue to hinder effective management of pelagic thresher sharks in the region, highlighting a need for independent, non-invasive monitoring approaches to better understand the demographic status of the species.
Demographic models have been used to assess data-deficient shark populations where both fisheries-dependent and fisheries-independent abundances for bycatch species have been unavailable (Tsai and Huang, 2022; Aires-da-Silva and Gallucci, 2007; Mollet and Cailliet, 2002; Cortés, 2002). These models make use of life history information (specifically fecundity, growth rates and survivorship) to estimate the intrinsic growth rate of populations (Mollet and Cailliet, 2002; Cortés, 2002, 1998). The use of stage-based models are understood to better represent the demographic differences within populations and avoid the amplification of errors in life history parameters from the application of life-history tables of long-lived species (Mollet and Cailliet, 2002; Cortés, 2002). Tsai et al. (2010) applied fishing mortality estimates derived from Taiwanese fisheries landing data to a stage-based demographic model on a regional pelagic thresher shark population to demonstrate that it was overexploited and concluded that continued unregulated fishing would not be sustainable.
The age of individual pelagic thresher sharks is categorised into life stages in stage-based models, which can be determined by length measurements (Liu et al., 1999). The conventional method for acquiring length measurements from sharks involves the catching and handling of wild animals, which can cause injury and induce physiological stress responses that impair their growth, feeding, and condition, and risk both at-vessel and post-release mortality (Talwar et al., 2017; Musyl et al., 2011; Brooks et al., 2011; Skomal, 2007, 2006; Cooke et al., 2002). A stereo camera system (hitherto referred to as stereocam) with appropriate software can provide a quick and accurate alternative platform for measuring distances between visible landmarks (Olsen et al., 2015; Shortis, 2015). In comparison to the conventional method of catching large sharks for morphometrics, stereocams are able to provide length measurements that are equally accurate (Delacy et al., 2017).
In this paper we assess the dynamics of a population of pelagic thresher sharks in the Central Visayan Sea from four months of remote video observations. We used a stereocam to non-invasively assimilate pre-caudal length (PCL) measurements of pelagic thresher sharks in situ and categorised thresher shark observations into four maturity classifications to quantify the impact that hypothetical increments of fishing mortality might have on population growth and vulnerability in the region. We discuss our findings in the context of conservation.
Methods
Location
Monad Shoal is a shallow coastal seamount situated in the Central Visayan Sea, eight kilometres east of Malapascua Island, Cebu, in the Philippines (N 11° 19’ 06.7”, E 124° 11’ 31.9”) (Oliver et al., 2023). The seamount rises 250 m from the sea floor to 15–25 m depths where it plateaus with a surface area of approximately 4.5 km2. Cleaner fish occupy stations along the mount’s southern fringe where they provide important parasite removal services that benefit thresher shark health and fitness (Oliver and Bicskos Kaszo, 2015; Cadwallader et al., 2015; Oliver et al., 2011). The predictable and repetitive occurrence of these interactions offered a unique opportunity to deploy a remote stereocam and monitor fluctuations in their population dynamics without catching them (Figure 1).
Figure 1
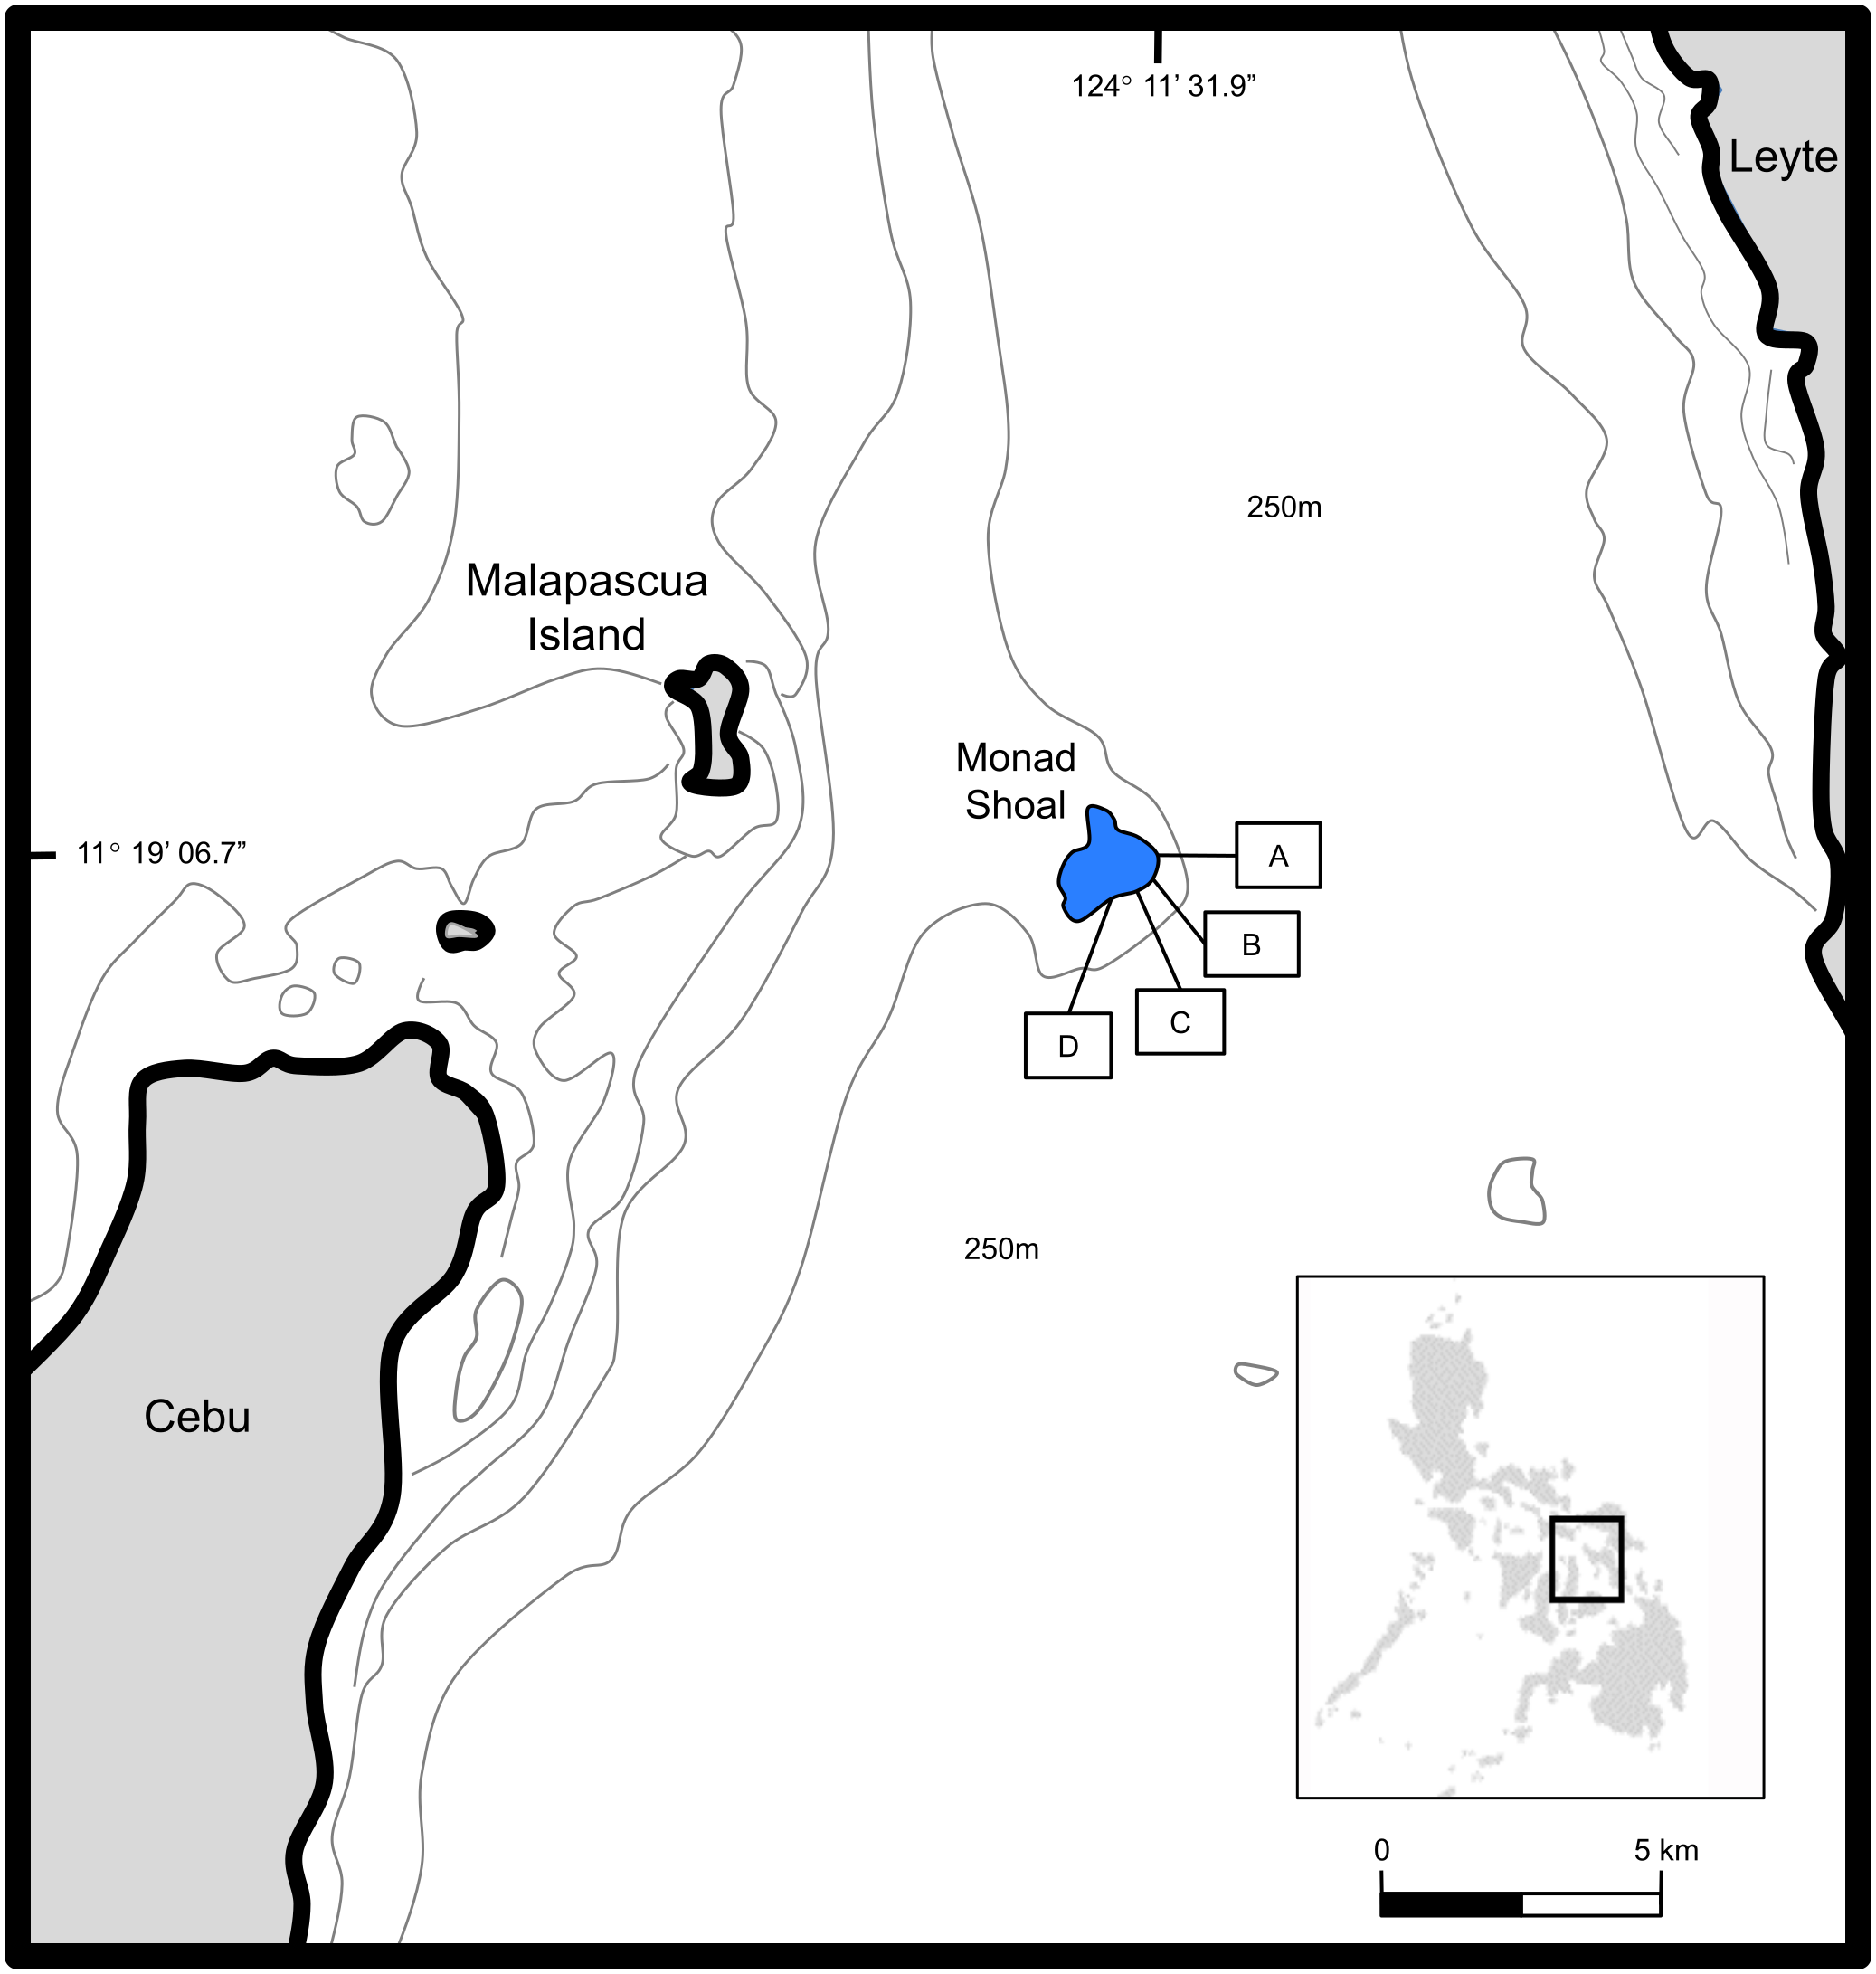
Map of Monad Shoal in the Central Visayan Sea of the Philippines, showing the study sites A-D (used by permission from Oliver et al., 2019).
Field observations
Optimal elasmobranch survey recording times vary depending on the species but most require a minimum standard of 60 continuous minutes (Jabado et al., 2021; Currey-Randall et al., 2020). We designed a stereocam that we tested and then randomly deployed at one of four survey sites on Monad Shoal between 0600 and 1000 hours (December 2019 - March 2020) when thresher shark sightings are known to be most frequent (Oliver et al., 2019, 2011). The four sites provide habitat for cleaning stations where thresher sharks could be best observed for collecting morphometric data. Thresher shark preferences for these cleaning stations (which are located some distance from each other) differed individually (Oliver et al., 2019) so we sampled the sites equally to capture observations along a 1.5 km ridge that crests the southeastern half of the seamount.
The stereocam consisted of two video cameras (GoPro® Hero 3+ Black) with a metal backplate that we mounted 800 mm apart on a metal frame with a convergence of 8 degrees (Delacy et al., 2017; Boutros et al., 2015). The metal frame was mounted on a PVC frame (supported and weighed down with internal rods) such that the pitch of the stereocam could be adjusted and locked without compromising the distance and convergence between the two cameras. Both cameras were identically configured to 1080p resolution, 30 fps with a narrow (~90 degrees) field of view to minimise distortion, and we used a light source to synchronise the cameras.
We positioned a 9x7 checkerboard with 100 mm squares at 50 different locations within the stereocam’s field of view to calibrate our length measurements to mm accuracy with the R package StereoMorph (Olsen and Haber, 2022) calibration function. We verified the calibration using a straight measuring stick that we held at increasing distances from the stereocam. Distances where the verification measurements deviated more than 20mm were noted and shark measurements at those distances were omitted from our analyses. We then used StereoMorph (Olsen and Haber, 2022) to derive point to point measurements of thresher shark precaudal (PCL) lengths from synchronised still frames of the video recordings (Olsen and Haber, 2022; Olsen et al., 2015). Observations of thresher sharks that were in close proximity and perpendicular to the stereocam’s axis of observation, and that exhibited minimal body curvature were prioritised when extracting still frames for length measurements (Figure 2). If the same individual shark was observed on multiple occasions, the measurements were taken from the best still frames based on the aforementioned prioritisations. Individual sharks were identified from the accuracy of our length measurements, by sex, and from unique ventral spot patterning features. Shark sex was determined by the presence or absence of claspers. We selected PCL measurements as our indicator of shark age and maturity since growth in thresher sharks is known to be continuous throughout their ontogeny (Tsai and Huang, 2022; Ebert et al., 2015; Tsai et al., 2010; Camhi et al., 2008; (Liu et al., 1999).
Figure 2
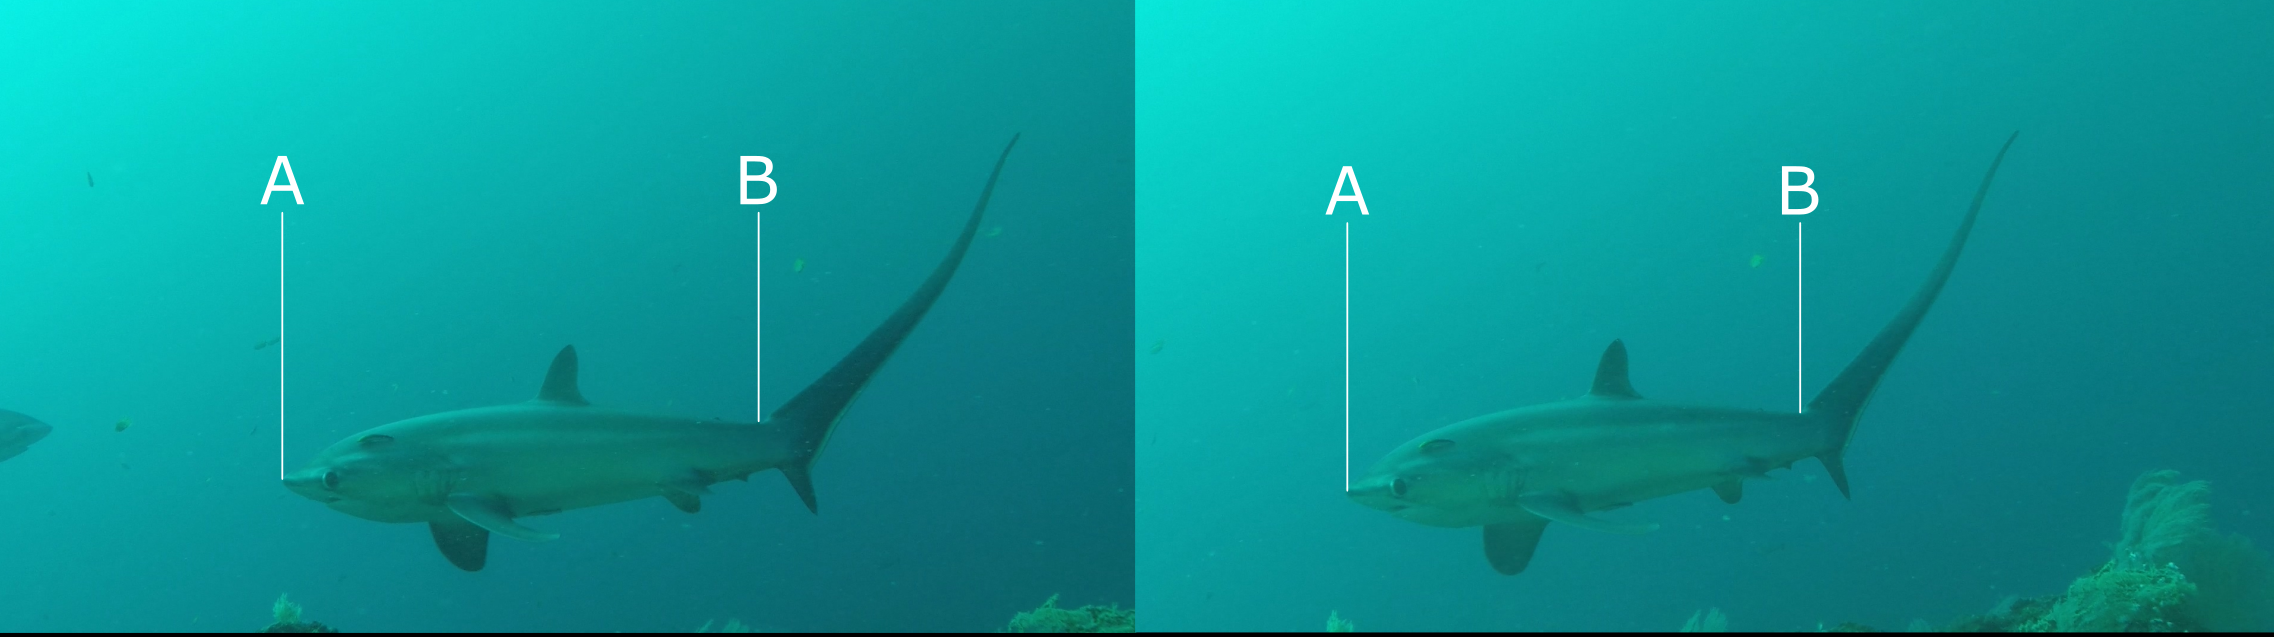
Example of the ideal positioning of a pelagic thresher shark when extracting still frames for PCL measurements. The StereoMorph (Olsen and Haber, 2022) command “digitizeimages” is equipped with a user interface that enables the placement of landmarks on synchronised still-images from stereo videography. Landmarks were placed on the tip of the rostrum (A) and the precaudal peduncle/pit (B). The precaudal length measurement was obtained by transforming two-dimensional image coordinates from landmark placements into three-dimensional coordinates using calibration data and calculations of the distance between the two points according to reconstructed three-dimensional spatial coordinates.
Analyses
All statistical tests employed R Studio (2024.04.2 + 764 “Chocolate Cosmos” Release) running R version 4.2.2.
Sex ratios and sampling effort
We used a two-way analysis of variance to test for differences in sampling effort across our study sites, and we used a chi-squared goodness of fit test to evaluate if the sex ratio of the thresher sharks that we observed (both overall and stage-specific) conformed to an expected 1:1 sex ratio from known embryonic development (Liu et al., 1999).
Life history parameters
The von Bertalanffy growth equation (VBGE) that we used for estimating PCL length at age was:
For estimating PCL at age for female pelagic thresher sharks we used:
where the asymptotic length at which growth is zero was , the growth rate was , and the theoretical age at size zero was (Liu et al., 1999).
We used the Chen and Watanabe (1989) method for estimating mortality for age-dependent survivorship as follows:
with senescence constants
and age at the end of reproductive span
Liu et al. (2006) reported an estimated longevity of 30 years for female pelagic thresher sharks with size at maturity (145.5 cm PCL) corresponding to an age of 8 years. We calculated mortality at each age and used the mean values for each corresponding stage (apart from neonates) and their respective standard deviations to generate stochasticity in the model (Tsai et al., 2010).
Model construction
Pelagic thresher sharks exhibit yearlong parturition, so we constructed a continuous four-stage Leslie-Lefkovitch model based on Caswell (2001) and Tsai et al. (2010) to project changes in the population over a timeframe that was equivalent to the lifespan of female pelagic thresher sharks (30 years) (Tsai et al., 2010; Liu et al., 2006; Mollet and Cailliet, 2002). The four stages were based on PCL and categorized as (1) neonate, (2) juvenile, (3) transitional, and (4) adult (Table 1). The projection matrix of life history parameters A is given as:
Table 1
| Stage class | Female sizing parameters (cm PCL) | Approximate age (years) | Stage duration (years) | Male sizing parameters (cm PCL) |
|---|---|---|---|---|
| Neonate | <103 | 0-1 | 1 | <97 |
| Juvenile | 103–136 | 1-6 | 5 | 97 - 134 |
| Transitional | 136–145 | 6-8 | 2 | 134 - 140 |
| Adult | 145< | 8-30 | 22 | 140< |
Sizing parameters for categorising pelagic thresher sharks into four stage classes based on Liu et al. (1999) and Tsai et al. (2010).
The approximate ages and durations of each stage class were used in the VBGE equations for calculating the life history parameters of the Leslie-Lefkovitch projection matrices.
Pi: Probability of surviving at age-class i and remaining in current age class at the next time interval was defined as:
Gi: Probability of surviving at age-class i and moving up to next age class at the next time interval was defined as:
fi: Fecundity at age-class i. Stage specific fecundities were defined as:
where is the probability of newborns surviving to age 0.5 and defined as:
and is the number of female embryos. Pelagic thresher sharks have a 1:1 sex ratio so was set to 1. The survival rate at stage i was defined as: where is the fishing mortality and is the natural mortality at stage i. The proportion of individuals moving from stage i to stage i + 1 was defined as:
where initial population growth rate was .
The future population was projected using matrix multiplication. For year t + 1 the population vector was calculated as:
where N is the population at year t, A is the projection matrix and λ is the finite growth rate. The total population, , at any given year is the sum of all individuals across stages:
where is the number of individuals in stage i at time t. The finite growth rate is defined as the dominant eigenvalue and calculated as
where is the initial population and is the total population after the projected timeframe in years. The intrinsic growth rate can subsequently be calculated as, .
Model scenarios
Since a separable virtual population analysis would require landing data that were not available from the region (Lassen and Medley, 2001), we incorporated six scenarios into the model to hypothetically predict incremental increases in fishing mortality (F) which we based on actual fisheries data from nearby Taiwanese pelagic thresher shark fisheries (Tsai et al., 2010). A 30-year projection horizon was selected to match the estimated longevity of female pelagic thresher sharks and to capture population processes across a full life cycle, which is consistent with demographic modelling standards for long-lived, K-select species (Tsai and Huang, 2022; White, 2018; Tsai et al., 2010). An initial model with no fishing mortality (F = 0) was constructed (1). Two models (2 and 3 respectively) then set the fishing mortality to the minimum (F = 0.09) and maximum (F = 0.209) values (estimated from 1990 to 2007 by Tsai et al., 2010). Two models (4 and 5 respectively) set the fishing mortality to 100% (F = 0.142) and 50% (F = 0.072) of the mean estimated fishing mortality from 1990 to 2007 by Tsai et al. (2010). A final model (6) was constructed to investigate the highest fishing mortality that would be sustainable for the population over a 30-year timeframe. The fishing mortality was titrated in 1% increments (F = 0.00142) of the mean fishing mortality from Taiwanese pelagic thresher shark fisheries until a positive growth rate (λ >1) was reached.
We introduced additional stochasticity to the survivorship parameters from the standard deviation of estimated fishing mortalities reported by Tsai et al. (2010) because fisheries-based mortality was unknown. Random normal variation was introduced to simulate stochastic survival rates as follows:
where is the adjusted survival rate for stage i and is a random number from a normal distribution and defined as:
where was the mean that was set to zero to express neutral expected change, as the standard deviation of survival rate at stage i, and as the Box-Muller transformation using two independent random numbers, U1 and U2, from a standard uniform distribution.
Monte Carlo simulations were applied to the model to test the effect of uncertain fishing mortality for each scenario. The means and 95% confidence intervals for each scenario were calculated from 10000 simulations based on the initial female population from the stereocam observations. The mean of the total population at time t across all simulations was calculated as:
Quantiles were calculated for each time t to generate 95% confidence intervals:
We assessed the potential for population decline from fisheries-based mortality for each scenario using a 50% decline in the initial number of observed females as a critical threshold because this level is consistent with precautionary benchmarks in elasmobranch risk assessments and aligns with international conservation frameworks (Tsai et al., 2010; Aires-da-Silva and Gallucci, 2007). Under the IUCN’s Red List, a population reduction of ≥50% over three generations qualifies a species as ‘endangered’, meaning the population has fallen to half of its baseline. Although our model does not project three generations, using a 50% threshold captures the same magnitude of decline considered to be biologically severe by the IUCN Threats Classification Scheme (Version 3.3) (IUCN, 2025). Likewise, the Food and Agriculture Organization Precautionary Approach recommends biomass triggers at approximately 50% of initial biomass or biomass Maximum Sustainable Yield for initiating management action in data-limited fisheries (FAO, 1996). Thus, a 50% threshold provides a simple, policy-relevant indicator of when the population may be at elevated risk.
The critical threshold of 50% of the females that we observed (n=144) corresponded to a value of 72. The risk probability of the population dropping below this critical threshold at any point in the 30-year timeframe was calculated as:
where I is an indicator function that is 1 if the condition is true and 0 otherwise.
Stage threshold sensitivity analyses
To ensure robust stage assignment, borderline individuals with PCL measurements falling within ±1 cm of stage thresholds were flagged and evaluated through sensitivity checks within the demographic model. The initial female populations were adjusted by i) excluding borderline individuals; and ii) switching borderline individuals to adjacent stages. The critical threshold was likewise adjusted to 50% of the total initial female population where borderline individuals were removed. The model outputs of both adjusted initial populations were separately compared to the unadjusted outputs by calculating the absolute percent difference and the Cohen’s d.
Results
The stereocam recorded a total of 120.42 hours of video observations from 40 deployments with equal sampling effort across the four study sites on Monad Shoal (December 2019 – March 2020), which is consistent with the observation effort for surveying the abundance of elusive species in similar studies (Devine et al., 2018; Harasti et al., 2016). The mean (± SE) recording time was 3.01 hrs (± 2.27 mins) across our study sites (F = 0.9053, 36, p=0.448). The maximum and minimum recording times were 3.45 hrs and of 2.4 hrs respectively. 90% of our stereocam deployments resulted in observations of pelagic thresher sharks. Site A had the lowest frequency of encounters (mean (± SE) of 0.49 (± 0.18) observations per hour-1) while site B had the highest (mean 5.70 (± 0.85) observations hour-1). The mean (± SE) encounter frequency for sites C and D was 2.48 (± 0.51) and 3.64 (± 0.70) observations hour-1 respectively. 313 pelagic thresher sharks were detected overall, 107 of which were either repeat sightings or sharks that were too far from, or too close to the stereocam’s field of view for accurate PCL measurements. We filtered these and excluded them from our analyses. Of the remaining 206 pelagic thresher sharks that we identified as individuals, 144 were females and 62 were males (Table 2). The mean (± SE) PCL measurement for female thresher sharks was 136.8 cm (± 1.25 cm). We determined that the largest female shark had a PCL of 193.52 cm and the smallest was 90.45 cm (PCL) (Table 2). The mean (± SE) PCL measurement for male thresher sharks was 130.31 cm (± 1.57 cm). The largest male shark had a PCL of 151.64 cm and the smallest had a PCL of 100.26 cm (Table 2). Significantly more females of all maturity classifications were observed than for males (overall ♂:♀ χ2 = 38.721, p ≤ 0.001; adult ♂:♀ χ2 = 20.481, p ≤ 0.001; transitional ♂:♀ χ2 = 11.2151, p ≤ 0.001; and juvenile ♂:♀ χ2 = 8.24391, p< 0.01). Only three female neonates were observed (no males).
Table 2
| Sex | Neonate | Juvenile | Transitional | Adults | Total |
|---|---|---|---|---|---|
| Females | 3 | 54 | 46 | 41 | 144 |
| Males | 0 | 28 | 19 | 9 | 56 |
| Ratio (F:M) | 3:0 | 1.93:1 | 2.42:1 | 4.56:1 | 2.57:1 |
Number of individual pelagic thresher shark observations categorised by stage-class and sex.
Stage thresholds
We flagged 20 borderline female individuals which represented 13.8% of the females in the dataset. The juvenile stage contained 3 borderline individuals, one within the neonate threshold and two within the transitional threshold. The transitional stage contained 14 borderline individuals with seven individuals within both the juvenile and adult thresholds. The adult stage contained 3 borderline individuals.
The removal of borderline individuals had a minimal effect on the growth rates in the demographic model with a mean (± SE) effect size of 0.40 (± 4.15E-3). When borderline individuals were removed, the mean (± SE) absolute percent differences in the finite population increase rate (Δλ) and intrinsic population growth rate (Δr) with their confidence intervals (Δ95% CI [lower limit – upper limit]) were Δλ = 0.079% (± 1.81E-3%) with Δ95% CI = [0.083% (± 4.85E-3%) - 0.074% (± 2.27E-3%)] and Δr = 3.35% (± 1.35%) with Δ95% CI = [3.75% (± 2.35%) – 4.04% (± 2.10%)] respectively. In scenario 2, the removal of borderline individuals increased the probability of population decline below the critical threshold by 2.73% to a value of 86.5% risk. In scenario 5, the removal of borderline individuals increased the probability of population decline below the critical threshold by 21.52% to a value of 6.72% risk. The probabilities of population decline below the critical threshold were unchanged by the removal of borderline individuals.
Switching borderline individuals to their adjacent stage had less effect than their removal on the growth rates with a mean (± SE) effect size of 0.31 (± 2.94E-3). When borderline individuals were switched to adjacent stages, the mean (± SE) absolute percent differences in the finite population increase rate (Δλ) and intrinsic population growth rate (Δr) with their confidence intervals (Δ95% CI [lower limit – upper limit]) were Δλ = 0.060% (± 1.43E-3%) with Δ95% CI = 0.064% (± 4.40E-3%) - 0.056% (± 1.76E-3%) and Δr = 2.55% (± 1.03%) with Δ95% CI = 2.89% (± 1.84%) – 3.07% (± 1.61%) respectively. In scenario 2, switching borderline individuals to adjacent stages increased the probability of population decline below the critical threshold by 2.00% to a value of 85.9% risk. In scenario 5, switching borderline individuals to adjacent stages increased the probability of population decline below the critical threshold by 17.36% to a value of 6.49% risk. The probabilities of population decline below the critical threshold were unchanged when borderline individuals were switched to adjacent stages.
We concluded that minor variation in classification did not materially influence estimates of survivorship or transition probabilities. Since the four-stage structure (neonate, juvenile, transitional, adult) reflects well-established maturity criteria for pelagic thresher sharks based on continuous growth and documented PCL–age relationships (Tsai and Huang, 2022; Tsai et al., 2010; Liu et al., 1999), our reporting pertains to the unmodified dataset.
Population projections
Since Leslie-Lefkovitch matrices only consider females for population estimates, the 144 pelagic thresher sharks that we identified as female were used in the six scenarios that estimated population growth in response to hypothetical fishing mortality (F) in our models (Weinbaum et al., 2013) (based from Tsai et al. (2010) fisheries dependent data) (Table 3).
Table 3
| Model Scenario | Fishing Mortality | Projection Matrix |
|---|---|---|
| Scenario 1 | F = 0 |
|
| Scenario 2 | F = 0.090 |
|
| Scenario 3 | F = 0.209 |
|
| Scenario 4 | F = 0.142 |
|
| Scenario 5 | F = 0.071 |
|
| Scenario 6 | F = 0.053 |
|
Leslie-Lefkovitch matrices for a continuous four-stage model of female pelagic thresher shark population.
Fishing mortality values (F) were based from Taiwanese fisheries data (Tsai et al., 2010). Scenario 1 represents life history parameters with no fishing mortality. Scenarios 2 and 3 used the highest and lowest estimated fishing mortalities from the years 1990–2007 respectively (Tsai et al., 2010). Scenarios 4–6 set fishing mortality to a percentage of the mean estimated fishing mortality by Tsai et al. (2010).
The model with no fishing mortality (F = 0; Scenario 1) projected population growth (λ = 1.072 year-¹, 95% CI = 1.068–1.075 year-¹; r = 0.069 year-¹, 95% CI = 0.066–0.073) with zero probability of decline below the critical threshold. Under the minimum fishing mortality estimated by Tsai et al. (2010) (F = 0.090; Scenario 2), population size declined (λ = 0.969 year-¹, 95% CI = 0.953–0.984; r = –0.031 year-¹, 95% CI = –0.048 to –0.016) with an 84.2% probability of depletion within the projection period. At the maximum estimated fishing mortality (F = 0.209; Scenario 3), the population showed a continuous negative trajectory (λ = 0.850 year-¹, 95% CI = 0.832–0.865; r = –0.163 year-¹, 95% CI = –0.184 to –0.145) with a 100% risk of decline. When fishing mortality was set to 100% of the mean (F = 0.142; Scenario 4), the decline was slower than Scenario 3 but still substantial (λ = 0.915 year-¹, 95% CI = 0.898–0.930; r = –0.089 year-¹, 95% CI = –0.107 to –0.072), and the risk of decline remained at 100%. At 50% of the mean fishing mortality (F = 0.071; Scenario 5), population decline was marginal (λ = 0.990 year-¹, 95% CI = 0.974–1.005; r = –0.010 year-¹, 95% CI = –0.026 to 0.005), and the risk of depletion was reduced to 5.5%. Finally, Scenario 6 determined that the maximum sustainable fishing mortality was 37% of Tsai et al.’s (2010) mean (F = 0.053), where population growth was positive (λ = 1.011 year-¹, 95% CI = 0.995–1.025; r = 0.011 year-¹, 95% CI = –0.005 to 0.025) and the risk of depletion was zero (Figure 3, Table 4).
Figure 3
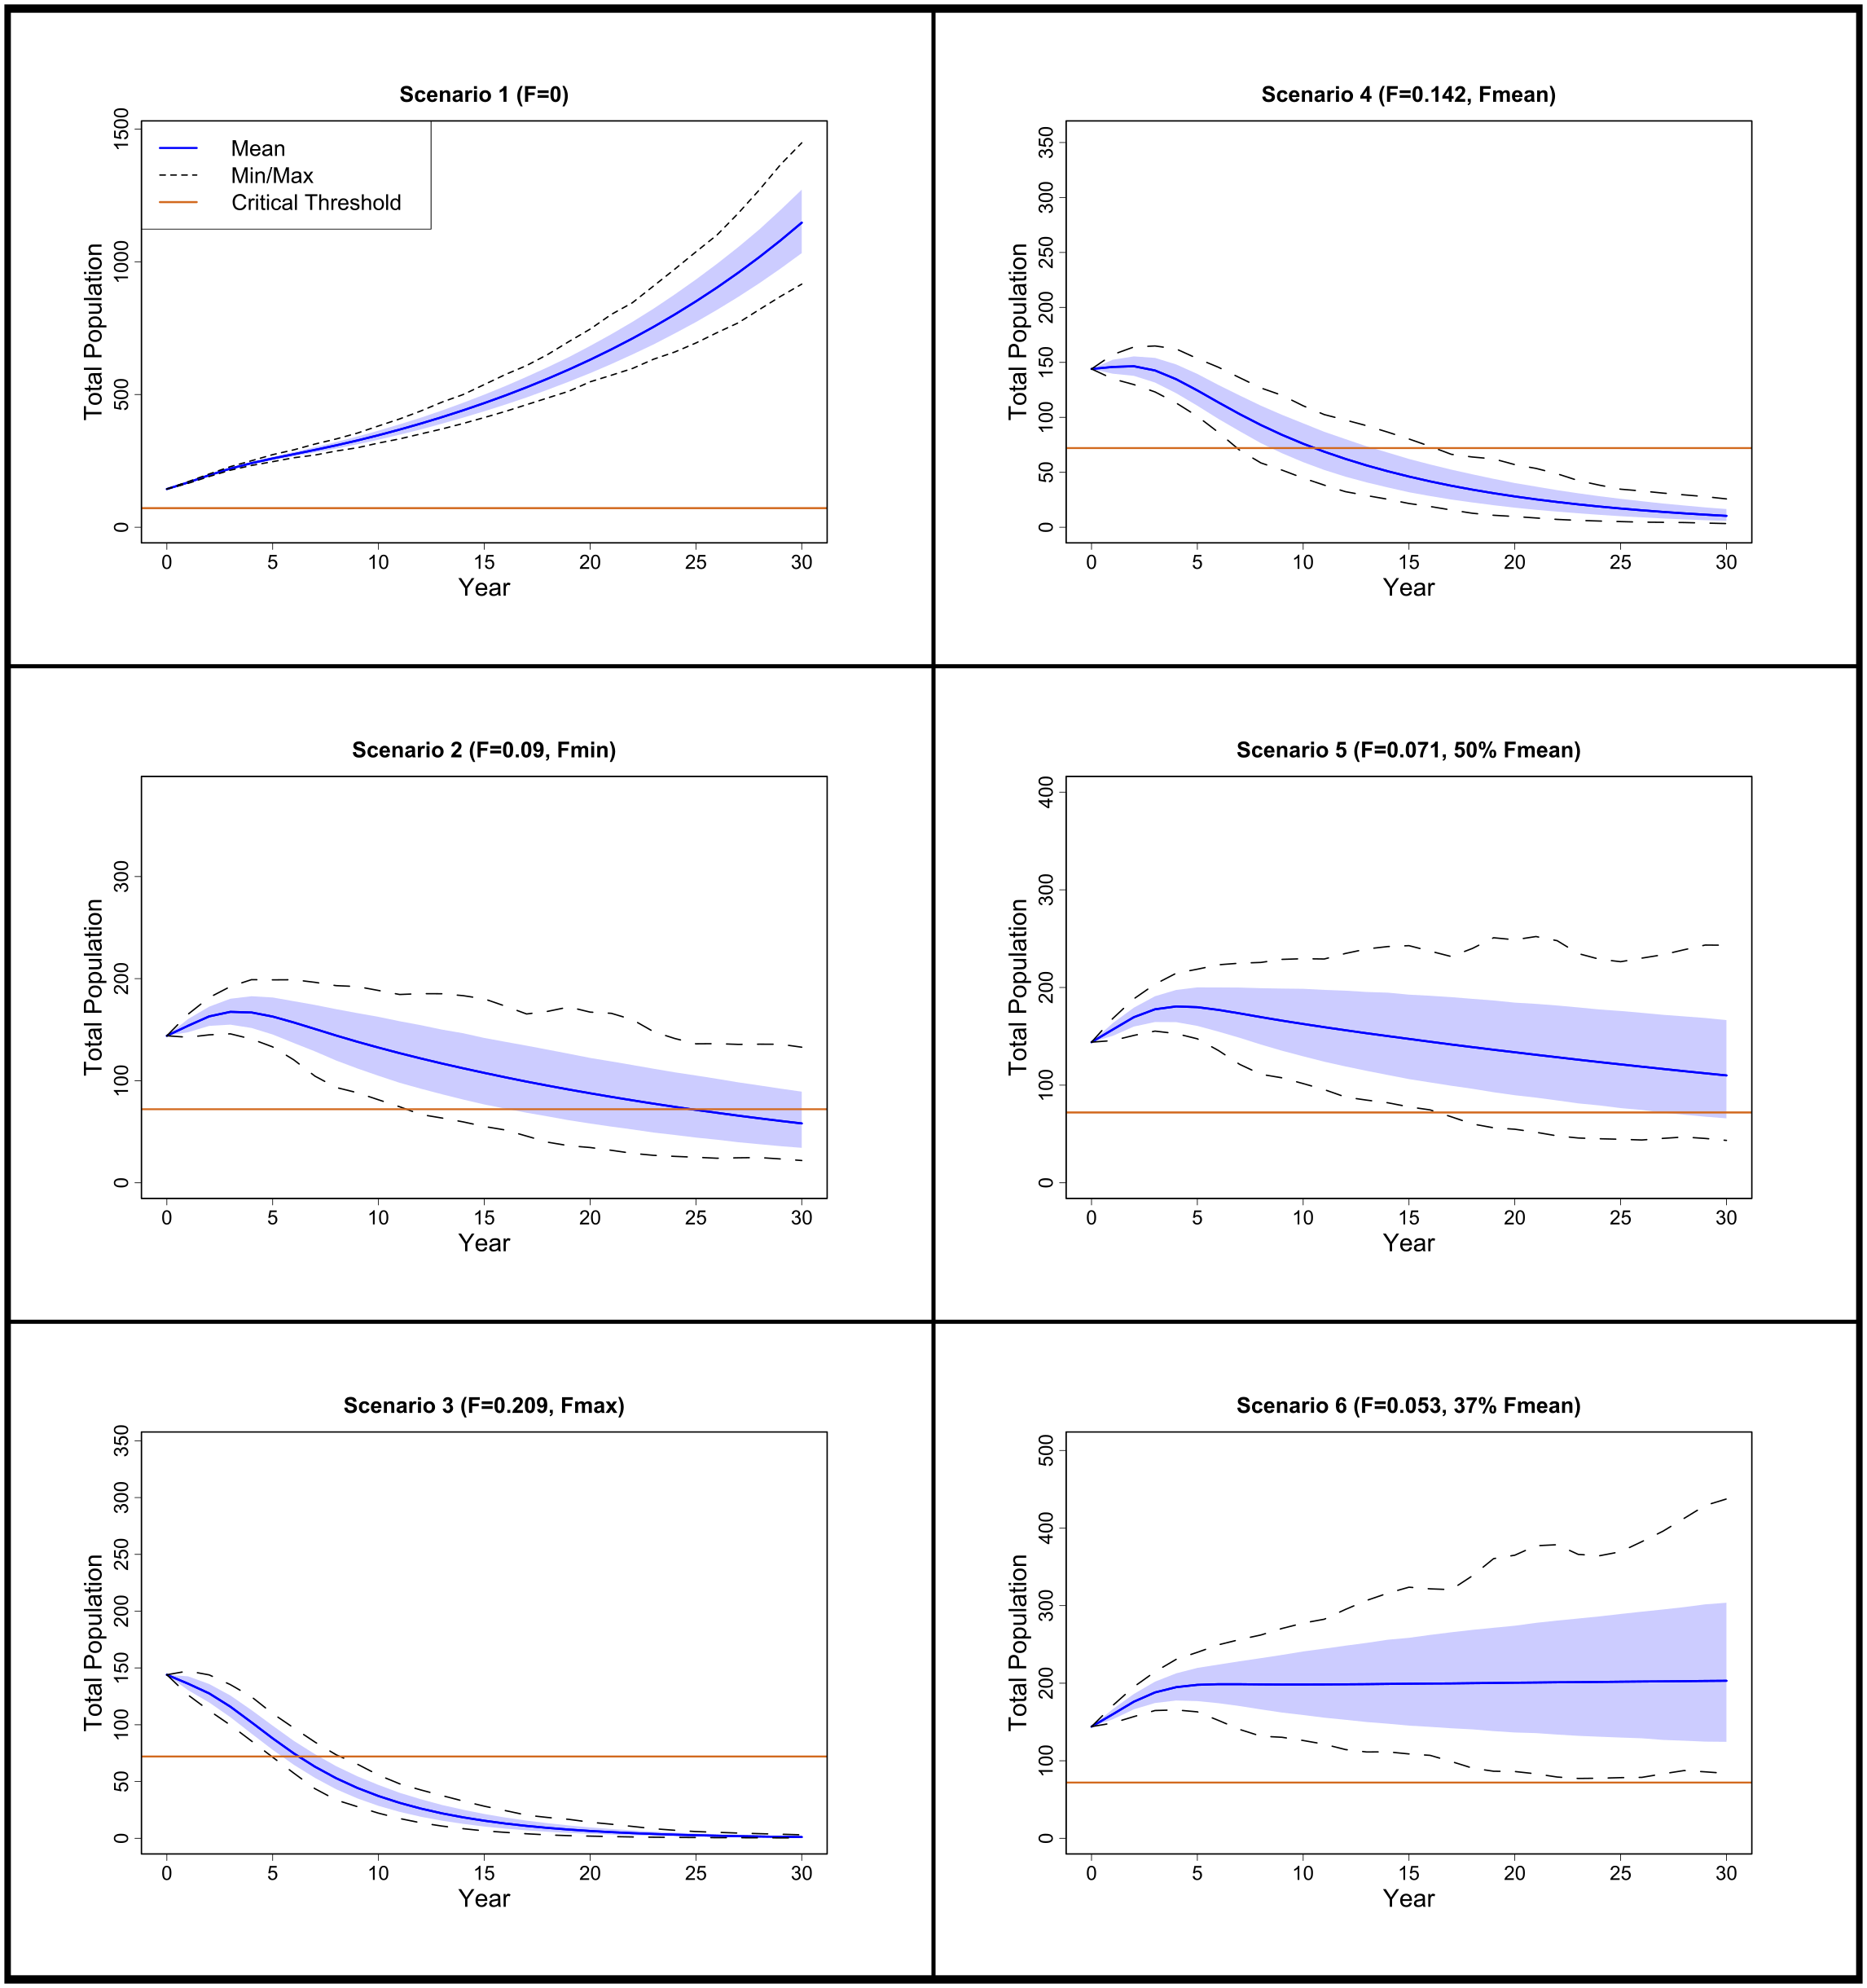
Female pelagic thresher shark population projections for scenarios 1–6 over a 30-year timescale. Min/Max refer to the 95% minimum and maximum confidence intervals and the upper and lower quartiles of the population projections are shown in light blue. The critical threshold value that would signify population decline was set at 50% for the initial female population. Fishing mortality values (F) were based from Taiwanese fisheries data (Tsai et al., 2010). Fmax and Fmin used the highest and lowest estimated fishing mortalities from the years 1990–2007 respectively (Tsai et al., 2010). Scenarios 4–6 set fishing mortality to a percentage of mean estimated fishing mortality by Tsai et al. (2010).
Table 4
| Scenario | F | Finite population increase rate, λ (95% CI) | Intrinsic population growth rate, r (95% CI) | Risk |
|---|---|---|---|---|
| 1 | 0 | 1.072 (1.068 - 1.075) | 0.069 (0.066 - 0.073) | 0 |
| 2 | 0.09 | 0.969 (0.953 - 0.984) | -0.031 (-0.048 - -0.016) | 0.842 |
| 3 | 0.209 | 0.85 (0.832 - 0.865) | -0.163 (-0.184 - -0.145) | 1 |
| 4 | 0.142 | 0.915 (0.898 - 0.93) | -0.089 (-0.107 - -0.072) | 1 |
| 5 | 0.071 | 0.99 (0.974 - 1.005) | -0.01 (-0.026 - 0.005) | 0.0553 |
| 6 | 0.053 | 1.011 (0.995 - 1.025) | 0.011 (-0.005 - 0.025) | 0 |
List of all model scenarios with respective fishing mortalities (F), finite (λ) and intrinsic (r) population growth rates, and the probability of population decline within a 30-year timeframe (Risk).
Discussion
Our study represents the first attempt to use stereo videography as a tool to assess vulnerable pelagic thresher shark populations. Population assessments are essential for making informed management decisions since they provide estimates of the status of species and forecast future population trajectories (Weinbaum et al., 2013; Nichols and Williams, 2006) but most require data from harvest rates (Weinbaum et al., 2013). In the absence of these, our use of stereo videography offers a new non-invasive platform for sampling shark populations for demographic studies.
Population projections
Our findings indicate that one third of the mean fishing mortality that Tsai et al. (2010) observed from nearby Taiwanese pelagic thresher shark fisheries would be sustainable for pelagic thresher sharks in our study region. This figure corresponds to an extraction rate of 5.3% per annum or roughly 15–18 female individuals. There are no current data on the landing and bycatch rates of pelagic thresher sharks in the Visayas but these values would serve a conservative benchmark for measuring the success of management efforts if illegal fisheries were to be eradicated and strict regulations on bycatch implemented.
Our continuous stage-based model showed that fishing pressures equivalent to those observed from Taiwanese fisheries would be unsustainable if levied on the population of pelagic thresher sharks that we monitored. It is possible that scenarios 5 and 6, which constitute a fraction of the mean fishing mortality estimates from Taiwanese fisheries, resemble the current status of A. pelagicus fishing mortality in the Visayan Sea. If true, these values suggest that annual fishing based mortality is between five and seven percent, where the lower limit indicates a net gain, and the upper limit indicates a net loss. It appears likely that the stability (and hence sustainability) of pelagic thresher shark populations in the Visayan Sea hinges on fine margins, and that the species is fragile and particularly vulnerable to exploitation in the region.
A limitation of stage-based Leslie matrices is that they do not factor in density-dependent strategies for coping with declining populations when modelling projections for population growth (Tsai et al., 2010; Cortés, 2002, 1998). It has been suggested that shark populations don’t recover from fisheries pressure as quickly as teleosts do because of their K-select life history strategies, and pelagic thresher sharks are known to have slower population growth rates relative to other oceanic species (Smith et al., 2008). The model in which we only incorporated natural mortality estimated a mean annual population growth rate (λ) of 1.072 which is higher than estimates from previous studies (Tsai et al., 2010; Mollet and Cailliet, 2002; Cortés, 2002). Tsai and Huang (2022) reported a similar pelagic thresher shark population growth rate to ours and suggested that this may be due to their use of higher natural life expectancy values in their model iterations. Regardless, this species’ low productivity makes it slow to recover and consequently highly vulnerable to exploitation (Mejía et al., 2025; Tsai and Huang, 2022; Smith et al., 2008; Cortés, 1998), which is supported by our findings.
Our demographic model relied on life-history parameters derived primarily from Taiwanese and northwestern Pacific studies (Tsai and Huang, 2022; Liu et al., 1999). Although these represent the best available estimates, regional variation in growth rates, fecundity, and longevity could influence model outputs. Sensitivity analyses from comparable demographic studies show that parameters such as stage durations, longevity, and age at maturity can substantially alter population growth rate estimates (Mollet and Cailliet, 2002; Cortés, 1998). Incorporating locally derived biological parameters into future models would refine estimates of population trajectories and reduce uncertainty around sustainable fishing mortality.
Sexual asymmetry
In the animal kingdom, females of a given species behave differently from their male conspecifics, and sexual dimorphism has been attributed to differences in the demographic distributions of the sexes in many habitats (Tikkamäki and Komonen, 2011; Mucientes et al., 2009). In the realm of elasmobranchs, sharks may select habitats differentially by sex for reasons related to social refuging, thermoregulation or foraging (Mucientes et al., 2009), and it has been suggested that female oceanic sharks aggregate to avoid harassment from free roaming males (Jacoby et al., 2010; Mucientes et al., 2009). The behaviour can be risky however, since boundaries between males and females are unknown for global fisheries, and species may consequently be differentially exploited by sex (Mucientes et al., 2009).
It is not known if female pelagic thresher sharks aggregate together, but considerably more female sharks were observed on Monad Shoal than males. Anecdotal evidence from fishermen throughout the Philippines indicates that female pelagic thresher sharks are generally caught together near large aggregations of sardines (Oliver, 2012). It is possible that the stereocam observed more female pelagic thresher sharks at Monad Shoal because females aggregate socially nearby. If fisheries in the Visayas disproportionately capture females (as suggested by anecdotal reports of female-biased catches near schools of sardines), the regenerative capacity of the population could be significantly compromised (Tsai and Huang, 2022). Given that female pelagic thresher sharks have low fecundity, long gestation, and late maturity, targeted or incidental removal of breeding females is likely to accelerate population declines more than male-biased mortality (Tsai and Huang, 2022; Tsai et al., 2010). This sex-skewed vulnerability underscores the urgent need for developing management strategies that explicitly consider differential exploitation risks between males and females.
Economic and/or logistic constraints can influence the capacity for governing bodies to meet their global conservation management commitments. In such cases, management approaches that focus on critical spatial, temporal, or demographic ranges are more feasible when resources are limited (MacKeracher et al., 2018; Gilman and Lundin, 2010). Since thresher sharks cannot be legally targeted by commercial fisheries, it is likely that bycatch mortality represents a significant threat to this species in the Philippines (Oliver et al., 2015; Gilman et al., 2008). Bycatch could be reduced by modifying gear and capture techniques, implementing post-capture release protocols, legislating fishery closures for target stocks that are located in known thresher shark habitats, mandating compensatory mitigation, and/or establishing marine protected areas with strict enforcement in thresher shark hotspots (Patterson et al., 2001; Gilman et al., 2008).
Concluding remarks
The stereocam proved to be a valuable asset for responding to our research objectives. Future work may wish to develop a framework for combining stereo videography with enhanced artificial intelligence tools to identify and track individuals across multiple years (Sandercock, 2003). Lewis (2019) used a stereocam with the Robust Design by Pollock et al. (1990) to measure and track individual sevengill sharks, determine their abundance, and assess their population demographics. Similarly modified mark-resight or sight-resight models could facilitate efforts to reveal residency patterns and estimate mortality rates for a range of species, which would have obvious implications for delineating boundaries for conservation enforcement zones (McClintock et al., 2019, 2014; Romero-Caicedo et al., 2014).
The application of non-invasive techniques for assessing and monitoring populations of vulnerable megafauna with poor capture and post-release survivorship offers significant value (Hutchinson et al., 2023). The stereocam’s capability for providing accurate data that can be directly associated with important life history parameters allows population focused conservation research to shift away from relying on fisheries dependent data, and high-risk invasive capture techniques. The standardisation and scalability of stereo videography has considerable scope for outreach, and for enabling the collection of demographic data without compromising the welfare of the very shark populations that are under scrutiny.
Statements
Data availability statement
The raw data supporting the conclusions of this article will be made available by the authors, without undue reservation.
Ethics statement
The animal study was approved by University of Chester’s animal ethics committee (1366/17/AG/BS). The study was conducted in accordance with the local legislation and institutional requirements.
Author contributions
AG: Data curation, Formal analysis, Funding acquisition, Investigation, Methodology, Resources, Software, Visualization, Writing – original draft, Writing – review & editing. SO: Conceptualization, Investigation, Methodology, Project administration, Resources, Supervision, Validation, Visualization, Writing – original draft, Writing – review & editing. JB: Data curation, Formal analysis, Investigation, Project administration, Software, Supervision, Visualization, Writing – review & editing. VC: Data curation, Methodology, Resources, Writing – review & editing. GC: Methodology, Resources, Writing – review & editing. AL: Supervision, Visualization, Writing – review & editing. IF: Data curation, Methodology, Project administration, Writing – review & editing.
Funding
The author(s) declared that financial support was received for this work and/or its publication. The research was supported by a University of Chester International Research/Field Study Travel Grant For Students, funded under the Santander Universities scheme. The funders were not involved in the study design, collection, analysis, interpretation of data, the writing of this article, or the decision to submit it for publication.
Acknowledgments
We would like to thank the Municipal Mayor of DaanBantayan and the Barangay Captain of Malapascua for their field support and guidance. We would also like to thank Divelink Cebu for supporting the field operations. We thank members of Singapore Management University’s ReefAlert programme and TSRCP volunteers for helping with the field surveys, and Prof Thomas Grothues for editorial input.
Conflict of interest
Authors VC and GC were employed by Divelink Cebu.
The remaining authors declare that the research was conducted in the absence of any commercial or financial relationships that could be construed as a potential conflict of interest.
Generative AI statement
The author(s) declared that generative AI was not used in the creation of this manuscript.
Any alternative text (alt text) provided alongside figures in this article has been generated by Frontiers with the support of artificial intelligence and reasonable efforts have been made to ensure accuracy, including review by the authors wherever possible. If you identify any issues, please contact us.
Publisher’s note
All claims expressed in this article are solely those of the authors and do not necessarily represent those of their affiliated organizations, or those of the publisher, the editors and the reviewers. Any product that may be evaluated in this article, or claim that may be made by its manufacturer, is not guaranteed or endorsed by the publisher.
References
1
Adams K. R. Fetterplace L. C. Davis A. R. Taylor M. D. Knott N. A. (2018). Sharks, rays and abortion: The prevalence of capture-induced parturition in elasmobranchs. Biol. Conserv.217, 11–27. doi: 10.1016/j.biocon.2017.10.010
2
Aires-da-Silva A. M. Gallucci V. F. (2007). Demographic and risk analyses applied to management and conservation of the blue shark (Prionace glauca) in the North Atlantic Ocean. Mar. Freshw. Res.58, 570–580. doi: 10.1071/mf06156
3
Booth H. Squires D. Milner-Gulland E. J. (2019). The neglected complexities of shark fisheries, and priorities for holistic risk-based management. Ocean Coast. Manage.182, 104994. doi: 10.1016/j.ocecoaman.2019.104994
4
Boutros N. Shortis M. R. Harvey E. S. (2015). A comparison of calibration methods and system configurations of underwater stereo-video systems for applications in marine ecology. Limnol. Oceanogr. Methods13, 224–236. doi: 10.1002/lom3.10020
5
Brooks E. J. Sloman K. A. Sims D. W. Danylchuk A. J. (2011). Validating the use of baited remote underwater video surveys for assessing the diversity, distribution and abundance of sharks in the Bahamas. Endang. Species Res.13, 231–243. doi: 10.3354/esr00331
6
Cadwallader H. F. Turner J. R. Oliver S. P. (2015). Cleaner wrasse forage on ectoparasitic digeneans (phylum Platyhelminthes) that infect pelagic thresher sharks (Alopias pelagicus). Mar. Biodivers.45, 613–614. doi: 10.1371/journal.pone.0014755
7
Camhi M. D. Pikitch E. K. Babcock E. A. (2008). Sharks of the Open Ocean: Biology, Fisheries and Conservation (Oxford: Blackwell Publishing).
8
Caswell H. (2001). Matrix population models: construction, analysis, and interpretation. 2nd edn (Sunderland, MA: Sinauer Associates. Inc.).
9
Chen S. Watanabe S. (1989). Age dependence of natural mortality coefficient in fish population dynamics. Nippon Suisan Gakk.55, 205–208. doi: 10.2331/suisan.55.205
10
Cooke S. J. Schreer J. F. Dunmall K. M. Philipp D. (2002). Strategies for quantifying sub-lethal effects of marine catch-and-release angling: insights from novel freshwater applications. Am. Fish. Soc Symp.30, 121–134.
11
Cortés E. (1998). Demographic analysis as an aid in shark stock assessment and management. Fish. Res.39, 199–208. doi: 10.1016/S0165-7836(98)00183-0
12
Cortés E. (2002). Incorporating uncertainty into demographic modeling: application to shark populations and their conservation. Conserv. Biol.16, 1048–1062. doi: 10.1046/j.1523-1739.2002.00423.x
13
Currey-Randall L. M. Cappo M. Simpfendorfer C. A. Farabaugh N. F. Heupel M. R. (2020). Optimal soak times for baited remote underwater video station surveys of reef-associated elasmobranchs. PLoS One15, e0231688. doi: 10.1371/journal.pone.0231688
14
Delacy C. R. Olsen A. Howey L. A. Chapman D. D. Brooks E. J. Bond M. E. (2017). Affordable and accurate stereo-video system for measuring dimensions underwater: a case study using oceanic whitetip sharks Carcharhinus longimanus. Mar. Ecol. Prog. Ser.574, 75–84. doi: 10.3354/meps12190
15
Devine B. M. Wheeland L. J. Fisher J. A. (2018). First estimates of Greenland shark (Somniosus microcephalus) local abundances in Arctic waters. Sci. Rep.8, 974. doi: 10.1038/s41598-017-19115-x
16
Dulvy N. K. Baum J. K. Clarke S. Compagno L. J. V. Cortés E. Domingo A. et al . (2008). You can swim but you can’t hide: the global status and conservation of oceanic pelagic sharks and rays. Aquat. Conserv.: Mar. Freshw. Ecosyst.18, 459–482. doi: 10.1002/aqc.975
17
Dulvy N. K. Fowler S. L. Musick J. A. Cavanagh R. D. Kyne P. M. Harrison L. R. et al . (2014). Extinction risk and conservation of the world’s sharks and rays. eLife3, e00590. doi: 10.7554/eLife.00590
18
Ebert D. Dando M. Bodiguel C. (2015). “ On board guide for the identification of pelagic sharks and rays,” in Western Indian Ocean ( FAO, Roma, Italy).
19
Food and Agriculture Organisation (FAO) (1996). Precautionary Approach to Capture Fisheries and Species Introductions, Food and Agricultural Organisation Technical Guidelines for Responsible Fisheries No. 2 (Rome, Italy: FAO), 54. Available online at: https://ftp.fao.org/docrep/fao/003/W3592e/W3592e00.pdf.[Accessed December 10, 2025].
20
Gilman E. Clarke S. Brothers N. Alfaro-Shigueto J. Mandelman J. Mangel J. et al . (2008). Shark interactions in pelagic longline fisheries. Mar. Policy32, 1–18. doi: 10.1016/j.marpol.2007.05.001
21
Gilman E. Lundin C. G. (2010). “ Minimizing bycatch of sensitive species groups in marine capture fisheries: Lessons from tuna fisheries,” in Handbook of Marine Fisheries Conservation and Management. Eds. GraftonR. Q.HilbornR.SquiresD.TaitN.WilliamsM. ( Oxford University Press, Oxford), 150–164.
22
Harasti D. Lee K. Laird R. Bradford R. Bruce B. (2016). Use of stereo baited remote underwater video systems to estimate the presence and size of white sharks (Carcharodon carcharias). Mar. Freshw. Res.68, 1391–1396. doi: 10.1071/MF16184
23
Hutchinson M. Lopez J. Wiley B. Pulvenis J.-F. Altamirano E. Aires-da-Silva A. (2023). “ Knowledge and research gaps to the implementation of best handling and release practices for vulnerable species,” in Document EB-01-01; Working Group on Ecosystem & Bycatch, La Jolla, California, USA (Inter-American Tropical Tuna Commission).
24
IUCN (2025). Threats Classification Scheme (Version 3.3) (Gland, Switzerland: IUCN). Available online at: https://www.iucnredlist.org/resources/threat-classification-scheme.
25
Jabado R. W. Antonopoulou M. Möller M. Al Suweidi A. S. Al Suwaidi A. M. Mateos-Molina D. (2021). Baited Remote Underwater Video Surveys to assess relative abundance of sharks and rays in a long standing and remote marine protected area in the Arabian Gulf. J. Exp. Mar. Biol. Ecol.540, 1–10. doi: 10.1016/j.jembe.2021.151565
26
Jacoby D. M. Busawon D. S. Sims D. W. (2010). Sex and social networking: the influence of male presence on social structure of female shark groups. Behav. Ecol.21, 808–818. doi: 10.1093/beheco/arq061\
27
Lassen H. Medley P. (2001). Virtual population analysis: a practical manual for stock assessment. FAO Fish. Tech. Paper.400, 11–12.
28
Last P. R. Compagno L. J. V. (2002). “ Review of the biodiversity of rays in the South China Sea and adjacent areas,” in Elasmobranch Biodiversity, Conservation and Management: Proceedings of the International Seminar and Workshop, Sabah, Malaysia, July 1997. Eds. FowlerS. L.ReedT. M.DipperF. A. Gland, (Switzerland and Cambridge, UK: IUCN Species Survival Commission No. 25), 64–69.
29
Lewis R. (2019) in Population demographics of sevengill sharks (Notorynchus cepedianus) in Paterson Inlet, Stewart Island (Master’s Thesis, University of Otago), Dunedin, New Zealand.
30
Liu K. M. Chang Y. T. Ni I. H. Jin C. B. (2006). Spawning per recruit analysis of the pelagic thresher shark, Alopias pelagicus, in the eastern Taiwan waters. Fish. Res.82, 56–64. doi: 10.1016/j.fishres.2006.08.013
31
Liu K. M. Chen C. T. Liao T. H. Joung S. J. (1999). Age, growth, and reproduction of the pelagic thresher shark, Alopias pelagicus in the Northwestern Pacific. Copeia1999, 68–74. doi: 10.2307/1447386
32
Liu K. M. Chin C. P. Chen C. H. Chang J. H. (2015). Estimating finite rate of population increase for sharks based on vital parameters. PloS One10, e0143008. doi: 10.1371/journal.pone.0143008
33
MacKeracher T. Diedrich A. Simpfendorfer C. A. (2018). Sharks, rays and marine protected areas: A critical evaluation of current perspectives. Fish Fish.20, 255–267. doi: 10.1111/faf.12337
34
McClintock B. T. Hill J. M. Fritz L. Chumbley K. Luxa K. Diefenbach D. R. (2014). Mark-resight abundance estimation under incomplete identification of marked individuals. Methods Ecol. Evol.5, 1294–1304. doi: 10.1111/2041-210X.12140
35
McClintock B. T. White G. C. Pryde M. A. (2019). Improved methods for estimating abundance and related demographic parameters from mark-resight data. Biometrics75, 799–809. doi: 10.1111/biom.13058
36
Mejía D. Galván-Magaña F. Briones-Mendoza J. Jakes-Cota U. Villalobos H. Moncayo-Estrada R. et al . (2025). Stochastic demographic analysis of the pelagic thresher shark (Alopias pelagicus) in the Ecuadorian Pacific. Reg. Stud. Mar. Sci.88, 104264. doi: 10.1016/j.rsma.2025.104264
37
Mollet H. F. Cailliet G. M. (2002). Comparative population demography of elasmobranchs using life history tables, Leslie matrices and stage-based matrix models. Mar. Freshw. Res.53, 503–515. doi: 10.1071/mf01083\
38
Mucientes G. R. Queiroz N. Sousa L. L. Tarroso P. Sims D. W. (2009). Sexual segregation of pelagic sharks and the potential threat from fisheries. Biol. Lett.5, 156–159. doi: 10.1098/rsbl.2008.0761
39
Musyl M. K. Brill R. Curran D. S. Fragoso N. M. McNaughton L. Nielsen A. et al . (2011). Postrelease survival, vertical and horizontal movements, and thermal habitats of five species of pelagic sharks in the central Pacific Ocean. Fish. Bull.109, 341–368.
40
Nichols J. D. Williams B. K. Monitoring for conservation. Trends Ecol Evol. (2006) 21(12):668–673. doi: 10.1016/j.tree.2006.08.007
41
Oliver S. P. (2012) in The Behaviour and Biology of Pelagic Thresher Sharks (Alopias pelagicus) in the Philipines (Doctor of Philosophy, Bangor University), Anglesey, United Kingdom.
42
Oliver S. P. Bicskos Kaszo A. E. (2015). A pelagic thresher shark (Alopias pelagicus) gives birth at a cleaning station in the Philippines. Coral Reefs34, 17–17. doi: 10.1007/s00338-014-1249-8
43
Oliver S. Braccini M. Newman S. J. Harvey E. S. (2015). Global patterns in the bycatch of sharks and rays. Mar. Policy54, 86–97. doi: 10.1016/j.marpol.2014.12.017
44
Oliver S. P. Grothues T. M. Mayo Z. J. Williams A. L. Silvosa M. Cases G. (2023). Depth and temperature profiles reflect individual differences in the daytime diving behaviours of pelagic thresher sharks. Front. Mar. Sci.10. doi: 10.3389/fmars.2023.1128473
45
Oliver S. P. Grothues T. M. Williams A. L. Cerna V. Silvosa M. Cases G. et al . (2019). Risk and resilience: High stakes for sharks making transjurisdictional movements to use a conservation area. Biol. Conserv.230, 58–66. doi: 10.1016/j.biocon.2018.11.013
46
Oliver S. P. Hussey N. E. Turner J. R. Beckett A. J. (2011). Oceanic sharks clean at coastal seamount. PloS One6, e14755. doi: 10.1371/journal.pone.0014755
47
Oliver S. P. Turner J. R. Gann K. Silvosa M. D’Urban Jackson T. (2013). Thresher sharks use tail-slaps as a hunting strategy. PloS One8, e67380. doi: 10.1371/journal.pone.0067380
48
Olsen A. Haber A. (2022). StereoMorph: Stereo Camera Calibration and Reconstruction. version 1.6.5.
49
Olsen A. M. Westneat M. W. Freckleton R. (2015). StereoMorph: an R package for the collection of 3D landmarks and curves using a stereo camera set-up. Methods Ecol. Evol.6, 351–356. doi: 10.1111/2041-210x.12326
50
Oposa A. Cerna V. Cases E. (2016). Socio-economic Survey of Barangays Maya, Logon, and Carnaza in Daanbantayan, Cebu, Philippines: Baseline Information for Policy Building and Management Plan. Save Philippine Seas: April 2016 Report.
51
Pacoureau N. Rigby C. L. Kyne P. M. Sherley R. B. Winker H. Carlson J. K. et al . (2021). Half a century of global decline in oceanic sharks and rays. Nature589, 567–571. doi: 10.1038/s41586-020-03173-9
52
Patterson K. Cook R. Darby C. Gavaris S. Kell L. Lewy P. et al . Estimating uncertainty in fish stock assessment and forecasting. Fish Fish. (2001) 2 (2), 125–157. doi: 10.1046/j.1467-2960.2001.00042.x
53
Pollock K. H. Nichols J. D. Brownie C. Hines J. E. (1990). Statistical inference for capture-recapture experiments. Wildl. Monogr.107, 3–97.
54
Rigby C. Barreto R. Carlson J. Fernando D. Fordham S. Francis M. et al . (2019).“ Alopias pelagicus,” in The IUCN Red List of Threatened Species 2019, e.T161597A68607857. [Accessed December 10, 2025]. doi: 10.2305/IUCN.UK.2019-3.RLTS.T161597A68607857.en.
55
Romero-Caicedo A. F. Galván-Magaña F. Martínez-Ortiz J. (2014). Reproduction of the pelagic thresher shark Alopias pelagicus in the equatorial Pacific. J. Mar. Biol. Assoc. U. K.94, 1501–1507. doi: 10.1017/s0025315414000927
56
Sandercock B. K. (2003). Estimation of survival rates for wader populations: a review of mark-recapture methods. Bull.-Wader Study Group100, 163–174.
57
Shortis M. (2015). Calibration techniques for accurate measurements by underwater camera systems. Sensors (Basel)15, 30810–30826. doi: 10.3390/s151229831
58
Skomal G. B. (2006) in The physiological effects of capture stress on post-release survivorship of sharks, tunas, and marlin (Boston, United States: Doctor of Philosophy, Boston University).
59
Skomal G. (2007). Evaluating the physiological and physical consequences of capture on post-release survivorship in large pelagic fishes. Fish. Manage. Ecol.14, 81–89. doi: 10.1111/j.1365-2400.2007.00528.x
60
Smith S. E. Au D. W. Show C. (2008). Intrinsic rates of increase in pelagic elasmobranchs. Sharks Open ocean: biology fisheries Conserv., 288–297. doi: 10.1002/9781444302516
61
Talwar B. Brooks E. J. Mandelman J. W. Grubbs R. D. (2017). Stress, post-release mortality, and recovery of commonly discarded deep-sea sharks caught on longlines. Mar. Ecol. Prog. Ser.582, 147–161. doi: 10.3354/meps12334
62
Tikkamäki T. Komonen A. (2011). Estimating population characteristics of two saproxylic beetles: a mark-recapture approach. J. Insect Conserv.15, 401–408. doi: 10.1007/s10841-010-9313-3
63
Tsai W. P. Huang C. H. (2022). Data-limited approach to the management and conservation of the pelagic thresher shark in the Northwest Pacific. Conserv. Sci. Pract.4, e12682. doi: 10.1111/csp2.12682
64
Tsai W. P. Liu K. M. Joung S. J. (2010). Demographic analysis of the pelagic thresher shark, Alopias pelagicus, in the north-western Pacific using a stochastic stage-based model. Mar. Freshw. Res.61, 1056–1066. doi: 10.1071/mf09303
65
Weinbaum K. Z. Brashares J. S. Golden C. D. Getz W. M. (2013). Searching for sustainability: are assessments of wildlife harvests behind the times? Ecol. Lett.16, 99–111. doi: 10.1111/ele.12008
66
White E. R. (2018). Minimum time required to detect population trends: the need for long-term monitoring programs. BioScience69, 40–46. doi: 10.1093/biosci/biy144
Summary
Keywords
marine conservation, fisheries, demographic analysis, elasmobranchs, pelagic thresher shark, marine protected areas, population risk assessment, stereo videography
Citation
Gokgoz A, Oliver SP, Brown J, Cerna V, Cases G, Lawrence A and Faringstam I (2026) Stereo videography reveals fragility in a high value thresher shark population. Front. Mar. Sci. 12:1696369. doi: 10.3389/fmars.2025.1696369
Received
31 August 2025
Revised
11 December 2025
Accepted
19 December 2025
Published
04 February 2026
Volume
12 - 2025
Edited by
Brad Wetherbee, University of Rhode Island, United States
Reviewed by
Gonzalo Mucientes Sandoval, Spanish National Research Council (CSIC), Spain
Julian A. Tyne, Conservation and Attractions (DBCA), Australia
Updates
Copyright
© 2026 Gokgoz, Oliver, Brown, Cerna, Cases, Lawrence and Faringstam.
This is an open-access article distributed under the terms of the Creative Commons Attribution License (CC BY). The use, distribution or reproduction in other forums is permitted, provided the original author(s) and the copyright owner(s) are credited and that the original publication in this journal is cited, in accordance with accepted academic practice. No use, distribution or reproduction is permitted which does not comply with these terms.
*Correspondence: Simon P. Oliver, s.oliver@chester.ac.uk
ORCID: Simon P. Oliver, orcid.org/0000-0002-2975-1233; Alp Gokgoz, orcid.org/0000-0002-0125-8682
Disclaimer
All claims expressed in this article are solely those of the authors and do not necessarily represent those of their affiliated organizations, or those of the publisher, the editors and the reviewers. Any product that may be evaluated in this article or claim that may be made by its manufacturer is not guaranteed or endorsed by the publisher.