Abstract
National maps are essential to support the conservation, restoration, and sustainable management of blue carbon ecosystems (BCE). This is particularly important for nations in the Indo-Pacific region, including Papua New Guinea (PNG), that aspire to integrate these ecosystems into their nationally determined contributions (NDCs) for ecosystem accounting. This study focussed on mapping the extent of BCEs in PNG using Earth observation data for the year 2020 and reporting on biomass and carbon storage services. Land cover categories were generated using the Living Earth framework for the 15 coastal provinces of PNG. The total BCE area in PNG (14,353 km²) comprised 30% mangrove, 65% lowland peat swamp forest, 3% saltmarsh, and 2% seagrass. Lowland peat swamp forests contribute the greatest biomass (137.94 ± 67.10 Tg) followed by mangroves (71.79 ± 27.16 Tg), with a total biomass of 212.99 ± 95.89 Tg. Across PNG, a total of 710.46 ± 362.75 Tg C were estimated for belowground carbon of BCEs (reporting to 1 m depth), almost seven times more than that of aboveground carbon (102.14 ± 45.97 Tg C). This study highlights the need for a consistent and standardised framework for mapping BCEs, which can support coordinated management of coastal landscapes across provinces that contribute to national policies and NDC reporting. This case study can be used as a demonstration for other nations where similar opportunities and challenges may exist for mapping BCE using Earth observations, with a framework that can be compared and adapted to user requirements.
1 Introduction
Coastal vegetated ecosystems, including mangrove, saltmarsh, and seagrass, are among the most extensive and valuable landscapes across the tropical central Indo-Pacific (Friess et al., 2020; Stankovic et al., 2021). Collectively termed blue carbon ecosystems (BCE), because of their comparatively high potential to provide long-term carbon storage relative to terrestrial ecosystems, these ecosystems provide environmental, economic, and social benefits that link directly to sustainable livelihoods (Macreadie et al., 2021; Sillanpää et al., 2024). BCEs further provide protection of shorelines from extreme events (e.g., severe storms and tsunamis), filter catchment-derived sediment and nutrients harmful to sensitive marine habitats (e.g., coral reefs), and provide nurseries for fish and other fauna (Carrasquilla-Henao and Juanes, 2017). Despite these benefits, extensive loss and degradation of coastal ecosystems has taken place, particularly in Southeast Asia with shrimp aquaculture ponds and oil palm plantations being common replacement land covers (Richards and Friess, 2016). Human activities have also directly accounted for more than two-thirds of the losses of tidal wetlands in Asia (Murray et al., 2022). In addition to adverse impacts on biodiversity and carbon mitigation services, these alternate land uses displace coastal communities, entrench inequality, erode sustainable livelihoods, exacerbate climate change, and contribute to maritime and border security threats (Friess et al., 2020; Sillanpää et al., 2024; Stankovic et al., 2021).
As a consequence of adverse changes to coastal landscapes and in response to international agreements such as the United Nations Framework Convention on Climate Change (UNFCCC), the United Nations Convention on Biological Diversity (CBD), and the RAMSAR Convention on Wetlands, many countries are actively seeking sustainable management of BCE including through protection, conservation, and restoration. Indeed, BCE management practices are also increasingly being recognised in the blue economy strategies of many nations (Steven et al., 2019). Changes in ecosystem extent and condition are considered fundamental to compiling national environmental accounts required by the United Nations System of Environmental-Economic Accounting (SEEA). BCEs are also key habitats for nature-based solutions projects, which are being advanced at local, national, and regional scales (Cohen-Shacham et al., 2016). Accordingly, many nations are aspiring to incorporate BCE assets into greenhouse gas (GHG) emission inventories as a key component of their nationally determined contributions (NDCs) and, where required, are seeking to facilitate sustainable management of BCEs in order to provide livelihood opportunities. Several countries have either now implemented one (e.g., mangroves) or more of these ecosystems into their NDCs or are planning to do so in the future (Friess, 2023).
In order to achieve goals of protection, conservation, and restoration BCEs, with support recognised through international agreements, high-quality maps of coastal landscapes that differentiate coastal vegetated ecosystems are required. In particular, the spatial extent of BCEs and their change over time needs to be identified (Macreadie et al., 2019). Maps depicting ecosystems services are also increasingly required, with these supported by inventories such as biodiversity status or potential carbon emissions. The latter require time-series estimates of amounts of biomass and carbon in the above- and belowground components of vegetation and soils and associated uncertainties. Once obtained, carbon storage, sequestration rates, and emission factors can be estimated. Significantly, such data need to be collected according to recognised activities and ideally at national and subnational scales (IPCC, 2019, 2014).
For many countries in the Indo-Pacific region, there is limited information on BCE extent and condition and on the associated biodiversity and carbon-related services (Worthington et al., 2020; Becker et al., 2025) As many mapping efforts are undertaken at local and regional scales, and often align with specific projects, the collation of national information and maps and their routine update is often incomplete and inaccurate. This is the case for Papua New Guinea (PNG), a largely undeveloped country of the tropical central Indo-Pacific that is ~78% forested and contains significant and diverse BCEs (Gamoga et al., 2021). PNG has made significant commitments to address the impacts of climate change relative to its socioeconomic development status and, in the near future, is intending to include blue carbon into its NDCs (CCDA PNG, 2022). For blue carbon to be effectively incorporated into NDCs, improved mapping of the spatial extents of contributory ecosystems together with relevant national data on carbon stocks, fluxes, and economic valuation of ecosystem services are needed to support national policies and inform management initiatives. A standardised framework for mapping the spatial extent of BCEs and generating estimates of ecosystem services, such as carbon storage into NDCs, would support a routine and standardised monitoring approach for nations such as PNG.
Over the past few decades, technological advances in Earth Observations (EO) and big data storage, processing, and analysis have transformed our ability to map land covers and ecosystems from national scales and facilitated transfer of capability within and between platforms and countries (Gomes et al., 2020; Tang et al., 2018; Worthington et al., 2020). These enhancements have enabled global products to be generated, including those depicting the extent of mangroves [e.g., the Global Mangrove Watch; Bunting et al. (2022a)), tidal marshes (Worthington et al., 2024), seagrasses (McKenzie et al., 2020), and coral reefs (Allen Coral Atlas; Lyons et al. (2024)]. While providing an invaluable contribution, most national to global mapping has focused on individual BCEs and often for one time period (typically a single year). When these maps are combined to reflect the composition of the coastal landscape, gaps (omissions) or overlaps in class extents are commonplace with these compromising area estimates and the monitoring of extent change. Categorical or continuous map products are also associated with uncertainties that need to be identified, quantified, and ideally addressed. As an example, misclassification of mangroves is most frequent on the inland margins and where these adjoin dense broadleaf tropical forests (Bunting et al., 2022a; Simard et al., 2025). Uncertainties in estimates of vegetation biomass can also be substantial, with reference to independently generated ground datasets essential to quantify uncertainties (Santoro et al., 2024). However, many countries lack the national data needed to support product validation, which can lead to low confidence in uptake and subsequent use. The implementation of different land cover or habitat taxonomies within and between countries is also commonplace, which can also lead to inconsistencies in the definitions of classes or the selection of values for thresholding EO data. Often, these taxonomies are inconsistent or not compatible, particularly for scaling to national levels or reporting against international commitments (Keith et al., 2020).
Recognising the spatial and temporal variation between ecosystem extent in the intertidal zone, Murray et al. (2022) generated global maps of three tidal wetlands (tidal flats, mangroves, and tidal marshes) with no overlaps. This capability is also inherent to Living Earth, which is a framework for providing globally consistent and scalable description, mapping, and monitoring of land covers as it utilises the Food and Agriculture Organisation (FAO) Land Cover Classification System (LCCS) (Di Gregorio, 2005). Instead of using selected end classes of the FAO LCCS as target categories, Living Earth uniquely constructs land covers from environmental descriptors with defined units or categories retrieved or classified primarily from Earth observation (EO) data (Lucas et al., 2019; Owers et al., 2021). A major advantage is that mutually exclusive land cover classes are generated which can be translated to a diverse range of habitats and ecosystem types (Kosmidou et al., 2014; Punalekar et al., 2021), including by integration of contextual information such as topography (Punalekar et al., 2024). The capacity to scale Living Earth is enhanced by its use of globally relevant taxonomies, specifically the FAO LCCS, that provide independence of scale and time because of the use of consistent units or categories. Living Earth has been successfully implemented operationally at national scales in Australia and Wales, through Digital Earth Australia (Owers et al., 2022) and the Welsh Data Cube (Planque et al., 2025), respectively.
The aim of this study was to generate a national map of coastal landscapes for Papua New Guinea (PNG) using Living Earth, with a view to providing provincial estimates of BCE extents and associated biomass and carbon stocks based on existing datasets. This case study provides an opportunity to evaluate transferability and translatability of Living Earth, respectively, to i) the Commonwealth Scientific and Industrial Research Organisation (CSIRO) Earth Analytics Science and Innovation (EASI) data cube instance that hosts satellite (Landsat and Sentinel) data processed to analysis ready data (ARD) across Southeast Asia, and ii) a unique tropical location, PNG, where opportunities and challenges exist for mapping and monitoring from Earth observations. The potential uses and applications of these maps are also highlighted, particularly in relation to policy requirements and international obligations (e.g., UNFCCC, SEEA, REDD+). As such, we report on first-order biomass and carbon estimates based on existing literature and data, and national mapping of blue carbon ecosystems for PNG.
2 Materials and methods
2.1 Papua New Guinea case study
Papua New Guinea occupies the eastern half of the island of New Guinea and covers 462,840 km2 when the islands of New Britain, New Ireland, the Autonomous Region of Bougainville, and a further 600 smaller islands and atolls in addition to over 800,000 km2 of ocean are included (Figure 1). The country is administered as 22 provinces, with 15 connected to the coast, grouped into three regions (Momase, Southern, Islands). The coastal regions, islands, and atolls, in particular, are vulnerable to extreme weather events, coastal flooding, and sea level rise, with this being higher (~7 mm year−1) than the global average of 2.8–3.6 mm year−1 (Howes, 2018; IPCC, 2022).
Figure 1
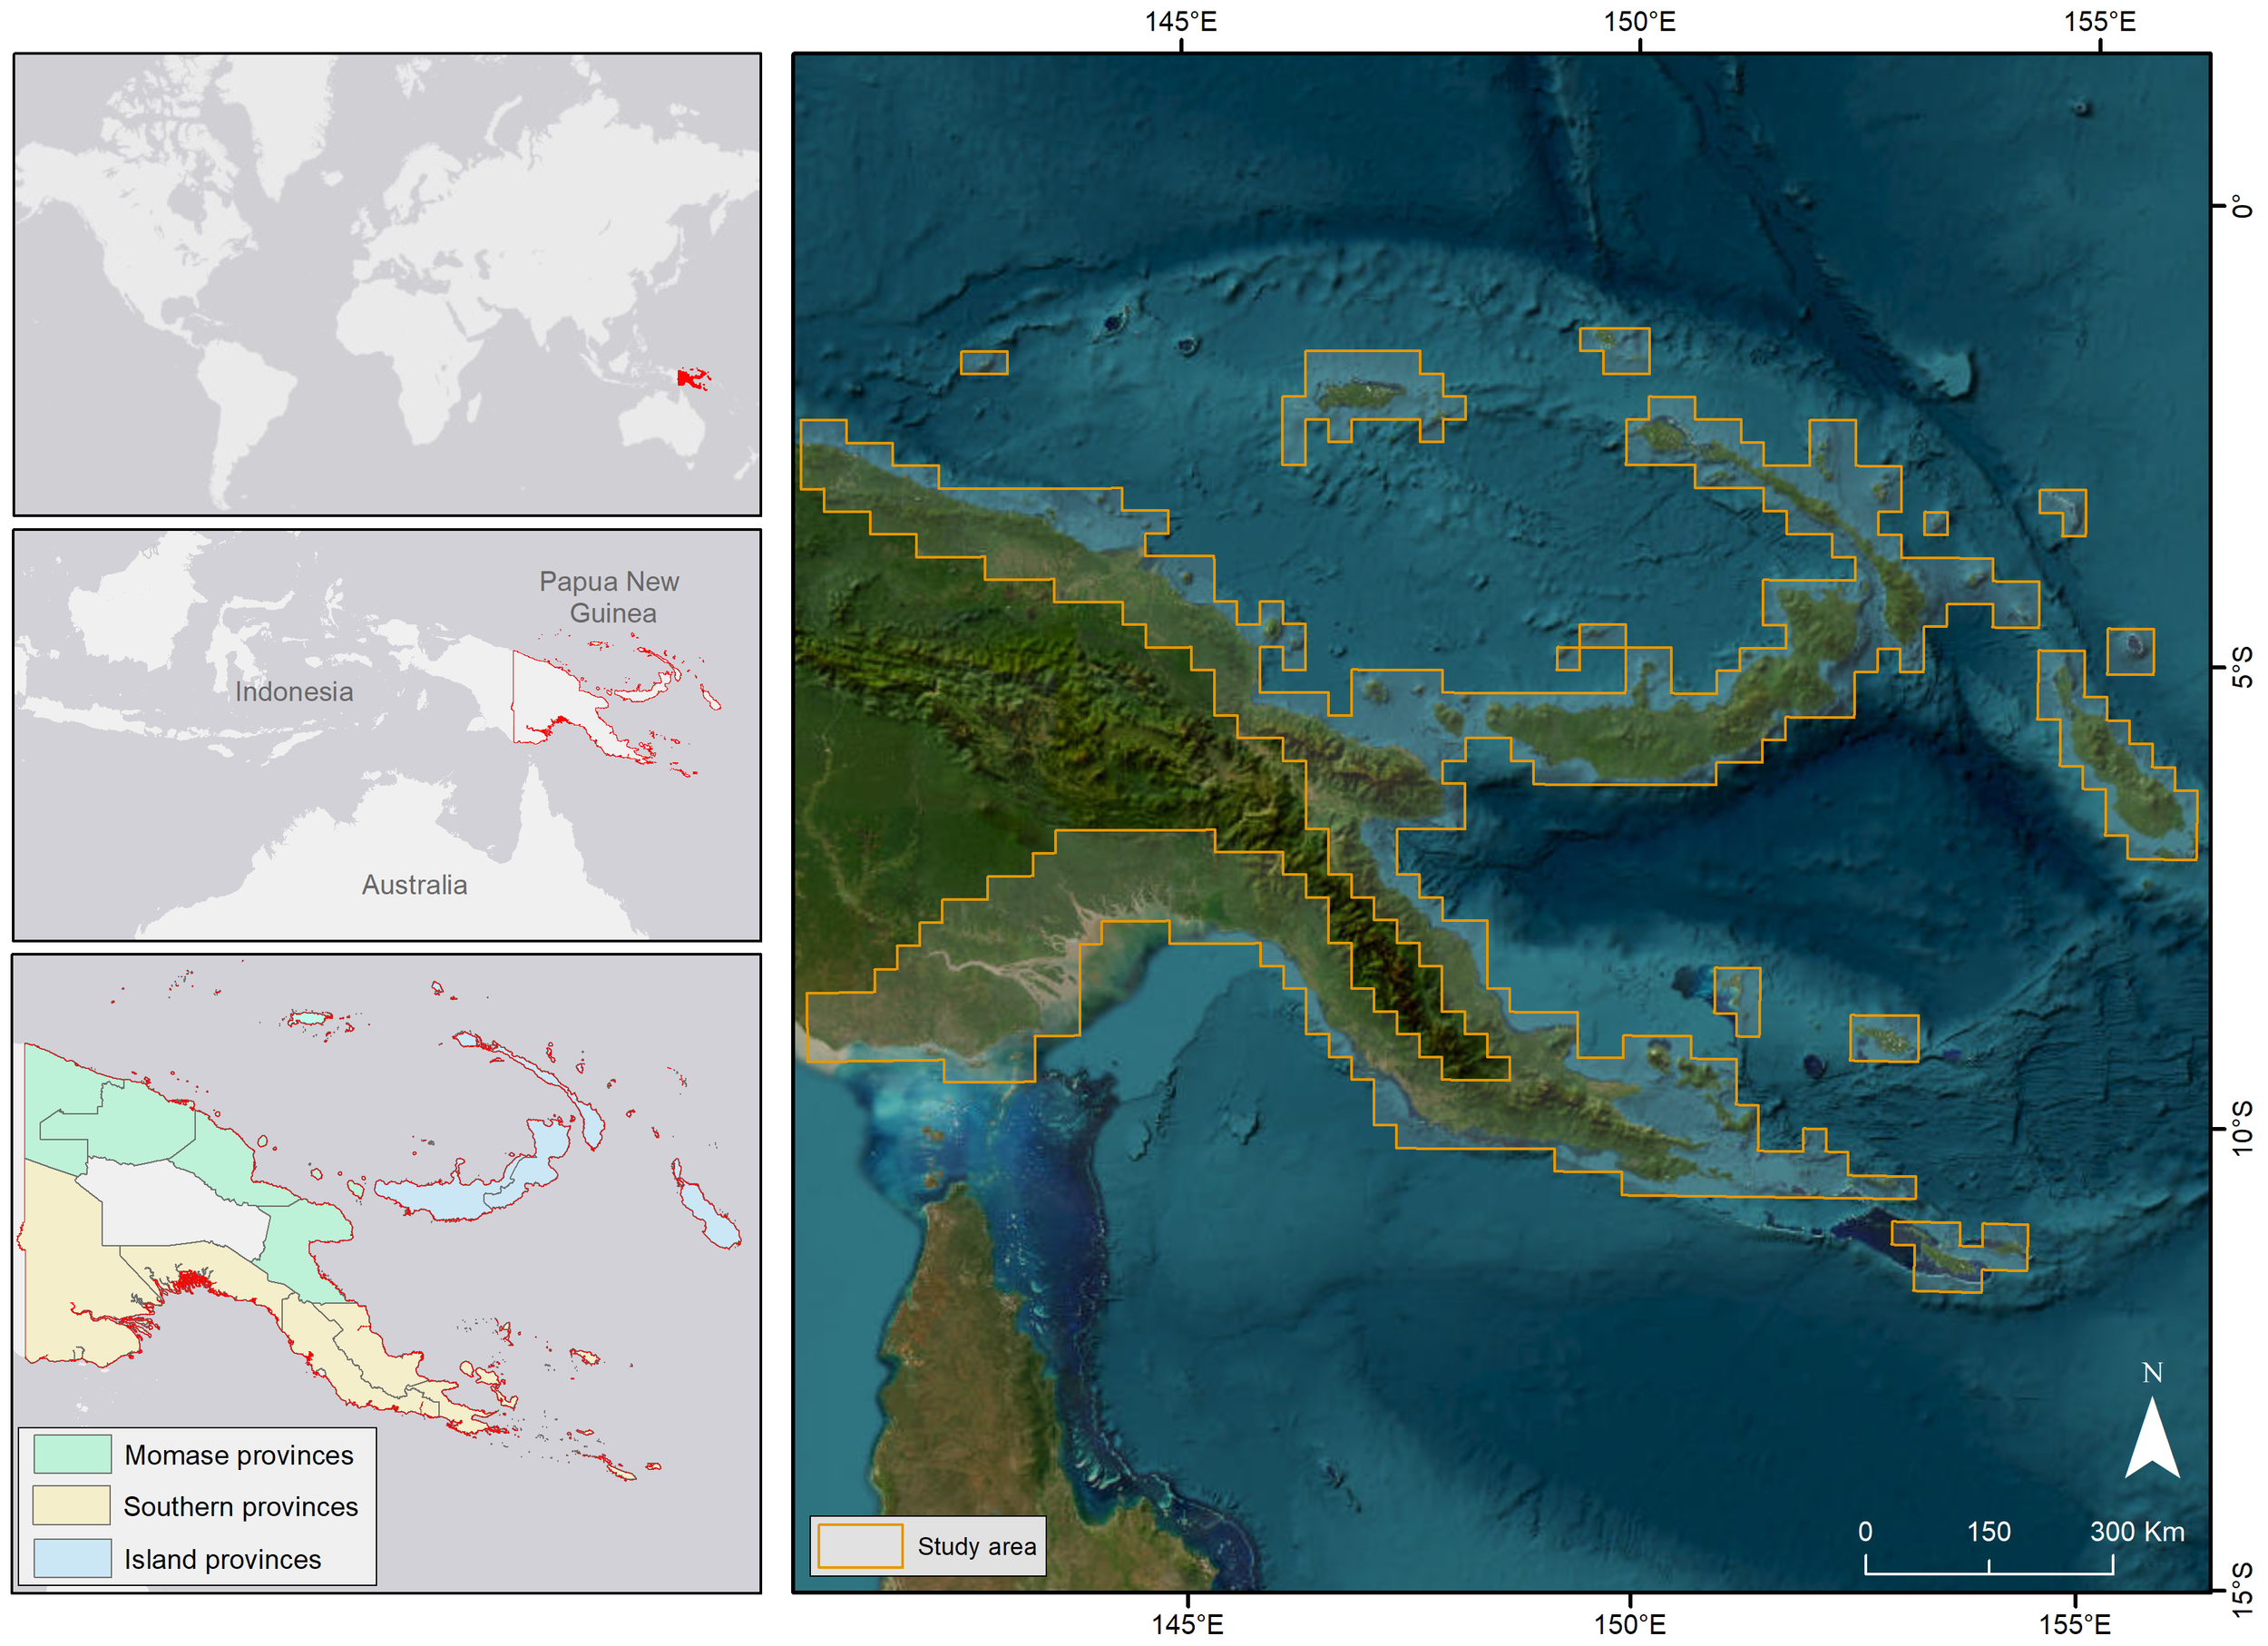
Location of Papua New Guinea and its coastal regions (Momase provinces, Southern provinces, Island provinces), showing the extent of coastal areas mapped in this case study.
The country is geomorphologically diverse, having a rugged mountainous interior vegetated with tropical forest and savannah grass plains surrounded by extensive lowland plains that reach to the coast and dissected by large rivers and deltas, swamps and lagoons, and extensive lowland peat swamp forests. The country is an area of exceptional species endemism, supporting an estimated 5%-9% of the world’s terrestrial biodiversity and the world’s highest known marine biological diversity, including more than 40 species of mangrove (Ellison, 2019, 1997; UNESCO, 2022) and 13 seagrass species (McKenzie et al., 2021).
PNG is the eighth most mangrove-rich country in the world, with an estimated area of 4,525 km2 (Bunting et al., 2022b). The largest and most diverse mangal communities occur within the deltaic systems and mouths of the Purari, Kikori, and Fly rivers (Southern provinces) and the Sepik and Ramu rivers (Momase provinces). These communities are distributed in relation to local geomorphic features and according to salinity and elevation preferences (Ellison, 1997; Rowe et al., 2013; Shearman and Bryan, 2015). For intertidal areas subject to frequent inundation, and where salinities are greater than 10 ppt, Rhizophora spp. and Bruguiera spp. often dominate whereas Avicennia spp. predominate on the less frequently inundated intertidal areas (Rowe et al., 2013). Inland, and along brackish tributaries, Nypa woodland (Nypa fruticans) and pandan (Pandanus spp.) are common with Sonneratia spp. frequenting accreting banks. In areas of lower salinity, mixed vegetation communities (mosaics) comprised of mangrove species and associates and freshwater swamp forest species (e.g., Campnosperma, Terminalia, Calophyllum spp., Intsia bijuga (Kwila), Myristica hollrungii, and Amoora cucullata) are more common. However, where areas are well-drained, these forests are often replaced by lowland rainforest, dominated by an association of Pometia and Octomeles sumatrana with Melaleuca spp. and Casuarina spp. occurring as pioneer vegetation on swampy alluvial soils (Shearman and Bryan, 2015).
Areas of saltmarsh with primarily herbaceous vegetation are dominated by species from the genera Leersia, Saccharum-Phragmites, and Pseudoraphis. Seagrass communities form a significant coastal habitat that extends from the intertidal to the subtidal zone and across a range of settings including mangrove coastlines, estuaries and shallow embayments, coral-reef platforms, inter-reef seabeds, and island shores (McKenzie et al., 2021, 2006).
2.2 Data access and processing
Earth observation (EO) data were accessed using the CSIRO Earth Analytics Science and Innovation Platform (EASI). EASI builds upon the Open Data Cube framework to store, access, and analyse EO data using cloud computing services (Woodcock et al., 2018). EASI ASIA is an instance of the EASI platform that provides data and analytical capacity from large areas of Southeast Asia. This includes satellite sensor data for the Landsat program, Sentinel-1 and -2 from the Copernicus program, and other freely available datasets (https://explorer.asia.easi-eo.solutions/products). For this study, we utilised Landsat-8 and Sentinel-1 data to generate an annual map of PNG coastal landscapes for the year 2020. EASI ASIA provided analytical capacity to generate land cover classification maps from EO data as well as integration of external ancillary datasets into scalable analytics and workflows for national mapping (Table 1).
Table 1
| FAO LCCS | Layer | Method | Source |
|---|---|---|---|
| Vegetated/non-vegetated (L1) | • Fractional cover (PV, NPV) • Water Observations from Space (WOfS) | • Annualised Fractional Cover 90th percentile where PV and NPV were greater than 25%. • Annual Fractional Cover 90th percentile pixels where NPV was greater than 25% were removed. • Mask to remove erroneous water classifications with WOfS (as in L2). | Gill et al. (2017); Mueller et al. (2016) |
| Aquatic/terrestrial (L2) | • Water Observations from Space (WOfS) • Global Mangrove Watch (GMW) • Tidal wetland probability | • Annualised WOfS where observational frequency was greater than 20% to remove flood events not indicative of water in the landscape. • Mask delineating aquatic areas where mangroves were present from GMW. • Mask delineating aquatic areas where tidal wetland probability layer was greater than 50%. | Bunting et al. (2022b); Mueller et al. (2016); Murray et al. (2022) |
| Aquatic vegetation (L3) | • Aquatic/terrestrial (L2) | • Inherited from L2. | |
| Artificial surfaces/bare surfaces (L3) | • Open street map | • Artificial surfaces classified where open street map data were categorised as building, airports or roads. • Roads were only considered if categorised as ‘primary’, ‘primary link’, ‘secondary’, ‘secondary link’, ‘trunk’, trunk link’. | OpenStreetMap contributors (2017) |
| Waterbodies (L3) | • Aquatic/terrestrial (L2) | • Inherited from L2. | |
| Lifeform (L4) | • Sentinel-1 | • Derived from Sentinel-1where annualised woody frequency was greater than 90% | Planque et al. (2020) |
| Terrestrial woody lifeform (L4) | • Aquatic/terrestrial (L2) • Lifeform (L4) | • Inherited from aquatic/terrestrial (L2) and lifeform (L4) | |
| Terrestrial herbaceous lifeform (L4) | • Aquatic/terrestrial (L2) • Lifeform (L4) | • Inherited from aquatic/terrestrial (L2) and lifeform (L4) | |
| Mangrove (L4) | • Natural aquatic vegetation (L3) • Global Mangrove Watch (GMW) | • Inherited from natural aquatic vegetation (L3) • Where lifeform (L4) was classified as woody • Where mangrove were present in GMW | Bunting et al. (2022b) |
| Lowland peat swamp forests (L4) | • Natural aquatic vegetation (L3) • Global Mangrove Watch (GMW) | • Inherited from natural aquatic vegetation (L3) • Where lifeform (L4) was classified as woody • Where mangrove were not present in GMW | Bunting et al. (2022b) |
| Saltmarsh (L4) | • Natural aquatic vegetation (L3) • Lifeform (L4) | • Inherited from natural aquatic vegetation (L3) • Where lifeform (L4) was classified was not woody | |
| Seagrass (L4) | • Natural aquatic vegetation (L3) • Lifeform (L4) • Seagrass intertidal extent | • Inherited from natural aquatic vegetation (L3) • Where lifeform (L4) was classified was not woody • Seagrass intertidal extent probability greater than 50% | Lyons et al. (2020, 2024) |
Derived overarching and additional environmental descriptors integrated to the Living Earth system applied to the PNG case study.
2.3 Land cover mapping using the Living Earth system
Living Earth is a free and open-source software (https://bitbucket.org/au-eoed/livingearth_lccs) that provides a framework for implementation of FAO LCCS using Earth observation data (Lucas et al., 2022; Owers et al., 2022). The land cover taxonomy is hierarchical, consisting of a binary decision tree structure (Figure 2). A total of nine (9) land cover categories were generated using Living Earth for coastal landscapes of PNG (Figure 2). Primarily vegetated areas, defined as vegetative cover of at least 4% for at least 2 months of the year, were initially differentiated from primarily non-vegetated areas (Di Gregorio, 2005). Terrestrial and aquatic areas were subsequently identified, where the latter were associated with landscapes that are significantly influenced by the presence of water over an extended period each year. Natural terrestrial and aquatic vegetation were further classified to differentiate lifeform, as to whether vegetation was woody (e.g., shrublands, forests) or herbaceous. For terrestrial vegetation, terrestrial woody vegetation and terrestrial herbaceous vegetation were differentiated. BCEs are not explicitly differentiated in the FAO LCCS; however, Living Earth provides a flexible classification system for additional environmental descriptors at LCCS Level 4 (Figure 2). For aquatic vegetation, woody lifeforms were classified as either mangrove or areas of lowland peat swap forests; as for herbaceous lifeforms, saltmarsh and seagrass classes were recognised. As the project aimed to map BCE, the focus was on coastal landscapes with (semi)natural land covers. Consequently, the cultivated/managed areas were not differentiated. Primarily non-vegetated areas were of lesser interest and only classified to overarching environmental descriptors (LCCS Level 3) of artificial surfaces, bare surfaces, and water bodies.
Figure 2
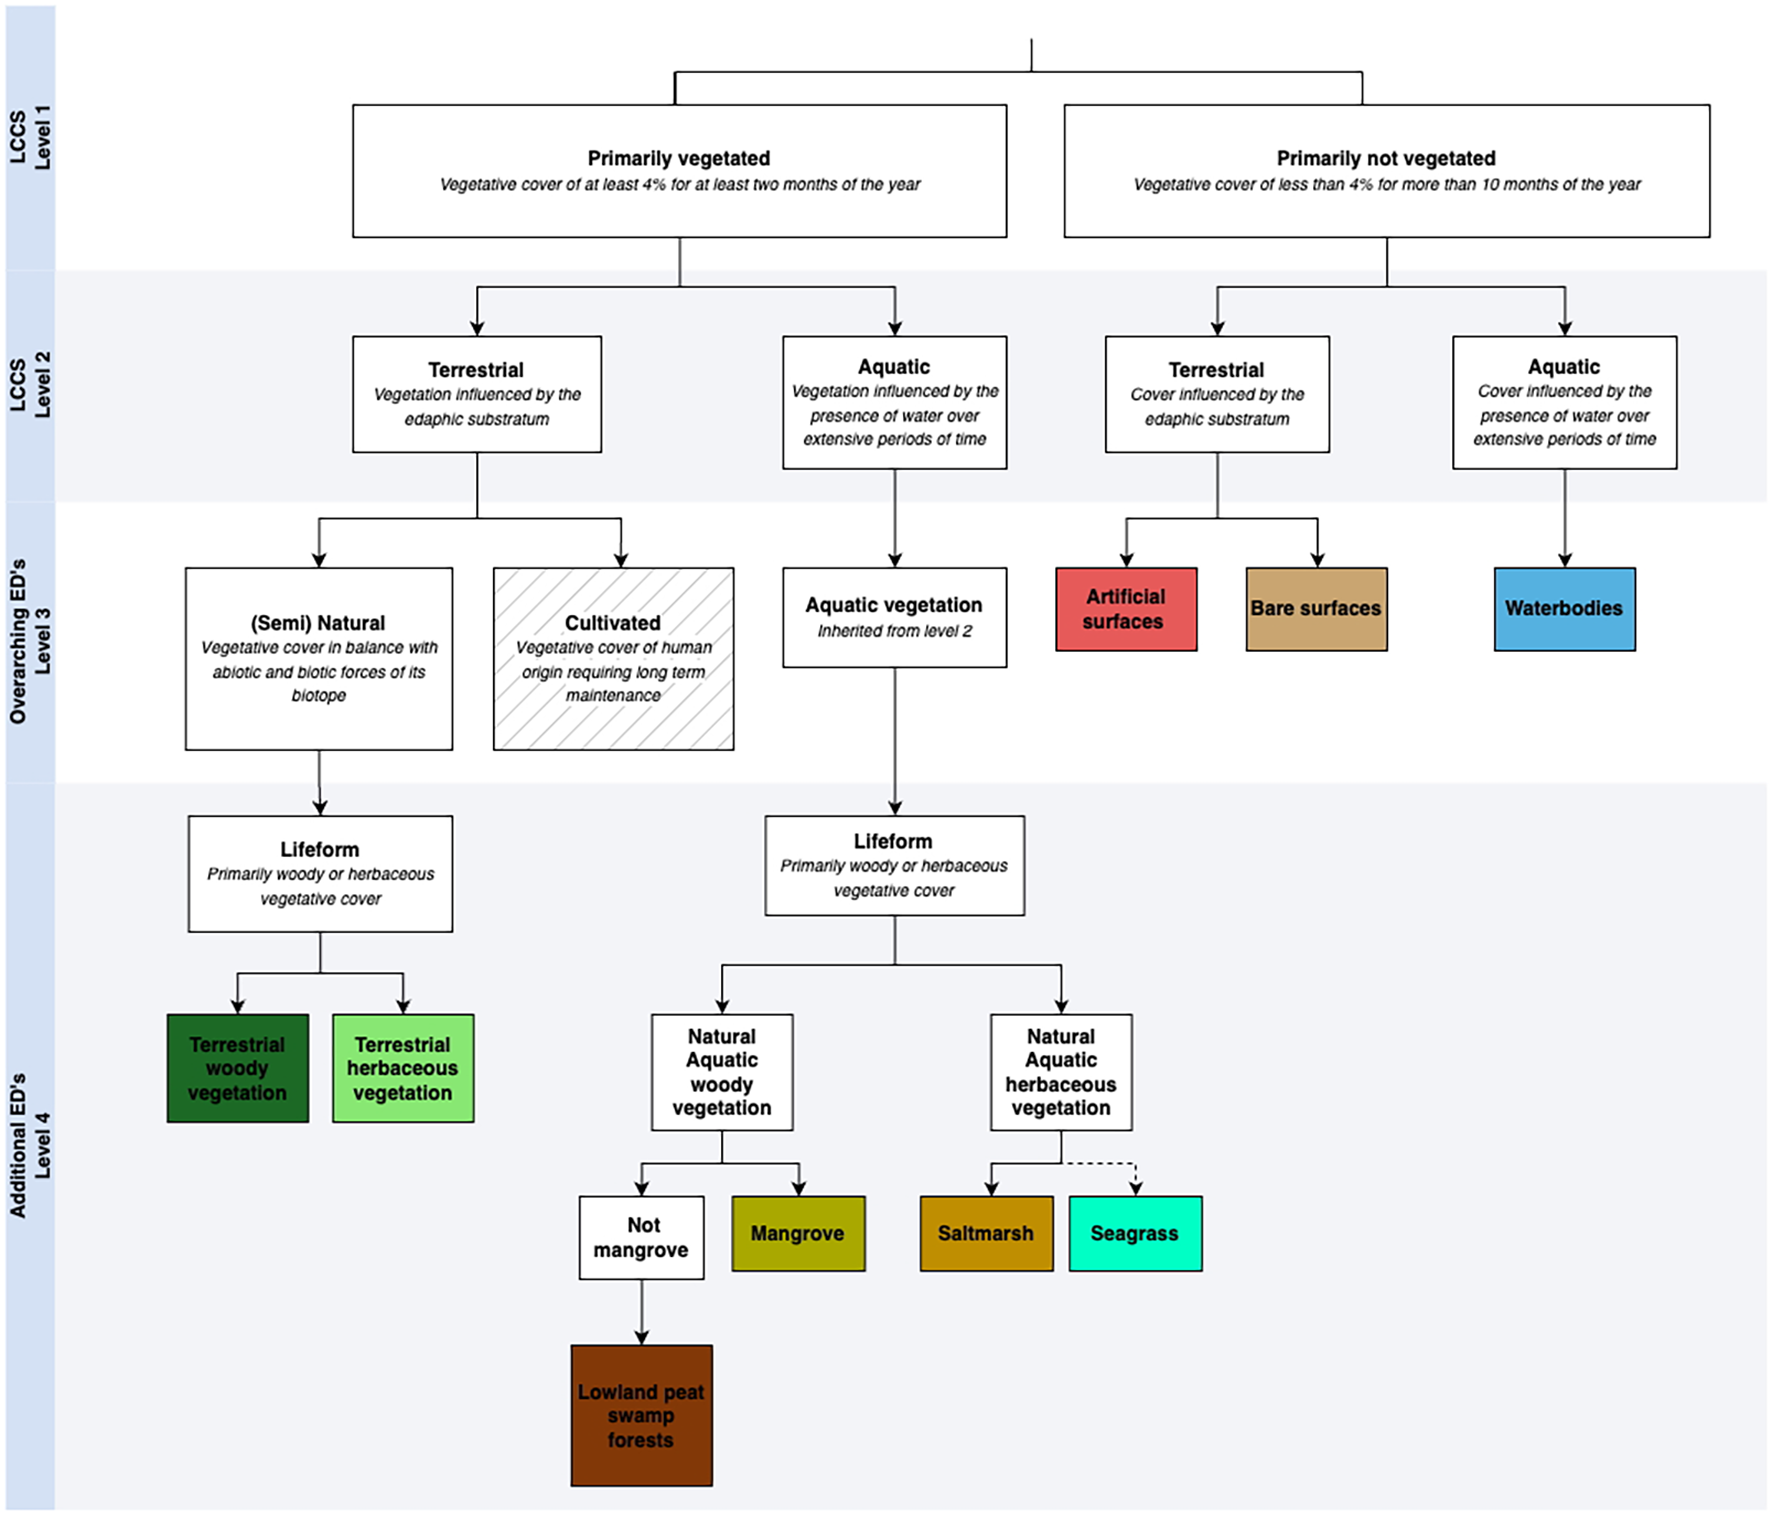
Living Earth hierarchy showing Overarching Environmental Descriptors (EDs) (LCCS Level 3) and Additional Environmental Descriptors (LCCS Level 4) to map coastal land cover and blue carbon ecosystems. Detailed description of datasets and workflow provided in Table 1. Dotted line for seagrass indicates BCE not fully integrated into the FAO LCCS framework as this is primarily subtidal and not recognised as terrestrial land cover.
Differentiation between vegetated and non-vegetated surfaces (LCCS Level 1) was achieved using Landsat-derived fractional cover, specifically the 90th annual percentile for both photosynthetic (PV) and non-photosynthetic vegetation (NPV) (Gill et al., 2017). To be classified as a primarily vegetated pixel, the 90th annual percentile of PV and NPV fraction was greater than 25% (Table 1). To differentiate aquatic from terrestrial surfaces (LCCS Level 2), the former were first identified using a combination of open water and coastal wetland areas. Areas of open water were mapped using the Water Observations from Space (WOfS) algorithm (Mueller et al., 2016) where the observation frequency of water was greater than 20% for the year. Aquatic vegetation including mangroves, lowland peat swamp forests, and saltmarsh extent were obtained from existing datasets. Specially, mangrove extent was obtained from the Global Mangrove Watch (GMW), whereas those of lowland peat swamp forests and saltmarsh were retrieved using the tidal wetland probability layer developed by Murray et al. (2022), with the probability threshold set to >50%. Artificial surfaces were identified using the Open Street Map data, with these including buildings, airports, and roads (Table 1).
Additional environmental descriptors were obtained by either reference to existing sources or direct retrieval and classification from EO data. The woody lifeform category was identified using annual Sentinel-1 time-series and an algorithm developed by Planque et al. (2020) (Table 1). The areas associated with the GMW maps of mangrove extent were also integrated where these did not overlap with the Sentinel-1-derived woody layer. The herbaceous lifeform categories included terrestrial and aquatic areas, with the latter being associated with saltmarsh in tidal areas. Seagrass extent was mapped for shallow and clear waters, using methods described in Lyons et al. (2020, 2024), with a probability threshold set to >50%.
2.4 Generation of land cover mapping and reporting on biomass and carbon for blue carbon ecosystems
Land cover mapping was generated using EO data (i.e., Landsat-8, Sentinel-1, external ancillary data) for the 2020 calendar year across the 15 coastal provinces in PNG at 30-m spatial resolution. The Living Earth system integrated EO-derived data to classify nine land cover classes. These include coastal vegetation ecosystems of mangrove, saltmarsh, lowland peat swamp forest, and seagrass. The areal extents of each of these BCEs and other land cover classes were summarised to highlight regional differences in land cover areas between provinces with coastal landscapes. In addition, shore normal transects of six sites were generated to examine the spatial variation across the coastal landscape of land cover classes, together with aboveground biomass (Santoro et al., 2024) and canopy height (Potapov et al., 2021) datasets.
First-order biomass and carbon stock estimates were generated for all mapped BCEs for PNG to support reporting on nationally determined contributions (NDCs). Given the paucity of biomass and carbon information available for PNG, appropriate global (e.g., IPCC Wetlands Supplement, recent global synthesis), realm (e.g., Indo-Pacific/Oceania), and regional (e.g., Papua and West Papua, Indonesia) estimates were used as well as available global datasets (Table 2). Aboveground biomass for mangrove, saltmarsh, and lowland peat swamp forests were estimated using ESA CCI Biomass version 5.1 data for 2020 (Santoro et al., 2024). Biomass estimates are produced globally at 100-m spatial resolution. These data were resampled to align with land cover mapping (30 m) by first resampling to 10 m and dividing biomass values (Mg ha−1) by 100, and then resampling to 30 m and multiplying biomass values by 9. Uncertainty estimates were also generated for each BCE using the standard deviation layer provided by ESA CCI Biomass. Seagrass was unable to be estimated using this global dataset and was estimated using existing literature values (Collier et al., 2021; Strydom et al., 2023). Belowground biomass for all BCEs was estimated using mean values from existing literature (Table 2).
Table 2
| Measurement | Seagrass | Mangrove | Lowland peat swamp forest | Saltmarsh |
|---|---|---|---|---|
| AGB | Extent × 0.41 | ESA CCI biomass2 | ESA CCI biomass2 | ESA CCI biomass2 |
| BGB | Extent × 21 | AGB × 0.493 | AGB × 0.493 | AGB × 3.654 |
| AGC | AGB × 0.03365 | AGB × 0.486 | AGB × 0.486 | AGB × 0.457 |
| BGC-B | BGB × 0.03365 | BGB × 0.396 | BGB × 0.396 | BGB × 0.347 |
| SOC | 1948 | Mangrove SOC dataset9 | 56810 | 2687 |
| BGC | BGC-B + SOC | BGC-B + SOC | BGC-B + SOC | BGC-B + SOC |
Sources and values used to estimate aboveground biomass (AGB), belowground biomass (BGB), aboveground carbon (AGC), belowground carbon (of biomass) (BGC-B), soil organic carbon (SOC), and total belowground carbon (BGC) stocks of blue carbon ecosystems relevant to Papua New Guinea.
All values reported in this table are Mg ha−1. Uncertainty sources and values used in calculations provided in Supplementary Table S1.
1Collier et al. (2021); Strydom et al. (2023); 2Santoro et al. (2024); 3IPCC (2019, 2014); 4Howard et al. (2014); 5Duarte (1990); 6Kauffman and Donato (2012); 7Maxwell et al. (2024); 8Krause et al. (2025); 9Hengl et al. (2023); 10Kauffman et al. (2025) from Supplementary Table S1 based on 1-m estimate (568 = (2,446 Mg C ha−1/431 cm soil depth) * 100 cm).
Aboveground carbon estimates were derived from aboveground biomass by applying conversion factors provided by the IPCC (IPCC, 2019, 2014). Belowground carbon (of biomass) was similarly estimated using conversion factors from aboveground biomass (Table 2). Soil organic carbon content was conservatively estimated to 1 m below the surface. For mangrove, we utilised a global dataset that models carbon stocks to 1 m (Hengl et al., 2023). Uncertainty estimates were generated using the 95% confidence interval layers provided by Hengl et al. (2023). For saltmarsh, the recent global dataset on saltmarsh carbon stocks was not appropriate for use in PNG as identified by the creators due to low confidence in the area of applicability (Maxwell et al., 2024). Therefore, we used existing global or realm mean values for estimating saltmarsh as well as seagrass soil organic carbon. Very limited knowledge exists for lowland peat swamp forest extent, biomass, and carbon stocks; however, we utilised reported values for Indonesia in Kauffman et al. (2025) for estimating soil organic carbon stocks to 1 m (reported in the study to 4 m; however, for NDC reporting consistency, these values for divided by 4). Total belowground carbon was calculated as the sum of belowground carbon (of biomass) and soil organic carbon. All biomass and carbon estimates were generated for each BCE in the 15 coastal provinces of PNG and reported in Teragrams (Tg).
3 Results
3.1 Land cover mapping for PNG
Mapping of the coastal landscapes for PNG were generated for 2020 at 30-m spatial resolution (Figure 3; https://data.csiro.au/collection/csiro:65849). This was based on the framework of Living Earth, with the open-source software produced under an Apache 2.0 license and available online (Living Earth: https://bitbucket.org/au-eoed/livingearth_lccs, PNG case study: https://github.com/livingearth-system/livingearth_png (Owers et al., 2024)). The national land cover mapping of PNG case study focussed on coastal landscapes due to the focus on mapping BCEs. The total areal extent of BCEs for PNG for 2020 was estimated to be 4,315 km2 for mangrove, 9,289 km2 for lowland peat swamp forest, 431 km2 for saltmarsh, and 317 km2 for seagrass areas. Woody vegetation was the most extensive BCE (e.g., mangrove and lowland peat swamp forest). In the coastal landscape, terrestrial woody vegetation had greater extent (203,038 km2) than terrestrial herbaceous vegetation (17,821 km2). Artificial surfaces, such as residential and industrial areas, were a minor contribution (46 km2) and were concentrated around the capital Port Moresby. Unvegetated (2,710 km2) and bare areas (2,195 km2) were also smaller land cover extents than vegetated areas.
Figure 3
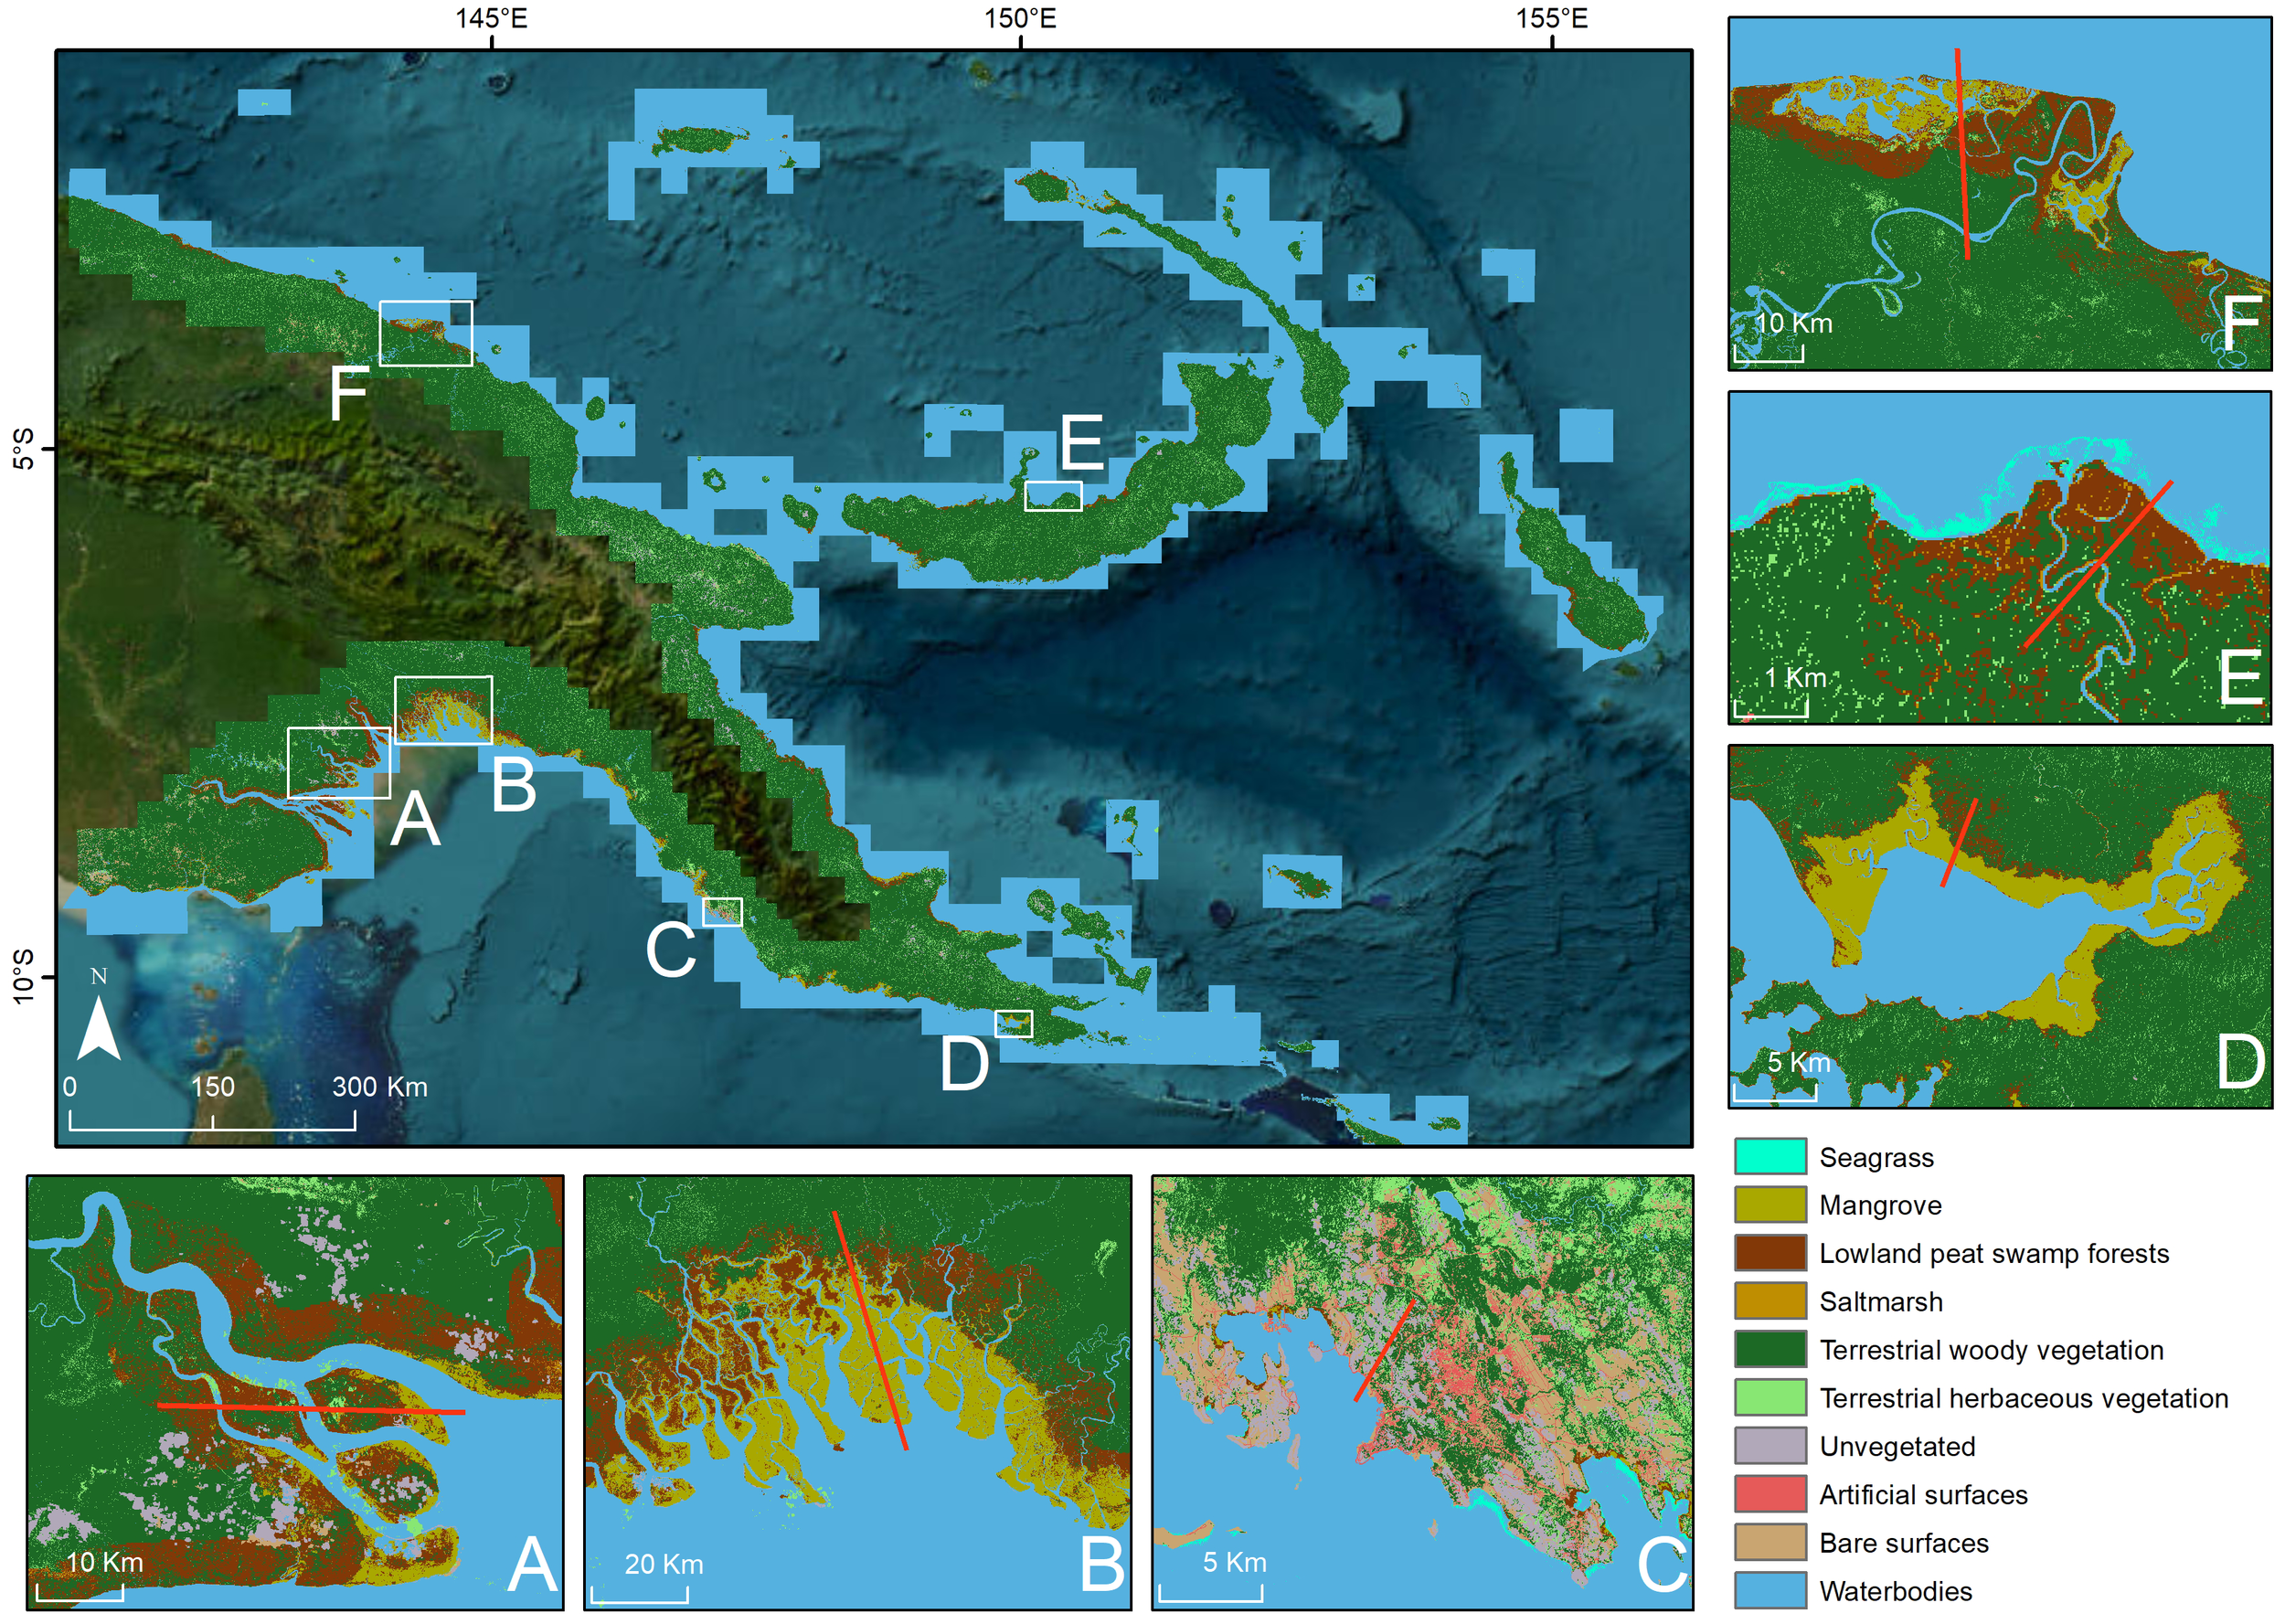
Land cover mapping for the coastal landscapes of PNG generated through Living Earth framework using Earth observation data. Shore normal transects of 6 sites (red line) displayed for (A) Fly river delta of Western Province, (B) Kikori delta, Central Province, (C) Port Morsby, Central Province, (D) near Orangerie Bay, Milne Bay Province, (E) Dagi river, West New Brittain Province, (F) Sepik river, West Sepik Province. Data are available for download https://data.csiro.au/collection/csiro:65849.
3.2 Blue carbon ecosystem extent in PNG
The total BCE extent for 2020 in PNG was calculated as 14,353 km2. The southern region exhibits the greatest proportion of mapped BCEs (10,785 km2), contributing >75% of the total areal extent of BCEs in the country (Figure 4). The Western and Gulf provinces contribute 75% of total areal extent of the southern region and 57% of total extent of BCEs in PNG, with 3,631 and 4,494 km2, respectively. In the coastal provinces of Momase and the Island regions, BCEs occupied 1,381 and 2,187 km2 respectively, with their distribution being typical to estuarine, open coast, and coral atolls within the Indo-Pacific region.
Figure 4
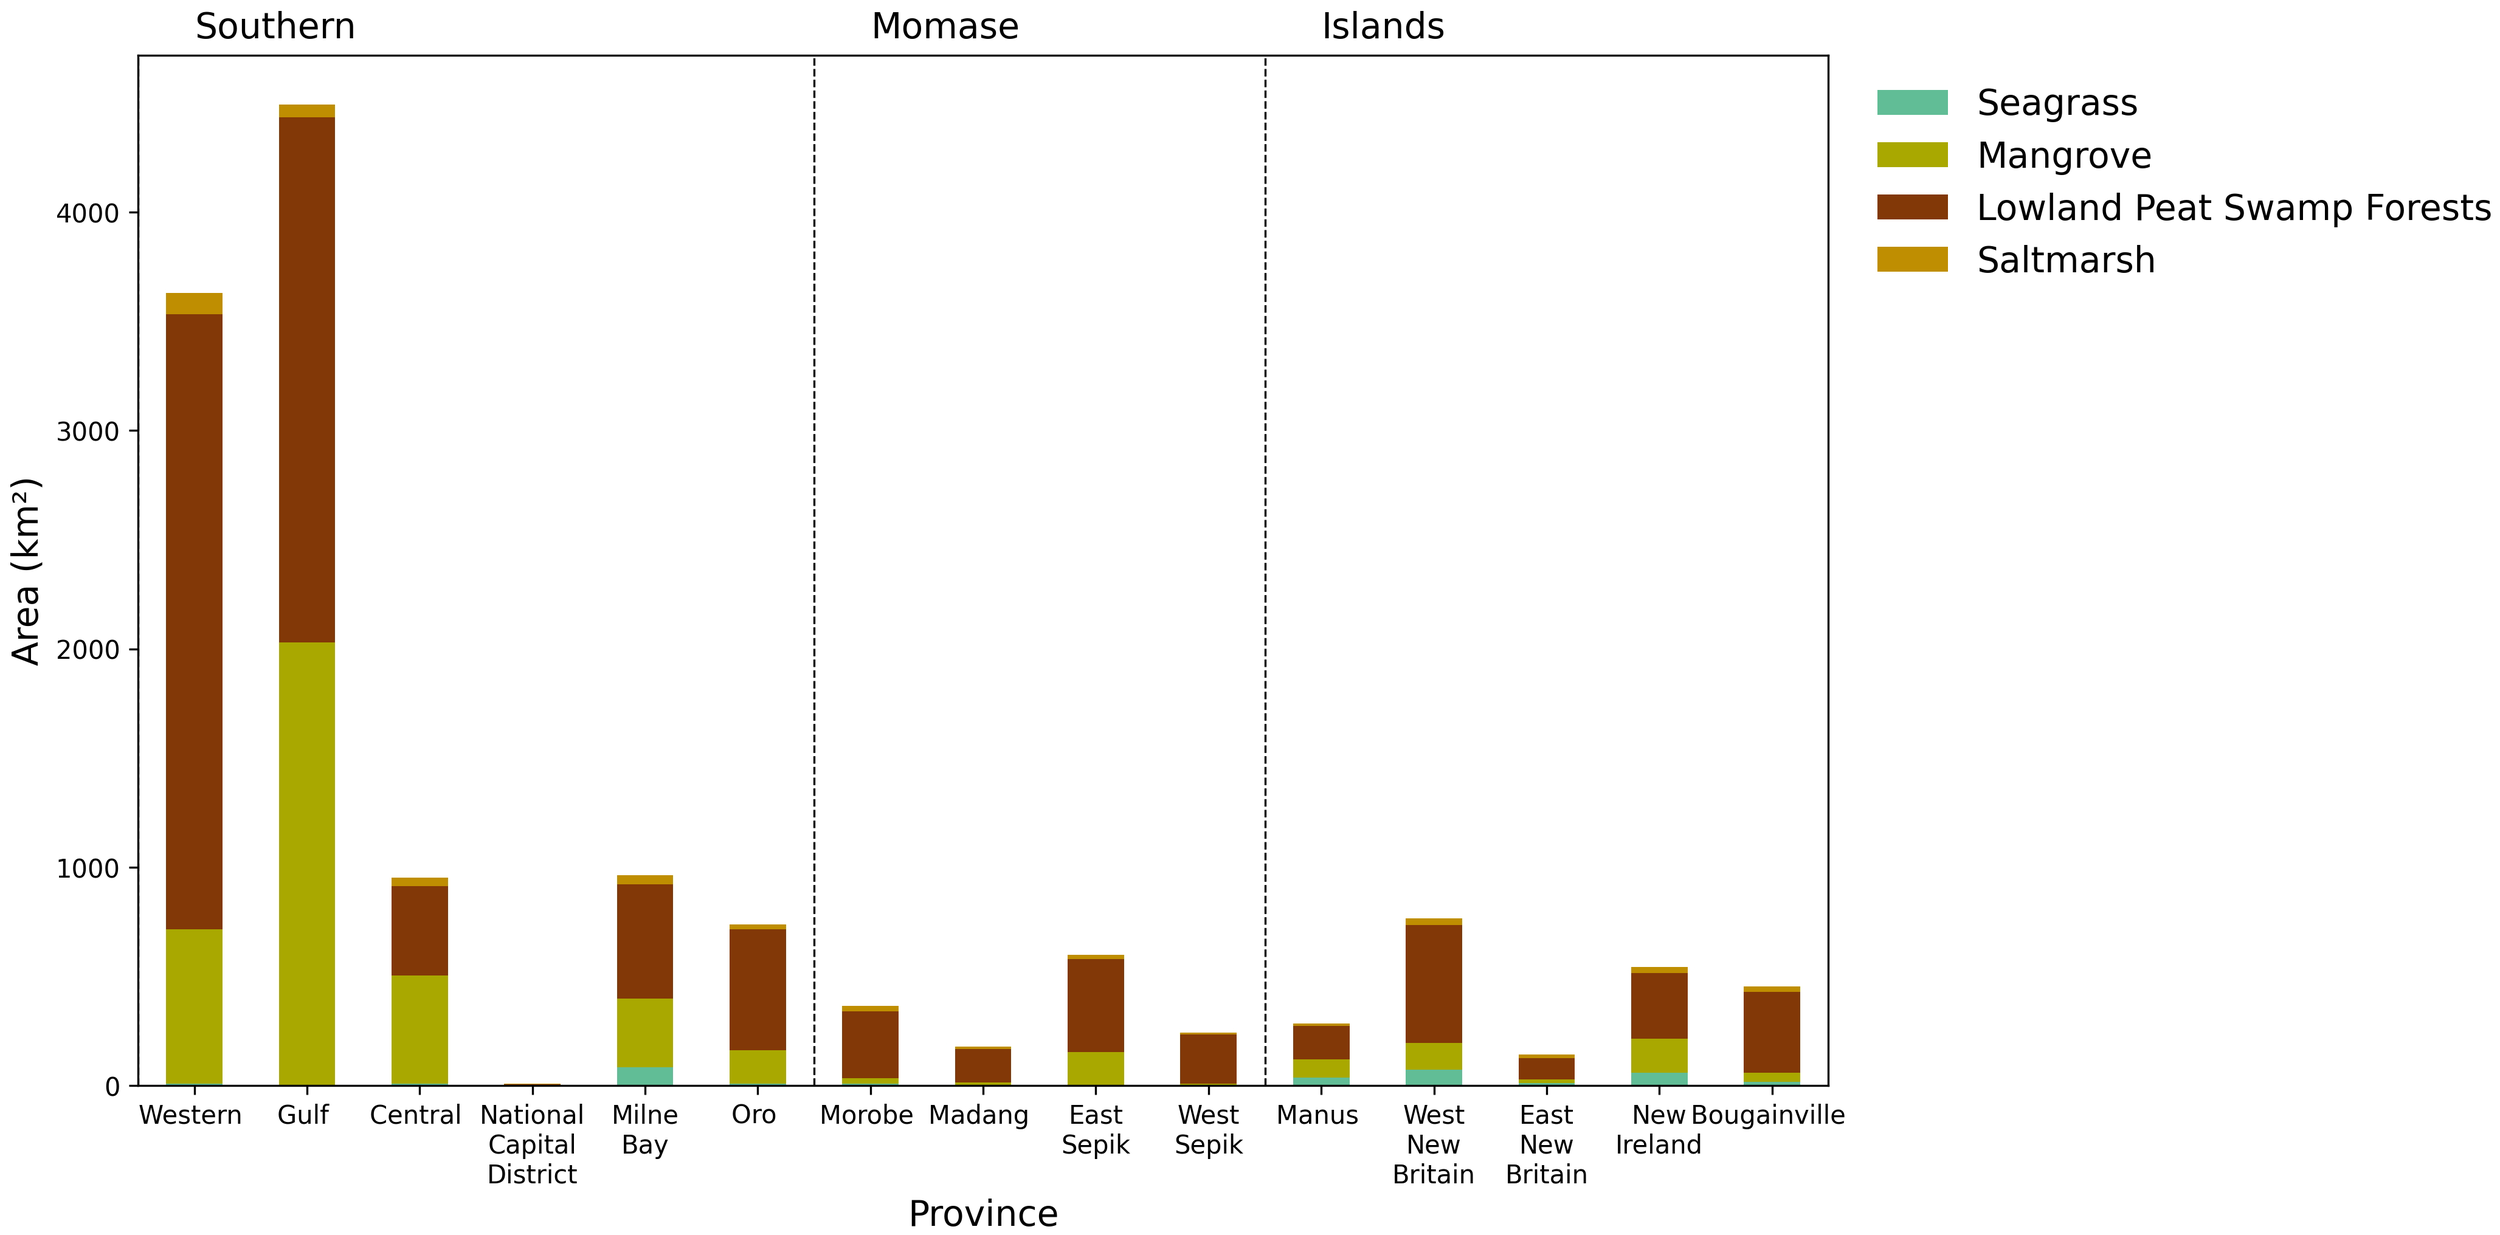
Extent calculations of BCEs for PNG generated from the 2020 mapped area. Extent has been reported based on region (Figure 1) and 15 provinces that have coastal landscapes. Note: seagrass was unable to be accurately identified in the Gulf province due to high turbidity levels. Extent values used to generate figure are provided in Supplementary Table S2.
Lowland peat swamp forest was recorded to have the greatest proportional extent of all BCEs based on national mapping, with 9,289-km2 areal extent, contributing 65% of total area of BCEs in PNG (Figure 4). This was followed by mangrove (4,315 km2, 30% of total area), saltmarsh (431 km2, 3% of total area), and seagrass (317 km2, 2% of total area). The greatest extent of mangrove was recorded in the Gulf province (2,029 km2, 45% of BCE area in province), whereas the Western province contained the greatest extent of saltmarsh (99 km2, 2% of BCE area in province) and lowland peat swamp forest (2,817 km2, 78% of BCE area in province). The seagrass extent was greatest in the Island region of West New Brittain (74 km2, 4% of BCE area in province). Lowland peat swamp forest represented the greatest proportional extent of all mapped BCEs for PNG provinces, with the exception of Central province (mangrove contributed 52% of BCE area in province) and the National Capital District (seagrass contributed 38% of BCE area in province). Saltmarsh or seagrass were consistently the smallest extents of BCE for all provinces in PNG.
Shore normal transects demonstrate the diversity of coastal landscapes across PNG. Mangrove or lowland peat swamp forest were the most common land covers at the shoreline, often associated with aboveground biomass of 50–100 Mg ha−1 (Figure 5). These often transitioned into areas of terrestrial woody vegetation that varied in biomass (50–100 Mg ha−1, Figures 5A’, F’; >100 Mg ha−1Figures 5B’, D’, E’) and height (<10 m Figures 5A’, F’; >10 m Figures 5B’, D’, E’). The BCE inland extent varied with geomorphic setting, with mangrove extending ~35 km inland for Kikori delta, Central Province (Figure 5B’), compared with <5 km for most other locations. The transect across Port Morsby, Central Province, demonstrates the concentration of unvegetated and artificial surfaces, such as residential and industrial areas (Figures 5C, C’).
Figure 5
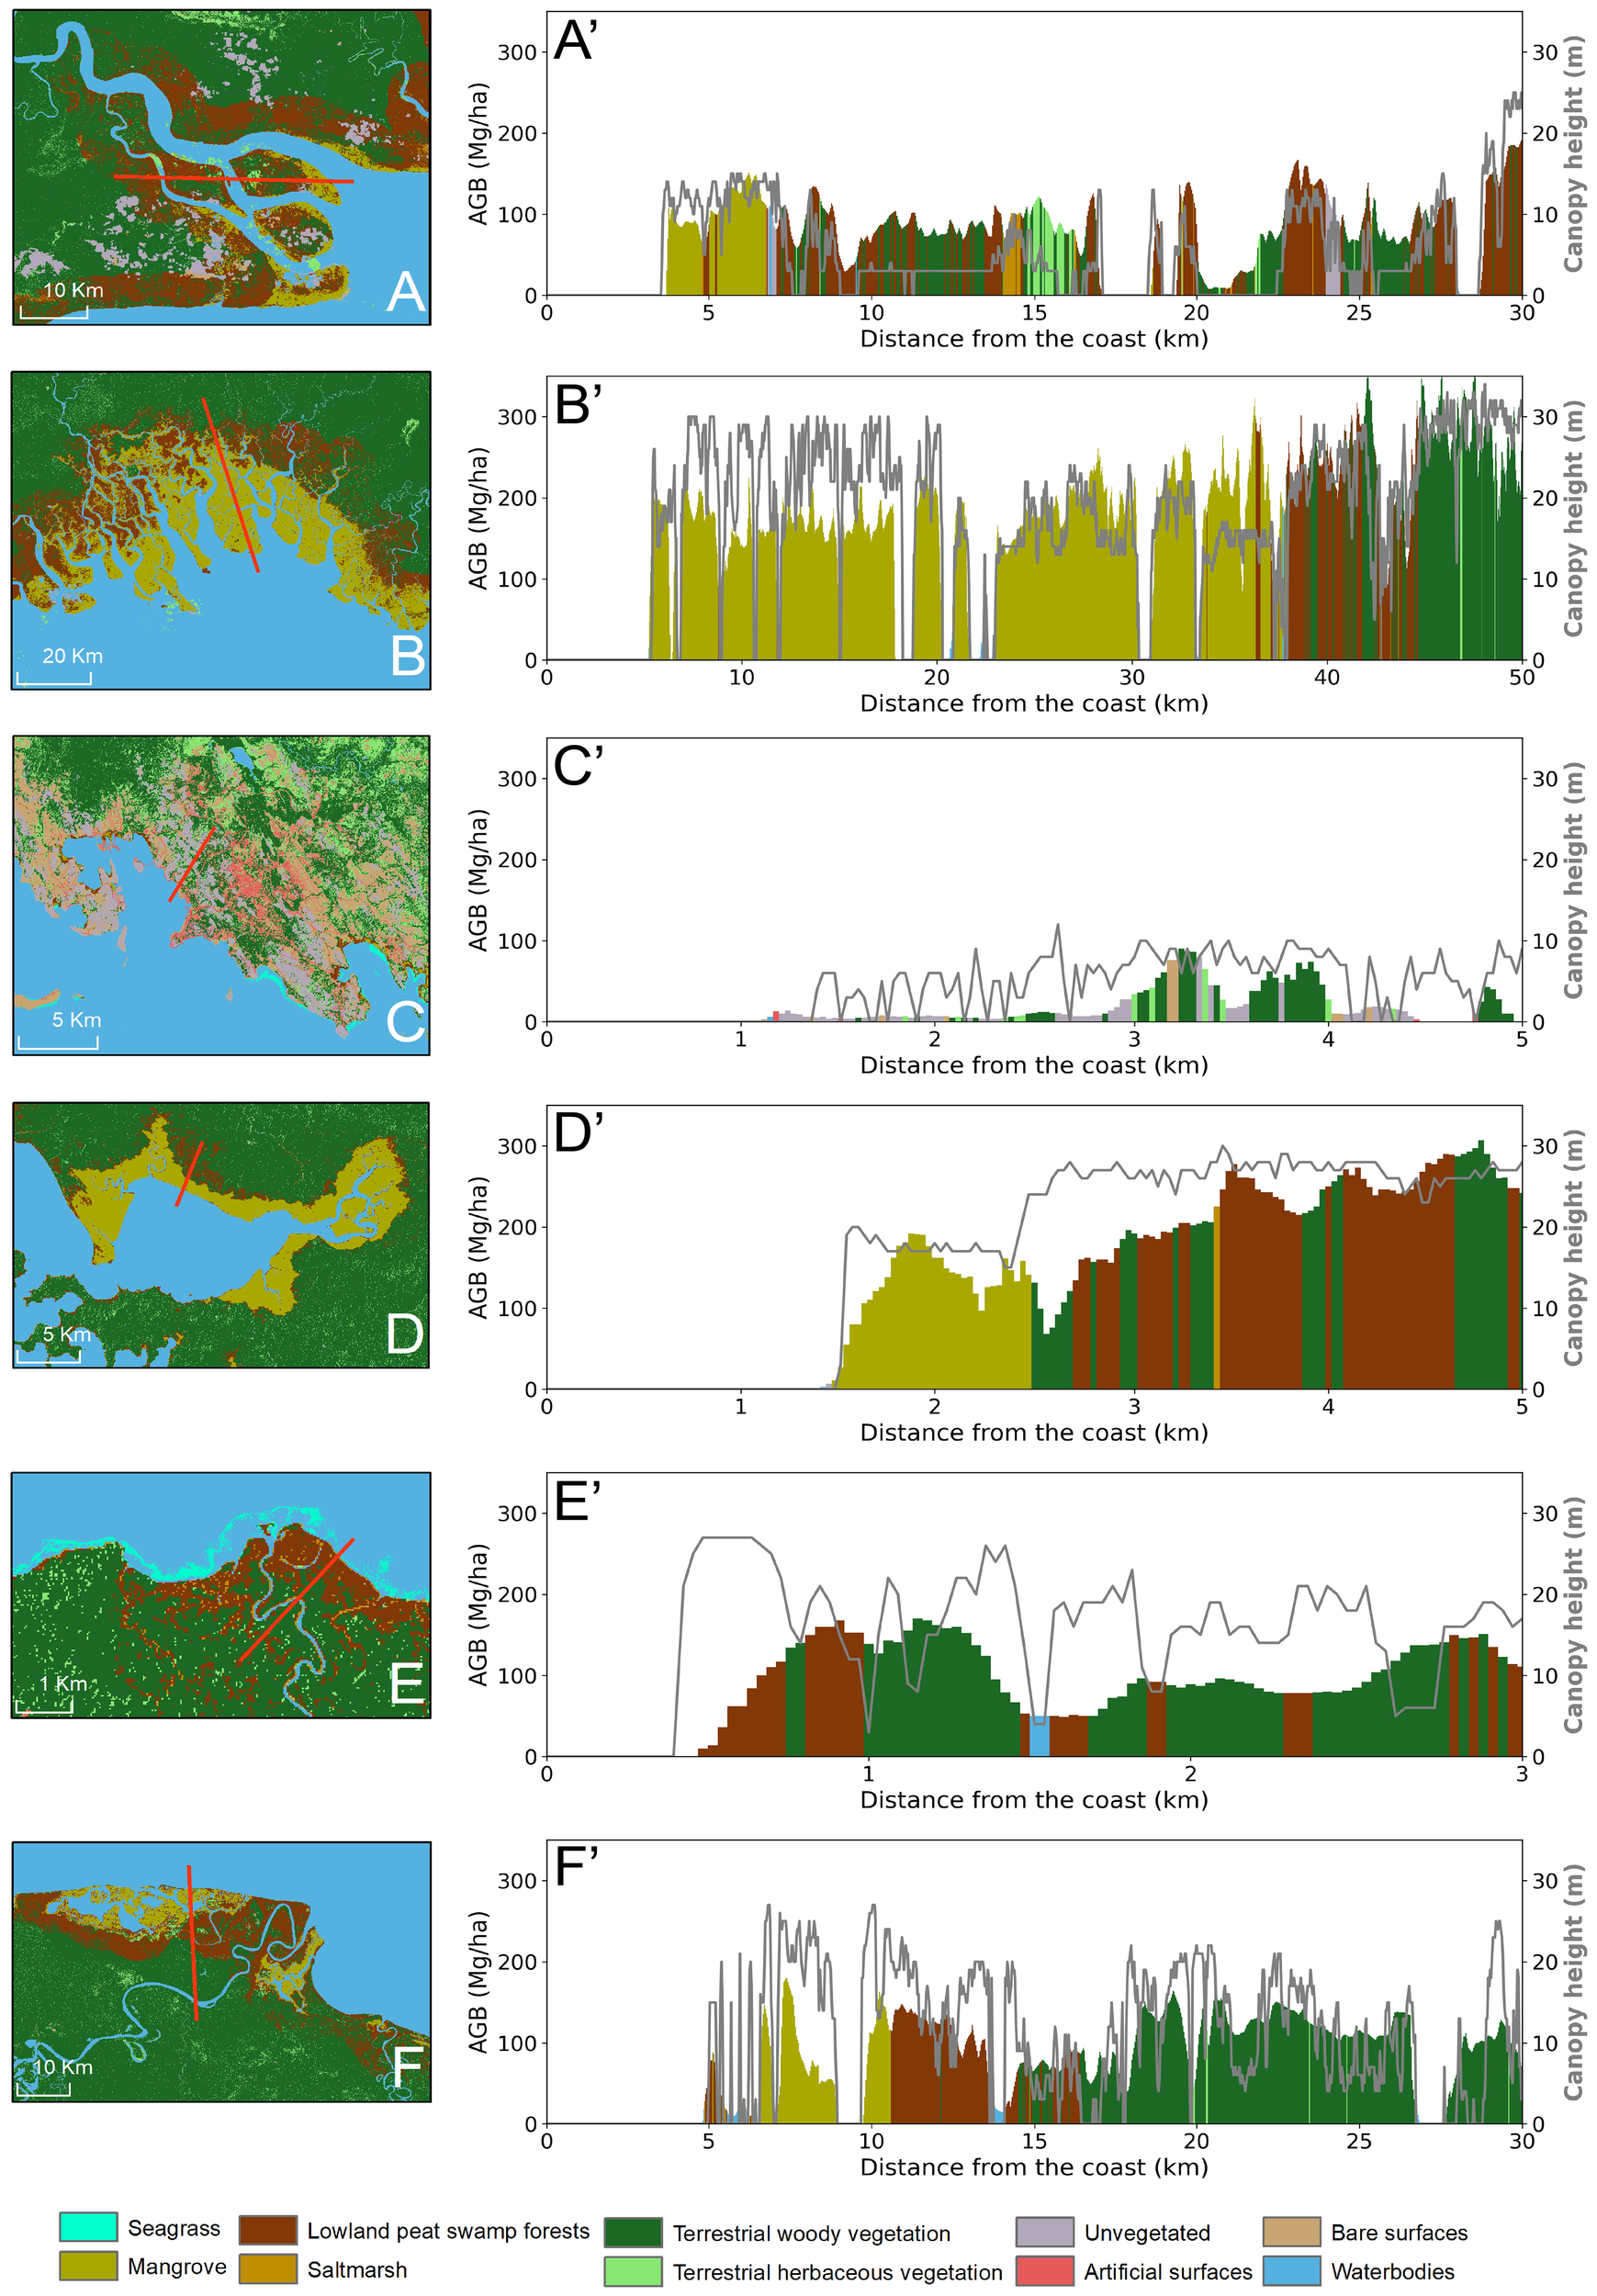
Shore normal transects (red line) of 6 sites showing land cover classes (colours), above-ground biomass (bar chart) and canopy height (grey line graph) for (A) Fly river delta of Western Province, (B) Kikori delta, Central Province, (C) Port Morsby, Central Province, (E) near Orangerie Bay, Milne Bay Province, (E) Dagi river, West New Brittain Province, (F) Sepik river, West Sepik Province.
3.3 Blue carbon ecosystem services of biomass and carbon in PNG
Total aboveground biomass (AGB) for PNG blue carbon ecosystems was estimated as 212.99 ± 95.89 Tg. Lowland peat swamp forest was the greatest contributor of AGB (137.94 ± 67.10 Tg) followed by mangrove (71.79 ± 27.16 Tg) (Figure 6). The southern region contributed the greatest proportion of AGB for blue carbon ecosystems in PNG, with Gulf province having the highest biomass (91.42 ± 43.34 Tg), followed by Western province (39.50 ± 16.55 Tg). For all provinces, lowland peat swamp forest demonstrated to contribute the greatest AGB of blue carbon ecosystems due to extensive spatial extent across PNG deltas and estuaries. On a per hectare basis, however, the average mangrove AGB (166.36 ± 62.94 Mg ha−1) was greater than lowland peat swamp forests (148.50 ± 72.23 Mg ha−1) although both were variable provincially, with the greatest average AGB for mangroves being in Oro province (223.54 ± 86.06 Mg ha−1) and the lowest in the National Capital District (53.97 ± 20.65 Mg ha−1). AGB of saltmarsh (3.25 ± 1.52 Tg) was considerably lower than mangrove and lowland peat swamp forest, due to the relatively small extents and limited structural diversity and biomass of this predominantly herbaceous vegetation. AGB of seagrass was conservatively estimated to be 0.012 Tg (lower estimate = 0.009 Tg, upper estimate = 0.103 Tg) and was greatest in West New Britain and New Ireland (Figure 6; Supplementary Tables S3, S4). Patterns of belowground biomass (BGB) mirrored those described above for AGB from which they were proportionally estimated.
Figure 6
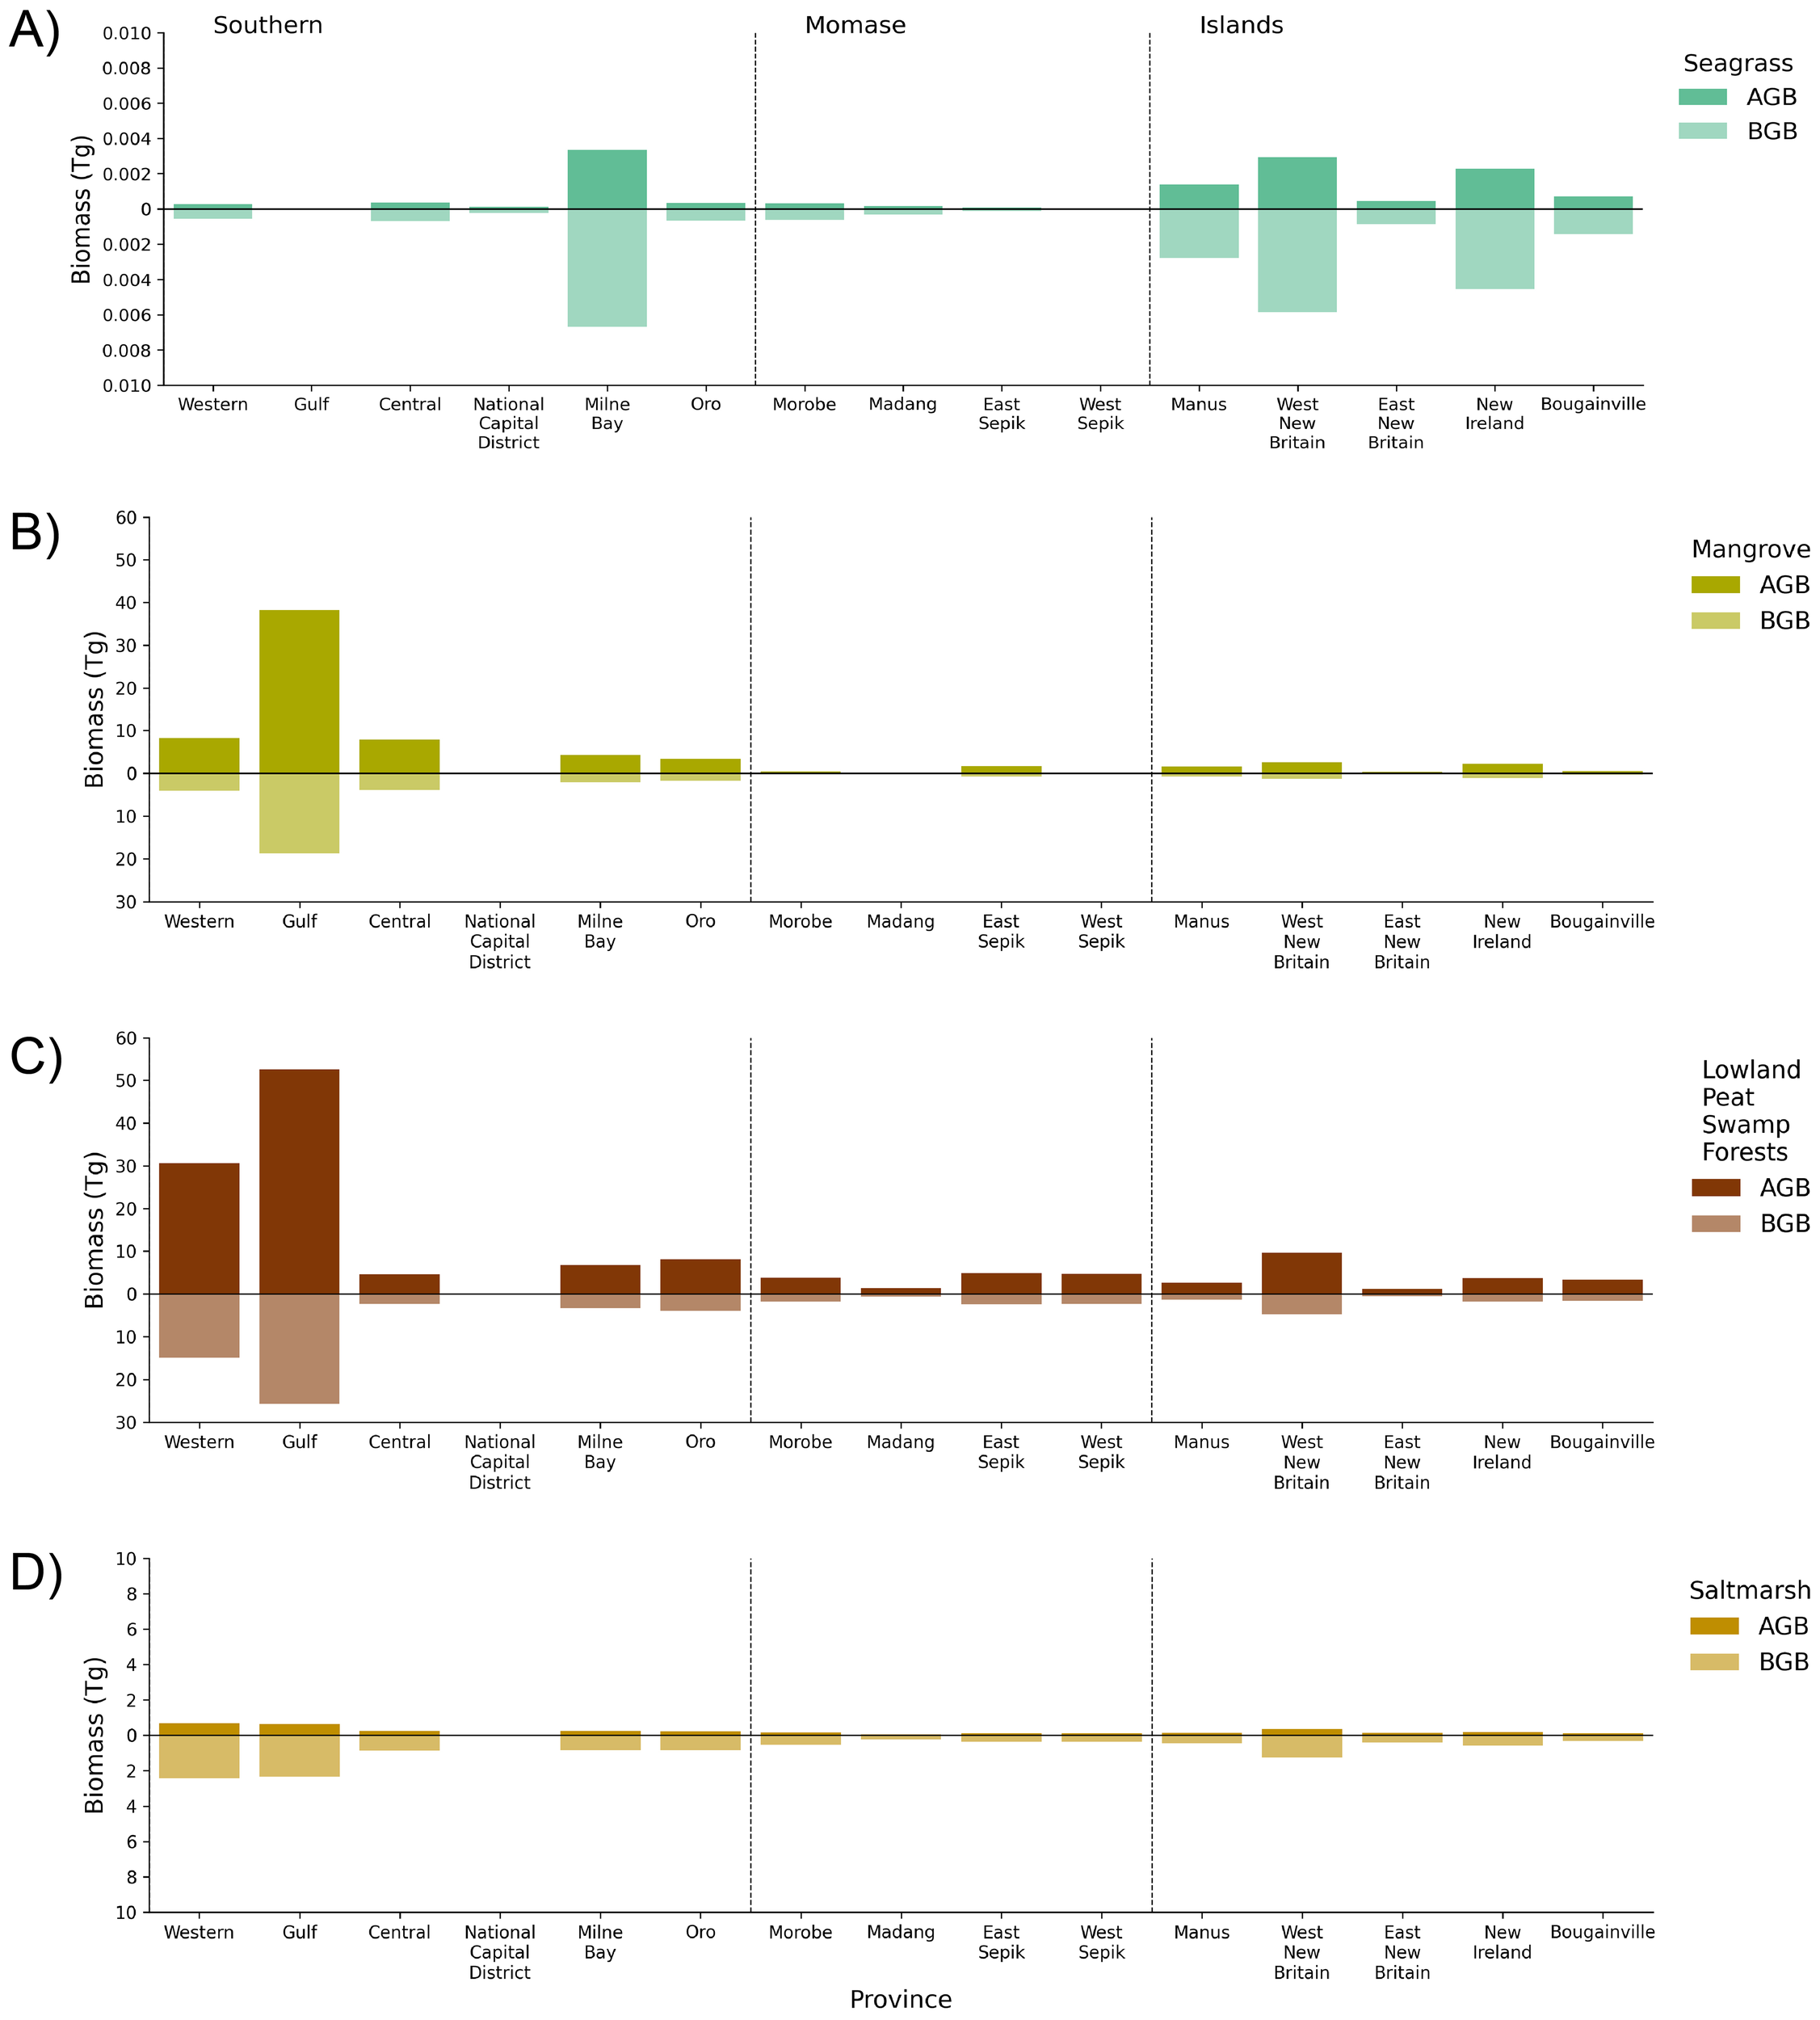
Estimates of above-ground biomass (AGB) and below-ground biomass (BGB) of blue carbon ecosystems for PNG generated from the 2020 mapped area. Biomass has been reported in Teragrams (Tg) based on 15 provinces that have coastal landscapes for (A) seagrass, (B) mangrove, (C) lowland peat swamp forest, and (D) saltmarsh. Biomass values used to generate figure are provided in Supplementary Tables S3, S5.
The greatest total carbon stocks (Tg C) were identified in lowland peat swamp forest (620.20 ± 88.13 Tg C) and were stored primarily in the soil organic components of belowground carbon (BGC) (Figure 7). Across PNG, a total of 710.46 ± 362.75 Tg C were estimated for BGC of BCEs (reporting to 1 m depth), almost seven times that contained in the aboveground carbon (AGC) which totalled 102.14 ± 45.97 Tg C. Mangrove total BGC (134.72 ± 298.02 Tg C) was 3.9 times more than AGC (34.46 ± 13.04 Tg C), with lowland peat swamp forest having eight times more BGC (553.99 ± 55.92 Tg C) than AGC (66.21 ± 32.21 Tg C). Woody vegetation (i.e., mangrove and lowland peat swamp forests) were estimated to store 34 times more carbon (AGC + BGC = 789.38 ± 399.22 Tg C) than herbaceous vegetation (i.e., saltmarsh and seagrass) (AGC + BGC = 23.22 ± 9.52 Tg C). Carbon storage services were greatest in Western and Gulf Provinces, with woody BCEs contributing greater than 98% of total carbon stocks in each province (Figure 7). For saltmarsh, more than 60% (10.38 ± 5.52 Tg C) of total carbon stocks were in the southern region of which greater than 90% was stored in BGC. Carbon stocks of seagrass totalled 6.17 ± 0.46 Tg C across PNG and were greatest in the easternmost provinces of Milne Bay (1.62 ± 0.12 Tg C), West New Britain (1.42 ± 0.11 Tg C), and New Ireland (1.11 ± 0.09 Tg C) (Figure 7; Supplementary Tables S7-S10).
Figure 7
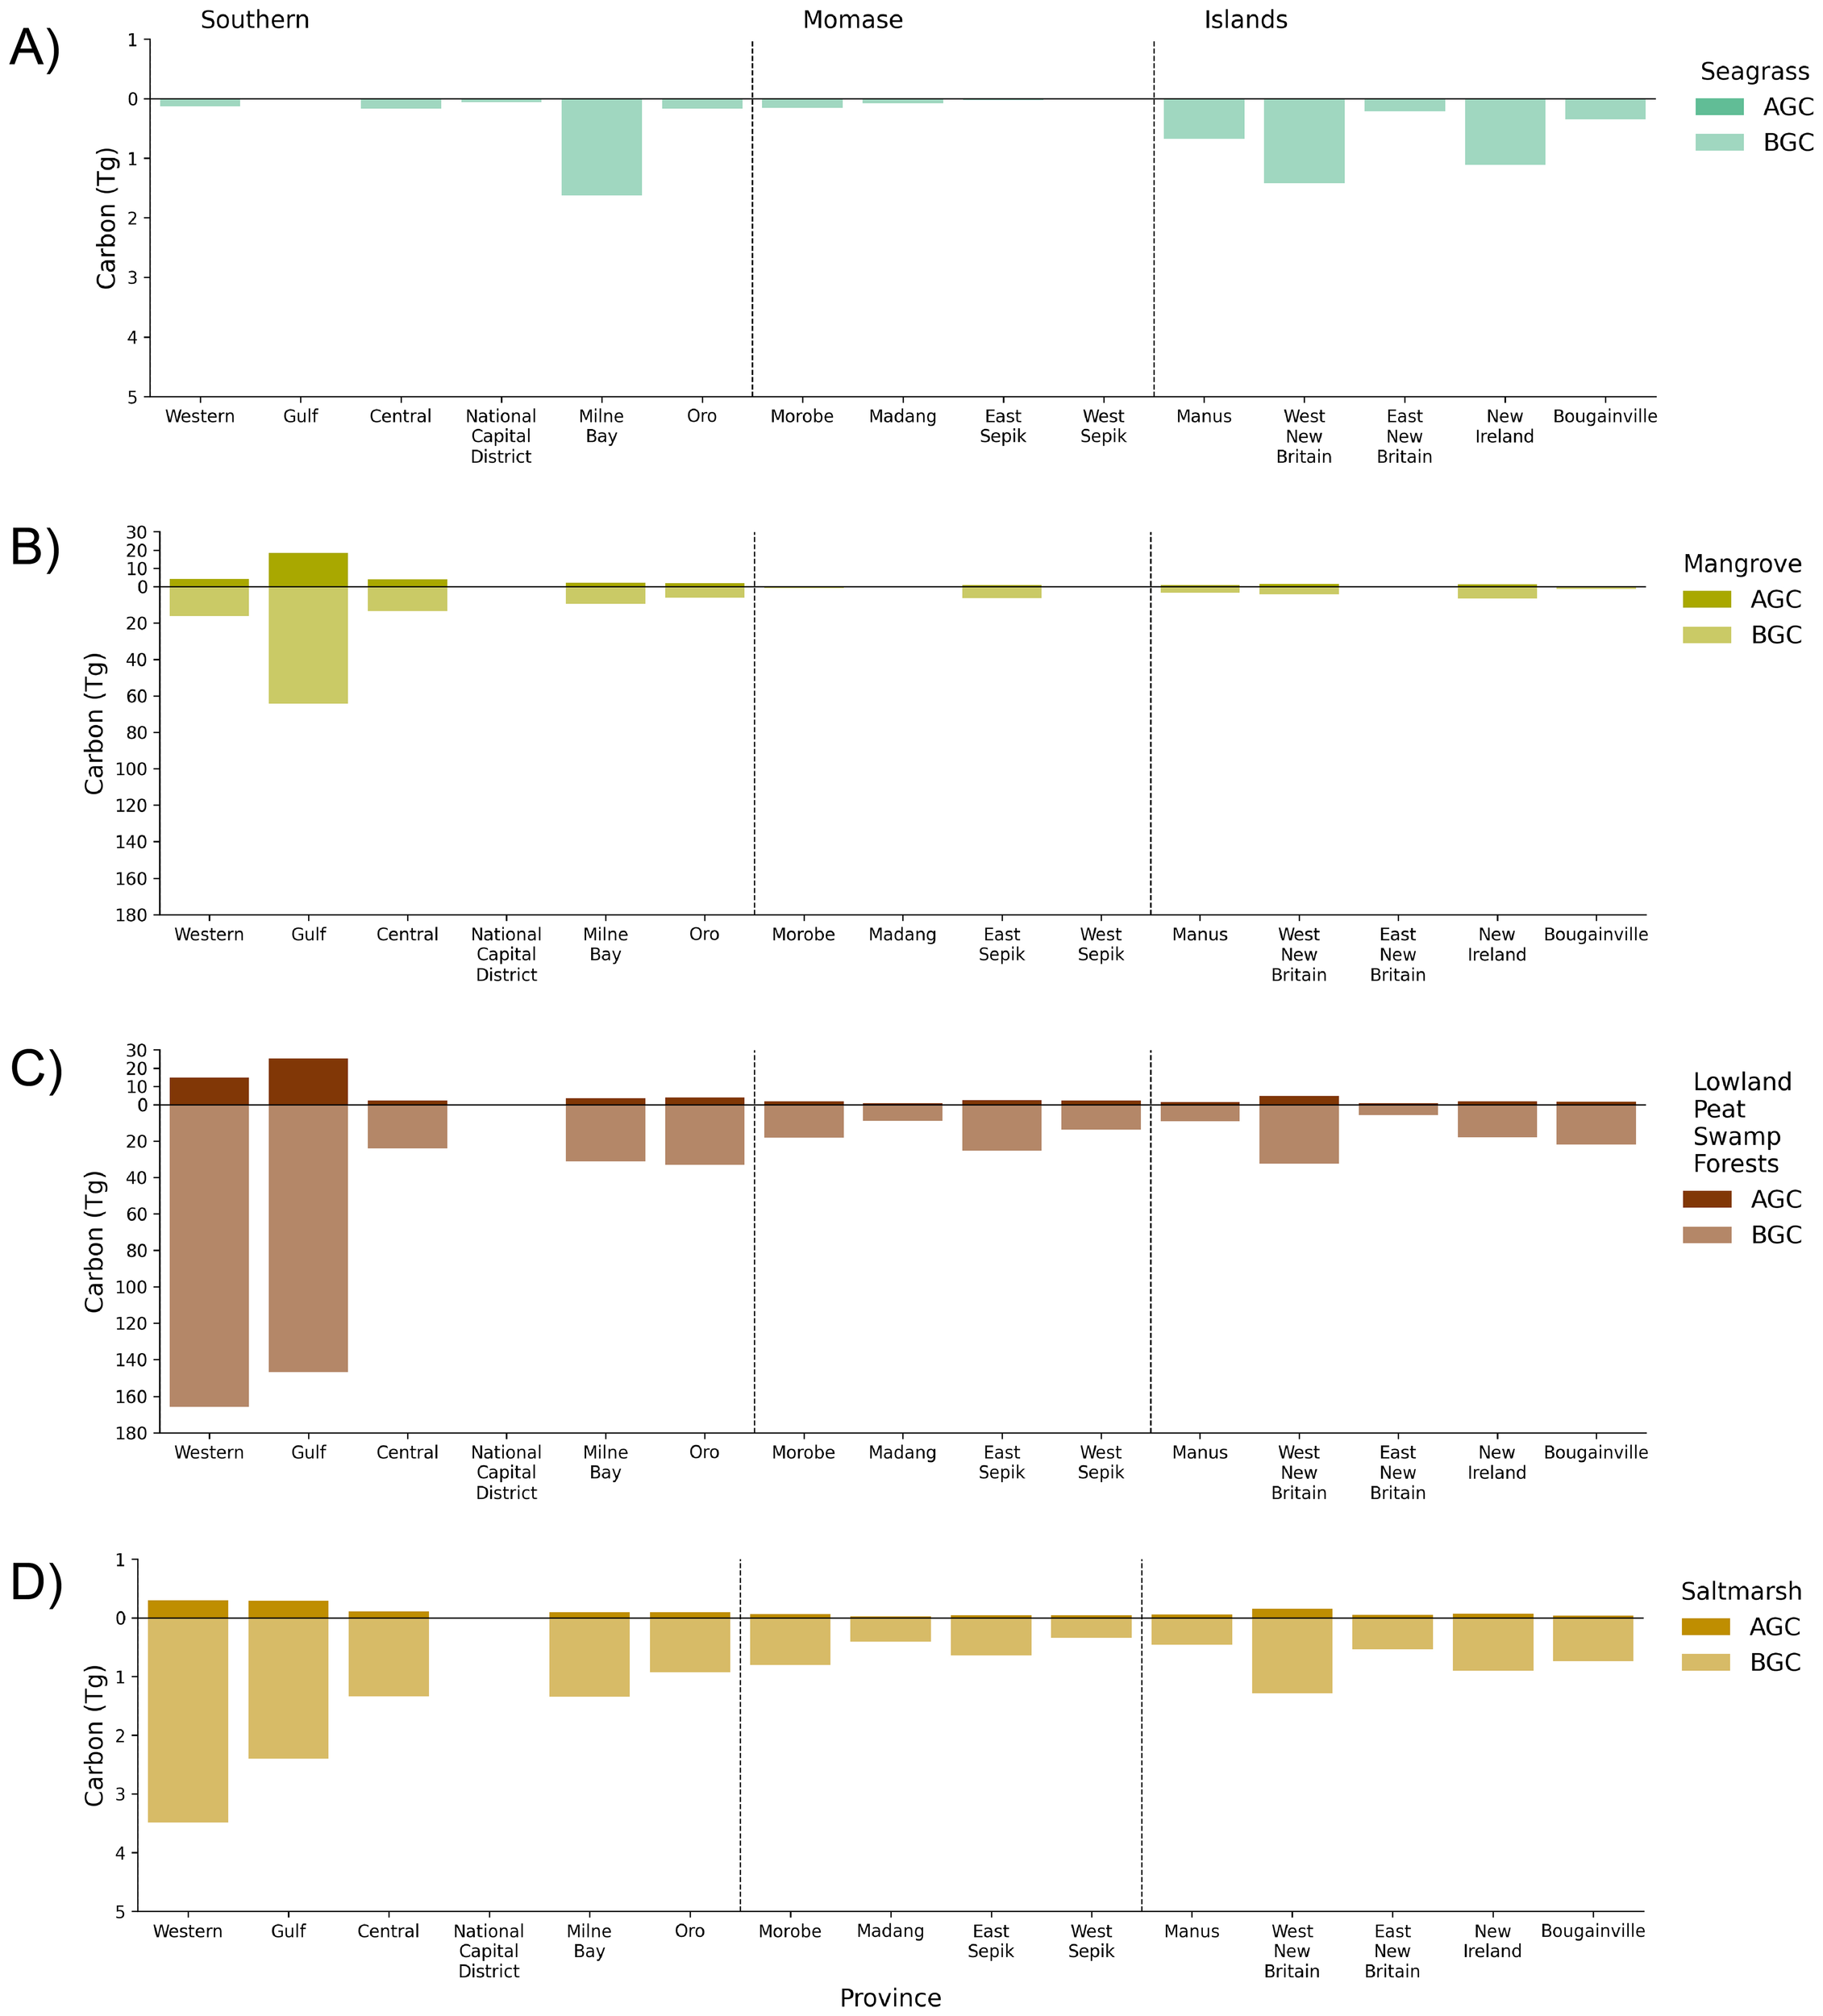
Estimates of above-ground carbon (AGC) and below-ground carbon (BGC) of blue carbon ecosystems for PNG generated from the 2020 mapped area. BGC is based on the sum of below-ground carbon (of biomass) and soil organic carbon (see Table 2). BGC is reported to 1 m depth. Carbon has been reported in Teragrams (Tg) based on 15 provinces that have coastal landscapes for (A) seagrass, (B) mangrove, (C) lowland peat swamp forest, and (D) saltmarsh. Carbon values used to generate figure are provided in Supplementary Tables S7, S9.
4 Discussion
This study generated national land cover mapping of PNG for 2020 in the 15 provinces with coastal landscapes, with a focus on blue carbon ecosystems (BCE). We demonstrate the capacity of Living Earth to provide a framework for land cover mapping, with flexibility of application and land cover categories of interest. This case study provided an opportunity to evaluate transferability of Living Earth on the CSIRO EASI platform, demonstrating its flexibility for national scale land cover mapping. We also provide results to evaluate the translatability to a unique location in southeast Asia, where opportunities and challenges exist for mapping and monitoring coastal landscapes from Earth observations (Becker et al., 2025). Moreover, the approach of land cover mapping demonstrated in this study provides first-order estimates on extent, biomass, and carbon storage services for national inventories. This case study can be used as a demonstration for other nations where similar opportunities and challenges may exist for mapping using Earth observations, with a standardised framework that can be compared and adapted for reporting on Nationally Determined Contributions (NDCs) of BCEs.
4.1 Extent of blue carbon ecosystems in PNG
This study estimated that the total area of BCEs in PNG for 2020 was 14,353 km2. This comprised 30% mangrove, 65% lowland peat swamp forest, 3% saltmarsh, and 2% seagrass. The distribution of blue carbon ecosystems around PNG highlights the diversity of coastal landscapes, with large expanses of mangrove and lowland peat swamp forest present in the southern region. Western and Gulf provinces in the southern region account for 63% of all mangrove areas in PNG. Such high proportions of BCEs in these provinces are attributed to the presence of large deltaic settings such as the Fly, Kikori, and Purari river deltas that receive high allochthonous sediment input from mountainous ranges exposed to heavy rainfall events (Alongi, 2007; Ellison, 1997; Goñi et al., 2014; Walsh and Nittrouer, 2004). In the coastal provinces of Momase and the Island regions, the smaller extent and distribution of BCEs is typical of the distribution associated with estuarine, open coast, and coral atolls within the Indo-Pacific region (Alongi, 2007).
Our estimate of mangrove extent (4,315 km2) is 210 km2 less than the 4,525 km2 estimated by GMW for 2020 (Bunting et al., 2022a). This difference can be attributed to the hierarchical approach taken by Living Earth to classify land cover. For example, areas identified as primarily non-vegetated at LCCS Level 1 cannot be attributed as mangrove at LCCS Level 4, regardless of the mapped extent of input products for LCCS Level 4 (e.g., mangrove identified in GMW). While the Living Earth framework for classifying BCEs does present some caveats, due to mapping uncertainties and potential error propagation of input datasets, it also provides transparency and consistency due to conformity of mapping units through the hierarchical structure and this does not imply any decrease in accuracy (Owers et al., 2021). Furthermore, it is also likely that some of the GMW reported mangrove inland are at elevations likely to be lowland peat swamp forest due to the contiguous nature of PNGs coastal vegetated landscapes (Ellison, 1997); misclassification is often observed on islands with mangrove extents adjoining dense broadleaf tropical forests or where there is steep mountainous terrain (Bunting et al., 2022b; Simard et al., 2025). Indeed, other reported estimates for mangrove extent in PNG suggest less than both estimates from GMW and this study, with UNESCO reporting 4,265 km2 (UNESCO, 2022), compared with officially reported mangrove extents for PNG being significantly less, 2,818.5 km2 in 2018 (CCDA PNG, 2023); however, littoral forests are explicitly classified (1,462.3 km2) whereas Nypa palm (1,908.2 km2) are also recognised as a subclass under the Wetlands class (CCDA PNG, 2023). The Living Earth framework enables accumulation of evidence from several sources to provide a unique land cover class for each pixel. It is important to acknowledge that this accumulation of evidence, while supporting greater confidence in classification, must take into account error propagation due to the diverse sources of data (Owers et al., 2021). The framework leads to maps with no overlap of BCE classes, or conflict in land cover classification where independent spatial data products have mapped areas as different vegetation communities.
Lowland peat swamp forest and saltmarsh were based on LCCS Level 3 (natural aquatic vegetation) and delineated where LCCS Level 4 lifeform was considered woody (lowland peat swamp forest) or herbaceous (saltmarsh). For national and international reporting, BCE have typically encompassed mangroves, saltmarsh, and seagrass. However, recent evidence has suggested that coastal forested wetlands are important ecological communities that provide similar ecosystem services to well-recognised BCEs (Adame et al., 2024; Kauffman et al., 2025; Kelleway et al., 2025; Kelleway et al., accepted). In the Indo-Pacific region, lowland peat swamp forests are naturally waterlogged with some areas receiving tidal inputs and distributed across the lowland near coastal area (Anda et al., 2021; UNEP, 2022). In some areas, lowland peat swamp forests occur behind mangrove forests with large areas of overlapped mangrove and peatland distributed along coastlines in southern Sorong and Bintuni Bay (Murdiyarso et al., 2024), and peatland dominated by Nypa fruticans along the coastal eastern Sumatra and western Kalimantan coastlines (Murdiyarso et al., 2010). These have also been described for PNG as mixed assemblages of mainly freshwater swamp forests, inland of mangrove communities that may extend as thin fringe up to 300 km upstream and which are only intermittently tidally inundated on spring tides (Ellison, 1997). In some cases, these are classified as littoral forests, including in PNG, in the FAO land use classification as swamp under wetlands. Our mapping demonstrates the significance of these forests and their widespread distribution across PNG. While these are not formally recognised as blue carbon habitat and associated peatlands that result, there is an emerging and global literature that confirm their high capacity for providing carbon storage services (Adame et al., 2024; Kauffman et al., 2025; Kelleway et al., accepted).
For seagrass, we estimated an extent for PNG of 317 km2. The majority of seagrass occur from nearshore intertidal to shallow subtidal depths (i.e., 10 m below MSL) (McKenzie et al., 2021). Notably, this estimate did not include the southern region coastal waters where high turbidity precluded meaningful analysis. This is an important consideration given the potential systematic bias in national-level biomass and carbon estimates due to this omission. McKenzie et al. (2021) conservatively estimated the seagrass extent of only 117.2 km2 based only on field observations made with high confidence and noting that for PNG, ‘mapping was incomplete’. Comparatively, the Allen Coral Atlas estimates seagrass extent of 1,093 km2 for PNG (Lyons et al., 2024). Seagrass remains very challenging to identify from Earth observations, and, as such, the estimates derived in this study only consider shallow and clear waters, where benthic habitats can be observed with optical EO data (Lyons et al., 2020, 2024).
4.2 National estimates of biomass and carbon for PNG
This study presents the first estimates of biomass and carbon for PNG BCEs provided as an integrated national land cover approach. For estimation of biomass and carbon, there were very limited data available for PNG and we have relied on data available from global mapping studies and limited field studies in PNG and for Indonesian Papua (e.g., Kauffman et al., 2025, 2020; Sillanpää et al., 2024; Taberima et al., 2018). Our results estimate total carbon stocks (AGC + BGC to 1 m) for PNG BCE in 2020 of 812.60 ± 408.72 Tg C. The large extent and substantial contribution to carbon services provided by blue carbon ecosystems in PNG emphasises the importance of these ecosystems to provide environmental, economic, and social benefits that are directly linked to sustainable livelihoods, and climate resilience and adaptation (Friess, 2023; Sillanpää et al., 2024). Avoiding deforestation and forest degradation to blue carbon ecosystems, particularly mangrove lowland peat swamp forest, will result in substantial avoided emissions (Murdiyarso et al., 2024, 2019, 2015). The approach provided in this study can provide an integrated approach to identifying, monitoring, and reporting on changes in biomass and carbon of BCE. Given the limited availability of comparable BCE service estimates within the Indo-Pacific and broader southeast Asia region, the framework presented here to report on biomass and carbon could provide other nations and regions baseline information to continue to monitor and report changes in blue carbon ecosystem services.
4.3 Implications for national inventories, reporting mechanisms, and conservation policy in PNG
PNG has made significant commitments to address the impacts of climate change relative to its socioeconomic development status (CCDA PNG, 2022). PNG’s Vision 2050, its Climate Compatible Development Management Policy, and its nationally determined contributions (NDC) outline the government’s commitment to be 50% carbon neutral by 2030 and fully carbon neutral by 2050 (CCDA PNG, 2023, 2022). Under REDD+, PNG intends to reduce the area of annual deforestation and degradation by 25% against 2015 levels and increase afforestation, reforestation, and ecosystem restoration to give an estimated 10,000-Gg CO2-equivalent reduction in net emissions from the LULUCF subsector by 2030 (CCDA PNG, 2020). PNG recognises the significance of its BCEs have been crucial in climate change mitigation and adaptation and intends to develop and adopt a national blue carbon policy and establish baseline measures. PNG recognises key gaps as the unavailability of national statistics for seagrass and tidal marshes and the lack of technical capacity for establishment of the baseline (CCDA PNG, 2025).
To support these ambitious goals, a consistent and standardised framework for mapping spatial extent of BCE and generating estimates of ecosystem services, such as carbon storage into NDC, is required at a national scale. The approach detailed in this study provides a national snapshot of BCE extent and ecosystem service contribution of biomass and carbon storage. This can help support environmental accounting measures (e.g., SEEA-EA), as well as direct resource allocation and management, by mapping ecosystem extent and extent change to support ongoing assessment of risk to ecosystems and land management needs under the IUCN Red List of Ecosystems (Keith et al., 2020). The PNG National Oceans Policy (NOP), released in 2020, seeks to develop and establish an Integrated Ocean Management System (OMS) within the national jurisdiction and, at the same time, establish a framework for regional and international cooperation and collaboration in areas beyond its national jurisdiction (DJAG PNG, 2020). The approach applied here to PNG can provide a workflow translated to other nations in the Indo-Pacific region. This will support the efforts for initiation of national frameworks for managing coastal landscapes, including the protection, conservation, and restoration of BCE, of which PNG does not currently have a formal national approach to this (Sillanpää et al., 2024).
4.4 Current challenges and future opportunities
Land cover maps generated in this study for PNG have provided an opportunity to evaluate the transferability and translatability of the Living Earth framework as well as report on aboveground biomass and belowground carbon at a national scale for blue carbon ecosystems. We provide baseline estimates of BCE extent for 2020 as well as ecosystem services of biomass and carbon. For ongoing monitoring, reporting, and management of blue carbon ecosystems for PNG, several challenges need to be addressed. Existing databases of ground-truthed data are currently limited for PNG. Validation of the land cover mapping generated in this study, as well as aboveground biomass and belowground carbon estimates reported at a national scale, was limited as a result, with no accuracy metrics, such as a confusion matrix, able to be produced in this iteration. Calibration and validation data are imperative for any mapping or modelling to report at national scales. This has been recently highlighted by Sillanpää et al. (2024) where long-term monitoring of environmental change is required and multiple scales are due to lack of data collection for calibration and validation over New Guinea. Sillanpää et al. (2024) suggest that this could be achieved through integrated coastal zone management frameworks that have somewhat addressed mangrove extent loss for other nations in the Indo-Pacific region.
This study reports on land cover, biomass, and carbon of coastal landscapes for 2020. For ongoing monitoring and reporting on ecosystem services provided by BCEs, multiyear annual maps to track change in extent and ecosystem services are required to facilitate a national reporting framework. In particular, current lack national-level information on lowland peat swamp forest and seagrass limits baseline estimates of biomass and carbon services of these coastal vegetated ecosystems. In addition, information on biomass and carbon is key to progress landscape scale approaches that align with national approaches to facilitate integrated coastal zone management at multiple scales and should be a priority for efforts in the near future. Collection of this data will also allow greater granularity in estimates and higher confidence in uncertainty when upscaling using national mapping, as demonstrated in this study. To facilitate long-term data collection for BCE that is standardised and enables clear pathway to user uptake, mobile apps such as EarthTrack can be used for ground truthing and validation efforts of national maps and models (Natural Aptitude Ltd, 2024). Importantly, utilising established protocols on data collection and data accessibility, such as the FAIR principles of software development and data accessibility and following the principles of good data and information management; ‘collect once, use many times’ (IGGI, 2005), will help facilitate knowledge sharing from landscape and province to national reporting.
5 Conclusion
Papua New Guinea supports a diverse and extensive range of blue carbon ecosystems across 15 coastal provinces. Nations in the Indo-Pacific such as Papua New Guinea are increasingly aware of the importance of conservation and restoration of these ecosystems and aspire to incorporate these assets into greenhouse gas emission inventories as part of their nationally determined contributions. Earth observations provide data for mapping and monitoring blue carbon ecosystem extent as well as ecosystem services such as biomass and carbon. In this study, we demonstrate the transferability and translate ability of Living Earth, a framework for land cover mapping and reporting on ecosystem services. Integrated mapping of blue carbon ecosystems for PNG through Living Earth provides baseline extent estimates of mangrove (4,315 km2), lowland peat swamp forest (9,289 km2), saltmarsh (431 km2), and seagrass (317 km2) for 2020. Total aboveground biomass of BCE for PNG was estimated to be 212.99 ± 95.89 Tg, with belowground carbon storage estimates of 710.46 ± 362.75 Tg C. Further research is needed to provide robust estimates of lowland peat swamp forest and seagrass biomass and carbon storage services, coupled with a multiyear annual maps to track changes in extent as well as changes to ecosystem services provide by coastal landscapes of PNG.
Statements
Data availability statement
The datasets presented in this study can be found in online repositories. The names of the repository/repositories and accession number(s) can be found below:
PNG land cover map: https://data.csiro.au/collection/csiro:65849;
PNG case study: https://github.com/livingearth-system/livingearth_png (https://doi.org/10.5281/zenodo.14049281);
Living Earth software: https://bitbucket.org/au-eoed/livingearth_lccs.
Author contributions
CO: Writing – review & editing, Conceptualization, Funding acquisition, Supervision, Writing – original draft, Formal Analysis, Software, Project administration, Methodology, Investigation. RL: Supervision, Conceptualization, Methodology, Funding acquisition, Project administration, Writing – original draft, Writing – review & editing. CP: Methodology, Writing – original draft, Formal Analysis, Software, Data curation, Investigation, Writing – review & editing. DC: Methodology, Formal Analysis, Software, Data curation, Writing – original draft, Writing – review & editing. MP: Writing – review & editing, Formal Analysis, Data curation, Software, Writing – original draft, Methodology. CF: Writing – review & editing, Software, Investigation, Methodology, Data curation, Writing – original draft, Project administration, Visualization. AB: Project administration, Data curation, Writing – original draft, Software, Writing – review & editing, Methodology, Investigation. FA: Resources, Writing – original draft, Formal Analysis, Project administration, Investigation, Validation, Writing – review & editing. ML: Methodology, Writing – original draft, Investigation, Data curation, Validation, Writing – review & editing. AS: Writing – review & editing, Writing – original draft, Validation, Project administration, Funding acquisition, Supervision, Conceptualization, Investigation.
Funding
The author(s) declared that financial support was received for this work and/or its publication. This project was an outcome of the Pacific Blue Carbon Program (CSIRO and Australia Department of Foreign Affairs and Trade) and the Living Coasts research grant (EO4Agriclimate, URKI, Grant Ref. ST/Y000218/1).
Conflict of interest
The authors declared that this work was conducted in the absence of any commercial or financial relationships that could be construed as a potential conflict of interest.
Generative AI statement
The author(s) declared that generative AI was not used in the creation of this manuscript.
Any alternative text (alt text) provided alongside figures in this article has been generated by Frontiers with the support of artificial intelligence and reasonable efforts have been made to ensure accuracy, including review by the authors wherever possible. If you identify any issues, please contact us.
Publisher’s note
All claims expressed in this article are solely those of the authors and do not necessarily represent those of their affiliated organizations, or those of the publisher, the editors and the reviewers. Any product that may be evaluated in this article, or claim that may be made by its manufacturer, is not guaranteed or endorsed by the publisher.
Supplementary material
The Supplementary Material for this article can be found online at: https://www.frontiersin.org/articles/10.3389/fmars.2025.1697243/full#supplementary-material
References
1
AdameM. F.KellewayJ.KraussK. W.LovelockC. E.AdamsJ. B.Trevathan-TackettS. M.et al. (2024). All tidal wetlands are blue carbon ecosystems. BioScience74, 253–268. doi: 10.1093/biosci/biae007
2
AlongiD. M. (2007). “ Mangrove forests of papua,” in The Ecology of Indonesia ( Periplus Editions, Singapore).
3
AndaM.RitungS.SuryaniE.SukarmanHikmatM.YatnoE.et al. (2021). Revisiting tropical peatlands in Indonesia: Semi-detailed mapping, extent and depth distribution assessment. Geoderma402, 115235. doi: 10.1016/j.geoderma.2021.115235
4
BeckerA.BercoviciS. K.ChooJ.FakhrurroziF.FongA.FowellS. E.et al. (2025). Blue carbon management integrating socioeconomic and environmental interconnectivity in Southeast Asia: an urgent climate priority. Front. Mar. Sci.12. doi: 10.3389/fmars.2025.1642387
5
BuntingP.RosenqvistA.HilaridesL.LucasR. M.ThomasN. (2022a). Global mangrove watch: updated 2010 mangrove forest extent (v2.5). Remote Sens.14, 1034. doi: 10.3390/rs14041034
6
BuntingP.RosenqvistA.HilaridesL.LucasR. M.ThomasN.TadonoT.et al. (2022b). Global mangrove extent change 1996–2020: global mangrove watch version 3.0. Remote Sens.14, 3657. doi: 10.3390/rs14153657
7
Carrasquilla-HenaoM.JuanesF. (2017). Mangroves enhance local fisheries catches: a global meta-analysis. Fish Fisheries18, 79–93. doi: 10.1111/faf.12168
8
CCDA PNG (2020) in Papua New Guinea’s Enhanced Nationally Determined Contribution 2020, Papua New Guinea ( Climate Change and Development Authority, National Capital District).
9
CCDA PNG (2022) in Second Biennial Update Report To The United Nations Framework Convention On Climate Change, Papua New Guinea ( Climate Change and Development Authority, National Capital District).
10
CCDA PNG (2023). “ Second national REDD+ Forest reference level,” in Modified Submission for the UNFCCC Technical Assessment in 2023, Papua New Guinea ( Climate Change and Development Authority, National Capital District).
11
CCDA PNG (2025) in Technology Needs Assessment for Climate Change Mitigation (PNG TNA Report for Climate Change Mitigation - Energy, Transport and LULUCF), Papua New Guinea ( Climate Change and Development Authority, National Capital District).
12
Cohen-ShachamE.WaltersG.JanzenC.MaginnisS. (2016). Nature-based solutions to address global societal challenges (Switzerland: IUCN).
13
CollierC. J.LangloisL. M.McMahonK. M.UdyJ.RasheedM.LawrenceE.et al. (2021). What lies beneath: Predicting seagrass below-ground biomass from above-ground biomass, environmental conditions and seagrass community composition. Ecol. Indic.121, 107156. doi: 10.1016/j.ecolind.2020.107156
14
Di GregorioA. (2005). Land Cover Classification System (LCCS), version 2: Classification Concepts and User Manual (Rome: FAO Environment and Natural Resources Service Series).
15
DJAG PNG (2020). National Oceans Policy of Papua New Guinea 2020-2030 (Port Moresby: Department of Justice and Attorney General).
16
DuarteC. M. (1990). Seagrass nutrient content. Mar. Ecol. Prog. Ser.67, 201–207. doi: 10.3354/meps067201
17
EllisonJ. C. (1997). Mangrove ecosystems of the western and Gulf Provinces of Papua New Guinea, a review. Sci. New Guinea23, 3–16.
18
EllisonJ. (2019). “ Biogeomorphology of mangroves,” in Coastal Wetlands: An Integrated Ecosystem Approach ( Elsevier BV, Netherlands), 687–715.
19
FriessD. A. (2023). The potential for mangrove and seagrass blue carbon in Small Island States. Curr. Opin. Environ. Sustainability64, 101324. doi: 10.1016/j.cosust.2023.101324
20
FriessD. A.KraussK. W.TaillardatP.AdameM. F.YandoE. S.CameronC.et al. (2020). Mangrove blue carbon in the face of deforestation, climate change, and restoration. Annu. Plant Rev. Online3, 427–456. doi: 10.1002/9781119312994.apr0752
21
GamogaG.TuriaR.AbeH.HaraguchiM.IudaO. (2021). The forest extent in 2015 and the drivers of forest change between 2000 and 2015 in Papua New Guinea: deforestation and forest degradation in Papua New Guinea. Case Stud. Environ.5, 1442018. doi: 10.1525/cse.2021.1442018
22
GillT.JohansenK.PhinnS.TrevithickR.ScarthP.ArmstonJ. (2017). A method for mapping Australian woody vegetation cover by linking continental-scale field data and long-term Landsat time series. Int. J. Remote Sens.38, 679–705. doi: 10.1080/01431161.2016.1266112
23
GomesV. C. F.QueirozG. R.FerreiraK. R. (2020). An overview of platforms for big earth observation data management and analysis. Remote Sens.12, 1253. doi: 10.3390/rs12081253
24
GoñiM. A.MooreE.KurtzA.PortierE.AlleauY.MerrellD. (2014). Organic matter compositions and loadings in soils and sediments along the Fly River, Papua New Guinea. Geochimica Cosmochimica Acta140, 275–296. doi: 10.1016/j.gca.2014.05.034
25
HenglT.MaxwellT.ParenteL. (2023). Global mangrove soil carbon data set at 30 m resolution for year 2020 (0–100 cm). doi: 10.5281/zenodo.7729492
26
HowardJ.HoytS.IsenseeK.PidgeonE.TelszewskiM. (2014). “ Coastal Blue Carbon: Methods for assessing carbon stocks and emissions factors in mangroves, tidal salt marshes, and seagrass meadows,” in Conservation International, Intergovernmental Oceanographic Commission of UNESCO, Arlington, Virginia, USA ( International Union for Conservation of Nature).
27
HowesE. L. (2018) in Effects of climate change relevant to the Pacific Islands, Pacific Marine Climate Change Report Card ( Centre for Environment, Fisheries and Aquaculture Sciences (Cefas), UK).
28
IGGI (2005) in The Principles of Good Data Management (London: Intra-governmental Group on Geographic Information, UK).
29
IPCC (2014). “ CHAPTER 4: coastal wetlands,” in 2013 Supplement to the 2006 IPCC Guidelines for National Greenhouse Gas Inventories: Wetlands. (Switzerland: The Intergovernmental Panel on Climate Change) 1–55.
30
IPCC (2019). “ CHAPTER 7: wetlands,” in 2019 Supplement to the 2006 IPCC Guidelines for National Greenhouse Gas Inventories: Wetlands. (Switzerland: The Intergovernmental Panel on Climate Change) vol. 1933, 131–147.
31
IPCC (2022). “ Sea level rise and implications for low-lying islands, coasts and communities,” in The Ocean and Cryosphere in a Changing Climate: Special Report of the Intergovernmental Panel on Climate Change, Cambridge. 321–446 ( Cambridge University Press). doi: 10.1017/9781009157964.006
32
KauffmanJ. B.AdameM. F.AdinugrohoW. C.AnshariG.BasukiI.DonatoD.et al. (2025). Total ecosystem carbon stocks of tropical peat forests and greenhouse gas emissions from their disturbance. For. Ecol. Manage.593, 122840. doi: 10.1016/j.foreco.2025.122840
33
KauffmanJ. B.AdameM. F.ArifantiV. B.SChile-BeersL. M.BernardinoA. F.BhomiaR. K.et al. (2020). Total ecosystem carbon stocks of mangroves across broad global environmental and physical gradients. Ecol. Monogr.90, 1–18. doi: 10.1002/ecm.1405
34
KauffmanJ. B.DonatoD. C. (2012). Protocols for the measurement, monitoring and reporting of structure, biomass and carbon stocks in mangrove forests, Center for International Forestry Research (Bogor, Indonesia: Center for International Forestry Research (CIFOR). doi: 10.17528/cifor/003749
35
KeithD. A.Ferrer-parisJ. R.NicholsonE.KingsfordR. T. (2020). “ IUCN Global Ecosystem Typology 2.0: descriptive profiles for biomes and ecosystem functional groups,” in IUCN Global Ecosystem Typology 2.0: descriptive profiles for biomes and ecosystem functional groups, Switzerland (Gland: International Union for Conservation of Nature and Natural Resources). doi: 10.2305/iucn.ch.2020.13.en
36
KellewayJ. J.GorhamC.Trevathan-TackettS. M.PalaciosM.SerranoO.LaveryP. S.et al. (2025). Inundation and salinity regimes support blue carbon conditions in Australian temperate supratidal forests. Ecol. Appl.35, e70123. doi: 10.1002/eap.70123
37
KellewayJ. J.NoeG. B.KraussK. W.BrophyL.ConnorW. H.DubersteinJ. A.et al. Accepted. Beyond the mangroves: a global synthesis of tidal forested wetland types, drivers and future information needs. Ecol. Monogr. doi: 10.31223/X5ZF2B
38
KosmidouV.PetrouZ.BunceR. G. H.MücherC. A.JongmanR. H. G.BogersM. M. B.et al. (2014). Harmonization of the Land Cover Classification System (LCCS) with the General Habitat Categories (GHC) classification system. Ecol. Indic.36, 290–300. doi: 10.1016/j.ecolind.2013.07.025
39
KrauseJ. R.CameronC.Arias-OrtizA.Cifuentes-JaraM.CrooksS.DahlM.et al. (2025). Global seagrass carbon stock variability and emissions from seagrass loss. Nat. Commun.16, 3798. doi: 10.1038/s41467-025-59204-4
40
LucasR.MuellerN.SigginsA.OwersC.ClewleyD.BuntingP.et al. (2019). Land cover mapping using digital earth Australia. Data4, 143. doi: 10.3390/data4040143
41
LucasR. M.GermanS.MetternichtG.SchmidtR. K.OwersC. J.ProberS. M.et al. (2022). A globally relevant change taxonomy and evidence-based change framework for land monitoring. Glob. Chang. Biol. 28, 6293–6317. doi: 10.1111/gcb.16346
42
LyonsM. B.MurrayN. J.KennedyE. V.KovacsE. M.Castro-SanguinoC.PhinnS. R.et al. (2024). New global area estimates for coral reefs from high-resolution mapping. Cell Rep. Sustainability1, 100015. doi: 10.1016/j.crsus.2024.100015
43
LyonsM.RoelfsemaC.KennedyE.KovacsE.Borrego-AcevedoR.MarkeyK.et al. (2020). Mapping the world’s coral reefs using a global multiscale earth observation framework. Remote Sens. Ecol. Conserv.6, 557–568. doi: 10.1002/rse2.157
44
MacreadieP. I.AntonA.RavenJ. A.BeaumontN.ConnollyR. M.FriessD. A.et al. (2019). The future of Blue Carbon science. Nat. Commun.10, 3998. doi: 10.1038/s41467-019-11693-w
45
MacreadieP. I.CostaM. D. P.AtwoodT. B.FriessD. A.KellewayJ. J.KennedyH.et al. (2021). Blue carbon as a natural climate solution. Nat. Rev. Earth Environ.2, 826–839. doi: 10.1038/s43017-021-00224-1
46
MaxwellT. L.SpaldingM. D.FriessD. A.MurrayN. J.RogersK.RovaiA. S.et al. (2024). Soil carbon in the world’s tidal marshes. Nat. Commun.15, 10265. doi: 10.1038/s41467-024-54572-9
47
McKenzieL. J.ErftemeijerP.ColesR. (2006). “ Seagrass ecosystems of papua,” in The Ecology of Papua ( Periplus Editions, Singapore).
48
McKenzieL. J.NordlundL. M.JonesB. L.Cullen-UnsworthL. C.RoelfsemaC.UnsworthR. K. F. (2020). The global distribution of seagrass meadows. Environ. Res. Lett.15, 074041. doi: 10.1088/1748-9326/ab7d06
49
McKenzieL. J.YoshidaR. L.AiniJ. W.AndréfouetS.ColinP. L.Cullen-UnsworthL. C.et al. (2021). Seagrass ecosystem contributions to people’s quality of life in the Pacific Island Countries and Territories. Mar. pollut. Bull.167, 112307. doi: 10.1016/j.marpolbul.2021.112307
50
MuellerN.LewisA.RobertsD.RingS.MelroseR.SixsmithJ.et al. (2016). Water observations from space: Mapping surface water from 25 years of Landsat imagery across Australia. Remote Sens. Environ.174, 341–352. doi: 10.1016/j.rse.2015.11.003
51
MurdiyarsoD.DonatoD.KauffmanJ. B.KurniantoS.StidhamM.KanninenM. (2010). Carbon storage in mangrove and peatland ecosystems: a preliminary account from plots in Indonesia (Bogor Barat, Indonesia: Center for International Forestry Research (CIFOR). doi: 10.17528/cifor/003233
52
MurdiyarsoD.LilleskovE.KolkaR. (2019). Tropical peatlands under siege: the need for evidence-based policies and strategies. Mitigation Adaptation Strategies Global Change24, 493–505. doi: 10.1007/s11027-019-9844-1
53
MurdiyarsoD.PurbopuspitoJ.KauffmanJ. B.WarrenM. W.SasmitoS. D.DonatoD. C.et al. (2015). The potential of Indonesian mangrove forests for global climate change mitigation. Nat. Climate Change5, 1089–1092. doi: 10.1038/nclimate2734
54
MurdiyarsoD.SwailsE.Hergoualc’hK.BhomiaR.SasmitoS. D. (2024). Refining greenhouse gas emission factors for Indonesian peatlands and mangroves to meet ambitious climate targets. Proc. Natl. Acad. Sci.121, e2307219121. doi: 10.1073/pnas.2307219121
55
MurrayN. J.WorthingtonT. A.BuntingP.DuceS.HaggerV.LovelockC. E.et al. (2022). High-resolution mapping of losses and gains of Earth’s tidal wetlands. Science376, 744–749. doi: 10.1126/science.abm9583
56
Natural Aptitude Ltd (2024). EarthTrack. (United Kingdom: Natural Aptitude).
57
OpenStreetMap contributors (2017). OpenStreetMap.
58
OwersC. J.ClewleyD.PlanqueC.BurkeA.PagetM. (2024). livingearth-system/livingearth_png: Pacific Blue Carbon Project. doi: 10.5281/zenodo.14049282
59
OwersC. J.LucasR. M.ClewleyD.PlanqueC.PunalekarS.TissottB.et al. (2021). Living Earth: Implementing national standardised land cover classification systems for Earth Observation in support of sustainable development. Big Earth Data5, 368–390. doi: 10.1080/20964471.2021.1948179
60
OwersC. J.LucasR. M.ClewleyD.TissottB.ChuaS. M. T.HuntG.et al. (2022). Operational continental-scale land cover mapping of Australia using the Open Data Cube. Int. J. Digital Earth15, 1715–1737. doi: 10.1080/17538947.2022.2130461
61
PlanqueC.LucasR. M.ClewleyD.ChognardS.GiulianiG.ChatenouxB.et al. (2025). National Digital Infrastructure: clustering global open-source solutions for sovereign monitoring of the environment. SSRN Electronic Journal. doi: 10.2139/ssrn.5292171
62
PlanqueC.PunalekarS.LucasR.ChognardS.OwersC. J.ClewleyD.et al. (2020). “ Living Wales – automatic and routine environmental monitoring using multi-source Earth observation data,” in Earth Resources and Environmental Remote Sensing/GIS Applications XI. Eds. SchulzK.NikolakopoulosK. G.MichelU. ( SPIE, United Kingdom), 9. doi: 10.1117/12.2573763
63
PotapovP.LiX.Hernandez-SernaA.TyukavinaA.HansenM. C.KommareddyA.et al. (2021). Mapping global forest canopy height through integration of GEDI and Landsat data. Remote Sens. Environ.253, 112165. doi: 10.1016/j.rse.2020.112165
64
PunalekarS. M.HurfordC.LucasR. M.PlanqueC.ChognardS. (2024). Hierarchical-modular framework for habitat mapping through systematic and informed integration of remote sensing data with contextual information. Ecol. Inf.82, 102714. doi: 10.1016/j.ecoinf.2024.102714
65
PunalekarS. M.PlanqueC.LucasR. M.EvansD.CorreiaV.OwersC. J.et al. (2021). National scale mapping of larch plantations for Wales using the Sentinel-2 data archive. For. Ecol. Manage.501. doi: 10.1016/j.foreco.2021.119679
66
RichardsD. R.FriessD. A. (2016). Rates and drivers of mangrove deforestation in Southeast Asia 2000–2012. Proc. Natl. Acad. Sci.113, 344–349. doi: 10.1073/pnas.1510272113
67
RoweC.McNivenI. J.DavidB.RichardsT.LeavesleyM. (2013). Holocene pollen records from Caution Bay, southern mainland Papua New Guinea. Holocene23, 1130–1142. doi: 10.1177/0959683613483620
68
SantoroM.CartusO.QueganS.KayH.LucasR. M.ArazaA.et al. (2024). Design and performance of the Climate Change Initiative Biomass global retrieval algorithm. Sci. Remote Sens.10, 100169. doi: 10.1016/j.srs.2024.100169
69
ShearmanP.BryanJ. E. (2015). The State of the Forests of Papua New Guinea 2014: Measuring change over the period 2002-2014 (Port Moresby: University of Papua New Guinea).
70
SillanpääM.FriessD. A.HeatubunC. D.CraggS. M.AleiF.BhargavaR.et al. (2024). Mangrove management practices, policies, and impacts in New Guinea. Biol. Conserv.296, 110697. doi: 10.1016/j.biocon.2024.110697
71
SimardM.FatoyinboL.ThomasN. M.StovallA. E.ParraA.BarenblittA.et al. (2025). A New Global Mangrove Height Map with a 12 meter spatial resolution. Sci. Data12, 15. doi: 10.1038/s41597-024-04213-z
72
StankovicM.Ambo-RappeR.CarlyF.Dangan-GalonF.FortesM. D.HossainM. S.et al. (2021). Quantification of blue carbon in seagrass ecosystems of Southeast Asia and their potential for climate change mitigation. Sci. Total Environ.783, 146858. doi: 10.1016/j.scitotenv.2021.146858
73
StevenA. D. L.VanderkliftM. A.Bohler-MullerN. (2019). A new narrative for the Blue Economy and Blue Carbon. J. Indian Ocean Region15, 123–128. doi: 10.1080/19480881.2019.1625215
74
StrydomS.McCallumR.LafrattaA.WebsterC. L.O’DeaC. M.SaidN. E.et al. (2023). Global dataset on seagrass meadow structure, biomass and production. Earth System Sci. Data15, 511–519. doi: 10.5194/essd-15-511-2023
75
TaberimaS.DjuunaI. A. F.MusaadI.MurdiyarsoD. (2018). Carbon stock in Peatlands Ecosystem of West Papua and Papua Provinces, Eastern Indonesia. (West Papua, Indonesia).
76
TangW.ZhengM.ZhaoX.ShiJ.YangJ.TrettinC. C. (2018). Big geospatial data analytics for global mangrove biomass and carbon estimation. Sustainability10, 472. doi: 10.3390/su10020472
77
UNEP (2022). Global Peatlands Assessment: The State of the World’s Peatlands - Evidence for Action toward the Conservation, Restoration, and Sustainable Management of Peatlands, Global Peatlands Initiative (Nairobi: United Nations Environment Programme). doi: 10.59117/20.500.11822/41222
78
UNESCO (2022). Mangrove Ecosystems of Papua New Guinea: Coverage and Significance ( United Nations Educational, Scientific and Cultural Organisation). Available online at: https://doi.org/20.500.12592/g6xrkn.
79
WalshJ. P.NittrouerC. A. (2004). Mangrove-bank sedimentation in a mesotidal environment with large sediment supply, Gulf of Papua. Mar. Geology208, 225–248. doi: 10.1016/j.margeo.2004.04.010
80
WoodcockR.PagetM.WangP.HeldA. (2018). “ Accelerating industry innovation using the open data cube in Australia,” in IGARSS 2018–2018 IEEE International Geoscience and Remote Sensing Symposium. (Valencia, Spain: IEEE), 8636–8638. doi: 10.1109/IGARSS.2018.8519170
81
WorthingtonT. A.Andradi-BrownD. A.BhargavaR.BuelowC.BuntingP.DuncanC.et al. (2020). Harnessing big data to support the conservation and rehabilitation of mangrove forests globally. One Earth2, 429–443. doi: 10.1016/j.oneear.2020.04.018
82
WorthingtonT. A.SpaldingM.LandisE.MaxwellT. L.NavarroA.SmartL. S.et al. (2024). The distribution of global tidal marshes from Earth observation data. Global Ecol. Biogeography33, e13852. doi: 10.1111/geb.13852
Summary
Keywords
PNG, land cover, biomass, carbon, FAO LCCS, conservation, nationally determined contributions
Citation
Owers CJ, Lucas RM, Planque C, Clewley D, Paget M, Fitzpatrick C, Burke A, Alei F, Lyons MB and Steven ADL (2025) Mapping blue carbon ecosystems from Earth observations at a national scale for Papua New Guinea. Front. Mar. Sci. 12:1697243. doi: 10.3389/fmars.2025.1697243
Received
02 September 2025
Revised
25 November 2025
Accepted
25 November 2025
Published
19 December 2025
Volume
12 - 2025
Edited by
Chao Liu, Ministry of Natural Resources, China
Reviewed by
Siddhi Joshi, Umeå University, Sweden
Adityo Raynaldo, OSO University, Indonesia
Updates
Copyright
© 2025 Owers, Lucas, Planque, Clewley, Paget, Fitzpatrick, Burke, Alei, Lyons and Steven.
This is an open-access article distributed under the terms of the Creative Commons Attribution License (CC BY). The use, distribution or reproduction in other forums is permitted, provided the original author(s) and the copyright owner(s) are credited and that the original publication in this journal is cited, in accordance with accepted academic practice. No use, distribution or reproduction is permitted which does not comply with these terms.
*Correspondence: Christopher J. Owers, chris.owers@newcastle.edu.au
Disclaimer
All claims expressed in this article are solely those of the authors and do not necessarily represent those of their affiliated organizations, or those of the publisher, the editors and the reviewers. Any product that may be evaluated in this article or claim that may be made by its manufacturer is not guaranteed or endorsed by the publisher.